
Relationship between Androgen Deprivation Therapy and Abdominal Adipose Tissue
by
 , , and
Federico Greco
1,* ,
,
Alessandro Tafuri
2,
Andrea Panunzio
2,3,
Bruno Beomonte Zobel
4 and
Carlo Augusto Mallio
4 1
U.O.C. Diagnostica per Immagini Territoriale Aziendale, Cittadella della Salute Azienda Sanitaria Locale di Lecce, Piazza Filippo Bottazzi, 73100 Lecce, Italy
2
Department of Urology, “Vito Fazzi” Hospital, Piazza Filippo Muratore, 1, 73100 Lecce, Italy
3
Department of Urology, University of Verona, Azienda Ospedaliera Universitaria Integrata di Verona, 37126 Verona, Italy
4
Unit of Diagnostic Imaging, Università Campus Bio-Medico di Roma, Via Alvaro del Portillo, 21, 00128 Rome, Italy
*
Author to whom correspondence should be addressed.
Uro 2022, 2(4), 270-276; https://doi.org/10.3390/uro2040030
Submission received: 23 October 2022
/
Revised: 29 November 2022
/
Accepted: 30 November 2022
/
Published: 2 December 2022
(This article belongs to the Special Issue Prostate Cancer and Erectile Disfunction)
Abstract
:The role of androgens in body composition is well known. Androgen deprivation therapy (ADT) has shown beneficial effects in the treatment of advanced prostate cancer (PCa). Given that androgens are important for the homeostasis of different organs, the effects of ADT can affect body composition and therefore adipose tissue. Computed tomography (CT) and magnetic resonance imaging (MRI) are non-invasive methods that allow for quantification of the different fat compartments. In this review we describe the effects of ADT on abdominal adipose tissue in PCa patients.
1. Introduction
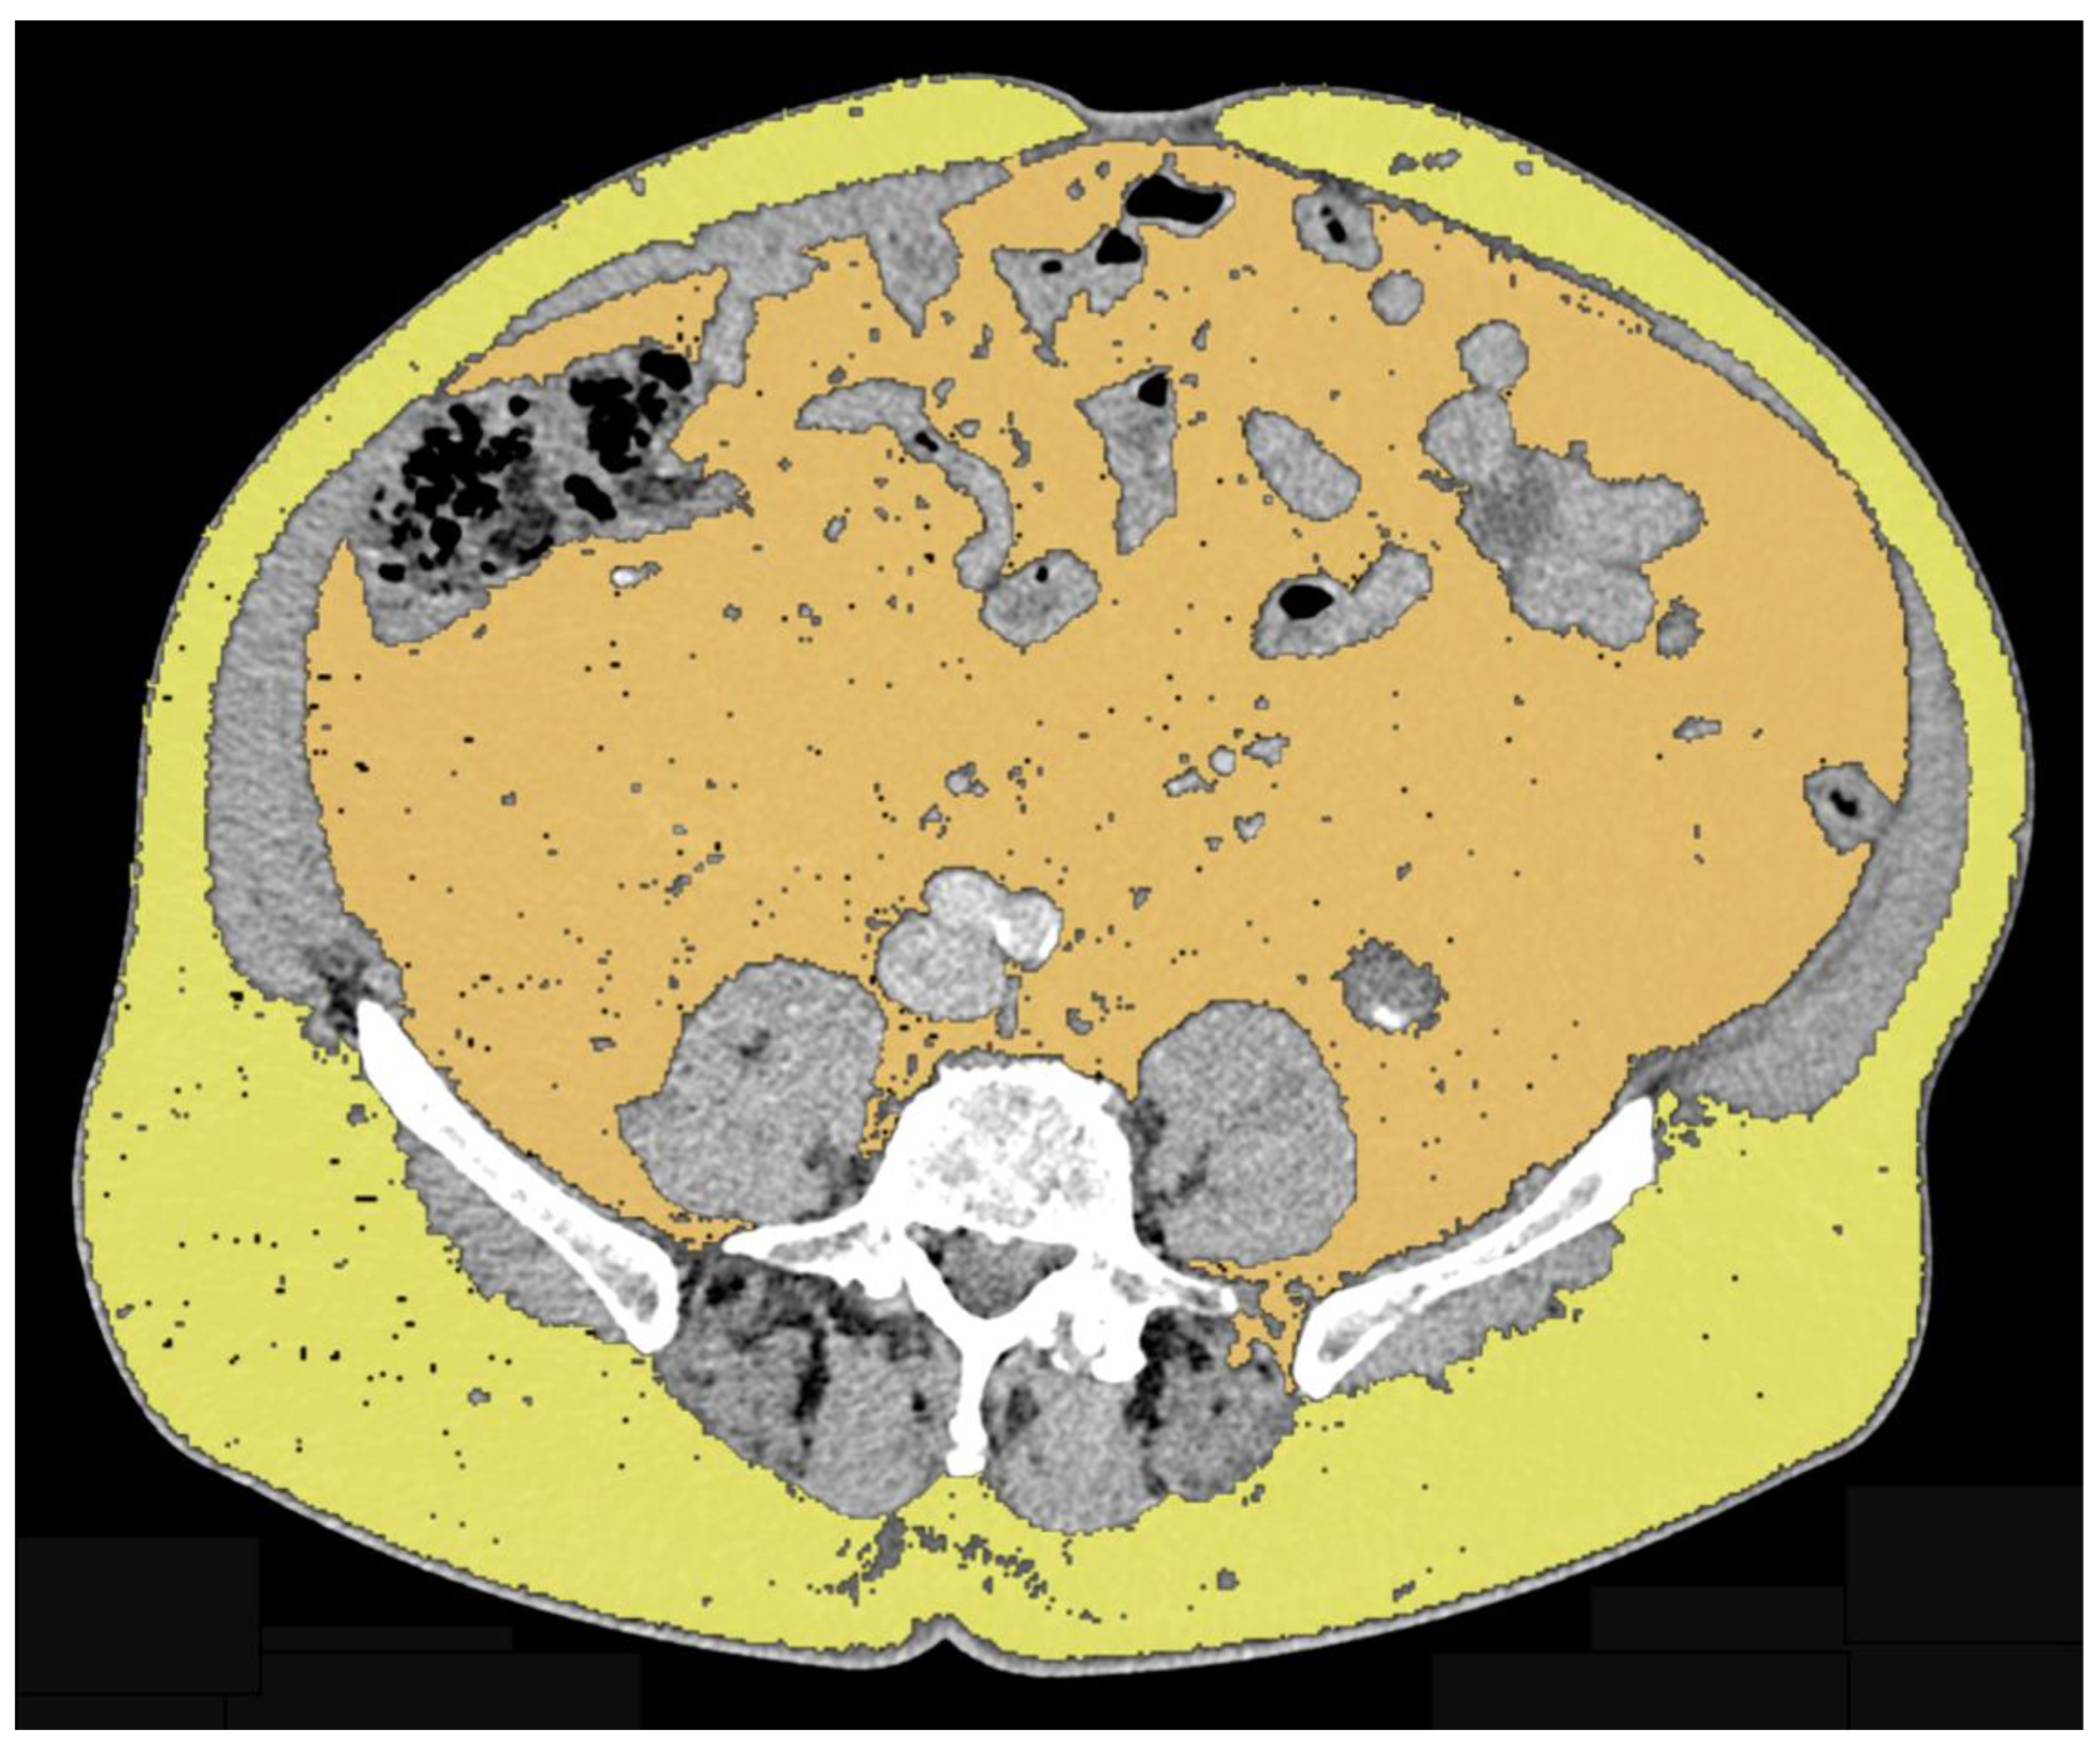
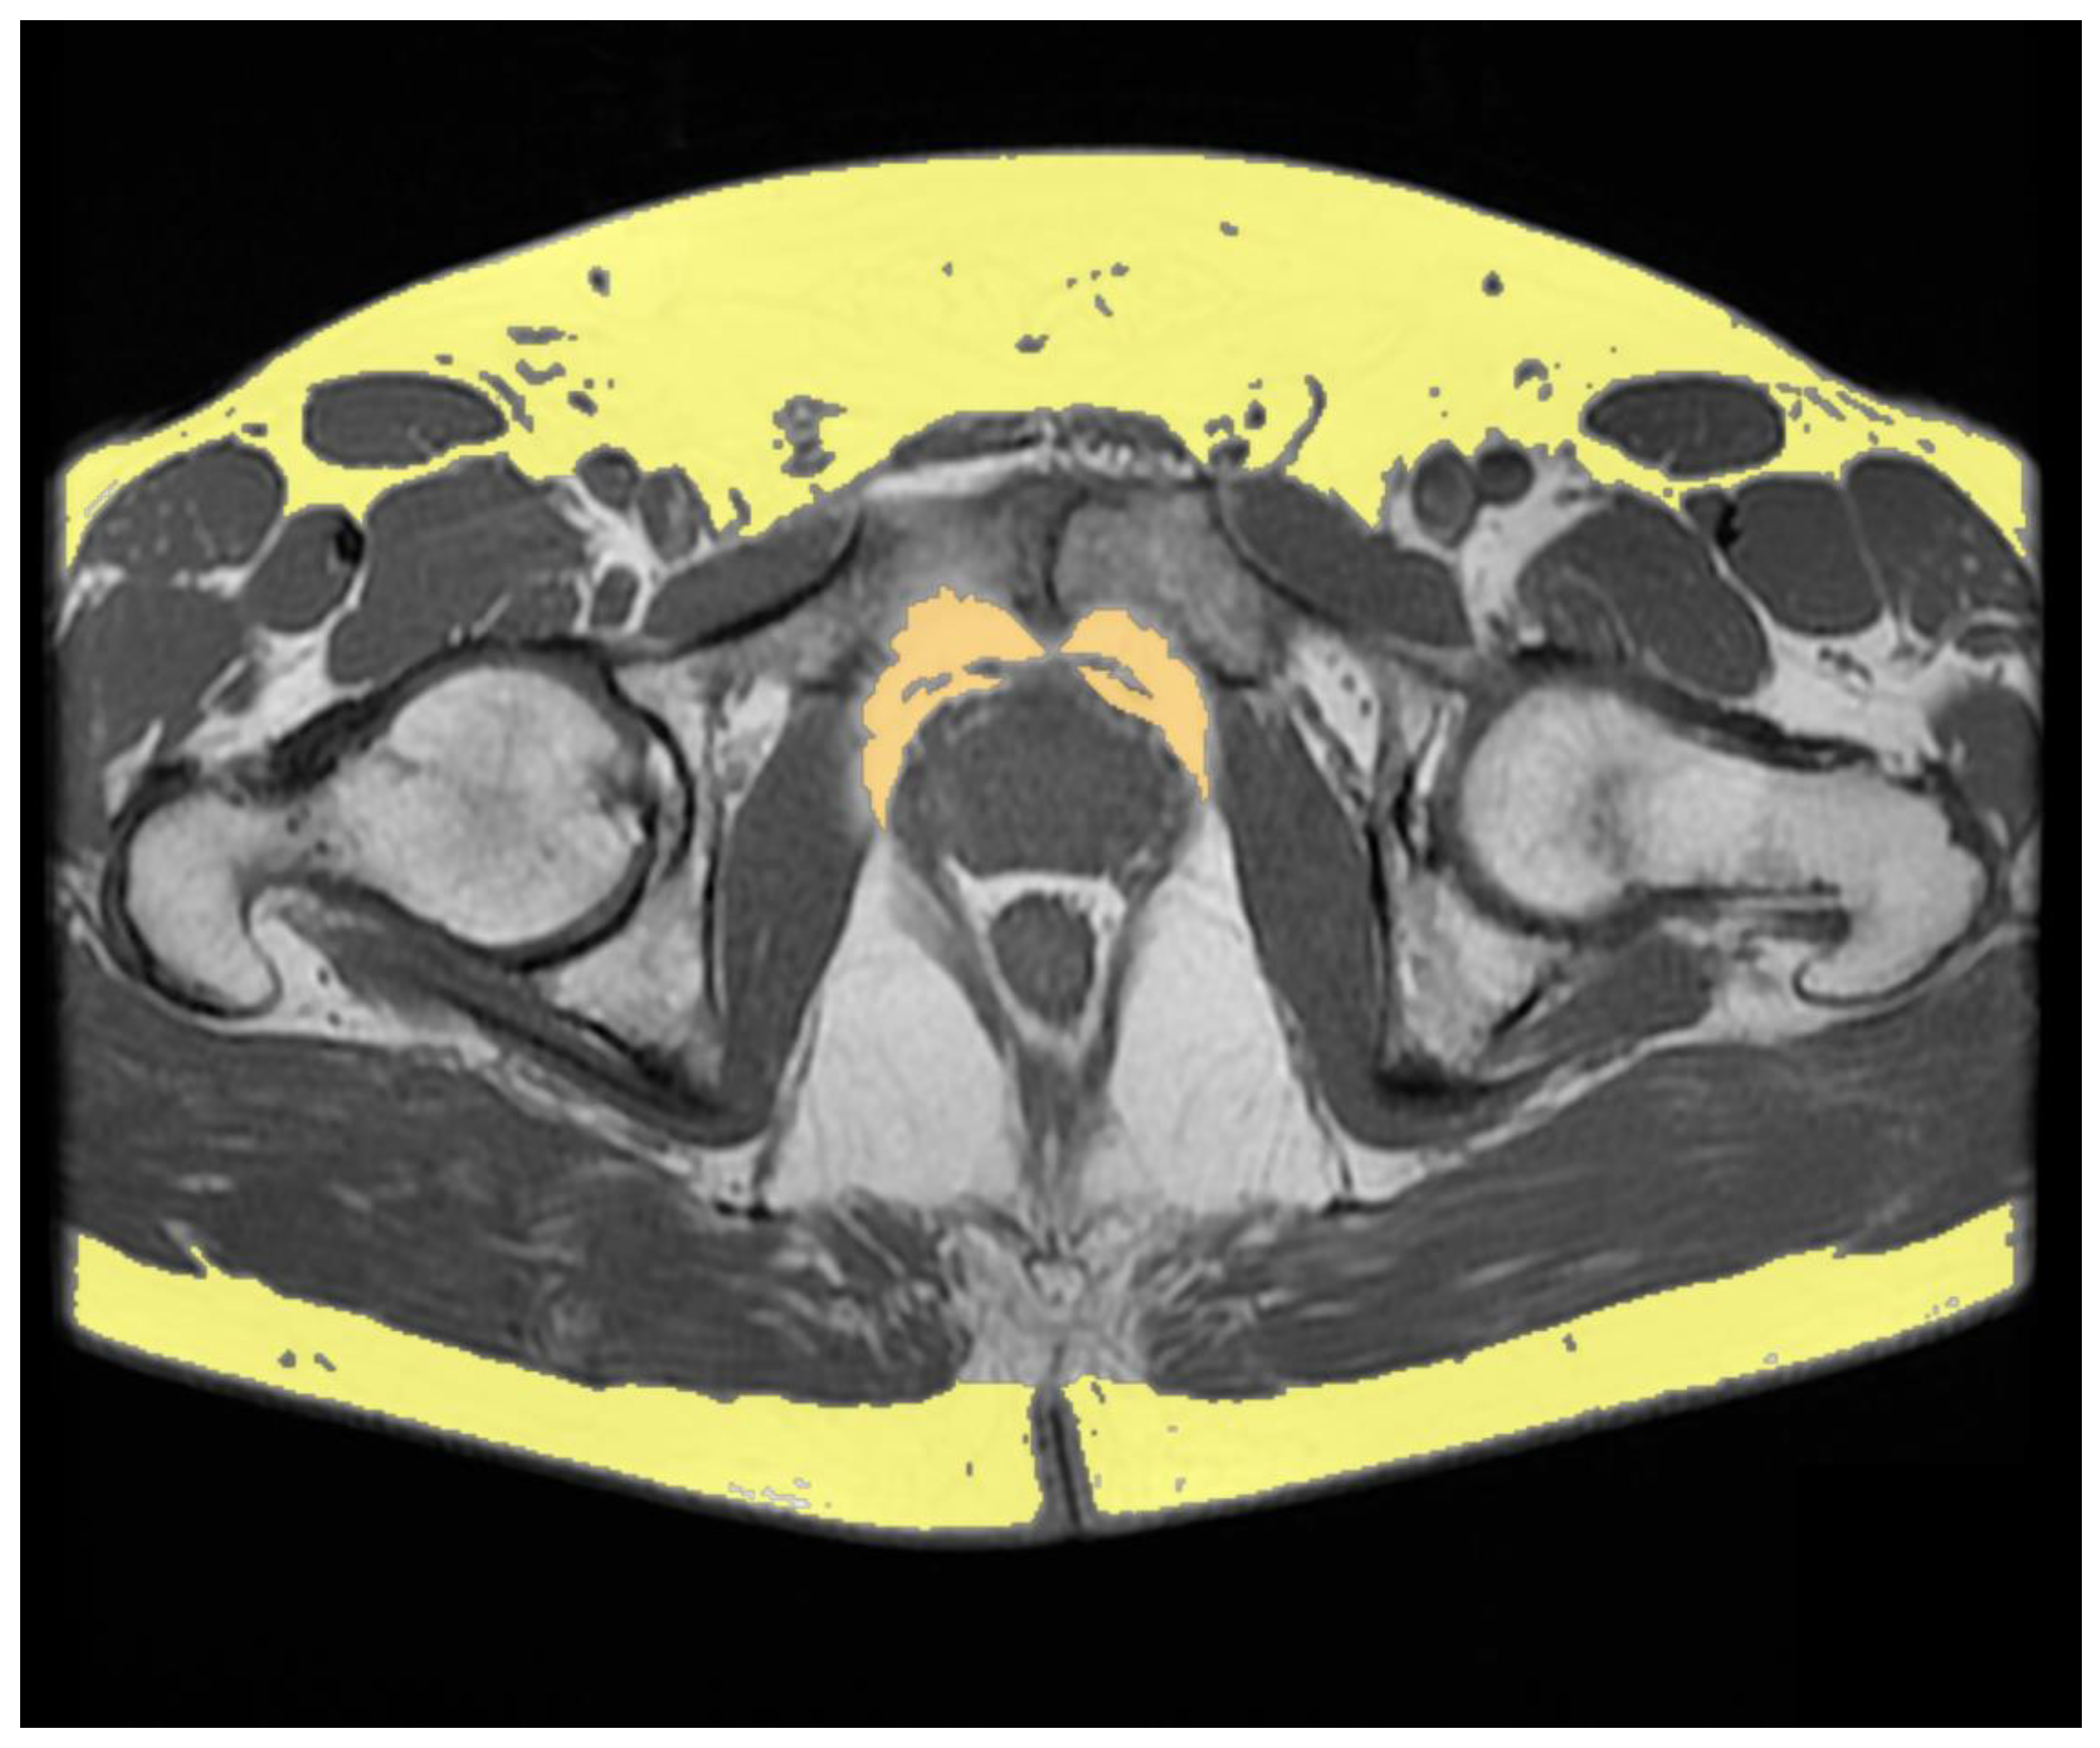
Androgens play an active role in body composition in men. Indeed, a positive correlation has been found between serum testosterone concentrations and lean mass together with a negative correlation with fat mass [1]. Testosterone replacement therapy determines an increase in lean body mass and a decrease in fat mass in hypogonadal men [2,3]. Surgical androgen deprivation or medical castration were the basis for treatment of advanced prostate cancer [4]. The new cytotoxic and androgen receptor-targeted therapies have demonstrated a survival benefit in association with androgen deprivation [5]. Considering that androgens are important for the homeostasis of different organ systems, their use is related to a number of harmful effects [6]. One of the side effects of androgen deprivation therapy (ADT), even for short term treatment, is an increase of fat mass [7,8]. The absence of androgen-related hormones changes the lipid composition of tissues and decreased insulin sensitivity, resulting in the promotion of an obese-like phenotype [9,10]. A body mass index (BMI) greater than 30 kg/m2 defines obesity, but it does not provide information on body composition such as the quantity of the different adipose tissue compartments [11,12]. Fat compartments can be distinguished by computed tomography (CT) and magnetic resonance imaging (MRI), non-invasive imaging techniques for qualitative and quantitative analysis of tissues (Figure 1 and Figure 2) [13,14,15,16,17].
Herein, we describe the effects of ADT on abdominal adipose tissue assessed by quantitative analysis performed by a CT and MRI imaging-based approach.
2. Methods
The literature search was carried out in September 2022 using MEDLINE PubMed Central. The search was performed for literature published between 2012 and 2022. Only articles written in English were included. The keywords used for the articles search were: “Androgen deprivation therapy adipose tissue” and “Androgen deprivation therapy fat”. Only articles evaluating body composition by a CT- and MRI-based approach in PCa patients treated with ADT were selected. Four articles met these criteria and were included in this review.
3. Results and Evidence
3.1. Effects of Androgen Deprivation Therapy on Abdominal Adipose Tissue
Antoun et al. evaluated body composition in patients with metastatic castration-resistant prostate cancer (PCa) treated with abiraterone acetate and enzalutamide. Quantification of visceral adipose tissue (VAT), subcutaneous adipose tissue (SAT), and skeletal muscle mass (SMM) was performed by a CT-approach, measuring cross-sectional areas on an axial plane at the level of the 3rd lumbar vertebra (L3). Among the 120 patients included, 46 patients had a body composition measurement at all three time points (baseline, 3 months, and 6 months).
There was a decrease in the SAT and SSM indexes (both p < 0.001) from baseline to 3 months and an increase in the VAT index (p = 0.01) from baseline to 3 months [18].
Sheikhbahaei et al. evaluated the body composition of 22 PCa patients (median age 58 years, median Gleason score 8) with recently diagnosed castration-naïve oligometastatic prostate cancer treated with neoadjuvant docetaxel chemotherapy and ADT before definitive prostatectomy and consolidation of local and oligometastatic disease. Ten patients received abiraterone + prednisone in addition to docetaxel (duration 1–16 weeks) and their use was terminated prior to prostatectomy. All but one patient underwent radical prostatectomy after completing chemotherapy. Approximately 12–16 weeks after prostatectomy, the patients underwent prostate/pelvic bed radiation therapy and consolidative stereotactic radiation to the oligometastatic lesions (n = 21). All but one patient received ADT for 12 months.
Body composition was evaluated by quantifying the total adipose tissue (TAT), VAT, SAT, and muscle psoas areas at L3–L4 level. The analysis was performed before the start of neoadjuvant therapy, within one month since the end of the neoadjuvant therapy and approximately one year after the start of the neoadjuvant therapy.
There was a significant decrease in psoas muscle areas on first and second follow-up CT exams relative to baseline (both p < 0.001), with a decline of −13.9% and −13.2%, respectively. Furthermore, a significant increase in SAT areas on first and second follow-up CT exams was found (p = 0.002, and p < 0.001, respectively) with an increase of +8.9% and +18.9% respectively. A similar trend was found for the TAT area. There was no significant change in VAT (p > 0.05) [19].
3.2. Role of Abdominal Adipose Tissue on Survival of Prostate Cancer Patients Treated with Androgen Deprivation Therapy
The univariate analysis of the study by Antoun et al., performed on the three body composition parameters (available for 120 patients), showed a correlation between the SAT index and overall survival. The median survival was 15 months (95% [CI] = 9–18) for patients with a SAT index < the median value (51.7 cm2/m2) and 18 months (95% [CI] = 13–30) for patients with a SAT index ≥ the median value (HR = 0.6, 95% [CI] = 0.4–0.9, p = 0.008) [18].
Salji et al. performed a retrospective study on 61 PCa patients with advanced disease (≥T3 or N1 or M1) treated with primary ADT. Their periprostatic fat volume (PPFV) was measured from staging MRI scans before ADT. Significantly higher PPFV was found in patients who developed castration-resistant PCa (n = 31) compared to patients who showed a prolonged response to ADT (n = 30), with a median of 37.9 cm3 compared with 16.1 cm3 (p < 0.0001, Wilcoxon rank sum test).
Immunohistochemical analysis for chemokine receptor 3 (CCR3), which mediates the interaction between periprostatic adipose tissue and PCa, performed on prostate biopsies in patients with a favorable sustained response to ADT (n = 6), initial response to ADT (n = 6), and poor response to ADT (n = 6), showed a progressive trend towards an increase in CCR3 expression from low PPFV (< 15 cc, n = 4), medium PPFV (15–45 cc, n = 10), to high PPFV: (< 45 cc, n = 4).
This study shows that PPFV quantification in patients with advanced PC could be used as a predictor of tumor response to ADT [20].
Sasaki et al. evaluated the relationship of periprostatic adipose tissue in advanced PCa patients (i.e., locally advanced and metastatic). The study was conducted on 85 hormone-naïve PCa patients who received primary ADT with surgical or pharmacologic castrations (i.e., luteinizing hormone-releasing hormone agonist or antagonist) associated with an antiandrogen (i.e., combined androgen blockade). In particular, through the MRI-approach, the thickness of the periprostatic adipose tissue and SAT were measured on the slices of T2-weighted images at the axial section, at the level of the femoral head and the greater trochanter of the femur and at the level of the maximum diameter of the bladder, respectively. Furthermore, by means of the CT-approach, VAT and SAT were measured in an axial plane at the umbilical level.
Patients with thinner periprostatic adipose tissue and thicker subcutaneous adipose tissue (i.e., periprostatic adipose tissue/SAT thickness ratio ≥ 1) showed better overall survival; while patients with thicker periprostatic adipose tissue and less thick subcutaneous adipose tissue (i.e., periprostatic adipose tissue/SAT thickness ratio < 1) showed worse overall survival (univariate hazard ratio and multivariate hazard ratio showed 2.05 [1.02–4.10] p = 0.043 and 3.25 [1.54–6.84] p = 0.002, respectively). There was no significant difference between VAT/SAT thickness ratio ≥ 1 and <1.
A pre-treatment periprostatic adipose tissue/SAT thickness ratio on an MRI scan is an independent predictor of survival in hormone-naïve patients with advanced PCa. This data could be used to predict which patients are more likely to develop castration-resistant PCa [21].
This narrative review demonstrated how the quantitative assessment of abdominal adipose tissue plays an important role in relation to the pharmacological treatment of prostate cancer through the use of ADT both in evaluating the effects of this therapy on adipose tissue and as a predictive factor in the assessment of survival.
However, this review has some limitations; the use of a single search engine in a limited period of time found only four articles. In the future, a systematic review using multiple search engines without limits of time span could increase the scientific evidence on the relationship between abdominal adipose tissue and ADT in PCa patients. Moreover, the relationship between visceral adiposity and functional outcomes after radical prostatectomy has been demonstrated [22]. In this direction further studies will have to be carried out in order to investigate the relationship between the compartments of abdominal adipose tissue and prostatectomy.
The data and results of the studies are summarized in Table 1.
4. Conclusions
Studies over the past decade have shown increased PPFV in patients who have developed castration-resistant PCa, suggesting that this parameter could give helpful information to predict tumor response to ADT. In particular, it has been demonstrated that PCa patients with a periprostatic adipose tissue/SAT thickness ratio ≥ 1 show better overall survival.
Lastly, one study found an increase in VAT and a decrease in SAT after ADT treatment, while another study found an increase in SAT in PCa patients treated with docetaxel chemotherapy and ADT.
Taken together, the available evidence highlights the importance of body composition imaging in investigating the effects of ADT on the male body.
Author Contributions
Conceptualization, F.G. and C.A.M.; methodology, F.G. and C.A.M.; resources, F.G., A.T., A.P. and C.A.M.; data curation, F.G. and C.A.M.; writing—original draft preparation, F.G. and C.A.M.; writing—review and editing, F.G., A.T., A.P. and C.A.M.; visualization, F.G., A.T. and C.A.M.; supervision, F.G., B.B.Z. and C.A.M.; project administration, F.G., B.B.Z. and C.A.M. All authors have read and agreed to the published version of the manuscript.
Funding
This research received no external funding.
Institutional Review Board Statement
Not applicable.
Informed Consent Statement
Not applicable.
Conflicts of Interest
The authors declare no conflict of interest.
References
- Vermeulen, A.; Goemaere, S.; Kaufman, J.M. Testosterone, body composition and aging. J. Endocrinol. Investig. 1999, 22, 110–116. [Google Scholar]
- Katznelson, L.; Finkelstein, J.S.; Schoenfeld, D.A.; Rosenthal, D.I.; Anderson, E.J.; Klibanski, A. Increase in bone density and lean body mass during testosterone administration in men with acquired hypogonadism. J. Clin. Endocrinol. Metab. 1996, 81, 4358–4365. [Google Scholar] [PubMed] [Green Version]
- Bhasin, S.; Storer, T.W.; Berman, N.; Yarasheski, K.E.; Clevenger, B.; Phillips, J.; Lee, W.P.; Bunnell, T.J.; Casaburi, R. Testosterone replacement increases fat-free mass and muscle size in hypogonadal men. J. Clin. Endocrinol. Metab. 1997, 82, 407–413. [Google Scholar] [CrossRef] [PubMed]
- Huggins, C.; Stevens, R.E.; Hodges, C.V. Studies on prostatic cancer: The effect of castration on advanced carcinoma of the prostate gland. Arch. Surg. 1941, 43, 209–223. [Google Scholar] [CrossRef]
- James, N.D.; Spears, M.R.; Clarke, N.W.; Dearnaley, D.P.; De Bono, J.S.; Gale, J.; Hetherington, J.; Hoskin, P.J.; Jones, R.J.; Laing, R.; et al. Survival with Newly Diagnosed Metastatic Prostate Cancer in the “Docetaxel Era”: Data from 917 Patients in the Control Arm of the STAMPEDE Trial (MRC PR08, CRUK/06/019). Eur. Urol. 2015, 67, 1028–1038. [Google Scholar] [CrossRef] [Green Version]
- Rhee, H.; Gunter, J.H.; Heathcote, P.; Ho, K.; Stricker, P.; Corcoran, N.M.; Nelson, C.C. Adverse effects of androgen deprivation therapy in prostate cancer and their management. BJU Int. 2015, 115 (Suppl. S5), 3–13. [Google Scholar] [CrossRef]
- Van Londen, G.J.; Levy, M.E.; Perera, S.; Nelson, J.B.; Greenspan, S.L. Body composition changes during androgen deprivation therapy for prostate cancer: A 2-year prospective study. Crit. Rev. Oncol. Hematol. 2008, 68, 172–177. [Google Scholar] [CrossRef] [Green Version]
- Smith, J.C.; Bennett, S.; Evans, L.M.; Kynaston, H.G.; Parmar, M.; Mason, M.D.; Cockcroft, J.R.; Scanlon, M.F.; Davies, J.S. The effects of induced hypogonadism on arterial stiffness, body composition, and metabolic parameters in males with prostate cancer. J. Clin. Endocrinol. Metab. 2001, 86, 4261–4267. [Google Scholar] [CrossRef]
- Faris, J.E.; Smith, M.R. Metabolic sequelae associated with androgen deprivation therapy for prostate cancer. Curr. Opin. Endocrinol. Diabetes Obes. 2010, 17, 240–246. [Google Scholar] [CrossRef] [Green Version]
- Freedland, S.J.; Aronson, W.J.; Kane, C.J.; Presti, J.C., Jr.; Amling, C.L.; Elashoff, D.; Terris, M.K. Impact of obesity on biochemical control after radical prostatectomy for clinically localized prostate cancer: A report by the Shared Equal Access Regional Cancer Hospital database study group. J. Clin. Oncol. 2004, 22, 446–453. [Google Scholar] [CrossRef]
- WHO. Obesity: Preventing and Managing the Global Epidemic: Report of a WHO Consultation; World Health Organization Technical Report Series 894; WHO: Geneva, Switzerland, 2000; 253p. [Google Scholar]
- Park, Y.H.; Lee, J.K.; Kim, K.M.; Kook, H.R.; Lee, H.; Kim, K.B.; Lee, S.; Byun, S.S.; Lee, S.E. Visceral obesity in predicting oncologic outcomes of localized renal cell carcinoma. J. Urol. 2014, 192, 1043–1049. [Google Scholar] [CrossRef] [PubMed]
- Del Buono, R.; Sabatino, L.; Greco, F. Neck fat volume as a potential indicator of difficult intubation: A pilot study. Saudi J. Anaesth. 2018, 12, 67–71. [Google Scholar] [PubMed]
- Greco, F.; Cirimele, V.; Mallio, C.A.; Beomonte Zobel, B.; Grasso, R.F. Increased visceral adipose tissue in male patients with clear cell renal cell carcinoma. Clin. Cancer Investig. J. 2018, 7, 132–136. [Google Scholar] [CrossRef]
- Greco, F.; Mallio, C.A.; Cirimele, V.; Grasso, R.F.; Beomonte Zobel, B. Subcutaneous adipose tissue as a biomarker of pancreatic cancer: A pilot study in male patients. Clin. Cancer Investig. J. 2019, 8, 10–19. [Google Scholar] [CrossRef]
- Mallio, C.A.; Greco, F.; Pacella, G.; Schena, E.; Beomonte Zobel, B. Gender-based differences of abdominal adipose tissue distribution in non-small cell lung cancer patients. Shanghai Chest 2018, 2, 20. [Google Scholar] [CrossRef]
- Greco, F.; Quarta, L.G.; Carnevale, A.; Giganti, M.; Grasso, R.F.; Beomonte Zobel, B.; Mallio, C.A. Subcutaneous Adipose Tissue Reduction in Patients with Clear Cell Renal Cell Carcinoma and Peritumoral Collateral Vessels: A Retrospective Observational Study. Appl. Sci. 2021, 11, 6076. [Google Scholar] [CrossRef]
- Antoun, S.; Bayar, A.; Ileana, E.; Laplanche, A.; Fizazi, K.; di Palma, M.; Escudier, B.; Albiges, L.; Massard, C.; Loriot, Y. High subcutaneous adipose tissue predicts the prognosis in metastatic castration-resistant prostate cancer patients in post chemotherapy setting. Eur. J. Cancer 2015, 51, 2570–2577. [Google Scholar] [CrossRef]
- Sheikhbahaei, S.; Reyes, D.K.; Rowe, S.P.; Pienta, K.J. CT-based assessment of body composition following neoadjuvant chemohormonal therapy in patients with castration-naïve oligometastatic prostate cancer. Prostate 2021, 81, 127–134. [Google Scholar] [CrossRef]
- Salji, M.; Hendry, J.; Patel, A.; Ahmad, I.; Nixon, C.; Leung, H.Y. Peri-prostatic Fat Volume Measurement as a Predictive Tool for Castration Resistance in Advanced Prostate Cancer. Eur. Urol. Focus 2018, 4, 858–866. [Google Scholar] [CrossRef] [Green Version]
- Sasaki, T.; Sugino, Y.; Kato, M.; Nishikawa, K.; Kanda, H. Pre-treatment ratio of periprostatic to subcutaneous fat thickness on MRI is an independent survival predictor in hormone-naïve men with advanced prostate cancer. Int. J. Clin. Oncol. 2020, 25, 370–376. [Google Scholar] [CrossRef]
- Cai, T.; Cocci, A.; Di Maida, F.; Chiodini, S.; Ciarleglio, F.; Luciani, L.G.; Pedrotti, G.; Palmieri, A.; Malossini, G.; Rizzo, M.; et al. Visceral adiposity is associated with worse urinary and sexual function recovery after radical prostatectomy: Results from a longitudinal cohort study. Arch. Ital. Urol. Androl. 2021, 93, 285–290. [Google Scholar] [CrossRef] [PubMed]
Figure 1.
Axial CT image of a male subject showing VAT segmented in orange and SAT segmented in yellow.
Figure 1.
Axial CT image of a male subject showing VAT segmented in orange and SAT segmented in yellow.

Figure 2.
Axial T1-weighted MRI image showing periprostatic adipose tissue segmented in orange and SAT segmented in yellow.
Figure 2.
Axial T1-weighted MRI image showing periprostatic adipose tissue segmented in orange and SAT segmented in yellow.


Table 1.
Summary of data and results of CT and MRI studies with quantification of adipose tissue compartments.
Table 1.
Summary of data and results of CT and MRI studies with quantification of adipose tissue compartments.
| Authors | Therapy | Adipose Tissue Compartments | Quantification Method | Number of Patients | Results |
|---|---|---|---|---|---|
| Antoun et al. (2015) [18] | Abiraterone acetateEnzalutamide | VAT SAT | Area at L3 level on axial plane using CT-based approach | 46 | Decrease in SAT (p < 0.001) Increase in VAT (p = 0.01) |
| Salji et al. (2018) [20] | Luteinizing hormone-releasing hormone analogues Androgen receptor blocker alone Estrogen patches Luteinizing hormone-releasing hormone antagonist | PPFV | Volume was calculated by consecutive areas using MRI-based approach on T2-weighted axial images | 61 | Higher PPFV in castration-resistant PCa patients compared to patients who showed a prolonged response to ADT (p < 0.0001). |
| Sasaki et al. (2020) [21] | Luteinizing hormone-releasing hormone agonist or antagonist Androgen blockade | Periprostatic adipose tissue thickness SAT thickness VAT SAT | Periprostatic fat thickness was measured on T2-weighted axial images at the femoral head and greater trochanter of the femur levels SAT thickness was measured on T2-weighted axial images at the maximum diameter of the bladder level VAT and SAT areas area were measured on axial plane using CT-based approach at the level of the umbilical position | 85 | Periprostatic adipose tissue/SAT thickness ratio ≥ 1 and overall survival Periprostatic adipose tissue/SAT thickness ratio < 1 and overall survival Univariate hazard ratio and multivariate hazard ratio showed p = 0.043 and p = 0.002, respectively VAT/SAT thickness ratio ≥ 1 and <1: no significant difference |
| Sheikhbahaei et al. (2021) [19] | Docetaxel Abiraterone Prednisone | TAT VAT SAT | Area at L3 level on axial plane using CT-based approach | 22 | Increased SAT areas on first and second follow-up CT exams (p = 0.002 and p < 0.001, respectively) Increased TAT area on second follow-up compared to baseline (p < 0.001) No significant change in VAT areas |
ADT, androgen deprivation therapy; CT, computed tomography; PCa, advanced prostate cancer; PPFV, periprostatic fat volume; SAT, subcutaneous adipose tissue; TAT, total adipose tissue; VAT, visceral adipose tissue.
Publisher’s Note: MDPI stays neutral with regard to jurisdictional claims in published maps and institutional affiliations. |
© 2022 by the authors. Licensee MDPI, Basel, Switzerland. This article is an open access article distributed under the terms and conditions of the Creative Commons Attribution (CC BY) license (https://creativecommons.org/licenses/by/4.0/).
Share and Cite
MDPI and ACS Style
Greco, F.; Tafuri, A.; Panunzio, A.; Beomonte Zobel, B.; Mallio, C.A. Relationship between Androgen Deprivation Therapy and Abdominal Adipose Tissue. Uro 2022, 2, 270-276. https://doi.org/10.3390/uro2040030
AMA Style
Greco F, Tafuri A, Panunzio A, Beomonte Zobel B, Mallio CA. Relationship between Androgen Deprivation Therapy and Abdominal Adipose Tissue. Uro. 2022; 2(4):270-276. https://doi.org/10.3390/uro2040030
Chicago/Turabian StyleGreco, Federico, Alessandro Tafuri, Andrea Panunzio, Bruno Beomonte Zobel, and Carlo Augusto Mallio. 2022. "Relationship between Androgen Deprivation Therapy and Abdominal Adipose Tissue" Uro 2, no. 4: 270-276. https://doi.org/10.3390/uro2040030