Article

The Computed Sinusoid

by
Matteo Boninsegna
1,
Peter A. G. McCourt
2 and
Christopher Florian Holte
2,*
1
Department of Physics, Bielefeld University, D-33501 Bielefeld, Germany
2
Faculty of Health Sciences, Institute for Medical Biology, UiT The Arctic University of Norway, 9010 Tromsø, Norway
*
Author to whom correspondence should be addressed.
Livers 2023, 3(4), 657-673; https://doi.org/10.3390/livers3040043
Submission received: 19 July 2023 / Revised: 17 October 2023 / Accepted: 26 October 2023 / Published: 11 November 2023

Abstract

:
Hepatic sinusoids are lined with thin endothelial cells with transcellular pores, termed fenestrations. These fenestrations are open channels that connect the sinusoidal lumen to the underlying Space of Disse (SoD) and the hepatocytes of the liver parenchyma. Fenestrations range from 0.05 to 0.35 µm in diameter and cover 5–15% of the sinusoidal endothelial surface area, depending on their location along the sinusoids. The direct measurement of hemodynamic parameters, such as pressure and flow velocity, remains challenging within the narrow sinusoids. Such knowledge would increase our understanding of the physiology of the hepatic niche and possible implications in aging or diseases in which fenestrations are reduced or lost. Few simulations of liver blood flow focus on the level of the individual sinusoid, and fewer still include the transcellular pores (fenestrations) of the sinusoidal endothelium. Furthermore, none have included (i) a porosity gradient along the sinusoid wall, modeled using through-all pores rather than a porous medium, (ii) the presence of the SoD, or (iii) lymphatic drainage. Herein, computed fluid dynamics (CFD) simulations were performed using a numerical model with relevant anatomical characteristics (length, diameter, porosity, inlet/outlet pressure, and lymphatic outflow from the portal region of the SoD). The greatest contribution to luminal velocity magnitude and pressure was the overall shape of the vessel. Divergent-radius models yielded velocity magnitudes 1.5–2 times higher than constant-radius models, and pressures were 5–8% lower in the divergent-radius models compared to the constant-radius models. Porosity only modestly contributed to luminal pressure. The luminal velocity magnitude was largely unaffected by the presence or absence of lymphatic drainage. Velocity magnitudes through fenestrations were lower in higher-porosity models (20%) vs. lower-porosity models (5%) across all models (0.4–0.55-fold lower). Velocity magnitudes through the space of Disse were increased 3–4 times via the addition of lymphatic drainage to the models, while pressures were decreased by 6–12%. The flow velocity in the SoD was modified via differences in porosity, while the flow velocity in the lumens of the sinusoids was largely unaffected. The overall shape of the vessel is the single most important factor in the pressure flow behavior of the sinusoidal lumen. The flow rate over hepatocytes and the SoD is modestly affected by the distribution of porosity along the sinusoid and greatly affected by the lymphatic drainage, parameters that would be of interest for modeling the exchange of blood with the hepatic parenchyma.

1. Introduction

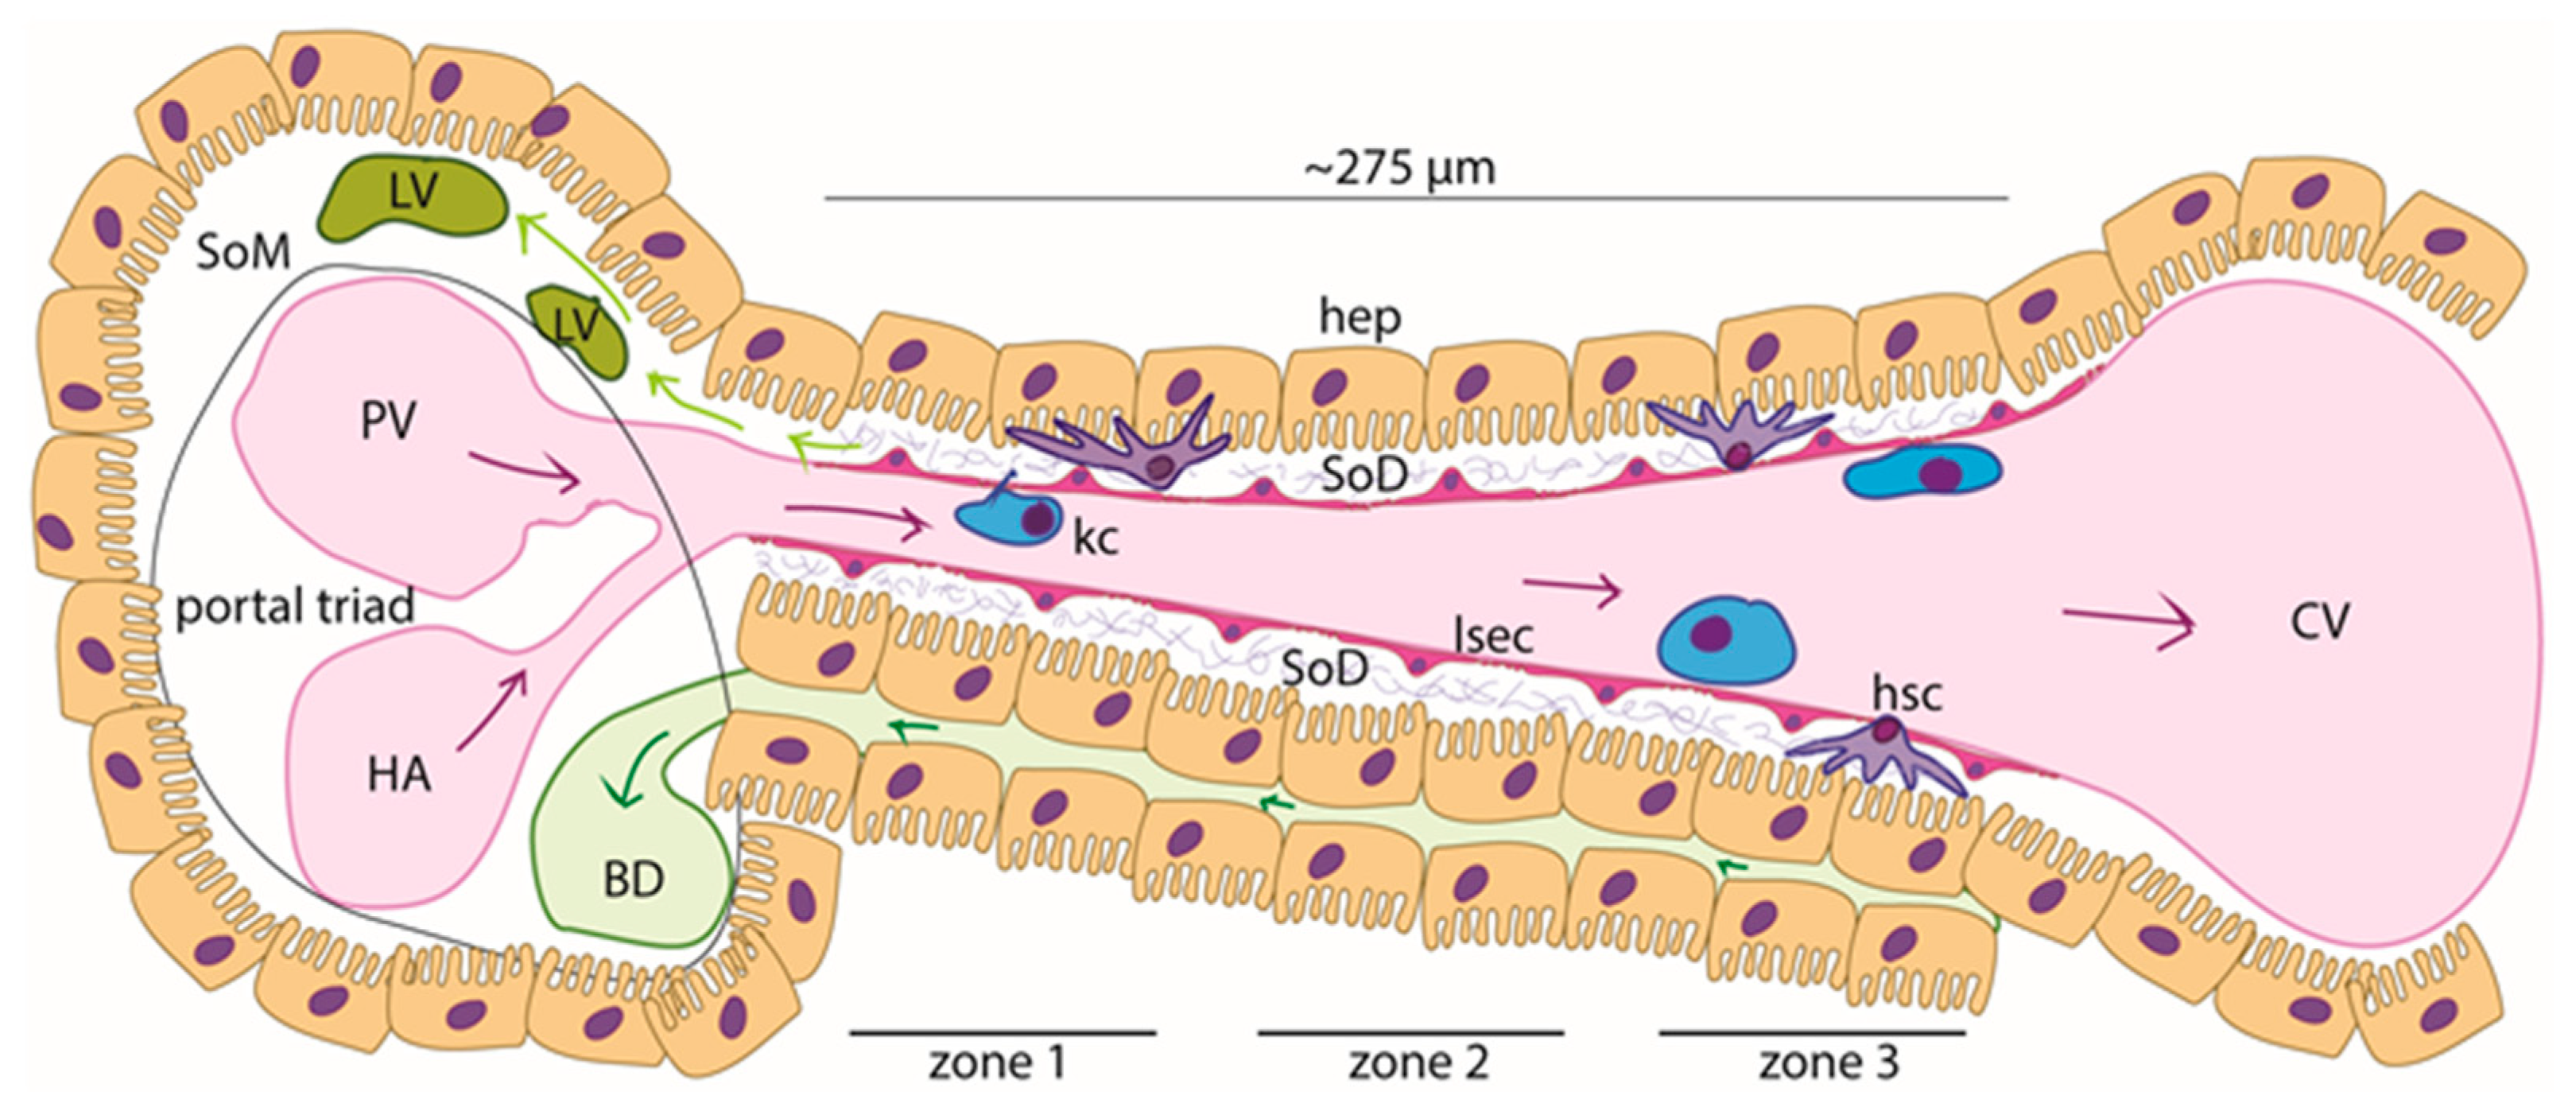
1.1. The Hepatic Sinusoid

In liver lobules, blood enters the sinusoids from the portal triad (PT) and flows toward the central vein (CV). Sinusoids are approximately 275 µm long and 5–15 µm wide [1,2]. Particularly, the periportal zone (zone 1) of the sinusoid has a lumen with a narrower diameter with respect to the perivenous zone (zone 3), while an intermediate width characterizes the zone in between (zone 2) (Figure 1) [3,4,5].
In rats, the mean linear flow rate of blood within the hepatic microvasculature is roughly 144 µm/s. Flow speed and fluidic resistance increase from the periportal zone to the perivenous zone [1,5,6]. Conversely, the pressure along the sinusoid decreases from 70 mmHg (9333 Pa) in zone 1 to 30 mmHg (2666 Pa) in zone 3 [5]. While velocities can be measured directly by tracking leukocytes or other particles in the sinusoids via in vivo microscopy, pressures across the sinusoids must be estimated from measurements of terminal portal venules and terminal hepatic venules [5]. Endothelial porosity (the area of the endothelium covered with fenestrations) also varies across hepatic zones, with fewer and narrower fenestrations in the periportal zone relative to the pericentral zone (Table 1) [2,7,8,9,10].
The liver is the largest site of lymph production in the body, with up to 50% of the lymph that drains into the thoracic duct formed here [14]. Hepatic lymph generation begins with the filtration of blood through the fenestrations of the sinusoidal lining, followed by drainage through the lymphatic vasculature beginning in the Space of Mall (SoM), a region of the portal tract situated between the outermost hepatocytes and the hepatic stroma [15,16,17]). Lymph production is correlated with hydrostatic pressure within the sinusoids, with even slight pressure changes increasing lymph production and flow [14,15]. This physiological consequence, which is particularly evident in pathological conditions such as portal hypertension, is due to the high permeability of the sinusoids [18].

1.2. Models of the Hepatic Sinusoids

Given the inaccessibility of the liver sinusoids to sensors for direct measurements of hemodynamic variables, computed fluid dynamics (CFD) simulations were used to model the flow field here (Table 2).
There are few models of the fluid dynamics of the liver or hepatic sinusoids that account for the presence of fenestrations [24], with most studies simulating whole lobules or larger areas of the liver [19,20,21,22,23,25,26,27,28,29,30,31,32,33] and, as such, accounting for porosity in a more general way (as porous medium) in their models. No one has, to our knowledge, added variable porosity to their models as such. Furthermore, the porosity of the liver sinusoid is reduced in several pathologies/conditions, such as cirrhosis [34], alcoholic liver disease [35], and in aging [36]. We therefore believe there is value added in a model that examines the single-sinusoid level, investigating the contributions made by the overall shape and the distribution of fenestrations (the porosity) in a computational fluid dynamics model of a single sinusoid. This is especially due to the effects found in microfluidics of an increasing versus constant porosity on the fluid flow velocity through a microchannel [37]. Brainerd et al. found that in a micro-channel lined with pores, the magnitude of the outflow velocity dropped significantly along its length if the porosity (% area fraction covered by open pores) was even along the length, while to achieve an even outflow from the channel, the porosity needed to increase along the length. Taken together with electron microscopic observations made on liver tissue samples, porosity was expected to contribute to fluid dynamics in the liver sinusoid.
Here, we seek to model the hemodynamics of a single liver sinusoid with a computationally inexpensive model that contains the most important ultrastructural details of the sinusoid. We aim to decipher the relative contributions of (i) the radius of the sinusoid (either as constant or expanding), (ii) the presence or absence of a periportal lymphatic drainage outlet in the space of Disse, and (iii) the distribution of fenestrations to pressure profiles and flow behavior.

2. Materials and Methods

2.1. Computational Fluid Dynamics (CFD) Simulations

CFD simulations were performed using Ansys® 2021 R1 Academic software and a laptop with the features listed below (Table 3).
The numerical 2D models utilized in the simulations were two half-sections of a simplified sinusoid with either a constant luminal radius (named C = constant-radius sinusoid) or a diverging luminal radius (named D = diverging sinusoid).
Each model was tested with different porosity and inlet pressure configurations (physiological vs. pathological pressure).
The effect of a lymphatic outflow in the portal tract of the SoD was explored for each model.
Linear porosity was defined as the ratio between the length given by the sum of the fenestrations and the length of the sinusoid.
Zonal linear porosity was defined as the ratio between the length given by the sum of the fenestrations in a certain zone and the length of the zone itself.
All three zones (periportal (1), perivenous (3), and intermediate (2)) were set to the same length (275/3 = 91.667 µm).
Numerical models with constant porosity were obtained by arranging fenestrations of a constant pitch along the whole length of the sinusoid. When variable porosity was applied, the fenestration pitch varied zone by zone (but the fenestrations were evenly spaced inside the zone itself). Zones 1, 2, and 3 of the sinusoid had porosities of 5%, 6%, and 20%, respectively. Thus, changes in porosity were applied by increasing the number of fenestrations rather than enlarging their diameter (Figure 2).

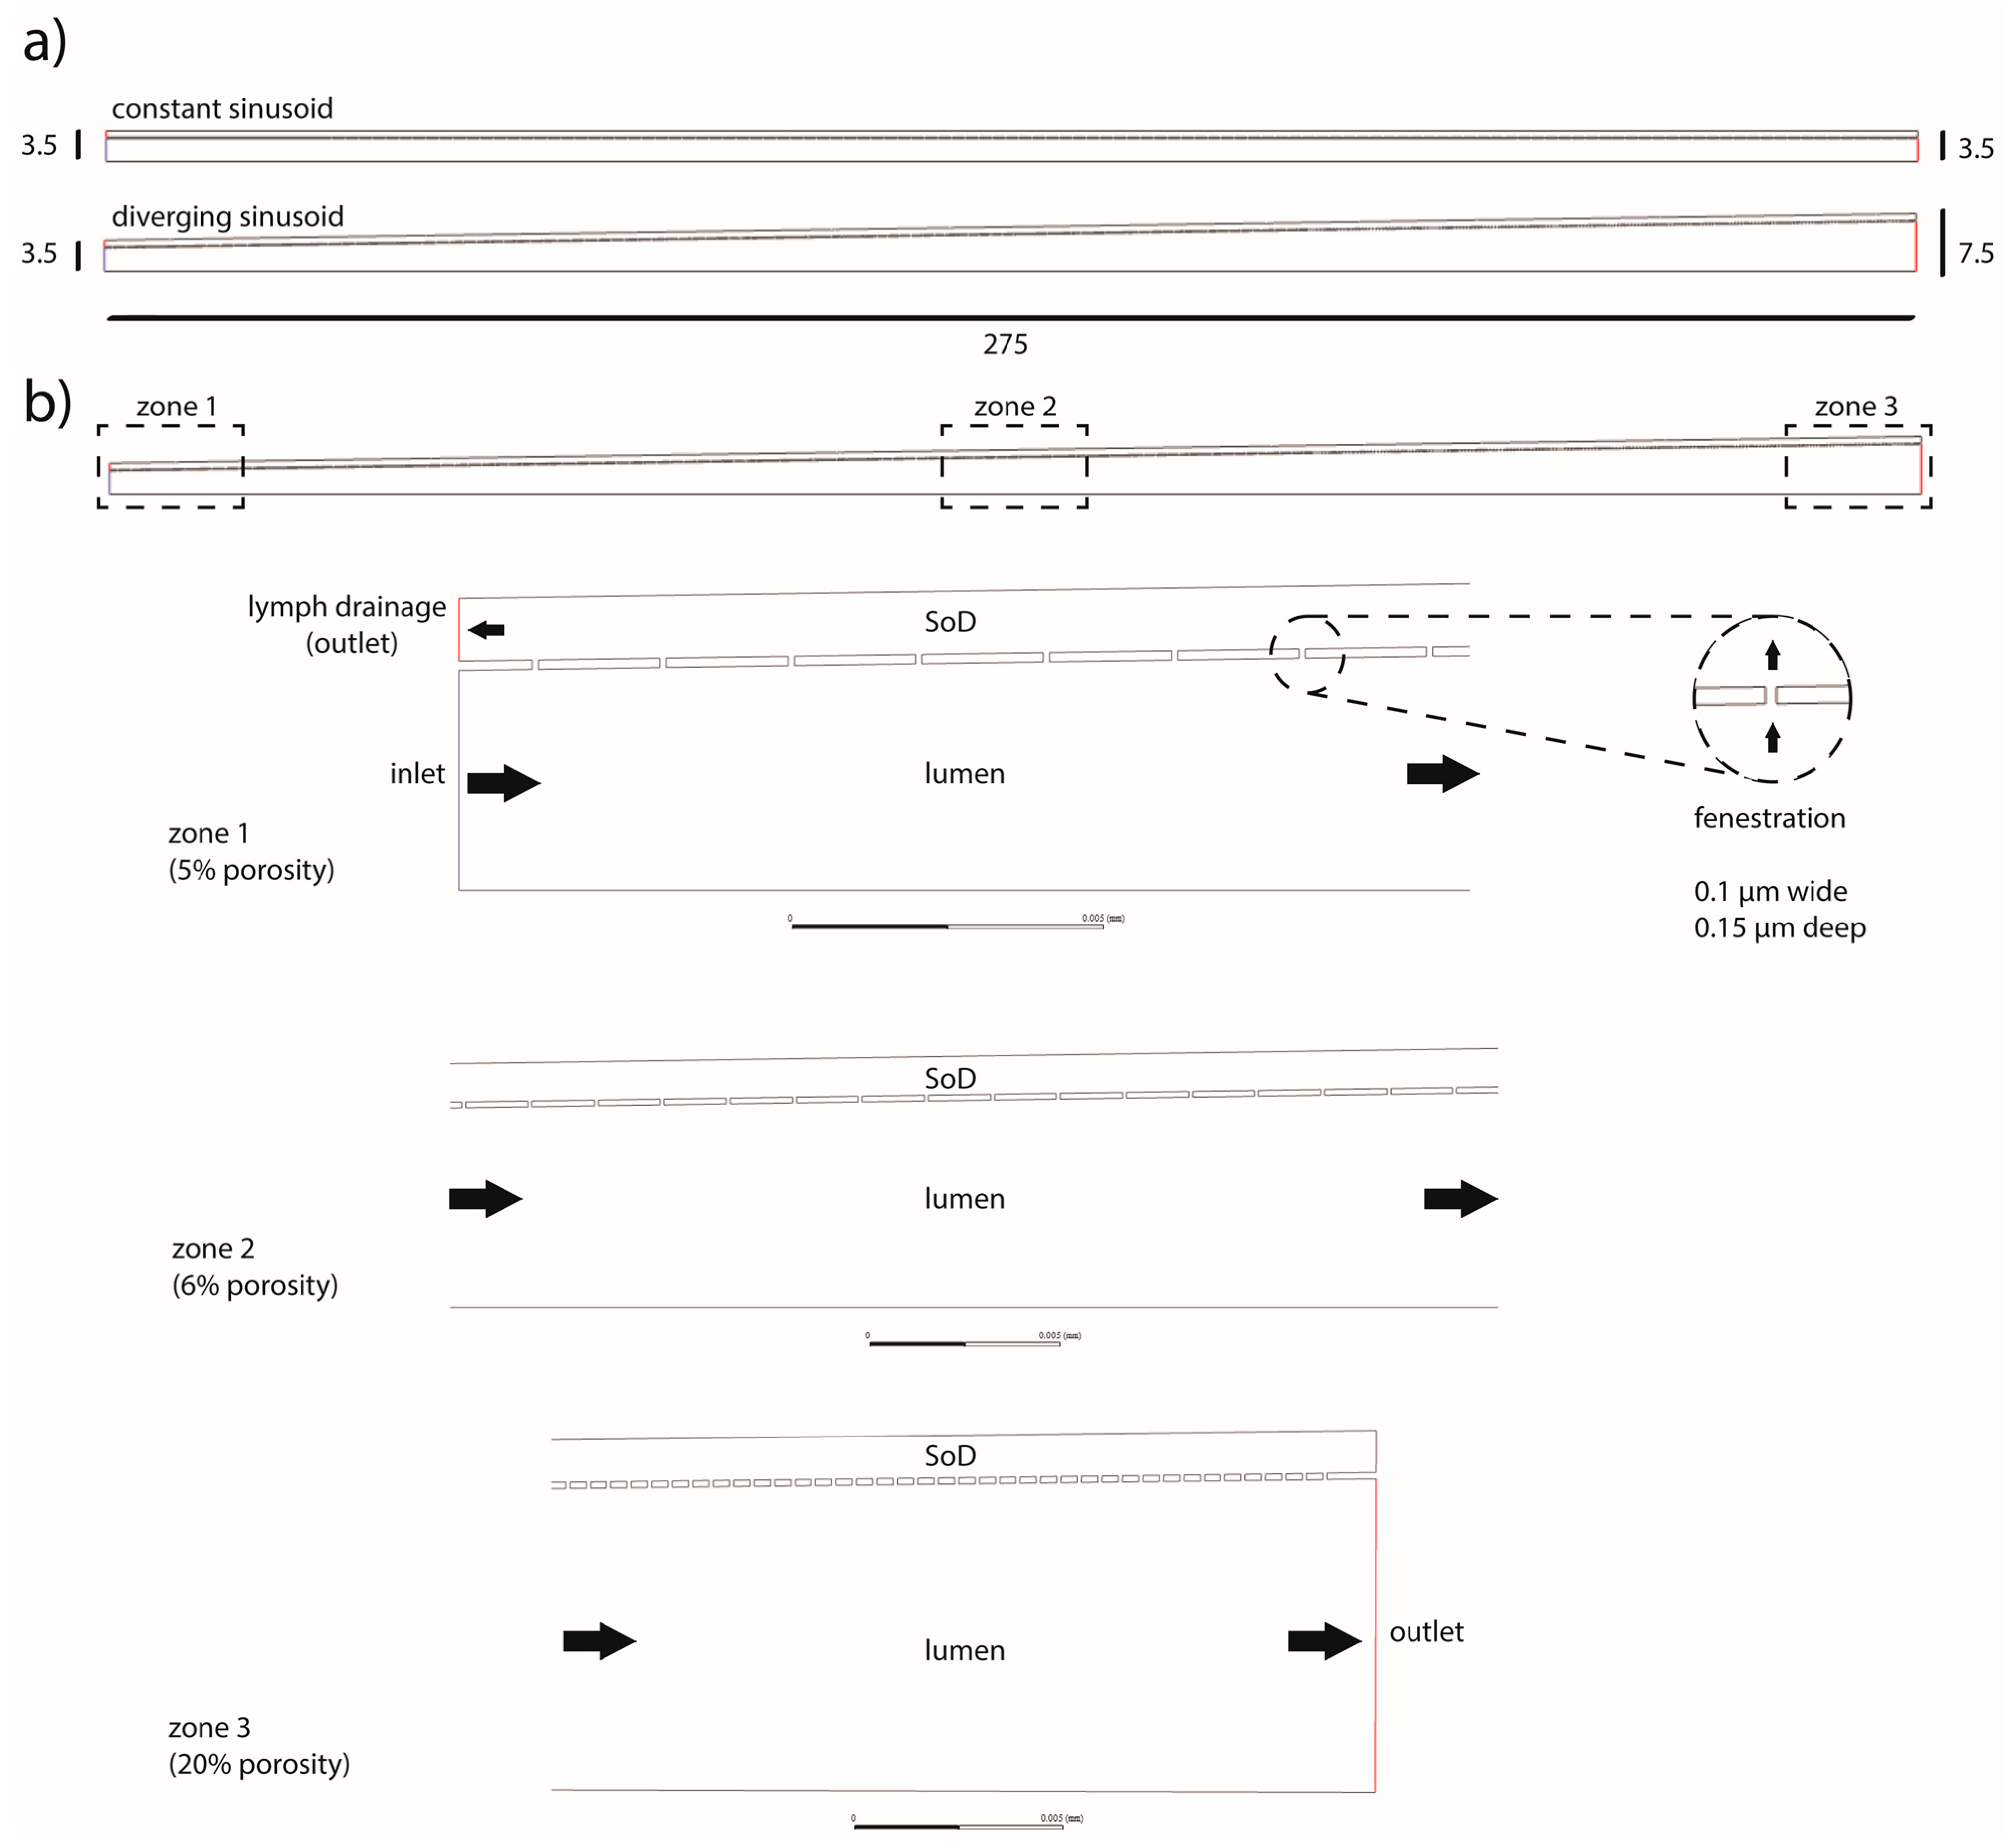
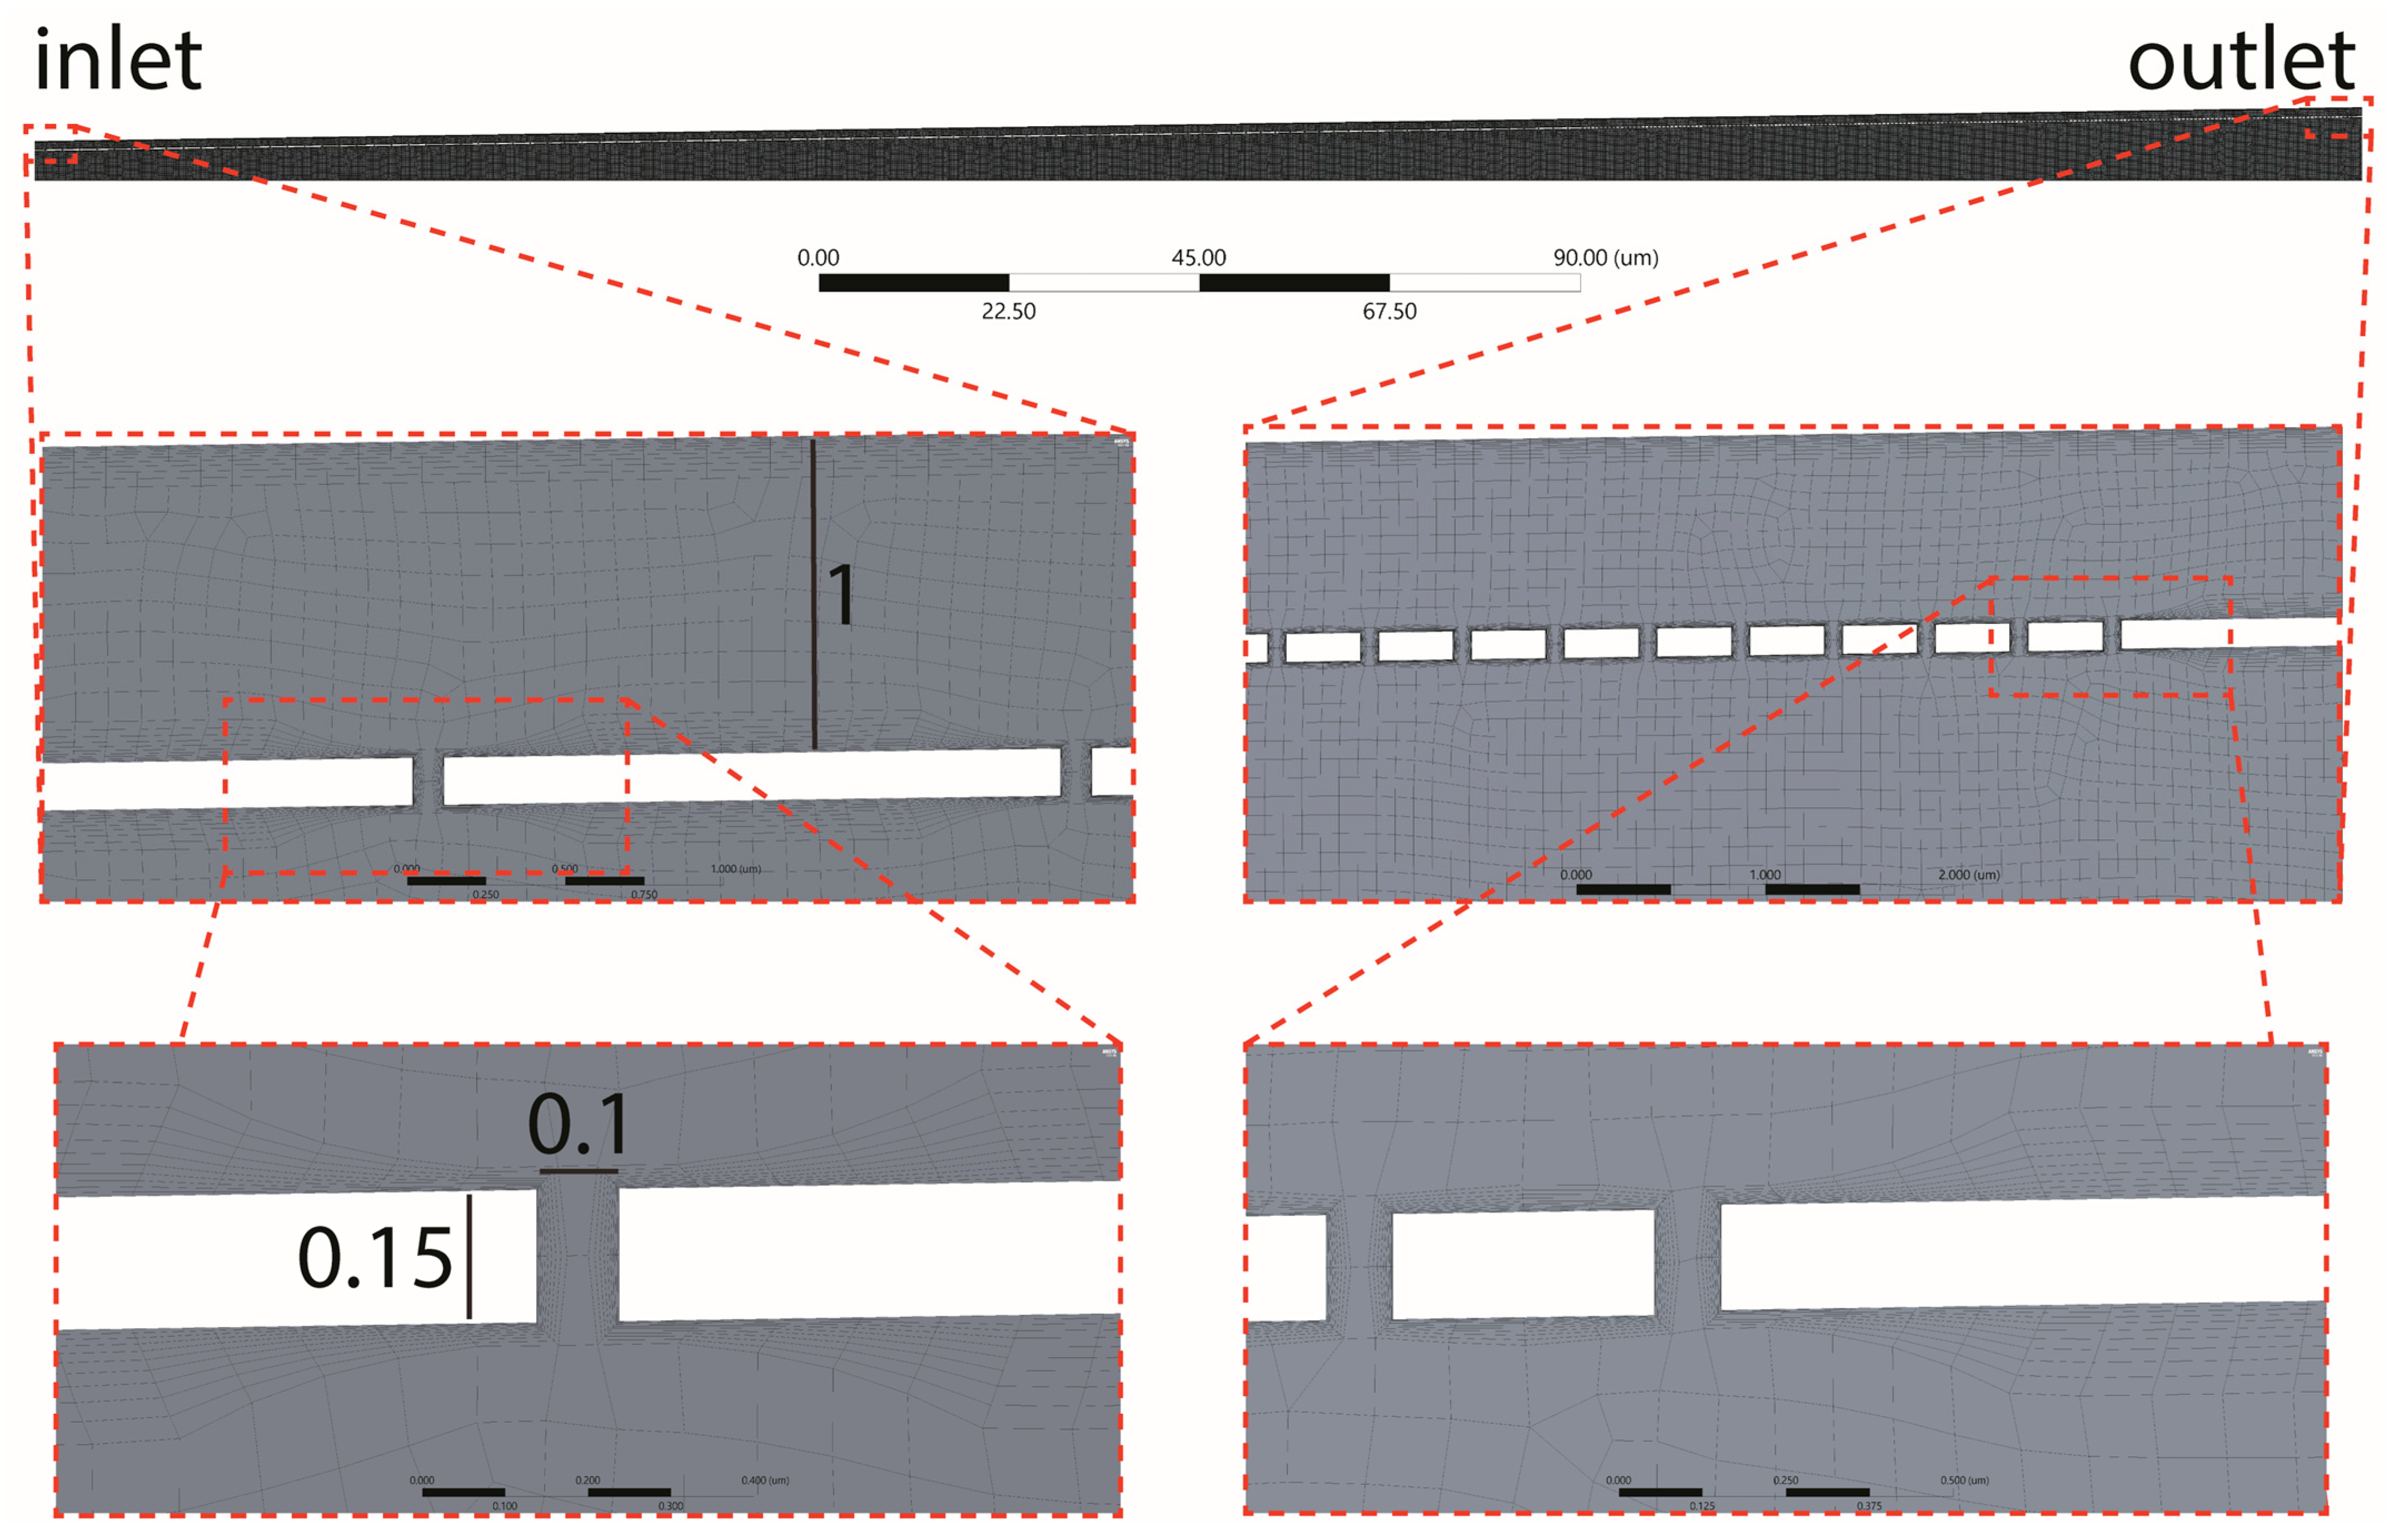
2.2. Geometry and Mesh

The numerical 2D models of the sinusoid were designed to comply with both the computational capabilities of the hardware and anatomical likelihood.
  • The sinusoid was designed as a half-section measuring 275 µm long. Two half-sections were evaluated, one with a constant radius (3.5 µm) and one with a linearly increasing radius (the inlet/outlet radii were, respectively, set to 3.5 µm and 7.5 µm).
  • The SoD was modeled as a 1 µm thick 2D chamber surrounding the sinusoid lumen and communicating with it via fenestrations.
  • The fenestrations were modeled as 100 nm long and 150 nm high channels connecting the sinusoidal lumen with the SoD (Figure 3).
Proper geometry is essential to facilitating the meshing process (the discretization of the whole surface into tiny sub-surfaces defined by nodes for which the solver computes the solutions of the fluid dynamics equations). The main design strategies used to obtain the geometry of the sinusoid were as follows:
  • The main walls (of the sinusoidal lumen and the Space of Disse lumen) were formed as two coaxial rectangles (or trapezoids when the sinusoid had a diverging section).
  • Fenestrations were modeled as a linear pattern.
  • The sketch was converted into a surface, and a symmetry axis was introduced (halving the model).
The finite element method (FEM) facilitates a complex system’s numerical simulation. This involves the discretization of a continuous system into small elements (named cells, which are defined by nodes) over which to solve the equations. The obtained local solutions are ultimately integrated over entire domains and bodies to produce a global solution. Thus, the quality of the solutions generated by the solver strictly depend on the quality of the mesh, which defines the size, distribution, and shape of the finite elements. A reduced number of elements lead to a coarse solution with low computational costs. A high number of elements gives an accurate solution which requires time-consuming calculations. The mesh obtained had a good quality (Figure 3), thus ensuring accurate solutions. However, the mesh can be further improved by reducing the size of the elements (set here to 0.1 µm).
The laminar flow module of a pressure-based solver, which couples mass and momentum conservation with no-slip boundary conditions, was applied to disclose the pressure and linear speed profiles of a steady flow for an incompressible fluid (blood).

2.3. Solver Configuration
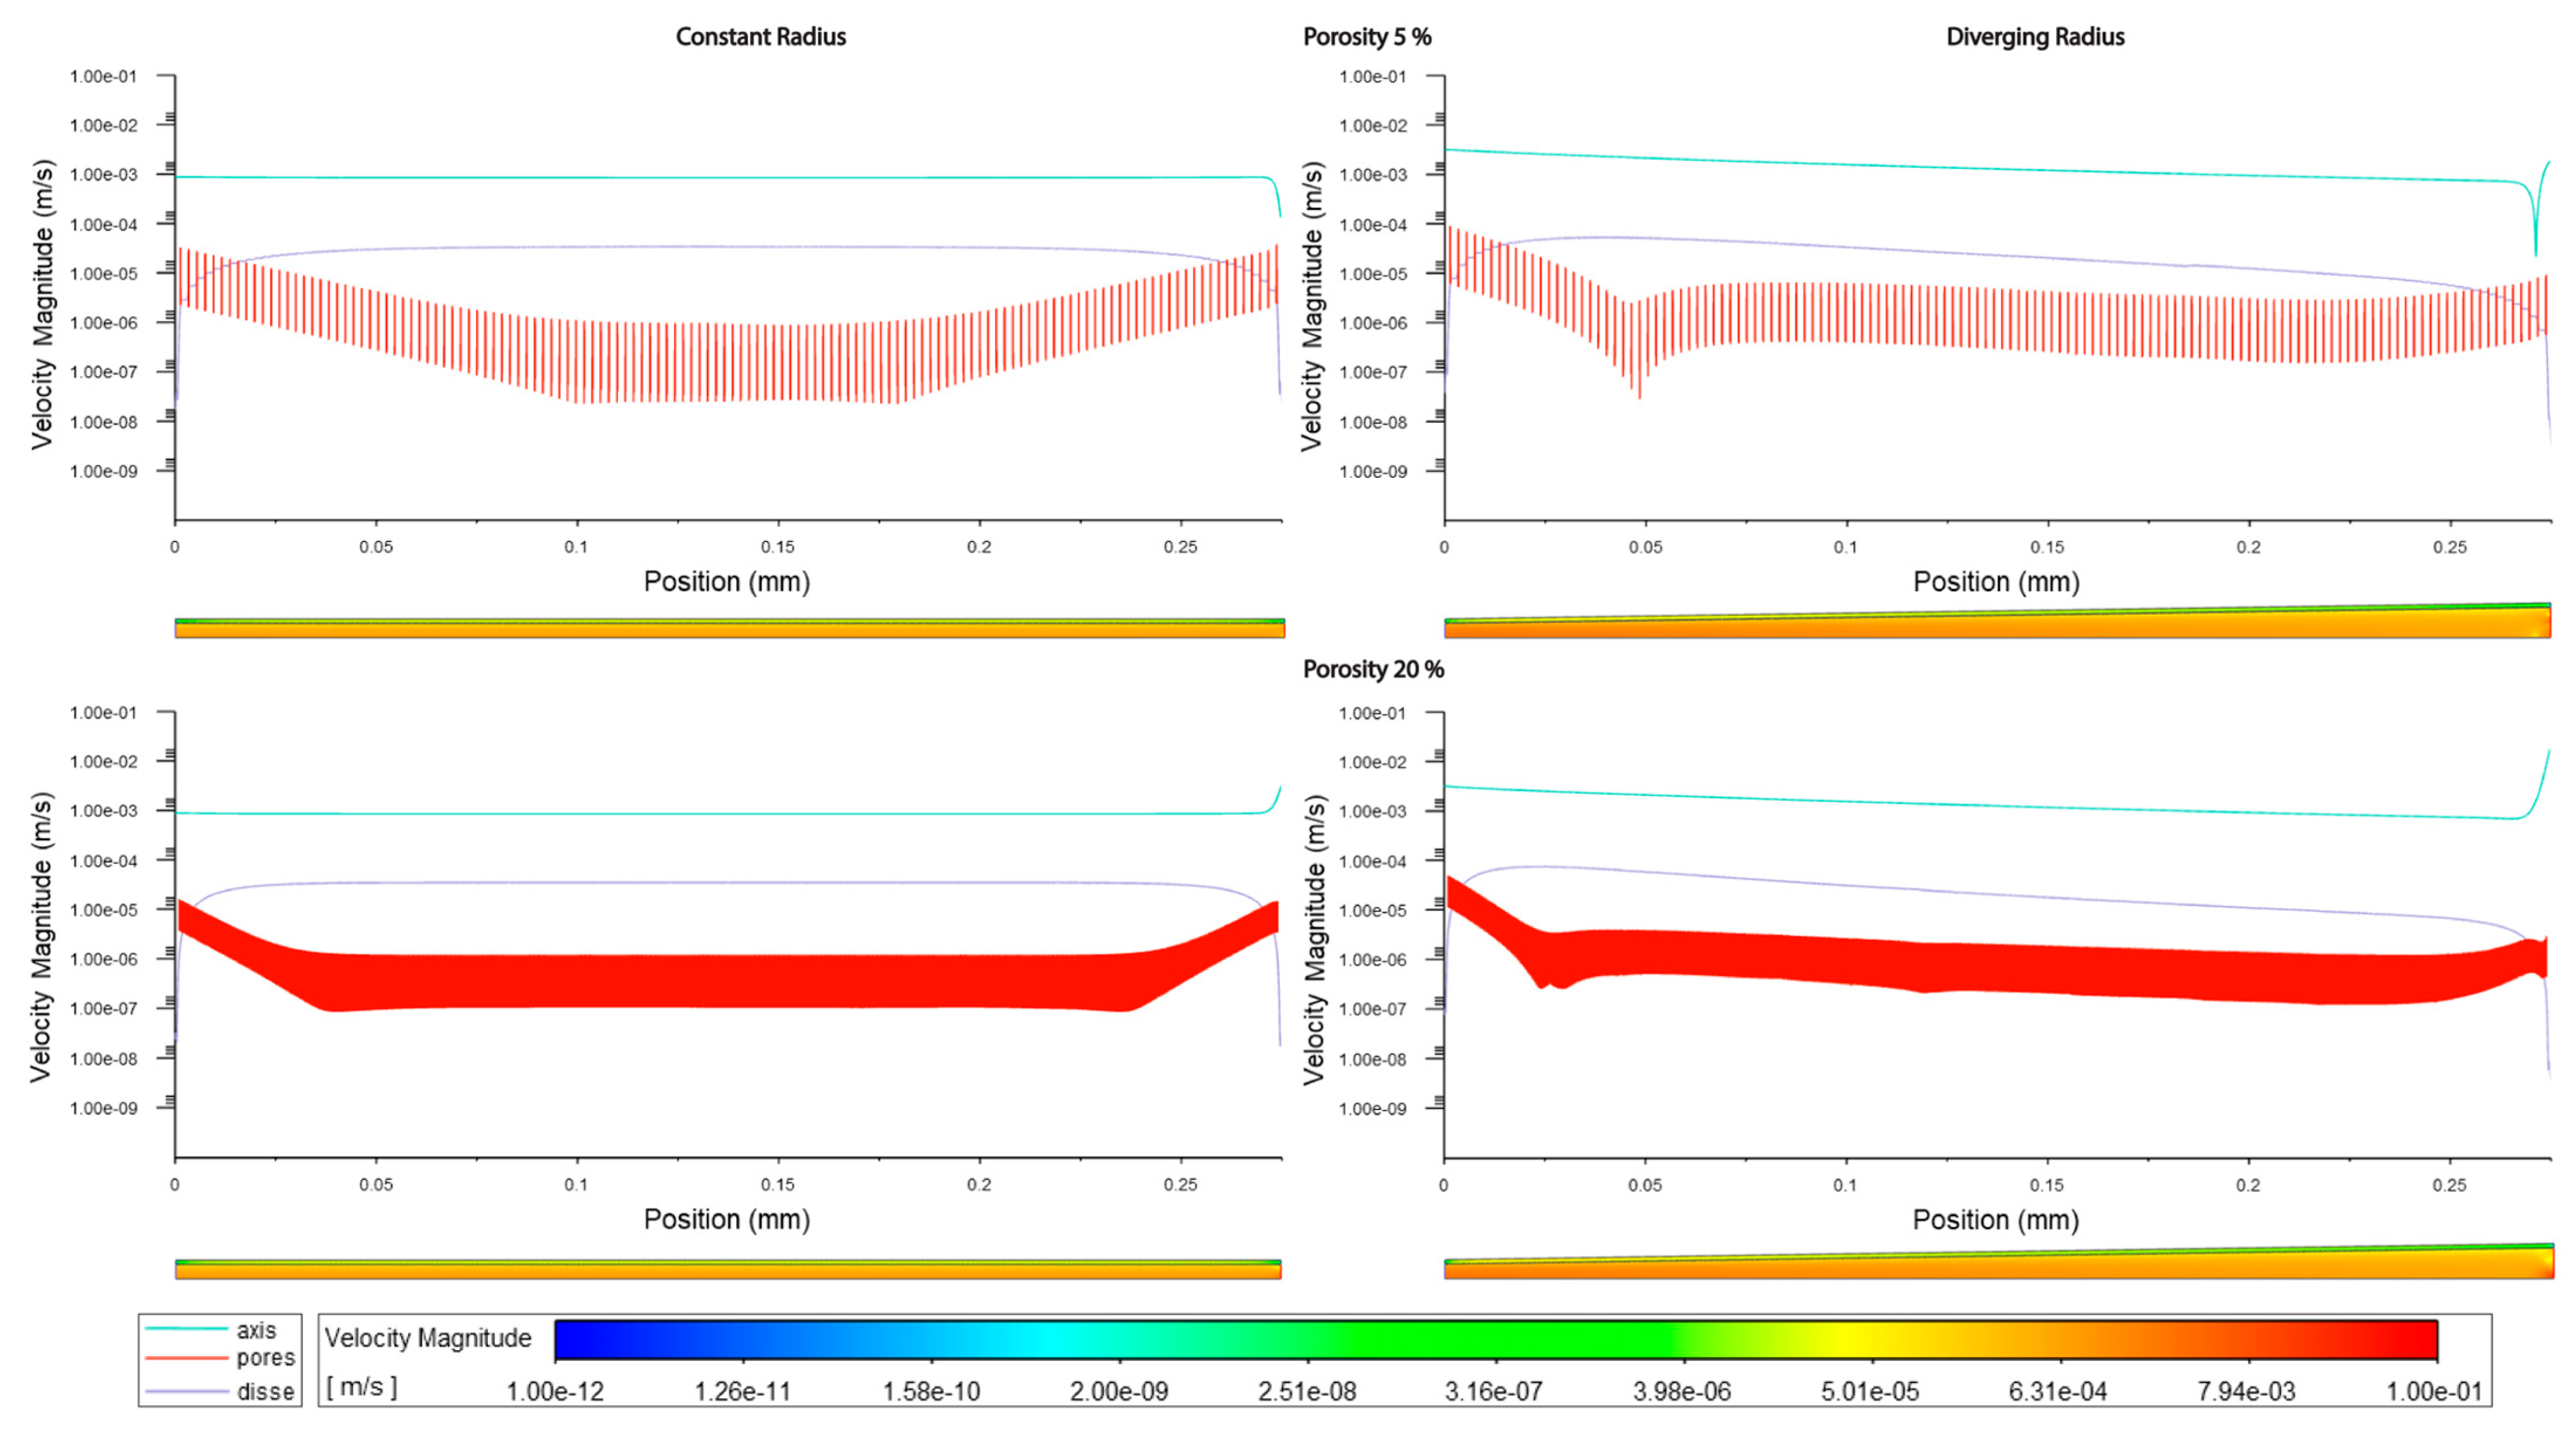
A Fluent solver (by Ansys) was utilized, setting a laminar-flow module with a no-slip condition at the boundaries (v = 0 at the walls). Blood at 37 °C was selected as the material (η = 0.0035 kg·m−1·s−1, ρ = 1060 kg/m3). Since the computational model was based on a pressure-driven flow, the physiological pressures were set to 1067 and 800 Pa, respectively, at the inlet/outlet [13]. Pathological conditions (e.g., portal hypertension) were introduced, elevating inlet pressure up to 2400 Pa [13]. To simulate lymphatic drainage, a pressure outlet was added at the portal region (zone 1) of the SoD, and the selected exit pressure was set to 100 Pa [38]. The equations were solved using the COUPLED algorithm (keeping default under-relaxation factors). The solutions converged after 105 iterations (which were initially set to 2000 iterations).
The physics of the numerical model can be explained with the following partial differential equations (PDEs):
∇·(ρu) = 0
That is, the mass conservation equation for an incompressible fluid where ρ is the density (kg/m−3) and u is the 3D velocity vector (m/s)
ρ(u·∇u) = −∇P + µ∇2u
which is the equation of momentum for Newtonian fluids (constant µ) where P is the pressure (Pa) and µ is the dynamic viscosity (Pa·s).

3. Results

The overall shape of the vessel had the greatest effect on the measured parameters, with the velocity magnitude greater in the divergent models compared with the constant-radii models. Velocity modules through the lumen were approximately 1.5–2-fold higher in the divergent models vs. the cylindrical models (Figure 4, Figure 5 and Figure 6 and Table 4, Table 5 and Table 6), and the average pressure in the lumen was about 5–8% lower in the divergent models vs. the cylindrical models (Figure 7, Figure 8 and Figure 9 and Table 4, Table 7 and Table 8).
The increment of zonal porosity increased the velocity in the SoD by 9–16% while decreasing the velocity through fenestrations by 40–55%; there was a modest decrease in luminal velocity in the cylindrical models, while there was a slight increase in the divergent models. Velocity magnitudes through the SoD were 3–4-fold higher in models with lymphatic drainage than in those without (Figure 4, Figure 5 and Figure 6; Table 5 and Table 6).
Velocity magnitudes through fenestrations were lower in high-porosity models (high = 20%) without lymphatic drainage, while in models with lymphatic drainage, the velocities were higher when the porosity was low (low = 5%) than when the porosity was high; additionally, velocities were lower in variable-porosity models (variable = 5, 6, 20%) than in either low- or high-porosity models (Figure 4, Figure 5 and Figure 6; Table 5 and Table 6).
The luminal velocity magnitude was slightly higher in constant-radius models without lymphatic drainage (with high and variable levels of porosity) and unchanged in divergent-radius models. In constant-radius models with lymphatic drainage, the luminal velocity was higher in low- and variable-porosity models. The luminal velocity in divergent-radius models was higher when models had high levels of porosity and lymphatic drainage and were equal in all others (Figure 4, Figure 5 and Figure 6; Table 5 and Table 6).
For models without lymphatic drainage and with a divergent radius, the luminal pressure was the lowest in variable-porosity models, while for constant-radius models with lymphatic drainage, variable-porosity models had slightly higher luminal pressure values. In divergent models with lymphatic drainage, variable-porosity models had the highest average pressure, with lower pressures observed in low-porosity models. The pressure was even lower in high-porosity models (Figure 7 and Figure 8; Table 7 and Table 8).
The pressure across fenestrations was the lowest in the variable-porosity models compared to those with uniform porosity. In the latter, pressure across fenestrations was greatest in the high-porosity models compared to the low-porosity models (Figure 7, Figure 8 and Figure 9; Table 7 and Table 8).
In models without lymphatic drainage, the pressure in the SoD was always lower in the variable-porosity models, whereas in models with lymphatic drainage, the pressure increased from low to variable to high (Figure 7, Figure 8 and Figure 9; Table 7 and Table 8).
In general, the variable porosity model had velocity and pressure curves between low constant porosity and high constant porosity, being somewhat closer to low constant porosity (Figure 4, Figure 5, Figure 6, Figure 7, Figure 8 and Figure 9).
In total, the overall shape of the vessel (Figure 4, Figure 5, Figure 6, Figure 7, Figure 8 and Figure 9, Table 4, Table 5, Table 6, Table 7 and Table 8) and the presence or absence of lymphatic drainage in the periportal zone had the largest effects on the flow parameters, while porosity had some less-pronounced effects.
Modeling with a pathological (elevated) pressure regimen did not show any changes in pressure or flow behavior. Increasing the input/output pressures to 2400/800 Pa, as per Ryou 2020 [13], only rescaled proportionally to increases in pressure, with the same patterns as those found for physiological pressures, i.e., the differences between them were merely rescaled.
Admixing: Regarding flowlines, the addition of lymphatic drainage in the periportal zone leads to more fluid moving through the SoD and more admixing relative to models without, whereas porosity only has a modest effect when comparing models with low, high, or variable porosity (Figures S1–S3). Divergent models show the formation of stronger vortexes at the outlet compared with constant-radius models.

4. Discussion

Four physiologically relevant 2D models of hepatic sinusoids were generated for CFD simulations to provide hemodynamics insights. Simulations were carried out using a laminar and steady flow of blood (constant dynamic viscosity) generated via a differential pressure between the sinusoid’s inlet and outlet. Velocity and pressure trends were collected for all models for physiological and pathophysiological (elevated) pressure conditions. Also, an extra outlet was added to the model to reproduce the lymphatic drainage in the portal zone of the SoD.

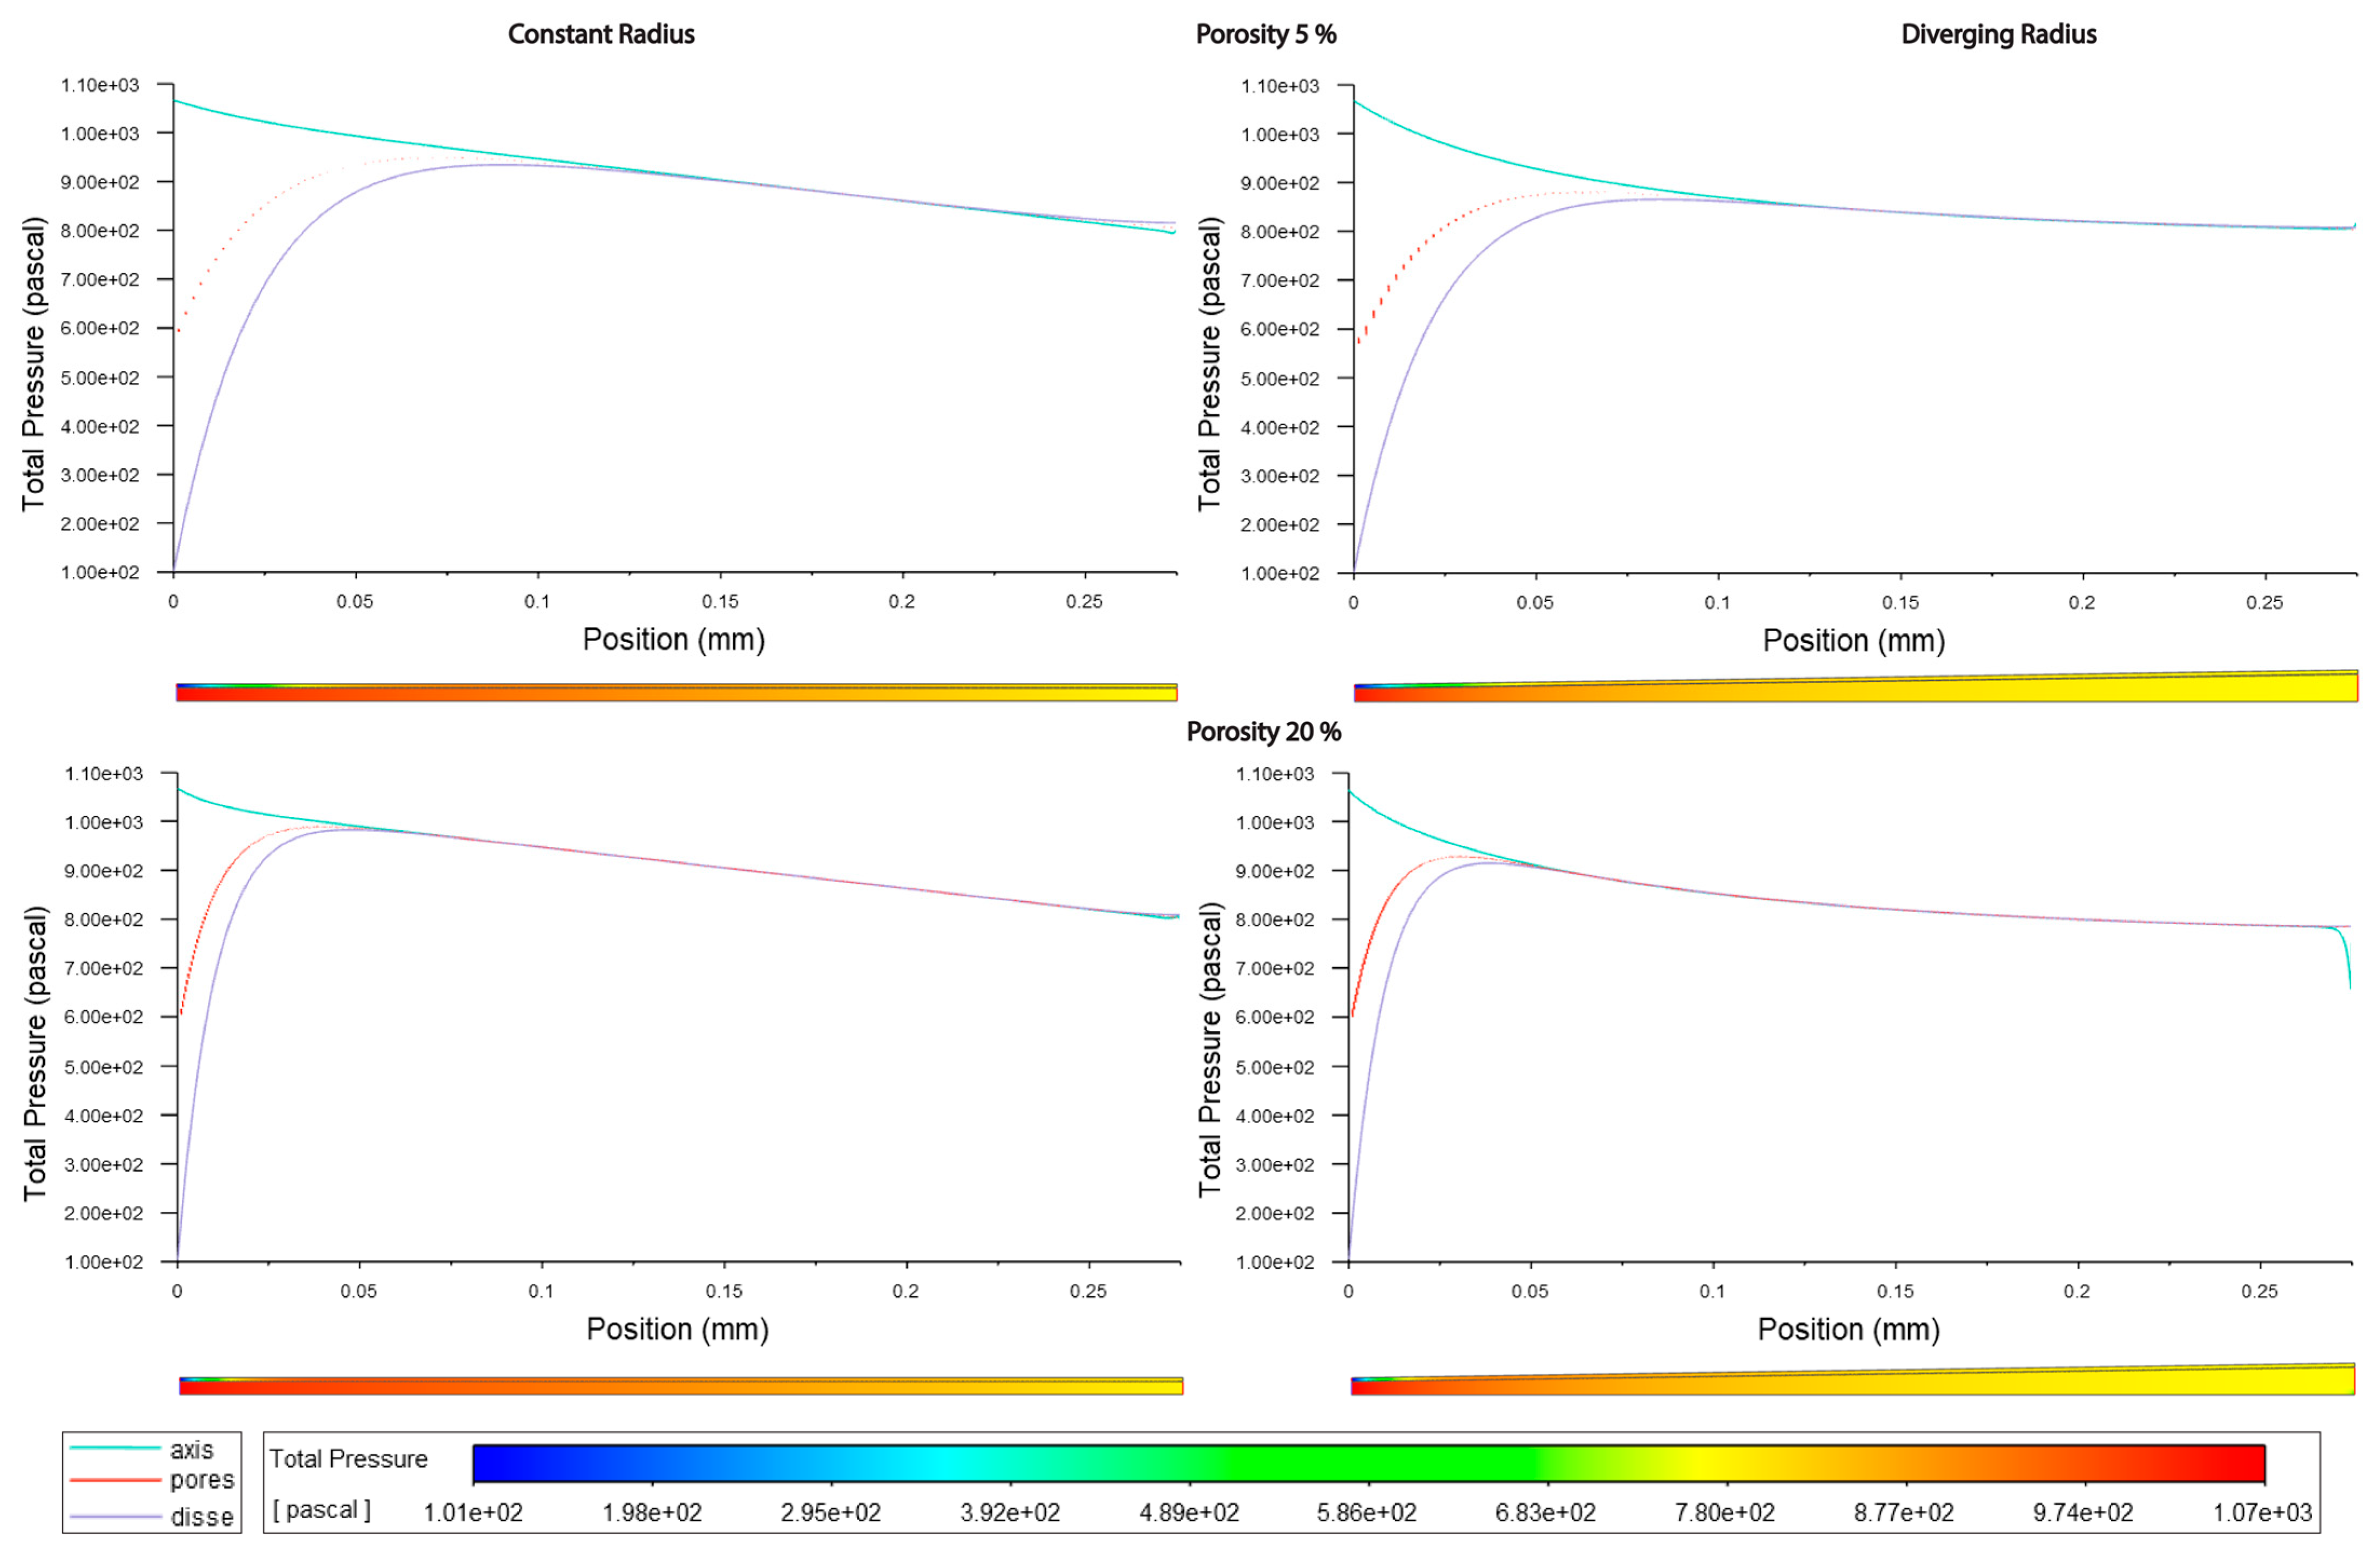
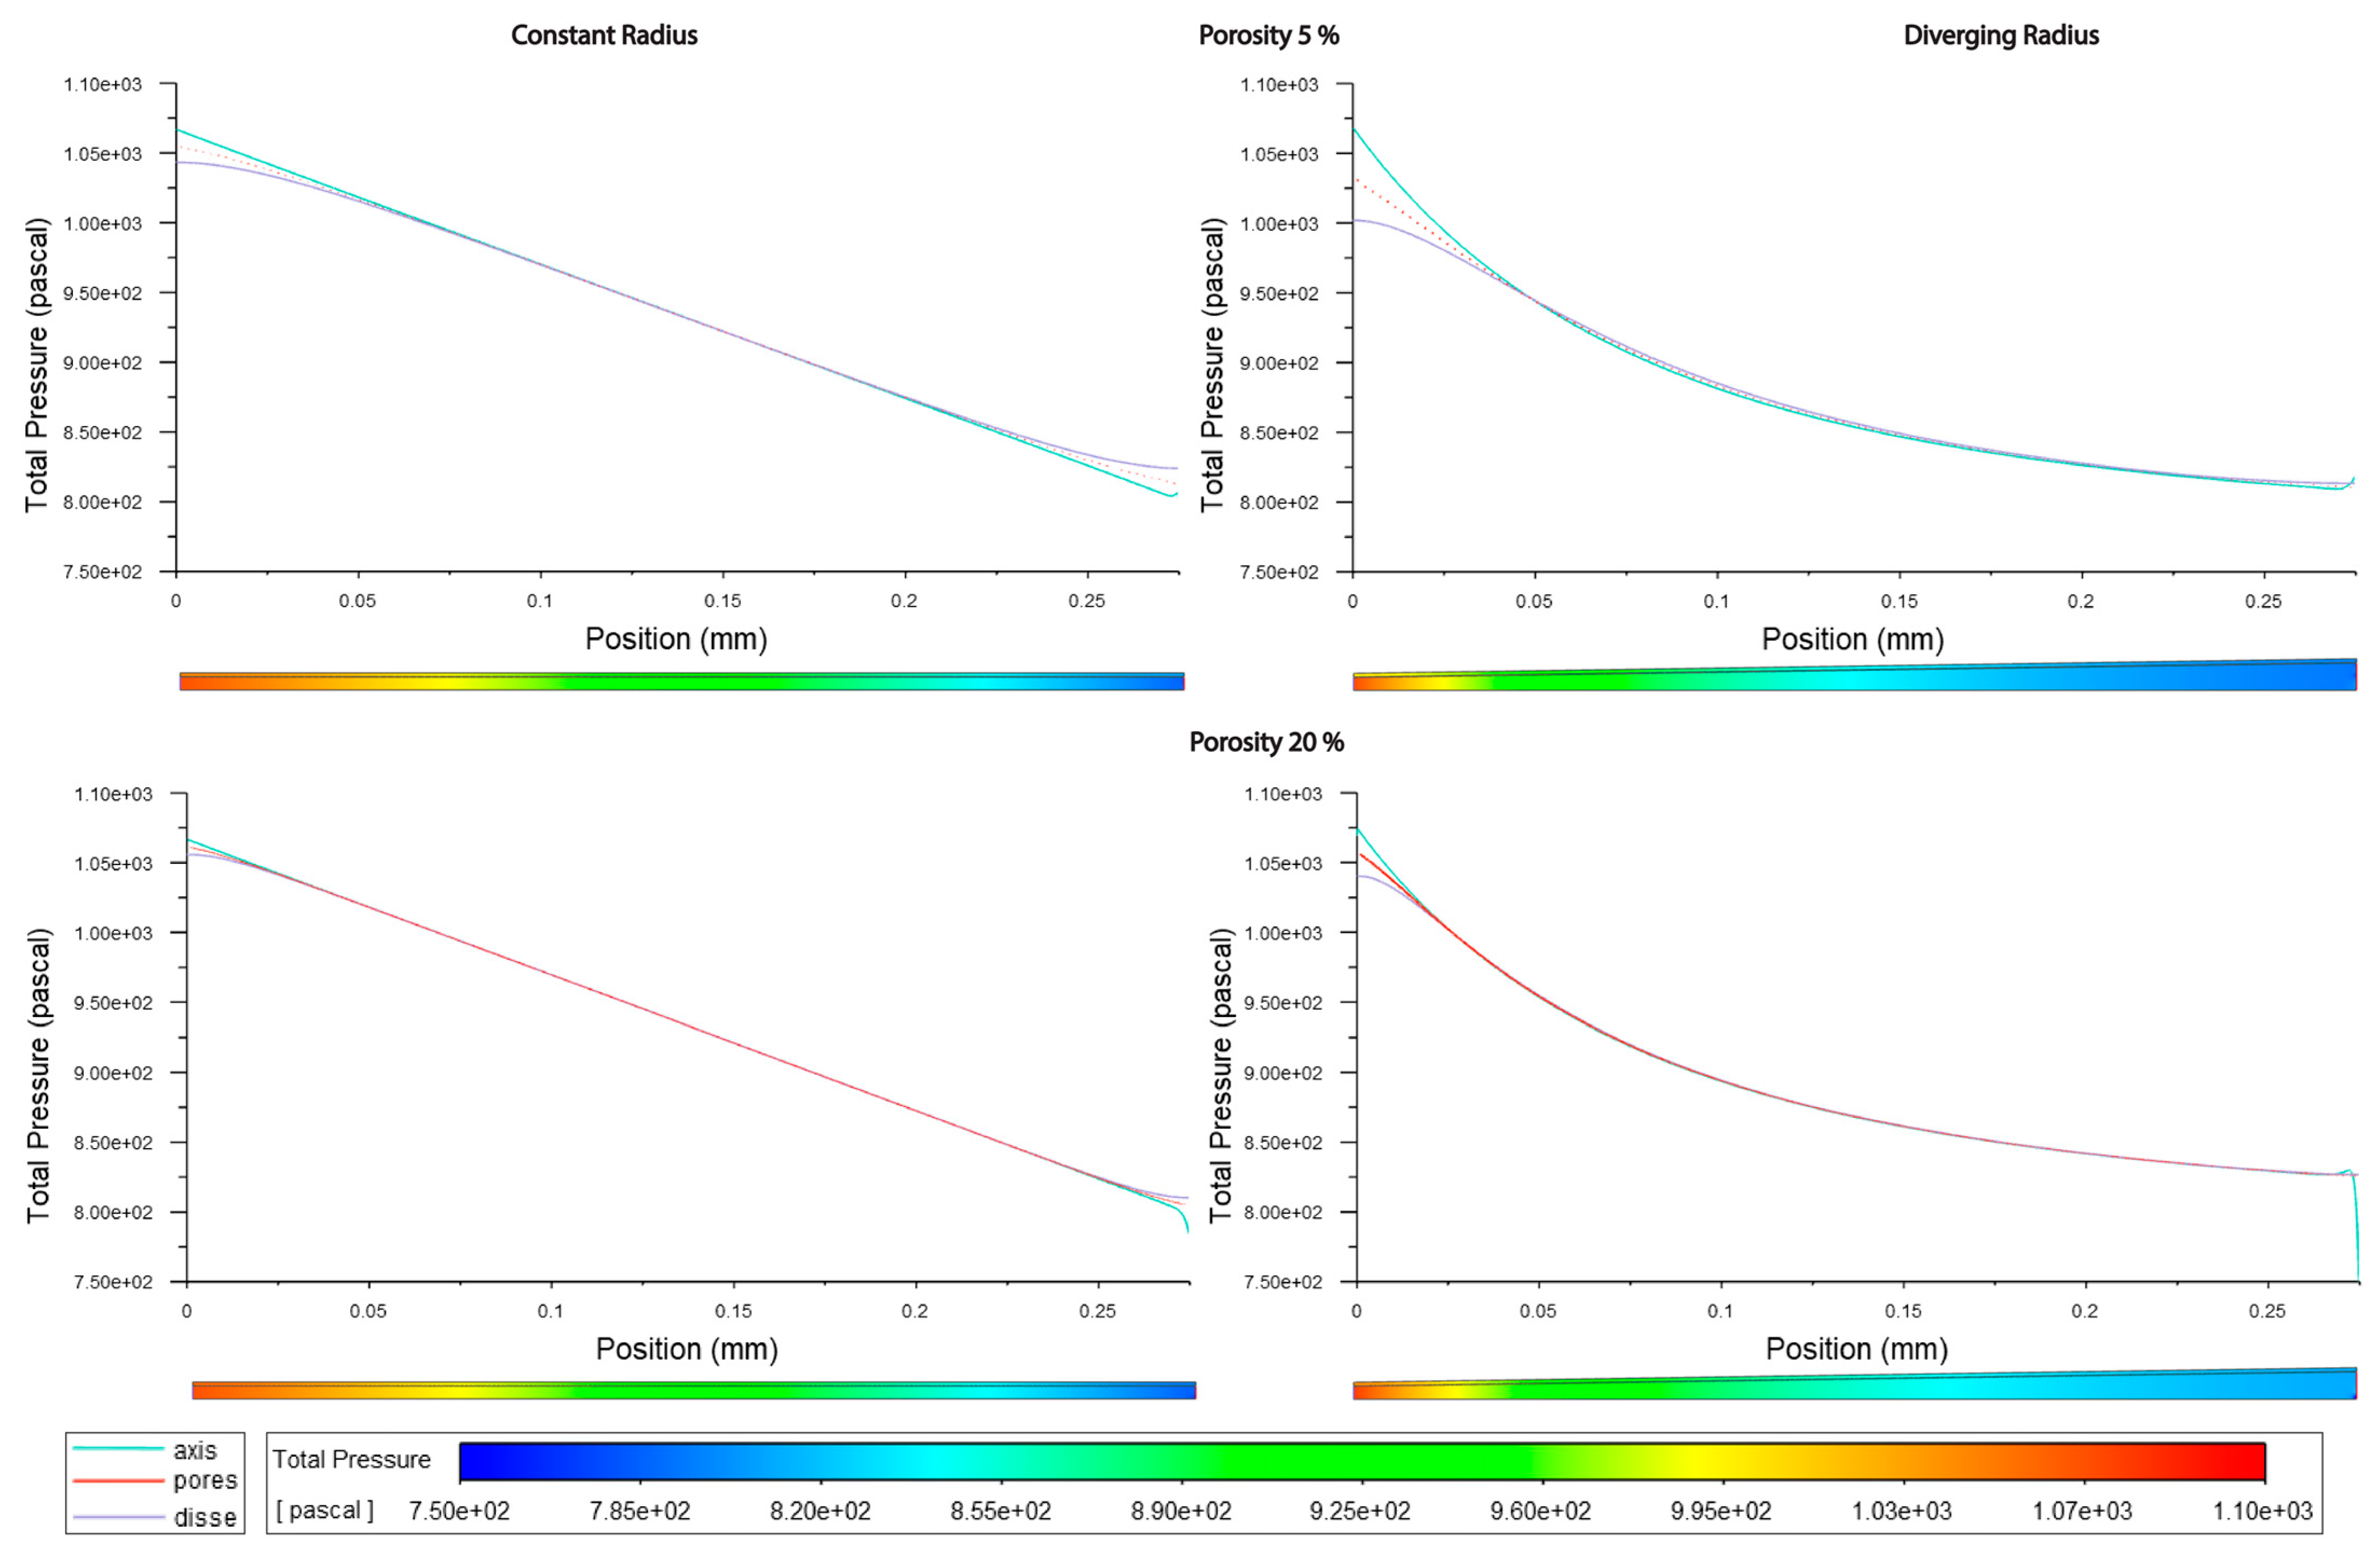
4.1. Major Insights about Sinusoidal Pressure (P)

Pressure decreases linearly in constant-radius models (Cmods) and exponentially in diverging-radius models (Dmods). Dmods generally have lower pressure throughout when compared with Cmods. Increased porosity in the pericentral zone implies a generalized pressure reduction, mostly borne by the SoD. Lymphatic drainage reduces with the pressure within the sinusoid, especially inside the SoD. This effect might be exaggerated by the model (see below in general considerations).
Pathological conditions, (PatCs), elevated pressures, merely re-scale the same pressure behavior obtained for physiological conditions (PhyCs). In terms of average pressure, the sinusoidal lumen and SoD have comparable pressure, while through fenestrations, pressure is generally lower.

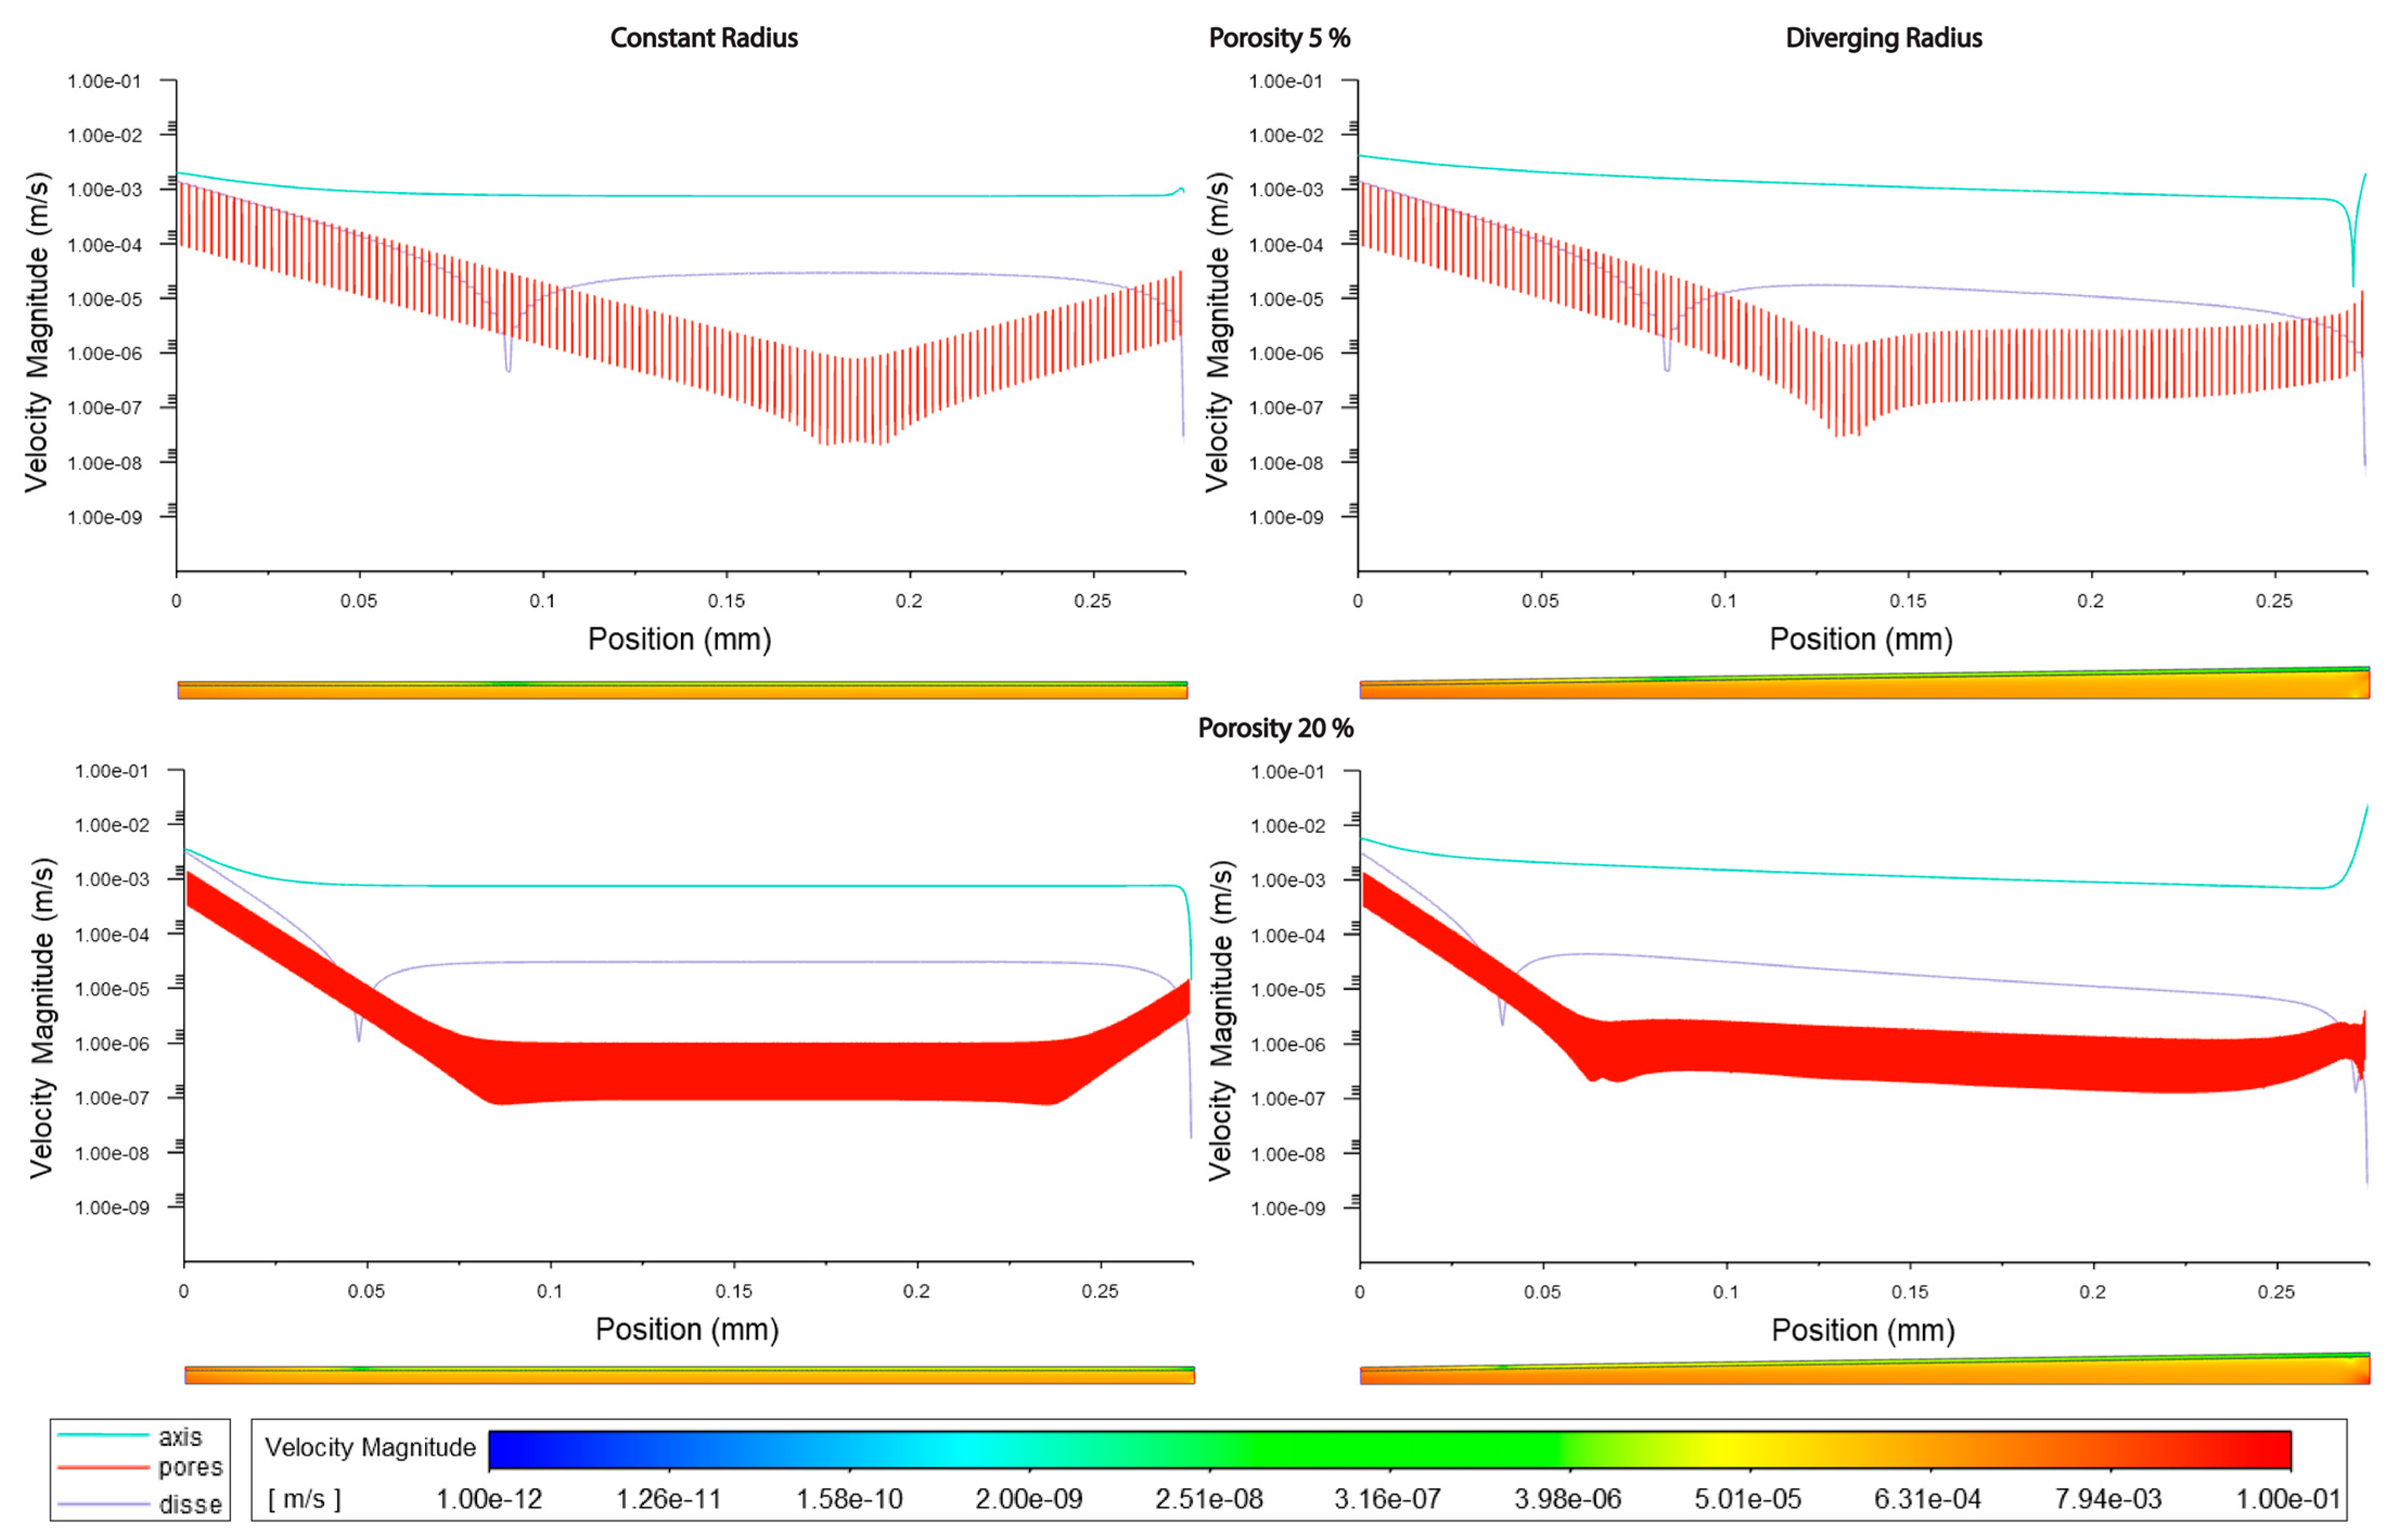
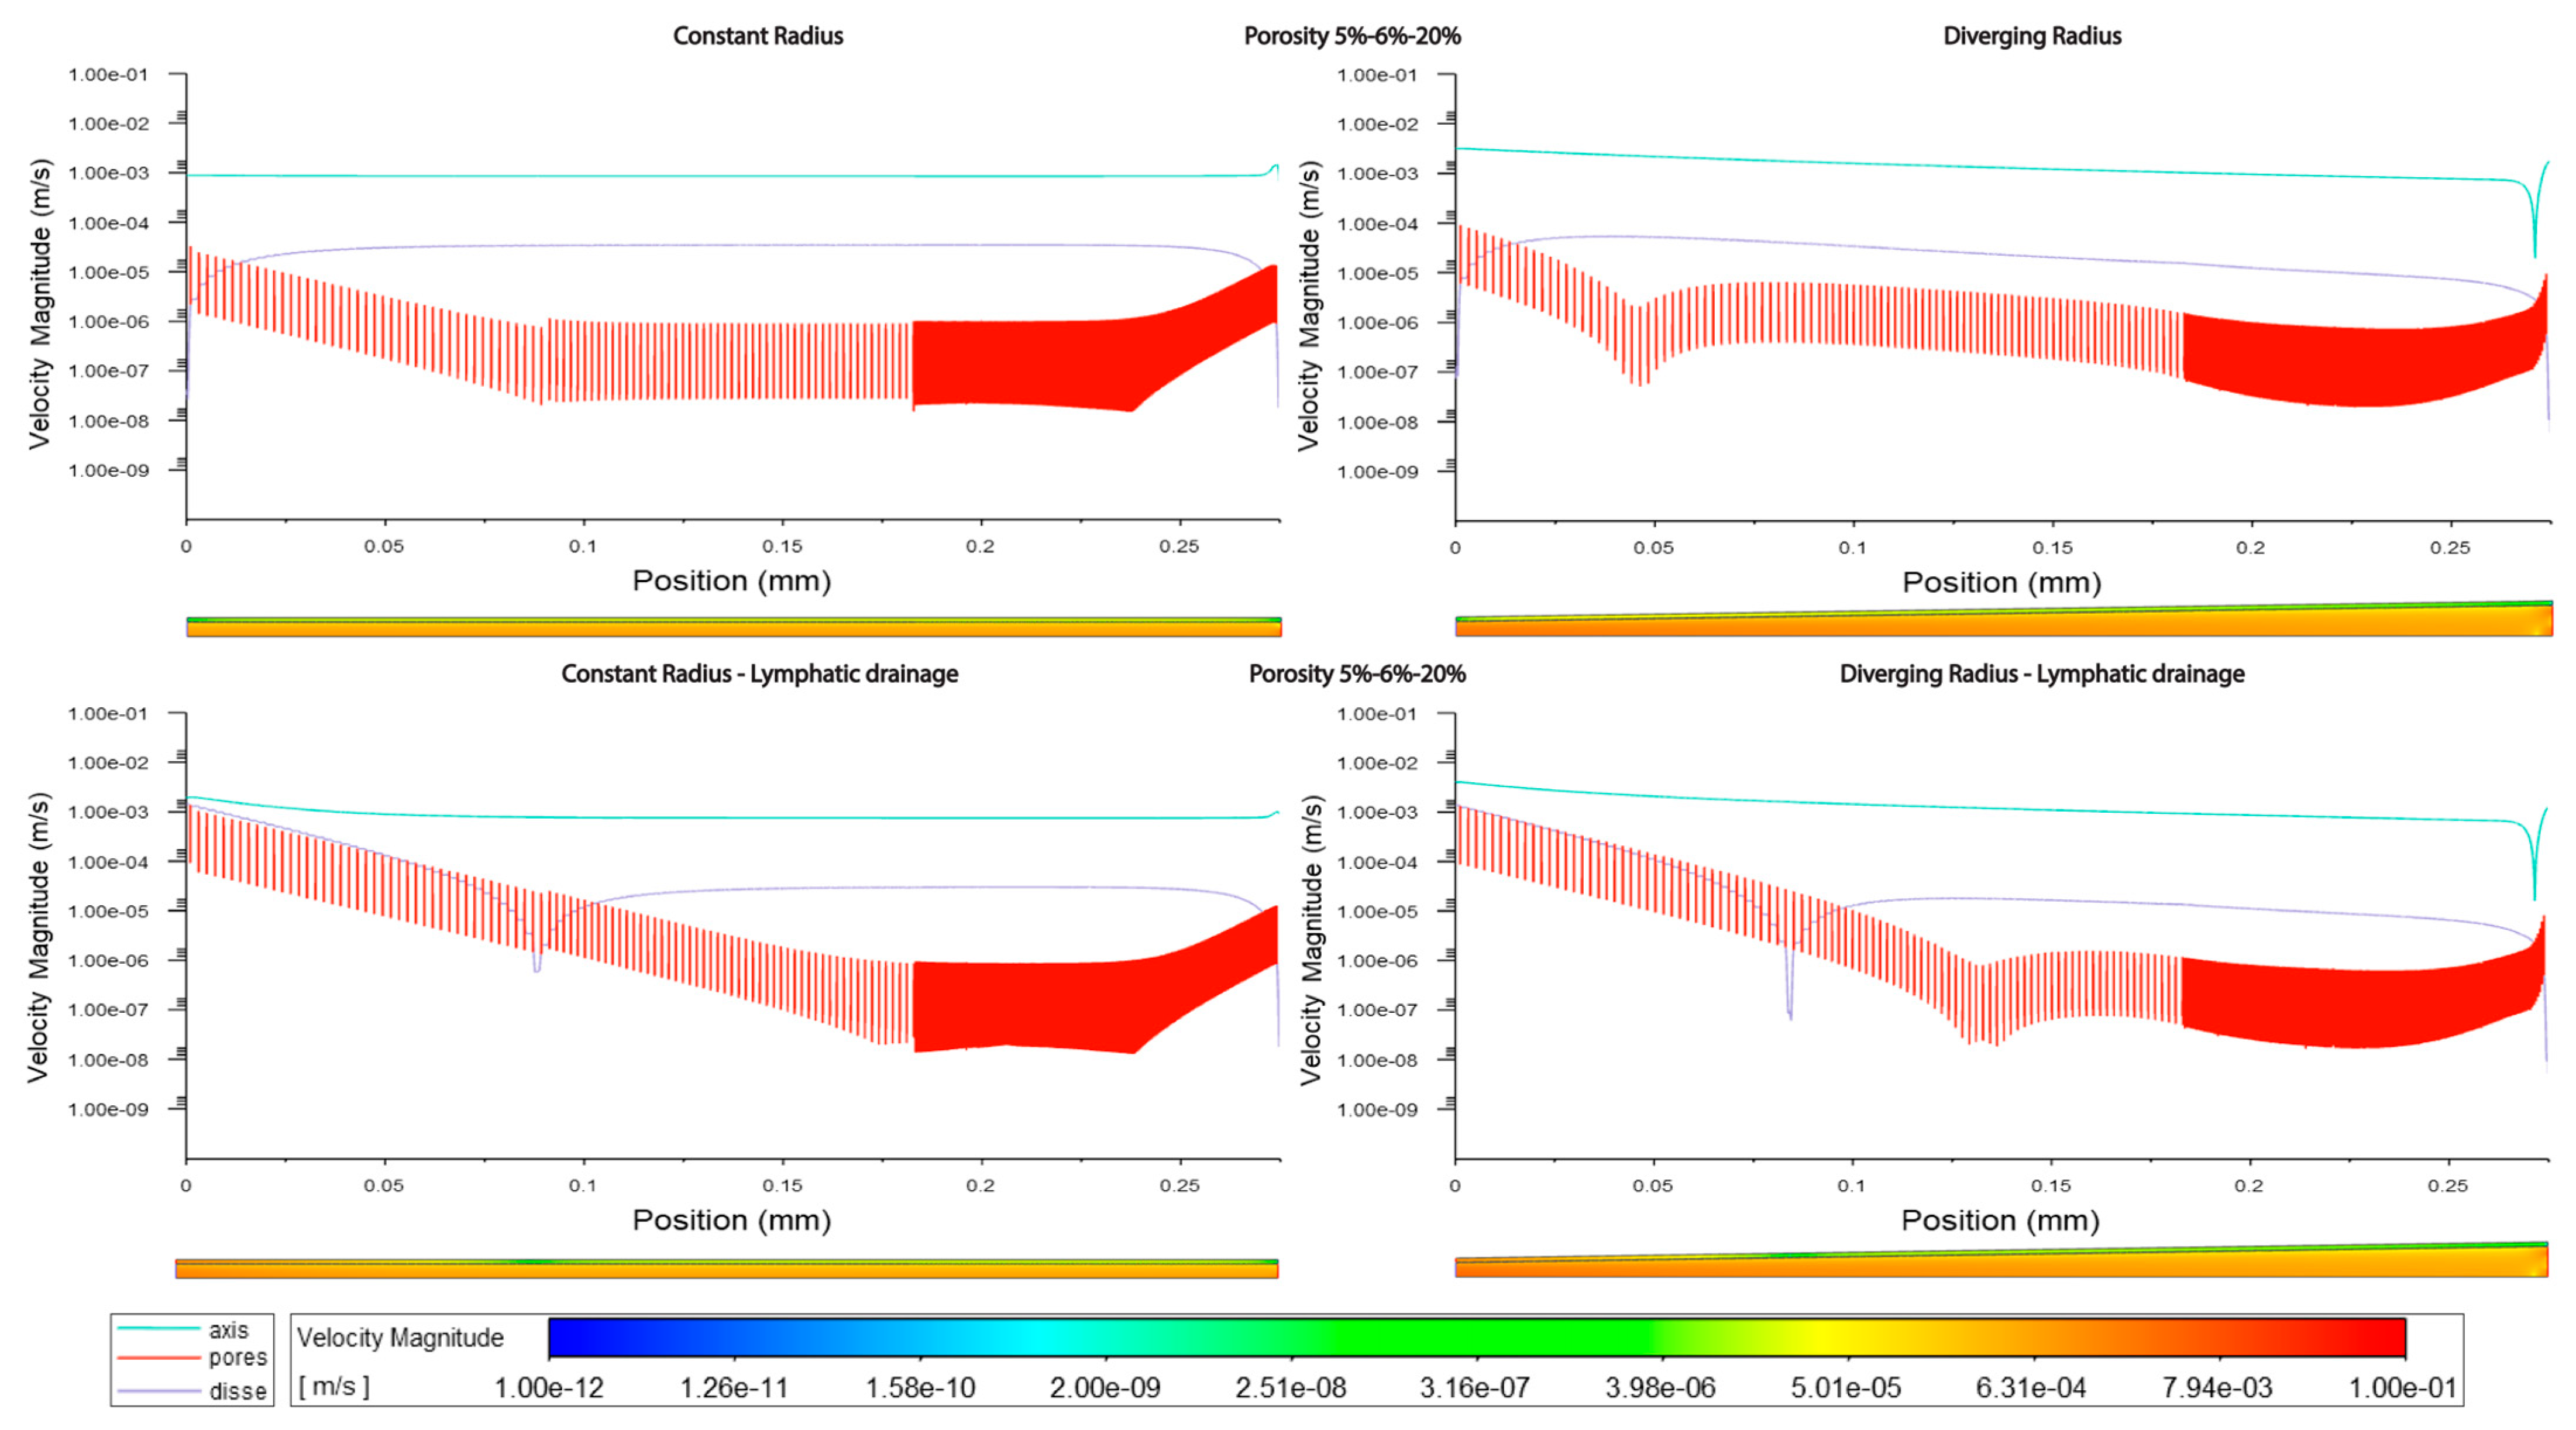
4.2. Major Insights Regarding Flow Velocity (V)

In general, Cmods have constant luminal velocity and an almost constant velocity within the SoD. Velocity through the fenestration develops along the sinusoid with a parabolic trend, with higher values at the inlet/outlet (where the flow enters/exits the SoD). In general, Dmods demonstrate a slowly decreasing velocity along the sinusoidal lumen and along the SoD. Through the fenestrations, velocity decreases within the first 50-100µm and then follows a sinusoidal trend, with values increasing in the proximity of the outlet. Globally, Dmods produced greater velocities in all compartments of the sinusoid when compared with Cmods. Some of the models (especially but not only the Dmods) present a reverse flow at the outlet. Porosity augmentation in the perivenous zone mostly affects velocity of the SoD and through fenestrations (with no effect on the luminal speed—the flow through fenestrations and the SoD seeks to compensate for the changes in porosity ). Generally, velocity increases within the SoD, while it decreases through fenestrations. Adding lymphatic drainage to the perivenous zone generated a shift in the velocity trend toward the outlet. The average flow speed through fenestrations reaches higher values and decreases more slowly within the first half of the sinusoid (an increased flow exchange between the lumen and SoD). Similarly, the flow along the SoD is characterized by a higher average speed. PatCs merely re-scale the same velocity behavior obtained for PhyCs.

4.3. General Considerations and Limitations

The overall shape of the sinusoids had the greatest influence on the luminal pressure and velocities; this is a parameter that may be altered in disease states [12,34]. When implementing a larger-scale model, this is likely the single most important parameter investigated here. Intuitively, we would have expected that porosity would have far greater effects on these luminal parameters, but this was not the case except at an extremely high porosity.
The addition of lymphatic drainage affected the flow through the fenestrations and SoD. It is therefore an important parameter to consider when modeling liver sinusoids. Lymphatic drainage in the SoD was modeled as a depressurization affecting the flow within the entire sinusoid. Since the lymphatic flow rate is estimated to be 100–500 times lower than the flow rate of blood [39], it may be necessary to adjust the pressure value at the drainage outlet. Also, lymphatic drainage is expected to be much higher under pathological conditions [14,16]; this aspect was not taken into account in our simulations.
With the current boundary conditions (PhyCs and PatCs), porosity variations seem to be fully compensated for through an exchange of flow between the lumen and SoD via fenestrations without affecting the flow velocity inside the lumen. If this model translates to the liver, then, in theory, the liver can change the flow in the SoD by changing the porosity without altering the luminal flow velocity. In the model, the elevated pressure seen in pathologies does not cause alterations to the flow pattern with unchanged geometries. While the model does not account for cellular responses to elevated pressure and flow velocity, it shows that the sinusoidal geometry must be altered for flow patterns to change.
The model employs a homogeneous variation of porosity, with evenly spaced and sized fenestrations. We believe this simplification in our model is justified for our application, but others will need to evaluate the complexity required by their inquiry. The model simplifies the sinusoid into a straight line, whereas the real case would be curved and branching. In addition, liver sinusoids are flexible and dynamic structures due to the fact they are in a soft tissue and are exposed to pulsatile flow. Our simplifications were necessary to home in on the focus of this article, namely the variable porosity and diameter in and of the sinusoid.
Luminal flow and pressure are mainly affected by the overall shape, i.e., the evolution of the vessel’s diameter, with porosity mostly affecting flow within the SoD. Variable porosity, with higher porosity toward the pericentral/zone 3, modestly increases flow velocity through the SoD relative to a constant-porosity model but also decreases velocity through fenestrations significantly. In the variable-porosity models, pressures through fenestrations were lower than for models with either high or low constant porosity. Similarly, the pressure in the SoD was lower for models without lymphatic drainage, or similar (less than 1% increase) for models with lymphatic drainage, in the variable-porosity models compared with the constant-low-porosity models and always lower than in the constant-high-porosity models.
We simulated lymphatic drainage by adding an outlet in the periportal area of the SoD; this inclusion increased flow velocity and the exchange between the lumen and SoD. However, more detailed studies of how this parameter evolves are required as it is poorly understood and it is currently not feasible to measure it directly. This is beyond the scope of the current study.
Some effects may be underestimated in the model due to parameter reductions as pulsatile flow, curved geometry, tissue compressibility, and the obstruction of flow by migrating blood cells [4,40] were not incorporated. The addition of these may be feasible with better computational hardware. Adding fenestrations with realistic porosity to a larger, more detailed model, such as the one used by Piergiovanni (2017) [22], would perhaps help elucidate the distribution patterns of various solutes and colloids at the sinusoid level but would have greater requirements in terms of both time and hardware.
The model did not account for the pulsatility of the flow, as is the case for blood flow, or the elasticity of the tissue itself, which can compress in response to pressure. Lymphatic outflow was simplified to a constant, and more accurate modeling would require an independent investigation in conjunction with experimental work. However, we showed that lymphatic drainage has the potential to affect relevant flow parameters within the sinusoid. The model reveals differences in the fluid flow velocity through the SoD between constant- and variable-porosity models, and this may have implications for solute exchange between the blood stream and the hepatocytes. Blood flow is crucial in liver function [41], and our model sought to elucidate how the ultra-structure of the liver affects this flow. Additional aspects we chose to simplify for the model were the shapes and sizes of the fenestrations. In reality, their diameters vary, and the distribution of their sizes has implications for the access of colloids and nanoparticles to the Space of Disse. It was not crucial to address this factor in the context of our fluid model, but for studies on nanoparticles or lipoproteins, this may be important to consider. There would be considerable benefit in generating more accurate and detailed models of the sinusoid. In addition to the parameters studied herein, these should also account for the branching (ideally in three dimensions) and elasticity of the tissue itself, a double inlet (arterial and venous contributions), pulsatile flow, lymphatic drainage (which is probably related to the pulsatility of the flow and probably has an intermittent outflow into the lymphatics based on pressure maxima in the sinusoid; however, this requires further dedicated studies for clarification), with mixing and flow-paths described in the case of pulsatile flow with lightly adherent blood cells (such as leukocytes) in the sinusoid (the contributions these make were theorized by Wisse [40]) and with fenestration diameters based on observed distributions. Nonetheless, this model represents a useful first approximation of the liver sinusoid which can be built upon with extra parameters and computing power.

Supplementary Materials

The following supporting information can be downloaded at: https://www.mdpi.com/article/10.3390/livers3040043/s1, Figure S1: Streamlines at Inlet (left hand side) and Outlet (right hand side) for sinusoids modelled without lymphatic drainage, Figure S2: Streamlines at Inlet (left hand side) and Outlet (right hand side) for sinusoids modelled with lymphatic drainage, Figure S3: Streamlines at Inlet (left hand side) and Outlet (right hand side) for sinusoids modelled with variable porosity (5-6-20%)

Author Contributions

Conceptualization: C.F.H.; methodology: M.B.; writing—original draft: M.B. and C.F.H.; review and editing: M.B., C.F.H. and P.A.G.M.; supervision: P.A.G.M. All authors have read and agreed to the published version of the manuscript.

Funding

This project was funded in part by Horizon 2020 MSCA ITN DeLIVER (grant no. 766181) and the Faculty of Health Sciences UiT.

Data Availability Statement

Data are available upon reasonable request from the corresponding author.

Acknowledgments

Special thanks are given to Lynn Butler for English-language revisions and Antoni Homs Corbera and Karolina Szafranska for scientific input.

Conflicts of Interest

The authors declare no conflict of interest.

References

  1. Ehrlich, A.; Duche, D.; Ouedraogo, G.; Nahmias, Y. Challenges and Opportunities in the Design of Liver-on-Chip Microdevices. Annu. Rev. Biomed. Eng. 2019, 21, 219–239. [Google Scholar] [CrossRef]
  2. Cogger, V.C.; Hunt, N.J.; Le Couteur, D.G. Fenestrations in the Liver Sinusoidal Endothelial Cell. In The Liver; Wiley: Hoboken, NJ, USA, 2020; pp. 435–443. [Google Scholar] [CrossRef]
  3. Wake, K.; Motomatsu, K.; Dan, C.; Kaneda, K. Three-Dimensional Structure of Endothelial Cells in Hepatic Sinusoids of the Rat as Revealed by the Golgi Method. Cell Tissue Res. 1988, 253, 563–571. [Google Scholar] [CrossRef] [PubMed]
  4. MacPhee, P.J.; Schmidt, E.E.; Groom, A.C. Intermittence of Blood Flow in Liver Sinusoids, Studied by High-Resolution in Vivo Microscopy. Am. J. Physiol.—Gastrointest. Liver Physiol. 1995, 269, G692–G698. [Google Scholar] [CrossRef]
  5. Komatsu, H.; Koo, A.; Guth, P.H. Leukocyte Flow Dynamics in the Rat Liver Microcirculation. Microvasc. Res. 1990, 40, 1–13. [Google Scholar] [CrossRef]
  6. Eguchi, H.; Sato, N.; Matsumura, T.; Minamiyama, M.; Kawano, S.; Kamada, T. The Microcirculatory Properties around the Hepatic Periportal and Pericentral Regions of Rats. In Proceedings of the Fourth World Congress for Microcirculation, Beijing, China, 20–22 July 1987. [Google Scholar]
  7. Horn, T.; Henriksen, J.H.; Christoffersen, P. The Sinusoidal Lining Cells in “Normal” Human Liver. A Scanning Electron Microscopic Investigation. Liver 1986, 6, 98–110. [Google Scholar] [CrossRef]
  8. Vidal-Vanaclocha, F.; Barberá-Guillem, E. Fenestration Patterns in Endothelial Cells of Rat Liver Sinusoids. J. Ultrastruct. Res. Mol. Struct. Res. 1985, 90, 115–123. [Google Scholar] [CrossRef] [PubMed]
  9. Wack, K.E.; Ross, M.A.; Zegarra, V.; Sysko, L.R.; Watkins, S.C.; Stolz, D.B. Sinusoidal Ultrastructure Evaluated during the Revascularization of Regenerating Rat Liver. Hepatology 2001, 33, 363–378. [Google Scholar] [CrossRef]
  10. Wisse, E.; De Zanger, R.B.; Jacobs, R.; McCuskey, R.S. Scanning Electron Microscope Observations on the Structure of Portal Veins, Sinusoids and Central Veins in Rat Liver. Scan. Electron Microsc. 1983, Pt 3, 1441–1452. [Google Scholar]
  11. Henriksen, J.H.; Lassen, N.A. Pressure Profile in Liver Sinusoids A Model of Localization of Sinusoidal Resistance in the Normal and Cirrhotic Liver. Liver 1988, 8, 88–94. [Google Scholar] [CrossRef] [PubMed]
  12. Yoon, Y.J.; Chang, S.; Kim, O.Y.; Kang, B.K.; Park, J.; Lim, J.H.; Yun Huang, J.; Kim, Y.K.; Byun, J.H.; Gho, Y.S. Three-Dimensional Imaging of Hepatic Sinusoids in Mice Using Synchrotron Radiation Micro-Computed Tomography. PLoS ONE 2013, 8, e68600. [Google Scholar] [CrossRef]
  13. Ryou, M.; Stylopoulos, N.; Baffy, G. Nonalcoholic Fatty Liver Disease and Portal Hypertension. Explor. Med. 2020, 1, 149–169. [Google Scholar] [CrossRef] [PubMed]
  14. Tanaka, M.; Iwakiri, Y. Lymphatics in the Liver. Curr. Opin. Immunol. 2018, 53, 137–142. [Google Scholar] [CrossRef] [PubMed]
  15. Tanaka, M.; Iwakiri, Y. The Hepatic Lymphatic Vascular System: Structure, Function, Markers, and Lymphangiogenesis. Cell. Mol. Gastroenterol. Hepatol. 2016, 2, 733–749. [Google Scholar] [CrossRef]
  16. Jeong, J.; Tanaka, M.; Iwakiri, Y. Hepatic Lymphatic Vascular System in Health and Disease. J. Hepatol. 2022, 77, 206–218. [Google Scholar] [CrossRef] [PubMed]
  17. Santambrogio, L. The Lymphatic Fluid. Int. Rev. Cell Mol. Biol. 2018, 337, 111–133. [Google Scholar] [CrossRef]
  18. Hsu, M.C.; Itkin, M. Lymphatic Anatomy. Tech. Vasc. Interv. Radiol. 2016, 19, 247–254. [Google Scholar] [CrossRef]
  19. Bonfiglio, A.; Leungchavaphongse, K.; Repetto, R.; Siggers, J.H. Mathematical Modeling of the Circulation in the Liver Lobule. J. Biomech. Eng. 2010, 132, 111011. [Google Scholar] [CrossRef]
  20. Siggers, J.H.; Leungchavaphongse, K.; Ho, C.H.; Repetto, R. Mathematical Model of Blood and Interstitial Flow and Lymph Production in the Liver. Biomech. Model. Mechanobiol. 2014, 13, 363–378. [Google Scholar] [CrossRef]
  21. Debbaut, C.; Vierendeels, J.; Casteleyn, C.; Cornillie, P.; Van Loo, D.; Simoens, P.; Van Hoorebeke, L.; Monbaliu, D.; Segers, P. Perfusion Characteristics of the Human Hepatic Microcirculation Based on Three-Dimensional Reconstructions and Computational Fluid Dynamic Analysis. J. Biomech. Eng. 2012, 134, 011003. [Google Scholar] [CrossRef]
  22. Piergiovanni, M.; Bianchi, E.; Capitani, G.; Li Piani, I.; Ganzer, L.; Guidotti, L.G.; Iannacone, M.; Dubini, G. Microcirculation in the Murine Liver: A Computational Fluid Dynamic Model Based on 3D Reconstruction from In Vivo Microscopy. J. Biomech. 2017, 63, 125–134. [Google Scholar] [CrossRef]
  23. Hu, J.; Lü, S.; Feng, S.; Long, M. Flow Dynamics Analyses of Pathophysiological Liver Lobules Using Porous Media Theory. Acta Mech. Sin. Xuebao 2017, 33, 823–832. [Google Scholar] [CrossRef]
  24. Rani, H.P.; Sheu, T.W.H.; Chang, T.M.; Liang, P.C. Numerical Investigation of Non-Newtonian Microcirculatory Blood Flow in Hepatic Lobule. J. Biomech. 2006, 39, 551–563. [Google Scholar] [CrossRef] [PubMed]
  25. Rohan, E.; Turjanicová, J.; Lukeš, V. Multiscale Modelling of Liver Perfusion. In Proceedings of the 15 International Conference on Computational Plasticity: Fundamentals and Applications, COMPLAS 2019, Barcelona, Spain, 3–5 September 2019; pp. 343–353. [Google Scholar]
  26. Debbaut, C.; Monbaliu, D.; Casteleyn, C.; Cornillie, P.; Van Loo, D.; Van Hoorebeke, L.; Simoens, P.; Pirenne, J.; Segers, P. Multiscale Modeling of the Blood Circulation in the Human Liver Using Vascular Corrosion Casting and Micro-CT Imaging Techniques. In Proceedings of the ASME 2011 Summer Bioengineering Conference, Parts A and B, Farmington, PA, USA, 22–25 June 2011; American Society of Mechanical Engineers: New York, NY, USA, 2011; pp. 451–452. [Google Scholar] [CrossRef]
  27. Ricken, T.; Dahmen, U.; Dirsch, O. A Biphasic Model for Sinusoidal Liver Perfusion Remodeling after Outflow Obstruction. Biomech. Model. Mechanobiol. 2010, 9, 435–450. [Google Scholar] [CrossRef] [PubMed]
  28. Ahmadi-Badejani, R.; Mosharaf-Dehkordi, M.; Ahmadikia, H. An Image-Based Geometric Model for Numerical Simulation of Blood Perfusion within the Liver Lobules. Comput. Methods Biomech. Biomed. Eng. 2020, 23, 987–1004. [Google Scholar] [CrossRef]
  29. Mosharaf-Dehkordi, M. A Fully Coupled Porous Media and Channels Flow Approach for Simulation of Blood and Bile Flow through the Liver Lobules. Comput. Methods Biomech. Biomed. Eng. 2019, 22, 901–915. [Google Scholar] [CrossRef]
  30. Schwen, L.O.; Krauss, M.; Niederalt, C.; Gremse, F.; Kiessling, F.; Schenk, A.; Preusser, T.; Kuepfer, L. Spatio-Temporal Simulation of First Pass Drug Perfusion in the Liver. PLoS Comput. Biol. 2014, 10, e1003499. [Google Scholar] [CrossRef] [PubMed]
  31. Schwen, L.O.; Schenk, A.; Kreutz, C.; Timmer, J.; Rodríguez, M.M.B.; Kuepfer, L.; Preusser, T. Representative Sinusoids for Hepatic Four-Scale Pharmacokinetics Simulations. PLoS ONE 2015, 10, e133653. [Google Scholar] [CrossRef]
  32. Barléon, N.; Clarke, R.J.; Ho, H. Novel Methods for Segment-Specific Blood Flow Simulation for the Liver. Comput. Methods Biomech. Biomed. Eng. 2018, 21, 780–783. [Google Scholar] [CrossRef]
  33. Rezania, V.; Coombe, D.; Tuszynski, J.A. A Physiologically-Based Flow Network Model for Hepatic Drug Elimination III: 2D/3D DLA Lobule Models. Theor. Biol. Med. Model. 2016, 13, 9. [Google Scholar] [CrossRef]
  34. Ni, Y.; Li, J.-M.; Liu, M.-K.; Zhang, T.-T.; Wang, D.-P.; Zhou, W.-H.; Hu, L.-Z.; Lv, W.-L. Pathological Process of Liver Sinusoidal Endothelial Cells in Liver Diseases. World J. Gastroenterol. 2017, 23, 7666–7677. [Google Scholar] [CrossRef]
  35. Horn, T.; Christoffersen, P.; Henriksen, J.H. Alcoholic Liver Injury: Defenestration in Noncirrhotic Livers-a Scanning Electron Microscopic Study. Hepatology 1987, 7, 77–82. [Google Scholar] [CrossRef] [PubMed]
  36. Hilmer, S.N.; Cogger, V.C.; Fraser, R.; McLean, A.J.; Sullivan, D.; Le Couteur, D.G. Age-Related Changes in the Hepatic Sinusoidal Endothelium Impede Lipoprotein Transfer in the Rat. Hepatology 2005, 42, 1349–1354. [Google Scholar] [CrossRef]
  37. Brainerd, C.; Gorti, V.; Janes, M.; Jones, K.; Khayat, S.; Liu, A.; Noonan-shueh, M.; Rao, S. Variable Fenestration of A 3D Nanoprinted Liver Sinusoid on a Chip. Dr. Ryan D. Sochol Department of Mechanical Engineering. Available online: http://hdl.handle.net/1903/24764 (accessed on 29 September 2021).
  38. Heppell, C.; Roose, T.; Richardson, G. A Model for Interstitial Drainage Through a Sliding Lymphatic Valve. Bull. Math. Biol. 2015, 77, 1101–1131. [Google Scholar] [CrossRef] [PubMed]
  39. Swartz, M.A. The Physiology of the Lymphatic System. Adv. Drug Deliv. Rev. 2001, 50, 3–20. [Google Scholar] [CrossRef]
  40. Wisse, E.; De Zanger, R.; Charles, K.; Van Der Smissen, P.; McCuskey, R. The Liver Sieve: Considerations Concerning the Structure and Function of Endothelial Fenestrae, the Sinusoidal Wall and the Space of Disse. Hepatology 1985, 5, 683–692. [Google Scholar] [CrossRef] [PubMed]
  41. Iwata, H.; Ueda, Y. Pharmacokinetic Considerations in Development of a Bioartificial Liver. Clin. Pharmacokinet. 2004, 43, 211–225. [Google Scholar] [CrossRef]
Figure 1. Schematic of the liver sinusoid: liver sinusoid endothelial cells (LSECs) form the highly specialized and fenestrated endothelium of the sinusoid. Resident macrophages (Kupffer cells (KCs)) populate the sinusoidal lumen, while hepatic stellate cells can be found within the Space of Disse (SoD), an approximately 1 µm thick region with a sparse extracellular matrix (grey bundles—proteoglycans and collagen type III) that separates the LSECs from the hepatocytes (hep). Blood rich in nutrients and oxygen flows from the portal vein (PV) and the hepatic artery (HA) toward the central vein (CV) (purple arrows). Bile is formed in the hepatocytes and flows through the bile canaliculi, which are situated between hepatic cords (dark green arrows). Lymph is largely (ca. 80%) formed from the filtrate in the SoD and flows into the lymphatic vasculature (LV), which is in the Space of Mall (SoM) (light green arrows).
Livers 03 00043 g001
Figure 2. Schematics of the numerical models of the sinusoid. The model was designed as a half-section. Two main versions were adopted: constant-radius and diverging sinusoids (a). Sizes are in microns. An example of the more complete model adopted in the simulations (b) a diverging section, including a variable porosity (5%, 6%, and 20%) and an extra outlet at the portal side of the SoD to mimic lymphatic drainage (dark arrows indicate the direction of the flow).
Livers 03 00043 g002
Figure 3. Mesh highlights shown for the diverging sinusoid model. The side of each element of the mesh was set to a max size of 0.1 µm. Further, in the bottom panel, the quality spectrum for the orthogonality metric is reported.
Livers 03 00043 g003
Figure 4. Velocity magnitudes along sinusoids modeled without lymphatic drainage. Models are with a constant radius (cylinder) or with a diverging radius (conical) and low (5%) porosity or high (20%) porosity.
Livers 03 00043 g004
Figure 5. Velocity magnitudes along sinusoids modeled with lymphatic drainage. Models are with a constant radius (cylinder) or with a diverging radius (conical) and low (5%) porosity or high (20%) porosity.
Livers 03 00043 g005
Figure 6. Velocity along sinusoids modeled with variable porosity (5, 6, 20%). Models are with a constant radius (cylinder) or with a diverging radius (conical) and with or without lymphatic drainage.
Livers 03 00043 g006
Figure 7. Pressure along sinusoids modeled with lymphatic drainage. Models are with a constant radius (cylinder) or with a diverging radius (conical) and low (5%) porosity or high (20%) porosity (top/bottom).
Livers 03 00043 g007
Figure 8. Pressure along sinusoids modeled without lymphatic drainage. Models are with a constant radius (cylinder) or with a diverging radius (conical) and low (5%) porosity or high (20%) porosity.
Livers 03 00043 g008
Figure 9. Pressure along sinusoids modeled with variable porosity (5, 6, 20%). Models are with a constant radius (cylinder) or with a diverging radius (conical) and with or without lymphatic drainage.
Livers 03 00043 g009
Table 1. Partial summary of the literature concerning sinusoidal dimensions and flow parameters.
Reference(i) Model; (ii) Method; (iii) Sinusoid Dimensions; (iv) Flow; (v) Pressure; (vi) Fenestrations
Wisse, 1983 [10](i) Rat; (ii) SEM; (vi) porosity is higher and fenestrations have wider diameters in zone 3 than in zone 1 (97.92 vs. 76.57 nm and 11.63 vs. 6.81%)
Vidal-Vanaclocha and Barbera-Guillem, 1985 [8](i) Rat; (ii) SEM; (vi) zone 3 has wider fenestrations (94–121 nm vs. 73–101 nm) and a higher frequency (10.21–10.68 fenestrations/µm2 vs. 5.74–6.26 fenestrations/µm2) than zone 1 and a greater number of sieve plates (1.73-fold greater)
Horn, 1986 [7](i) Human; (ii) SEM; (vi) in zone 3, fenestrations are more numerous (23.5 vs. 19.2%) than in zone 1, and porosity is higher in zone 3 than in zone 1 (9.1 vs. 7.6%)
Wake, 1988 [3](i) Rat; (ii) light and electron microscopy; (iii) centrilobular LSECs are larger (longer and wider) than periportal LSECs
Henriksen and Lassen, 1988 [11] (i) Theoretical model; (iv) the shape of the sinusoid does not affect the flow profile, which is characterized by an increasing speed moving from zone 1 to zone 3; (v) in humans, the pressure drop between the portal and central veins is between 3 and 5 mmHg (450 Pa)
Komatsu, 1990 [5](i) Rat; (ii) in vivo fluorescence microscopy; (iii) the diameter of the sinusoid increases from zone 1 to zone 2 to zone 3; 6.4 µm–7 µm–8.3 µm; (iv) the flow rate increases along the sinusoid, 143–221–331 µm/s; (v) the interpolated values of pressure within sinusoids are as follows: zone 1, 68–50; zone 2, 50–40; and zone 3, 40–28 mmHg
MacPhee, 1995 [4](i) Mouse and rat; (ii) high resolution in vivo microscopy; (iv) the flow speed is highly variable due to interactions between blood cells and the cells of the sinusoid; generally, the velocity in zone 3 is greater than in zone 1
Yoon, 2013 [12](i) Mouse; (ii) computed tomography; (iii) zone 1 features a smaller diameter (8.8 vs. 13.7 µm) than zone 3; (vi) zone 1 has a lower porosity than zone 3
Ryou, 2020 [13](v) Clinical portal hypertension has pressure above 5 mmHg (666 Pa), while normal pressure is around 3.4 mmHg (450 Pa)
Table 2. The most significant studies on numerical models of the liver’s microvasculature. Ref. = Reference, Mod. Obj. = models of a liver sinusoid or lobule, Dim. = dimensions, Bound. Cond. = boundary conditions, Eval. Param. = evaluation parameter, v = velocity; FR = flow rate; WSS = wall shear stress; P = pressure; 2D = two-dimensional; 3D = three-dimensional.
Ref.Mod.
Obj.
Dim.OriginBound.
Cond.
Eval.
Param.
Highlights
Bonfiglio (2010) [19]; Siggers (2014) [20]Lobule2DNumericalPhys., post-resection, and lymph productionP, blood flow distribution (v), and lymph flowAn infinite lattice of hexagonal lobules, the sinusoid space as a porous medium, the resection effect, anisotropy and shear-dependent tissue deformation, and lymph production
Debbaut (2012) [21] Three lobules3DThree human lobule casts digitized using a micro-CT scannerPhys.P, permeability, preferential flow pathways, and WSSA liver circulation anisotropy estimation
Piergiovanni
(2017) [22]
Sinusoidal
network
3DIn vivo images; mouse modelPhys.vmean, FRmass, and WSSLocal hemodynamics; an
investigation into different degrees of occlusion
Hu (2017) [23] Lobule3DNumericalPhys.;
path. (fibrosis; cirrhosis)
P, vmean, and FRvolPorous media approach;
fibrotic–cirrhotic lobule
Table 3. Hardware specifications.
ProcessorIntel i5-10300H
Clock Freq. [GHz]2.50
Core #8
Ram [GB]8
Table 4. Quantitative evaluation of pressure (P) and velocity (V) at the axis of the simplified models of the sinusoid without fenestrations or lymphatic drainage (constant-radius and diverging-radius microchannels).
Constant RadiusDivergent Radius
P [Pa]V [m/s]P [Pa]V [m/s]
max1067.690.0011066.950.0032
min800.1460.0008799.8760.0007
avg933.59730.00085871.95080.0015
Std.dev77.19031.00 × 10−569.2010.0007
Table 5. Velocity magnitudes in sinusoids modeled without lymphatic drainage. Const. rad. = constant radius; Div. rad. = diverging radius; porosity given as %; Var = variable increasing porosity 5–20%; l = lumen centre line; f = fenestrations; D = Space of Disse.
Const. rad. 5% Const. rad. Var Const. rad 20%
lfDlfDlfD
max0.000870.0000380.0000340.00150.0000330.0000350.00330.0000160.000035
min0.00013000.00054000.0008500
avg0.000842.8 × 10−60.0000290.000861.2 × 10−60.000030.000860.0000010.000032
Std.dev0.0000470.0000050.0000080.0000442.5 × 10−67.7 × 10−60.000131.9 × 10−66.7 × 10⁻⁶
Div. rad. 5% Div. rad. Var Div. rad. 20%
lfDlfDlfD
max0.00310.000090.0000530.00320.000090.0000540.0190.0000490.000075
min0.000022000.000019000.000700
avg0.00150.0000040.0000250.00150.0000020.0000260.00151.8 × 10−60.000028
Std.dev0.000668.5 × 10−60.0000160.000676.63 × 10−60.0000160.00114.3 × 10−60.000022
Table 6. Velocity magnitudes in sinusoids modeled with lymphatic drainage. Const. rad. = constant radius; Div. rad. = diverging radius; porosity given as %; Var = variable increasing porosity 5–20%; l = lumen centre line; f = fenestrations; D = Space of Disse.
Const. rad. 5% Const. rad. Var Const rad. 20%
lfDlfDlfD
max0.0020.00130.00140.0020.00140.00140.00350.00140.003
min0.00075000.00065000.00001400
avg0.000860.0000570.000120.000860.0000190.000120.000850.0000290.00014
Std.dev0.000240.000165.25 × 10−50.000250.000850.000260.00040.000120.00042
Div. rad. 5% Div. rad. Var Div. rad. 20%
lfDlfDlfD
max0.00410.00130.00140.0040.00130.00140.0250.00140.003
min0.000016000.000016000.000700
avg0.00140.0000510.000110.00140.0000250.000110.00170.0000310.00012
Std.dev0.00080.000150.000260.00080.000110.000250.00160.000130.00041
Table 7. Pressure in sinusoids modeled without lymphatic drainage. Const. rad. = constant radius; Div. rad. = diverging radius; porosity given as %; Var = variable increasing porosity 5–20%; l = lumen centreline; f = fenestrations; D = Space of Disse.
Const. rad. 5% Const. rad. Var Const rad. 20%
lfDlfDlfD
max106710541043106710551044106710611056
min802813824796806811785806810
avg934934934933883931933933933
Std.dev767373776774777676
Div. rad. 5% Div. rad. Var Div. rad. 20%
lfDlfDlfD
max106810311002106710311001107410561040
min8098110813805802806748826827
avg878877878874844873891891891
Std.dev676259685361656362
Table 8. Pressure in sinusoids modeled with lymphatic drainage. Const. rad. = constant radius; Div. rad. = diverging radius; porosity given as %; Var = variable increasing porosity 5–20%; l = lumen centreline; f=fenestrations; D = Space of Disse.
Const. rad. 5% Const. rad. Var Const rad. 20%
lfDlfDlfD
max106794993410679529391067989983
min794592102798588102800604103
avg917876836919857840917900881
Std.dev736514071501406965110
Div. rad. 5% Div. rad. Var Div. rad. 20%
lfDlfDlfD
max106788086510678838681066929915
min805570102806586102656600105
avg869828791870823792850834816
Std.dev65501296534128685093
Disclaimer/Publisher’s Note: The statements, opinions and data contained in all publications are solely those of the individual author(s) and contributor(s) and not of MDPI and/or the editor(s). MDPI and/or the editor(s) disclaim responsibility for any injury to people or property resulting from any ideas, methods, instructions or products referred to in the content.

