
Ecological Sorption of Iron and Sulfate Ions onto Starch and Chitosan Biopolymer Blend

Abstract
:
1. Introduction
2. Materials and Methods
2.1. Materials
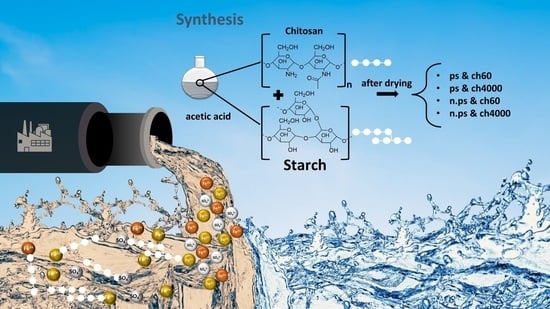
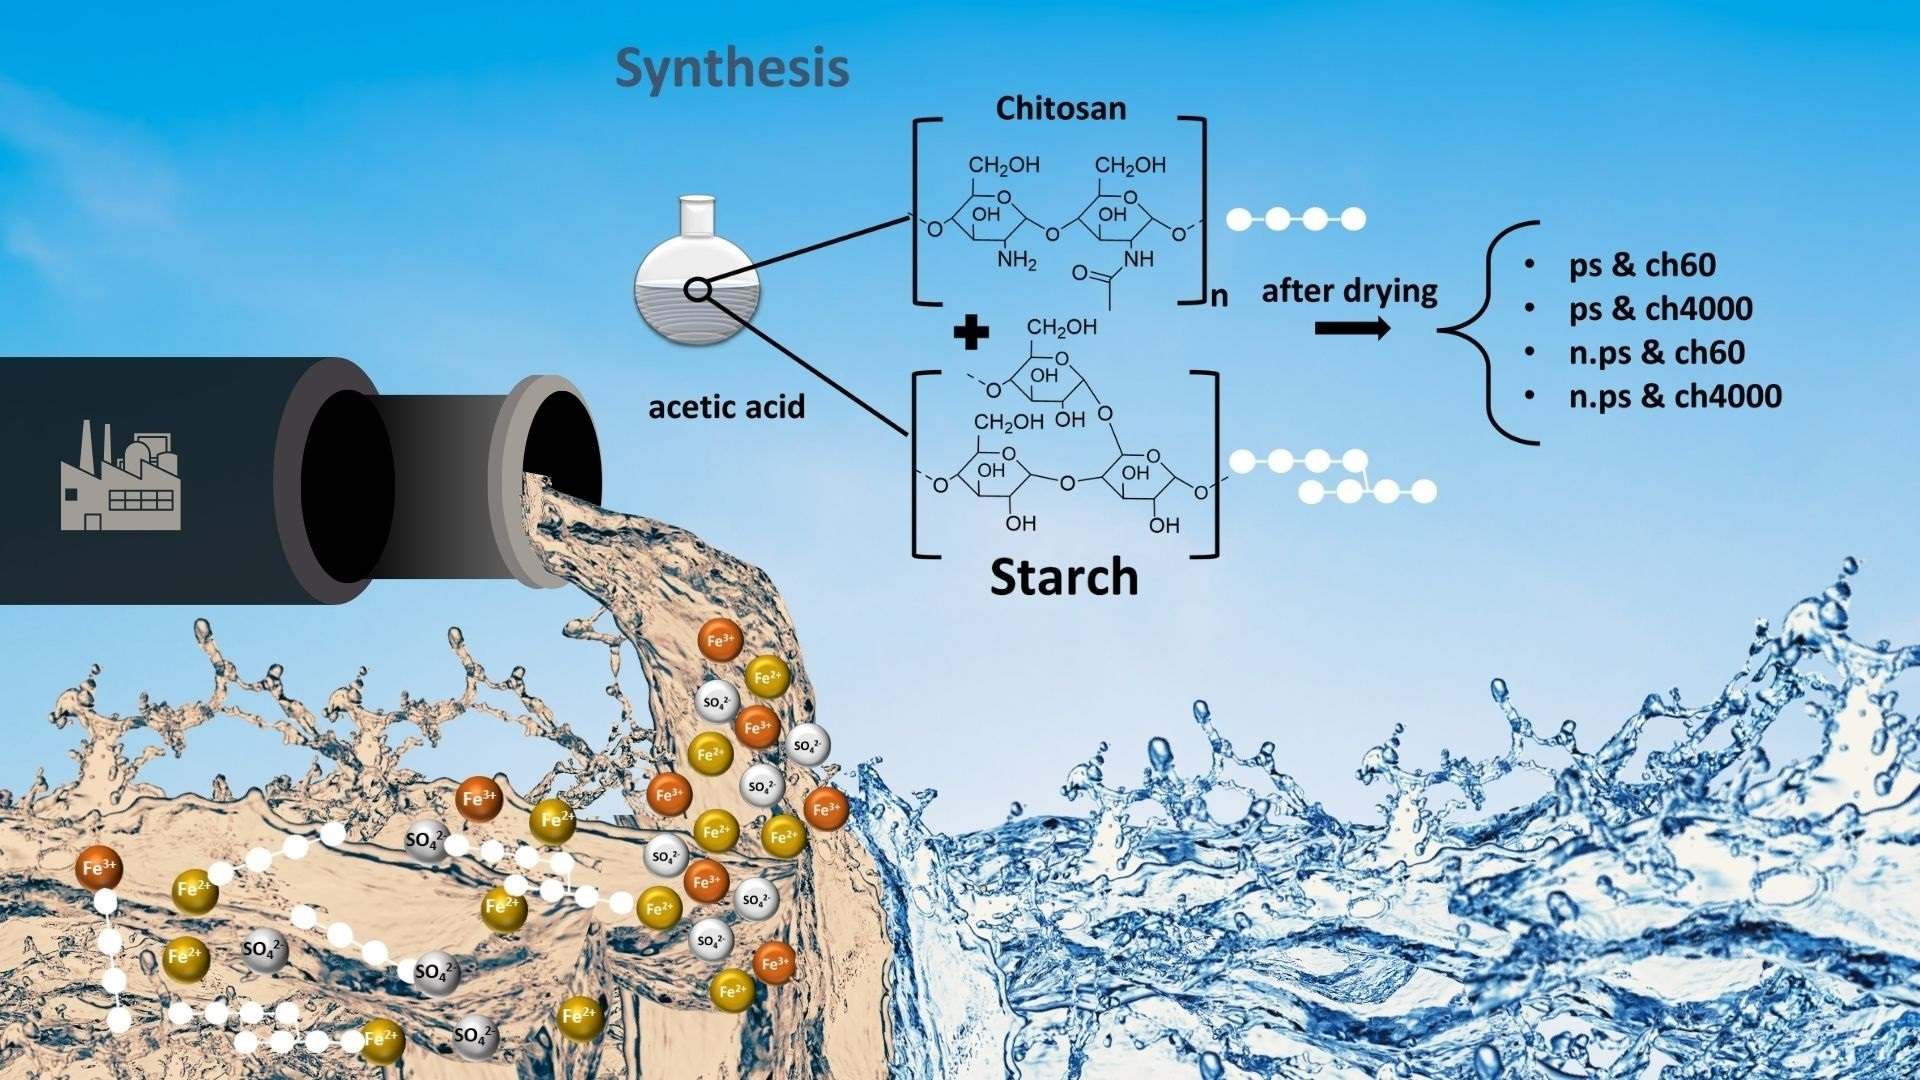
2.1.1. Synthesis of Starch Chitosan Blend
2.1.2. Synthesis of Nano Potato Starch
2.2. Methods
2.3. Adsorption Experiments
2.3.1. Adsorption in Dependence on Time
2.3.2. Adsorption Isotherms
3. Theory Part
3.1. Adsorption Test
3.2. Kinetic Isotherms
3.3. Adsorption Isotherms
4. Results and Discussion
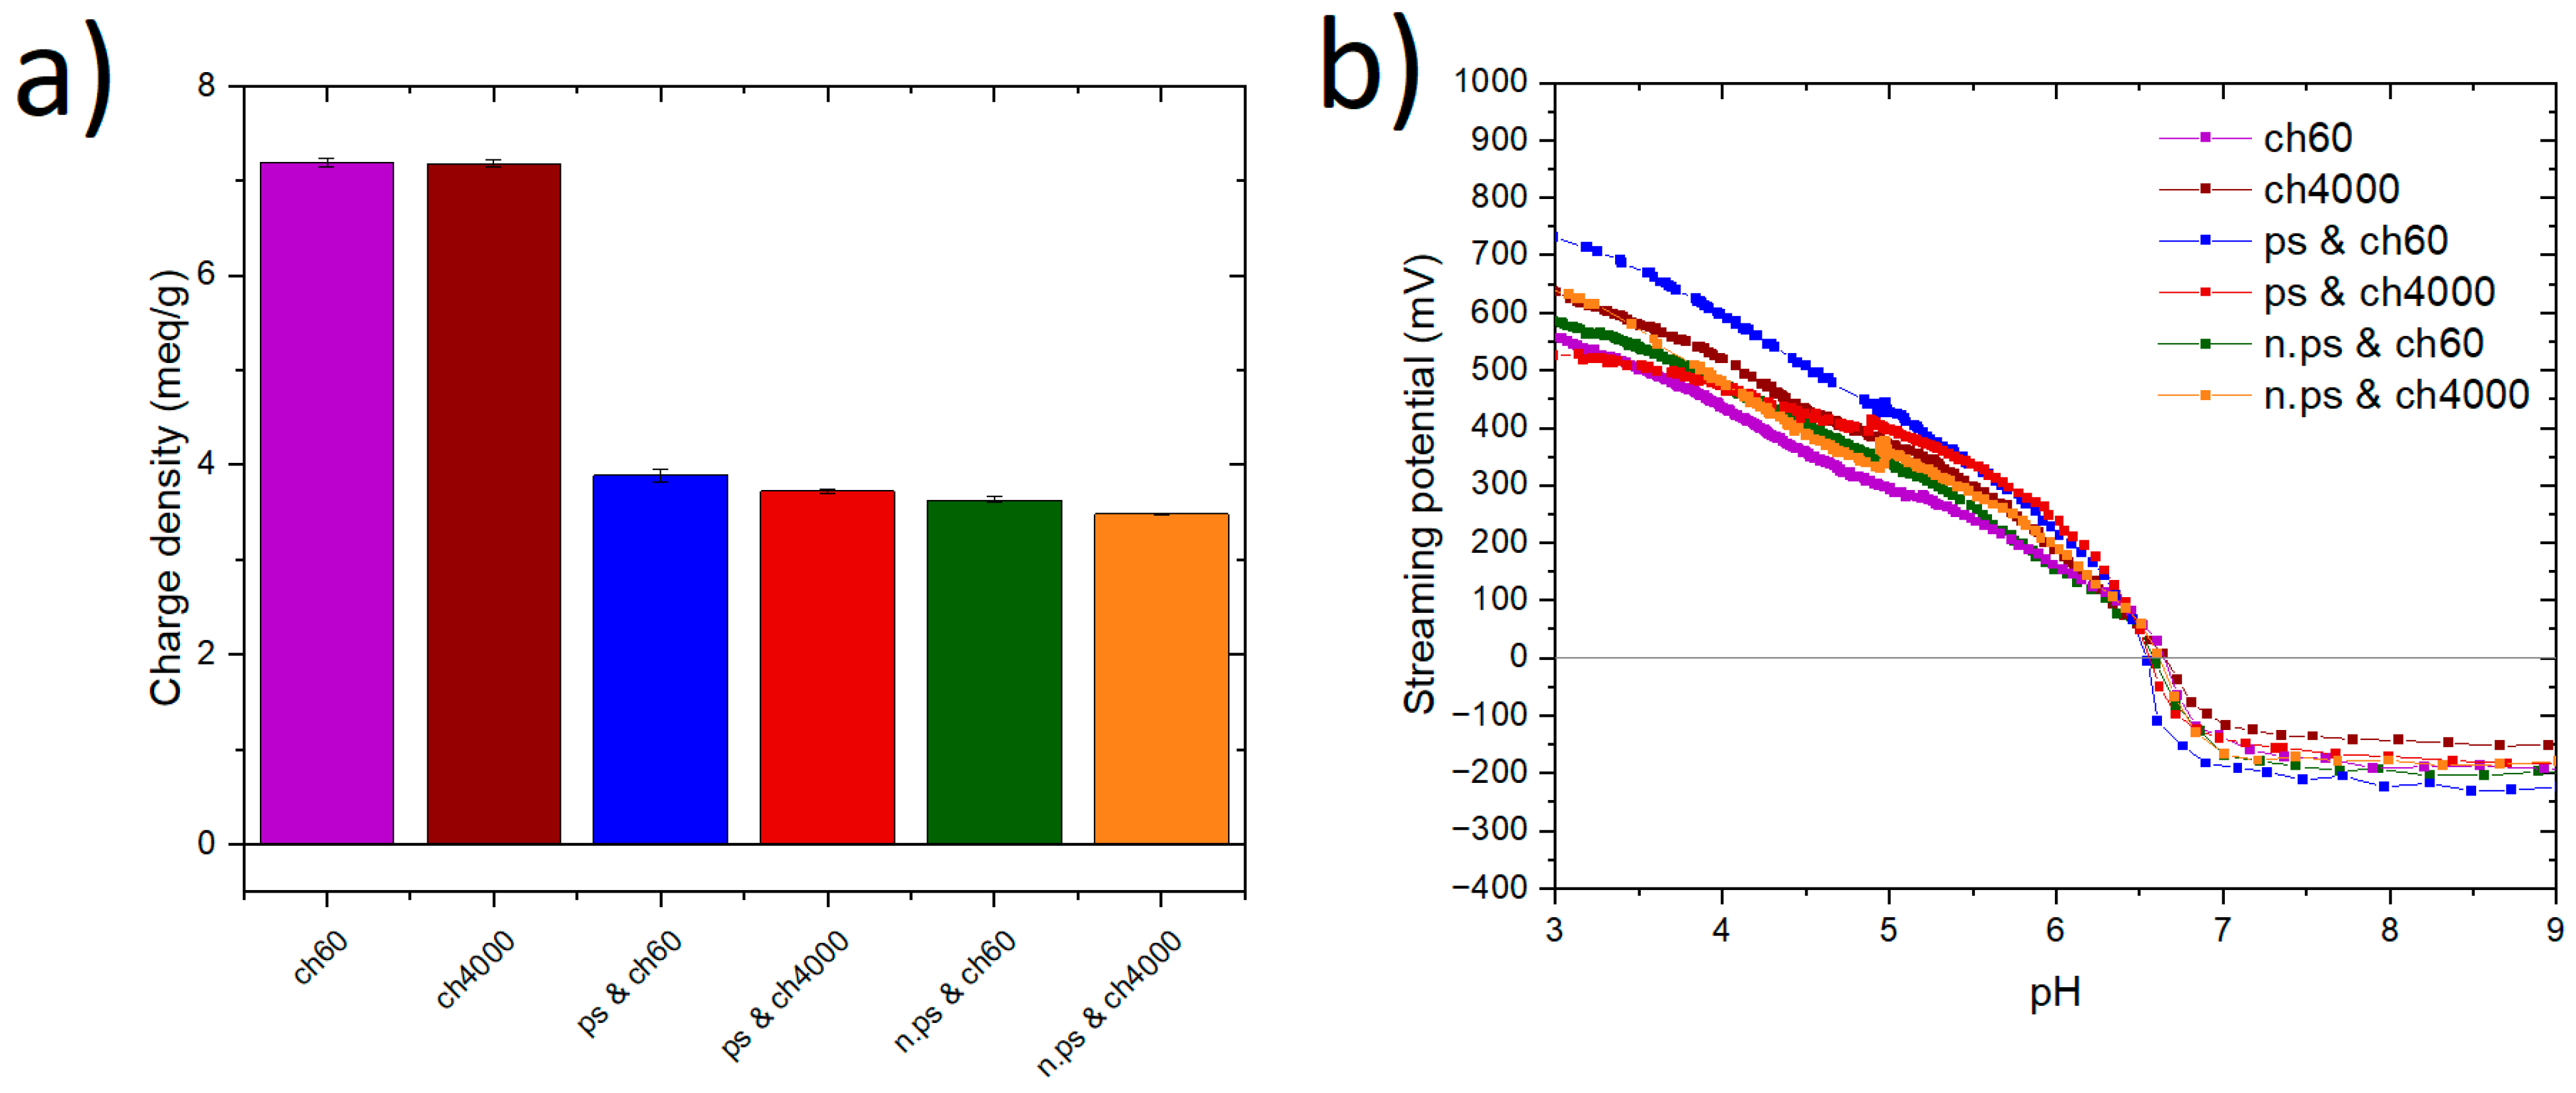
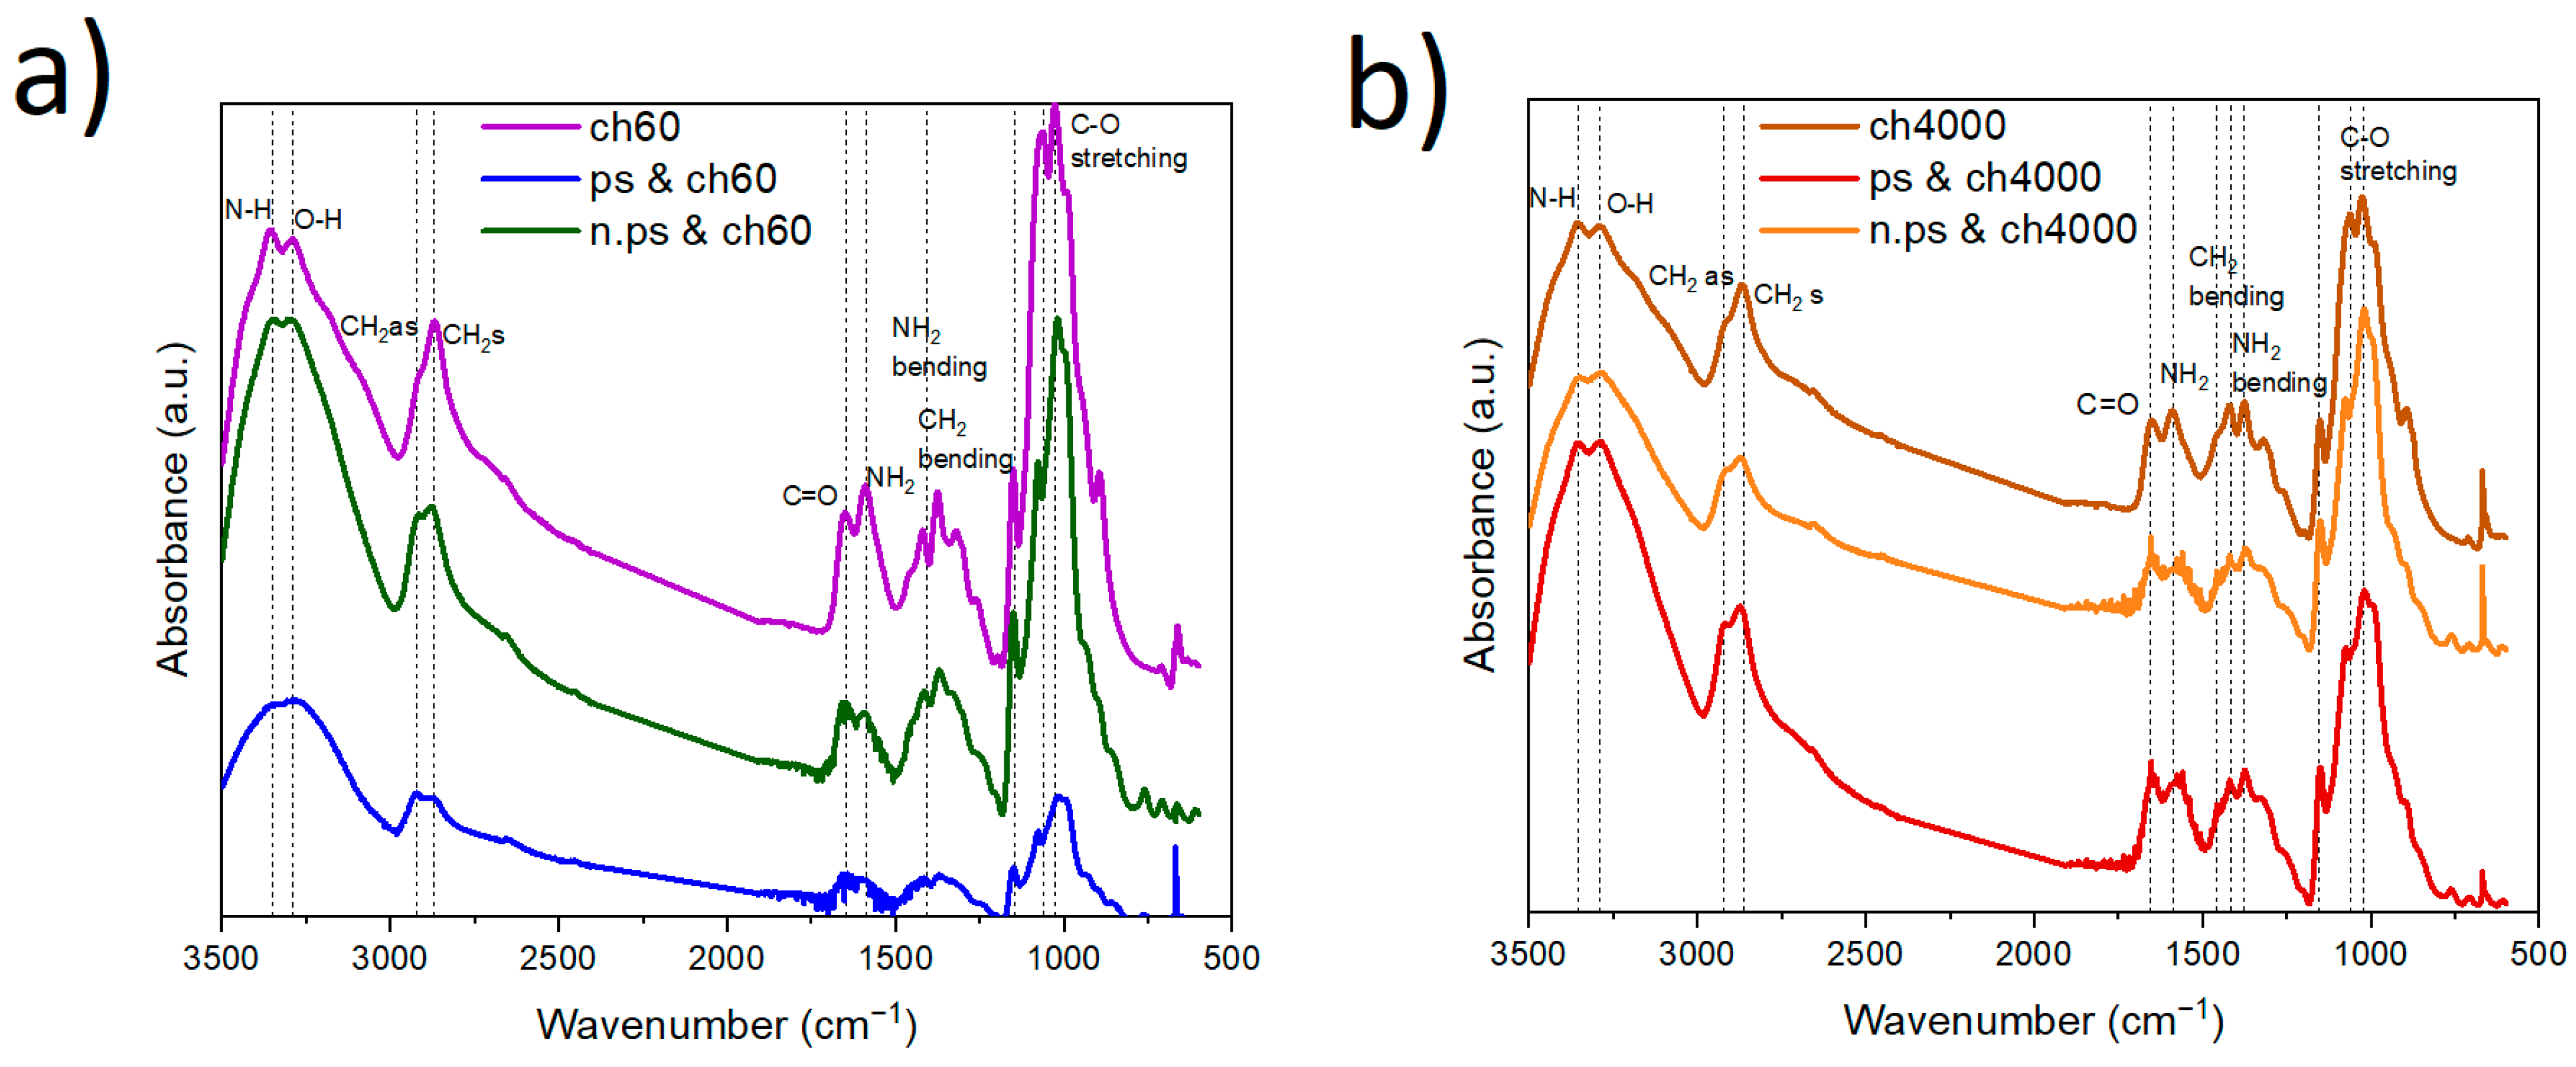
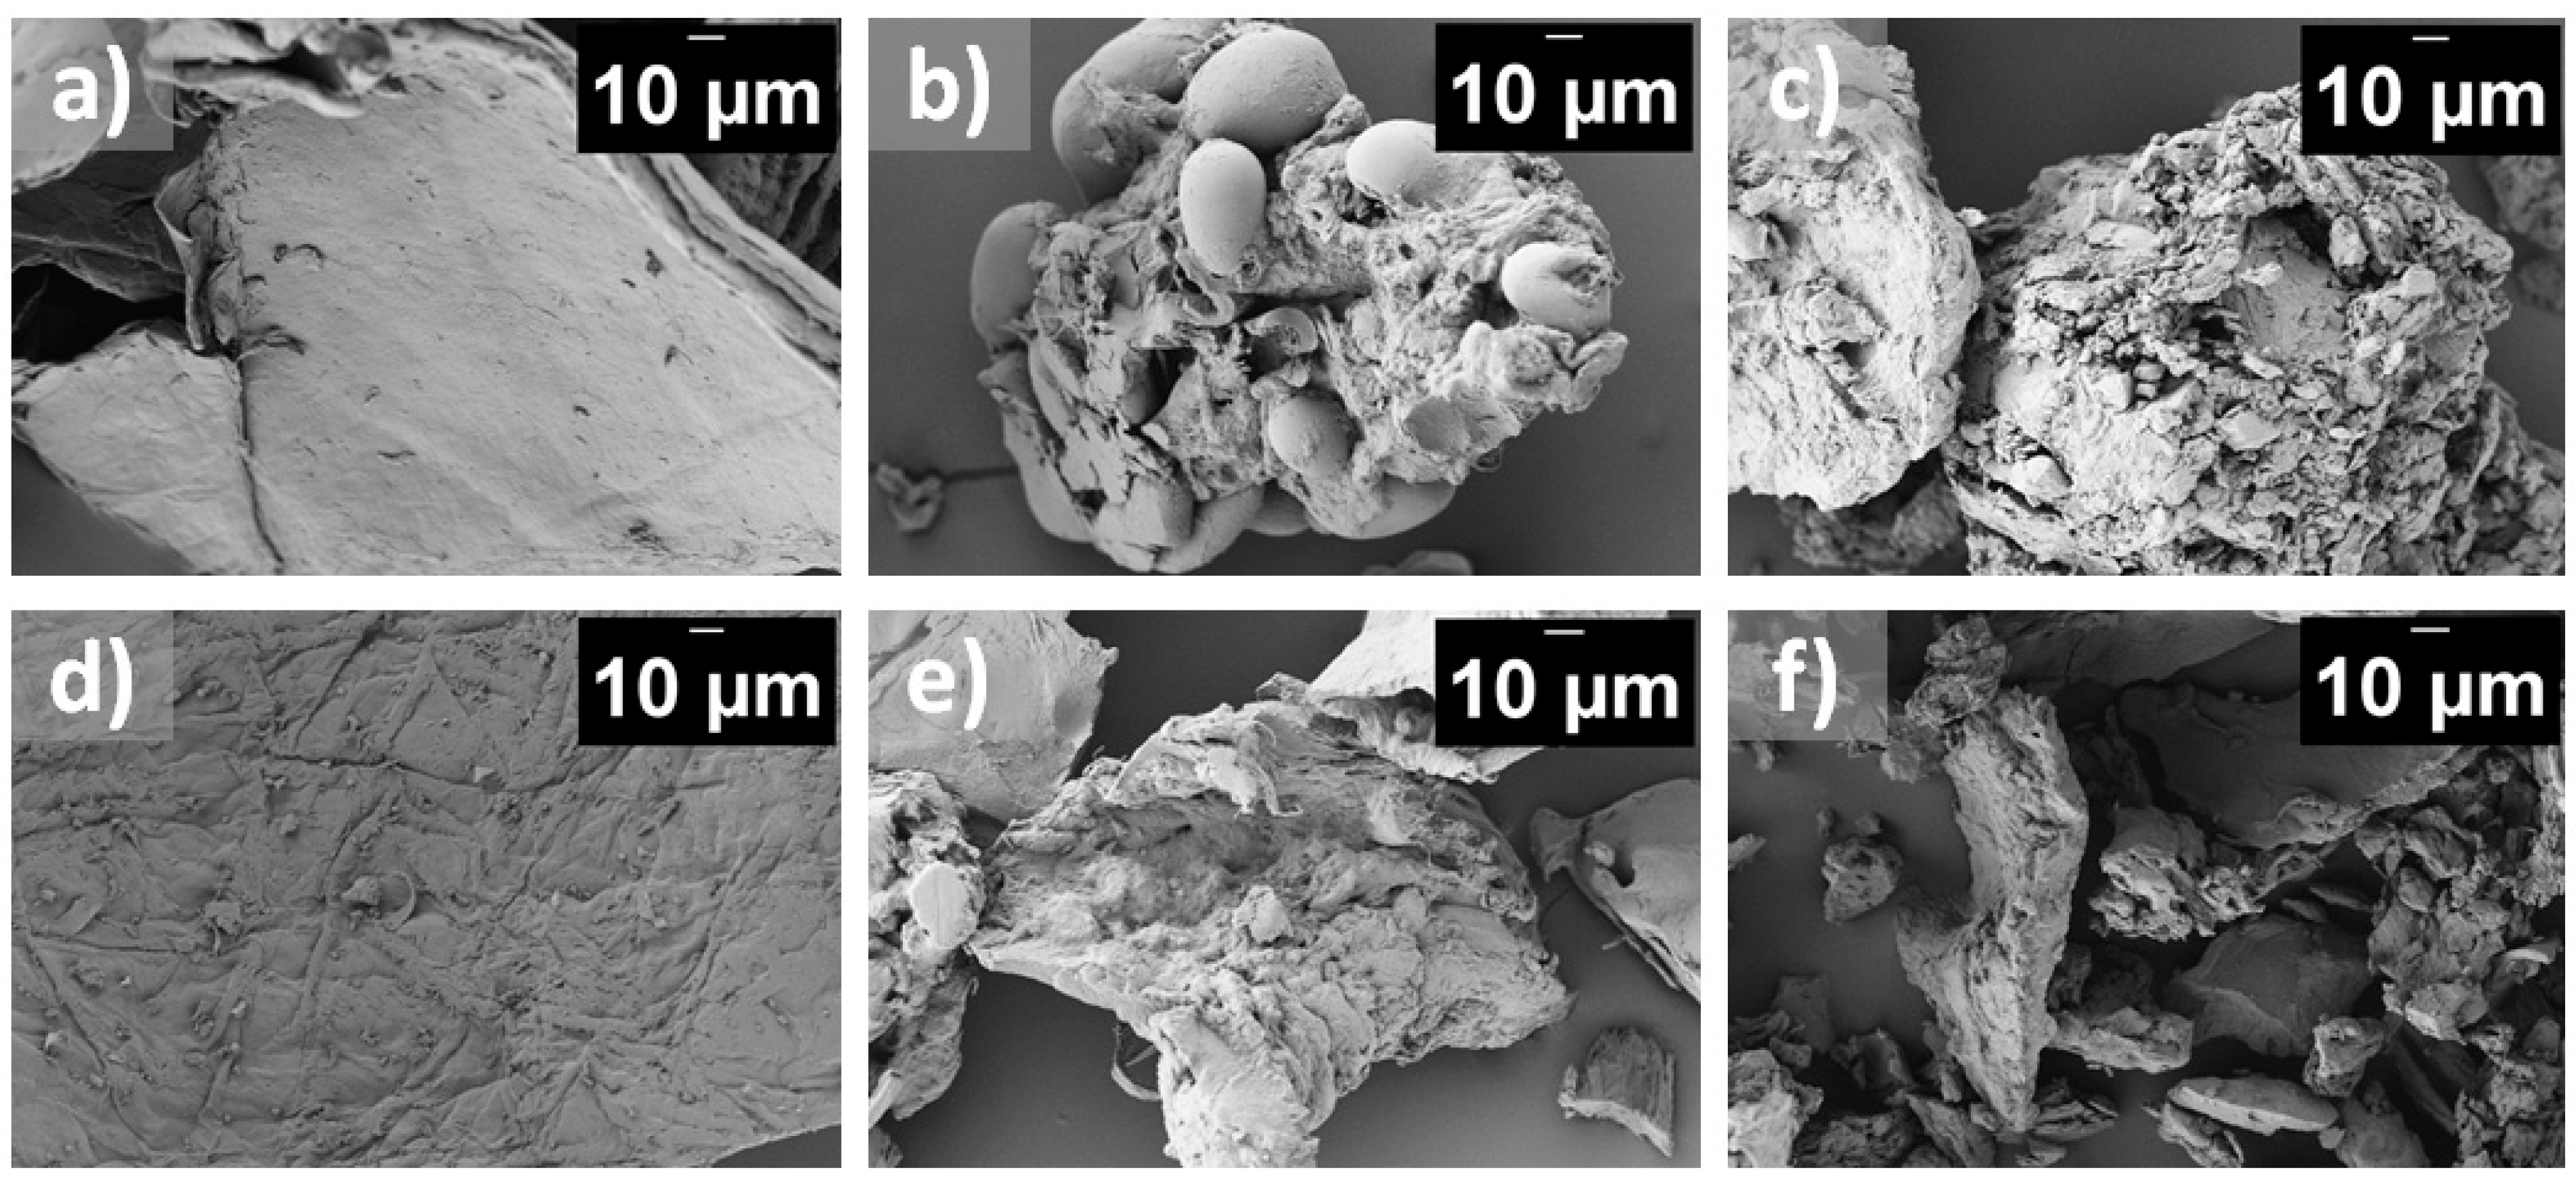
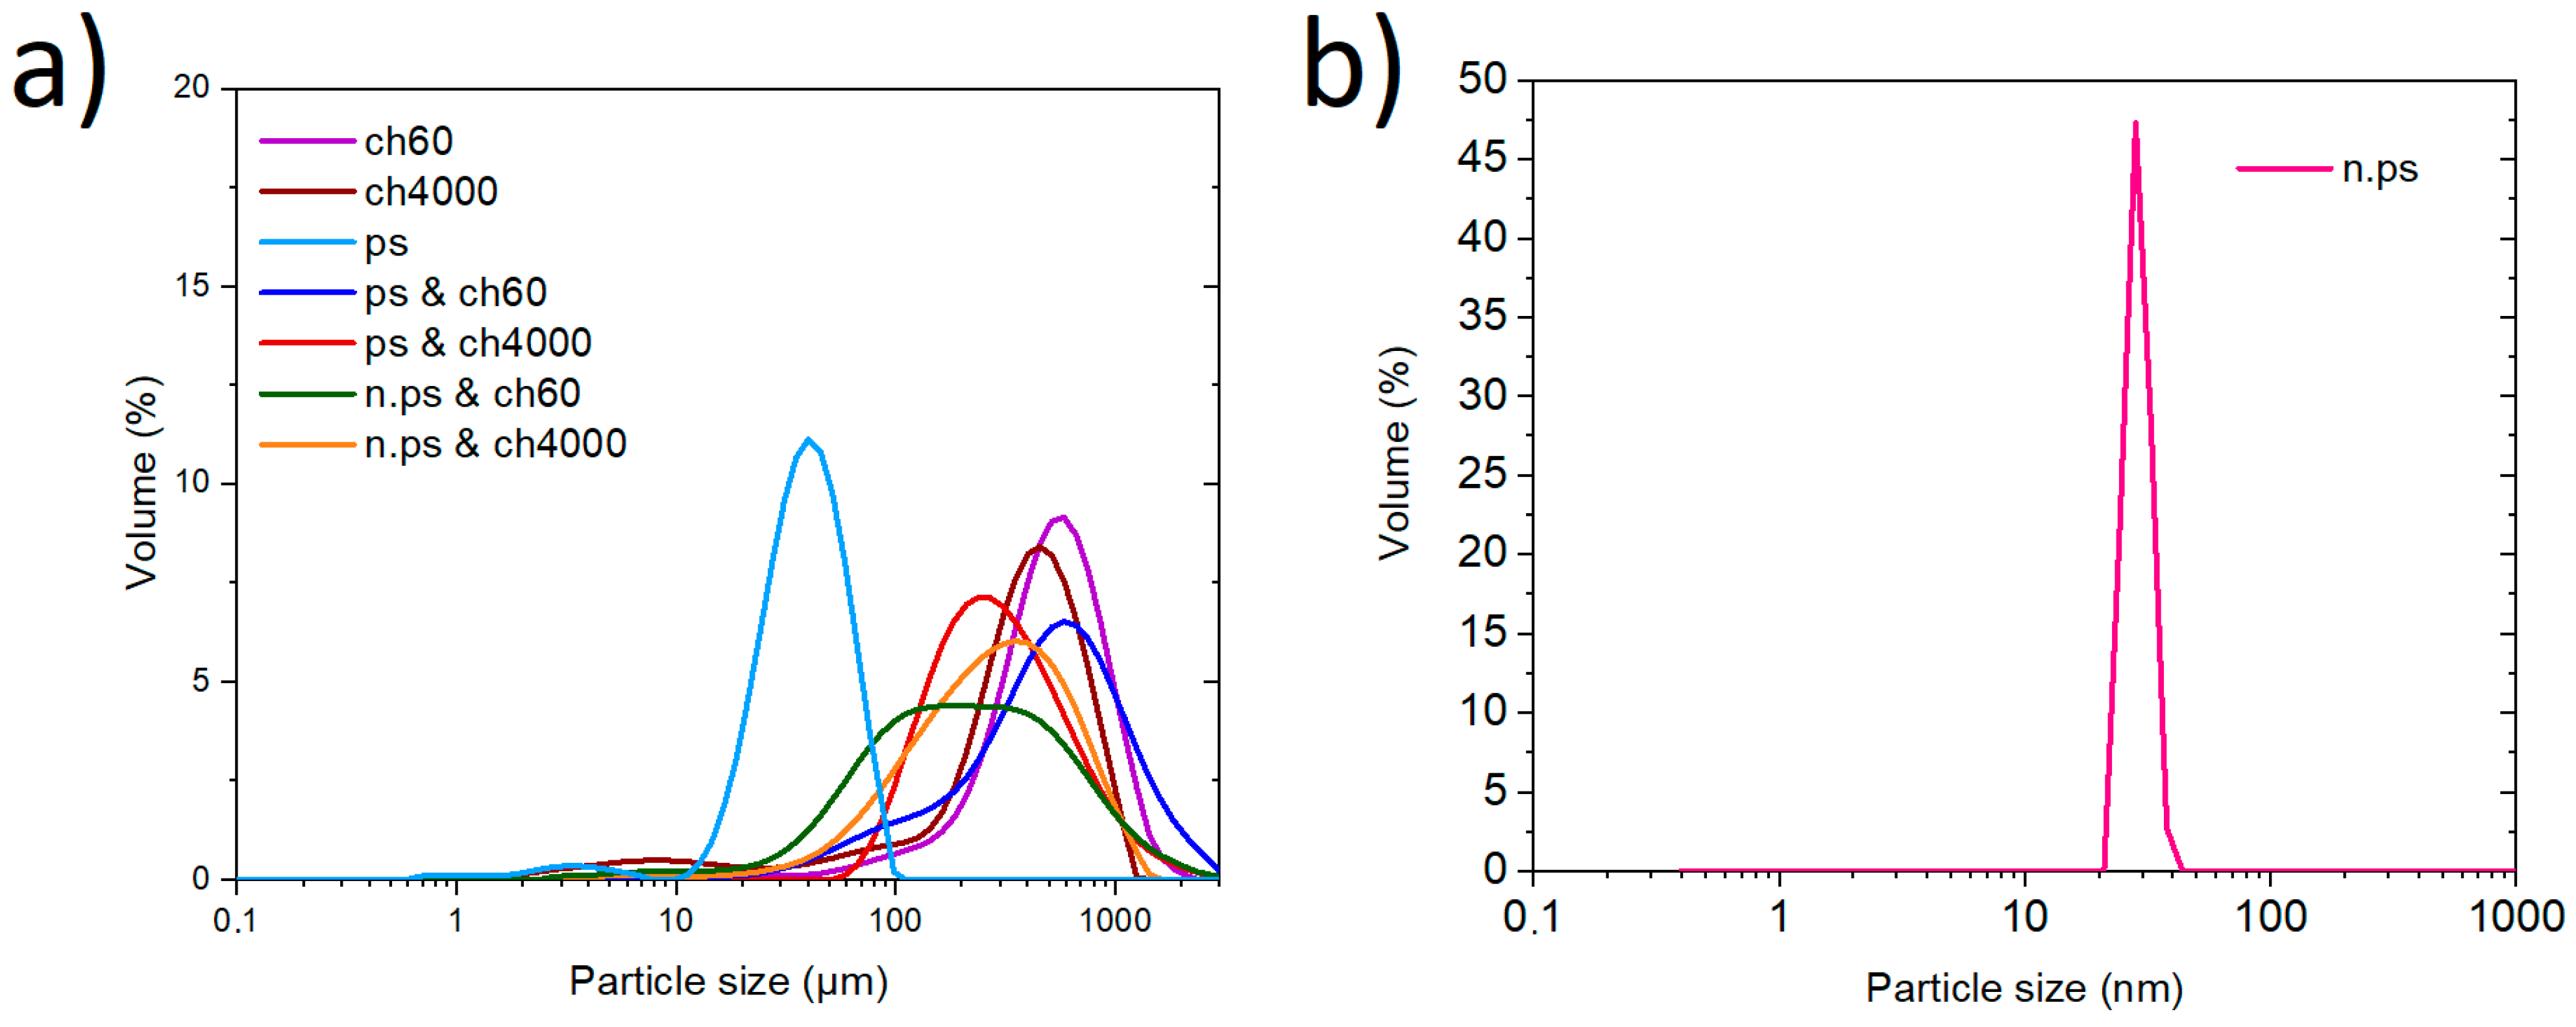
4.1. Characterization of Starch–Chitosan Blends
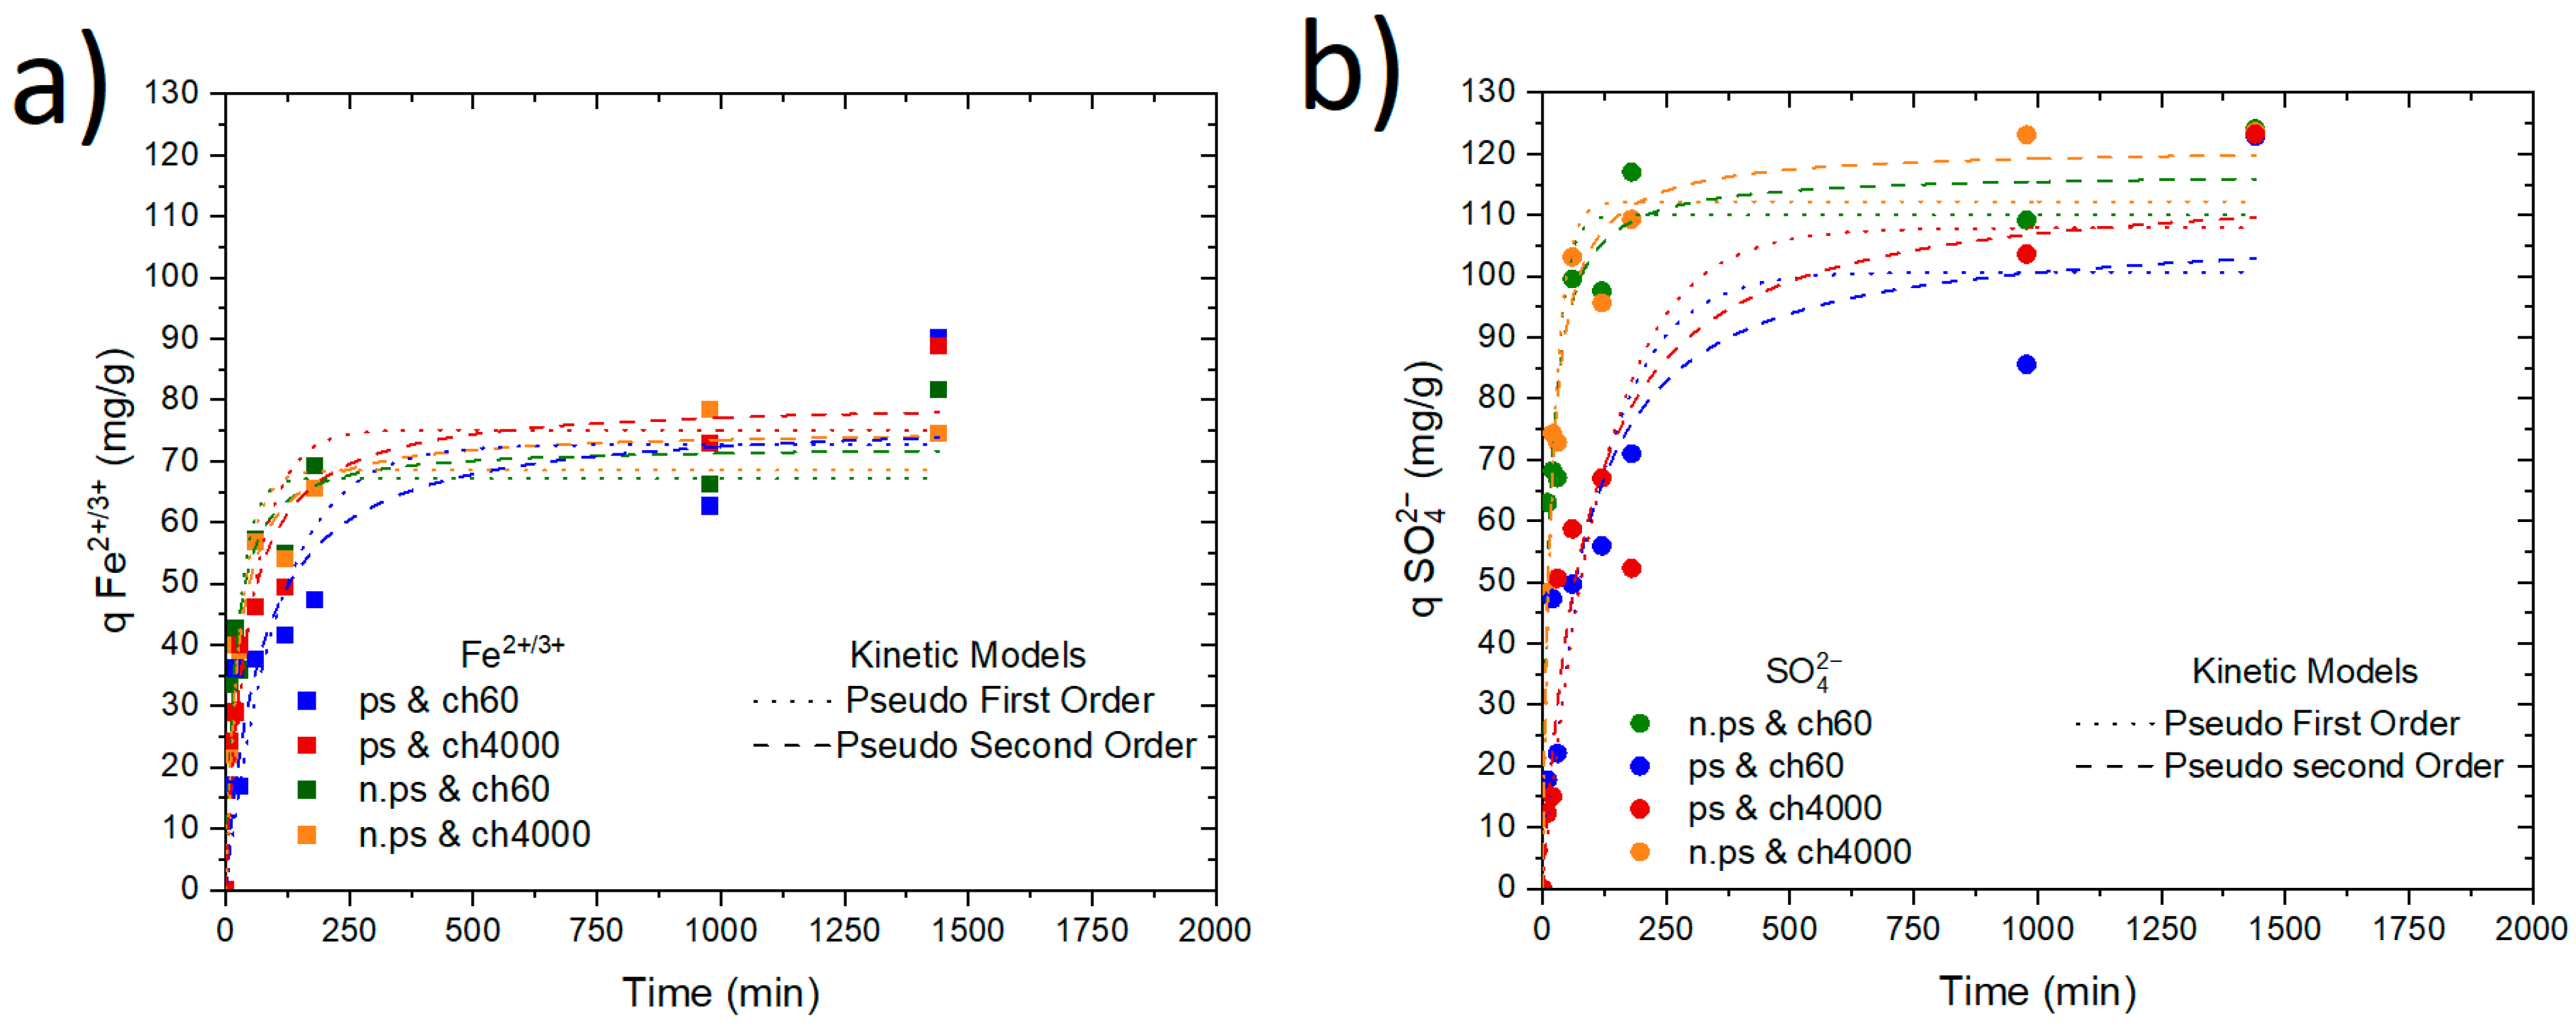
4.2. Adsorption Kinetic

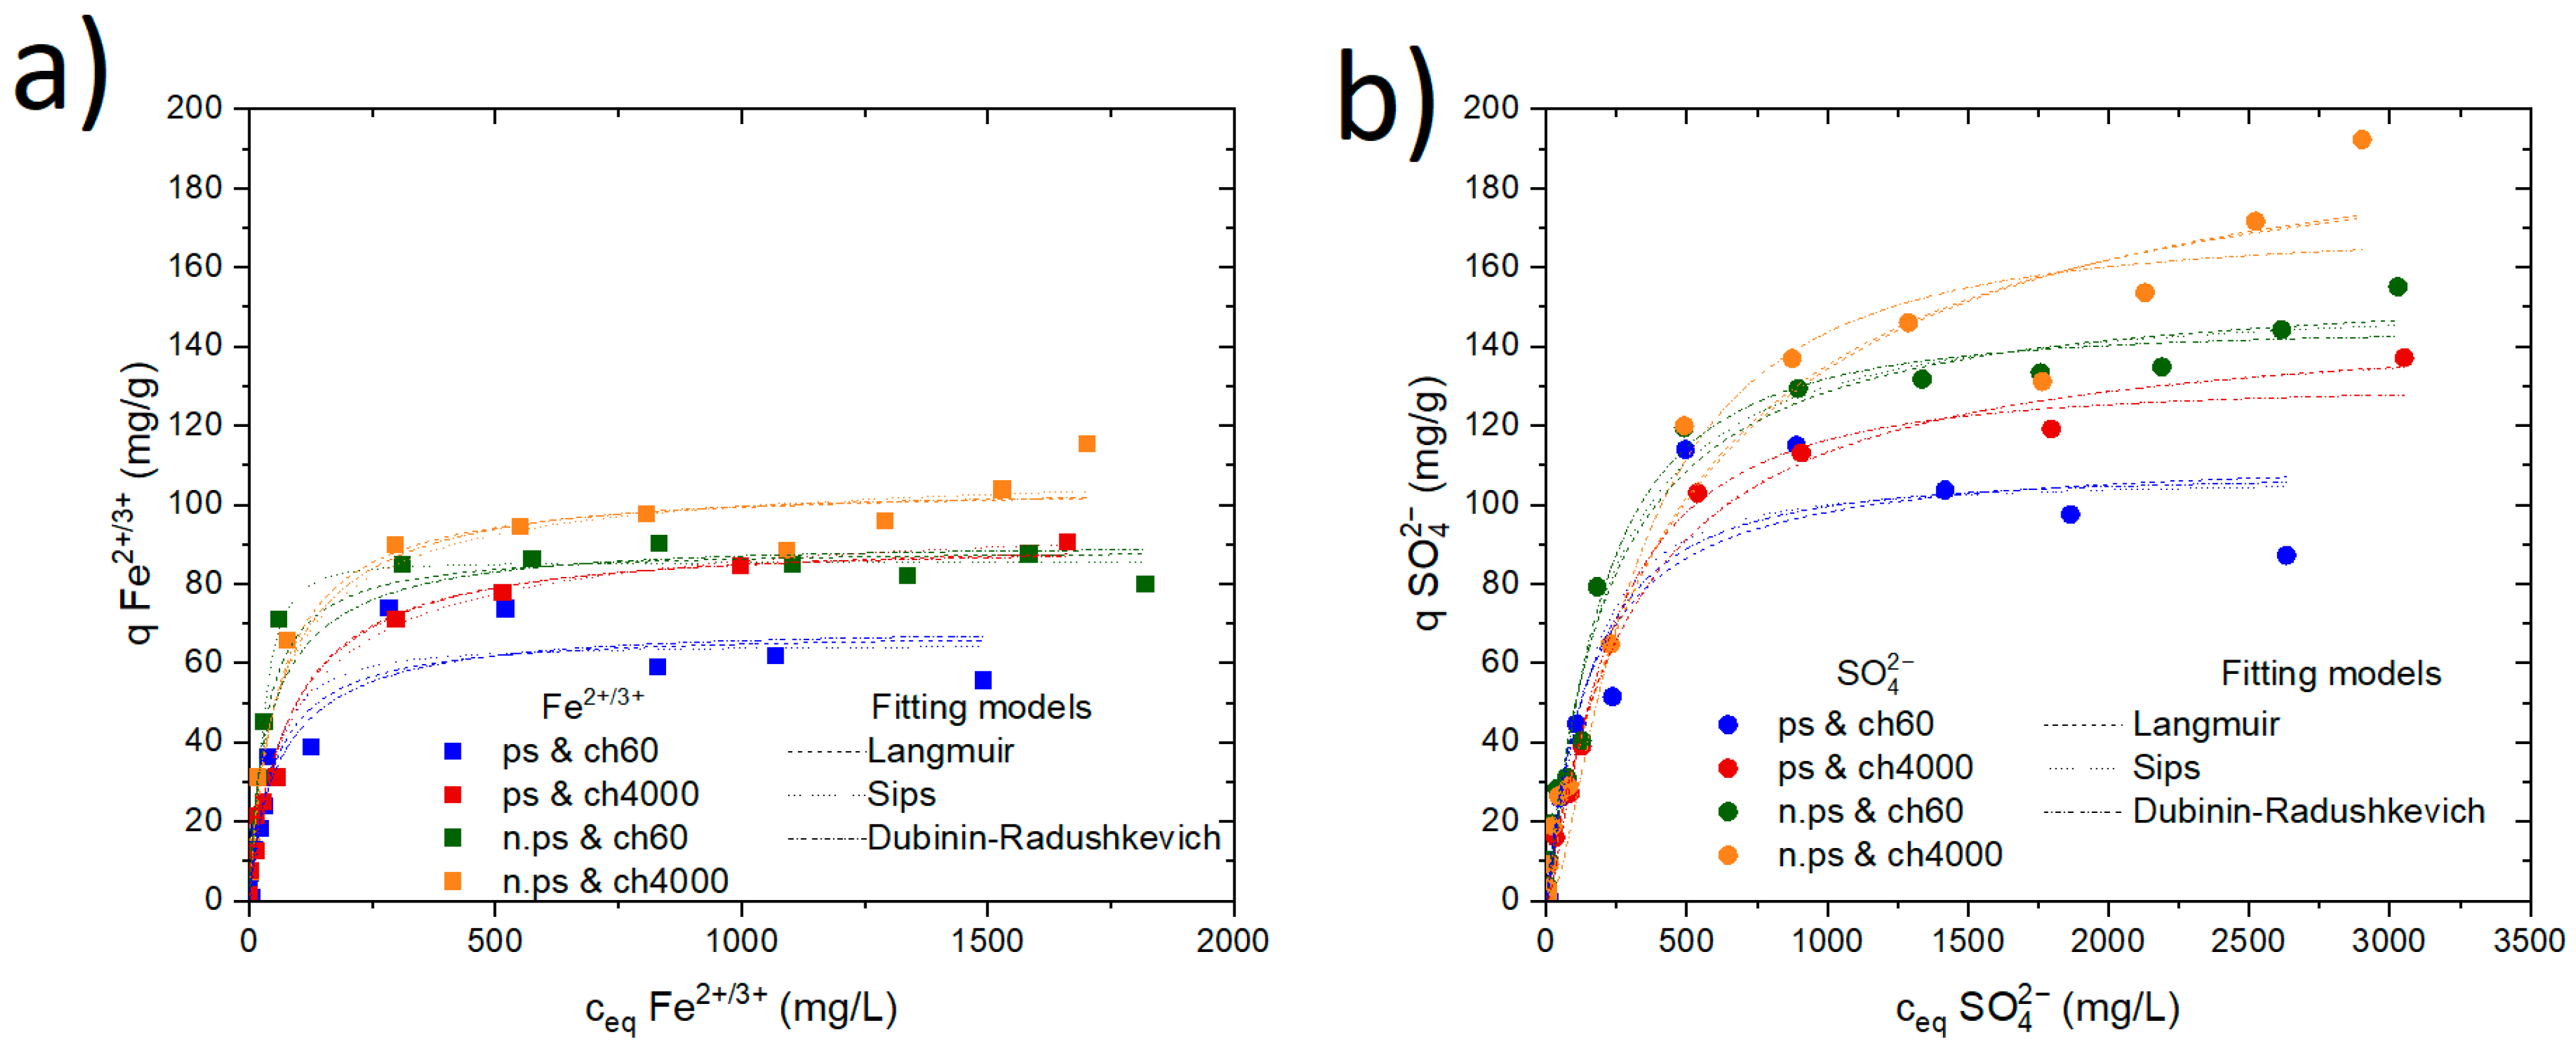
4.3. Adsorption Isotherm

5. Conclusions
Supplementary Materials
Author Contributions
Funding
Institutional Review Board Statement
Data Availability Statement
Acknowledgments
Conflicts of Interest
References
- Marsidi, N.; Abu Hasan, H.; Sheikh Abdullah, S.R. A Review of Biological Aerated Filters for Iron and Manganese Ions Removal in Water Treatment. J. Water Process Eng. 2018, 23, 1–12. [Google Scholar] [CrossRef]
- Rout, G.R.; Sahoo, S. Role of Iron in Plant Growth and Metabolism. Rev. Agric. Sci. 2015, 3, 1–24. [Google Scholar] [CrossRef]
- Geissler, C.; Singh, M. Iron, Meat and Health. Nutrients 2011, 3, 283–316. [Google Scholar] [CrossRef] [PubMed]
- Zak, D.; Hupfer, M.; Cabezas, A.; Jurasinski, G.; Audet, J.; Kleeberg, A.; McInnes, R.; Kristiansen, S.M.; Petersen, R.J.; Liu, H.; et al. Sulphate in Freshwater Ecosystems: A Review of Sources, Biogeochemical Cycles, Ecotoxicological Effects and Bioremediation. Earth Sci. Rev. 2021, 212, 103446. [Google Scholar] [CrossRef]
- Krasavtseva, E.; Gogoi, H.; Svetlov, A.; Leiviskä, T.; Makarov, D. Removal of Sulfate and Metals from Wastewater of a Mining Enterprise by a Dual Sorbent System: A Case Study. Mine Water Environ. 2023, 42, 200–208. [Google Scholar] [CrossRef]
- Weißpflog, J. Abtrennung von Schwermetall-und Oxyanionen aus wässrigen Lösungen Mithilfe von Biopolymeren. Ph.D. Thesis, Technische Universität Dresden, Dresden, Germany, 2022. [Google Scholar]
- Apriyanto, A.; Compart, J.; Fettke, J. A Review of Starch, a Unique Biopolymer—Structure, Metabolism and in Planta Modifications. Plant Sci. 2022, 318, 111223. [Google Scholar] [CrossRef] [PubMed]
- Boughanmi, R.; Borchert, K.B.L.; Steinbach, C.; Mayer, M.; Schwarz, S.; Svirepa, A.; Schwarz, J.; Mertig, M.; Schwarz, D. Native and Oxidized Starch for Adsorption of Nickel, Iron, and Manganese Ions from Water. Polysaccharides 2022, 3, 556–573. [Google Scholar] [CrossRef]
- Borchert, K.B.L.; Boughanmi, R.; Reis, B.; Zimmermann, P.; Steinbach, C.; Graichen, P.; Svirepa, A.; Schwarz, J.; Boldt, R.; Schwarz, S.; et al. Removal of Lead, Cadmium, and Aluminum Sulfate from Simulated and Real Water with Native and Oxidized Starches. Polysaccharides 2021, 2, 429–453. [Google Scholar] [CrossRef]
- Lim, C.; Lee, D.W.; Israelachvili, J.N.; Jho, Y.; Hwang, D.S. Contact Time- and PH-Dependent Adhesion and Cohesion of Low Molecular Weight Chitosan Coated Surfaces. Carbohydr. Polym. 2015, 117, 887–894. [Google Scholar] [CrossRef]
- Weißpflog, J.; Steinbach, C.; Schwarz, D.; Schwarz, S. Simultaneous Adsorption of Iron and Sulfate Ions with Biopolymers. In Proceedings of the 2nd World Congress on Civil, Structural, and Environmental Engineering, Barcelona, Spain, 2–4 April 2017; pp. 2–5. [Google Scholar] [CrossRef]
- Weißpflog, J.; Boldt, R.; Kohn, B.; Scheler, U.; Jehnichen, D.; Tyrpekl, V.; Schwarz, S. Investigation of Mechanisms for Simultaneous Adsorption of Iron and Sulfate Ions onto Chitosan with Formation of Orthorhombic Structures. Colloids Surf. A Physicochem. Eng. Asp. 2020, 592, 124575. [Google Scholar] [CrossRef]
- Weißpflog, J.; Vehlow, D.; Müller, M.; Kohn, B.; Scheler, U.; Boye, S.; Schwarz, S. Characterization of Chitosan with Different Degree of Deacetylation and Equal Viscosity in Dissolved and Solid State—Insights by Various Complimentary Methods. Int. J. Biol. Macromol. 2021, 171, 242–261. [Google Scholar] [CrossRef] [PubMed]
- Ramasubramaniam, S.; Govindarajan, C.; Nasreen, K.; Sudha, P.N. Removal of Cadmium (II) Ions from Aqueous Solution Using Chitosan/Starch Polymer Blend. Compos. Interfaces 2014, 21, 95–109. [Google Scholar] [CrossRef]
- Atangana, E.; Chiweshe, T.T.; Roberts, H. Modification of Novel Chitosan-Starch Cross-Linked Derivatives Polymers: Synthesis and Characterization. J. Polym. Environ. 2019, 27, 979–995. [Google Scholar] [CrossRef]
- Reis, B.; Gerlach, N.; Steinbach, C.; Carrasco, K.H.; Oelmann, M.; Schwarz, S.; Müller, M.; Schwarz, D. A Complementary and Revised View on the N-Acylation of Chitosan with Hexanoyl Chloride. Mar. Drugs 2021, 19, 385. [Google Scholar] [CrossRef] [PubMed]
- Wang, J.; Guo, X. Adsorption Kinetic Models: Physical Meanings, Applications, and Solving Methods. J. Hazard. Mater. 2020, 390, 122156. [Google Scholar] [CrossRef]
- Zhang, J. Physical Insights into Kinetic Models of Adsorption. Sep. Purif. Technol. 2019, 229, 115832. [Google Scholar] [CrossRef]
- Carrasco, K.H.; Höfgen, E.G.; Brunner, D.; Borchert, K.B.L.; Reis, B.; Steinbach, C.; Mayer, M.; Schwarz, S.; Glas, K.; Schwarz, D. Removal of Iron, Manganese, Cadmium, and Nickel Ions Using Brewers’ Spent Grain. Polysaccharides 2022, 3, 356–379. [Google Scholar] [CrossRef]
- Lagergren, S. Ueber Die Dämpfung Electrischer Resonatoren. Ann. Der Phys. 1898, 300, 290–314. [Google Scholar] [CrossRef]
- Ho, Y.S.; McKay, G. Pseudo-second order model for sorption processes. Process Biochem. 1999, 34, 451–465. [Google Scholar] [CrossRef]
- Gerente, C.; Lee, V.K.C.; Le Cloirec, P.; McKay, G. Application of Chitosan for the Removal of Metals from Wastewaters by Adsorption—Mechanisms and Models Review. Crit. Rev. Environ. Sci. Technol. 2007, 37, 41–127. [Google Scholar] [CrossRef]
- Langmuir, I. The Constitution and Fundamental Properties of Solids and Liquids. Part II.-Liquids. J. Frankl. Inst. 1917, 184, 721. [Google Scholar] [CrossRef]
- Sips, R. On the Structure of a Catalyst Surface. J. Chem. Phys. 1948, 16, 490–495. [Google Scholar] [CrossRef]
- Dubinin, M. The Equation of the Characteristic Curve of Activated Charcoal. Proc. USSR Acad. Sci. 1947, 55, 327–329. [Google Scholar]
- Song, X.; Zhang, Y.; Yan, C.; Jiang, W.; Chang, C. The Langmuir Monolayer Adsorption Model of Organic Matter into Effective Pores in Activated Carbon. J. Colloid Interface Sci. 2013, 389, 213–219. [Google Scholar] [CrossRef]
- Foo, K.Y.; Hameed, B.H. Insights into the Modeling of Adsorption Isotherm Systems. Chem. Eng. J. 2010, 156, 2–10. [Google Scholar] [CrossRef]
- Maciel, V.B.V.; Yoshida, C.M.P.; Franco, T.T. Chitosan/Pectin Polyelectrolyte Complex as a PH Indicator; Elsevier Ltd.: Amsterdam, The Netherlands, 2015; Volume 132, ISBN 5519404364. [Google Scholar]
- Dang, K.M.; Yoksan, R. Development of Thermoplastic Starch Blown Film by Incorporating Plasticized Chitosan. Carbohydr. Polym. 2015, 115, 575–581. [Google Scholar] [CrossRef]
- Jiménez-Regalado, E.J.; Caicedo, C.; Fonseca-García, A.; Rivera-Vallejo, C.C.; Aguirre-Loredo, R.Y. Preparation and Physicochemical Properties of Modified Corn Starch–Chitosan Biodegradable Films. Polymers 2021, 13, 4431. [Google Scholar] [CrossRef]
- Xu, Y.X.; Kim, K.M.; Hanna, M.A.; Nag, D. Chitosan-Starch Composite Film: Preparation and Characterization. Ind. Crops Prod. 2005, 21, 185–192. [Google Scholar] [CrossRef]
- Jiang, S.; Yu, Z.; Hu, H.; Lv, J.; Wang, H.; Jiang, S. Adsorption of Procyanidins onto Chitosan-Modified Porous Rice Starch. Lwt 2017, 84, 10–17. [Google Scholar] [CrossRef]
- Schwarz, S.; Steinbach, C.; Schwarz, D.; Mende, M.; Boldt, R. Chitosan—The Application of a Natural Polymer against Iron Hydroxide Deposition. Am. J. Anal. Chem. 2016, 07, 623–632. [Google Scholar] [CrossRef]
- Weißpflog, J.; Gündel, A.; Vehlow, D.; Steinbach, C.; Müller, M.; Boldt, R.; Schwarz, S.; Schwarz, D. Solubility and Selectivity Effects of the Anion on the Adsorption of Different Heavy Metal Ions onto Chitosan. Molecules 2020, 25, 2482. [Google Scholar] [CrossRef] [PubMed]
- Al-Ghouti, M.A.; Da’ana, D.A. Guidelines for the Use and Interpretation of Adsorption Isotherm Models: A Review. J. Hazard. Mater. 2020, 393, 122383. [Google Scholar] [CrossRef] [PubMed]
- Wang, J.; Guo, X. Adsorption Isotherm Models: Classification, Physical Meaning, Application and Solving Method. Chemosphere 2020, 258, 127279. [Google Scholar] [CrossRef] [PubMed]


| Element 1 | Element 2 | Ratio | Sample Code |
|---|---|---|---|
| Chitosan 90/60/A1 | - | - | ch60 |
| Chitosan 90/4000/A1 | - | - | ch4000 |
| Native potato starch | - | - | ps |
| Nano potato starch | - | - | n.ps |
| Chitosan 90/60/A1 | Native potato starch | 1:1 | ps & ch60 |
| Chitosan 90/4000/A1 | Native potato starch | 1:1 | ps & ch4000 |
| Chitosan 90/60/A1 | Nano potato starch | 1:1 | n.ps & ch60 |
| Chitosan 90/4000/A1 | Nano potato starch | 1:1 | n.ps & ch4000 |
| Sample | C (wt%) | H (wt%) | N (wt%) | Residue (wt%) |
|---|---|---|---|---|
| ch60 | 40.86 | 6.81 | 7.49 | 44.84 |
| ch4000 | 41.25 | 6.77 | 7.51 | 44.47 |
| ps | 38.32 | 5.32 | 0.0 | 56.36 |
| ps & ch60 | 41.01 | 6.63 | 3.63 | 48.73 |
| ps & ch4000 | 40.40 | 6.58 | 3.93 | 49.09 |
| n.ps & ch60 | 41.27 | 6.59 | 3.78 | 48.36 |
| n.ps & ch4000 | 40.82 | 6.54 | 3.42 | 49.22 |
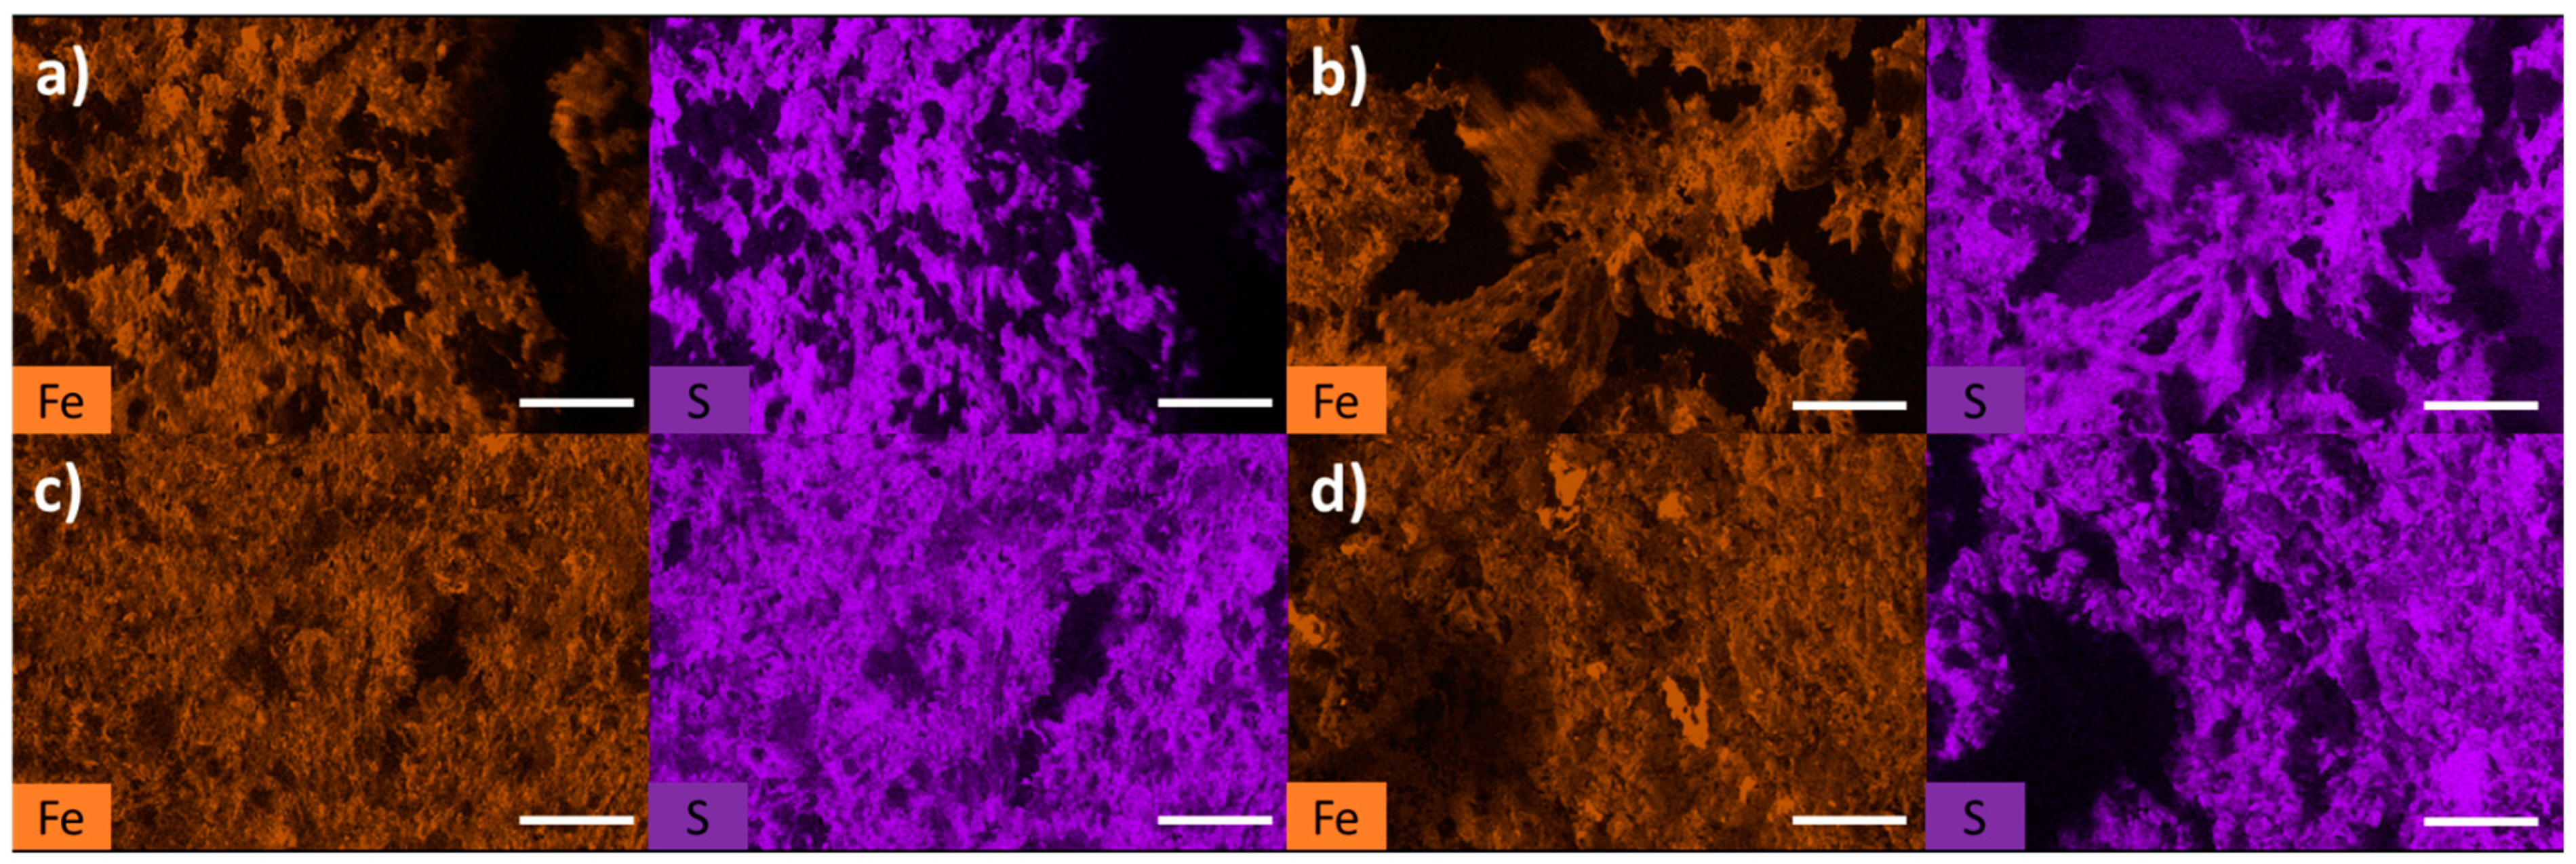
| Atomic Concentration | Fe (%) | S (%) | Molar Ratio Fe:S |
|---|---|---|---|
| ps & ch60 | 2.9 | 1.2 | 2.4 |
| ps & ch4000 | 5.04 | 1.58 | 3.18 |
| n.ps & ch60 | 2.64 | 1.93 | 1.36 |
| n.ps & ch4000 | 4.60 | 1.42 | 3.24 |
| Fe2+/3+ | SO42− | |||||||||||
|---|---|---|---|---|---|---|---|---|---|---|---|---|
| Kinetic Model | PFO | PSO | PFO | PSO | ||||||||
| Parameters | qeq (mg/g) | K (min−1) | R2 | qeq (mg/g) | K × 10−4 (mg/g.min) | R2 | qeq (mg/g) | K (min−1) | R2 | qeq (mg/g) | K × 10−4 (mg/g.min) | R2 |
| ps & ch60 | 72.70 | 0.009 | 0.771 | 77.45 | 1.83 | 0.837 | 100.72 | 0.009 | 0.822 | 108.34 | 1.20 | 0.851 |
| ps & ch4000 | 75.11 | 0.018 | 0.862 | 80.03 | 3.30 | 0.935 | 107.91 | 0.008 | 0.835 | 116.09 | 1.00 | 0.891 |
| n.ps & ch60 | 67.18 | 0.039 | 0.863 | 72.54 | 2.59 | 0.922 | 110.07 | 0.047 | 0.903 | 116.98 | 6.44 | 0.949 |
| n.ps & ch4000 | 68.53 | 0.032 | 0.924 | 75.26 | 1.12 | 0.967 | 112.21 | 0.045 | 0.942 | 121.07 | 5.33 | 0.977 |
| Sample | Model | Qm (mg/g) | K (L/mg) | ßDR × 10−9 (mol2/J2) | N | Eads,DR (KJ/mol) | R2 (COD) |
|---|---|---|---|---|---|---|---|
| ps & ch60 | Langmuir | 67.98 | 0.019 | -- | -- | 0.938 | |
| Sips | 64.60 | 0.006 | -- | 1.35 | -- | 0.944 | |
| Dubinin–Radushkevich | 68.26 | -- | 13.2 | -- | 61.5 | 0.933 | |
| ps & ch4000 | Langmuir | 91.65 | 0.013 | -- | -- | -- | 0.990 |
| Sips | 99.96 | 0.024 | -- | 0.80 | -- | 0.993 | |
| Dubinin–Radushkevich | 88.83 | -- | 15.86 | -- | 56.14 | 0.990 | |
| n.ps & ch60 | Langmuir | 89.05 | 0.031 | -- | -- | -- | 0.983 |
| Sips | 85.47 | 0.0034 | -- | 1.72 | -- | 0.995 | |
| Dubinin–Radushkevich | 89.79 | -- | 10.51 | -- | 68.94 | 0.972 | |
| n.ps & ch4000 | Langmuir | 104.98 | 0.017 | -- | -- | -- | 0.981 |
| Sips | 111.11 | 0.032 | -- | 0.809 | -- | 0.983 | |
| Dubinin–Radushkevich | 103.53 | -- | 13.32 | -- | 61.43 | 0.982 |
| Sample | Model | Qm (mg/g) | K (L/mg) | ßDR × 10−9 (mol2/J2) | N | Eads,DR (KJ/mol) | R2 (COD) |
|---|---|---|---|---|---|---|---|
| ps & ch60 | Langmuir | 113.28 | 0.006 | -- | -- | 0.936 | |
| Sips | 106.26 | 0.0012 | -- | 1.37 | -- | 0.943 | |
| Dubinin–Radushkevich | 107.32 | -- | 25.51 | -- | 44.26 | 0.942 | |
| ps & ch4000 | Langmuir | 148.89 | 0.003 | -- | -- | -- | 0.990 |
| Sips | 148.04 | 0.0029 | -- | 1.01 | -- | 0.991 | |
| Dubinin–Radushkevich | 130.23 | -- | 38.2 | -- | 36.17 | 0.982 | |
| n.ps & ch60 | Langmuir | 157.49 | 0.004 | -- | -- | -- | 0.987 |
| Sips | 153.1 | 0.002 | -- | 1.09 | -- | 0.988 | |
| Dubinin–Radushkevich | 144.81 | -- | 31.6 | -- | 39.74 | 0.985 | |
| n.ps & ch4000 | Langmuir | 201.63 | 0.002 | -- | -- | -- | 0.971 |
| Sips | 207.50 | 0.002 | -- | 0.95 | -- | 0.970 | |
| Dubinin–Radushkevich | 169.54 | -- | 56.3 | -- | 29.79 | 0.963 |
Disclaimer/Publisher’s Note: The statements, opinions and data contained in all publications are solely those of the individual author(s) and contributor(s) and not of MDPI and/or the editor(s). MDPI and/or the editor(s) disclaim responsibility for any injury to people or property resulting from any ideas, methods, instructions or products referred to in the content. |
© 2023 by the authors. Licensee MDPI, Basel, Switzerland. This article is an open access article distributed under the terms and conditions of the Creative Commons Attribution (CC BY) license (https://creativecommons.org/licenses/by/4.0/).
Share and Cite
Boughanmi, R.; Steinbach, C.; Gerlach, N.; Oelmann, M.; Beutner, C.; Schwarz, S. Ecological Sorption of Iron and Sulfate Ions onto Starch and Chitosan Biopolymer Blend. Polysaccharides 2023, 4, 325-342. https://doi.org/10.3390/polysaccharides4030019
Boughanmi R, Steinbach C, Gerlach N, Oelmann M, Beutner C, Schwarz S. Ecological Sorption of Iron and Sulfate Ions onto Starch and Chitosan Biopolymer Blend. Polysaccharides. 2023; 4(3):325-342. https://doi.org/10.3390/polysaccharides4030019
Chicago/Turabian StyleBoughanmi, Rahma, Christine Steinbach, Niklas Gerlach, Marina Oelmann, Christoph Beutner, and Simona Schwarz. 2023. "Ecological Sorption of Iron and Sulfate Ions onto Starch and Chitosan Biopolymer Blend" Polysaccharides 4, no. 3: 325-342. https://doi.org/10.3390/polysaccharides4030019