Review

pH Effects on the Conformations of Galacturonan in Solution: Conformational Transition and Loosening, Extension and Stiffness †

Department of Life Sciences, University of Trieste, 34127 Trieste, Italy
*
Author to whom correspondence should be addressed.
This paper is dedicated to the memory of Rudolf Kohn, a pioneer in the study of galacturonic acid-containing polysaccharides.
Polysaccharides 2023, 4(3), 271-324; https://doi.org/10.3390/polysaccharides4030018
Submission received: 20 July 2023 / Revised: 18 August 2023 / Accepted: 24 August 2023 / Published: 8 September 2023

Abstract

:
Calorimetric (from both isothermal micro-calorimetry and DSC), chiro-optical, viscometric and rheological data on aqueous solutions of pectic acid and low-methoxyl pectin (LMP), published over decades from different laboratories, have been comparatively revisited. The aim was to arrive at a consistent and detailed description of the behavior of galacturonan as a function of pH, i.e., of the degree of charging (as degree of dissociation, α) of the polyanion. The previously hypothesized pH-induced transition from a 31 to a 21 helix was definitely confirmed, but it has been shown, for the first time, that the transition is always coupled with loosening/tightening effects brought about by an increase in charge. The latter property has a twofold effect: the former effect is a purely physical one (polyelectrolytic), which is always a loosening one. However, in the very low range of pH and before the beginning of the transition, an increase in charge tightens the 31 helix by strengthening an intramolecular—but inter-residue—hydrogen bond. The value of the enthalpy change of 31 → 21 transition—+0.59 kcal·mol−1—is bracketed by those provided by theoretical modeling, namely +0.3 and +0.8 kcal·mol−1; the corresponding entropy value is also positive: +1.84 cal·mole r.u.−1·K−1. The enthalpic and the entropic changes in chain loosening amount only to about 23% of the corresponding 31 → 21 changes, respectively. Much like poly(galacturonic acid), the 31 conformation of LMP also stiffens on passing from pH = 2.5 to 3.0, to then start loosening and transforming into the 21 one on passing to pH = 4.0. Lowering the pH of a salt-free aqueous solution of LMP down to 1.6 brings about a substantial chain–chain association, which is at the root of the interchain junctions stabilizing the acid pH gels, in full agreement with the rheological results. A comparison of the enthalpic data reveals that, at 85 °C, LMP in acidic pH conditions has lost its initial order by about 2.3 times more than pectic acid brought from low charging to full neutralization (at α = 1.0) at 25 °C. A proper combination of experiments (enthalpic measurements) and theory (counterion condensation polyelectrolyte theory) succeeded in demonstrating, for the first time ever, a lyotropic/Hofmeister effect of the anion perchlorate in stabilizing the more disordered form of the 21 helix of galacturonan. The viscometric results in water showed that the 31 helix is capable of forming longer rheologically cooperative units compared with the 21 helix. Extrapolation to infinite ionic strength confirmed that, once all electrostatic interactions are cancelled, the elongation of the two helical forms is practically the same. At the same time, however, they indicated that the flexibility of the two-fold helix is more than fifteen times larger than that of the three-fold one. The result is nicely corroborated by a critical revisiting of 23Na relaxation experiments.

Graphical Abstract

1. Introduction

1.1. Conformational Transitions: Helices and Coils

A conformational change in (linear) polysaccharides in solution has been often—more or less explicitly—assumed as a transition between two limiting cases, namely from/to an ordered to/from a disordered conformation.
The ordered conformations of carbohydrate polymers—in analogy with proteins and nucleic acids—were successfully interpreted with the concept of helix [1,2,3]. For that, evidence has long since been provided by solid state investigations (albeit not unfrequently revisited). They were certainly favored by the terrific advancements brought about by the study of proteins, polypeptides and nucleic acids at the end of the 1940s and the beginning of the 1950s. In many cases, such helical conformations were found to be at the root of interchain junctions in hydrated physical gels, besides, obviously, constituting the solid-state fibers analyzed using crystallographic methods. Regular 31 and 21 helices were proposed for poly(galacturonic acid) (and salts) on the basis of experimental [2,4,5,6,7,8], theoretical modeling [9,10] or mixed [11,12] approaches. In spite of the difference in geometry, the two helical conformations show very similar values of the projection of the galacturonic repeating unit on the chain axis, b0, namely 4.33 Å for the former helix and 4.35 Å for the latter one, with a difference of 0.46% [2,4,8,11].
On the other side, the prevailing disordered conformational model in solution was that of the coil, conformationally disordered to different extents up to the limit of the random coil. Perhaps, this was due to the influence of the initially accepted views on the final state of the thermally induced transitions of both proteins [13,14] and nucleic acids [15,16] and of the behavior of the much studied flexible synthetic polymers (e.g., polyolefins, polyesters…). The behavior of flexible polysaccharides, like dextran, in solution could be well interpreted as that of a coil, although the comment made by Myer for polypeptides seems perfectly valid for polysaccharides as well: “A note of caution is further called for when speaking of “random” or “disordered” or “uncoiled” forms of polypeptides, since the conformation, and thus the optical parameters, can vary with size of polymer as well as conditions” [17].

1.2. The Loose Helix

The theme of “partial order” has often been present in the discussion of the conformation of (linear) polysaccharides in solution only as a featureless, intermediate step in the two-state transition between those two limiting cases. Still, the conformation of some polysaccharides of significant flexibility in solution, like amylose, were shown not to be fully coiled at random. Between the end of the 1970s and the beginning of the 1980s advancements in modeling approaches revealed a “randomly coiling [amylose] chain possessing perceptible regions of left-handed pseudo-helical backbone trajectory” [18] with a “persistent pseudo-helical character” [19]. The past fifty years have seen a lively discussion on the fundamental ordered conformation of algal galactans. The alleged double helical conformation proposed on the basis of X-ray fiber diffractograms [20] for agarose was later questioned by more accurate crystallographic investigations [21]. Those studies convincingly indicated the single helix as the most likely ordered conformation at the root of chain ordering upon cooling, which is a prerequisite for subsequent chain–chain associations, junction formation and gelation [3]. Guenet, with Rochas et al. [22], undertook solution studies that produced results that “lead one to a reappraisal of the occurrence of double helices in the gelation process, as they rather suggest a transition of the type loose-single helix → tight single helix” [23]. Guenet had proposed the novel concept of “loose helix”, applying it—at first—to the solution behavior of agarose; it envisaged “a near-helical structure for which atomic position correlations vanish rapidly compared with those for a tight helix” [24].

1.3. The Case of Galacturonan

In a recent work on the modes of binding of calcium ions by sodium poly(galacturonate), various experimental results, in particular the combined evidence of microcalorimetric and chiro-optical data, led the authors to identify a “loose” 21 helix as the conformation of sodium pectate in salt-containing aqueous solutions [25]. This is in full agreement with the statements made by Cros et al. that “… homogalacturonan chains adopt extended conformations having a low probabilities of folding, a feature that may be largely attributed to the axial-axial glycosidic linkage… Furthermore, all low energy conformers in this single energy well generate extended conformation. The homogalacturonan macromolecule therefore tends to adopt a pseudo helical conformation even in its disordered state” [26], further supported by Pérez et al., reporting that: “The homogalacturonan macromolecule therefore tends to adopt a pseudo-helical conformation even in its disordered state” [27]. This proposed conformation would easily explain the “conformational ordering propensity” of pectate upon interaction with monovalent (e.g., H+) [7,28,29] or divalent (e.g., Ca2+, Cu2+, Pb2+) ions [28,30]. All in all—and as a peculiar case among ionic polysaccharides—a 0% → 100% change in electrical charging seems to make galacturonan in aqueous solution oscillate between two limit conformations (a 31 and a 21 helix [7,29]), both modulated—albeit to a different extent—by an over imposed “loosening” of the respective conformational ordering.
Before proceeding further, it is useful to recall the nomenclature of (galacturonic acid)-containing polymers, e.g., as set out by Guidugli et al.: “Pectins are operationally grouped into low-methoxyl-pectins (LMP) and high-methoxyl-pectins (HMP), the degree of methylation marking the difference ranging from 40% to 50% depending upon the authors. Often, and depending upon the context, the pectin and pectate words refer to the salt form of HMP and very low LMP, respectively, and pectinic acid and pectic acid to the corresponding acid forms, respectively. Similarly, the term poly(galacturonic acid) (galacturonan) refers not only to the “perfect” homopolymer, but also to linear GalA-polymers, interspersed with neutral sugars and/or esterified GalA residues, altogether for not more than about 10%” [31]. Hereafter, the terms galacturonan, poly(galacturonic acid) and pectic acid (or sodium pectate or poly(galacturonate) at neutral pH) will be indifferently used in relation to the results obtained with the samples of the works by Ravanat and Rinaudo [7] and by Cesàro et al. [29], given their composition. LMP and pectinic acid terms will be used for the partially methyl-esterified sample of Gilsenan et al. [32].

1.4. Experimental Approaches to the Conformational Transition of Galacturonan

The physical chemical properties of biopolyelectrolytes depend on several variables. However, the main ones are certainly the degree of charging (linear charge density), the ionic strength of the medium (I) and the temperature (T). For weak polyacids—like pectic acid—the controlled variation of the former variable can be achieved by modifying the degree of dissociation, α, of the uronic acid function. Increasing the concentration of the supporting low Molecular Weight (MW) electrolyte (sometimes called the “simple salt”) is the correct way of controlling the ionic strength of the medium, and, thereby, the extent of the long-range electrostatic interactions (also represented as an interaction scale—measured by the Debye length, κ−1). Finally, the absolutely crucial role of temperature, which act as a “lever” of any entropy variation, can never be dismissed.
This work is largely based on experimental data from three laboratories, which—for more than forty years—have been the only ones that span over the whole range of pH, from acidic to neutral, and over a range of values of ionic strengths [7,29,30], or, at different pH values, in a temperature range as wide as between 10 °C and 85 °C [32].
A renewed interest in the conformations of galacturonan [33,34,35] and for its “loose” helix [25] is at the root of the present revisiting of the data. Previously to Donati et al. [25], the possibility that a “loose” helix was the solution conformation of sodium pectate had been clearly set forth only in the quoted theoretical studies [26,27], and, at least partially, in only one experimental work [36].
This analysis will start from the dilute polymer concentration conditions not because it was refrained a priori from investigating the physical chemical properties of galacturonan in massively associating conditions (e.g., those of gel formation). Rather, it was desired to tackle—as a conceptual preliminary step—the problem of unveiling the molecular details of the conformations of the isolated polymer chain in the different conditions, like pH, polymer concentration, ionic strength, temperature, and the presence of specific counterions. Such conditions are considered as prerequisites that, only eventually and also to a varying extent, lead to a reversible chain association. This strategy was followed in the chiro-optical investigations [7,29], as well as in the microcalorimetric ones [29], on the conformational transition of pectic acid as a function of pH; they all were carried out in a range of low polymer concentrations (namely, in the order of g·L−1). In such conditions, the intramolecular character of the pH-induced transition of a very pure sample of pectic acid in dilute solution was clearly demonstrated through light scattering [37] and osmotic pressure experiments [25,30]. In fact, only a tenfold increase in polymer concentration (in the order of % w/w) was able to give rise, at low pH, to intermolecular association—as shown by light scattering data [38]—and gelation, as extensively analyzed by the work of Gilsenan et al. on LMP [32]. The parallel thermodynamic interpretation of the various results from IsoThermal micro (μ) Calorimetry (ITμC) [29,30] and those from Differential Scanning Calorimetry (DSC) [32], together with the rheological results of the latter paper [32], enable the encompassing of the microscale and the macroscale, providing a molecular basis for the macroscopic behavior.

1.5. The Coupling of the Conformational Changes of Galacturonan

This work was undertaken with two goals: the first one is that of getting some better insight into the helical conformations of pectic acid, namely the 31 helix at acidic pH values and 21-helical conformation at full ionization, in the sodium salt form (neutral pH). These correspond to the limits of the demonstrated polymorphic phase transition upon passing from dried to hydrated calcium poly(galacturonate) gel [4,39]. The second one, which is not less important, is to unravel the interplay of the inter-conformational (31 → 21) transition with the “loosening” of the helical forms, particularly so the two-fold one. The conformational scenario seems to differentiate poly(galacturonate) from the otherwise similar case of poly(guluronate). For the latter polyuronate, no evidence of quasi-ordered remnants have been reported so far for its sodium salt at neutral pH nor of the existence of a conformational transition induced by pH between two helical conformations.
An important remark is mandatory in relation to the way each change in charge density is achieved in pectin systems. Although the correct way is obviously to act on pH, given the weak acid nature of constituent galacturonic acid, the possibility of reducing the charge-per-chain by methoxyl esterification has been exploited in a number of cases [9,10,40]. Unfortunately—as clearly shown recently [31]—the two methods are not equivalent at all, the latter one likely inducing incorrect conclusions on the correlation between, e.g., macroscopic properties and charge density.
Scheme 1 sketches the well-defined conformational 31 → 21 equilibrium with an over imposed continuous shift from a tightened, toward a loosened, conformation of galacturonan. It will be shown in the following that two processes can be achieved and modulated by an increase in charge density (as α), in ionic strength (as [NaClO4]), or of temperature, or by combinations thereof.

1.6. Specific Effects of Ions on the Conformation of Galacturonan

Several reports have shown that the addition of electrolytes increases the gel strength of LMP. In particular, this beneficial effect—of equimolar solutions in the tenth-molar range—followed the order K+ > Na+ > Li+, demonstrating the presence of the specific effects of alkali cations, particularly so at low pH values [42,43,44]. The conditions of very low polyanion charging make it difficult to invoke specific counterion binding effects; rather, also considering the range of salt concentration, it seems more likely that lyotropic [45] (or Hofmeister [46]) effects are involved, with the quoted order being that of decreasing chaotropic character.
Among the whole of the revisited results, those obtained in salt conditions were in the presence of NaClO4. At variance with the case of κ-carrageenan, in which a clear specific affinity by the sulfated galactan for the I ion was demonstrated [47] (and—to a lesser extent—also for Br and Cl) [48], there is no evidence whatsoever reported so far of a specific interaction between the perchlorate anion and the pectate polyanion. Therefore, any detected anomaly of behavior with that salt would suggest, for the first time, the presence of a lyotropic or Hofmeister effect.

1.7. Hydration of Galacturonan

A large positive volume change accompanies the binding of Ca2+ ions by pectate, stemming from the release of up to 16 molecules of water from the hydration spheres of both counterion and polyelectrolyte [30]. They produce a very large increase in entropy, which is the driving force for the strong calcium bonding [25]. Also, in the case of protonation of Na+ pectate, a positive volume change was measured [29], corresponding to the release of 7.8 molecules of hydration from the interacting partners, in perfect agreement with the predictions from the modeling [31]. However, very interestingly, no α-dependence was observed of the intrinsic volume change in dissociation, in particular in the range of the pH-induced conformational 31 → 21 transition. This means that the overall hydration of the two ordered conformations is the same—within error—and also that any conformational loosening taking place upon increasing the charge density would not affect the hydration sphere of galacturonan (interestingly, the reported nil value of volume change upon transition, Δ V ¯ t r , is paralleled by the practically nil change in the helical pitch of the two conformations). The finding that Δ V ¯ t r = 0 is at variance with the case of the temperature-induced conformational transition of both poly(glutamic acid) (PGA) and of DNA. In the former case, osmotic stress experiments indicated that the more compact α-helical state was favored over the more hydrated coil state. The number of molecules of hydration water (per residue) released in the coil → helix transition was 3.6 ± 0.8 from experiment and 4.9 from the theoretical calculation of the solvent-accessible surface (SAS) area, in “close agreement” [49]. In the latter case “the favorable folding of each DNA molecule results from the formation of base-pair stacks and uptake of both counterions and water molecules [as shown by] the negative ΔnW values [which] indicate an average uptake of 4–5 water molecules per base-pair, similar magnitude (~4 water molecules) is observed with the ST[Salmon Testes]-DNA polymer” [50]. It is very likely that the different behavior is to be ascribed to the absence of hydrophobic residues in galacturonan.
It can therefore concluded that, in the case of galacturonan, all the measured changes in internal energy (as ΔH) and in entropy upon transition must be attributed to variations in the absolute values of both the accessible minima and in their extension in the conformational energy space of the galacturonan backbone, without affecting the overall hydration of the chain.

2. The Charge-Induced Conformational Transition of Galacturonan

2.1. Viscometric and Potentiometric Data

The variations in the hydrodynamic and the thermodynamic (potentiometric) properties of galacturonan as a function of the degree of dissociation, α, both in “water” and in “salt”, have been reported in Figure 1: (a) reduced specific viscosity ( η s p C p = η red ); (b) apparent pKa, (pKa)app.; all redrawn data have been taken from reference [29]. Cp is the concentration of pectic acid in mole of repeating unit, r.u., per liter.
For polyelectrolytes, the deviations from the monotonic behavior of all the quoted properties has been interpreted as stemming from a pH-induced conformational transition [29]. The reduced viscosity sigmoid curves, similar to those in Figure 1a, have been repeatedly used as indicators of a conformational transition [51,52], revealing its effects at the whole-chain level. Likewise, the same type of deviation of the (pKa)app. (α) curves ((pKa)app(α) = pH + log[(1 − α)/α]) has been found to accompany those conformational transitions [53,54], albeit sometimes with less marked variations because of partial enthalpy/entropy compensations [55], as presently found in the case of pectate. The hydrodynamic and thermodynamic properties easily allow assigning the limits of the transition: in the absence of low MW electrolytes (hereafter: in “water”), the lower one is α2 = 0.22 (in blue); the one marking the transition end is α3 = 0.60 (in red) and α1 is the value of self-dissociation, namely the lowest value of α of the polyacid in an aqueous salt-free solution without the addition of titrant. The interval of α corresponding to the conformational transition, δ αtr, in “water”, is then as follows: δ αtr–≡ α3 − α2. Three regions can then be determined: Region I from α = 0 to α2, Region II from α2 to α3 (corresponding to δ αtr) and Region III from α3 to α = 1.
It is well known that an increase in I causes a decrease in the reduced viscosity of a polyelectrolyte [52]; this is clearly shown for pectate by the ηred data of Figure 1a in aqueous NaClO4 0.05 M (hereafter: “salt”). Likewise, increasing the ionic strength, I, produces a general effect of increase in the acidity of the polyacid in solution, manifesting as a decrease in both pH and (pKa)app and an increase in the (initial) self-dissociation, α1. This effect materializes when comparing the results of Figure 1b. In particular, the ionic strength-induced increment of acidity shifts the initial value of (pKa)app from 3.89 (“water”) to 3.40 (“salt”), having recorded the corresponding changes of pH from 3.12 to 2.91 and those of the value of self-dissociation of the polyacid (α1) from 0.145 to 0.242. In full analogy with the case of Figure 1a, those properties can be used for the determination of the limits of the conformational transition in “salt”; the lower one is α2 = 0.34 and the one marking the transition end is α3 = 0.70, with a difference (transition width, δ αtr) of 0.36. Interestingly, the increase in ionic strength shifts both α2 and α3 to higher values, but the width of the transition seemingly remains essentially unaffected (in “water”: δ αtr = 0.38). The ηred (α) curve seems to be the most largely affected by changing the ionic strength, in particular with a marked flattening of the curve over the whole range of α; the relative increase in ηred from the lowest value of α to the largest one is +127% in “water” vs. +21% in NaClO4 0.05 M. In fact, the increase in ηred with α in “salt” is much smaller than in “water”, over the whole investigated range of α.

2.2. Isothermal Micro-Calorimetric Data in Aqueous NaClO4

As for the other thermodynamic parameters of the transition, it was decided to numerically revisit in the present paper only the enthalpic parameters related to the dissociation of pectate and revealing the transition, given the peculiar experimental results of the ITμC micro-calorimetric data. For the case of pectate in 0.05 M NaClO4, the values of the enthalpy change upon dissociation, Δ H ¯ diss ( α ) , (normalized—as usual—per mole of dissociating group, i.e., per equivalent) are reported in Figure 2a. The corresponding entropy of dissociation, Δ S ¯ diss ( α ) , are reported in Figure 2b. For a detailed analysis of the Δ G ¯ diss ( α ) data—from (pKa)app (α) in Figure 1b as: Δ G ¯ diss ( α ) = 2.303·R·T·(pKa)app (α)—and of the derived curves of Δ S ¯ diss ( α ) —trivially as Δ S ¯ diss ( α ) = Δ H ¯ diss ( α ) Δ G ¯ diss ( α ) T —the reader is referred to the original paper [29]. As has already been highlighted, the two “bumps” in the Δ H ¯ diss ( α ) and Δ S ¯ diss ( α ) curves perfectly encompass the transition range. However, inspection of Figure 2 reveals that the excess areas of the Δ H ¯ diss and Δ S ¯ diss curves, conventionally attributed to the transition, actually extend beyond both the blue and the red limits of the conformational change (δ αtr). The range of α between the values of start (αi) and end (αf) of the calorimetric “bump”, δ αconf, is larger than that of the previously defined conformational transition: δ αconf > δ αtr. The values of αi and αf have been indicated (as purple vertical segments) in Figure 2: αi = 0.17 and αf = 0.87, with δαtr = 0.70.
For the calculation of the enthalpy changes in the transition, we resorted to well-known procedures. Both synthetic poly(carboxylic acids) (e.g., poly(acrylic acid), PAA [56]) and natural ones (e.g., alginate [57]) show a “well-behaving” (a “no-bump”) dependence of Δ H ¯ diss on α. In the case of pH-induced conformational transitions, the area of the bump-shaped deviations (very often endothermic) from such a “smoothly-behaving” baseline allows for the determination of the thermodynamic parameters of transition [56,58]. Accordingly, the values of the areas between “bump” and baseline (Figure 2) were taken as corresponding to that of the overall variations of enthalpy, Δ H ¯ tr excess , and entropy, Δ S ¯ tr excess , upon transition, calculated over the whole deviation range δ αtr [29]. Their integral values (i.e., normalized per mole of repeating unit, r.u.), calculated as Δ H ¯ tr excess ( α ) = α 1 α = 1 Δ H ¯ diss ( α ) · d α ) and as Δ S ¯ tr excess ( α ) = α 1 α = 1 Δ S ¯ diss ( α ) · d α ), have been reported in Figure 2a,b, respectively. The re-calculated values of Δ H ¯ tr excess and Δ S ¯ tr excess over the δ αconf range from the numerically reproduced curves (Figure 2) were found to be in exceptional agreement with the original values (see Table 1). The intermediate values of Δ H ¯ tr excess ( α ) and Δ S ¯ tr excess ( α ) at the intermediate values of α from α1 to α = 1.0 have been reported in Supplementary paragraph 1.

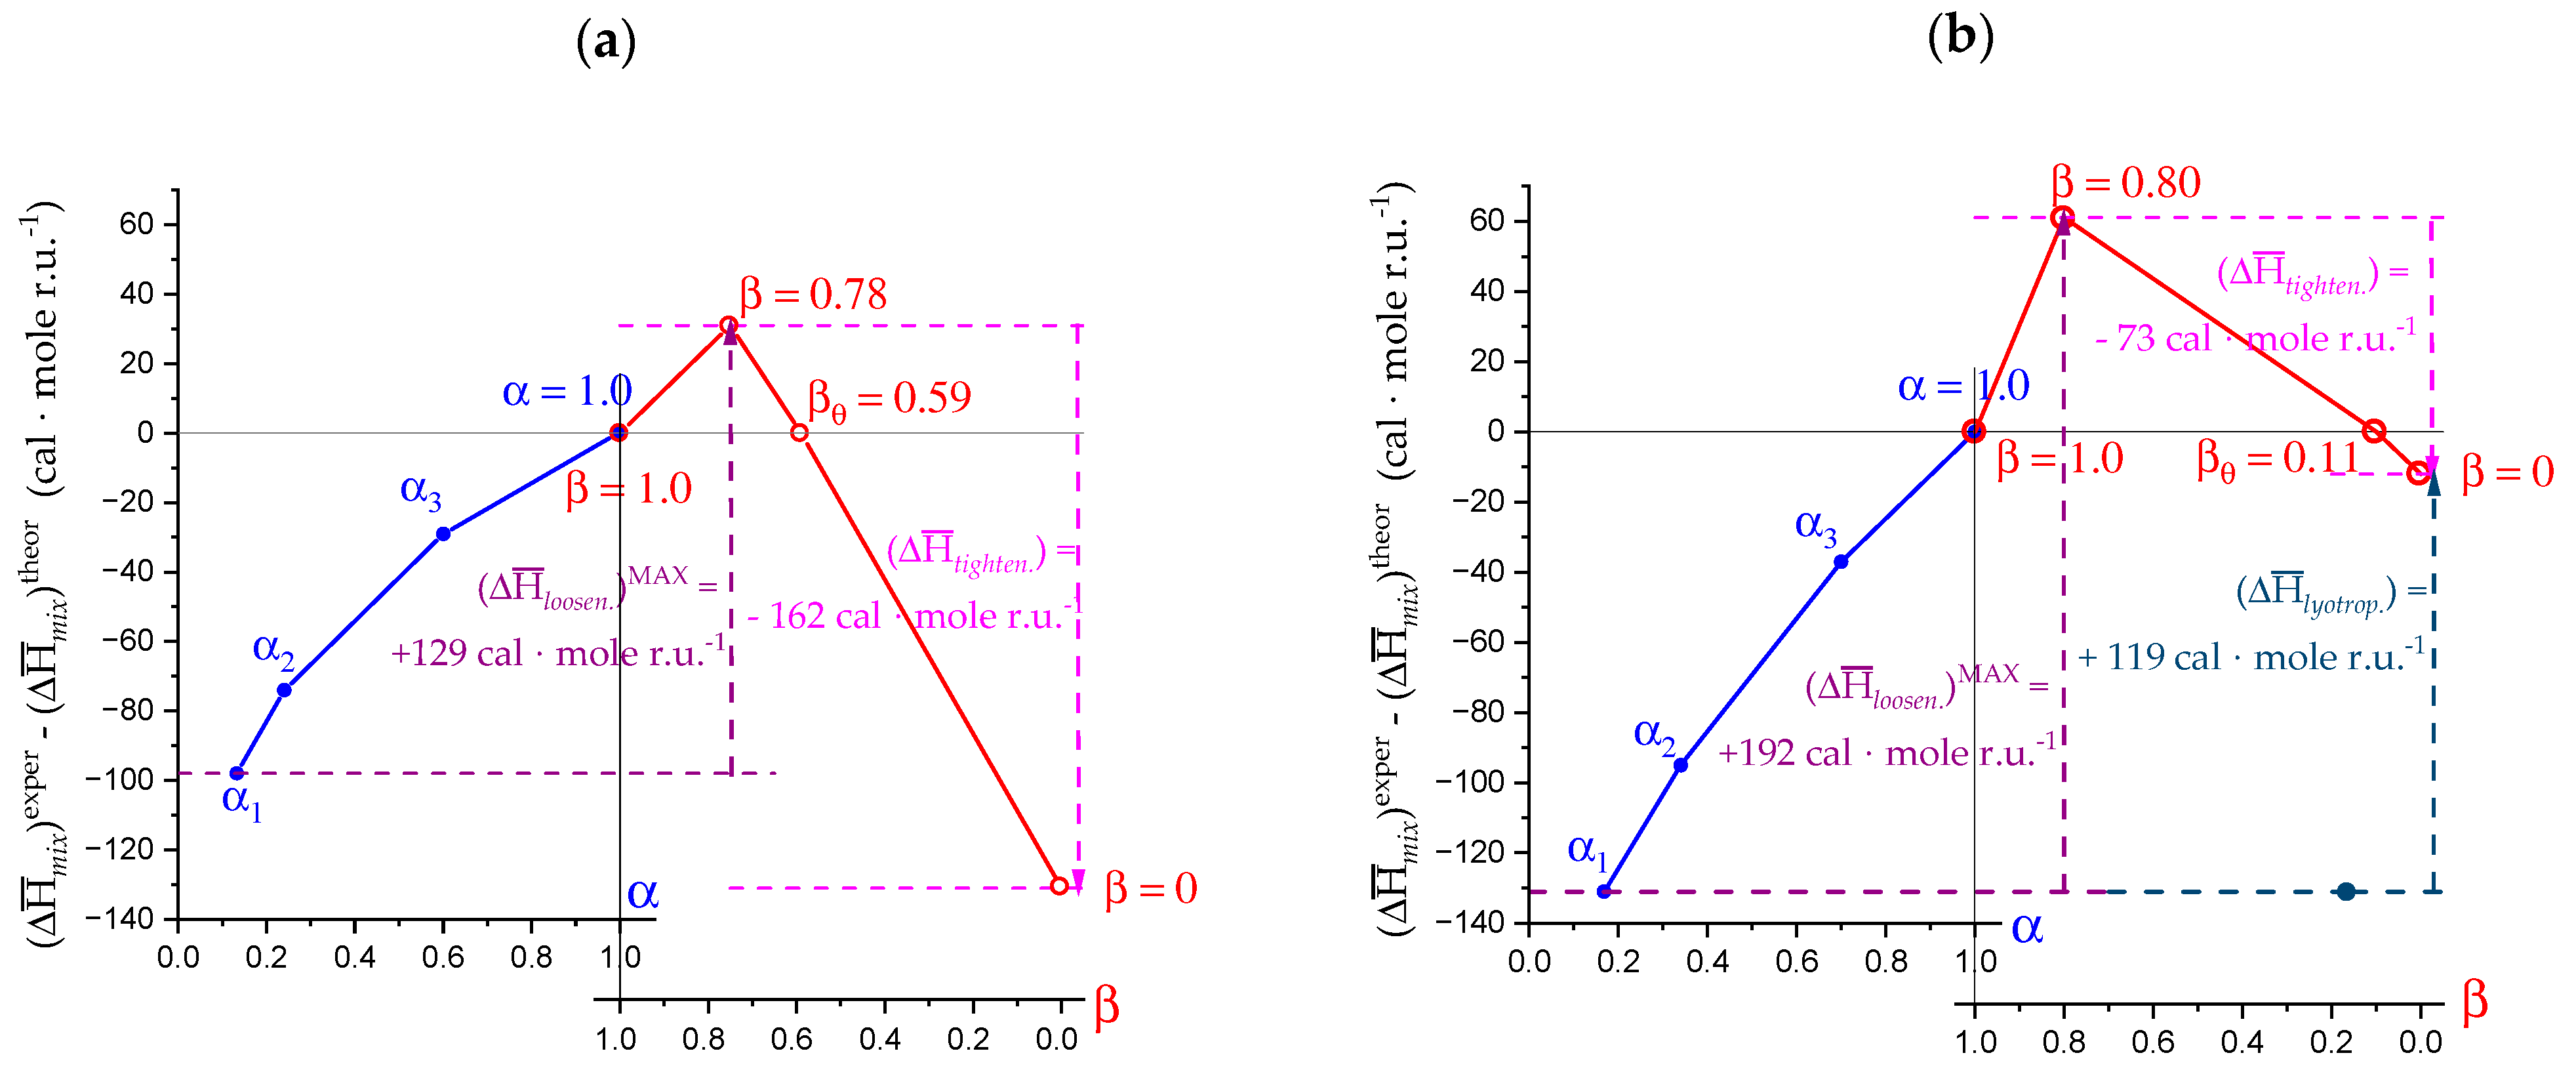
2.3. Decoupling of the Conformational Changes
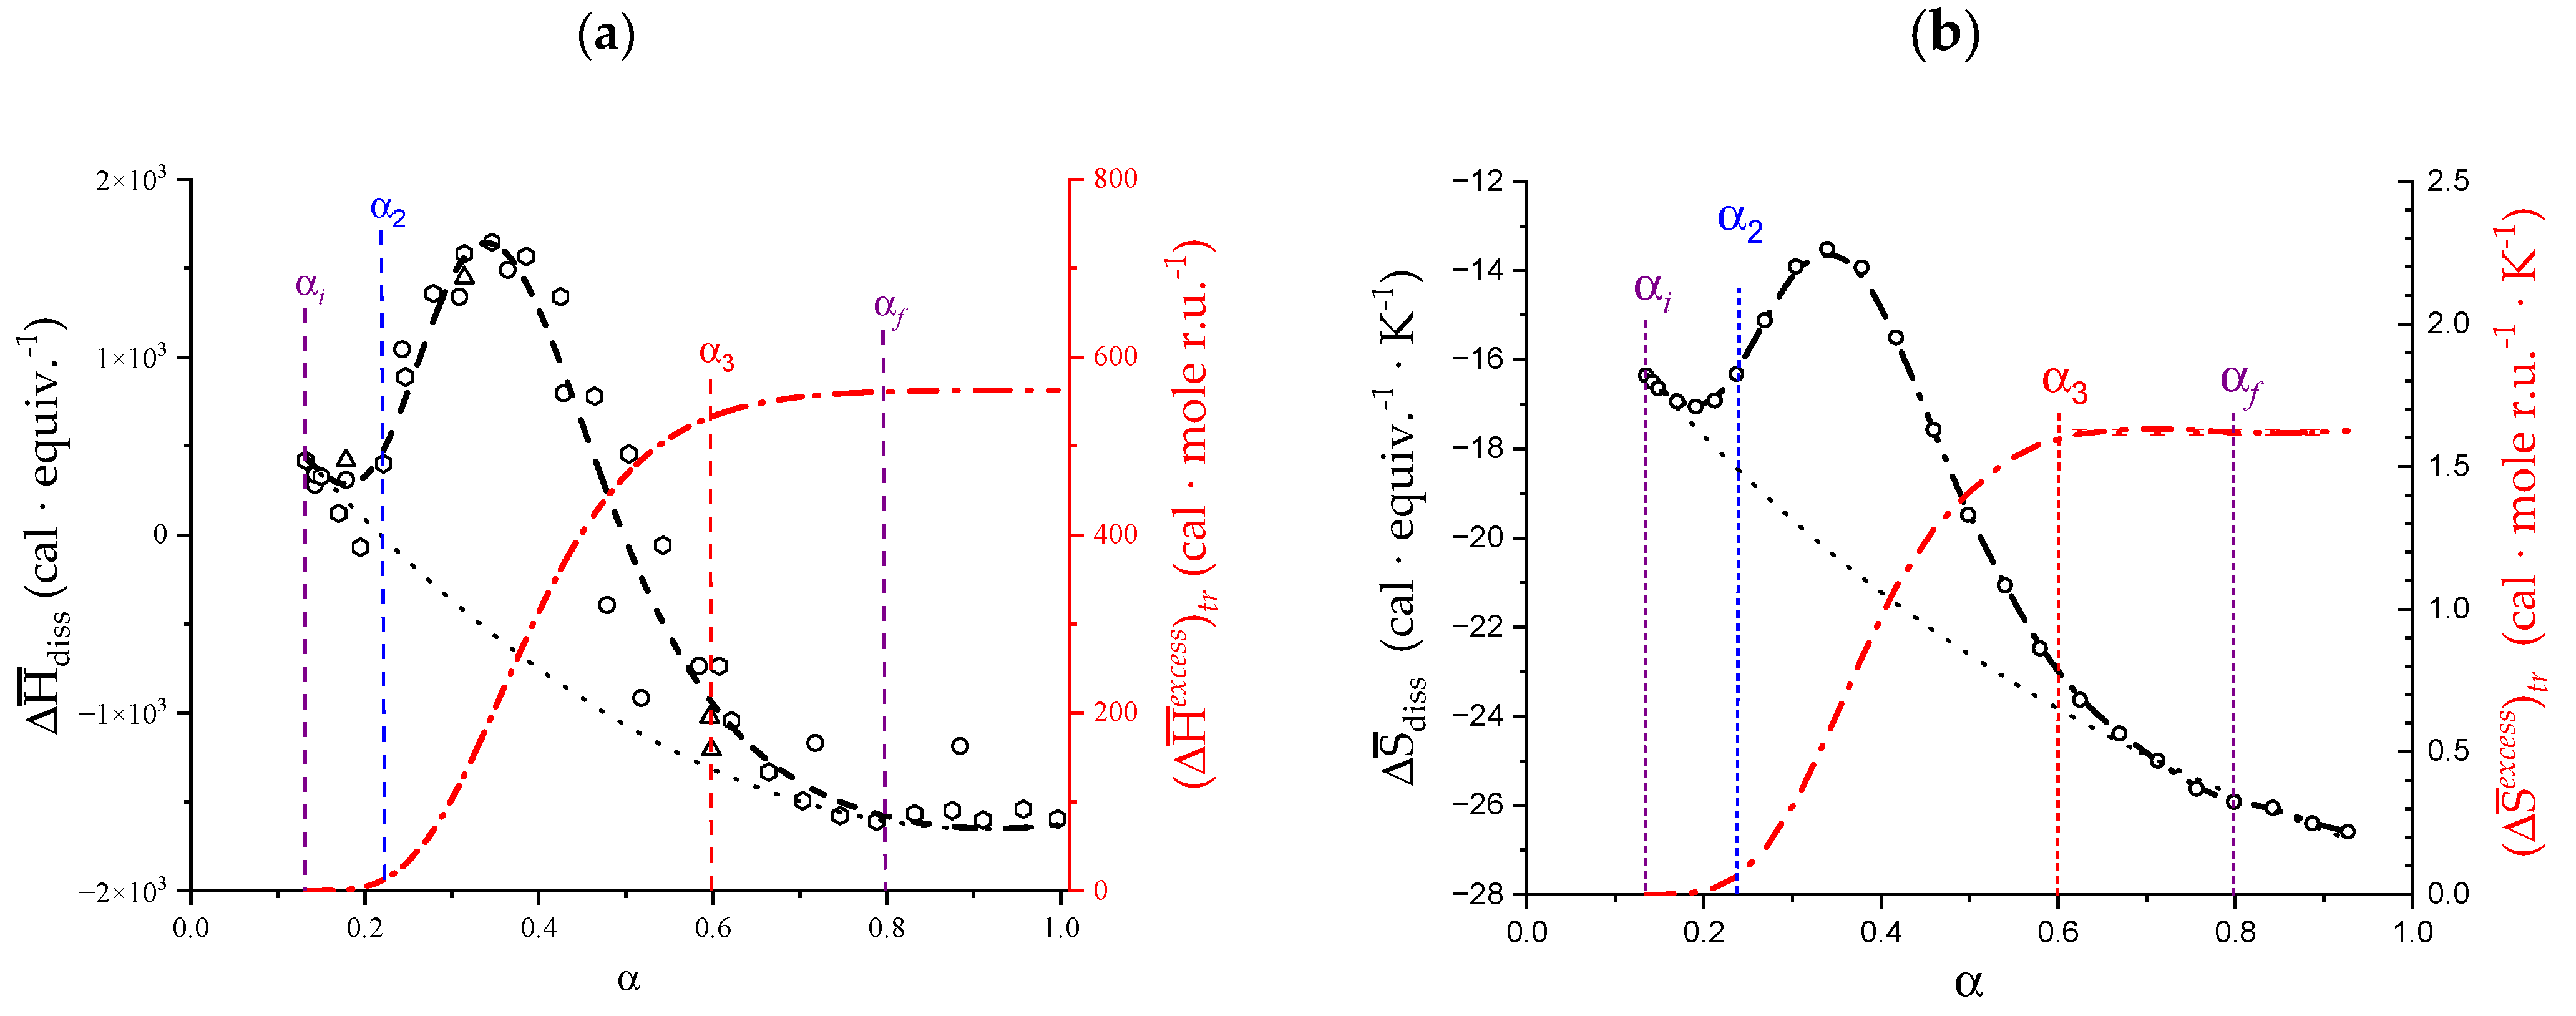
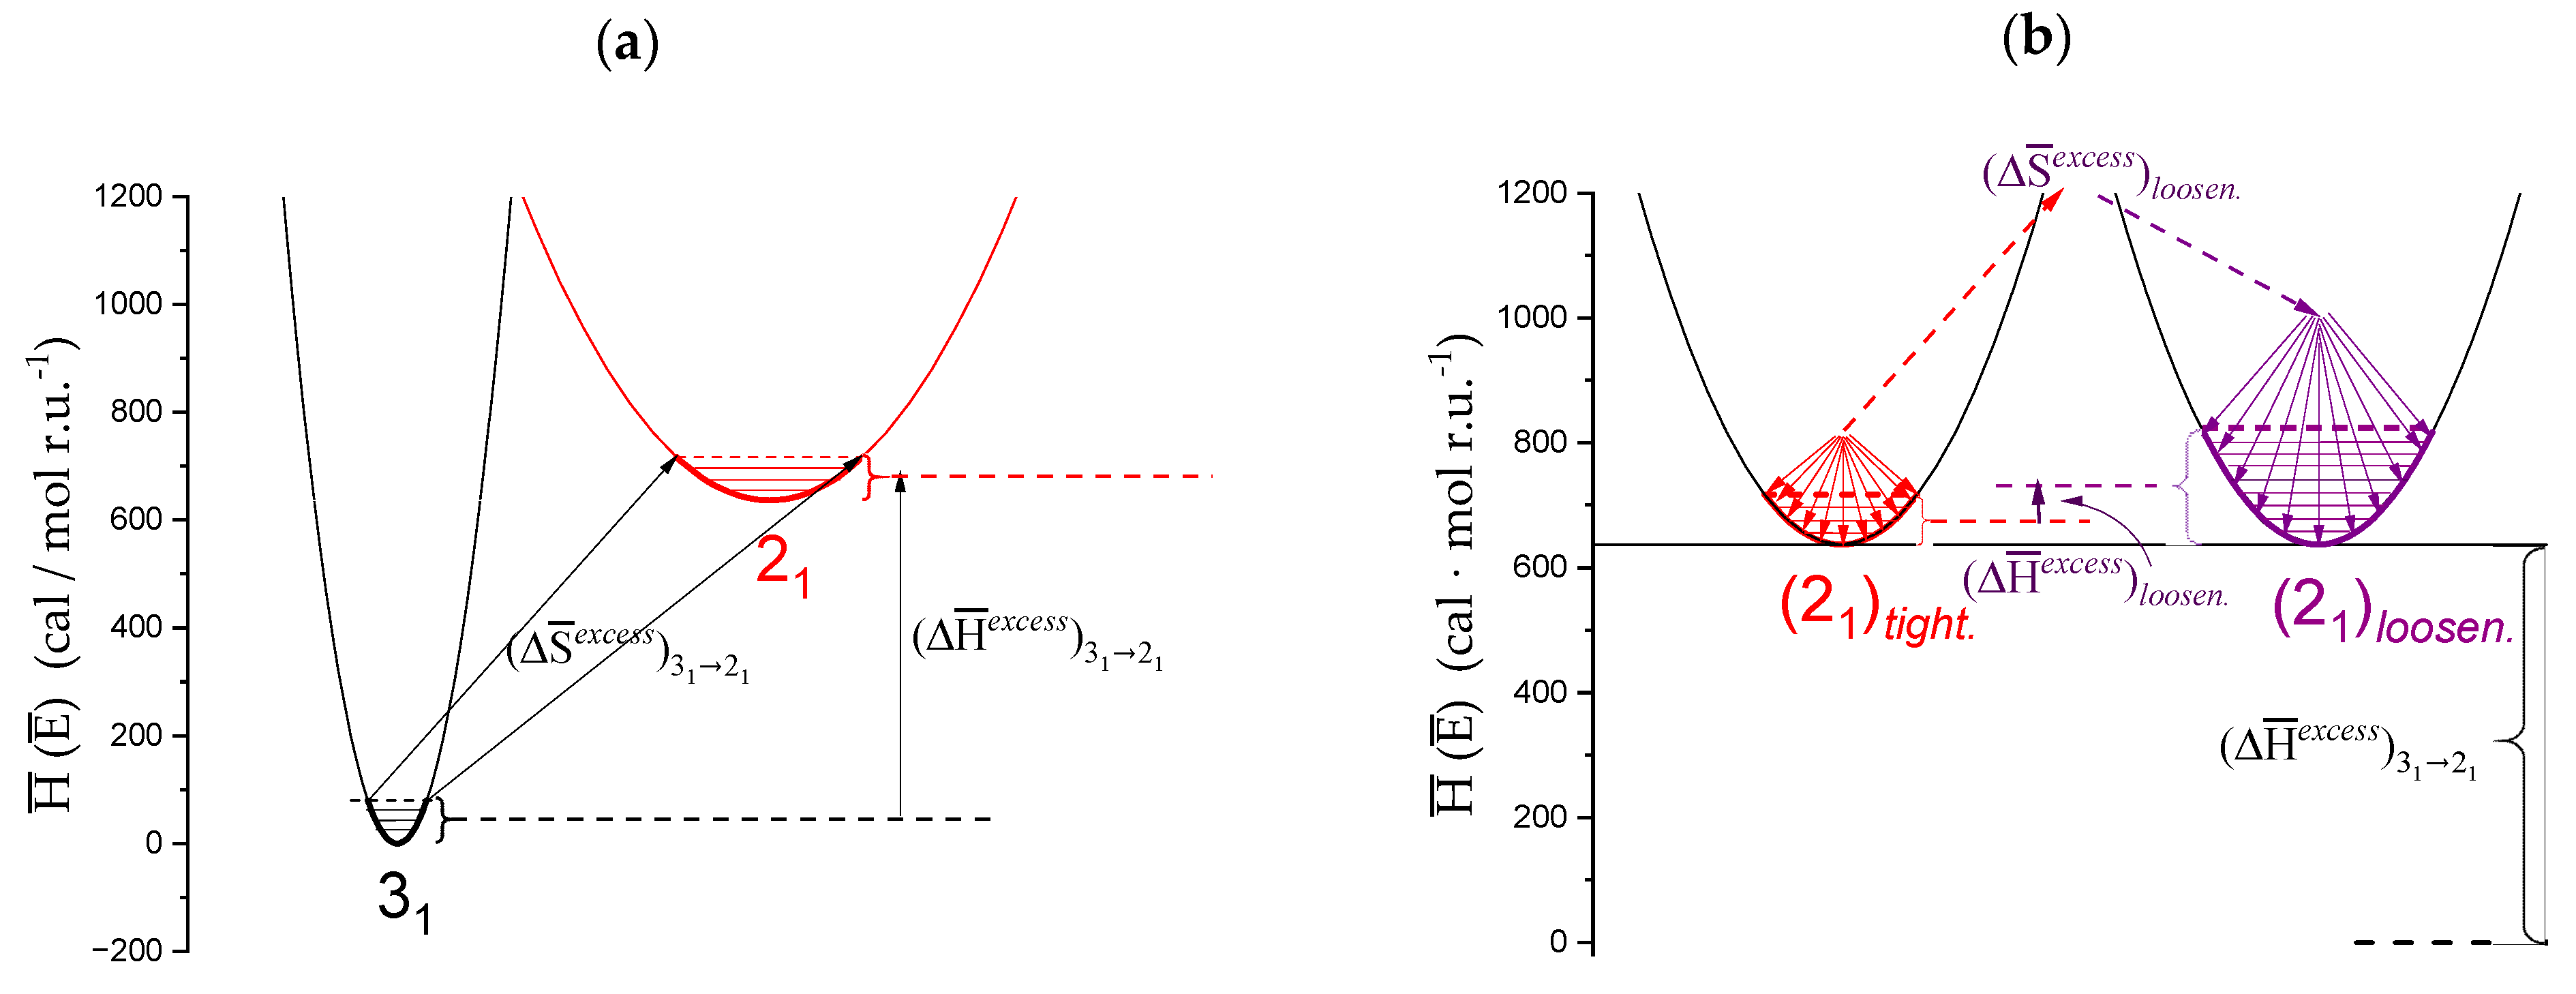
To decouple the observed enthalpic and entropic changes over the whole range of δαconf, the following procedure was used:
  • The experimental transition ( t r ) thermodynamic changes ( Δ X ¯ t r e x c e s s , with X ¯ = H ¯ , S ¯ , G ¯ ) are supposed to result from the additive contribution of the inter-conformational transition term (31 → 21) and the loosening term (loosen.): Δ X ¯ t r e x c e s s α = Δ X ¯ 3 1 2 1 e x c e s s α + Δ X ¯ l o o s e n . e x c e s s ( α );
  • In the ranges αi → α2 and α3 → αf (being αi = α1), the measured effect stems from the loosening. terms only: Δ X ¯ t r e x c e s s α 1 , R α 2 , R     Δ X ¯ l o o s e n . e x c e s s α 1 , R α 2 , R and Δ X ¯ t r e x c e s s α 3 , R α f , R     Δ X ¯ l o o s e n . e x c e s s α 2 , R α f , R . Moreover, no other excess term being detected beyond αf, the final condition (αf, R) can be substituted by (α = 1, R). For the case in “salt”, R = 10;
  • To evaluate the loosening contribution in the transition interval α2 → α3, two methods have been devised, which are described in Supplementary paragraph 2. Briefly, they both assume that Δ X ¯ t r e x c e s s α 2 , R α 3 , R reflects the trends before α2 and beyond α3. The results are encouragingly similar, allowing for the trivial estimation of Δ X ¯ l o o s e n . e x c e s s α 1 , R α = 1 , R as the sum of the three contributions in the three sequential intervals of α. The results have been reported in block a. of Table 2;
  • The Δ X ¯ 3 1 2 1 e x c e s s terms have then been evaluated as the difference between Δ X ¯ tr e x c e s s α 2 , R α 3 , R and Δ X ¯ l o o s e n . e x c e s s α 2 , R α 3 , R (see block b. of Table 2). The Δ X ¯ 3 1 2 1 e x c e s s terms are assumed to be independent of α, as usual in calculating the (non-electrostatic) thermodynamic properties of the conformational transition when there is no—or a negligible—variation in charge density values between the initial and final states. This holds in the present case, where the difference in charge density between the 31 and the 21 fully-charged conformations is as low as 0.46% at full dissociation (as already mentioned in Section 1.1), which reduces to 0.16% at α2 and to 0.32% at α3. Operationally, the electrostatic terms are fully taken care of by the Δ H ¯ diss   α and Δ S ¯ diss   α baselines;
  • The total excess changes from α1 to α = 1 ( Δ X ¯ t r e x c e s s = Δ X ¯ t o t a l e x c e s s ) are then the bare sum of the two previous sets (see block c. of Table 2).
The adopted procedure seems to have provided reasonable values of the thermodynamic properties, while allowing for the decoupling of the two conformational processes. Both processes are characterized by positive variations of both enthalpy and entropy. The values of Tm (i.e., 300 K vs. 324 K) are not very different, therefore inducing a consideration of them as closely related in their molecular origin. Moreover, their values, being very close to 298.15 K—but higher—explain well the very small and only slightly positive values of Δ G ¯ at 25 °C.
The first comment concerns the thermodynamic values of the 31 → 21 transition. There is no experimental value to compare with the present results. The Δ X ¯ t r value by Gilsenan et al. [32] actually pertain to the transition (31)ordered → (21)disordered; although their results correspond to the present Δ X ¯ t o t a l e x c e s s values, they will be discussed together with the present ones in Section 4.1. There are no other known cases of intramolecular inter-conformational transition of polysaccharides in solution of the type (helix)1 → (helix)2.
A reversible helix−helix transition of poly(β-aryl l-aspartate)s, involving a screw-sense inversion, was reported both in solution and in the solid state [59,60]. Very interestingly, “The enthalpy change in the transition was 0.5 kcal/mol of 3PLA [poly(β-phenyl propyl l-aspartate)] repeat unit which is attributable to the energy difference between right-handed helix and left-handed helix” [61], namely very close to the presently determined value for the inter-helical transformation of galacturonan: 0.59 kcal⋅mole r.u.−1.
The situation is better at the theoretical level. Probably the most thorough modeling investigations of poly(uronates)—and of poly(galacturonate) in particular—are those of Braccini and Pérez [41,62]. In the course of their investigation of the conformational aspects of those polysaccharides, with particular attention to their capacity of interacting with Ca2+ ions to give rise to gel junctions, they also tackled the problem of the stability of the polyuronides without calcium. In Reference [41], they demonstrated that the conformational energy map of the disaccharide components and of poly(galacturonic acid) show “only one low-energy region […] containing two energy wells”. The latter wells correspond, at the regular polymeric structural level, to the 31 and to the 21 helix, respectively. The calculated internal energy difference, in favor of the 31 helix, between the two conformations is +0.30 kcal⋅mole r.u.−1 for the isolated structural repeating unit and +0.80 kcal⋅mole r.u.−1 when re-calculated for the galacturonic unit in the polymer chain [41] (as for the latter case, it is to be recalled that the calculations of the conformational energy of the polymeric structures were subjected to “a constraint applied on the glycosidic linkage in order to preserve the regular helicity” [41]). It should also be recalled that, in all the quoted calculations, the fundamental role of water has been taken into account only by using the value of 80 for the (relative) dielectric permittivity, without an explicit involvement of water molecules in the minimization procedures.
In view of all these considerations, the fact that the experimentally determined value of the difference in internal energy (formally, enthalpy: Δ H ¯ 3 1 2 1 e x c e s s = +0.59 kcal⋅mole r.u.−1) between the 31 and the 21 conformations falls so nicely within the two quoted theoretical limits can be considered a success for both theory and experiment.
However, internal energy (i.e., enthalpy, for condensed phases) is not the whole story. Recalling the following: “The description of chain conformation in solution as two-fold or three-fold should not, of course, be interpreted as implying rigid, fixed geometry of the type found in the solid state and in the junction zones of polysaccharide gels, but rather as the state of minimum free energy around which the local conformation fluctuates” [32] also helps to interpret the calculated “inter-conformational” entropic difference ( Δ S ¯ 3 1 2 1 e x c e s s = +1.84 ± 0.01 cal⋅mole r.u.−1·K−1). At 25 °C, certainly neither conformation occupies a single, uniquely defined, minimum of the adiabatic energy map, but, rather, they both fluctuate on the “sides” of the minimum of the respective “well”. However, the determined value of ΔS tell us that the average shape of the conformational energy surface around the 21 well is certainly wider and less steep than that around the 31 one, thereby allowing the system (at T = 25 °C) to visit a much larger number of states and produce a favorable entropic bias for the former conformation; the counterpart at the macroscopic (hydrodynamic) level of this more dynamic situation is an increased chain flexibility on passing from the 31 to the 21 helical symmetry. This point will be discussed in Section 6. Scheme 2a is aimed at providing a visual—albeit simplified—representation of the 31 → 21 transition, highlighting the wider range of the conformational energy map of the 21 conformation visited with respect to the 31 one, resulting in a significant increase in entropy upon transition. Δ H ¯ 3 1 2 1 e x c e s s and Δ S ¯ 3 1 2 1 e x c e s s are the differences between the average values of the enthalpy and of entropy, respectively, of the two states, at 25 °C.
Too often, discussions on biopolymer conformations (in particular on conformations involved in transitions) are uniquely focused on the minima of the conformational energy maps. This produces a rigid scenario, in which only well-ordered shapes are permitted. A quotation from [63] is revealing: “Although regular helical structures, as inferred from fibre diffraction measurements in the solid state […] or built using molecular modelling procedures […] are useful conceptual models, they may represent a rather misleading picture of the complex conformational ensembles populated by single polyuronate chains in aqueous solution”. A correct approach should then also consider the energy profile of the map around the minima and its dynamic evolution, providing a population statistics dependent on the width and steepness of the well. The “loose” helix is likely to be just the result of a conformation averaging over a larger number of states around the helical minimum on well-defined timescales. Gouvion et al. clearly showed that “In spite of the dominance of two conformers in an equilibrium mixture based on the relative energies of four conformers, digalacturonic acid exhibits quite a large libration motion. This might be expected from the shape of the two lowest energy regions where several conformers are encompassed by the 1 kcal/mol contour” [64]. This is confirmed by the thermodynamic values of Table 2. The values of the ratio of the loosening terms ( Δ X ¯ l o o s e n . e x c e s s α 1 , R α = 1 , R ) over the corresponding (31 → 21) transition ones Δ X ¯ 3 1 2 1 e x c e s s α 1 , R α = 1 , R are 0.22 and 0.24 for the enthalpic and the entropic terms, respectively (recalling that this is true for 25 °C and 0.05 M aqueous NaClO4R = 10). Both entities are of the same sign (positive) as the 31 → 21 ones, but their absolute value (less than ¼ of the latter ones) demonstrates that the increase in both the enthalpy and entropy of the 21 helix in the “tight” to “loose” transition with respect to the 31 → 21 one is marginal. In turn, this clearly shows that the pH-induced transition of galacturonan is certainly not a helix → coil one, fully confirming the quoted theoretical arguments. Scheme 2b represents the loosening transition, with the corresponding enthalpy and enthalpy changes.

2.4. Isothermal Micro-Calorimetric Data in Salt-Free Aqueous Solution

An analysis of the experimental evidence accompanying the pH-induced transition of galacturonan in water, rather than simply confirming the conclusions drawn from the parallel results in “salt”, adds new insights into the polymer behavior, revealing unexpected features.
The Δ H ¯ diss α and Δ S ¯ diss   α curves for pectic acid in water, replotted from the original data in figures 1 and 3 of reference [29], have been reported in Figure 3a,b, respectively. The corresponding Δ H ¯ t r e x c e s s α and Δ S ¯ t r e x c e s s α integral curves have been also reported in the same figure, using the same scale (on the r.h.s.) used in Figure 2. Also in this case, the intermediate values of Δ H ¯ t r e x c e s s α and Δ S ¯ t r e x c e s s α at the intermediate values of α from α1 to α = 1.0 have been reported in Supplementary paragraph 1.
The bump-shaped curves in both panels are very similar to those of Figure 2 in “salt”. Much like the case of the limits of δαconf, those marking δαtr in “water” (δαtr = 0.67, vs. 0.70 in “salt”) also fall at lower values of α compared with those of the system in “salt”: αi = 0.13 (vs. 0.17) and αf = 0.80 (vs. 0.87). Also in this case, the recalculated values of both Δ H ¯ t r e x c e s s and Δ S ¯ t r e x c e s s over the δαconf range (reported in Table 1) are very close to those in the paper written by Cesàro et al. [29].
Using the same method as previously used in the case of the system in “salt”, the decoupling of the Δ X ¯ 3 1 2 1 e x c e s s and Δ X ¯ l o o s e n . e x c e s s values was performed. The results have been reported in Table 2. Both the enthalpic and the entropic values show the same sign as the corresponding ones in “salt”; however, in all cases, the values in “water” are a little smaller than those in “salt”. In the case of the Δ X ¯ 3 1 2 1 e x c e s s functions, the ratio of the enthalpy change in “water” over that in “salt” is identical to that of the corresponding entropy change (namely, 0.78), whereas, in the case of the Δ X ¯ l o o s e n . e x c e s s functions, the ratio of the Δ H ¯ values is 0.77 and that of the Δ S ¯ values is only 0.43. The smaller values of both Δ H ¯ l o o s e n . e x c e s s and Δ H ¯ 3 1 2 1 e x c e s s in “water” with respect to “salt” will be addressed in Section 2.8.

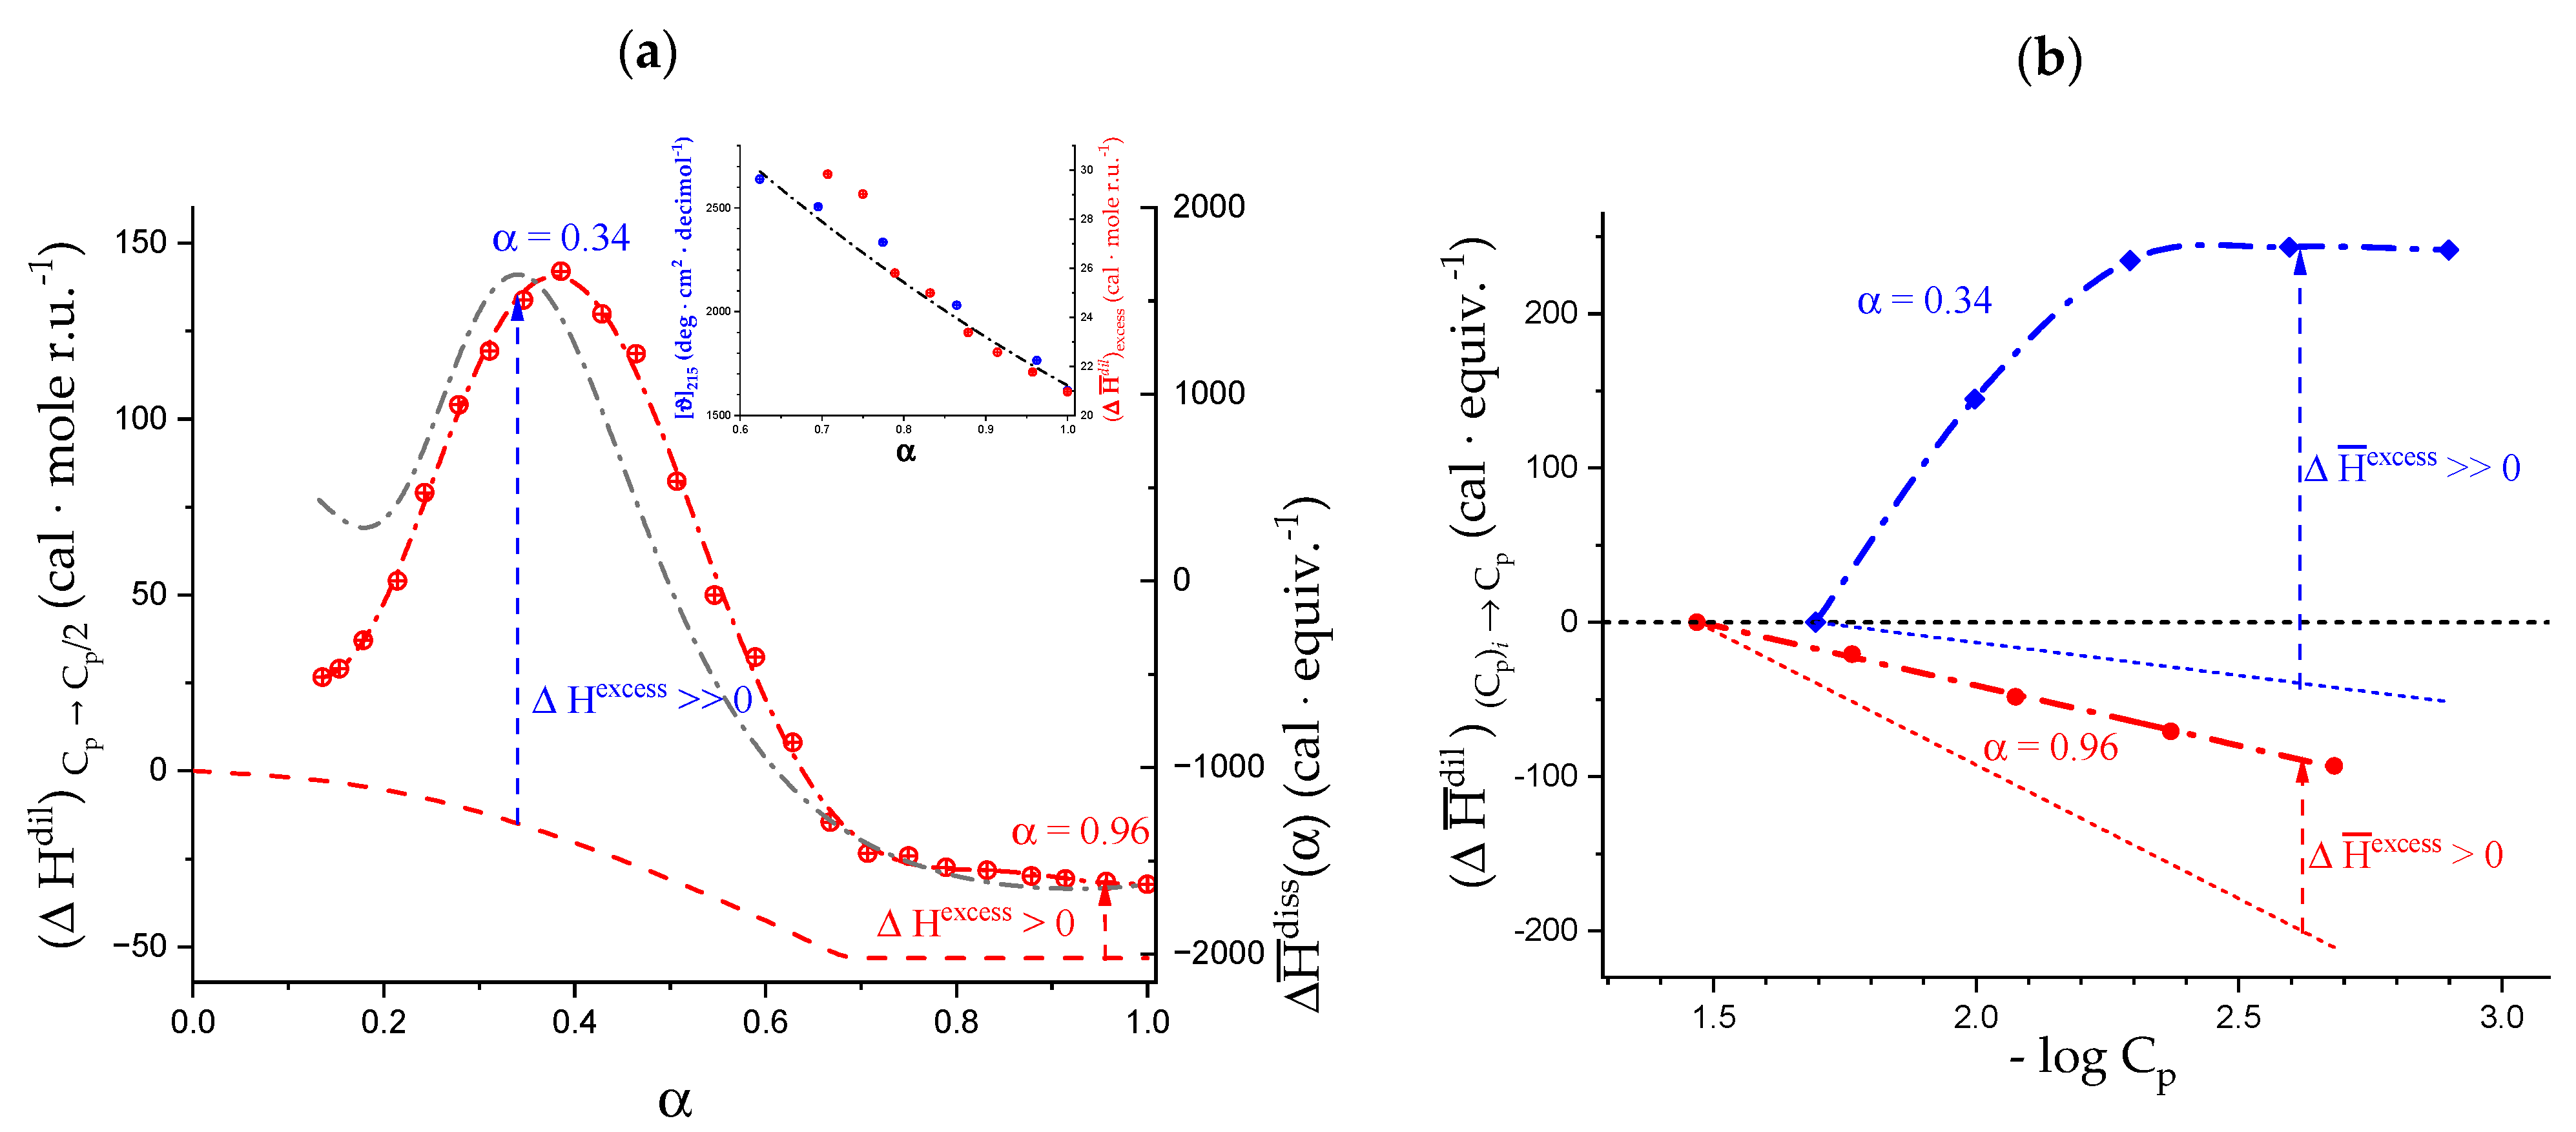
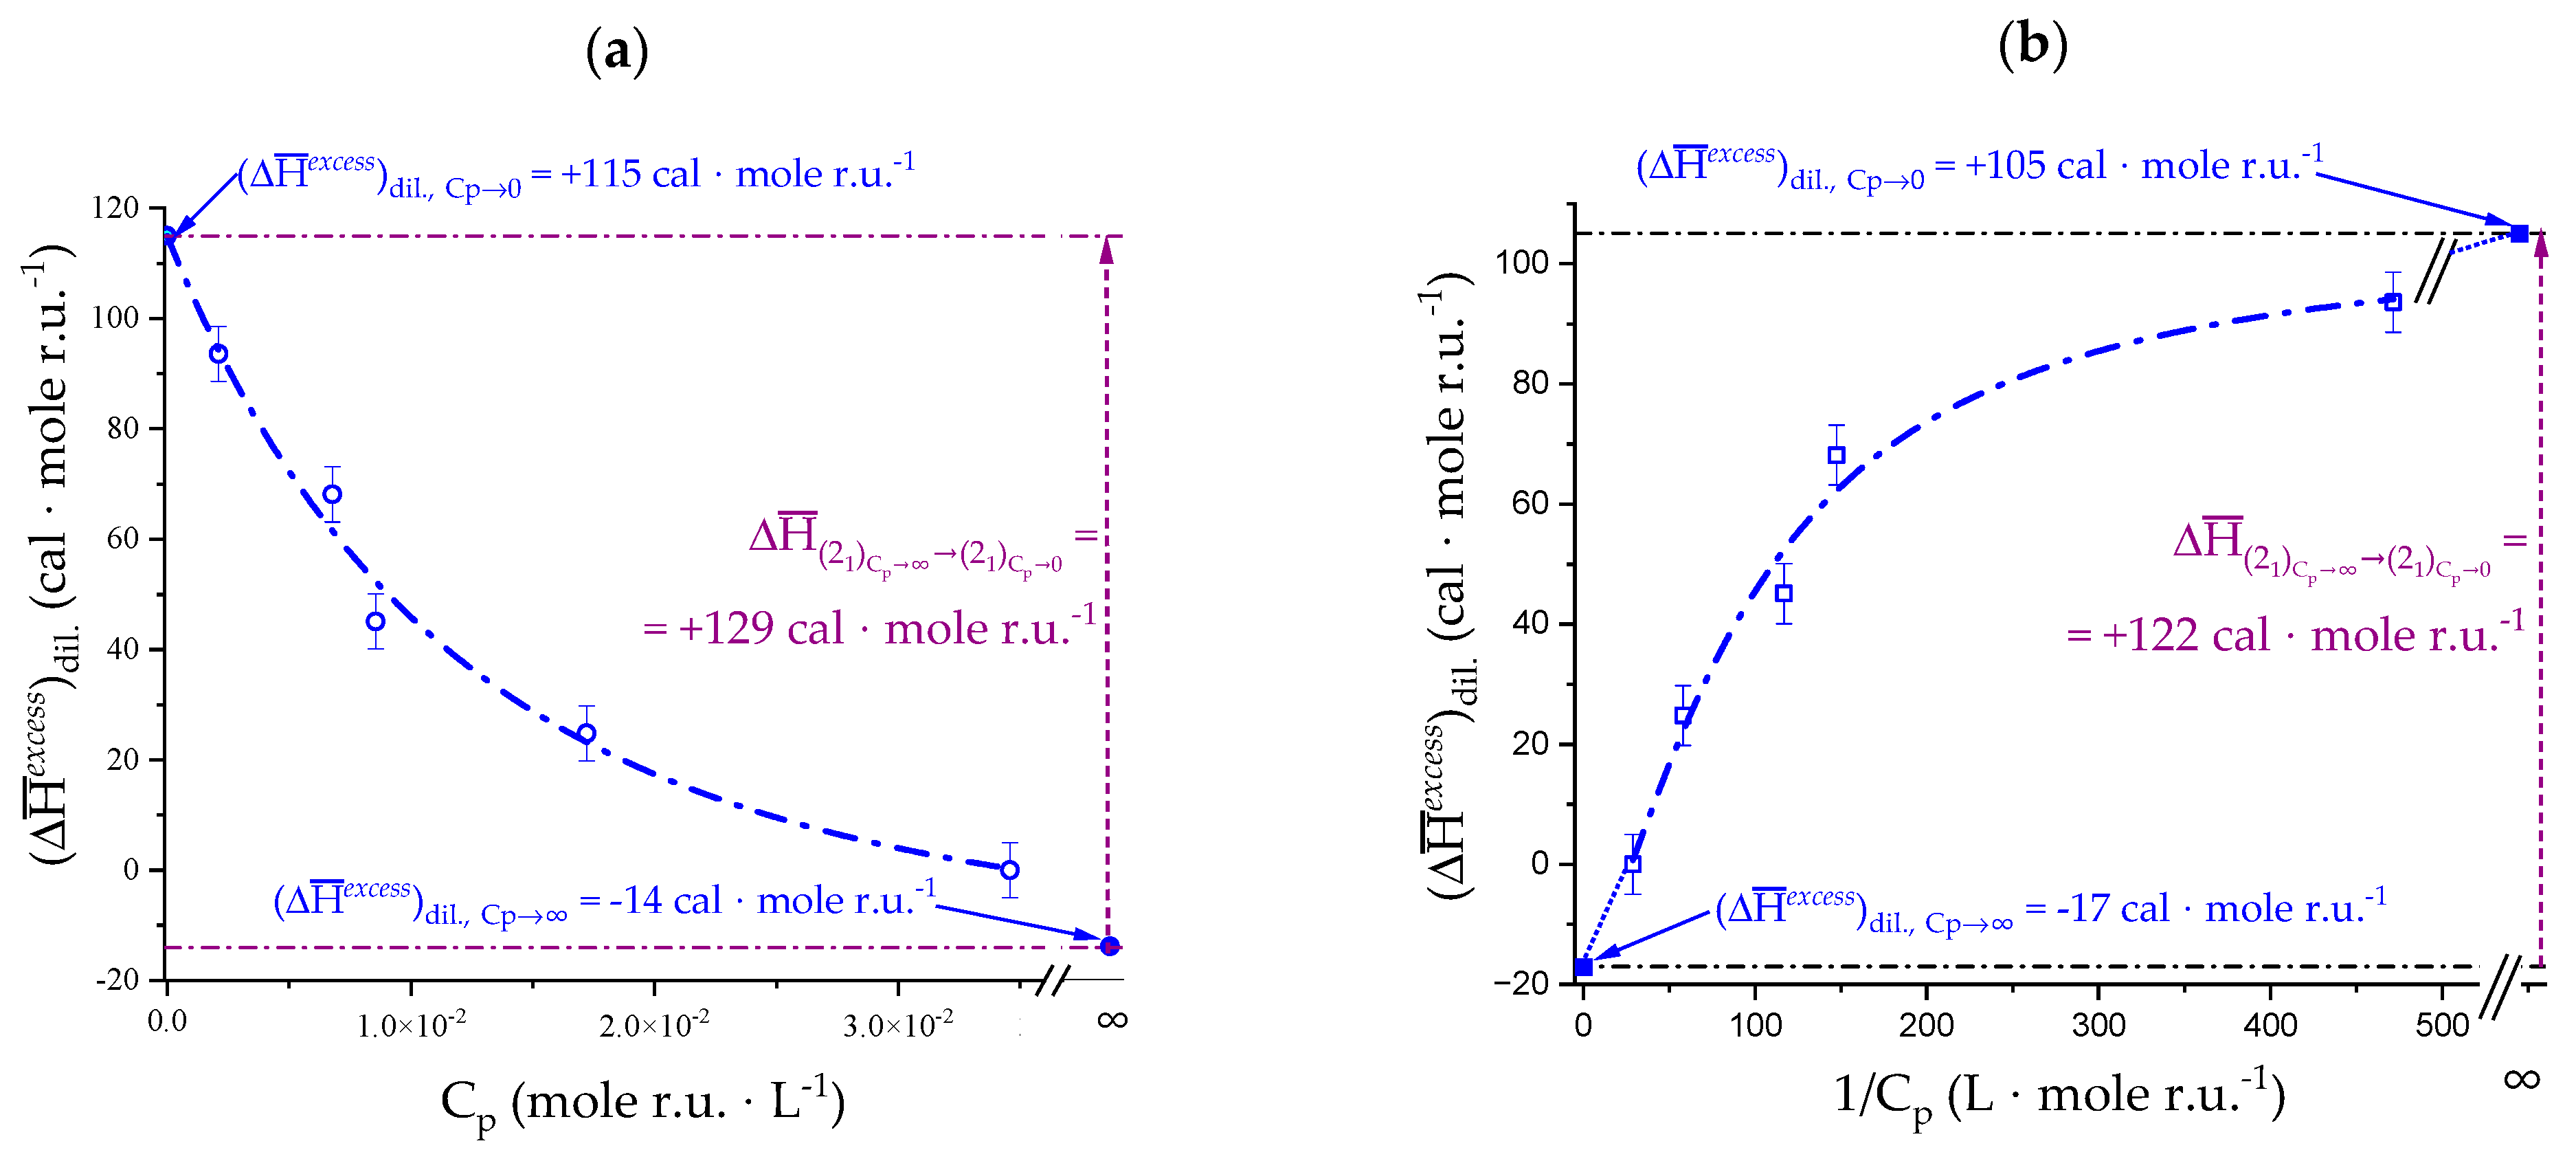
2.5. Enthalpy Changes of Dilution: Galacturonan in Water

The experimental data of the enthalpy of Δ H ¯ diss of Figure 3 implies—among others—the separate determination of the enthalpy of dilution of the polymer vs. solvent (water). Besides this necessary aspect, the measurements of the heat of the dilution of polymers are interesting per se [65]. Figure 4a shows the remarkable similarity of the two curves represented: the red dash-dotted curve through the red crossed-circles is the curve of the enthalpy of dilution of galacturonan in water upon halving the initial polymer concentration; the black dash-dotted curve is the Δ H ¯ diss α curve from Figure 3a. The red dashed curve at the bottom represents the calculated polyelectrolyte contribution to dissociation as a function of α [29]. A comparison with the exothermic values foreseen by theory leads to a very clear interpretation. Not only is the excess enthalpy change in dilution always endothermic, but its almost perfect overlap with the dissociation enthalpy curve demonstrates that the two trends reflect the same underlying process, namely the charge-induced changes of conformation. Moreover, one should underline that—even besides the “bump” corresponding to the 31 → 21 transition—the experimental curve keeps showing an endothermic excess with respect to the theoretical one up to α = 1.0, which must be traced back to the persistence of the loosening process.
All polyelectrolyte theories predict a linear dependence of the enthalpy of dilution on the logarithm of the polymer concentration, with a slope proportional to the charge density parameter, ξ (ξ = lB/b, with lB = 7.135 Å for water at 298.15 K and b = distance between projection of charges on chain axis). In the case of weak polyacids, ξ = α·ξ0, with ξ0 being the charge density parameter of the fully dissociated form of the polyacid (ξ0 = lB/b0, with b0 = 4.35 Å) [66]. Figure 4b shows that, at two different values of α, galacturonan does not follow theoretical predictions. At an α value in the middle of the transition, the experimental data show a large endothermic deviation from theory, which is also indicated in Figure 4a. On the low concentration side, the curve flattens down and starts showing a very small exothermic behavior. The second curve in Figure 4b describes the dilution behavior of pectate at α = 0.96; the trend is linear with log Cp, but it keeps a steady endothermic deviation from the theoretical behavior over the whole investigated range.
That the double-helix of DNA can be denatured by dilution has been known since the 1960s, e.g., [67,68]. However, to the best of our knowledge, this is the first reporting of experimental results demonstrating the “denaturation upon dilution” of an ordered polysaccharide conformation. It is the very process of dilution to drive the destabilization; the gain in free energy deriving from the increase in the configurational entropy of the chain and/or the reduction in excluded volume effects overwhelms the endothermic variation of enthalpy due to forcing the system to populate higher energy states. This process can be regarded as the conceptual opposite of the demonstrated osmotically induced coil → helix transition in poly(glutamic acid). In the latter case, an osmotic stress raises the helix–coil transition temperature by favoring the more compact α-helical state over the more hydrated and expanded coil state [49]. As already pointed out in Section 1.7, the profound compositional difference between PGA and galacturonan as to the change in hydration upon conformational transition is at the root of the different behavior.
Exploiting the above reasoning induced an attempt to use the results of Figure 4b to try to estimate the maximum value of Δ H ¯ l o o s e n . e x c e s s of Na+ pectate in water under the following assumptions.
The ideal condition of polymer in water at Cp → ∞ can be taken as the condition of a maximum tightening of the polyelectrolyte, due to both the obvious restriction in volume (minimum configurational entropy) and the attainment of the condition I → ∞ (stemming from the fraction of uncondensed counterions).
On the opposite side, the condition of polymer in water at Cp → 0 can be taken as the condition of maximum loosening (maximum configurational entropy).
The experimental data have been fitted as a function of Cp with a hyperbolic equation, and as a function of 1/Cp with a Hill equation. The results are shown in Figure 5a,b, respectively. The fittings enabled calculating Δ H ¯ l o o s e n . e x c e s s α = 1 , C p α = 1 , C p 0 , namely the value of Δ H ¯ l o o s e n . e x c e s s in the transition from (α = 1.0, Cp → ∞) to (α = 1.0, Cp → 0). In spite of the large errors from the numerical fitting, the two values—reported in Table 3—are in excellent agreement, lending confidence to the followed procedure. The result will be further discussed in Section 4.2.

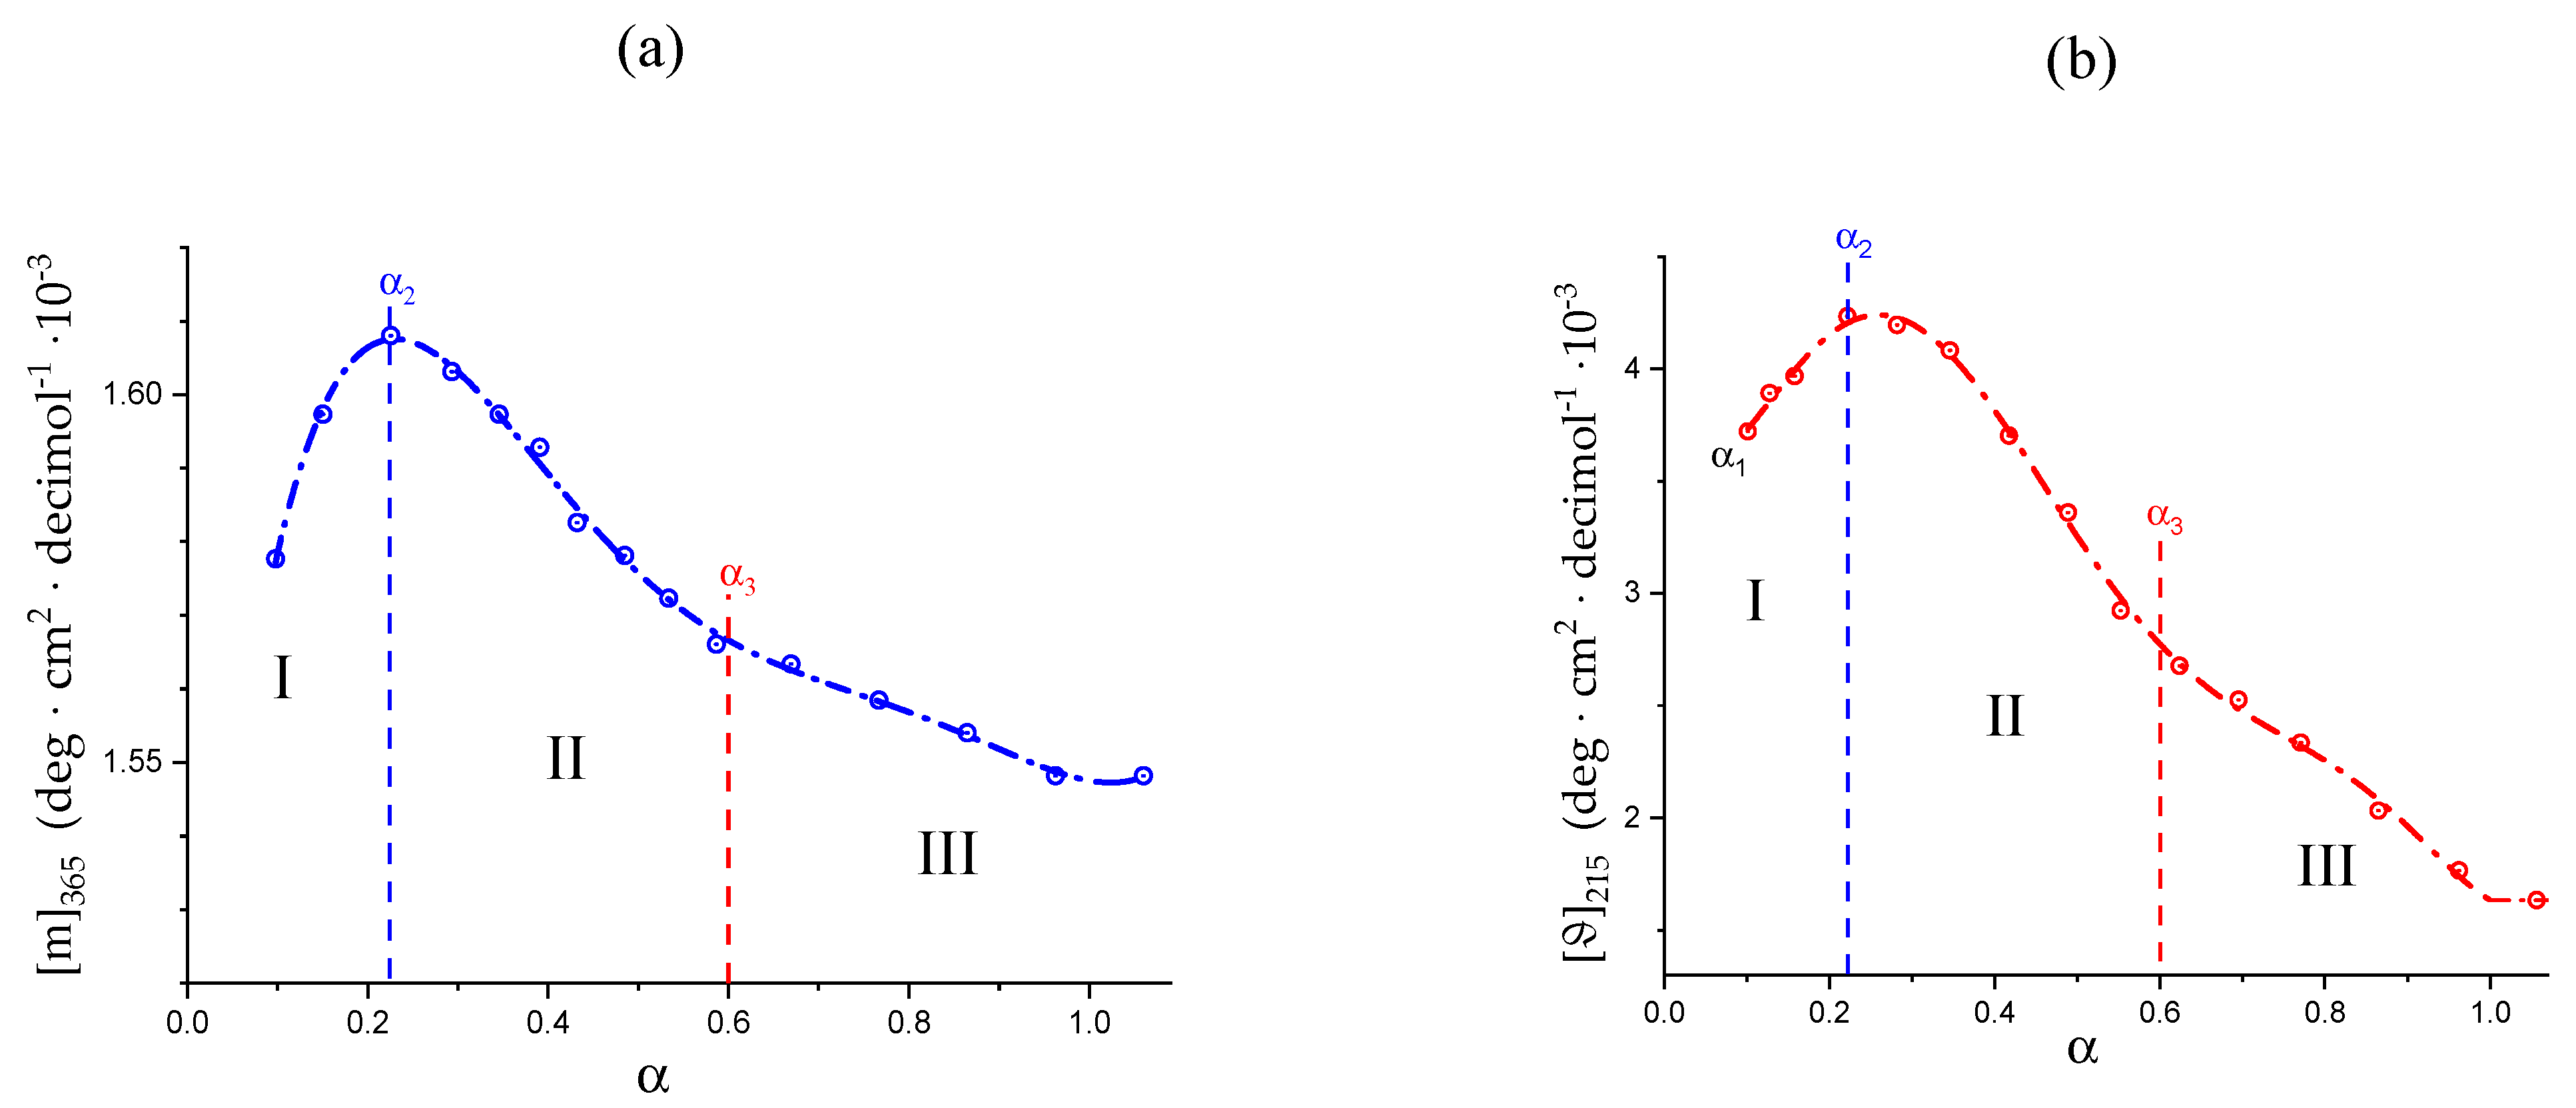
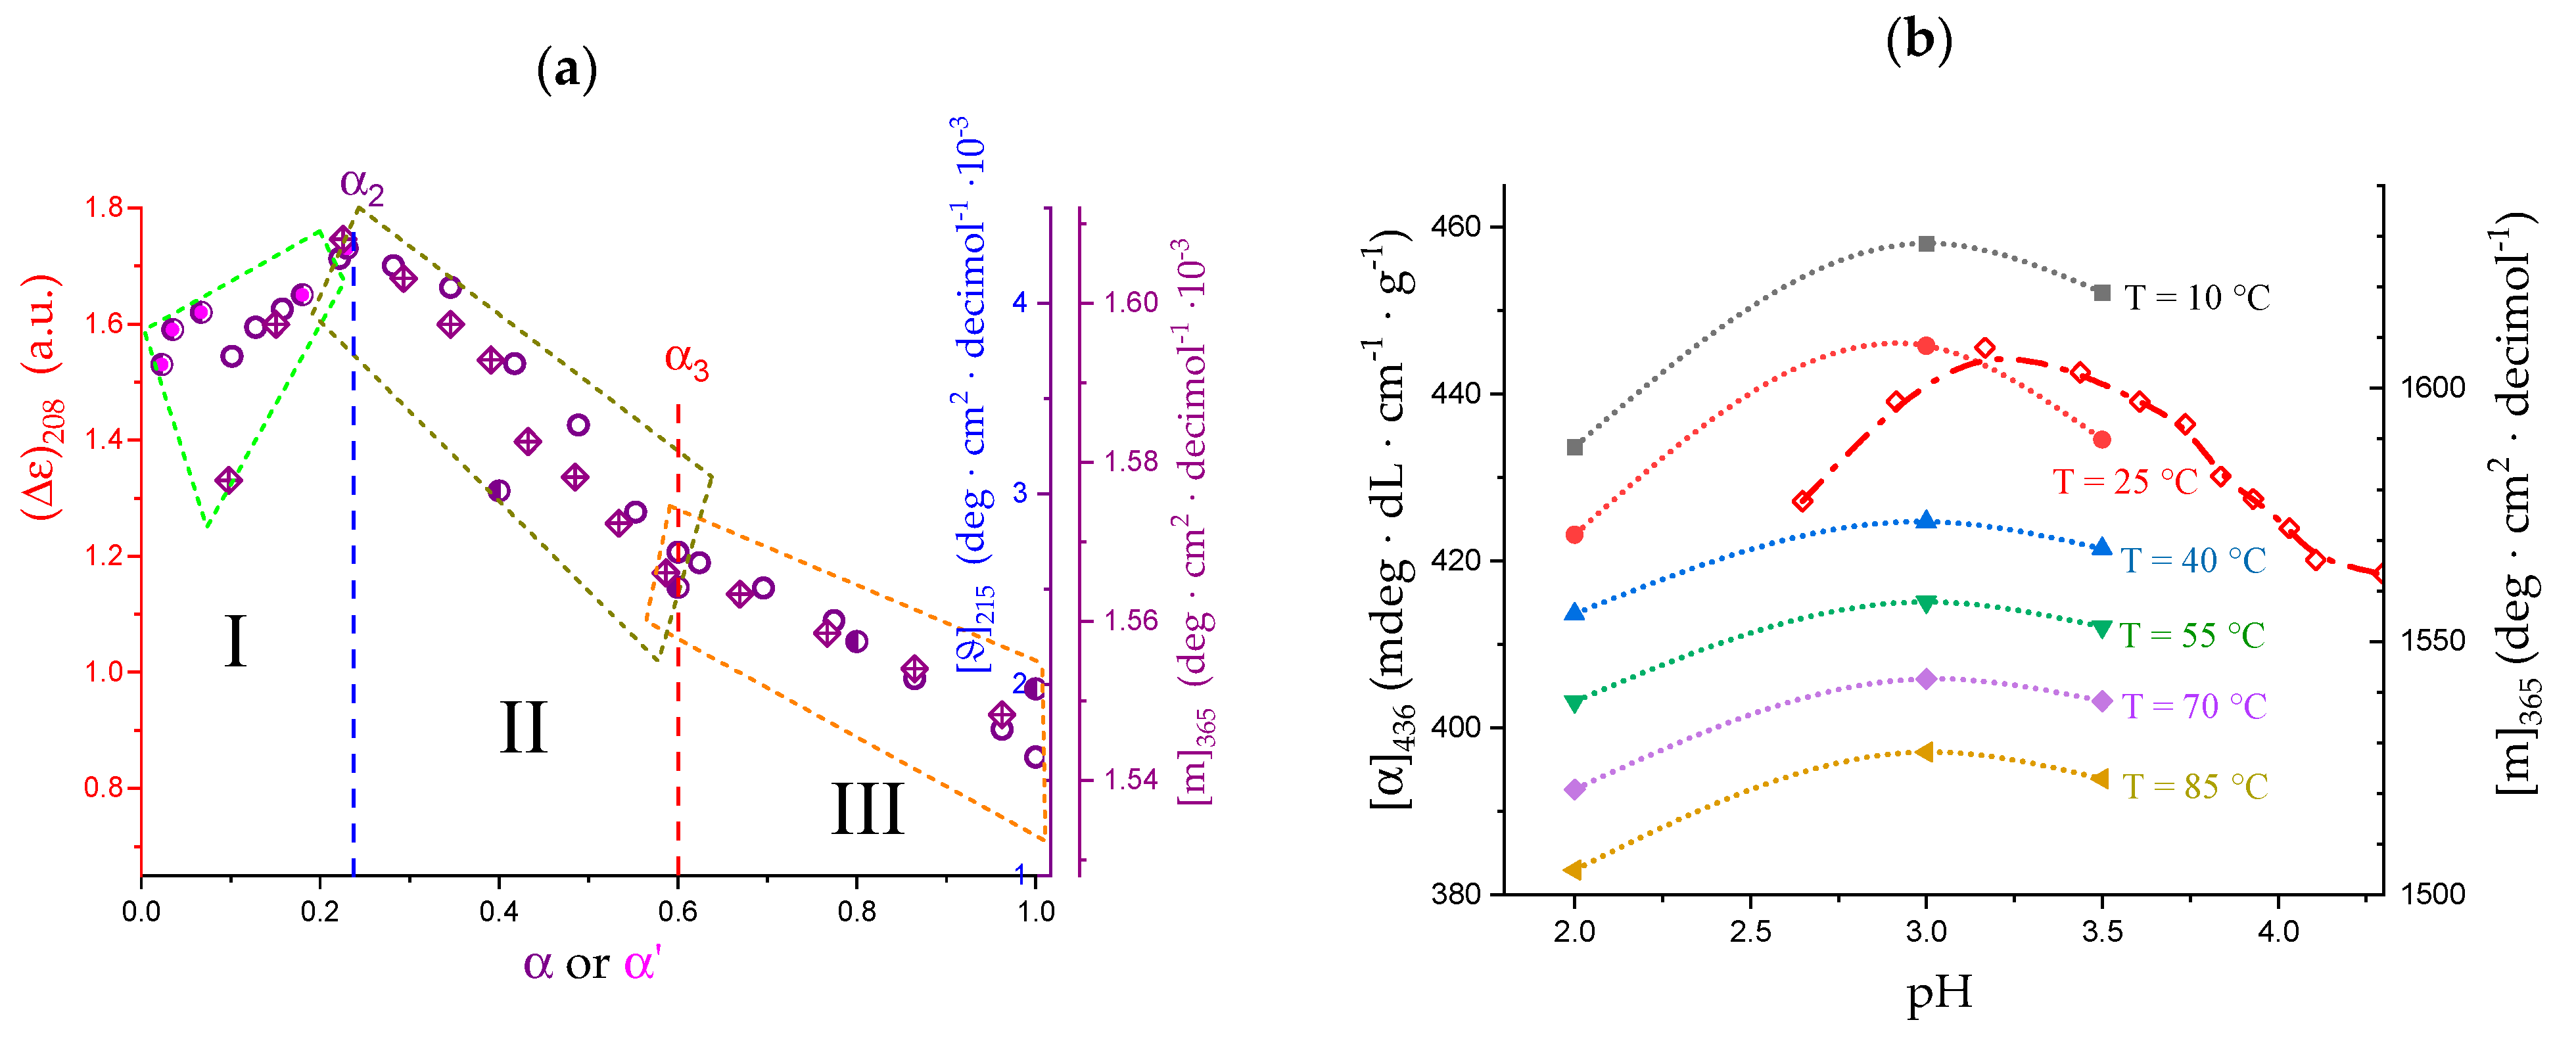
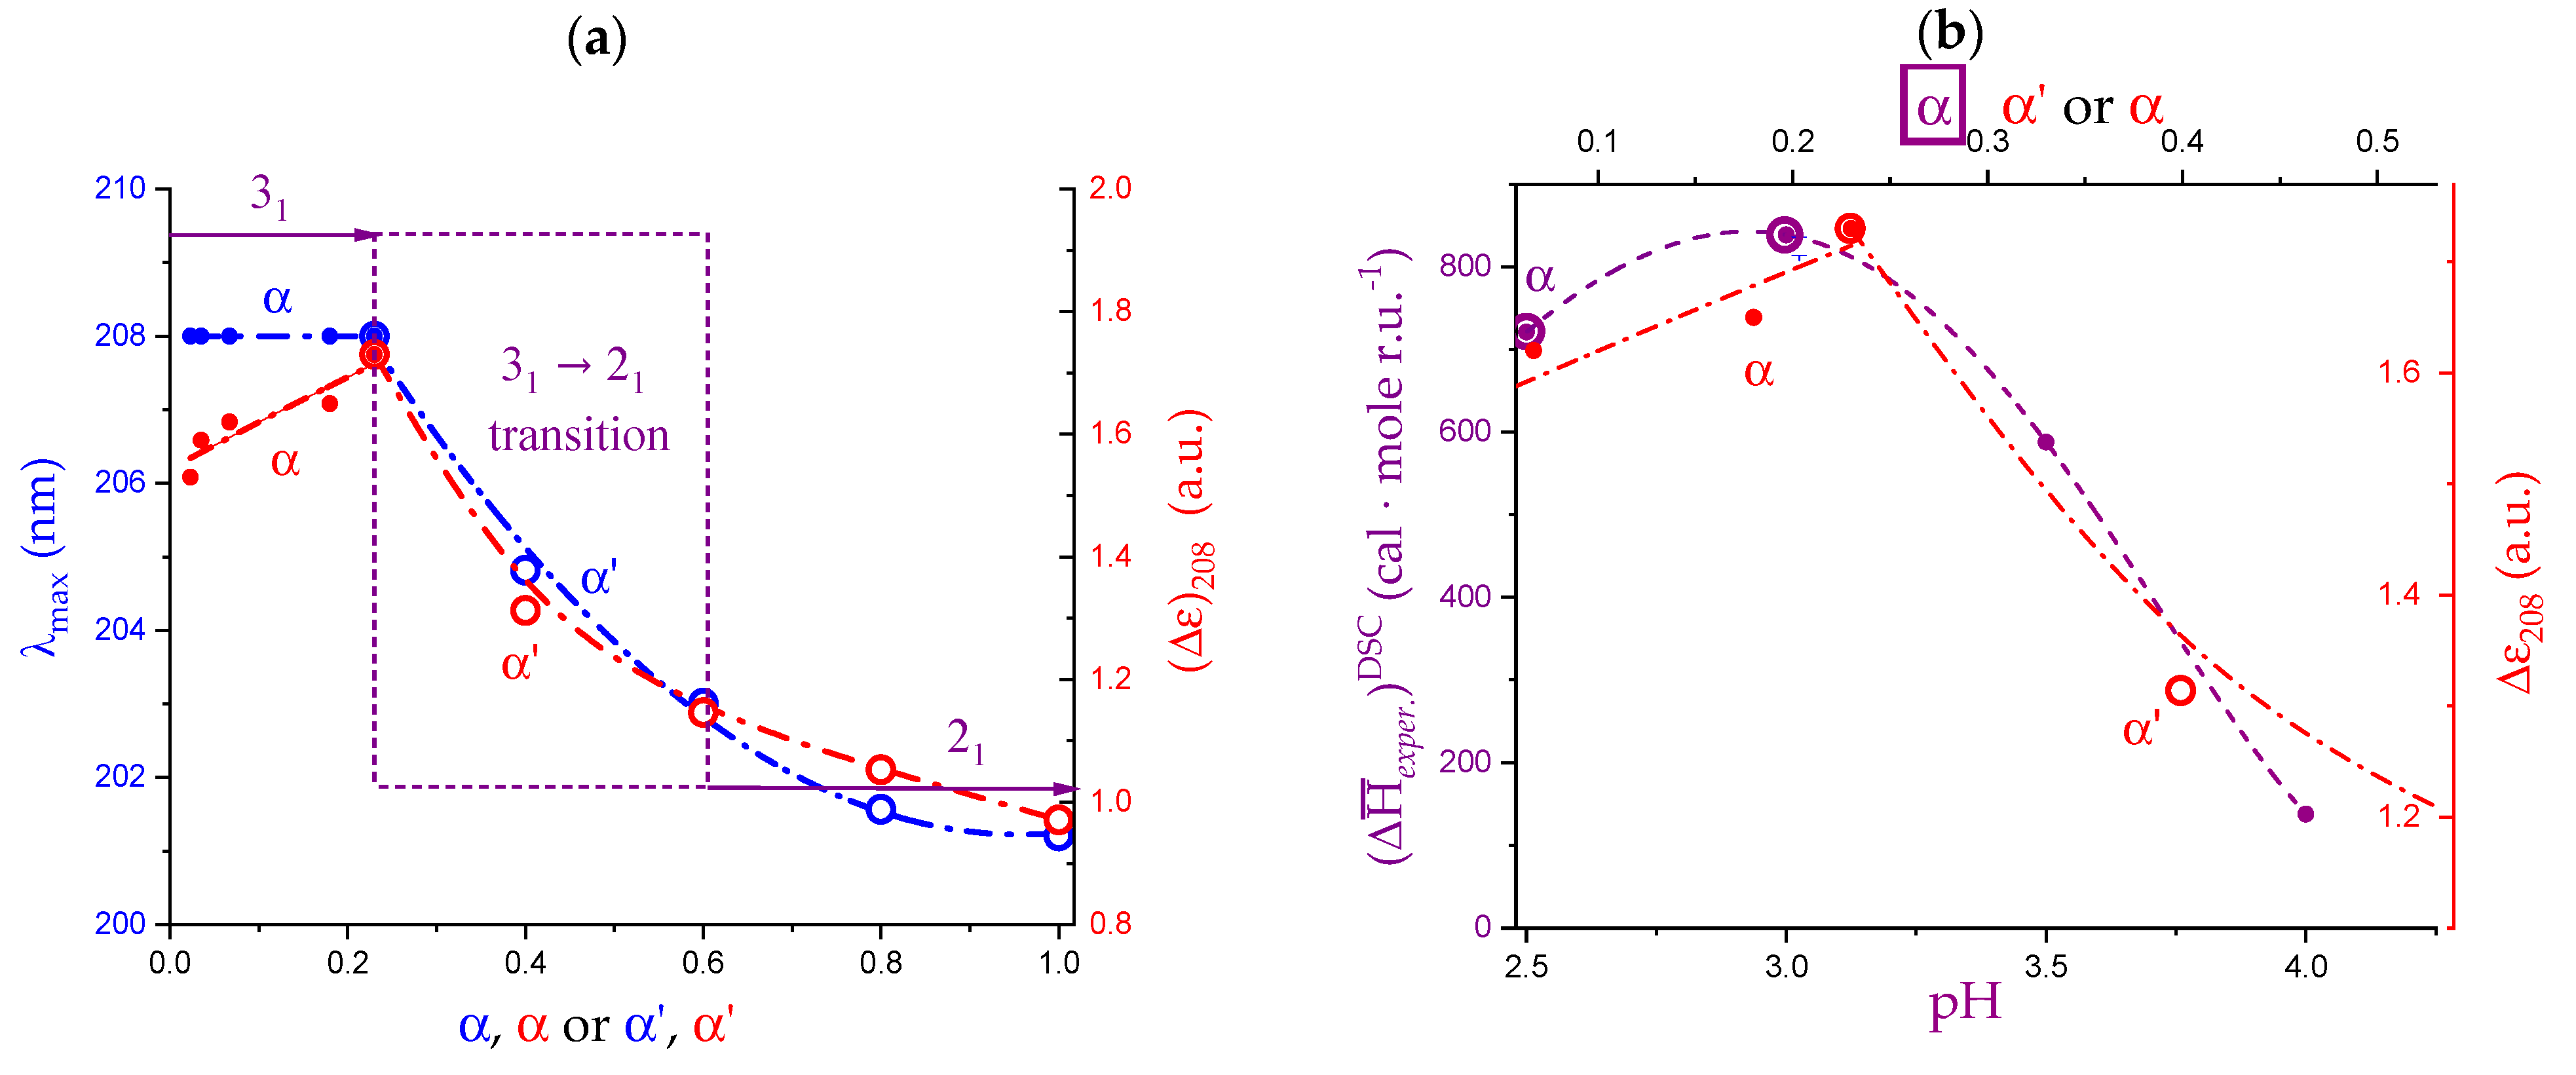
2.6. On the Peculiar Behavior of the Dependence of the Chiro-Optical Properties of Galacturonan in Water

Chiro-optical properties are among the best tools able to reveal subtle conformational details in biopolymers; to this end, the molar optical rotation [m]λ=365 and the molar ellipticity [ϑ]λ=215 of galacturonan in water as a function of α from figure 8 of reference [29] have been replotted in Figure 6a,b, respectively.
Figure 6. Dependence on α of the chiro-optical properties of pectic acid in water at 25 °C: (a) molar optical activity at λ = 365 nm; (b) molar ellipticity at λ = 215 nm.
Polysaccharides 04 00018 g006
They clearly depict the whole of the changes of conformation; interestingly, the values of α marking the beginning (α2) and the end (α3) of the 31 → 21 transition perfectly match those from viscosity and (pKa)app. in Figure 1. However, a peculiar behavior is immediately apparent. In most of the plots showing the dependence of chiro-optical parameters, accompanying a pseudo-first order transition, on the independent variable (e.g., temperature, specific ion concentration, charge density …), a sigmoid curve joins two roughly horizontal traits, corresponding to the specific property of the initial and final states, respectively, but not in this case. The traits of both properties before α2 and beyond α3 clearly show slopes markedly different from zero. Even more strikingly, the sign of their slopes is opposite: in the low α range both curves increase with α, whereas in the range of high α they decrease.
The data of (Δε)(α) at λ = 208 nm from Table 2 and figure 7 of the paper by Ravanat and Rinaudo [7] have been replotted, together with the data of Figure 6a,b, in Figure 7a. In spite of a limited scattering of the data points, the three sets of data converge in identifying three different areas of trend, exactly matching the three regions defined in the discussion of Figure 1. In particular, a maximum of all chiro-optical properties is noticed at about α = α2.
The results of Figure 7b are—at least—equally surprising. The optical activity data of LMP in water from figure 11 of the paper by Gilsenan et al. [32] have been replotted as a function of pH, for various temperature (T) values. Remarkably, they all show a maximum at pH = 3.0 at all values of T, and—even more interestingly—their maximum falls very close to that of the plot of the optical activity data of Figure 6a (replotted as function of pH). The slight difference on the pH scale between the two series may easily be explained invoking the different values of both methoxyl esterification and polymer concentration and the limited number of data points of the LMP experiments.
All in all, given the accepted role of chiro-optical data as a monitor of conformational order [32], the convergent results from the data of Figure 7 suggest an increase in conformational order in region I, with a maximum order reached at α ≈ 0.2. This is followed by a neat decrease in ordering accompanying the 31 → 21 transition. Eventually, in region III, the less steep decrease in optical activity indicates that the loss of order of the loosening 21 helix is less than that of the inter-conformation change.

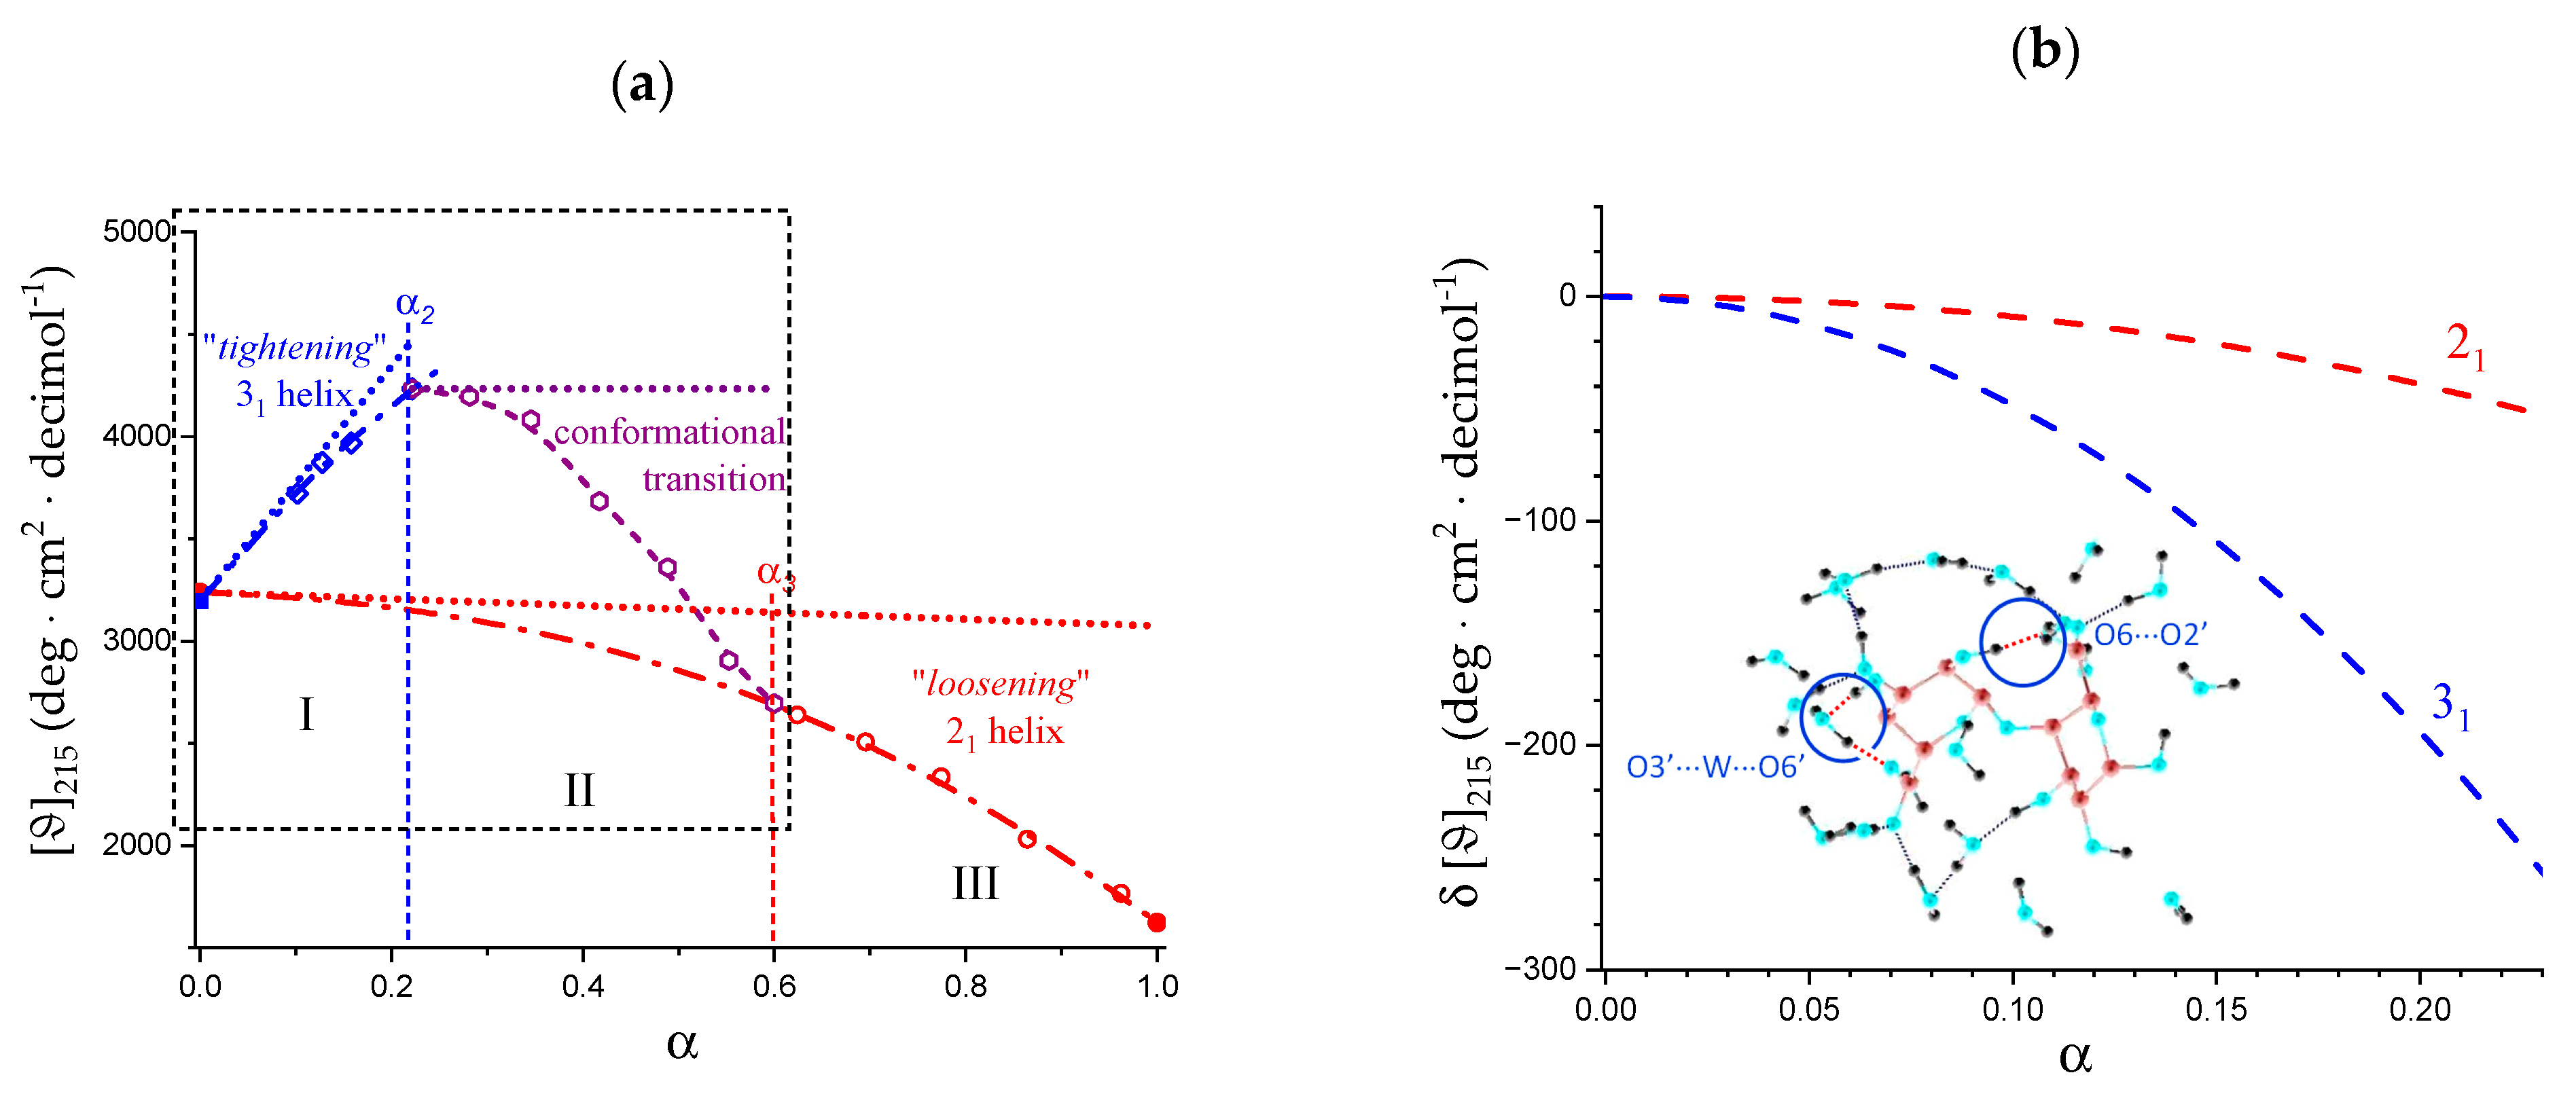
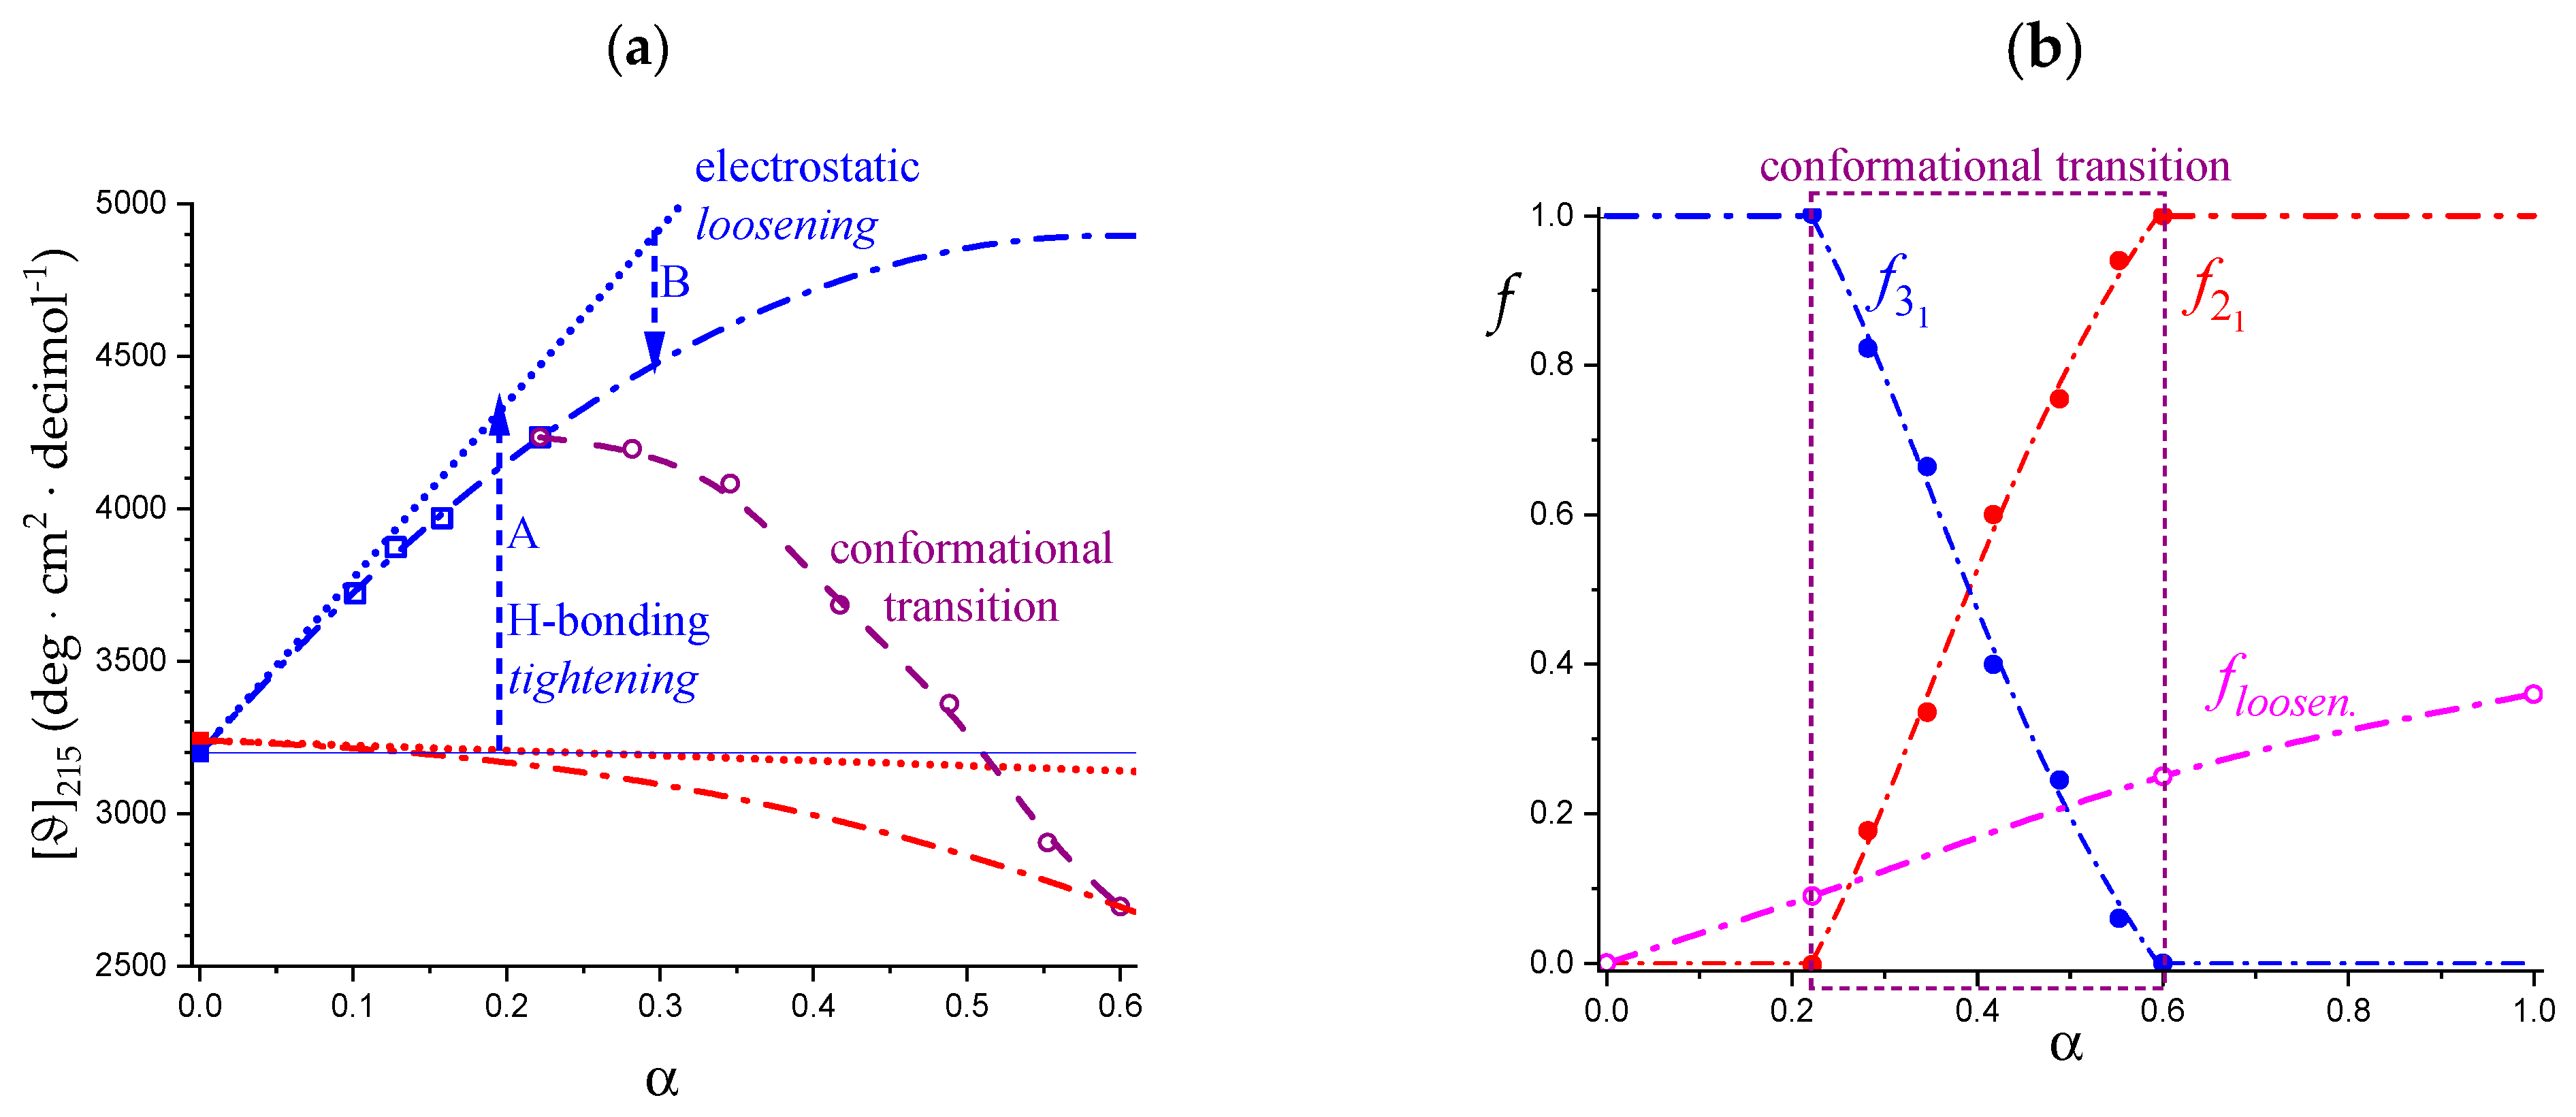
2.7. The Unique Interplay of Stiffening and Loosening of the 31 Conformation Induced by Charging: The Progress of the Conformational Transition

The molar ellipticity data of Figure 6b have been replotted in Figure 8a, where two separate non-linear fitting have been performed for regions I and III, in each of which only one type of helical conformation is supposed to exist. In region I (between α = 0.0 and α2), the best fit is a parabolic one and in region III (between α3 and α = 1.0) the fit is a hyperbolic one; they are indicated as a blue and a red dash-dotted line, respectively. Surprisingly, the values of extrapolation to α = 0.0 of both regions I and III almost coincide: they are 3198 and 3240 deg·cm2·decimol−1 for the 31 and the 21 conformations, respectively (average 3219, st.d. 0.9%). The common feature of the two fitting curves (and of the curve connecting the experimental points in the range of the conformational transition as well) is that their derivatives are always decreasing with α, irrespective of the absolute sign. This observation induced us to consider the tangent lines to the fitting curves at α = 0.0 as the limit reference curves for the experimental behavior in regions I and III, respectively. They have been drawn as short-dotted lines in Figure 8a and Figure 9a.
The reference line of region shows a large positive slope: − d ϑ 215 d α = +5736 deg·cm2·decimol−1, —whereas the slope of that of region III is extremely small and negative: − d ϑ 215 d α = −176 deg·cm2·decimol−1. The latter behavior is certainly not unexpected for a polyacid: an increase in charge density of a linear polyelectrolyte brings stress to any ordered structure, with a corresponding decrease in the correlated chiro-optical property. It is the former linear behavior, however, which is surprising. The ratio of the absolute values of the two slopes tells that the conformational behavior—according to the initial trend—of region I undergoes a (relative) transformation 33 times larger than that in region III. The short-dotted line in Figure 8a represents the increasing ordering of the 31 helix, linearly proportional to the increase in α. This effect is a conformational one, in the sense that it ascribed to the progressive build-up of local (short-range) interactions stabilizing the (cooperative) 31 helix. The intra-molecular H-bond H2 → O’6—from the non-reducing end to the reducing end of two nearest-neighbor galacturonic acid units—is present in both X-ray crystallography [2] and in all molecular modeling results published so far [31,63,69,70,71]. Its relevance derives from being an inter-residue hydrogen bond across the glycosidic linkage, therefore stabilizing the 31 helix. Oxygen atom O’6—from the carboxylic group—is always an H-bond acceptor; therefore, it is straightforward to conclude that any increase in charge on the COOH group is expected to strengthen the H-bond. As to the latter point, Guidugli et al. [31] analyzed previous work on the polyelectrolyte properties on the dissociation of weak polyacids (namely, polycarboxylates). They suggested that in the case of pectic acid, the best representation of the charge distribution at intermediate values of α is also that of a fractional charge on all uronate groups, due to the tremendous mobility of H+. Figure 1 of reference [31] has been reproduced in the inset of Figure 8b; the inter-residue H-bond H2 → O’6 has been indicated, together with the water-mediated H-bond linking O’3 with O’6 (the latter is an intra-residue bond, which brings only an indirect contribution to the stabilization of the disaccharide conformation). The linear increase in order with α then likely reflects the linear increase in fractional charge.
From the thermodynamic standpoint, it should be recalled that the process of H-bond strengthening of the 31 helix up to α2 is followed by the opposite change of H-bond breaking between α2 and α3, following the transition to the 21 helix. It means that the two sequential effects—both as to enthalpic and entropic changes—exactly cancel in the process of increasing α from, say, α1 to α = 1.0. Therefore, the values of Δ X ¯ 3 1 2 1 e x c e s s α ,   Δ X ¯ l o o s e n . e x c e s s (α) and Δ X ¯ t o t a l e x c e s s (α)—with X ¯ = H ¯ , S ¯ , G ¯ —in Table 2 will not be affected. An estimate of the enthalpy and entropy changes associated with the H-bond strengthening of the 31 helix is given hereafter in Section 3.2.
However, in parallel with the described effect, a long-range repulsive interaction between partially charged groups builds up; it is the polyelectrolyte effect correlated with the increase in α. The fact that the difference between all three fitting curves and the tangent to those curves at the beginning of the respective range is negative demonstrates that the increase in charge density produces a generalized loosening of all ordered conformations. The effect is proportional to α with a power larger than 1. As shown in Figure 8b, in region I, the destabilizing effect of loosening produces a much more dramatic decrease in conformational ordering on the 31 than on the 21 helical form. The reason for this is to be traced back to the intrinsic larger stiffness of the former conformation which withstands the electrostatic stress much worse than the intrinsically flexible helix of binary symmetry. At around 20% of group charging, the system starts relaxing the electrostatic stress by undergoing the 31 → 21 conformational transition and the parallel breakdown of the strongly H-bonded 31 conformation. A more comprehensive discussion of the above arguments is referred to in Section 5.2, in view of the viscometric results as a function of supporting salt concentration and ionic strength.
The red dash-dotted curve represents the progressive loosening of the 21 helix that accompanies an increase in α, with an acceleration of the trend between α3 and α = 1.0. The inset of Figure 4a shows a perfectly parallel trend between the chiro-optical data and the results of the heat of dilution in that range. The former ones point to a decreasing chiro-optical order, the latter one to increasingly lower—but always endothermic—heat effects due to a progressively looser 21 conformation.
Figure 9a is the blow-up of the area in the dotted rectangle of Figure 8a, to highlight the initial and the transition ranges. The two blue curves describe two opposite effects brought about by the same physical process, namely an increase in charge density; they have been indicated by an upward arrow (A) and a downward one (B). The origin of this seemingly contradictory behavior has been already addressed; a discussion on its possible effect on the curve of the enthalpy of dissociation is postponed to the following Section.
Using the experimental chiro-optical data of Figure 9a and the two dash-dotted curves as the limiting curves for the pure 31 (blue) and 21 (red) conformations, it is possible to calculate the fractions of 31 and 21 conformation, respectively, in the course of the conformational transition. The results have been reported in Figure 9b together with the calculated values of the fraction of “loosening” from calorimetry. The numerical values of the latter ones are reported and discussed in Section 5.1 about capillary viscosity, in which there is also a discussion of the finding that the value of α, at which the two fractions are equal, α1/2 ( f 3 1 = f 2 1 = 0.5), is α = 0.4, which will be given in relation to the whole-chain behavior of galacturonan.

2.8. Opposing Enthalpic Effects upon Charging the 31 Helix

The comparison of the values of both the loosening and of the 31 → 21 transition enthalpy change in “water” and in “salt” shows that those in the latter condition are always larger than in a salt-free solution.
The simultaneous presence of an “H-bonding tightening” effect and an “electrostatic loosening” one—as evidenced by the chiro-optical data of Figure 8 and Figure 9—necessarily implies an enthalpic counterpart. Hydrogen bond formation is accompanied by a negative internal energy (enthalpy) change [72]; however, in the process under scrutiny, only a partial formation (strengthening) can be envisaged, with a reasonable contribution probably one or two orders of magnitude lower than that of full formation in vacuum. (An estimated value of the enthalpic effect is given hereafter in Section 3.2). Helical loosening, on the other side, is an endothermic process (see Table 2). It is than quite likely that a partial compensation of effects is at the root of the lower value of Δ H ¯ l o o s e n . e x c e s s in water (namely, 0.10 vs. 0.13 kcal·mol−1). Scheme 3 gives a pictorial representation of the above argument, with a part of the endothermic signal being masked by the exothermic H-bond formation.
The former process is expected to grow according to a power law dependence on α larger than 1, whereas the dependence of the latter one should be essentially linear. This would entail an increasing “distortion” of the calorimetric data upon decreasing α. In turn, this would affect the critical set of data points at the beginning of the integration range for the determination of the “excess” heat effect of transition, explaining the underestimate of Δ H ¯ 3 1 2 1 e x c e s s in “water” with respect to that in “salt”.

3. The Temperature-Induced Conformational Transition of Galacturonan

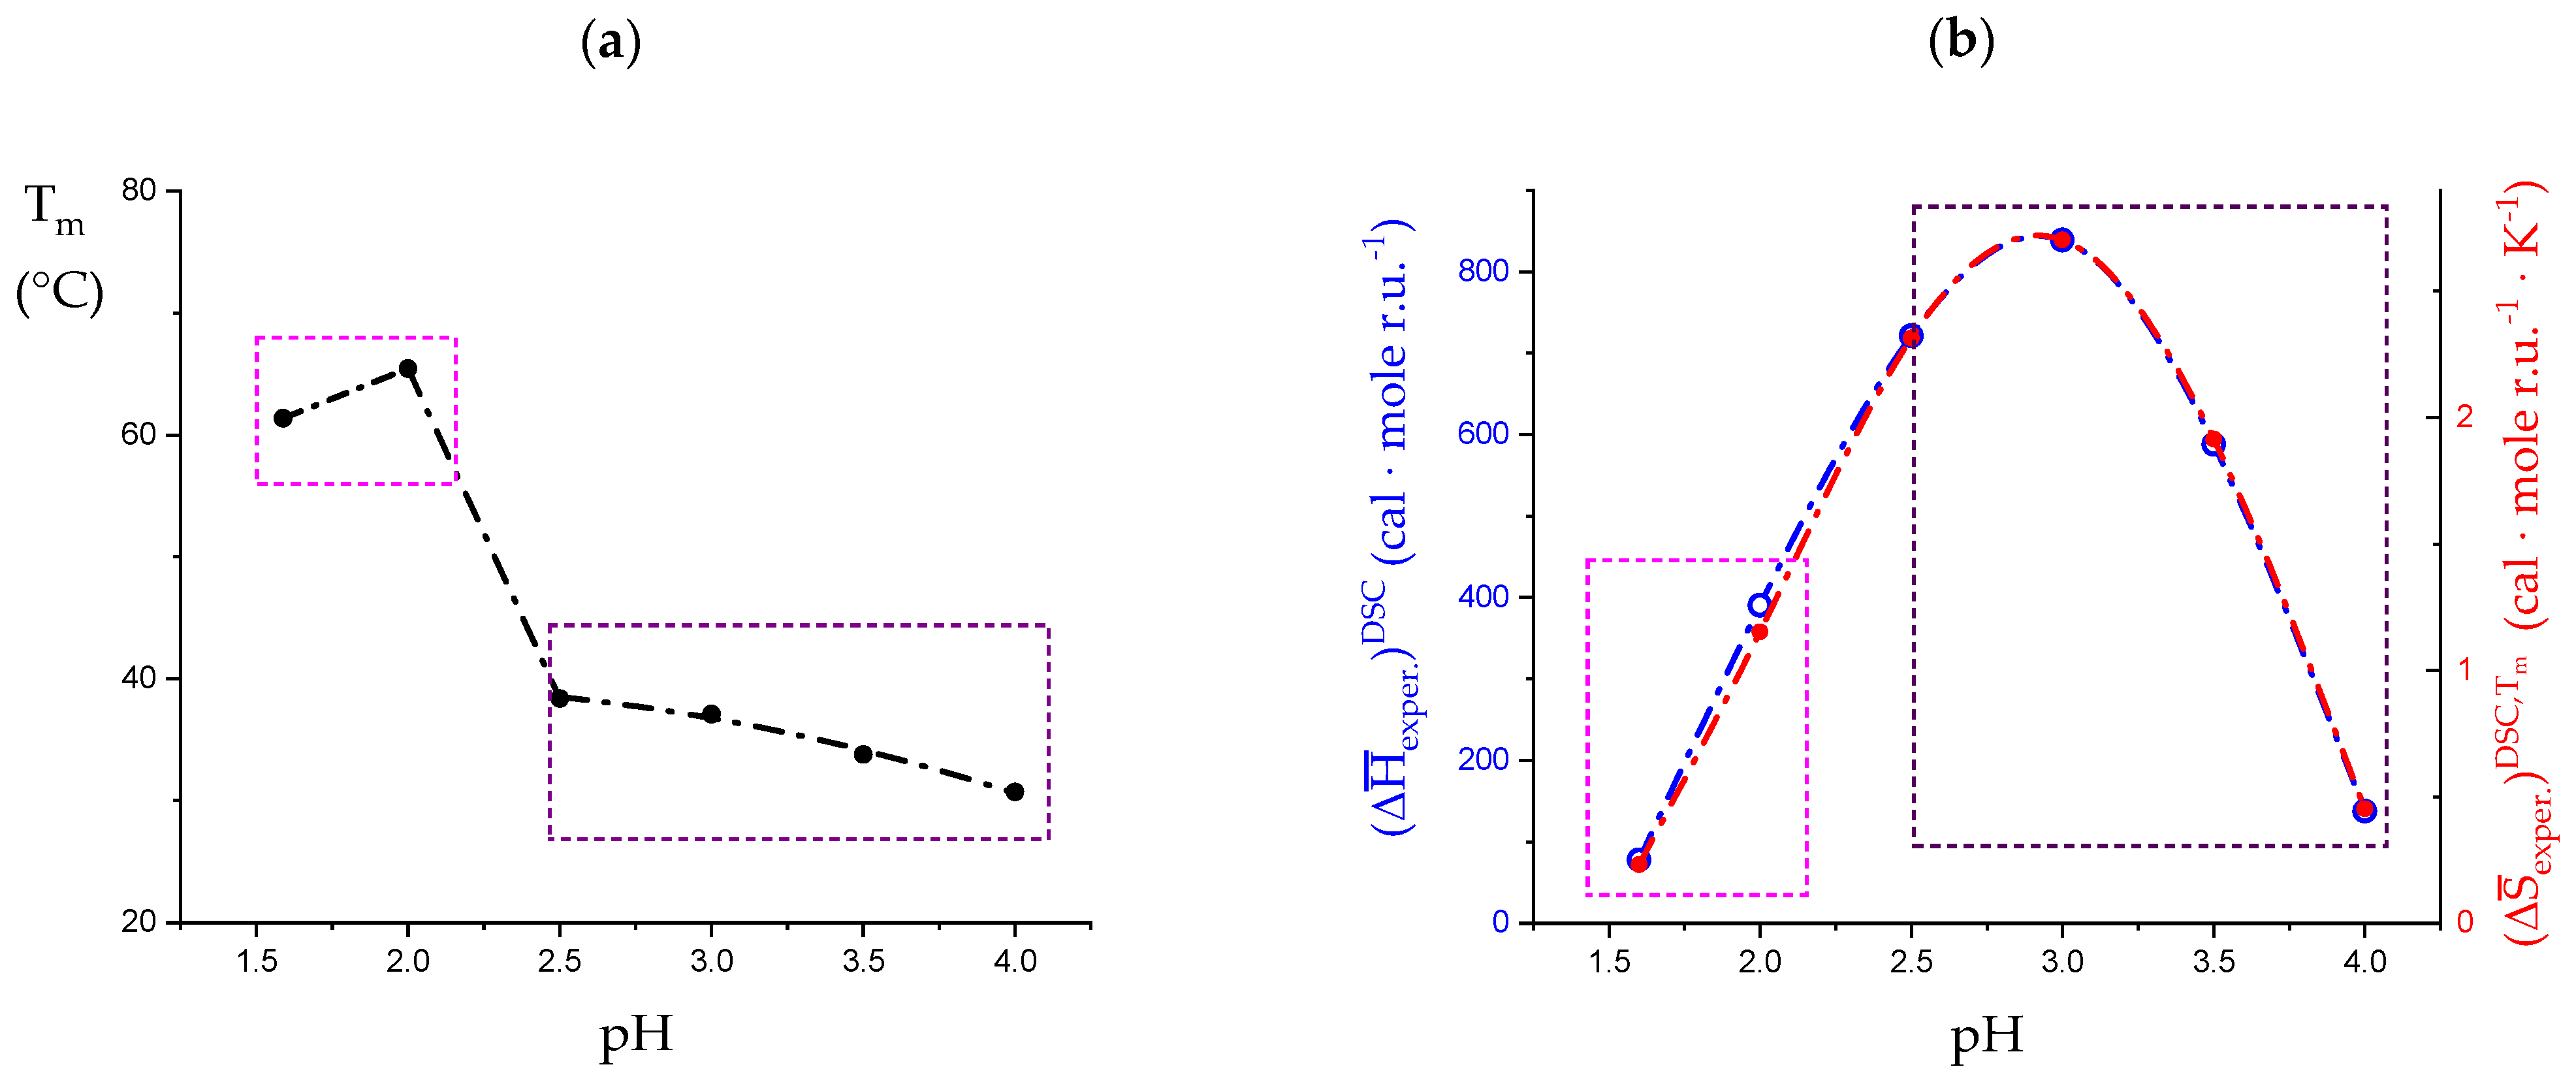
3.1. Enthalpy Changes and Melting Temperatures from DSC Data

In a typical DSC experiment [32], a 3% LMP solution at an acidic pH value (≤4.0) and at 10 °C was made to pass from a strong gel (for very low pH), or from a viscoelastic system (for the higher pH values investigated), to a viscous fluid at 85 °C, with the breakdown of the interchain junctions that are at the root of the chain association. In the initial condition, the polymer conformation is that of a fully (or at least largely) attained 31 helical form, in turn “loosened” to a variable extent with respect to the “perfect” helical conformation, as discussed in the preceding Section. The final state is always a condition of considerable conformational disorder (“looseness”). In the by far larger number of cases, the symmetry of the imperfect helix is the 21 one, albeit some remnants of the loosened 31 one may be present under some circumstances.
The observed heat effect in a DSC experiment, Δ H ¯ e x p e r . DSC , can be tentatively supposed to be made up of three contributions:
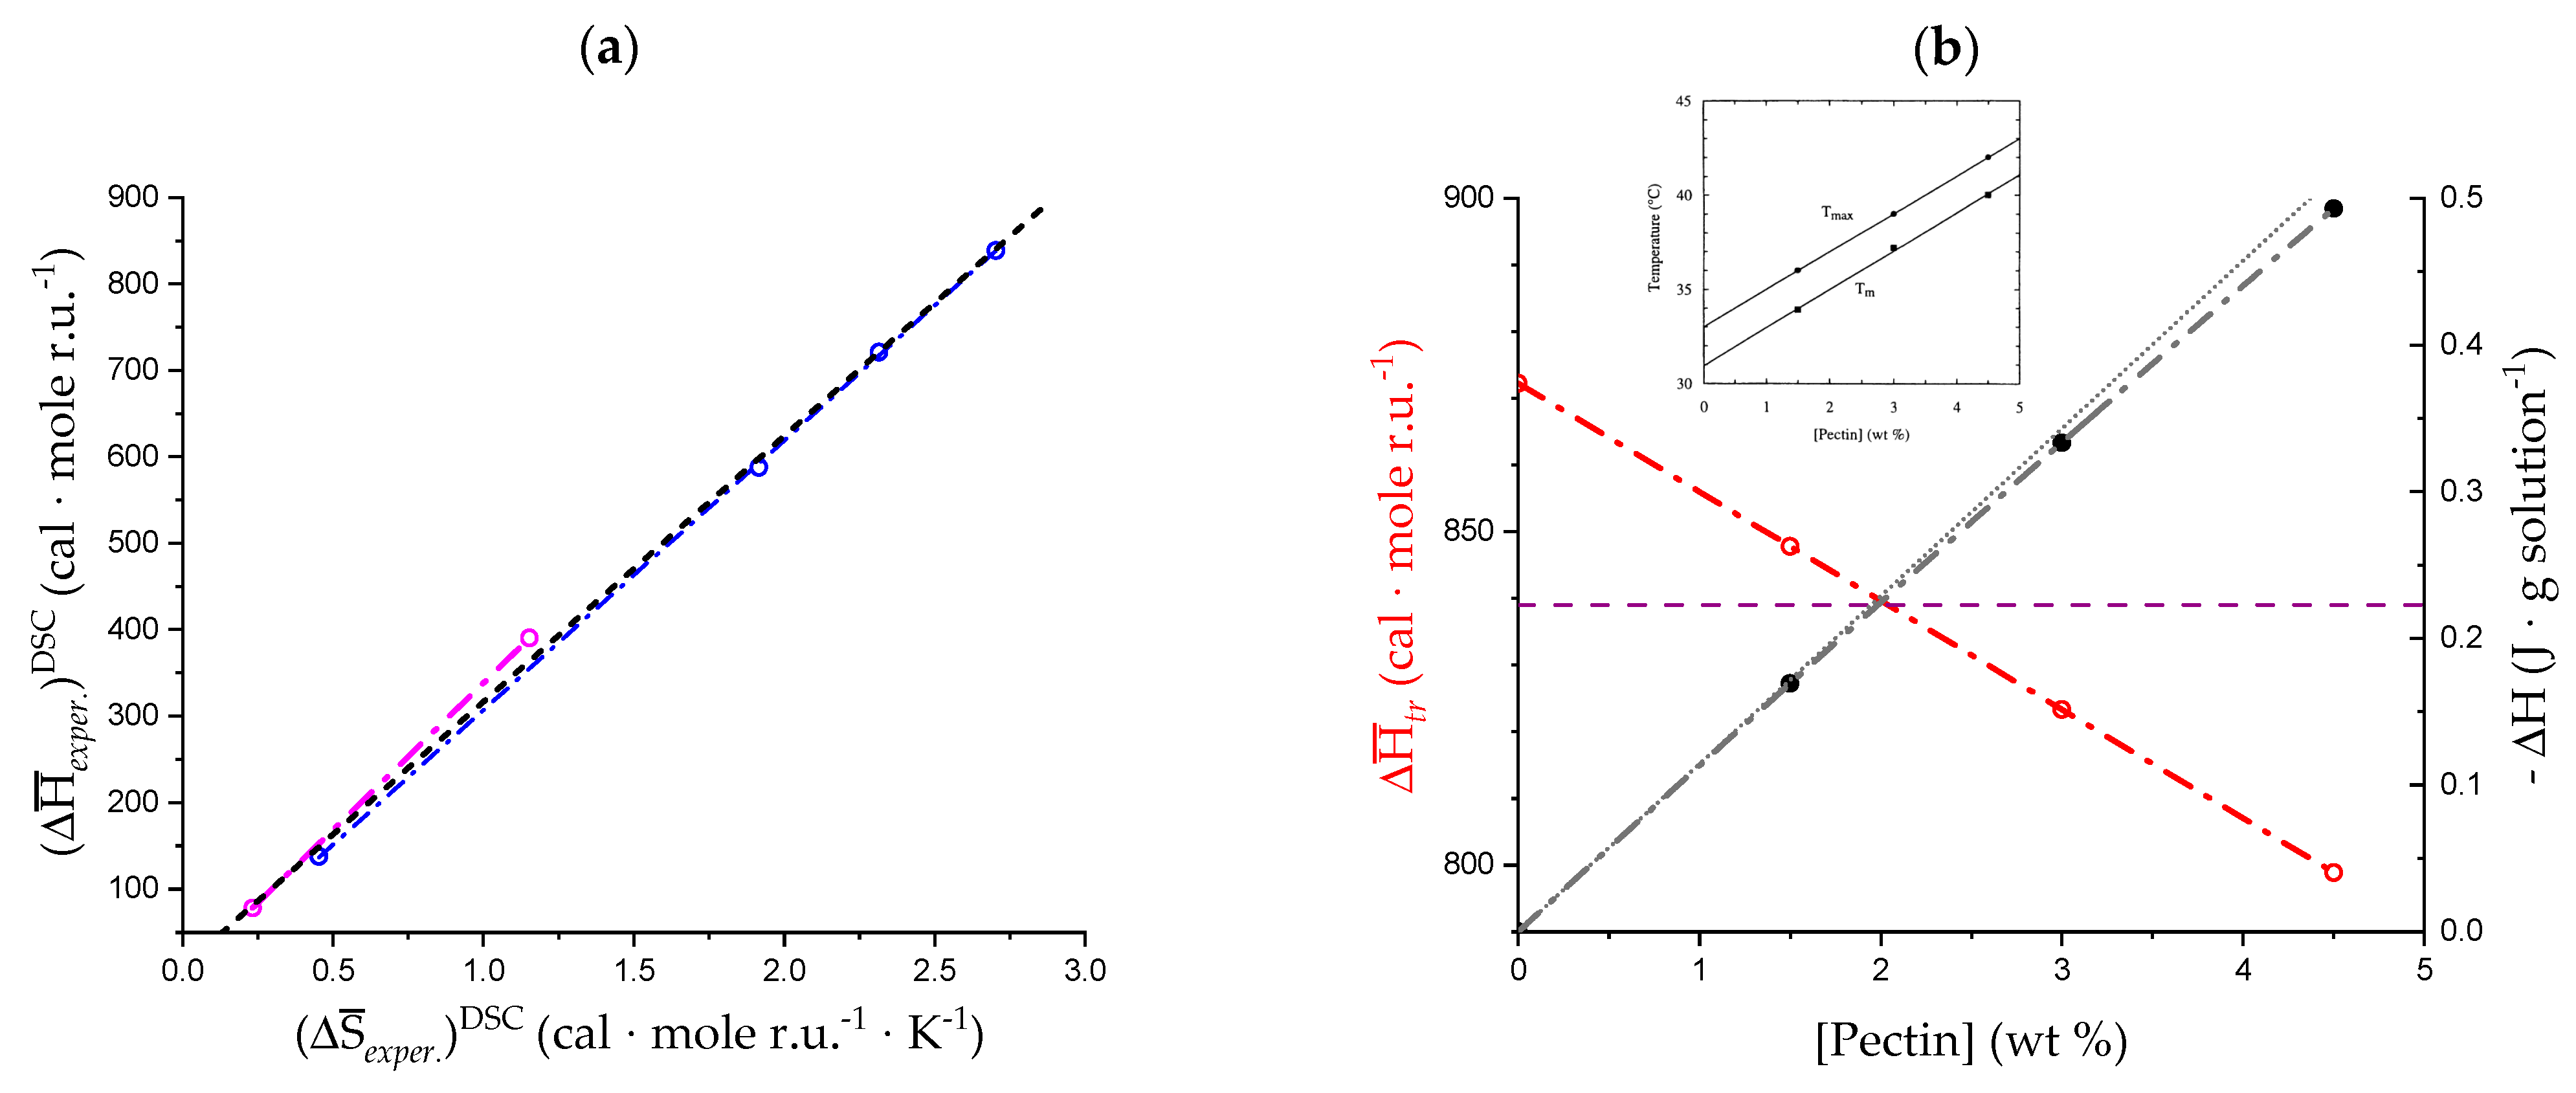
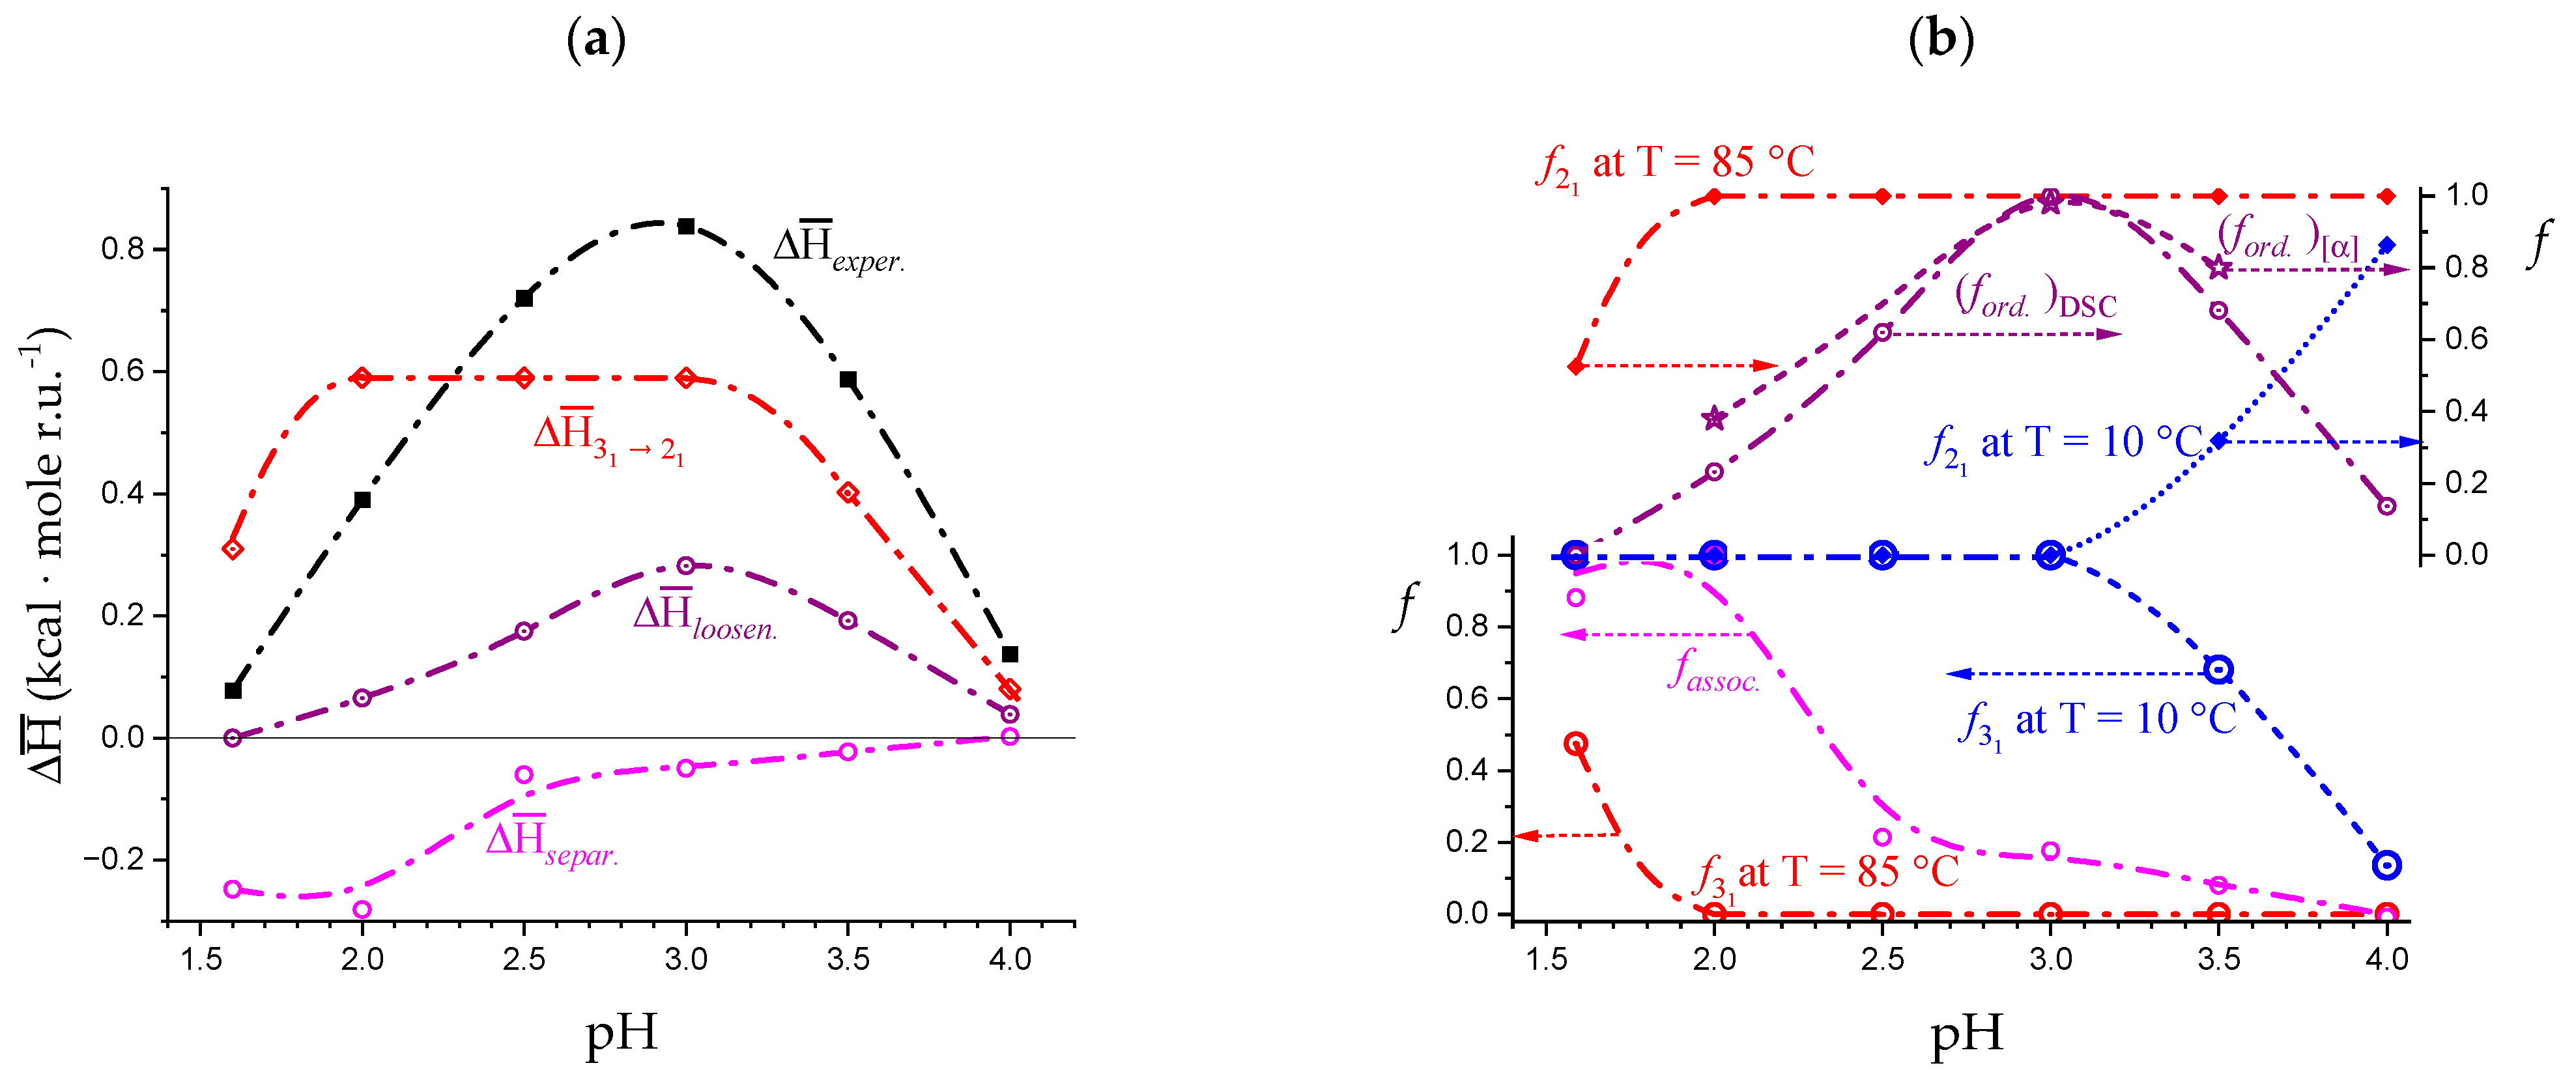
  • The enthalpy change accompanying the “melting” of the associated structures. The presence of contacts between chains (association), which is a prerequisite of gel formation in LMP, was demonstrated by light-scattering experiments [38]. It is quite reasonable to suppose that the junctions are held together thanks to hydrophobic (van der Waals) interactions between the COOCH3 groups of facing chain stretches (with a correlated enthalpy change in association, Δ H a s s o c . t r ). Their melting brings about a negative (exothermic) value of Δ H , Δ H s e p a r . DSC , with the opposite process being endothermic: “The formation of the hydrophobic bond is endothermic at low temperatures” [13] ( Δ H s e p a r . DSC = Δ H a s s o c . DSC ; separ. stands for “(chain) separation”, having restricted the word “dissociation” to the ionization process of galacturonic acid). From the experimental standpoint, negative (exothermic) values of Δ H have been observed in several associated systems held together by hydrophobic interactions [56,58,73]. In experiments of melting, like in the DSC heating experiments, one should then expect that the experimental enthalpy of melting—albeit being endothermic due to conformational transition, see points 2. and 3.—becomes increasingly less endothermic upon increasing polymer concentration, Cp. This increasing exothermic contribution stems from the obvious assumption that association if favored by an increase in Cp. Of course, in principle, other interchain interactions might also be present, like interchain hydrogen bonds. In this case, however, breaking such bonds would bring about an endothermic enthalpy change, indistinguishable from those described hereafter in 2. and 3. and, more important, it would add to those, thereby increasing the net endothermic effect;
  • The enthalpy change accompanying the conformational transition from the 31 to the 21 helical symmetry, Δ H 3 1 2 1 DSC . This effect is endothermic and, for the 100% change in conformation, it coincides with the value of Δ H ¯ 3 1 2 1 e x c e s s ( Δ H ¯ 3 1 2 1 e x c e s s = +0.59 kcal·mole r.u.−1), reported in Table 2 for the “salt” case from ITμC experiments. Should the final 21 conformation be only partially present in the initial state, then the extent of this effect would be equal to f 3 1 · Δ H 3 1 2 1 DSC , where f 3 1 is the fraction of the polymer in the 31 conformation, trivially being f 2 1 + f 3 1 = 1;
  • The enthalpy change accompanying the loss of order (“loosening”) of either regular conformation that accompanies the progressive increase in temperature, Δ H ¯ l o o s e n . DSC . This effect is endothermic (as very well known for the full order → disorder transitions of proteins and nucleic acids) and it coincides with the entity called Δ H ¯ l o o s e n . e x c e s s in Table 2; its value can vary depending on the given set of initial and final states;
  • The sum of Δ H 3 1 2 1 DSC and of Δ H ¯ l o o s e n . DSC . can be operationally identified with Δ H ¯ t r DSC , i.e., the enthalpy changes of the two processes pertaining to the transition of the isolated chain, corresponding the processes whose thermodynamic quantities have been reported in Table 2. On the other side, all terms contributing to chain–chain dissociation are collectively expressed by Δ H s e p a r . DSC .
Altogether, it is then possible to write for the enthalpy change in “melting”:
Δ H ¯ e x p e r . DSC C p = Δ H s e p a r . DSC C p + Δ H 3 1 2 1 DSC + Δ H ¯ l o o s e n . DSC
The experimentally determined values of the melting temperature, T m , and enthalpy change, Δ H ¯ e x p e r . DSC , from figure 8a,b of [32] have been replotted in Figure 10a,b, respectively. They have been obtained at different values of pH in the interval from 1.6 to 4.0 for an LMP concentration, Cp, Cp = 3 wt%. For the lowest pH values (namely 1.6 and 2.0), the bimodal grouping of the values of T m would indicate that some additional type of process becomes progressively apparent in that range of pH. It is paralleled by a very marked decrease in the experimentally determined endothermic heat effects (recalculated on the kcal·mole r.u.−1 scale). As to entropy, the Δ S ¯ e x p e r . DSC , T m pH values have been calculated from the experimental Δ H ¯ e x p e r . DSC and T m values, trivially calculated as follows: Δ S ¯ e x p e r . DSC , T m pH = Δ H ¯ e x p e r . DSC pH T m pH ; furthermore, those results have been reported in Figure 10b. Scrutiny of Figure 10b, however, seems to largely reconcile the anomaly of Figure 10a.
To test the latest hypothesis, we analyzed the enthalpy/entropy correlation by plotting the enthalpic data as a function of the entropic data, both from Figure 10b and Figure 11a.
A linear correlation between the enthalpy changes of a series of experiments and the corresponding entropy changes is generally accepted as a proof that the underlying process is the same (“enthalpy-entropy correlation”, or Barclay–Butler-type relation) [55]. The data of the group in the pH range from 2.5 to 4.0 show a very good linear correlation (R2 = 0.99986), with a slope of 312.0 ± 2.6 K. The slope of those in the pH range from 1.65 to 2.0 is 339.6 (trivially being R2 = 1.0). However, the latter couple of data points lay very close to the former group; in fact, a linear correlation of all the data of the two sets provides an equally good correlation (R2 = 0.99902), with a slope of 307.4 ± 6.8 K. This finding allows for the conclusion that the fundamental processes underlying all the different experimental conditions are largely the same.
The bare experimental enthalpy data points from a DSC scan of methoxylated galacturonan (“pectin”) at pH = 3.0, for three values of the polymer concentration, were reported in figure 10a of reference [32]; they are given in J per g of solution investigated. They have been replotted here in Figure 11b (black full circles and lines). Although not far from a linear behavior, a polynomial of the second order gives a better fit of the data (R2 = 1!), pointing to a slight, but clear, departure from linearity upon increasing concentration. Upon taking the derivative of the curve with respect to the concentration, taking into account the equivalent weight of the polymer (319 g·equiv.−1) and passing from the joule to the calorie scale, one obtains the data plotted (as red open circles) in Figure 11b, which—in accordance with premise—show a perfect linear behavior. Formally:
Δ H ¯ e x p e r . DSC C p = Δ H ¯ e x p e r . DSC C p = 0 + d Δ H ¯ e x p e r . DSC d C p · C p  
The result lends itself to only one conclusion: upon increasing concentration, a small but clear exothermic effect becomes increasingly evident. Given its concentration dependence, it is to be associated with the mentioned enthalpy change in chain separation:
d Δ H ¯ e x p e r . DSC d C p   d Δ H s e p a r . DSC d C p = d Δ H a s s o c . DSC d C p  
The value of the intercept of the plot of Δ H ¯ e x p e r . DSC C p , Δ H ¯ e x p e r . DSC C p = 0 , is +0.872 kcal·mole r.u.−1 and that of the slope −16.316 cal·mole r.u.−1·(wt%)−1. The (linearly averaged) value reported by Gilsenan et al., Δ H ¯ e x p e r . DSC C p = 3 % , is +0.84 kcal·mole r.u.−1 for pH = 3.0, after transformation to the same scale (see horizontal dashed line in Figure 10b).
Interestingly, the values of the temperature of both the maximum of the calorimetric peak (Tmax) and of the transitional midpoint (Tm) depend linearly upon the polymer concentration. In particular, they increase upon increasing Cp. The inset of Figure 11b is the reproduction of the original Figure 10b with the Tmax and Tm (Cp) data [32]. Also, in this case (replotting not shown), it formally holds as follows:
T m C p = T m C p = 0 + d T m d C p · C p
The intercept of the linear plot (R2 = 0.9985) of T m C p is T m C p = 0 = 304.08 K and slope 2.05 K·(wt%)−1. For the two cases, the intercept at Cp = 0 wt% can be taken as the values of the enthalpy change Δ H ¯ e x p e r . DSC C p = 0 = Δ H ¯ t r DSC and of the melting temperature T m C p = 0 = T m t r for the transition of the isolated chain, respectively, i.e., free from any association effect. The ratio of those values is the entropy change in the transition of the isolated chain, Δ S ¯ e x p e r . DSC , T m C p = 0 , at pH = 3.0:
Δ S ¯ e x p e r . DSC , T m C p = 0 = Δ H ¯ e x p e r . DSC C p = 0 T m C p = 0 = Δ S ¯ t r DSC , T m
with Δ S ¯ t r DSC , T m = +2.87 cal·mole r.u.−1 K−1. The (linearly averaged) value reported by Gilsenan et al., Δ S ¯ e x p e r . DSC , T m C p = 3 % , is +2.70 cal·mole r.u.−1 K−1 for pH = 3.0, after transformation to the same scale (see Figure 10b).
More on the thermodynamics of association is reported in Supplementary paragraph 3.
For the particular case of Cp = 3 wt%, which is the concentration of all reported DSC calorimetric data, the increase in Tm with respect to Cp = 0 wt% is 6 °C, whereas the enthalpy difference, Δ H ¯ s e p a r . DSC C p = 3 % , is—49 cal·mole r.u.−1. Unfortunately, no data as a function of concentration are available for the curves obtained at pH values other than 3.0. The knowledge of both Δ H ¯ e x p e r . DSC and Tm would have enabled evaluating the thermodynamic parameters of association in those conditions directly from experimental data. In the absence, any attempt at producing a solid quantitative evaluation of the different contributions to Δ H ¯ e x p e r . DSC must rely on some assumptions. It was decided to arrive at some rough estimates, based on questionable but verifiable hypotheses. The available results encompass a wide range of experimental conditions. The only purpose of this procedure was to provide a qualitative picture to comparatively rationalize such valuable results in terms of simple underlying physical chemical processes.
The first hypothesis is that the same qualitative behavior observed for pH = 3.0—as to the dependence of both Δ H ¯ e x p e r . DSC and Tm on Cp—holds for the other pH values: it is supported by the results of Figure 11a, namely by the good enthalpy/entropy correlation.
Recalling the purely comparative purposes of the desired estimates, the second hypothesis assumes the case at pH = 3.0 as the reference for such a comparison. In particular, (i) the limit condition of T m 0 = T m c h a i n = 304.15 K is assumed to be equally valid for the other pH values at the same temperature, and (ii) the same correlation between the decrease in Δ H ¯ e x p e r . DSC and the increase in Tm is assumed to hold for the other pH values. Consequently, the (excess) enthalpy change in dissociation (separ.) at the conventional Cp value of 3 wt% at any pH value can be obtained from the following:
Δ H s e p . DSC C p = 3 w t % pH = d Δ H ¯ e x p e r . DSC d C p d T m d C p · T m C p = 3 w t % pH T m 0 C p = 3 w t % pH = 3.0  
where d Δ H ¯ e x p e r . DSC d C p   = −16.316 cal·mole r.u.−1·(wt%)−1 and d T m d C p = 2.05 K·(wt%)−1, respectively.
According to the above hypothesis, one can correct the experimental enthalpy changes at different pH values for the concentration effect, using the corresponding values of Tm (and bringing the results back to the common reference case of pH = 3.0). The results of Δ H s e p a r . DSC (magenta) have been reported as in Figure 12a. Not surprisingly, the two cases of condition at—or below—pH = 2.0 show a massive presence of interchain association (the relative values of association, calculated as the ratio of Δ H ¯ s e p a r . DSC (pH) over the maximum observed value of Δ H ¯ s e p a r . DSC , i.e., at pH = 2.0, have been reported in Figure 12b). However, given the significant polymer concentration conditions used, association is present at least up to pH = 3.5. This point will be discussed later in relation to the rheological behavior.
Figure 12a also reports the values of the enthalpy changes of conformational transition, Δ H 3 1 2 1 DSC , and of chain “loosening” (disordering), Δ H ¯ l o o s e n . DSC , in the thermal transition, calculated as described in Supplementary paragraph 3.4. Also, in the case of the latter processes, the corresponding relative fractions (with respect to maximum) have been reported in Figure 12b. The resemblance of the behavior—with a maximum—shown by the optical activity data is striking. It is noteworthy that they have been obtained in the same range of conditions: see Figure 7b and Figure 12b. Before displaying those results, a discussion on the dependence of the various contributions on pH will be given in the next Section.

3.2. Insights into Conformational Changes from Data as a Function of Temperature

The pH range 2.5 to 4.0 investigated in the paper by Gilsenan et al. is the one which better lends itself to a comparison with the data at 25 °C by Ravanat and Rinaudo and by Cesàro et al. Figure 12b indicated that the fraction of associated material (at the starting temperature of 10 °C) decreases from about 20% (of maximum) at pH = 2.5 to zero at pH = 4.0. This therefore narrows the focus on the main involved effects to the inter-conformation 31 → 21 change and to the loosening effect. The chiro-optical results published by Ravanat and Rinaudo [7] have been reproduced here in Figure 13a. The blue data points clearly show that the wavelength of the maximum of the n → π* CD transition of pectic acid, λmax, is a peculiar function of the degree of dissociation (α) (or, in a correlated way, of the degree of charge neutralization α’, being α = α’ + (10−pH/Cp) with Cp defined in Section 2.1). The value of λmax is inversely proportional to the energy change associated with the transition; it is therefore a valuable source of information for the identification of the conformation in the initial state. In fact, the constancy of λmax in the particular range of pH (and hence of α’) demonstrates that up to a charge fraction of just about slightly more than 0.2, the only existing conformation is the 31 one: “when the equilibrium is displaced to favor the associated form (COOH), the absorbance Δε decreases without changing the absorption wavelength (λ = 208 nm)” [7]. For a further increase in pH (i.e., of α), the conformational equilibrium progressively shifts to the 21 form, associated with a higher transition energy (shorter wavelength). In parallel, the red data points (Δε, ellipticity) recall that there is a modulation of the transition probability corresponding to an increase in ellipticity (i.e., ordering) in the 0.0 < α < 0.2 range. It is followed by a steep decrease due to the 31 → 21 conformational transition up to α = 0.6, and finally by a less steep decrease up to full neutralization with progressive loosening of the chain order (see discussion in Section 2.7).
The Δε data have been replotted together with the DSC ones in Figure 13b. The values of the degree of dissociation of the latter solutions—indicated by the open purple circles—was calculated from proper extrapolation to the concentration of 3 wt% of the potentiometric data (pKa vs. α) in water by Cesàro et al. [29] The slight difference on the abscissa is clearly due to the much lower Cp value of the solution in the CD experiments—0.16 wt%, vs. 3 wt% in the DSC ones—and to the difference of temperature—25 °C vs. 10 °C. The parallel is striking: (i) at pH = 3.0, both the measured enthalpy change and Δε show their maximum value; (ii) Δ H ¯ e x p e r . DSC at pH = 2.5 is lower than at pH = 3.0 due to a lower degree of order (as also revealed by the Δε data); (iii) the decreasingly lower Δ H ¯ e x p e r . DSC data points—at pH = 3.5 and pH = 4.0—pertain to systems that contain mixtures of 31 and 21 conformations with a significantly decreasing fraction of the former one.
These premises allowed separating the inter-conformational (31 → 21) from the “loosening” enthalpy change values as a function of pH (see Supplementary paragraph 3.4 and data of Figure 12a). The representation of the fractions of the different parameters as a function of pH in Figure 12b leads to the following remarks: (i) at 10 °C some association is present in all the investigated pH conditions, but it is highest at pH = 2.0 and below; (ii) maximum ordering (“tightening”) is achieved at pH = 3.0 (the origin of the found behavior, which perfectly parallels the dependence of [ϑ]215 of Cesàro et al., was amply discussed in Section 2.7); (iii) beyond pH = 3.0, even at T = 10 °C, the increase in polymer charging increasingly destabilizes the three-fold helix in favor of the two-fold one; (iv) surprisingly, the opposite behavior is found in the condition of lowest charging (pH = 1.6) at T = 85 °C, where high temperature is shown to be unable to fully destabilize the 31 helix in favor of the 21 one ( f 3 1 = 0.48).
As to above point (ii), it is possible to arrive at an estimate of the enthalpy and entropy changes associated with the proposed strengthening of the inter-residue H-bond, Δ H ¯ H b o n d and Δ S ¯ H b o n d , respectively. The variation of Δ H ¯ l o o s e n . DSC —in Figure 12a—between pH = 1.6 and 3.0 corresponding to the opposite process of H-bond breaking suggests a value of about −0.28 kcal mole r.u.−1 for Δ H ¯ H b o n d . In full analogy with the procedure described in Supplementary paragraph 3.4 for the enthalpy values, considering the nil value of the loosening terms at pH = 1.6, and using the quoted values—in cal mole r.u.−1 K−1—of Δ S ¯ t r DSC , T m = +2.87 and Δ S ¯ 3 1 2 1 e x c e s s = +1.84, one can estimate the value of the entropy change accompanying the H-bond breaking as Δ S ¯ H b o n d = −( Δ S ¯ t r DSC , T m Δ S ¯ 3 1 2 1 e x c e s s ) = −1.03 cal mole r.u.−1 K−1.
The fact that the same analytical approach succeeded in interpreting data on LMP over a comparatively large range of pH (including the presence of important association phenomena) according to a behavior perfectly parallel to that of poly(galacturonic acid) corroborates the statement of Cros et. that “Of a certain interest is the conclusion that there is no significant influence of the methoxyl group on the conformational behaviour of both the disaccharide and the polysaccharide. Therefore, it may be concluded that the well known influence of methoxylation on functional properties of pectin may be arising from intermolecular origins” [11].
Scheme 4 visually summarizes the complex interplay of association, conformational transition and ordering/disordering in the critical low pH range from 2.5 to 3.5.

3.3. On the Difference between the Disordered Conformations of Pectin Brought about by Charging or Temperature

The comparison of the final states of the isothermal denaturation by increasing α to α = 1.0 (at T = 25 °C) and the thermal denaturation by increasing T to 85 °C (at pH = 3.0) is worth commenting. The statement by Gilsenan et al. who “…conclude that, as suggested in previous studies (e.g., Ravanat & Rinaudo, 1980), the preferred conformation of pectin in the solution state at high temperature and high pH (i.e., well above pK0) is highly extended, with local geometry close to that in the two-fold ordered structure” [32] applies equally well to the final state of the former transition. However, it is interesting to try to quantify such a similarity.
Table 4 reports the comparison between the parameters proportional to the extent of conformational loosening in the isothermal transition upon full charge neutralization at 25 °C with the parameters that measure conformational loosening in the thermal transition at pH = 3.0. This approach has considered the ratio of a given physical chemical property pertaining to the loosening process over the corresponding value of inter-conformation change, taken as the reference. The physical chemical properties considered were chiro-optical (molar ellipticity for isothermal and optical activity for iso-pH), enthalpic and entropic variations. Details of the values used are given in the legend of Table 4.
The results of the comparison of the ratio (thermal transition/charge transition) by the three methods produce a very similar picture: the average value is 2.3 ± 0.1. The surprising result is the absolute value of the ratio that indicates that high temperature is more efficient by more than 200% to disrupt the helical order with respect to electrostatic charging. On more specific grounds, the “loose” 21 conformation at high temperature can be reasonably considered as largely disordered (coil). On the other side, the form at α = 1.0 at 25 °C retains a significant part of the two-fold order, which renders the loose-helix ready to attain full ordering upon interacting with suitable di- or multivalent counterions, like in the well-known case of the formation of the calcium–pectate gel [25].

3.4. Molecular Aspects of the Acid–Gel Formation of LMP

Figure 14 clearly demonstrates the strong correlation between the elastic modulus, G′, of a 3.0 wt% LM pectin after 100 min at 5 °C (data replotted from figure 3a of [32]) and the fraction of maximum association (% ass.) as determined from the calorimetric experiments (see Section 3.1 and Figure 12b). The parallel up rise of G′ and % ass. (operationally depicted by the purple dash-dotted curve) increases steeply below pH = 2.5, finding a similarity with the hyperbolic dependence of M ¯ w on pH (see inset to Figure 14). The latter are the results (as weight-average MW, M ¯ w ) of light-scattering experiments on different LMP samples and poly(galacturonic acid) reported by Sawayama et al. [38] in their figure 3. They clearly show that decreasing pH brings about an increase in M ¯ w due to substantial chain association; the qualitative similarity with the fraction of maximum association curve (full squares) is striking. It gives a solid support to the interpretation of the concentration dependence of the calorimetric data as deriving from the enthalpic contribution of associative van der Waals (hydrophobic) interactions. The two areas identified in the Tm vs. pH curve of both panels of Figure 10 find a neat counterpart in two ranges of the % ass. curve: the former from pH = 4.0 to pH = 2.5, the latter at and below pH = 2.0. They have very different slopes, closely resembling the high pH and the low pH hyperbolic trend of Sawayama’s data, in particular of those of poly(galacturonic acid).
A comparison of the % ass. curve with the data on the dependence of tan δ (tan δ = G′′/G′) on pH—also from figure 3a of Gilsenan et al. [32]—helps to shed light onto the macroscopic behavior of the LMP system paralleling the pH-induced chain association; also, they have been replotted (as red symbols) in Figure 14. The log tan δ data show a sigmoid behavior (the transition being roughly identified by the light grey rectangle), with two steeper slopes, namely one for pH < 3.0 and another one in the interval 1.5 < pH < 2.5. Recalling the definitions of gel formation (G′ = G′′, i.e., log tan δ = 0.0) and of strong gel formation (G′ = 10·G′′, i.e., log tan δ = −1.0), three regions have been identified in Figure 14, corresponding to strong gels (for pH < 1.66), to weak gels (for 1.66 < pH < 3.29) and to viscoelastic solutions (for pH > 3.29).
Figure 15 revisits the data of the pH dependence of the (negative) average slope of the logarithm of the complex dynamic viscosity, η* ( η * = G 2 + G 2 1 2 ϖ ), versus the logarithm of the frequency, ω,—the function “−slope” slope = d   log η * d   log ϖ —across the frequency range studied, taken from figure 3b of Gilsenan et al. [32]; they have been replotted together with the tan δ data. The authors noticed that “the slope at pH 1.6 is close to the theoretical maximum value of—1.0 for a perfectly elastic (Hookean) network, but as the pH is raised there is a steep and essentially linear decrease in slope towards the minimum value of 0.0 anticipated for a perfect (Newtonian) liquid”. In Figure 15, the value of pH corresponding to the maximum tightening (and expansion) of the 31 helical conformation has also been reported (as a purple downward pointing arrow). This value—pH = 3.0—is very close to the value marking onset of gel formation (G′ = G′′; pH = 3.29). The red dotted circle marks the close matching of the conditions of the lower α limit of the conformational transition region, of the maximum tightness of the 31 helix and of gel formation: log tan δ = 0. It can be concluded that an increase in conformational loosening accompany—on opposite pH directions—the opposite processes of gel formation of increasing rigidity and of increasing liquid-like behavior of the viscoelastic solution.
A deeper insight into the correlation between the processes described in Section 3.1 and Section 3.2 (association, conformation change, loosening) and the rheological properties of LMP can derive from an inspection of Figure 15. The data of the function “−slope” between pH = 2.0 and pH = 4.0 very nicely conform to a parabolic behavior (R2 = 0.9985); the parabola crosses the horizontal line at (−slope) = 1.0 at pH = 1.69. On the opposite side, the value at the minimum of the parabola is reached at pH = 5.39, at which (−slope) = 0.17. The point at pH = 1.6 clearly does not fit to the parabola. Nevertheless, drawing a dull straight line between the points at the two lowest values of pH returns the value of pH = 1.42 at (−slope) = 1.0 and pH = 6.05 at (−slope) = 0.0. Finally, the values of pH marking the onset (at pH =3.02) and the end (at pH = 4.31) of the pH-induced conformational transition have also been reported in Figure 15.
One can draw the following remarks:
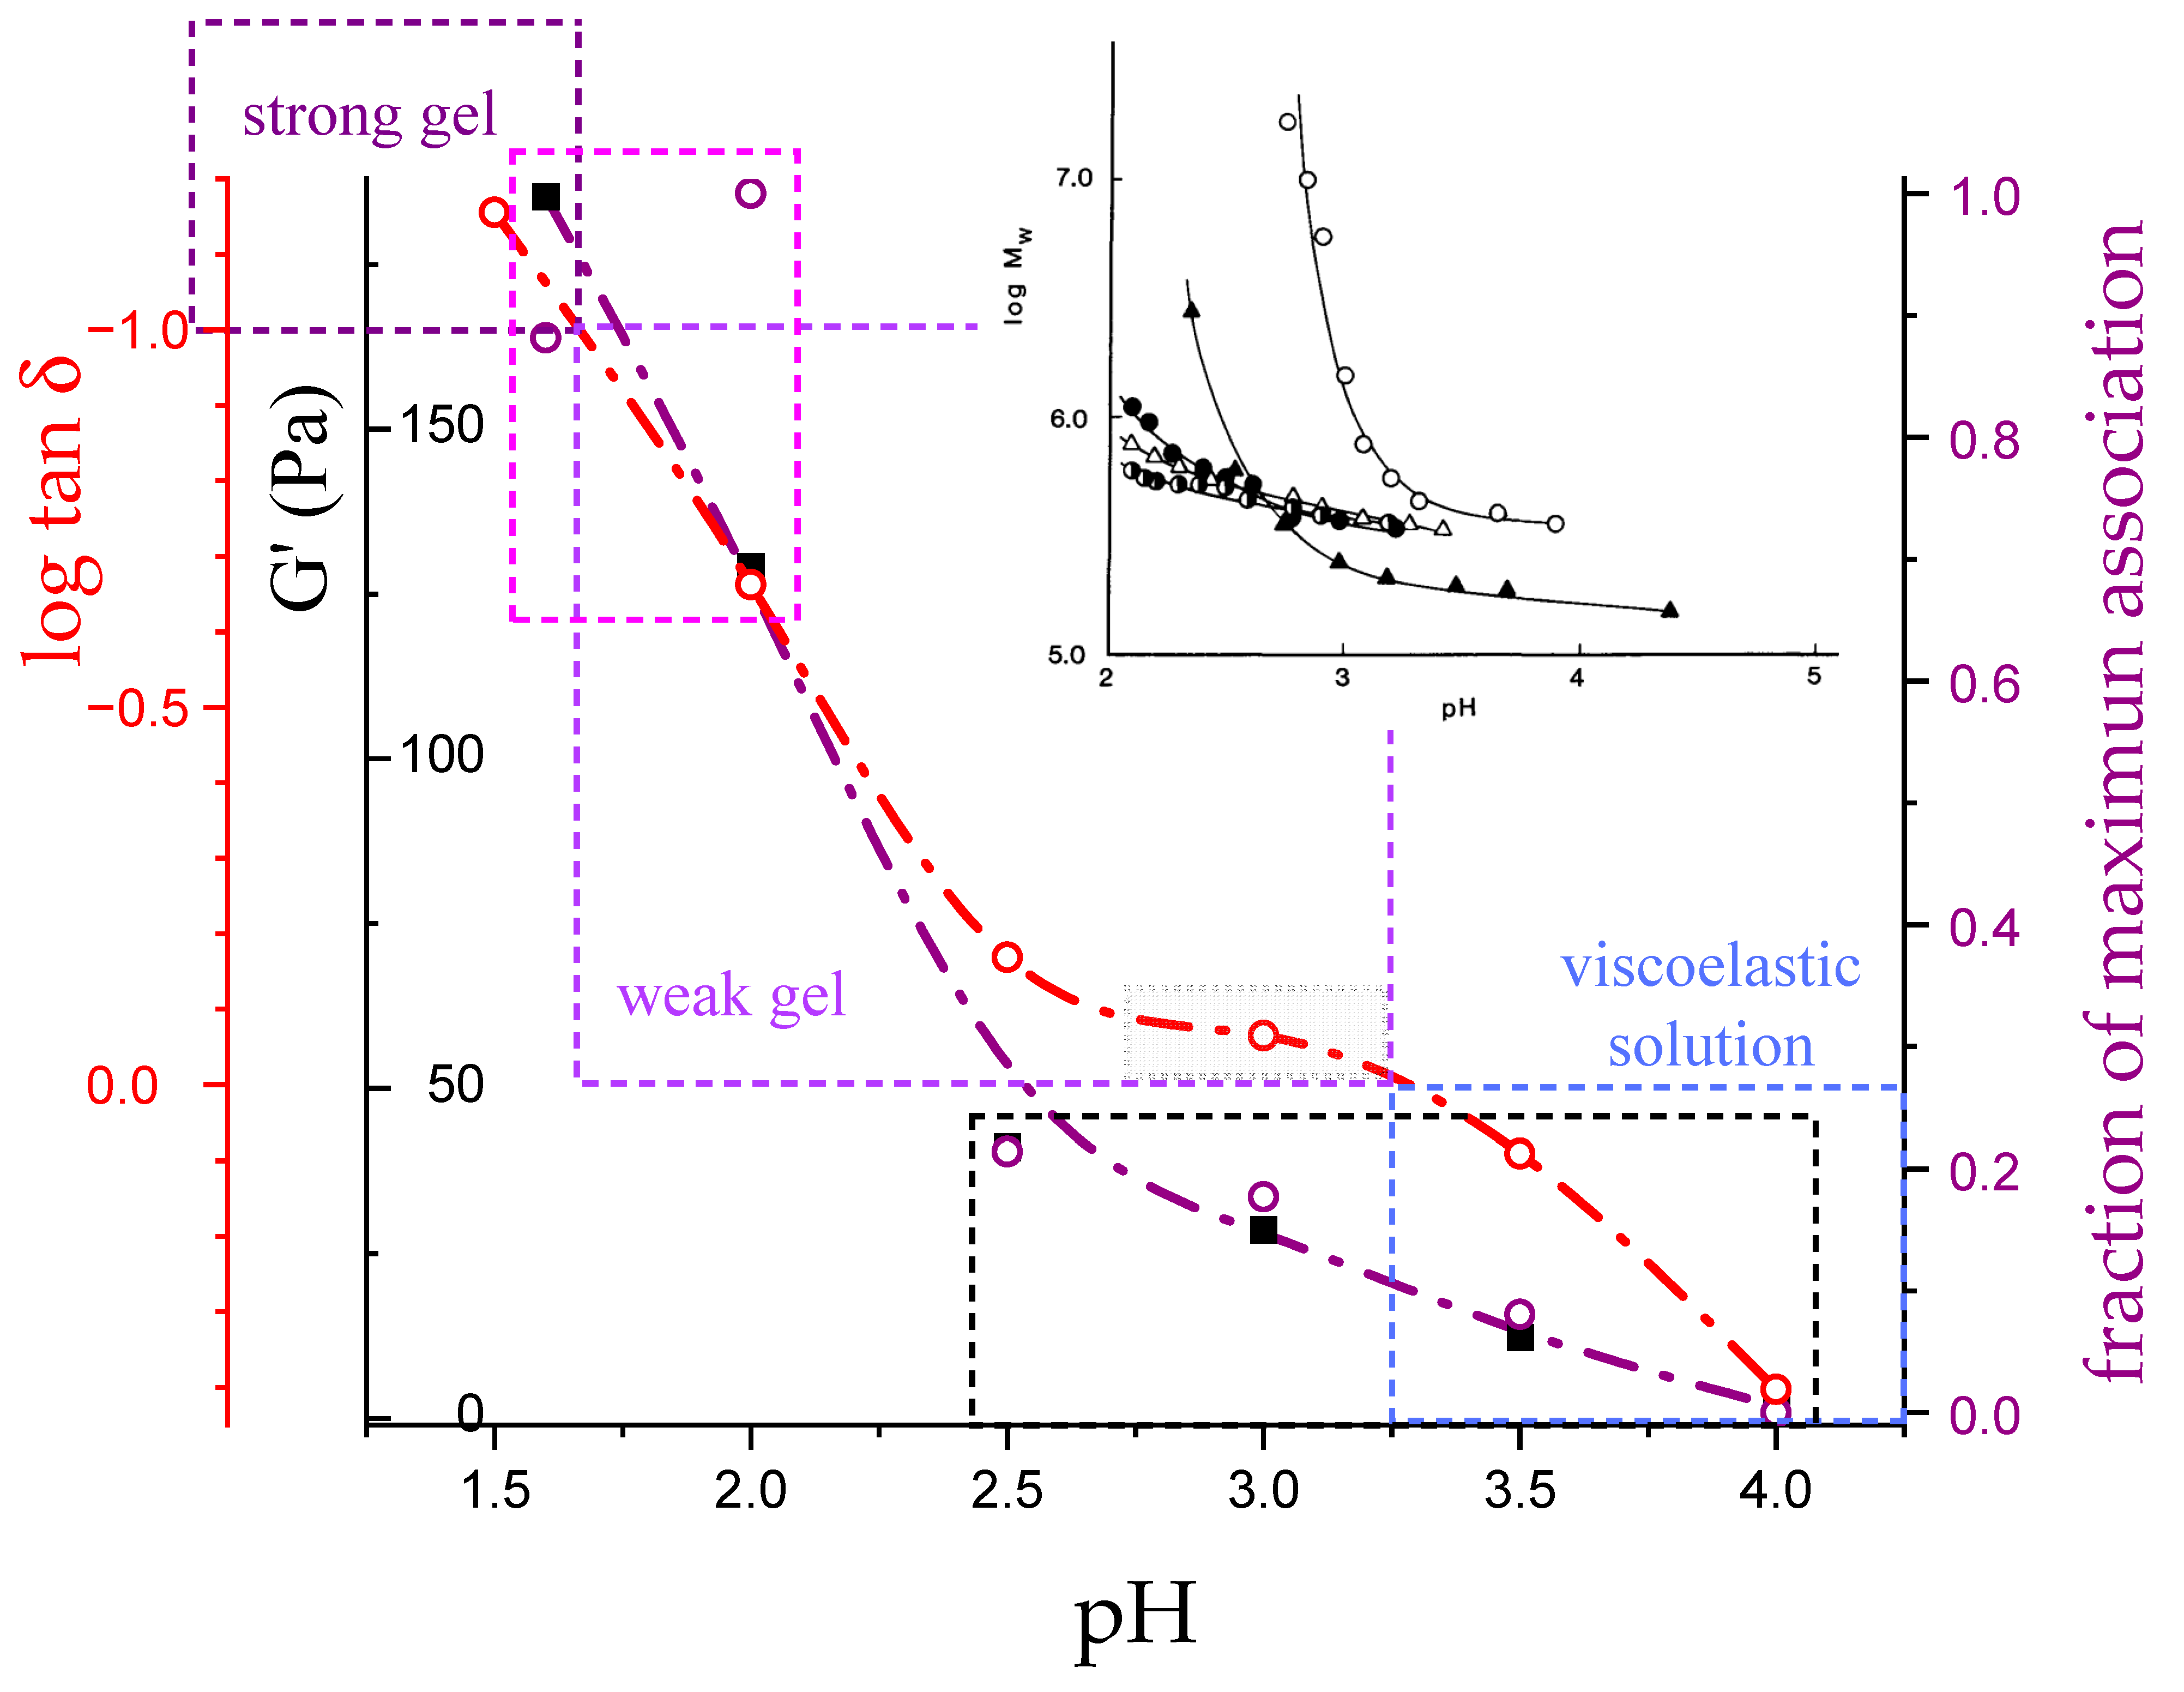
  • The 31 conformation is required to produce strong gels in very acidic conditions;
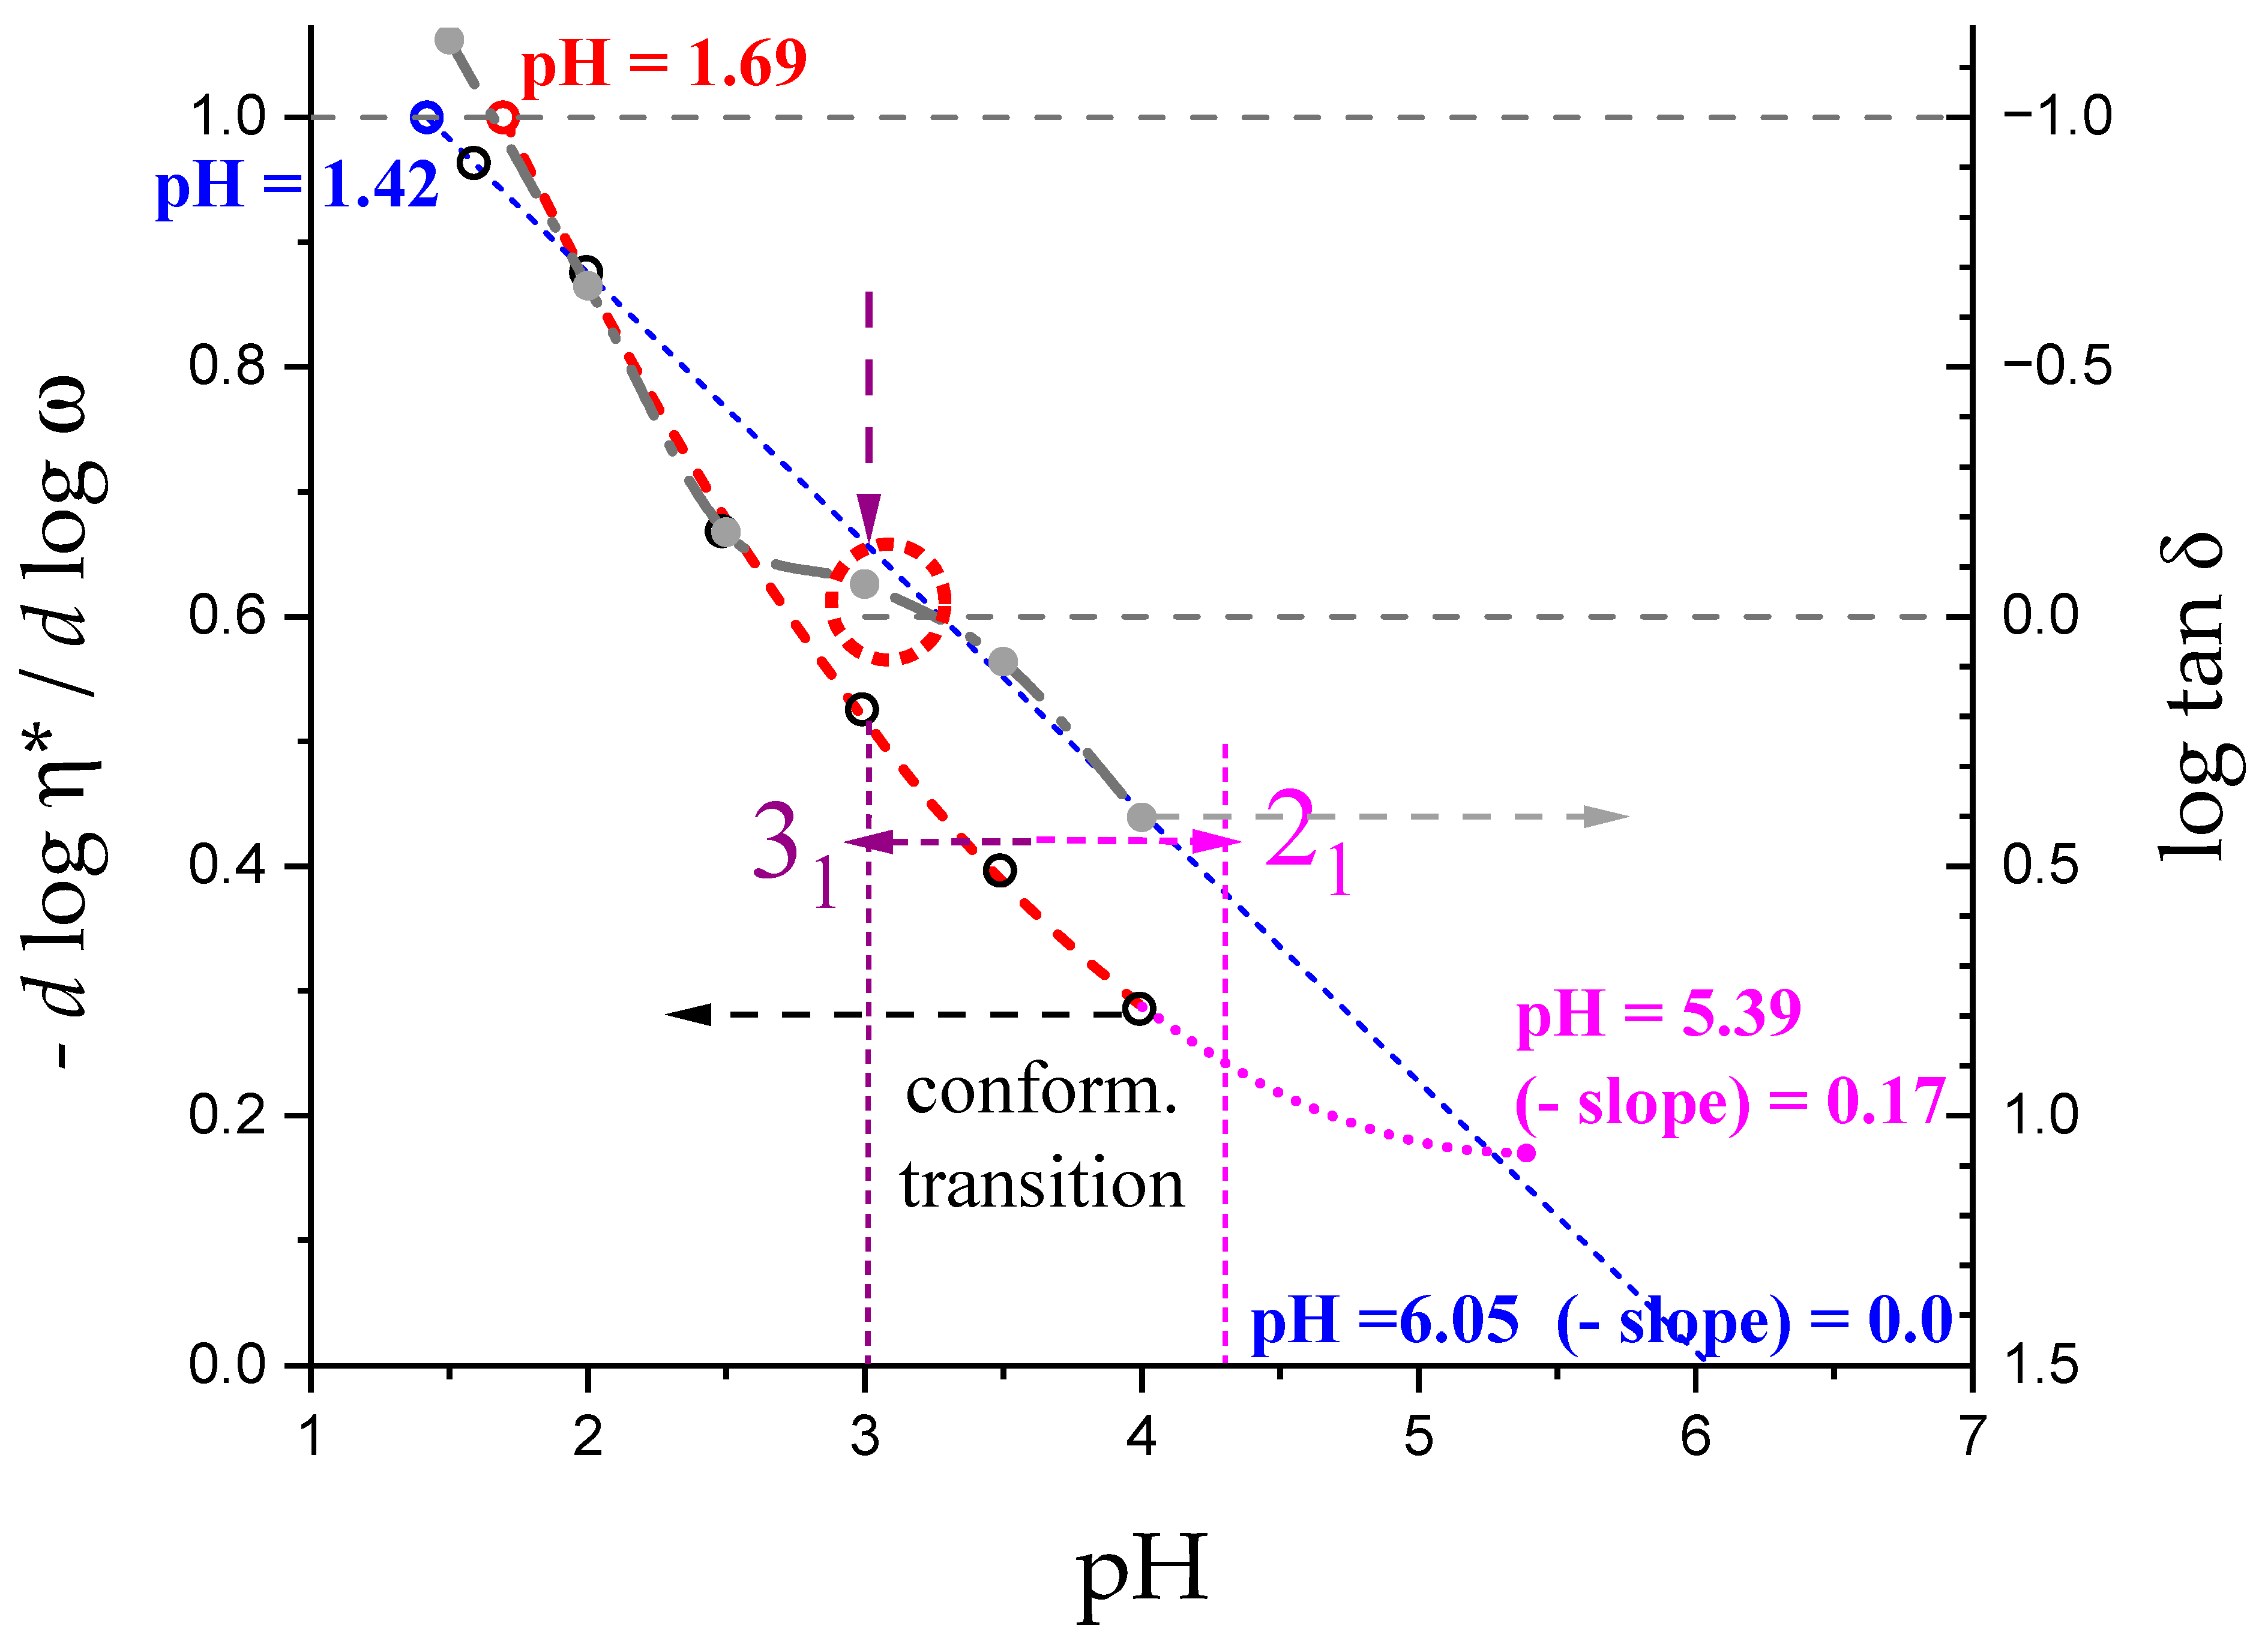
  • “Even in the absence of Ca2+ and above pH 3.5 LMP associates spontaneously and forms weak gels at sufficiently high concentration that can, however, be easily broken by shear” [74]. This is documented by the values of the (−slope) function, which at pH = 3.5 (within the conformational transition range) show a value as large as 0.4. Even at the last point of the parabolic trend (i.e., at pH 5.39) the value of the (−slope) function is 0.17, pointing to a clearly viscoelastic solution (see Figure 14 and Figure 15). Interestingly, “This association is favored by increasing the temperature” [74], i.e., this is accompanied by an endothermic enthalpy change, exactly corresponding to the presently determined Δ H ¯ a s s o c . DSC > 0 (see Section 3.1);
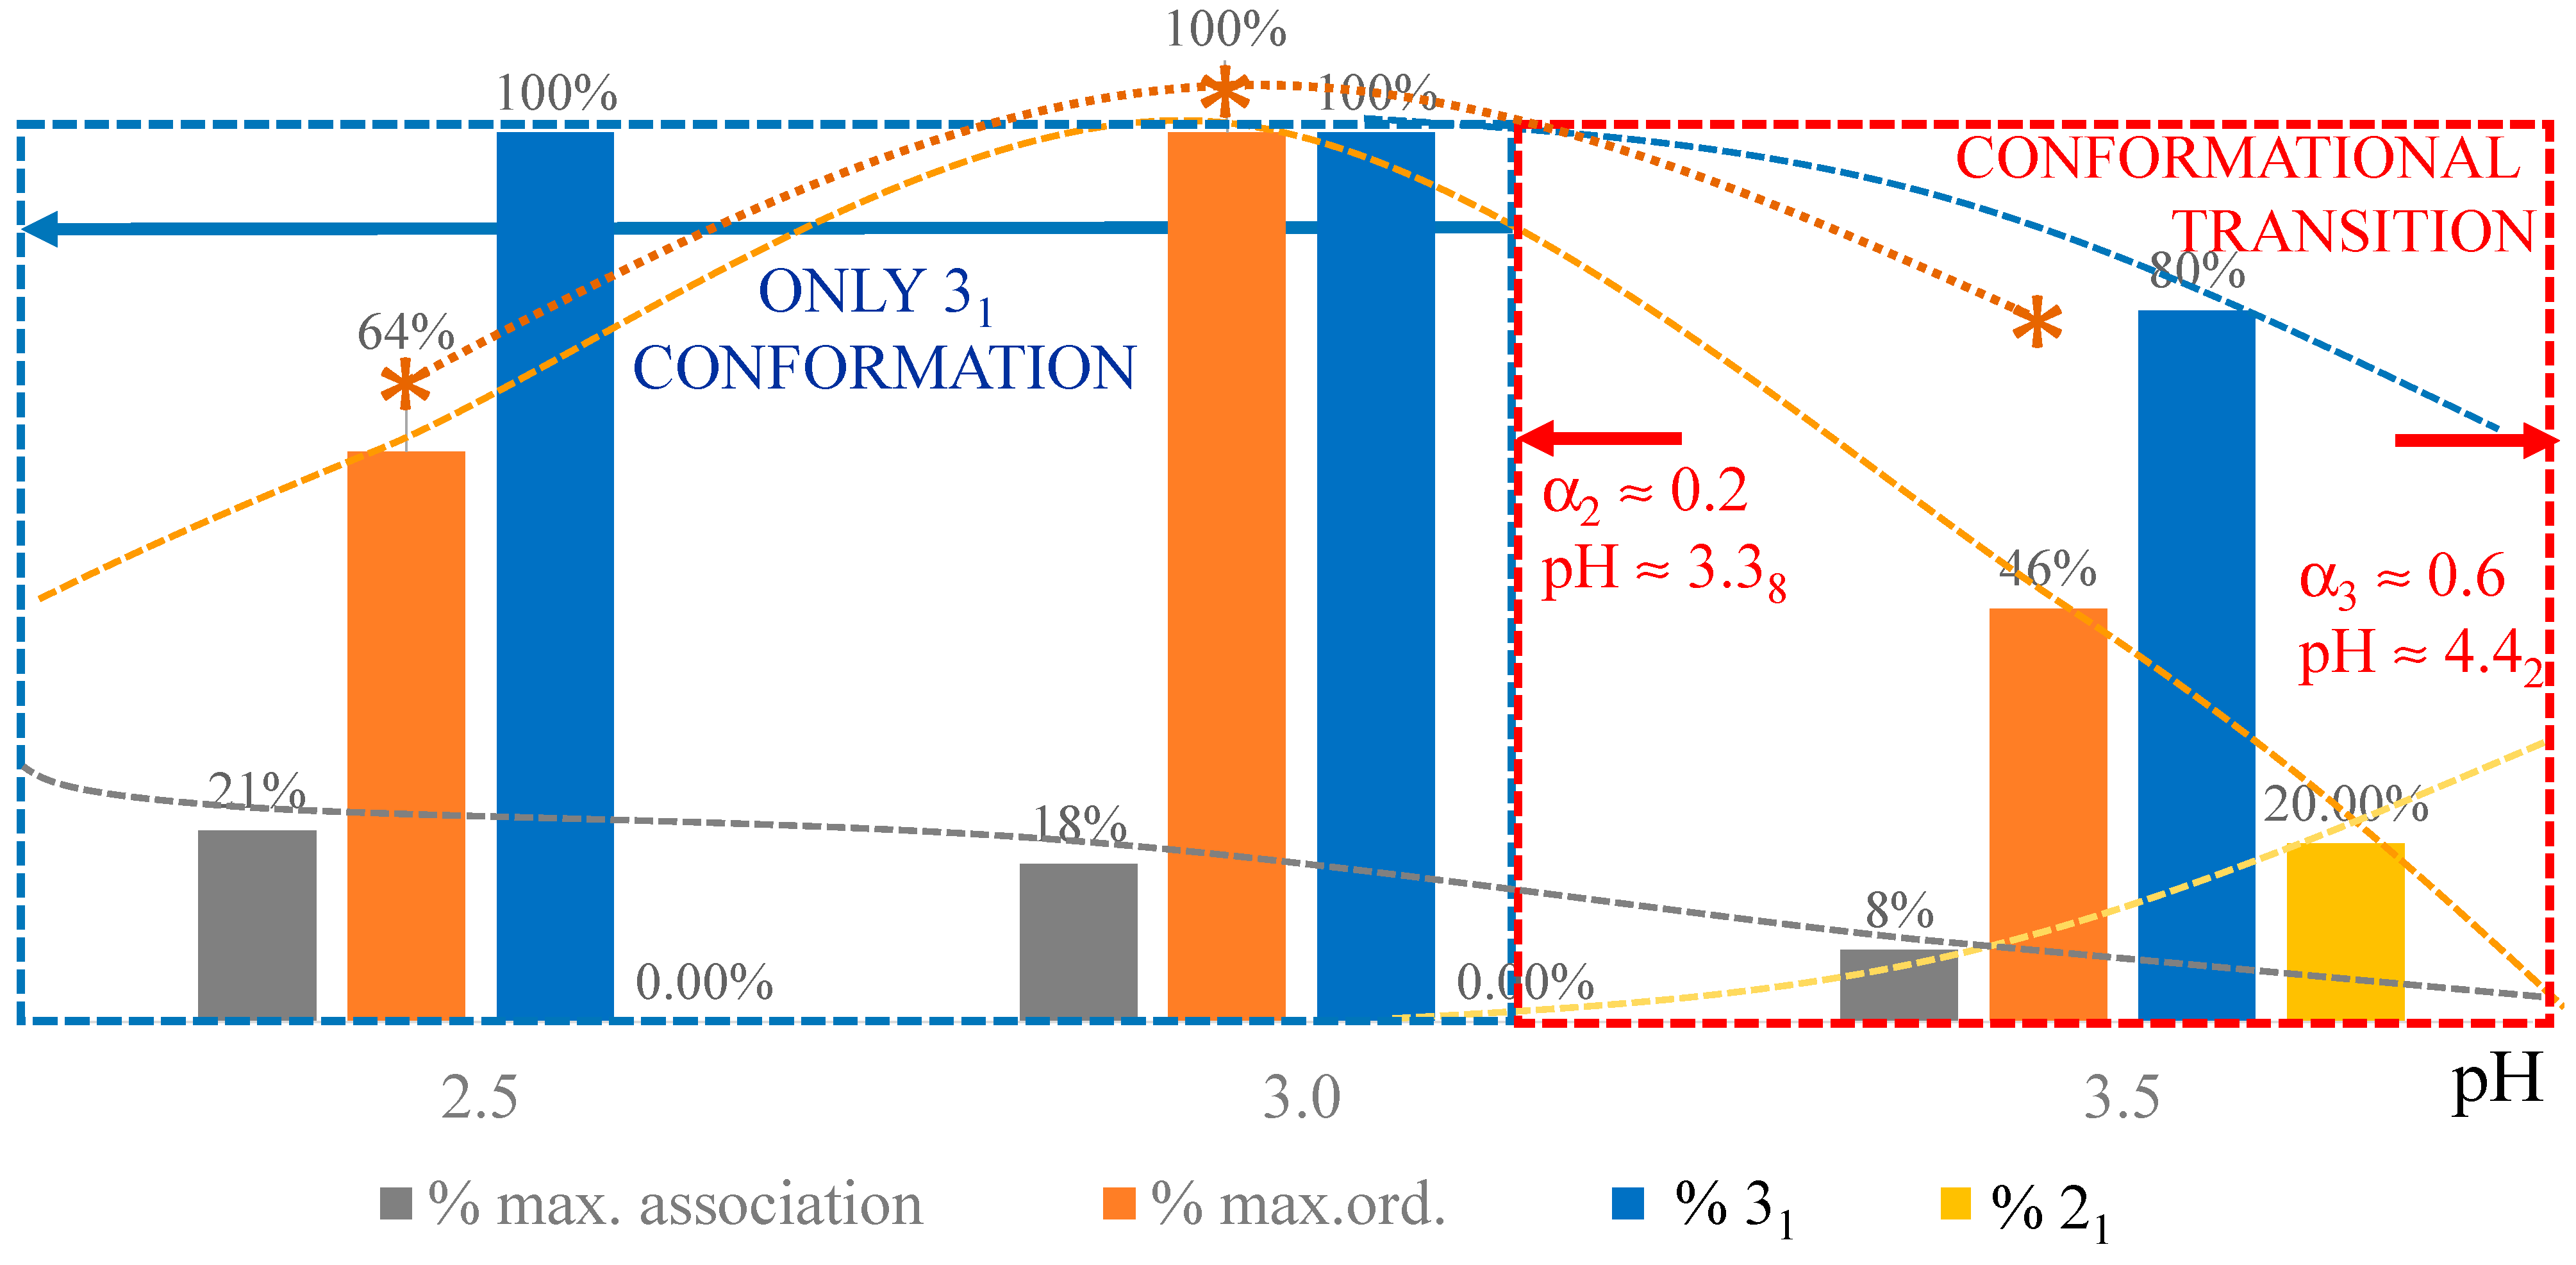
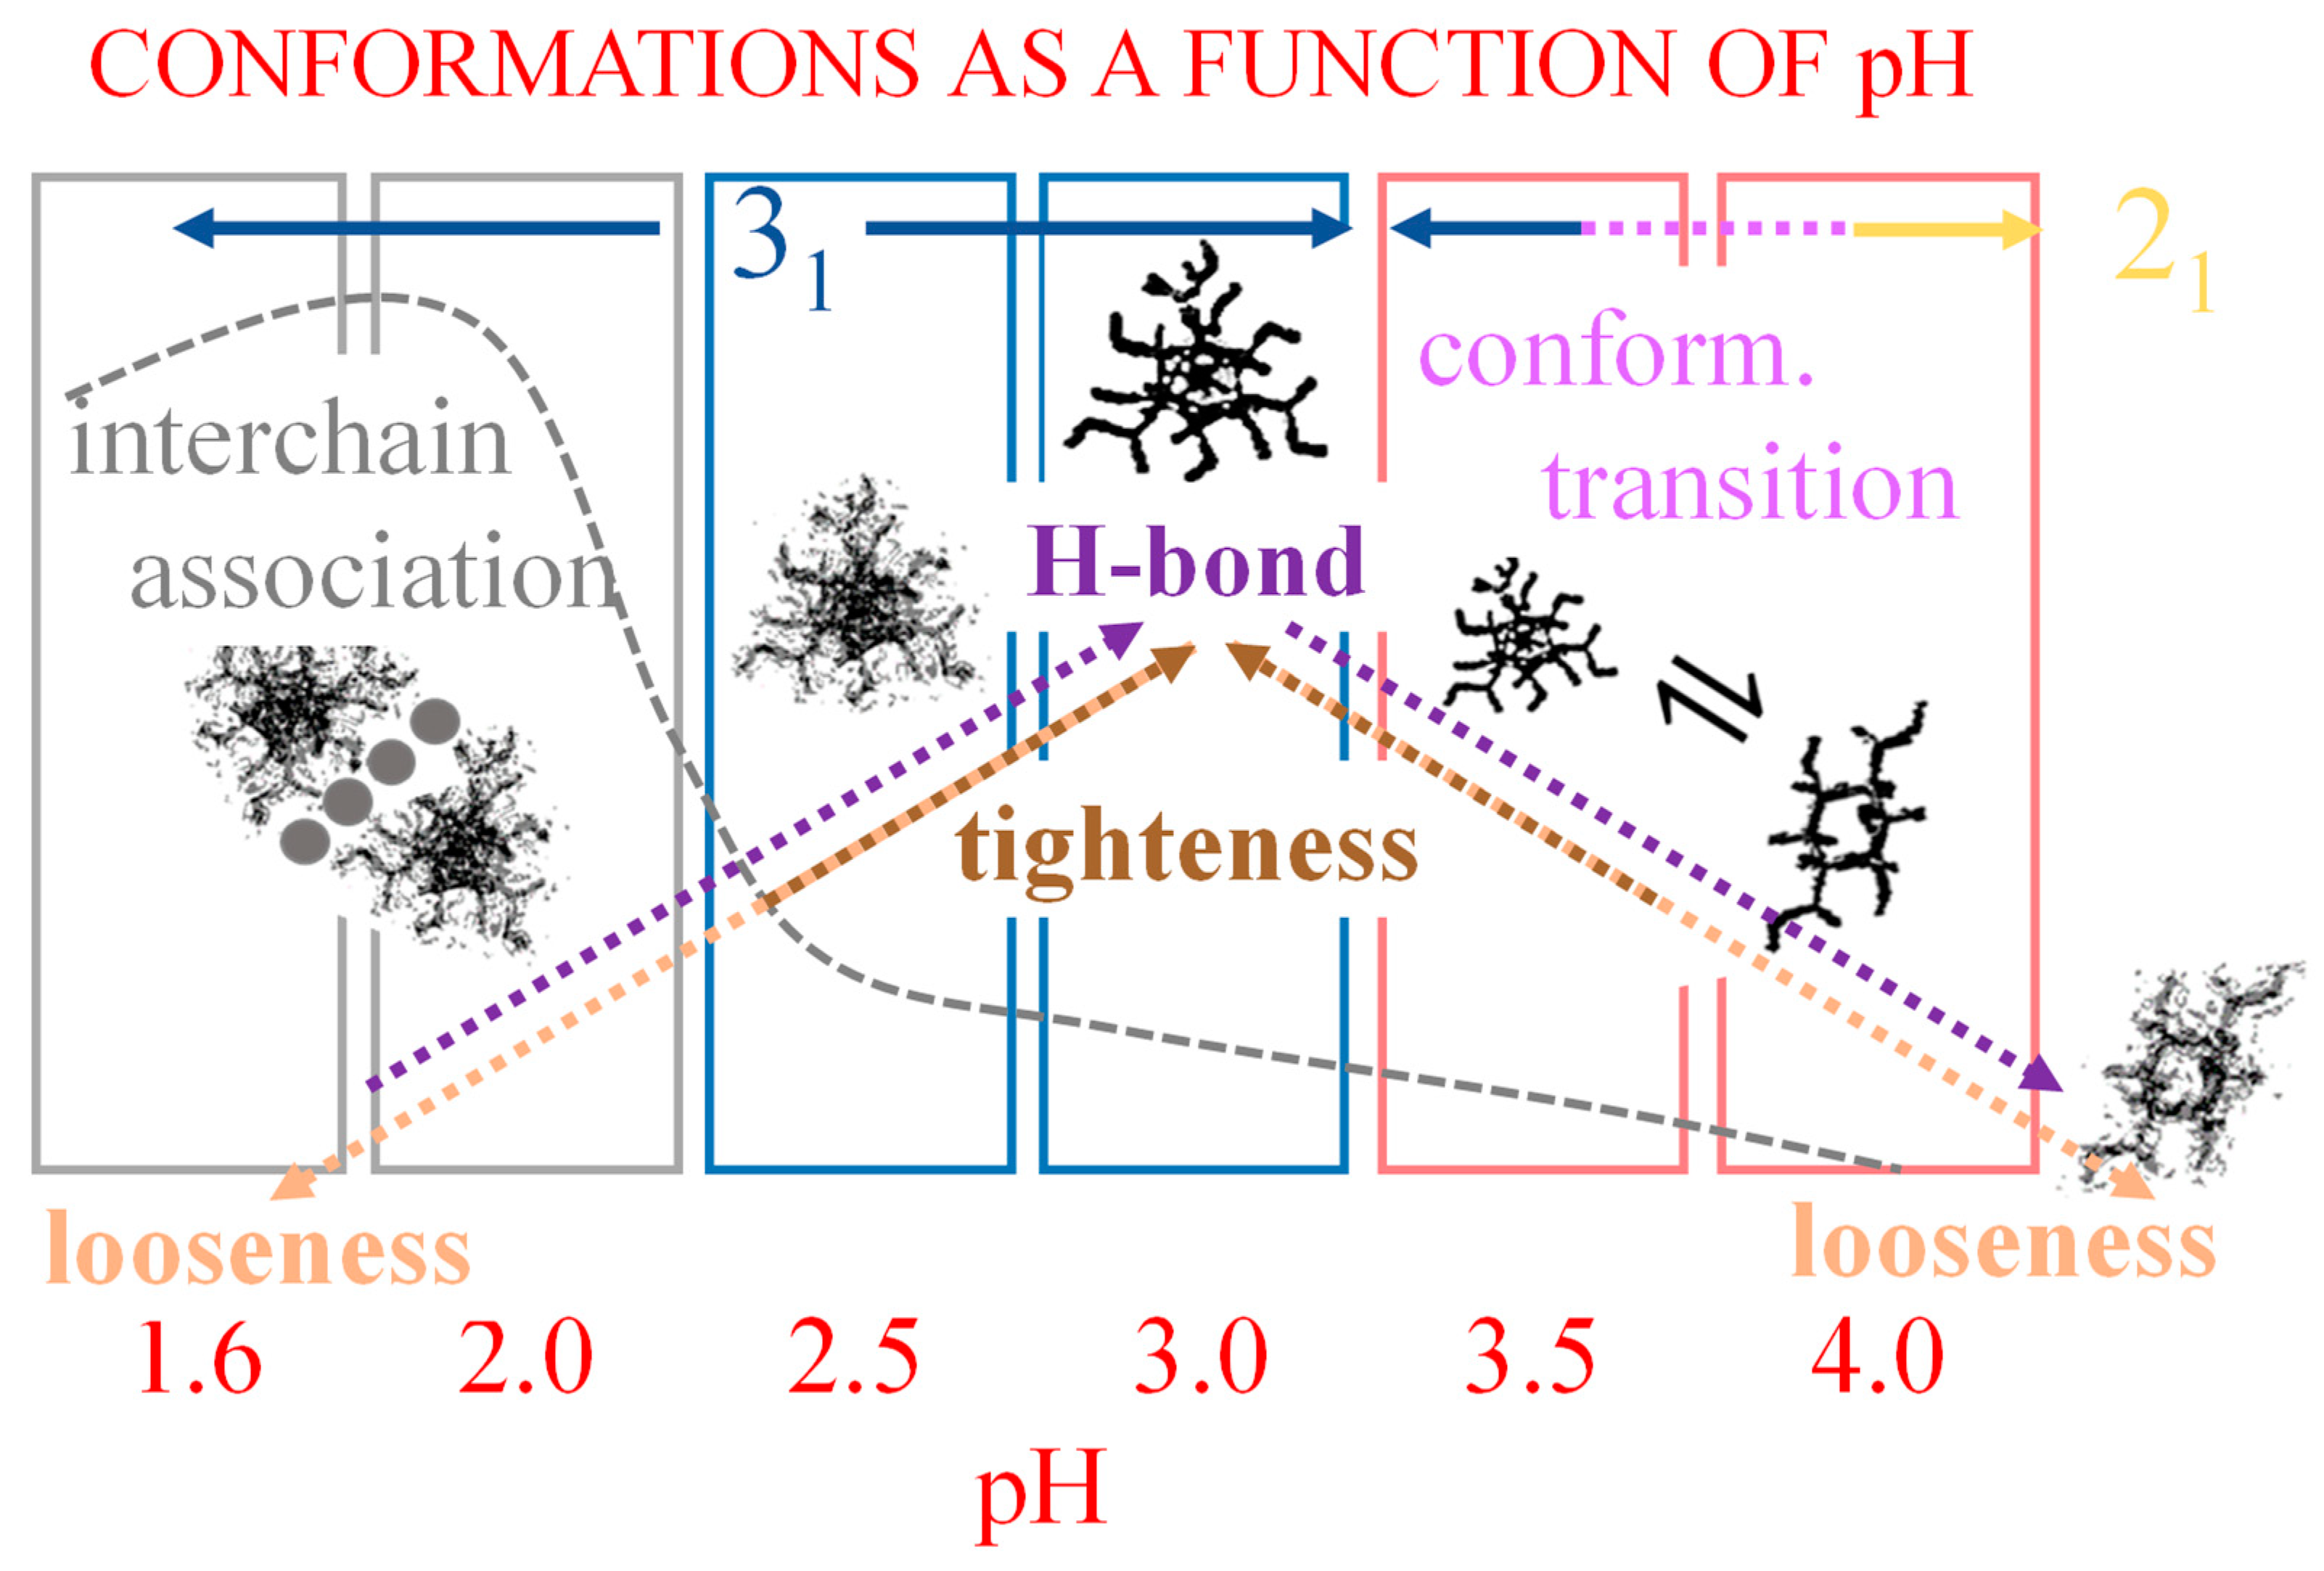
  • The parabolic rise of the function (−slope) upon decreasing pH is even steeper below about pH = 3.0 (at α2), at which the 31 conformation is at its maximum tightness and in its most extended conformation (see the above discussion in Section 2.6 and Section 2.7 and in the following Section 6 on viscosity). For α < α2 (i.e., pH < 3.0), the chain gets progressively more disordered. This indicates that the increasing gel-like character—as shown by the increase in the function (−slope)—is not due to an increase in contacts between stretches in the (31) ordered conformation. Rather, the major players,—effective in producing the rheologically effective interchain links,—are as follows: (1) the polyelectrolyte charge density, which must be reduced to a negligible amount by reduction in pH; (2) the presence of attractive van der Waals (hydrophobic) interactions between COOCH3 groups on facing—almost uncharged—chains;
  • For pH values lower than 3.0, the 31 conformation gets progressively looser upon decreasing pH; still, the nice parabolic trend must be viewed upon as intimately linked to a persisting fraction of tightness. Should the system proceed along that trend, the value of (−slope) = 1.0 would have been reached already at the (higher) pH value of 1.69. On the contrary, the pH value of the intercept at d   log η d   log ϖ = 1.0 for the linear trend of the two lowest values pH data points is 1.42. It is possible to hypothesize two opposing mechanisms of gel–junction formation. The former one could be due to the formation of H-bonds between locally regular sequences of facing repeating units; the latter one could be due to interactions between the non-regularly distributed methyl-ester groups on different chains. The regularity required by the first mechanism implies the ordering and stiffening of the 31 conformation, which, moreover, would be favored by a limited increase in fractional charge on the COOH groups, contrary to the observed effect. Moreover, as addressed in Section 3.1, breaking such interchain H-bonds (if present in significant amount) would imply a major endothermic effect, at variance with the opposite experimental findings (see Figure 12a). At variance, the second mechanism benefits from an increased flexibility to favor the geometrically undefined van der Waals contacts between opposing chains—the less charged the better—with a substantial gain of configurational entropy. The observed break of the parabolic trend of the d   log η * d   log ϖ function upon decreasing pH suggests a progressive reduction in any H-bond based association mechanism (if ever present) in favor of that based on associative hydrophobic (van der Waals) interactions at lower residual fractional charging;
  • That the conformation of LMP at pH ≤ 2.0 is largely disordered is supported by the intercept of the blue dashed line with the line of −slope = 0.0 (Newtonian liquid) at pH = 6.05. It means that such disordered LMP conformation, if it could be ideally kept up to neutral conditions, would behave as a pure dissipative liquid, without traces of elasticity that, on the contrary, characterize the “real” LMP solutions at a neutrality whose viscoelastic behavior (−slope = 0.17) is rooted in the—albeit “loose”—21 helical conformation.
Scheme 5 has been drawn to summarize the interplay of conformation and gel junction formation.

4. Lyotropic Effect of Perchlorate on the Conformations of Galacturonan

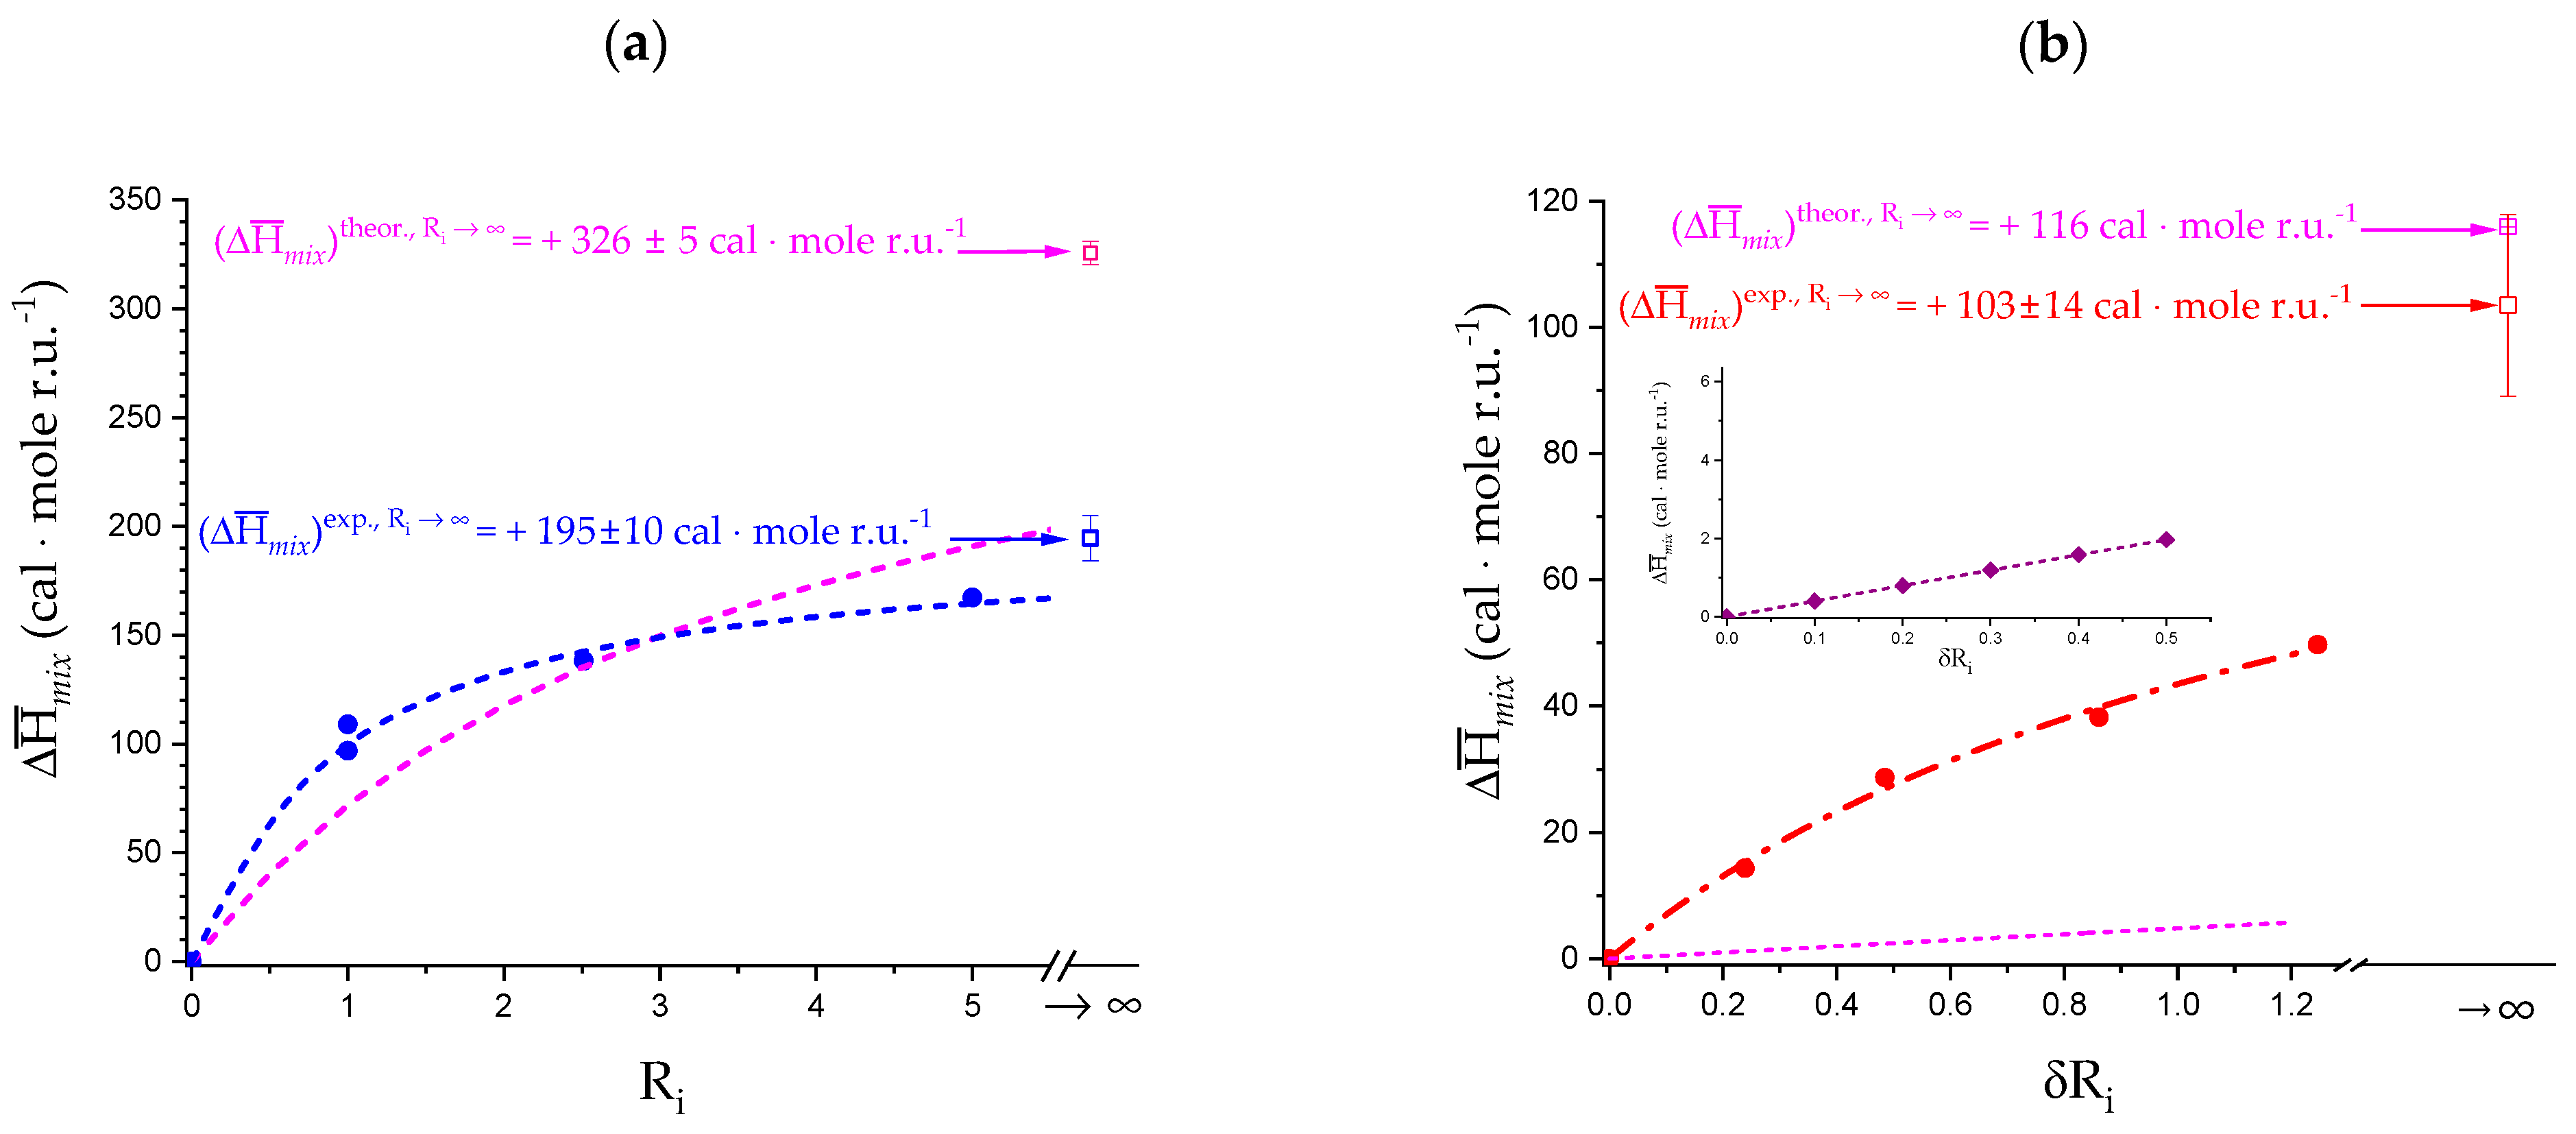
4.1. Enthalpy Changes of Mixing with Salt

Enthalpy changes when mixing polyelectrolytes with simple salts are among the most sensitive experiments that are able to reveal conformational changes in biopolymers, as addressed in Section 1.1.
The data of enthalpy change when mixing sodium pectate (at α = 1.0) with increasing concentration of Na+ ions, Δ H ¯ m i x , have been reported in Figure 16 for the two cases of salt-free aqueous solution—(a) (data taken from figure 7 of [75]) and of aqueous NaClO4 0.05 M—(b) (data taken from figure 3 of [30]). The source of the Na+ counterions was NaClO4; the variable was expressed as the molar ratio of added salt—Cs—to polymer r.u.—Cp, Ri, with Ri = Cs/Cp. In the latter case, the value of Ri in excess of the (constant) ratio of supporting salt to polymer, δRi, was used as the abscissa; this was used to allow for a better comparison with the case of addition of Ca2+ counterions over a constant concentration of NaClO4 0.05 M [30]. Very often, index “i” pertains to the 1:1 salt, whereas index “j” pertains to the 1:2 one [76]; in practice, δRi is made to correspond to Rj. In both cases, the trend of the data points is that of a system undergoing binding of a ligand to a substrate, indicating a tendency to reach a saturation of the effect. The simplest formalism to treat such a case is that provided by the Langmuir absorption isotherm, which assumes a ligand/substrate interaction without cooperativity; the fit was very good (R2 > 0.99) in both cases (to test the latter assumption, a fit using the Hill equation was also performed; it provided an equally good fit, with the value of the cooperativity parameter n = 1.0 in both cases, confirming the absence of cooperativity in the interaction). The limit values of Δ H ¯ m i x e x p w a t e r and Δ H ¯ m i x e x p s a l t at I → ∞ (actually, Ri → ∞ for the “water” case and δRi → ∞ for the “salt” case) are + 195 ± 10 cal·mole r.u.−1 and + 103 ± 14 cal·mole r.u.−1, respectively, indicating that the analyzed process does not grow indefinitely; the values have been reported in Table 5. The theoretical curves of mixing, calculated according to the Counterion Condensation (CC) theory [75] for the two cases, have also been reported in both panels of Figure 16 as magenta dashed curves (obviously, in the “salt” case the total concentration of Na+ counterions was used for the calculation of I). The limit values at I → ∞ for the theoretical curve and for the difference between the experimental and the theoretical ones (“excess”) have also been reported in Table 5. The figure reveals an unpredictable behavior of the polymer: both the case of “water” and that of “salt” show an endothermic deviation from theoretical expectations at low values of Ri or of δRi. However, in the former case, the deviation is small (if any, considering the experimental accuracy) and limited to the low Cs range, but it is large and negative at infinite dilution. In the latter case, the situation seems to be the different, with a small, negative discrepancy at infinite Cs, but a significant positive one (as discussed above) in the low range of δRi.
The interpretation of the behavior of sodium pectate as anomalous is further corroborated by the observation that the values of Δ H ¯ m i x with NaClO4 of sodium poly(mannuronate) (hereafter: polyM) perfectly conform to the theoretical predictions (see inset in Figure 16b), with the data taken from figure 1 of [76]. polyM is usually taken as the “reference” polyuronate in the large group of pectate and alginates. It does not give rise to gels with calcium ions in conditions in which pectate and alginates do and, at variance with the latter polyuronates, it shows no selectivity for Ca2+ with respect to Mg2+ [76]. A further detailed discussion using both theoretical and experimental arguments—reported in Supplementary paragraph 4 and sketched in Figure S1—consistently assessed that the origin of this deviation has to be traced to a whole-solution specificity of sodium (perchlorate) in water (a chemical effect) and not to an ion-specific modulation, an otherwise dominating polyelectrolyte behavior (physical effect). It is then mandatory to conclude that, at variance with the “ideally behaving” polyuronate polyM, it is the Na+ pectate/NaClO4 system that presents an unexpected deviation from the theoretical behavior.
Figure 17a,b report the difference between the experimental and the theoretical values of Δ H ¯ m i x as a function of the incremental value of Ri (δRi, Figure 17a) or a as a function of the (absolute) value of the molar concentration of NaClO4 (the added salt, Cs), (Figure 17b), over the whole respective ranges. (In Figure 17b, the plot of Δ H ¯ m i x as a function of the ionic strength, I, for both cases is completely superimposable with that as a function of Cs, apart from a negligible difference at very low Cs for the case in “water”; the former plot was not reported here to avoid overcrowding).
It is possible to identify three parts of both curves, indicated as rectangles in panel (a): an initial one (1), with increasing endothermic deviations, reaching a maximum, then followed by a neat exothermic sigmoid decrease (2), to finally asymptotically reaching the limit value at Ri (or δRi) → ∞ (3). Those profiles reveal the interplay of different contributions, in turn providing different enthalpic consequences depending upon the different initial conditions of the salt concentration (i.e., of ionic strength). The most obvious hypothesis to explain such behavior is to assume that the physical, un-specific effect of the increase in I is accompanied—and contrasted—by a specific effect due to the chemical nature of the 1:1 added electrolyte.
Before proceeding further, the results of Figure 17 need a clarification, in particular those of Figure 17b. The initial value of the Δ H ¯ m i x e x c e s s function of both curves is obviously 0, being the starting point of the difference function (see Figure 16b). In principle, the system in “water” after the addition of NaClO4 corresponding to the concentration of 0.05 M should be fully equivalent to the initial condition of the system in “salt” (δRi = 0). However, at [NaClO4] = 0.05 M, the value of Δ H ¯ m i x e x c e s s for the “water” case is −63 cal·mole r.u.−1, which is very different and much lower than initial starting value in “salt”, which is zero by definition. Moreover, beyond Cs = 0.05 M, the difference curve in “water” keeps showing negative values, whereas that of the “salt” case is positive up to the value marked by a red asterisk in Figure 17b.
This contradiction is purely apparent, because the difference stems from the very way of calculating the Δ H ¯ m i x e x p e r values at large Ri’s (up to Ri → ∞). In fact, the extrapolated points of those curves have been calculated using the Langmuir equation, which fitted the experimental data very well. The points of the calculated curve in “water” at large values of [NaClO4]—at 0.05 M NaClO4 and up to infinite—are the projection of the behavior at very low values of [NaClO4] with the consequence of keeping—and possibly enhancing—all the specific contributions and the deviations from the purely electrostatic interactions present in the initial part. Likewise, the extrapolated behavior at large values of Cs (up to infinite) of the points of the curve in “salt” reflect the behavior of the polymer in the limited range (0.050 to 0.055 M) of [NaClO4] only. The extrapolated curves of Figure 16 and the difference curves of Figure 17 should then be looked upon as both describing an extrapolated trend. A real contradiction would have arisen only if the experimentally determined data points would not match. The fitting with the Langmuir equation was analytically very good; however, it amounts to the projection of the initial trend of each of the cases to the infinite limit. As long as a solid reference frame is provided by the theoretical electrostatic enthalpy change, such openly recognized bias will turn out beneficial to unravelling the specific lyotropic contributions to the conformational stability of galacturonan and to derive information on the solute/co-solute/solvent interactions.

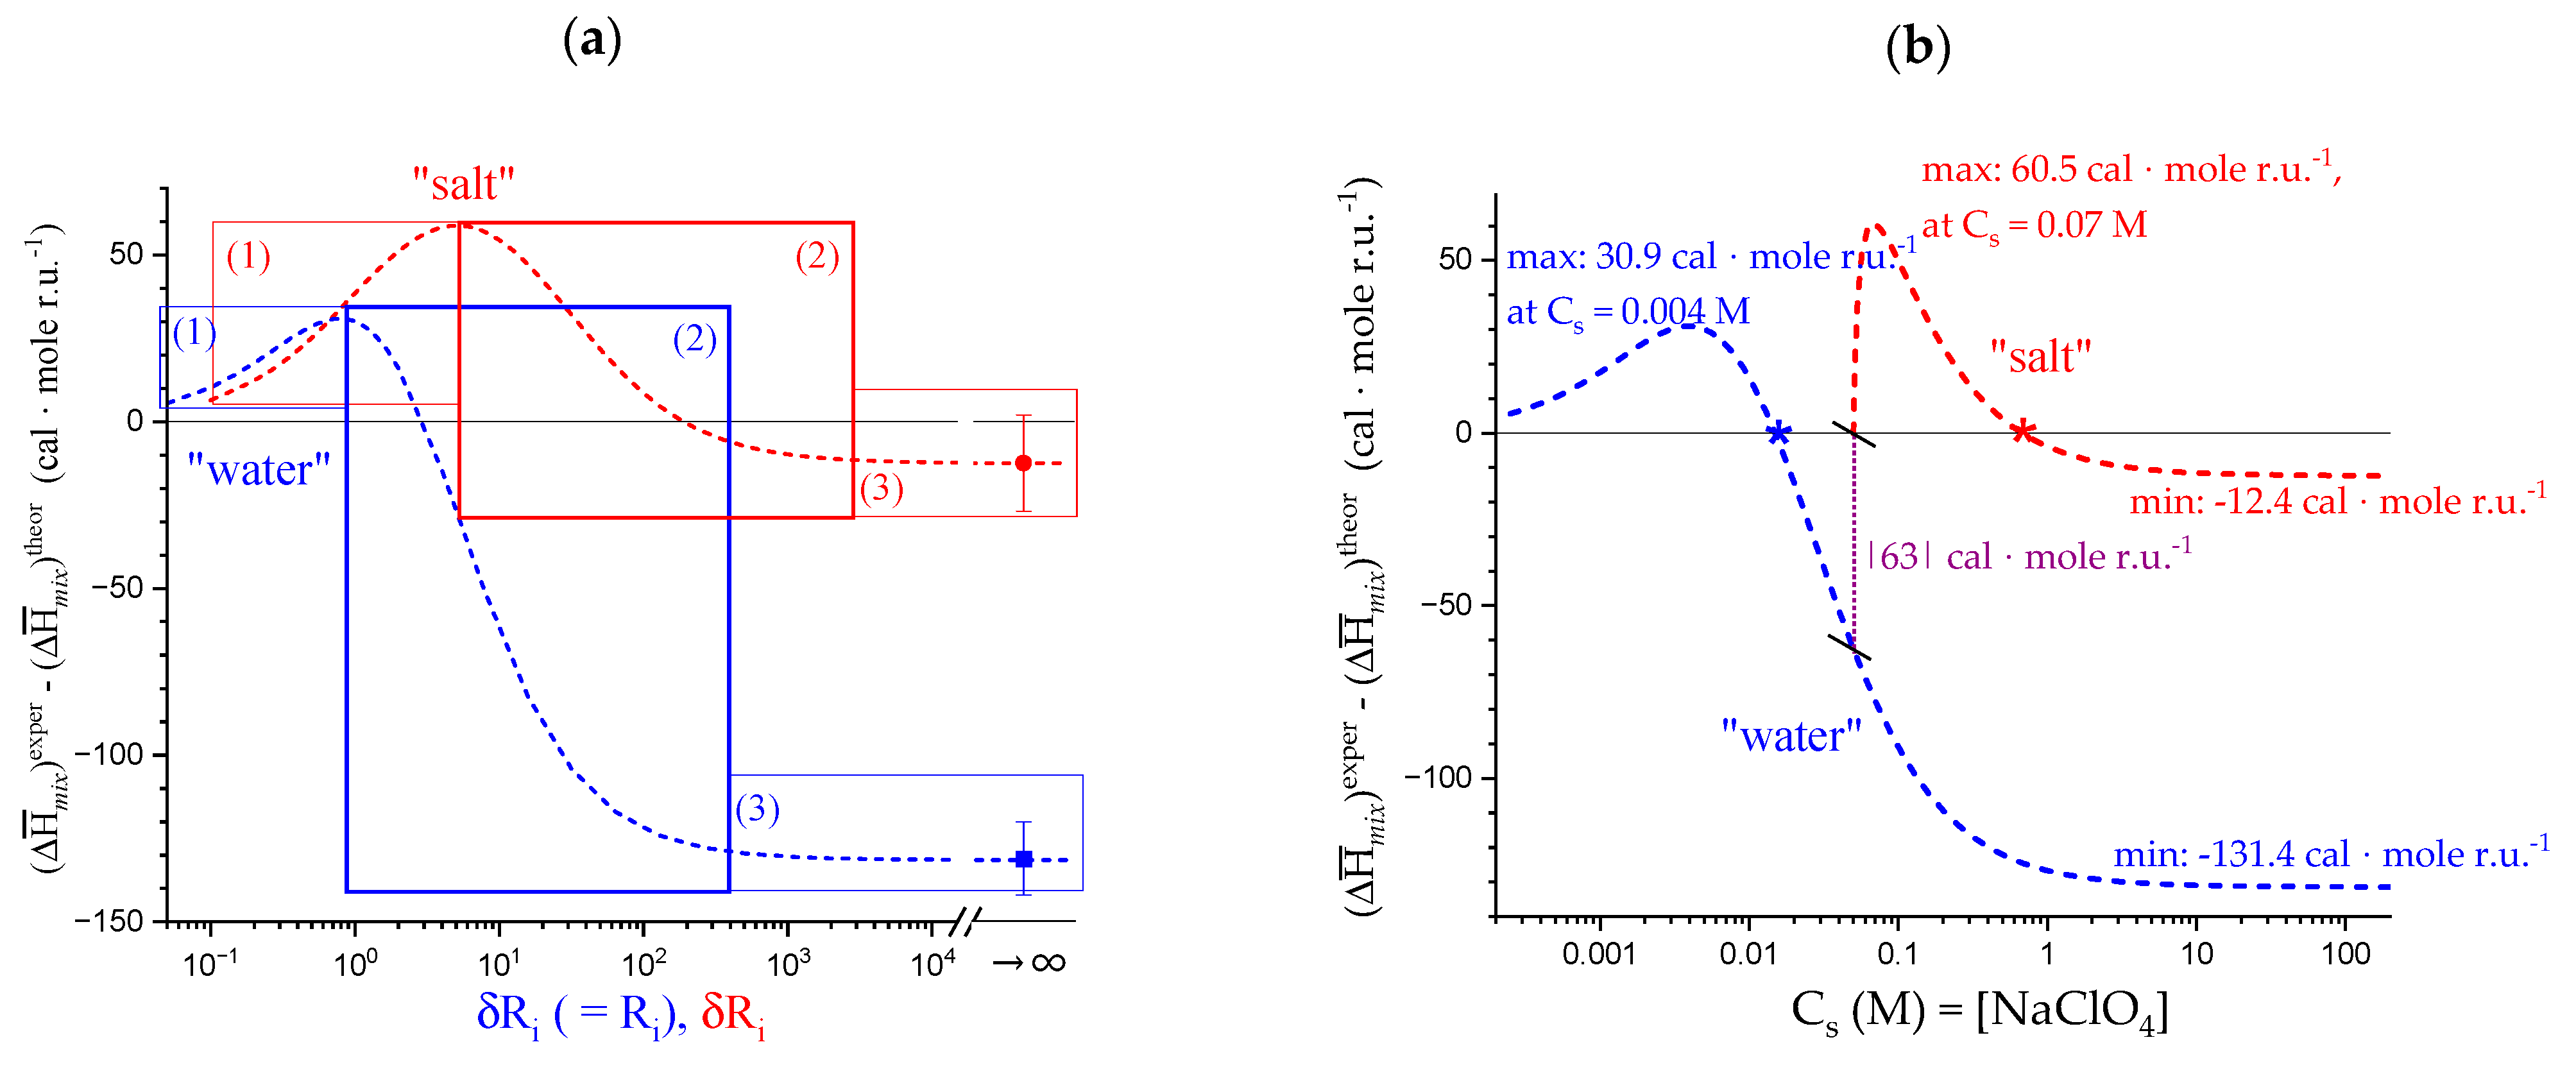
4.2. On the Difference between Infinite Ionic Strength and Infinite (Specific) Salt Concentration: Hofmeister and Lyotropic Effects

The results of Figure 16 and Figure 17 show a dependence on the ionic strength of the “excess” parameters, namely in excess of the purely “ionic”—polyelectrolytic—ones. One should recall that achieving an “ideal ionic strength” is impossible in real systems, where—instead—ionic strength is produced by “real” supporting low MW electrolytes. The effect of the latter ions on the structure of water cannot be separated from those of pure electrostatic (in this case: polyelectrolytic) nature. Therefore, more correctly, instead of using just the term “ionic strength”, one should write “ionic strength made by aqueous NaClO4”.
Perchlorate is the salt of a strong acid; as such, it does not give rise to hydrolysis effects affecting the charge of the weak poly(galacturonic acid). It has also been chosen because of the peculiar transparency of its aqueous solutions in the low wavelength side of the experimentally accessible UV range; the oxo anion carries only one negative charge and is considered to a be a “structure breaker” [77] (or even a “strong structure breaker” [78]) or a “chaotropic ion” [79,80].
The interaction of the ClO4 anion with peptides and proteins has been a matter of several investigations, with apparently different conclusions. For instance, “NaClO4 solution strongly stabilizes the helical state … of an alanine peptide in water. A direct mechanism was found in which ClO4 ions are strongly attracted to the folded backbone” [81]. On the contrary, in a study using “circular dichroism (CD), single-molecule Förster resonance energy transfer, and atomistic computer simulations to elucidate salt-specific effects on the structure of three peptides with large α-helical propensity, … [it was found that] The compacted states observed in the presence of NaClO4 originate from a tight ion-backbone network that leads to a highly heterogeneous secondary structure distribution and an overall lower α-helical content that would be estimated from CD. Thus, NaClO4 denatures by inducing a molten globule-like structure that seems completely off-pathway between a fully folded helix and a coil state” [82]. Very reasonably, a “loose-helix” of a polysaccharide is conceptually not very different from a “molten globule-like structure” of a polypeptide.
Very little, if any, work has been so far devoted to highlight the fundamental interaction of the perchlorate anion with (ionic) polysaccharides, and with pectic acid in particular. Some references are given in the Supporting Information. To the best of our knowledge, the only paper which might—at large—be considered as related to pectate deals with the anion (in particular: ClO4) adsorption by chemically modified orange peels, to produce effective sorbents to remove perchlorate contamination from drinking water. “The experimental results showed that the values of pH and coexisting anions have an important influence on the adsorption of ClO4 ions by the modified orange peels. The Freundlich adsorption isotherm model was suitable for the ClO4 ions in solution. The adsorption process of ClO4 ions in solution by the modified orange peels is not uniform”, thus suggesting the onset of specific interactions between the inorganic anion and some component of the raw material (very likely pectin/pectate) [83].
Probably the only significant investigations of the effect of lyotropic ions on carboxylated polysaccharides undergoing conformational changes are those of Clarke-Sturman et al. on xanthan and succinoglycan and of Mráček et al. on hyaluronan (HA). In the former cases “…high concentrations of [chaotropic] anions such as bromide or thiocyanate lower the transition temperature, thus decreasing the stability [of the ordered conformation] of the polymer” [84]. In the case of hyaluronic acid, the chaotropic salt KI was the most effective at increasing the flexibility of the macromolecular coil [85]. In addition, Tatini et al. reported that the decrease in the melting temperature of the freezable bound water of both alginate and hyaluronate was proportional to the chaotropic character of the supporting electrolyte (at a concentration 0.5 M), the maximum effect being shown by NaClO4 [86].
Considering the very close position in the Hofmeister series of ClO4 and of the anions quoted in the two former papers (in all cases considered as chaotropic ions), it was decided to hypothesize that a similar effect is also produced on the conformation(s) of galacturonan.
Two opposing driving forces confront each other upon increasing the concentration of NaClO4. The former one is an increasing destabilizing effect of the chaotropic perchlorate anion toward the ordered conformation according to the working hypothesis, on one side. The latter is a progressive reduction in the effective charging brought about by the increasing electrostatic shielding by the increasing ionic strength.
In the ideal process of mixing sodium pectate (at α = 1.0) with salt up to Cs → ∞. the quoted chaotropic effect of the perchlorate anion will continue destabilizing the ordered conformation, with the same effect as that produced by an increase in charging from α1 to α = 1.0. However, from the electrostatic standpoint, the charges on galacturonan will be progressively shielded: at I → ∞ the numerical values of both the (excess) polyelectrolytic thermodynamic functions—with their typical log I dependence—and the Debye–Hückel ones—with their I dependence—completely vanish. Sodium pectate (α = 1.0) at I → ∞ is then a polyuronate formally bearing full negative charges; however, its electric field, as perceived by a reference cation in solution, is zero. In practice, from the polyelectrolyte point of view, it is not distinguishable from the polymer at α = 0.0, apart from the existence of possible (very) short-range effects involving the COO group. It is then to be expected that the loose 21 conformation progressively reverts to the more ordered 21 conformation. It amounts to completely reverting the disordering effect previously brought about by increasing the fraction of charging from α1 to α = 1.0. From the enthalpic point of view, this would imply expecting an exothermic heat effect, equal in value and opposite in sign to that accompanying the “loosening” one observed by charging the polymer up to α = 1.0.
Figure 17 shows that the system, both in “water” and in “salt”, shows a complex thermal behavior as a function of the concentration of added sodium perchlorate (i.e., of I). Figure 17b tells that galacturonan in “water” shows an (excess) endothermic heat change of up to about +0.03 kcal·mole r.u.−1 (for Cs = 0.004 M), which adds to what was calculated over the whole range from α1 to α = 1.0 (namely +0.10 kcal·mole r.u.−1; see Table 2). The sum, i.e., +0.13 kcal·mole r.u.−1 seems to be the enthalpy change accompanying the maximum possible “loosening” effect brought about by the combined action of an increase in charging (to 100% at α = 1.0) and of the concentration of the chaotropic salt, at 25 °C (see Table 6, panel a., last column, and panel b., B, left column). Interestingly, the same value has been obtained from the analysis of the enthalpy of dilution in water (see Section 3.2; result reported in the last column of Table 3 and in Table 6, panel b., B, right column). The following thermal history (on the Cs axis) of sodium pectate shows a progressive, very neat exothermic enthalpy change, to reach—at the asymptote—a total enthalpy change from maximum of −0.16 kcal·mole r.u.−1 at [NaClO4] → ∞ (Table 6, panel b., A). The parallel changes in entropy have been calculated using the proper values of the Tm form, as seen in Table 2; they have also been reported in the lower part of panel (b) of Table 6. The result is really interesting: within error, the system in “water” at I → ∞ regains all the internal energy and entropy changes which have been released in the “forward” (or “loosening”) process, and even a little more than those. As to this latter result, the net negative values of both enthalpy and entropy balance (see last column of Table 6, panel b., A + B), just slightly beyond error, are what would be expected for a final state (in the I → ∞ limit) corresponding to zero charge (“as if” α = 0.0), i.e., lower than the initial value of the calorimetric process (α1 = 0.13), due to the reversal of the endothermic and endergonic values of the forward process.
The situation in “salt” is very different. The endothermic variation of Δ H ¯ m i x e x c e s s develops over a wider range of Cs, namely from 0.05 M to 0.67 M, with a higher value of Δ H ¯ m i x e x c e s s at maximum (i.e., about +0.06 kcal·mole r.u.−1 at Cs = 0.07 M. Note that in Figure 17b the sharper form of the peak in “salt” with respect to “water” is simply due to the logarithmic scale). Like in the previous case, the resulting value of + 0.19 kcal·mole r.u.−1 is the enthalpy change accompanying the maximum possible “loosening” effect in “salt”, at 25 °C starting from α1 (Table 6, panel a., last column, and panel b., B). Beyond Cs = 0.07 M, an exothermic heat change is observed, whose asymptote, however, does not go beyond −0.01 kcal·mole r.u.−1, for a total drop (from maximum) of −0.07 kcal·mole r.u.−1. Much in the same way as in the “water” case, the correlated changes in entropy have been calculated; all thermodynamic parameters have been reported in Table 6. In the “water” case, the balance between the “forward” and the “backward” charging paths is very small and negative; at variance, in the “salt” case, it is positive and significant. The destabilizing effect of the larger concentration of the perchlorate anion is only partially overcome by the decrease in the electrostatic interactions. Whereas, in the previous case, the net result of the thermodynamic “quasi-cycle” polymer α 1 C s = 0     polymer α = 1 C s = C s M A X     polymer α = 1 C s = is just slightly negative, in the latter case the clear endothermic (and endergonic) final balance demonstrates, for the first time, the existence of a clear chaotropic effect of ClO4 on galacturonan. Much like the cases of xanthan and succinoglycan [84], hyaluronan [85] and peptides with large α-helical propensity [82], the chaotropic anion clearly stabilizes the more disordered conformation.
From the quantitative standpoint, however, it should be recalled that the values of Δ H ¯ l y o t r o p . α 1 , R α = 1 , R = and of Δ S ¯ l y o t r o p . α 1 , R α = 1 , R = are specific to the particular initial concentration of perchlorate (namely, 0.05 M). For a complete description of the lyotropic effect, a series of experiments of both the enthalpy of dissociation and of the enthalpy of mixing with NaClO4 as a function of the salt concentration would be necessary. In its absence, it is possible to observe that the ratio of the “lyotropic” values of enthalpy and entropy in aqueous NaClO4 0.05 M at 25 °C (A + B) over the corresponding “loosening” terms (B) is about 0.62. This means that increasing the ionic strength to ∞ would bring the loose helical conformation of sodium galacturonate (at α = 1.0) back to complete conformational ordering only by about 38%.
A short discussion on the coupling of the polyelectrolyte aspects with the lyotropic ones is reported in Supplementary paragraph 6, in which Figure S2 highlights the dependence of the thermodynamic properties on the inverse of the square-root of the supporting 1:1 electrolyte. Hereafter, the two panels of Figure 18 summarize the evolution of the changes in the internal energy of “loosening” and “tightening” upon increasing the net charge on the polymer (as monitored by the degree of dissociation, α) or decreasing it by charge screening (as measured by the operationally defined parameter β). β, called the “fraction of un-screening”, measures the fraction of unscreened charge on the polymer by the action of the ionic strength. It is the un-screening counterpart of the degree of charging (namely, dissociation of the COOH groups, α). It has been calculated as the ratio of the polyelectrolyte enthalpy of the system at Cs over the initial value of Cs (which is 0.0 M and 0.05 M for the “water” and the “salt” cases, respectively).
The corresponding enthalpy changes have been indicated. In the case of “water”, the difference between “loosening” (purple upward arrow) and “tightening” (magenta downward arrow) is close to experimental error; nevertheless, the small negative value is fully compatible with (or even expected for) a tightening of the helical conformation upon decreasing α at very low values of (unscreened) charge as demonstrated by the whole of the preceding discussion.
A useful discussion of the difference between the two—often identified—Hofmeister [46] and lyotropic [45] effects is provided by the work of [79]. The literature evidence on the presence of determining the solution behavior of pectins—and of pectate in particular—is not abundant; in particular, it was impossible to find any explicit reference to the ClO4 anion. The only evidence concerns the effect of cations. The effect of the sequence K+ > Na+ > Li+ on the rheological properties (and on gel strength in particular) of LMP pectin gels [42,43] has found a counterpart in the same sequence favoring chain association and aggregation [87]; altogether, those findings point to a beneficial effect of chaotropic cations versus the formation of pectin–pectin junctions at the root of both phenomena, apparently irrespective of the underlying molecular mechanism (i.e., intermolecular H-bonding, hydrophobic interactions). A more recent paper by Chen et al. [88], besides confirming the K+ > Na+ sequence, uniquely reported that the anions followed the series Cl > I in increasing G′ at the equimolar concentration of 0.07 M (for both the K+ and the Na+ salts); this is paralleled by the sequence Cl > NO3 in the range from 0.035 M to 0.105 M (Na+ salts), confirming an inversion of the lyotropic series between cations and anions.
It would be risky to draw too far-reaching conclusions from a comparison between the limited reported literature evidence and the present, clear findings that the ClO4 anion favors the “loose” 21 conformation. The pH range of the quoted rheological results on LMP—from 5.0 to 3.0 [88]—corresponds to the progressive shifting of the conformational equilibrium from the 21 to the 31 conformation, but no evidence whatsoever was provided in those papers between the actual conformation of LMPs and their rheological properties. More work, in particular more experimental data obtained with varying concentrations of both chaotropic and kosmotropic ions, as well as results from conformational-sensitive techniques (like the chiro-optical ones), are needed to assess a clear picture of the effect of ionic co-solutes belonging to the Hofmeister series on the solution and gel properties of galacturonan.
Still, the present evidence is the first one to clearly identify such an effect as modulating the conformation of sodium pectate, adding to the few already established cases of both non-ionic and ionic polysaccharides.
Finally, it is somehow mandatory to underline that the present results, based on the fundamental role that the CC polyelectrolyte theory has brought to the unraveling of the different enthalpic contributions, further strengthen the statement that “The theory has already been shown to provide for an effective “contrast effect”, enabling one to evaluate the non-polyelectrolytic contribution to the experimental enthalpy change of ion-induced conformational transitions of ionic polysaccharides” [89].

5. Whole-Chain Properties of Galacturonan

5.1. Capillary Viscosity Data

The previous discussion has extensively focused on the fundamental contributions to the conformation of galacturonan at the level of constituent monomeric species (at the microscopic scale) and on their role in determining the macroscopic rheological behavior of the polymer in the low-pH gel formation. However, to get a complete picture of polysaccharide behavior as a function of the investigated variables (namely, charge density and low MW salt presence), capillary viscometry can provide valuable information on the whole-chain properties of pectic acid, reflecting the size and shape of the macromolecular solute and somehow covering an intermediate mesoscale. The microscopic thermodynamic parameters fail to provide any information on how many repeating units undergo a given transition, whereas whole-chain properties (like viscosity or light scattering) do. The presence of cooperative effects typically manifests as the agent modulating the size of the polymeric stretch at the root of a given macroscopic property (see, e.g., [90,91,92]).
As already pointed out in Section 2.1, in the transition region, the ηred(α) curve presents a marked deviation from the expected monotonous increase, typical of weak polyacids [52], as a function of the increase in the linear charge density, α. The latter behavior has been indicated by a dash-dotted curve in both panels of Figure 19. However, at variance with the quoted cases of polyelectrolytes NOT undergoing abrupt pH-induced conformational changes, galacturonan has been shown to face a real conformational transition, passing from a “tightened” 31 helix, at low values of α, to a “loosened” 21 helical conformation, at high α values. The difference between the curve fitting the experimental data points and such a “polyelectrolyte” reference curve has been reported (with comments) as Figure S3 in Supplementary paragraph 7 for the system both in “water” and in “salt”. However, a visual inspection of the ηred(α) plot of pectic acid in water reveals that the first part stands for its clear linearity (see dashed lines in Figure 19). It represents the viscometric behavior of pectic acid in the range of α in which the 31 helix is the only conformation, which is progressively tightened by a small increase in charge density up to about α = 0.2. This value—albeit approximate—has been indicated as αc, the letter “c” standing for “critical”. It is the value of α corresponding to a maximum tightening of the 31 conformation, as suggested by the convergent indications of microcalorimetry, DSC and chiro-optical data discussed previously. It was found expedient to take the line through the first part of each of the curves as a reference, with no loss of information, simply to operationally use it as a “viscometric contrast”. The blue color pertains to the “water” (“w”) case, the red color to the “salt” case (“s”). The “excess” value of ηred, with respect to the hypothetical behavior of the “tight” 31 helix, δ ηred(α), extrapolated from the initial part of the ηred(α) curve, can then provide hints on the relative viscometric behavior of the pectate chain at higher values of α with respect to that in the initial range. The difference from the line, i.e., the function δ ηred(α), has been reported in Figure 19b, both for the experiment in water and for that in aqueous NaClO4.
A common behavior can be noticed: two decreasing traits are connected by a shorter central one, with an opposite slope. In the salt-free case, the initial decreasing segment and the central one have larger (absolute) slopes than in the case of “salt”. In the latter case, the central trait is quite short (about 0.15 α units), it starts at a much higher value of α and it is practically horizontal. The main, striking feature of the curves in panel (b) is that all δ ηred(α) values beyond α = 0.2 never regain the ηred trend extrapolated from very low α values. This is at strong variance with the case of the pH-induced transition of both PGA (as indicated by both viscosity [51] and light scattering [93]), and PMA (from viscosity [52]), in which a notable increase in dimensions was shown to accompany the conformational transition upon increasing α to eventually recovering the initial trend.
Figure 20a reproduces the δ ηred(α) data and those of (pKa)excess for the “water” case. The values of (pKa)excess have been obtained as the difference between the experimental (pKa)app data and the corresponding values of the reference best-fit line drawn through the first group and the last group of experimental data points of Figure 1b. The widely differing parts of the trend of δ ηred versus α have been sketched with four segments, indicated with capital letters from A (corresponding to region I of Figure 1 and Figure 3) to D (the latter letter corresponding to region III of those figures). The overall shape is that of an asymmetrical V, with two arms exactly corresponding to the extension of region II, the one on the larger α side (B) being shorter than the one before the minimum (C). Moreover, beyond α = 0.6 (namely the end of the conformational transition), the curve starts decreasing again (D), due to the lower slope of the reduced viscosity increase from α = 0.6 toward α = 1. Quite interestingly, the (pKa)excess(α) function shows two peaks: the former one (“peak 1”) essentially covers the sharply decreasing trait B of δ ηred(α), whereas the second one (“peak 2”) encompasses traits C and D. To make matters more surprising, Figure 20b also reveals that the dependence of the derivative of Δ H ¯ d i s s e x c e s s α with respect to α shows a very close asymmetric V-shaped behavior in the same range of α. Last but not least, Figure 20b also points to the similarity of the δ ηred(α) curve with that of the derivative of [ϑ]215 with respect to α, namely the chiro-optical parameter fundamental for the assessment of the polymer conformational changes. (A slight shift—indicated in the figure—of the relevant points (e.g., maxima and minima) to higher α values in the case of the latter curve is easily explained, taking into account the different polymer concentration of the two sets of experiments: 9.7·10−3 mole r.u.·L−1 for ηred and 21.3·10−3 mole r.u.·L−1 for [ϑ]215. This was expected, e.g., from inspection of the (pKa)app plots of Figure 1b, which show an increase to higher α of the transition “bump” proportional to the polymer concentration [29]). Finally, it is important to stress that the peculiar behavior (minimum) at α = 0.4 is correlated with the condition f 3 1 = f 2 1 = 0.5 (α = 0.4 ≡ α1/2); the further confirmatory results of Figure 9b have not been added to Figure 20b to avoid overcrowding.
Figure 20. (a) Dependence on α of δ ηred of pectic acid in “water” (blue open circles and dash-dotted curve, data from Figure 18b; l.h.s. scale), and of (pKa)excess (magenta (peak 1) and purple (peak 2) dot-centered lozenges and dashed-dotted curves calculated with the Origin® Multiple Peak Fit routine, data calculated as the difference between the experimental (pKa)app.(α) data points of Figure 1b and the dotted line—baseline—there indicated; magenta and purple r.h.s. scale); segments A–D described in the text. I, II, III are the three regions defined in Section 2.1; (b) dependence on α of the δ ηred values (blue open circles and dash-dotted curve, l.h.s. scale), of the derivative with respect to α of the integral enthalpy change in transition, d Δ H ¯ t r e x c e s s /dα, from Figure 3a (magenta open circles and dash-dotted curve, inner r.h.s. scale), of the derivative with respect to α of the molar ellipticity at λ = 215 nm, d[ϑ]215/dα, from Figure 6b (purple open circles and dash-dotted curve, outer r.h.s. scale; the abscissa has been translated to account for the difference in α stemming from the difference in polymer concentration).
Polysaccharides 04 00018 g020
The similarity of the three plots of Figure 20b cannot be purely incidental. All in all, this set of data clearly establishes an intrinsic correlation of the processes of (i) the breakdown of the initial hydrodynamic structure of poly(galacturonic acid) and the successive build-up of sequences of 21 units (δ ηred(α): blue curve), (ii) the disruption of the helical 31 conformation (d[ϑ]215/dα: purple curve) and (iii) its correlated change in internal energy (d Δ H ¯ t r / dα: magenta curve). Moreover, the reported difference in apparent excess acidity (as (pKa)excess in Figure 20a) clearly adds to this picture the evidence that subtle non-monotonic changes in the polyelectrolyte electrostatic free-energy parallel the quoted processes.
Scheme 6 represents the molecular events at the root of the dependence of δ ηred on α. In the initial range of α (up to α2), the 31 helical repeating units get progressively tightened and expanded. At α = αc = 0.2, the hydrodynamic-active element is likely a rather extended stretch of 31 helical repeating units, loosened to only about 9% ( f l o o s e n . , calculated as the ratio Δ H ¯ l o o s e n . e x c e s s α 1 , R α 2 , R / Δ H ¯ l o o s e n . : 0.024/0.278; for numerical values, see Table 4 and Supplementary paragraph 2), and very stiff (as indicated by both the very low value of the Smidsrød’s B parameter: B = 0.005 [94] and the discussion after the following Figure 21). The significant expansion of the initial stretch can be described as a wormlike chain with high persistence length; it is also indirectly demonstrated by the very large loss of viscosity (marked as B in Figure 20a and in Scheme 6) that takes place (probably cooperatively) in the interval from α = 0.2 (αc) to α = 0.4 (α1/2).
Beyond α = 0.4, the large prevalence of 21 traits likely allows for the formation of 21 helical sequences, partially regaining expansion (and increase in persistence length). However, those sequences are able to only partially recover the previous viscosity loss produced by the breakdown of the long 31 cooperative segments. In the absence of additional evidence, it impossible to ascertain whether such smaller recovery of viscosity (C)—as compared with the preceding larger drop (B)—stems from an “intrinsic” lower stiffness of the 21 helix with respect to the 31 one or by the shorter size of its average cooperative units, or from both reasons. Beyond α = 0.6, namely after the end of the conformational transition, the partial recovery comes to a sharp end. It is possible to estimate that the (cooperative) 21 helical structure can tolerate a maximum level of “loosening” of about 25% (at α = α3, calculated as the ratio Δ H ¯ l o o s e n . e x c e s s α 1 , R α 3 , R / Δ H ¯ l o o s e n . : 0.069/0.278; for numerical values, see Table 6 and Supplementary paragraph 2). Beyond that, a new breakdown of the hydrodynamic active structure takes place and the viscometric behavior of pectate in the high α region well conforms to the (non-cooperative) expansion of a semi-flexible polyelectrolyte, as also indicated by the tenfold larger value of the Smidsrød’s B parameter with respect to that of the 31 conformation (B = 0.039 ± 0.007 [94]) and by the results reported in the following Figure 21. Over and above the described abrupt changes in δ ηred, f l o o s e n . increases steadily up to α = 1.0, reaching f l o o s e n . = 0.36.
The dependence of the δ ηred function on α for the case in aqueous 0.05 M NaClO4 points to a smoother process. The likely explanation for this is that the higher value of I (and of perchlorate) is deleterious for the hydrodynamic cooperativity of the partially ordered conformations, but certainly much more so for the 21 one. By performing the same calculations as above in the case of “water”, one finds that the values of f l o o s e n . at α2, α3 and α = 1.0 are 13%, 34% and 47% for the “salt” case, as compared with 9%, 25% and 36% for the “water” case, respectively (for the numerical values of the enthalpy changes, see Table 6 and Supplementary paragraph 2). This means that the f l o o s e n . values are always larger in “salt” than in “water”, pointing to the important role of “loosening” (brought about by the perchlorate anion) in determining the observed lower cooperativity in 0.05 M NaClO4.
From the polyelectrolyte standpoint, one should recall the important role, for the “water” case, of the electrostatic persistence length [95], which in the salt-free conditions is producing its largest effect due to the lack of shielding which, on the contrary, characterizes the “salt” case.
The above value of f l o o s e n . ≈ 50% in “salt” (and much more so that in “water”) should not induce looking at sodium galacturonate (α = 1.0) as a “randomly coiled” chain. It should be recalled that “loosening” is but a larger oscillation around the energy minimum of the 21 helix with respect to the simple thermal motion. The reported values of the persistence length, Lp, for LMP or galacturonate at a neutral pH in the 0.1 M NaCl range from 7.5 nm (from SANS) to 12.6 nm (from viscosity) for a sample with DE = 0.28 [26], or 9 nm (from viscosity) for a sample with DE = 0.05 at Cs → ∞ [96]. Given those values, the most suitable definition is that of a wormlike chain [96] with a pseudo-helical conformation [27].

5.2. “Intrinsic” Chain Expansion and Stiffness of Pectic Acid

The ηred data at infinite ionic strength (as NaClO4) from figure 2 of reference [31] have been replotted in Figure 21. They have been obtained by the extrapolation of the viscometric data by [29], here reproduced in Figure 1a.
The most significant aspects of the curve are as follows: (i) the typical sigmoid shape—related to the pH-induced conformational transition—is very clear and retained from finite salt concentrations; (ii) the limits of the conformational transition are shifted to higher α values (the values of α2 and α3 are 0.36 and 0.74, respectively), but the width of the transition is essentially constant (δ αtr = 0.38); (iii) the value of αc—corresponding to the maximum extension of the 31 helix—coincides with α2 and is then higher than that in water (i.e., α2 = 0.2); (iv) at variance with the “water” case (reproduced in panel (b) for comparison), in which the sigmoid modulates an underlying increasing trend, at I → ∞ such underlying trend is essentially horizontal. This led the authors of the paper by Guidugli et al. to stress that the cube root of the ratio of ηred at α = 1.0 over that at α = 0.0 is 1.02, whereas the ratio of the experimentally determined values of helix pitch, h, for the charged (21 helix) [70,97] over the uncharged (31 helix) form [2,8] is 1.01. (The cube root allows passing from the volume scale of viscosity to the linear scale of the helical pitch for consistent comparison). Besides the excellent agreement between the two results, the remarkable finding is that the two limiting conformations also share practically the same elongation in solution, as long as the electrostatic interactions have been completely shielded, in full agreement with the finding of Cros et al.: “The most striking features are the facts that these changes in conformation can occur without any noticeable variation of the fibre repeat” [11]. In this respect, it seems very interesting to also recall that the ratio of the values of molar ellipticity extrapolated to α = 0.0 for the 21 conformation over that of the 31 one is 1.01, as already pointed out in Section 2.7.
The process of extrapolation, however, has provided an additional piece of very useful information, namely the response of chain dimensions to a change in the ionic strength. Among the several works on this aspect of polyelectrolyte solutions, the already quoted one by Smidsrød and Haug has probably been one of the most successful: “The response to salt was quantitatively expressed as the slope [S] of straight lines relating the intrinsic viscosity to the reciprocal of the square-root of the ionic strength [S = d   η d   I 0.5 ]. This slope increased considerably with increasing molecular weight of the polyelectrolyte, and could serve to characterize the response to salt of different substances only when comparison was made at a constant molecular weight. [94]. Their latter remark is very relevant for the present case, since light-scattering [37] and osmotic data [25,30] have shown that the pH-induced transition of pectic acid in dilute solution takes place with no change in the relative molar mass [25]. Aiming at comparative purposes only, it was decided to use the ηred results instead of [η], thereby defining S’ as S’ = d   η red d   I 0.5 by analogy with S, and taking the ratio of S’ at any value of α over S’ at α = 1.0. The results have been reported in Figure 21b as well (before proceeding, attention should be drawn to the different nature of the values of ηred at I → ∞ and the S’ values. They both derive form the I dependence of ηred: however, the former ones pertain to the polymer condition at I → ∞ whereas the latter ones to the process toward I → ∞, thus enabling us to also draw conclusions on stiffness at finite values of I).
The result is impressive, in particular when compared with the very small range of variation of the ηred curve in the same range of α. The curve is continuously increasing, but more markedly so in the range of conformational transition. The values of the S parameter reported by Smidsrød and Haug for “sodium pectinates of varying degree of esterification” (D.E.) were 0.028 and 0.030 for D.E. = 0 (i.e., α = 1.0) and 0.02 for D.E. 89% (i.e., α = 0.11), corresponding to a ratio of about 15. The present ratio of S’(α)/S’(α = 1) between the extreme values is 15.6 (namely, 1.0/0.064), in very good agreement with theirs. It is possible then to conclude that the galacturonan backbone, once liberated from (both long- and short-range) electrostatic interactions, shows essentially the same elongation at α = 0.0 and at α = 1.0, whereas its flexibility is enormously increased in the same range.
It is useful to consider together the relative values of both ηred (as ηred (α)/ηred (α = 1)) and S’(α)/S’(α = 1) at the values of α corresponding to the extremes of the degree of charging and to the extremes of the conformational transition. The results have been reported in Table 7, together with the stepwise percent variations and the (percent) share of the total percent variation. The latter values tell us that the 31 conformation undergoes a significant expansion up to the maximum tightening at α2, which is almost exactly recovered by the end of the transition at α3. However, the initial expansion is not only accompanied by an increase in stiffness, but it is even paralleled by a slight, but clear, increase in flexibility; it is the rheological counterpart of the complex behavior discussed in Section 2.6 and Section 2.7. On the contrary, expansion and stiffness become positively correlated across the conformational transition, with a behavior which, in relative terms, could be described as a major breakdown of both properties due to the intrinsic features of the conformational energy profile of the two-fold helix. Finally, from α = α3 to α = 1.0, a residual increase in the elongation of the 21 conformation is accompanied by a small increase in chain flexibility, the maximum variation having already been achieved in the transition range.
Nevertheless, the above findings deserve some comments. The first one is a reminder that expansion and stiffness can well be positively correlated, but they also may not be. The second one is that a certain—albeit small—fraction of charge is beneficial for the adoption of an elongated conformation (probably also highly cooperative) of the 31 helix. In fact, the condition of I → ∞, while annihilating both long- and short-range electrostatic interactions, does NOT annihilate the electrical charge (or a fraction of) present on the uronate carboxylate, which is likely involved in H-bonding. The latter comment nicely supports the arguments described in Section 2.7. In relation to Figure 8a and Figure 9a, in the lowest α range the trend of the molar ellipticity seems to reveal that the 31 conformation undergoes two parallel processes. A progressive stabilization of an elongated 31 helical conformation, probably related to the quoted beneficial effect of partly charging the COO groups, and, at the same time, a progressive loosening of that structure due to electrostatic repulsion. In comparison, the parallel changes of the 21 conformation are extremely small, indicating that the elongation of that conformation is moderately affected by variations in charging, and that only a minor increase in flexibility is added to an already very flexible conformation, after the transition, on passing from α3 to α = 1.0.
In 1986, Grasdalen and Kvam published a 23Na NMR relaxation comparative study on alginates and pectate: “Besides providing a direct probe of the ion-binding phenomenon at the molecular level, the NMR of ionic nuclei may also serve as an indirect probe of the conformational and dynamic behavior of macromolecules” [98]. In the case of pectate, they also investigated the relaxation features of the probe counterion as a function of the degree of neutralization, α’, concluding that “No evidence in support of a recently reported pH-induced intramolecular conformational transition in polygalacturonate was obtained” [98]. Actually, they seem to have overlooked the anomalous trend that is evident in the neutralization range corresponding to the conformational transition from their data replotted in Figure 22a. Figure 22b reports the difference between the linear behavior extrapolated in the 0 ≤ α’ ≤ 0.2 range and the experimental data, δ Δν1/2, in full analogy with the procedure used to obtain the difference viscosity data of Figure 19b. One should start recalling the following: “Around α = 0.61 … for polygalacturonate …, where the linear charge density exceeds the critical value predicted by Manning’s limiting law [ξ = 1.0], a rapid increase in the line width occurs, indicating an appreciable binding of counterions. This result is typical for polyelectrolyte solutions in which the secondary structure of the polymer is retained upon neutralization” [98]. However, the range of α’, which is relevant to the present discussion, corresponds to ξ < 1.0, namely up to the end of the transition. For ξ < 1.0, the observed effects on the 23Na relaxation of the uncondensed counterions in solution mostly reflect the conformational and the ensuing micro-viscosity features of the polyion. The δ Δν1/2 curve starts getting negative at about α2, with a sudden further drop at about α = 0.4, namely at f 3 1 = f 2 1 = 0.5; the analogy with the results of Figure 20b is striking. A rough estimate of the slopes before and after α = 0.4 returns −9.5 and −107 s−1, respectively, with a full order of magnitude difference. At α3, which also coincides with α ξ = 1 , the transition is over and the strong effect of counterion condensation starts dominating.
Borrowing the clear interpretation of those authors of the results on alginates, it is straightforward to correlate a larger value of Δν1/2 with a faster counterion relaxation due to the higher intrinsic rigidity of the polyanion. The significant stiffness of the 31 helical conformation starts being only slightly weakened by the transition at α2, but when the more flexible 21 units start prevailing (namely beyond α1/2) the drop in the relaxation rate becomes dramatic.
No better corroboration of the viscometric results on the behavior of the flexibility parameter S’ of Figure 21b and Table 7 could have been expected from a completely independent methodology and investigation.

6. Conclusions

The results of the comparative revisiting of the published research on the conformational aspects of pectic acid and LMP can be summarized as follows:
  • An exhaustive thermodynamic description of the pH-induced conformational changes [7,29,32] of galacturonan has been achieved, demonstrating the coexistence of an intramolecular 31 → 21 helical conformational transition with an order → (partial) disorder transition;
  • Increasing the fraction of charging (as degree of dissociation, α) from 0.0 to 1.0—at 25 °C—brings about the following:
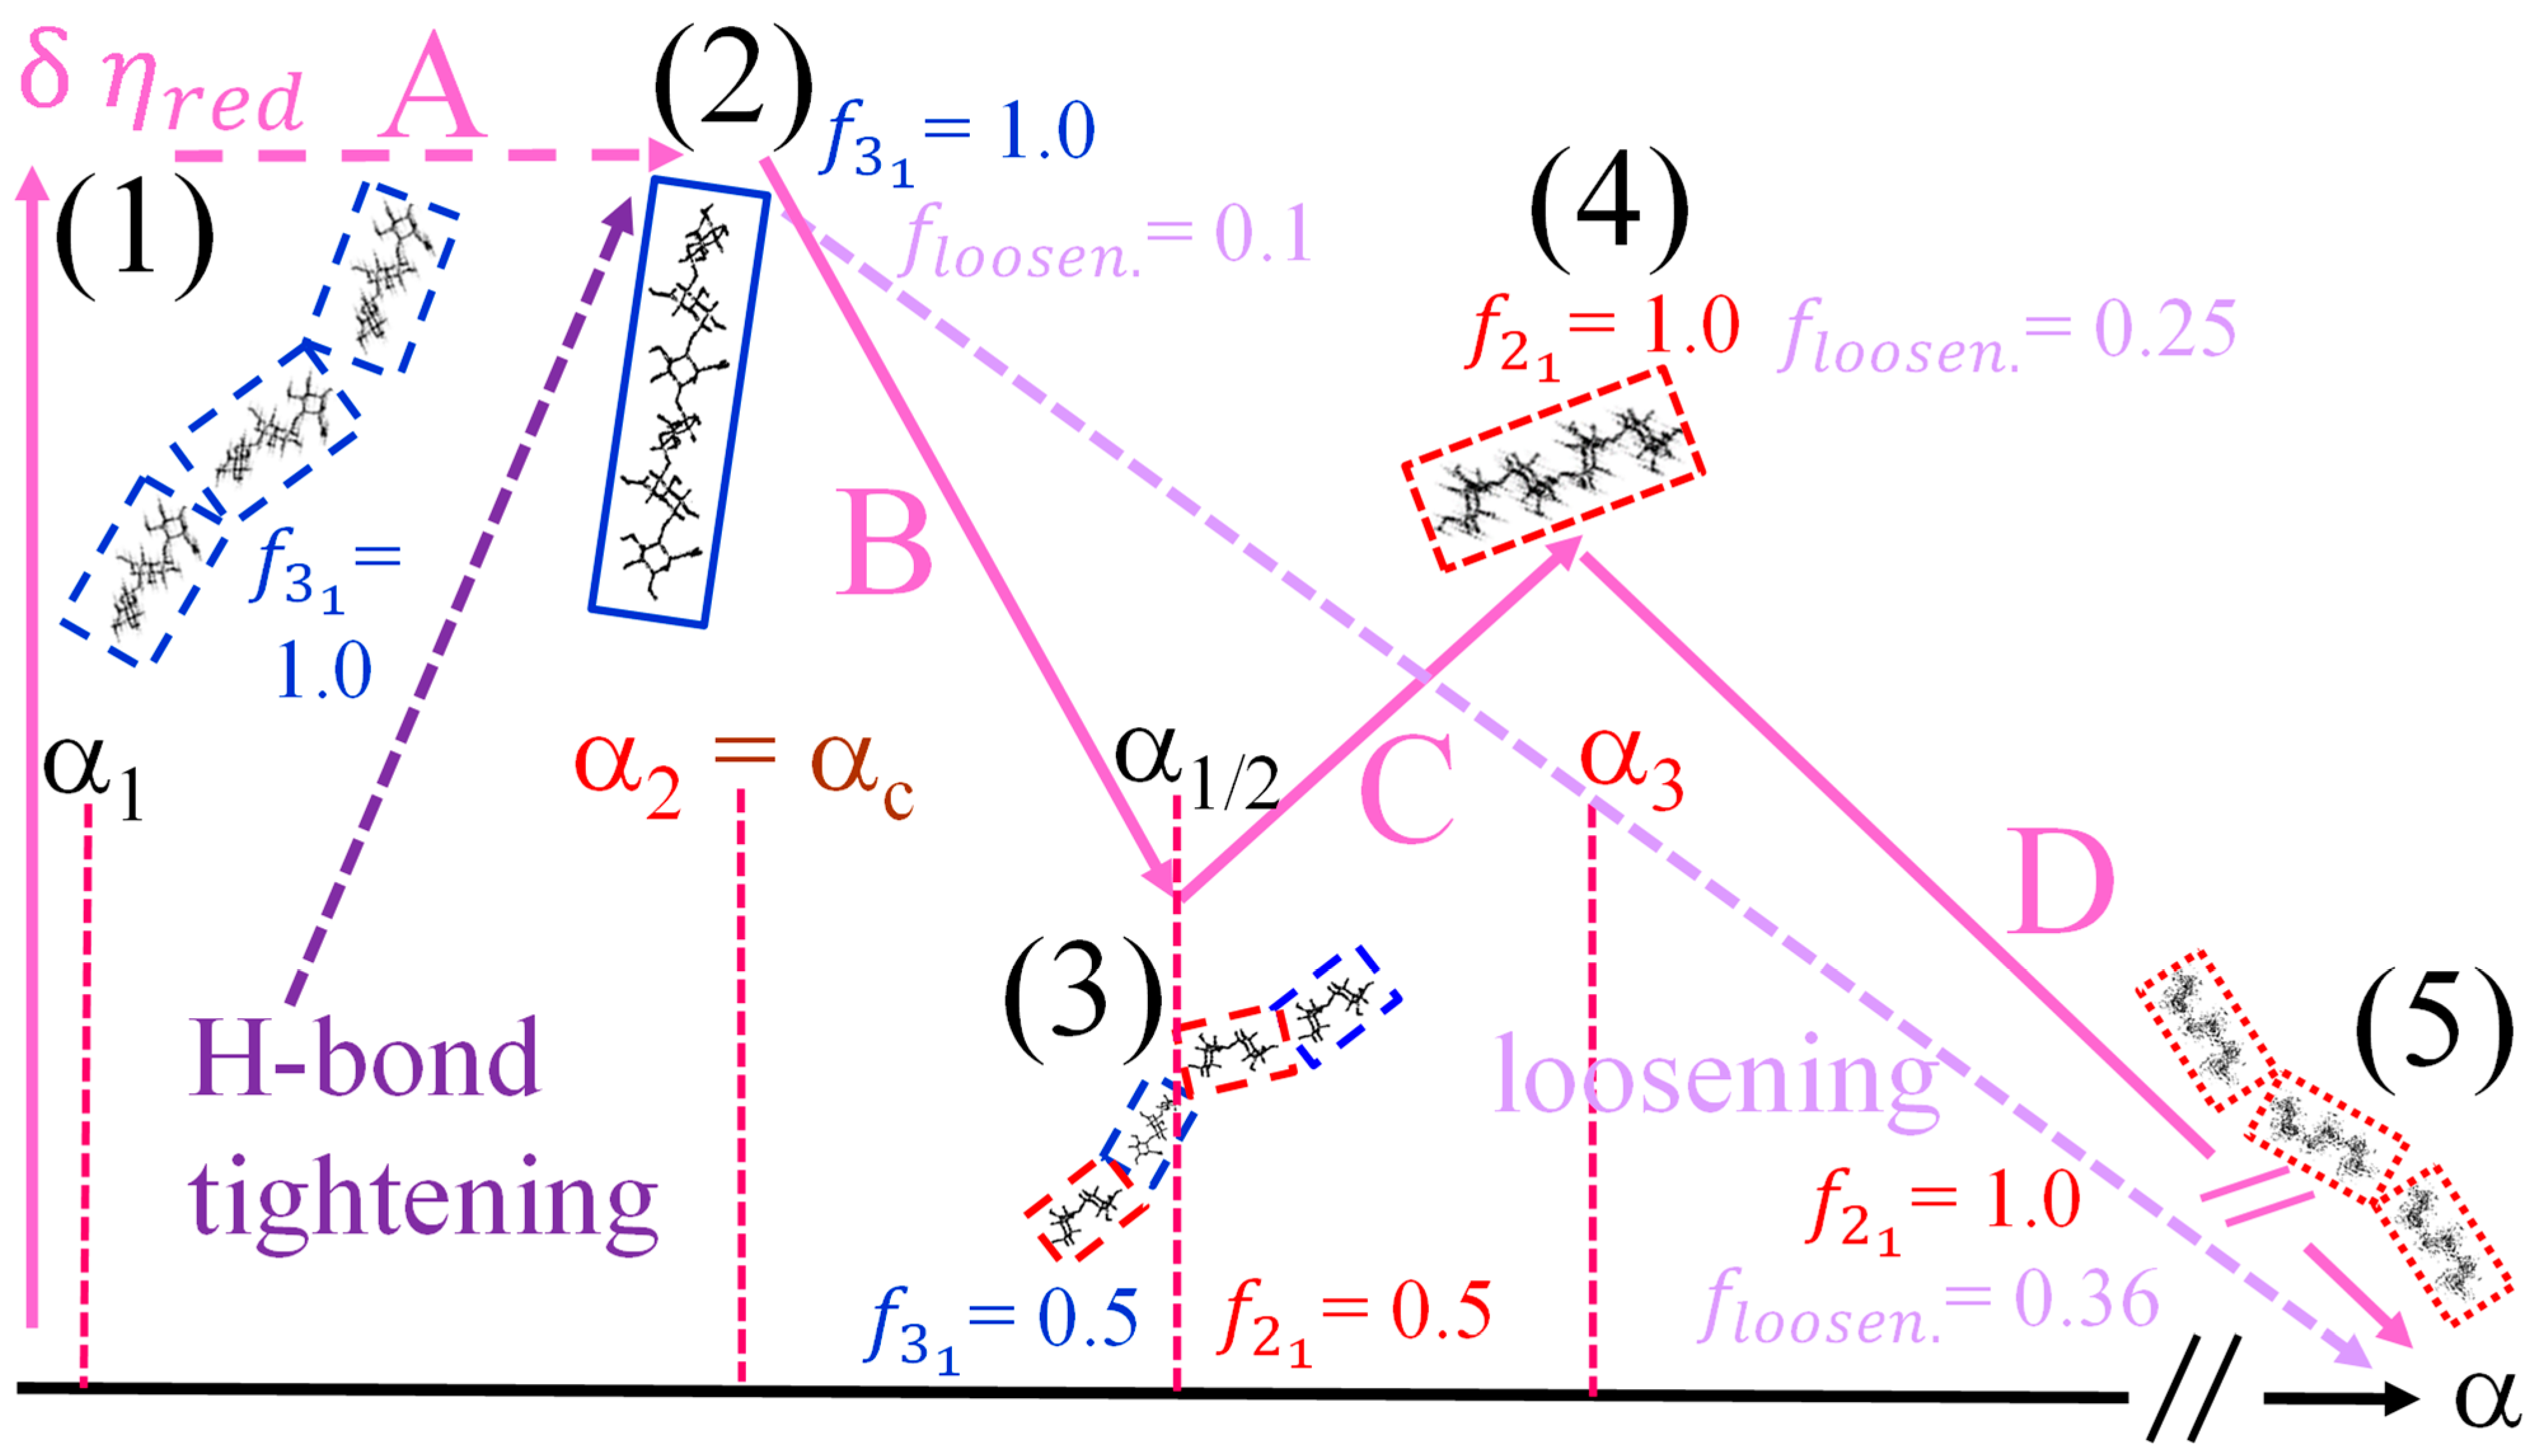
    • An expansion of the 31 helical conformation—tightened by the formation of intra-molecular H-bond in H2 → O’6—with the formation of rheologically significant cooperative stretches up to a critical value of charge density, ξcc = αc·ξ0);
    • A conformational transition from the stiffer 31 to the more flexible 21 helical conformation; the α width of the transition is constant (δαtr = 0.38), i.e., independent of the ionic strength of the medium;
    • An ever increasing—with α—loosening of either helical conformation;
  • The 31 → 21 transition can also be achieved by heating LMP in water (namely, from 10 °C to 85 °C). The pH profile of the heat effects (by DSC) indicated that the condition pH = 3.0 produces the maximum value, paralleling the pH profile of the optical activity. It corresponds to the maximum tightening by the formation of intra-molecular H-bond;
  • Both negative charging (by COOH dissociation) and temperature are effective in disordering (“loosening”) galacturonan helical conformations. However, the latter variable is by far more effective in doing so. Moreover, NaClO4, in due concentration, can stabilize the loosened conformation. This has been shown as the failure of an increase in the ionic strength to completely revert the loosening provoked by the increase in charge density through electrostatic shielding. Such effect is the first reported evidence of the impact of the chaotropic anion perchlorate on galacturonan (Hofmeister effect);
  • For pH values ≤ 2.0, a massive association of LMP builds up, which is mostly driven by hydrophobic (van der Waals) interactions. A concerted action of highly reduced charge density, increased conformational loosening and interchain association produce interchain junctions at the root of acid–gel formation [32];
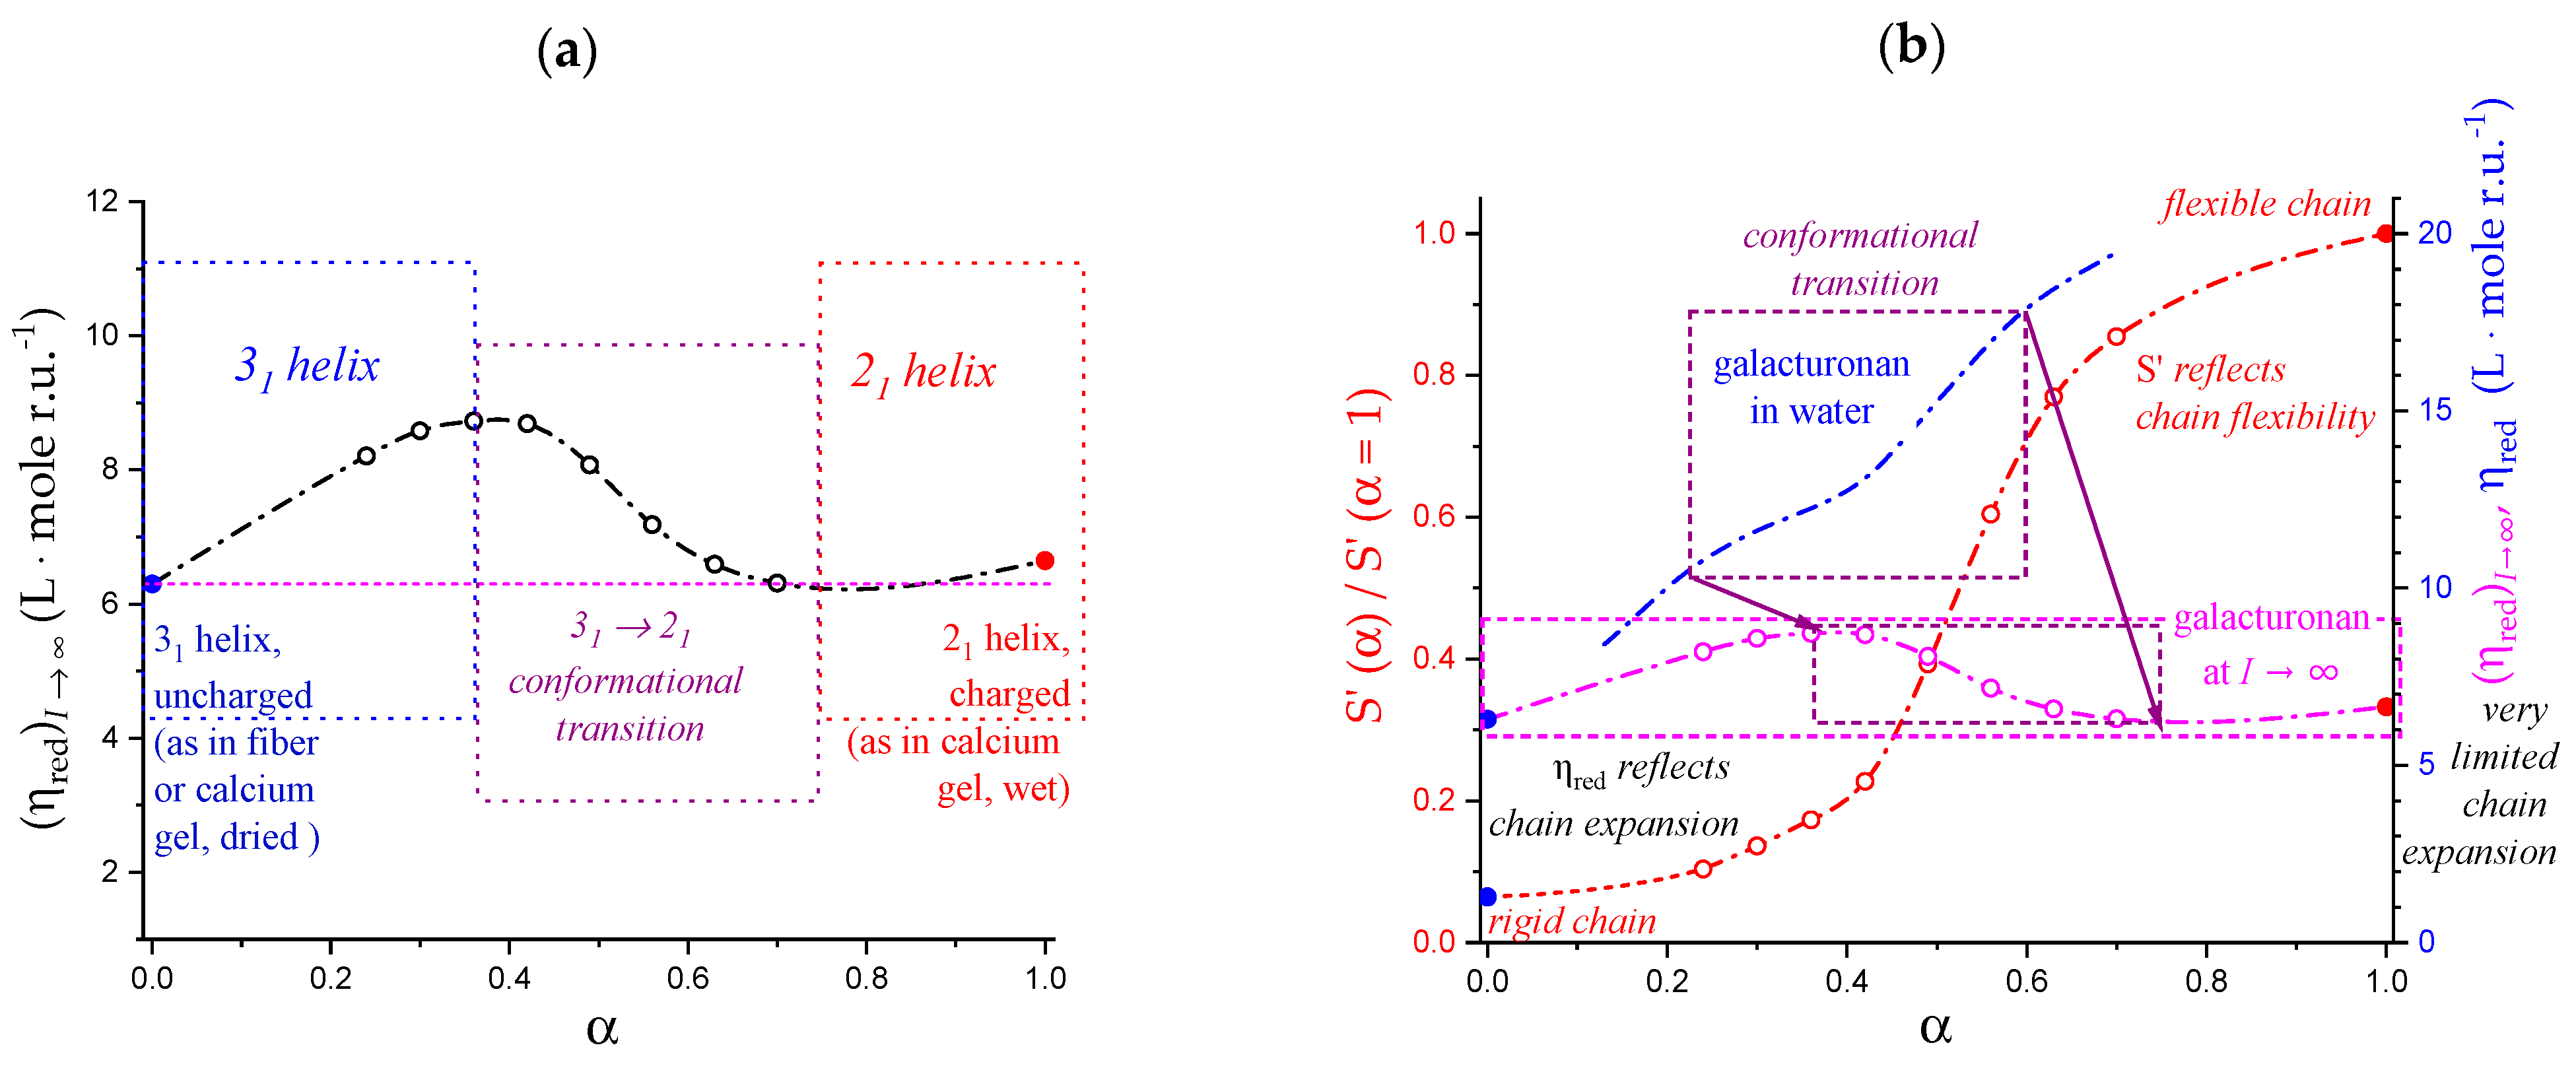
  • The extrapolation of the reduced viscosity data to infinite ionic strength confirmed that the expansion of the 31 and the 21 helical conformations at α = 0.0 and 1.0, respectively, was the same (to within 1%) [31]; on the contrary, the response to ionic strength change showed a 15-fold increase in the 31 → 21 transformation, pointing to a very large accompanying increase in flexibility;
  • The viscosity data confirmed that the three-fold helical conformation undergoes progressive tightening and expansion thanks to inter-residue H-bond formation up to a critical value of α, αc, beyond which a breakdown of the cooperative helix starts to produce the much more flexible two-fold helical conformation.
Although α-helix → β-sheet transitions have been reported in protein and polypeptides (see, e.g., [99,100]), an inter-helical transition in polysaccharides in solution is much more rare, with the case of galacturonan and LMP being the only clear-cut case studied so far. Quite surprisingly, very little work—if any—has been devoted in the past forty years to deepen this aspect, after the pioneering investigations [7,29,32].
By an in-depth comparative revisiting of those data (and others’), it has been possible to compose a picture in which the different roles of conformational stability, electrostatic interactions, temperature, and the chaotropic effects of low MW salt have been unraveled in their complex interplay to modulate the conformational transition of galacturonan from a three-fold to a two-fold helix coupled with a transition from a “tightened” to a “loose” helix, sharing this feature with other important galactans, like agarose.

Supplementary Materials

The following supporting information can be downloaded at: https://www.mdpi.com/article/10.3390/polysaccharides4030018/s1. References [7,8,25,26,94,101,102,103,104,105,106,107,108,109,110,111,112,113] are cited in supplementary material. File “Supplementary Materials” with the paragraphs:
  • Intermediate values of  Δ H ¯ t r e x c e s s α  at the intermediate values of α, from α1 to α = 1.0
  • Calculation of the “loosen” contribution in the conformational transition interval
  • More on the Thermodynamics of Association
  • On the possible sources of deviation from theory of the enthalpy of mixing data (including Figure S1)
  • More on Hofmeister and Lyotropic Effects in Polysaccharide Systems
  • On the Coupling of the Polyelectrolyte Aspects with the Lyotropic Ones (including Figure S2)
  • On the Viscometric behavior of Galacturonan as Compared to that of a “Normal” Weak Polyacid (including Figure S3)

Funding

This research received no external funding.

Institutional Review Board Statement

Not applicable.

Data Availability Statement

Data presented in this study are available on request from the corresponding author.

Conflicts of Interest

The authors declare no conflict of interest.

References

  1. Zugenmaier, P. (Ed.) History of Cellulose Research BT. In Crystalline Cellulose and Derivatives: Characterization and Structures; Springer: Berlin/Heidelberg, Germany, 2008; pp. 7–51. ISBN 978-3-540-73934-0. [Google Scholar]
  2. Walkinshaw, M.D.; Arnott, S. Conformations and Interactions of Pectins: I. X-ray Diffraction Analyses of Sodium Pectate in Neutral and Acidified Forms. J. Mol. Biol. 1981, 153, 1055–1073. [Google Scholar] [CrossRef]
  3. Rees, D.A. Chain Conformation: Order versus Disorder. In Polysaccharide Shapes; Springer: Berlin/Heidelberg, Germany, 1977. [Google Scholar]
  4. Morris, E.R.; Powell, D.A.; Gidley, M.J.; Rees, D.A. Conformations and Interactions of Pectins: I. Polymorphism between Gel and Solid States of Calcium Polygalacturonate. J. Mol. Biol. 1982, 155, 507–516. [Google Scholar] [CrossRef]
  5. Palmer, K.J.; Hartzog, M.B. An X-ray Diffraction Investigation of Sodium Pectate. J. Am. Chem. Soc. 1945, 67, 2122–2127. [Google Scholar] [CrossRef]
  6. Sterling, C. Structure of Oriented Gels of Calcium Polyuronates. Biochim. Biophys. Acta 1957, 26, 186–197. [Google Scholar] [CrossRef]
  7. Ravanat, G.; Rinaudo, M. Investigation on Oligo- and Polygalacturonic Acids by Potentiometry and Circular Dichroism. Biopolymers 1980, 19, 2209–2222. [Google Scholar] [CrossRef]
  8. Walkinshaw, M.D.; Arnott, S. Conformations and Interactions of Pectins: II. Models for Junction Zones in Pectinic Acid and Calcium Pectate Gels. J. Mol. Biol. 1981, 153, 1075–1085. [Google Scholar] [CrossRef]
  9. Ruggiero, J.; Urbani, R.; Cesàro, A. Conformational Features of Galacturonans. I. Structure and Energy Minimization of Charged and Uncharged Galacturonan Dimeric Units. Int. J. Biol. Macromol. 1995, 17, 205–212. [Google Scholar] [CrossRef]
  10. Ruggiero, J.; Urbani, R.; Cesàro, A. Conformational Features of Galacturonans. II. Configurational Statistics of Pectic Polymers. Int. J. Biol. Macromol. 1995, 17, 213–218. [Google Scholar] [CrossRef]
  11. Cros, S.; du Penhoat, C.H.; Bouchemal, N.; Ohassan, H.; Imberty, A.; Pérez, S. Solution Conformation of a Pectin Fragment Disaccharide Using Molecular Modelling and Nuclear Magnetic Resonance. Int. J. Biol. Macromol. 1992, 14, 313–320. [Google Scholar] [CrossRef]
  12. Di Nola, A.; Fabrizi, G.; Lamba, D.; Segre, A.L. Solution Conformation of a Pectic Acid Fragment by 1H-Nmr and Molecular Dynamics. Biopolymers 1994, 34, 457–462. [Google Scholar] [CrossRef]
  13. Scheraga, H.A.; Némethy, G.; Steinberg, I.Z. The Contribution of Hydrophobic Bonds to the Thermal Stability of Protein Conformations. J. Biol. Chem. 1962, 237, 2506–2508. [Google Scholar] [CrossRef]
  14. Smith, L.J.; Fiebig, K.M.; Schwalbe, H.; Dobson, C.M. The Concept of a Random Coil: Residual Structure in Peptides and Denatured Proteins. Fold. Des. 1996, 1, R95–R106. [Google Scholar] [CrossRef]
  15. Inman, R.B.; Baldwin, R.L. Helix-Random Coil Transitions in DNA Homopolymer Pairs. J. Mol. Biol. 1964, 8, 452–469. [Google Scholar] [CrossRef]
  16. Fresco, J.R.; Doty, P. Polynucleotides. I. Molecular Properties and Configurations of Polyriboadenylic Acid in Solution1. J. Am. Chem. Soc. 1957, 79, 3928–3929. [Google Scholar] [CrossRef]
  17. Myer, Y.P. The PH-Induced Helix-Coil Transition of Poly-L-Lysine and Poly-L-Glutamic Acid and the 238-Mμ Dichroic Band. Macromolecules 1969, 2, 624–628. [Google Scholar] [CrossRef]
  18. Jordan, R.C.; Brant, D.A.; Cesàro, A. A Monte Carlo Study of the Amylosic Chain Conformation. Biopolymers 1978, 17, 2617–2632. [Google Scholar] [CrossRef]
  19. Gagnaire, D.; Pérez, S.; Tran, V. Configurational Statistics of Single Chains of α-Linked Glucans. Carbohydr. Polym. 1982, 2, 171–191. [Google Scholar] [CrossRef]
  20. Arnott, S.; Fulmer, A.; Scott, W.E.; Dea, I.C.M.; Moorhouse, R.; Rees, D.A. The Agarose Double Helix and Its Function in Agarose Gel Structure. J. Mol. Biol. 1974, 90, 269–284. [Google Scholar] [CrossRef]
  21. Foord, S.A.; Atkins, E.D.Y. New X-ray Diffraction Results from Agarose: Extended Single Helix Structures and Implications for Gelation Mechanism. Biopolymers 1989, 28, 1345–1365. [Google Scholar] [CrossRef]
  22. Guenet, J.-M.; Brûlet, A.; Rochas, C. Agarose Chain Conformation in the Sol State by Neutron Scattering. Int. J. Biol. Macromol. 1993, 15, 131–132. [Google Scholar] [CrossRef]
  23. Guenet, J.-M.; Rochas, C. Agarose Sols and Gels Revisited. Macromol. Symp. 2006, 242, 65–70. [Google Scholar] [CrossRef]
  24. Guenet, J.-M. Factors Influencing Gelation versus Crystallization in Cooling Polymer Solutions. Trends Polym. Sci. 1996, 4, 6–11. [Google Scholar]
  25. Donati, I.; Benegas, J.; Paoletti, S. On the Molecular Mechanism of the Calcium-Induced Gelation of Pectate. Different Steps in the Binding of Calcium Ions by Pectate. Biomacromolecules 2021, 22, 5000–5019. [Google Scholar] [CrossRef]
  26. Cros, S.; Garnier, C.; Axelos, M.A.V.; Imberty, A.; Pérez, S. Solution Conformations of Pectin Polysaccharides: Determination of Chain Characteristics by Small Angle Neutron Scattering, Viscometry, and Molecular Modeling. Biopolymers 1996, 39, 339–351. [Google Scholar] [CrossRef]
  27. Pérez, S.; Mazeau, K.; Hervé du Penhoat, C. The Three-Dimensional Structures of the Pectic Polysaccharides. Plant Physiol. Biochem. 2000, 38, 37–55. [Google Scholar] [CrossRef]
  28. Thibault, J.F.; Rinaudo, M. Interactions of Counteroins with Pectins Studied by Potentiometry and Circular Dichroism. In Chemistry and Function of Pectins; ACS Symposium Series; American Chemical Society: Washington, DC, USA, 1986; Volume 310, pp. 6–61. ISBN 9780841209749. [Google Scholar]
  29. Cesàro, A.; Ciana, A.; Delben, F.; Manzini, G.; Paoletti, S. Physicochemical Properties of Pectic Acid. I. Thermodynamic Evidence of a PH-Induced Conformational Transition in Aqueous Solution. Biopolymers 1982, 21, 431–449. [Google Scholar] [CrossRef]
  30. Paoletti, S.; Cesaro, A.; Delben, F.; Ciana, A. Ionic Effects on the Conformation, Equilibrium, Properties, and Rheology of Pectate in Aqueous Solutions and Gels. In Chemistry and Function of Pectins; ACS Symposium Series; American Chemical Society: Washington, DC, USA, 1986; Volume 310, pp. 7–73. ISBN 9780841209749. [Google Scholar]
  31. Guidugli, S.; Villegas, M.; Benegas, J.; Donati, I.; Paoletti, S. Solvation and Expansion of Neutral and Charged Chains of a Carbohydrate Polyelectrolyte: Galacturonan in Water. A Critical Revisiting. Biophys. Chem. 2023, 295, 106960. [Google Scholar] [CrossRef]
  32. Gilsenan, P.M.; Richardson, R.K.; Morris, E.R. Thermally Reversible Acid-Induced Gelation of Low-Methoxy Pectin. Carbohydr. Polym. 2000, 41, 339–349. [Google Scholar] [CrossRef]
  33. Huynh, U.T.D.; Lerbret, A.; Neiers, F.; Chambin, O.; Assifaoui, A. Binding of Divalent Cations to Polygalacturonate: A Mechanism Driven by the Hydration Water. J. Phys. Chem. B 2016, 120, 1021–1032. [Google Scholar] [CrossRef]
  34. Assifaoui, A.; Lerbret, A.; Uyen, H.T.D.; Neiers, F.; Chambin, O.; Loupiac, C.; Cousin, F. Structural Behaviour Differences in Low Methoxy Pectin Solutions in the Presence of Divalent Cations (Ca2+ and Zn2+): A Process Driven by the Binding Mechanism of the Cation with the Galacturonate Unit. Soft Matter 2015, 11, 551–560. [Google Scholar] [CrossRef]
  35. Ventura, I.; Jammal, J.; Bianco-Peled, H. Insights into the Nanostructure of Low-Methoxyl Pectin–Calcium Gels. Carbohydr. Polym. 2013, 97, 650–658. [Google Scholar] [CrossRef]
  36. Catoire, L.; Derouet, C.; Redon, A.-M.; Goldberg, R.; Hervédu Penhoat, C. An NMR Study of the Dynamic Single-Stranded Conformation of Sodium Pectate. Carbohydr. Res. 1997, 300, 19–29. [Google Scholar] [CrossRef]
  37. Thibault, J.F.; Rinaudo, M. Interactions of Mono- and Divalent Counterions with Alkali- and Enzyme-Deesterified Pectins in Salt-Free Solutions. Biopolymers 1985, 24, 2131–2143. [Google Scholar] [CrossRef]
  38. Sawayama, S.; Kawabata, A.; Nakahara, H.; Kamata, T. A Light Scattering Study on the Effects of PH on Pectin Aggregation in Aqueous Solution. Food Hydrocoll. 1988, 2, 31–37. [Google Scholar] [CrossRef]
  39. Alagna, L.; Prosperi, T.; Tomlinson, A.A.G.; Rizzo, R. Extended X-ray Absorption Fine Structure Investigation of Solid and Gel Forms of Calcium Poly(+.Alpha.-D-Galacturonate). J. Phys. Chem. 1986, 90, 6853–6857. [Google Scholar] [CrossRef]
  40. Schmidt, I.; Cousin, F.; Huchon, C.; Boué, F.; Axelos, M.A. V Spatial Structure and Composition of Polysaccharide−Protein Complexes from Small Angle Neutron Scattering. Biomacromolecules 2009, 10, 1346–1357. [Google Scholar] [CrossRef]
  41. Braccini, I.; Grasso, R.P.; Pérez, S. Conformational and Configurational Features of Acidic Polysaccharides and Their Interactions with Calcium Ions: A Molecular Modeling Investigation. Carbohydr. Res. 1999, 317, 119–130. [Google Scholar] [CrossRef]
  42. Ström, A.; Schuster, E.; Goh, S.M. Rheological Characterization of Acid Pectin Samples in the Absence and Presence of Monovalent Ions. Carbohydr. Polym. 2014, 113, 336–343. [Google Scholar] [CrossRef]
  43. Yoo, S.-H.; Lee, B.-H.; Savary, B.J.; Lee, S.; Lee, H.G.; Hotchkiss, A.T. Characteristics of Enzymatically-Deesterified Pectin Gels Produced in the Presence of Monovalent Ionic Salts. Food Hydrocoll. 2009, 23, 1926–1929. [Google Scholar] [CrossRef]
  44. Yoo, S.-H.; Fishman, M.L.; Savary, B.J.; Hotchkiss, A.T. Monovalent Salt-Induced Gelation of Enzymatically Deesterified Pectin. J. Agric. Food Chem. 2003, 51, 7410–7417. [Google Scholar] [CrossRef]
  45. Voet, A. Quantative Lyotropy. Chem. Rev. 1937, 20, 169–179. [Google Scholar] [CrossRef]
  46. Kunz, W.; Henle, J.; Ninham, B.W. ‘Zur Lehre von Der Wirkung Der Salze’ (about the Science of the Effect of Salts): Franz Hofmeister’s Historical Papers. Curr. Opin. Colloid Interface Sci. 2004, 9, 19–37. [Google Scholar] [CrossRef]
  47. Grasdalen, H.; Smidsroed, O. Iodide-Specific Formation of.Kappa.-Carrageenan Single Helixes. Iodine-127 NMR Spectroscopic Evidence for Selective Site Binding of Iodide Anions in the Ordered Conformation. Macromolecules 1981, 14, 1842–1845. [Google Scholar] [CrossRef]
  48. Norton, I.T.; Morris, E.R.; Rees, D.A. Lyotropic Effects of Simple Anions on the Conformation and Interactions of Kappa-Carrageenan. Carbohydr. Res. 1984, 134, 89–101. [Google Scholar] [CrossRef]
  49. Stanley, C.B.; Strey, H.H. Osmotically Induced Helix-Coil Transition in Poly(Glutamic Acid). Biophys. J. 2008, 94, 4427–4434. [Google Scholar] [CrossRef]
  50. Olsen, C.M.; Shikiya, R.; Ganugula, R.; Reiling-Steffensmeier, C.; Khutsishvili, I.; Johnson, S.E.; Marky, L.A. Application of Differential Scanning Calorimetry to Measure the Differential Binding of Ions, Water and Protons in the Unfolding of DNA Molecules. Biochim. Biophys. Acta-Gen. Subj. 2016, 1860, 990–998. [Google Scholar] [CrossRef]
  51. Satoh, M.; Komiyama, J.; Iijima, T. Viscometric Study of Poly(α-L-Glutamic Acid) in NaCl Solution. Colloid Polym. Sci. 1980, 258, 136–141. [Google Scholar] [CrossRef]
  52. Noda, I.; Tsuge, T.; Nagasawa, M. The Intrinsic Viscosity of Polyelectrolytes. J. Phys. Chem. 1970, 74, 710–719. [Google Scholar] [CrossRef]
  53. Leyte, J.C.; Mandel, M. Potentiometric Behavior of Polymethacrylic Acid. J. Polym. Sci. Part A Gen. Pap. 1964, 2, 1879–1891. [Google Scholar] [CrossRef]
  54. Nagasawa, M.; Holtzer, A. The Helix-Coil Transition in Solutions of Polyglutamic Acid. J. Am. Chem. Soc. 1964, 86, 538–543. [Google Scholar] [CrossRef]
  55. Pan, A.; Biswas, T.; Rakshit, A.K.; Moulik, S.P. Enthalpy–Entropy Compensation (EEC) Effect: A Revisit. J. Phys. Chem. B 2015, 119, 15876–15884. [Google Scholar] [CrossRef] [PubMed]
  56. Crescenzi, V.; Quadrifoglio, F.; Delben, F. Calorimetric Investigation of Poly(Methacrylic Acid) and Poly(Acrylic Acid) in Aqueous Solution. J. Polym. Sci. Part A-2 Polym. Phys. 1972, 10, 357–368. [Google Scholar] [CrossRef]
  57. Delben, F.; Cesaro, À.; Paoletti, S.; Crescenzi, V. Monomer Composition and Acetyl Content as Main Determinants of the Ionization Behavior of Alginates. Carbohydr. Res. 1982, 100, C46–C50. [Google Scholar] [CrossRef]
  58. Crescenzi, V.; Quadrifoglio, F.; Delben, F. Calorimetric Studies of Polycarboxylic Acids in Aqueous Solution. II. Maleic Acid–Butyl Vinyl Ether Copolymer. J. Polym. Sci. Part C Polym. Symp. 1972, 39, 241–246. [Google Scholar] [CrossRef]
  59. Abe, A.; Furuya, H. Conformational Characteristics of Polypeptide Chains with Special Focus on the α-Helix-Sense Inversion. In Modern Applications of Flory’s “Statistical Mechanics of Chain Molecules”; ACS Symposium Series; American Chemical Society: Washington, DC, USA, 2020; Volume 1356, pp. 5–63. ISBN 9780841298866. [Google Scholar]
  60. Watanabe, J.; Okamoto, S.; Satoh, K.; Sakajiri, K.; Furuya, H.; Abe, A. Reversible Helix−Helix Transition of Poly(β-Phenylpropyl l-Aspartate) Involving a Screw-Sense Inversion in the Solid State. Macromolecules 1996, 29, 7084–7088. [Google Scholar] [CrossRef]
  61. Sakajiri, K.; Satoh, K.; Yoshioka, K.; Kawauchi, S.; Watanabe, J. A Study on the Isothermal Kinetics of Helix–Helix Transformation Poly(β-Phenylpropyl l-Aspartate) Solid by DSC Analysis. J. Mol. Struct. 1999, 477, 175–179. [Google Scholar] [CrossRef]
  62. Braccini, I.; Pérez, S. Molecular Basis of Ca2+-Induced Gelation in Alginates and Pectins: The Egg-Box Model Revisited. Biomacromolecules 2001, 2, 1089–1096. [Google Scholar] [CrossRef]
  63. Perić, L.; Pereira, C.S.; Pérez, S.; Hünenberger, P.H. Conformation, Dynamics and Ion-Binding Properties of Single-Chain Polyuronates: A Molecular Dynamics Study. Mol. Simul. 2008, 34, 421–446. [Google Scholar] [CrossRef]
  64. Gouvion, C.; Mazeau, K.; Heyraud, A.; Taravel, F.R.; Tvaroska, I. Conformational Study of Digalacturonic Acid and Sodium Digalacturonate in Solution. Carbohydr. Res. 1994, 261, 187–202. [Google Scholar] [CrossRef]
  65. Lewis, G.; Johnson, A.F. Interpretation of the Heat of Dilution of Polymer Solutions. Polymer 1970, 11, 336–338. [Google Scholar] [CrossRef]
  66. Paoletti, S.; Delben, F.; Crescenzi, V. Enthalpies of Dilution of Partially Neutralized Maleic Acid Copolymers in Water. Correlation of Experiments with Theories. J. Phys. Chem. 1981, 85, 1413–1418. [Google Scholar] [CrossRef]
  67. Krasna, A.I. Changes in the Light-Scattering Properties of DNA on Denaturation. J. Colloid Interface Sci. 1972, 39, 632–646. [Google Scholar] [CrossRef]
  68. Colvill, A.J.E.; Jordan, D.O. The Influence of Ionic Strength on the Reversibility of the Denaturation of DNA in Dilute Solution. J. Mol. Biol. 1963, 7, 700–709. [Google Scholar] [CrossRef] [PubMed]
  69. Manunza, B.; Deiana, S.; Pintore, M.; Gessa, C. Molecular Dynamics Study of Polygalacturonic Acid Chains in Aqueous Solution. Carbohydr. Res. 1997, 300, 85–88. [Google Scholar] [CrossRef]
  70. Noto, R.; Martorana, V.; Bulone, D.; San Biagio, P.L. Role of Charges and Solvent on the Conformational Properties of Poly(Galacturonic Acid) Chains:  A Molecular Dynamics Study. Biomacromolecules 2005, 6, 2555–2562. [Google Scholar] [CrossRef]
  71. Guidugli, S.; Villegas, M.; Esteban, C.; Fernández Gauna, C.; Pantano, S.; Paoletti, S.; Benegas, J. Flexibilidad de Cadenas Neutras y Cargadas de Ácido Poligalacturonico En Distintos Solventes. An. AFA 2009, 21, 238–242. [Google Scholar]
  72. Wendler, K.; Thar, J.; Zahn, S.; Kirchner, B. Estimating the Hydrogen Bond Energy. J. Phys. Chem. A 2010, 114, 9529–9536. [Google Scholar] [CrossRef]
  73. Fenyo, J.C.; Delben, F.; Paoletti, S.; Crescenzi, V. Thermodynamics of Polycarboxylate Aqueous Solutions. 4. Special Features of Hydrophobic Maleic Acid Olefin Copolymers. J. Phys. Chem. 1977, 81, 1900–1905. [Google Scholar] [CrossRef]
  74. Capel, F.; Nicolai, T.; Durand, D.; Boulenguer, P.; Langendorff, V. Calcium and Acid Induced Gelation of (Amidated) Low Methoxyl Pectin. Food Hydrocoll. 2006, 20, 901–907. [Google Scholar] [CrossRef]
  75. Paoletti, S.; Cesàro, A.; Delben, F.; Crescenzi, V.; Rizzo, R. Polyelectrolytic Aspects of Conformational Transitions and Interchain Interactions in Ionic Polysaccharide Solutions: Comparison of Theory and Microcalorimetric Data. In Microdomains in Polymer Solutions; Dubin, P., Ed.; Springer: Boston, MA, MA, 1985; pp. 159–189. ISBN 978-1-4613-2123-1. [Google Scholar]
  76. Donati, I.; Cesàro, A.; Paoletti, S. Specific Interactions versus Counterion Condensation. 1. Nongelling Ions/Polyuronate Systems. Biomacromolecules 2006, 7, 281–287. [Google Scholar] [CrossRef]
  77. Eklund, L.; Hofer, T.S.; Persson, I. Structure and Water Exchange Dynamics of Hydrated Oxo Halo Ions in Aqueous Solution Using QMCF MD Simulation, Large Angle X-ray Scattering and EXAFS. Dalt. Trans. 2015, 44, 1816–1828. [Google Scholar] [CrossRef]
  78. Walrafen, G.E. Raman Spectral Studies of the Effects of Perchlorate Ion on Water Structure. J. Chem. Phys. 2003, 52, 4176–4198. [Google Scholar] [CrossRef]
  79. Mazzini, V.; Craig, V.S.J. What Is the Fundamental Ion-Specific Series for Anions and Cations? Ion Specificity in Standard Partial Molar Volumes of Electrolytes and Electrostriction in Water and Non-Aqueous Solvents. Chem. Sci. 2017, 8, 7052–7065. [Google Scholar] [CrossRef] [PubMed]
  80. Lo Nostro, P.; Ninham, B.W. Hofmeister Phenomena: An Update on Ion Specificity in Biology. Chem. Rev. 2012, 112, 2286–2322. [Google Scholar] [CrossRef]
  81. Asciutto, E.K.; General, I.J.; Xiong, K.; Asher, S.A.; Madura, J.D. Sodium Perchlorate Effects on the Helical Stability of a Mainly Alanine Peptide. Biophys. J. 2010, 98, 186–196. [Google Scholar] [CrossRef]
  82. Crevenna, A.H.; Naredi-Rainer, N.; Lamb, D.C.; Wedlich-Söldner, R.; Dzubiella, J. Effects of Hofmeister Ions on the α-Helical Structure of Proteins. Biophys. J. 2012, 102, 907–915. [Google Scholar] [CrossRef] [PubMed]
  83. Qiu, M.; Hu, C.; Mei, A.; Lou, X. The Influence of the Coexisting Anions on the Adsorption of Perchlorate from Water by the Modified Orange Peels. Nat. Environ. Pollut. Technol. 2016, 15, 1359–1362. [Google Scholar]
  84. Clarke-Sturman, A.J.; Pedley, J.B.; Sturla, P.L. Influence of Anions on the Properties of Microbial Polysaccharides in Solution. Int. J. Biol. Macromol. 1986, 8, 355–360. [Google Scholar] [CrossRef]
  85. Mráček, A.; Varhaníková, J.; Lehocký, M.; Gřundělová, L.; Pokopcová, A.; Velebný, V. The Influence of Hofmeister Series Ions on Hyaluronan Swelling and Viscosity. Molecules 2008, 13, 1025–1034. [Google Scholar] [CrossRef]
  86. Tatini, D.; Sarri, F.; Maltoni, P.; Ambrosi, M.; Carretti, E.; Ninham, B.W.; Lo Nostro, P. Specific Ion Effects in Polysaccharide Dispersions. Carbohydr. Polym. 2017, 173, 344–352. [Google Scholar] [CrossRef]
  87. Fishman, M.L.; Chau, H.K.; Kolpak, F.; Brady, J. Solvent Effects on the Molecular Properties of Pectins. J. Agric. Food Chem. 2001, 49, 4494–4501. [Google Scholar] [CrossRef] [PubMed]
  88. Chen, R.; Ratcliffe, I.; Williams, P.A.; Luo, S.; Chen, J.; Liu, C. The Influence of PH and Monovalent Ions on the Gelation of Pectin from the Fruit Seeds of the Creeping Fig Plant. Food Hydrocoll. 2021, 111, 106219. [Google Scholar] [CrossRef]
  89. Benegas, J.C.; Cesàro, A.; Rizzo, R.; Paoletti, S. Conformational Stability of Biological Polyelectrolytes: Evaluation of Enthalpy and Entropy Changes of Conformational Transitions. Biopolymers 1998, 45, 203–216. [Google Scholar] [CrossRef]
  90. Engel, J.; Schwarz, G. Cooperative Conformational Transitions of Linear Biopolymers. Angew. Chem. Int. Ed. Engl. 1970, 9, 389–400. [Google Scholar] [CrossRef] [PubMed]
  91. Poland, D.; Scheraga, H.A. Theory of Helix-Coil Transitions in Biopolymers. In Statistical Mechanical Theory of Order-Disorder Transitions in Biological Macromolecules; Academic Press: Cambridge, MA, USA, 1970. [Google Scholar]
  92. Zimm, B.H.; Doty, P.; Iso, K. Determination of the Parameters for Helix Formation in Poly-γ-Benzyl-L-Glutamate. Proc. Natl. Acad. Sci. USA 1959, 45, 1601–1607. [Google Scholar] [CrossRef] [PubMed]
  93. Kidera, A.; Nakajima, A. Light Scattering from Poly(L-Glutamic Acid) in Aqueous Solution in the Helix-Coil Transition Region. Macromolecules 1984, 17, 659–663. [Google Scholar] [CrossRef]
  94. Smidsrød, O.; Haug, A. Estimation of the Relative Stiffness of the Molecular Chain in Polyelectrolytes from Measurements of Viscosity at Different Ionic Strengths. Biopolymers 1971, 10, 1213–1227. [Google Scholar] [CrossRef]
  95. Manning, G.S. The Persistence Length of DNA Is Reached from the Persistence Length of Its Null Isomer through an Internal Electrostatic Stretching Force. Biophys. J. 2006, 91, 3607–3616. [Google Scholar] [CrossRef]
  96. Malovikova, A.; Milas, M.; Rinaudo, M.; Borsali, R. Viscometric Behavior of Sodium Polygalacturonate in the Presence of Low Salt Content. In Macro-Ion Characterization; ACS Symposium Series; American Chemical Society: Washingtong, DC, USA, 1993; Volume 548, pp. 24–315. ISBN 9780841227705. [Google Scholar]
  97. Powell, D.A.; Morris, E.R.; Gidley, M.J.; Rees, D.A. Conformations and Interactions of Pectins: II. Influence of Residue Sequence on Chain Association in Calcium Pectate Gels. J. Mol. Biol. 1982, 155, 517–531. [Google Scholar] [CrossRef]
  98. Grasdalen, H.; Kvam, B.J. Sodium-23 NMR in Aqueous Solutions of Sodium Polyuronates. Counterion Binding and Conformational Conditions. Macromolecules 1986, 19, 1913–1920. [Google Scholar] [CrossRef]
  99. Minin, K.A.; Zhmurov, A.; Marx, K.A.; Purohit, P.K.; Barsegov, V. Dynamic Transition from α-Helices to β-Sheets in Polypeptide Coiled-Coil Motifs. J. Am. Chem. Soc. 2017, 139, 16168–16177. [Google Scholar] [CrossRef] [PubMed]
  100. Qi, R.; Luo, Y.; Ma, B.; Nussinov, R.; Wei, G. Conformational Distribution and α-Helix to β-Sheet Transition of Human Amylin Fragment Dimer. Biomacromolecules 2014, 15, 122–131. [Google Scholar] [CrossRef] [PubMed]
  101. Donati, I.; Asaro, F.; Paoletti, S. Experimental Evidence of Counterion Affinity in Alginates: The Case of Nongelling Ion Mg2+. J. Phys. Chem. B 2009, 113, 12877–12886. [Google Scholar] [CrossRef] [PubMed]
  102. Manning, G.S. Limiting Laws and Counterion Condensation in Polyelectrolyte Solutions: IV. The Approach to the Limit and the Extraordinary Stability of the Charge Fraction. Biophys. Chem. 1977, 7, 95–102. [Google Scholar] [CrossRef] [PubMed]
  103. Manning, G.S. Limiting Laws and Counterion Condensation in Polyelectrolyte Solutions: V. Further Development of the Chemical Model. Biophys. Chem. 1978, 9, 65–70. [Google Scholar] [CrossRef]
  104. Vanderzee, C.E.; Swanson, J.A. Heats of Dilution and Relative Apparent Molal Enthalpies of Aqueous Sodium Perchlorate and Perchloric Acid. J. Phys. Chem. 1963, 67, 285–291. [Google Scholar] [CrossRef]
  105. Messikomer, E.E.; Wood, R.H. The Enthalpy of Dilution of Aqueous Sodium Chloride at 298.15 to 373.15 K, Measured with a Flow Calorimeter. J. Chem. Thermodyn. 1975, 7, 119–130. [Google Scholar] [CrossRef]
  106. Andreeva, D.; Hartmann, H.; Taneva, S.G.; Krastev, R. Regulation of the growth, morphology, mechanical properties and biocompatibility of natural polysaccharide-based multilayers by Hofmeister anions. J. Mater. Chem. B 2016, 4, 7092–7100. [Google Scholar] [CrossRef]
  107. Sangeetha, P.; Selvakumari, T.M.; Selvasekarapandian, S. Preparation of primary magnesium battery based on kappa-carrageenan with magnesium perchlorate and its application to electrochemical devices. Polym. Bull. 2023. [Google Scholar] [CrossRef]
  108. Seale, R.; Morris, E.R.; Rees, D.A. Interactions of alginates with univalent cations. Carbohydr. Res. 1982, 110, 101–112. [Google Scholar] [CrossRef]
  109. Rochas, C.; Rinaudo, M. Activity Coefficients of Counterions and Conformation in kappa-Carrageenan Systems. Biopolymers 1980, 19, 1675–1687. [Google Scholar] [CrossRef]
  110. Zhang, W.; Piculell, L.; Nilsson, S. Salt Dependence and Ion Specificity of the Coil-Helix Transition of Furcellaran. Biopolymers 1991, 31, 1727–1736. [Google Scholar] [CrossRef]
  111. Zhang, W.; Piculell, L.; Nilsson, S. Effects of Specific Anion Binding on the Helix-Coil Transition of Lower Charged Carrageenans. NMR Data and Conformational Equilibria Analyzed within the Poisson-Boltzmann Cell Model. Macromolecules 1992, 25, 6165–6172. [Google Scholar] [CrossRef]
  112. Yin, W.; Zhang, H.; Huang, L.; Nishinari, K. Effects of the lyotropic series salts on the gelation of konjac glucomannan in aqueous solutions. Carbohydr. Polym. 2008, 74, 68–78. [Google Scholar] [CrossRef]
  113. Singh, T.; Meena, R.; Kumar, A. Effect of sodium sulfate on the gelling behavior of agarose and water structure inside the gel networks. J. Phys. Chem. B 2009, 113, 2519–2525. [Google Scholar] [CrossRef] [PubMed]
Scheme 1. Schematic representation of the coupling of the “tightness”/“looseness” (or order/disorder) effect—vertical axis—with the conformational equilibrium (between one element of the set of the 31 conformations and one element of the set of the 21 conformations)—horizontal axis. Top view along the helix axis of the two conformations taken from [41], with permission, and adapted.
Polysaccharides 04 00018 sch001
Figure 1. (a) Dependence of the reduced specific viscosity, ηred, on the degree of dissociation, α, for pectic acid in water (blue symbols) and in aqueous NaClO4 0.05 M (red symbols); (b) dependence of the apparent pKa, (pKa)app., on α for pectic acid in water (blue symbols) and in aqueous NaClO4 0.05 M (red symbols); the dotted line connecting the data points in the initial and in the final range has been used for the calculation of the (pKa)excess values reported in the following Figure 20a. α1, α2, and α3 correspond to the values of α of (initial) self-dissociation of the polyacid and of the start and end of the conformational transition, respectively. Roman numerals identify the three regions defined in the text.
Polysaccharides 04 00018 g001
Figure 2. (a) Dependence on α of the molar enthalpy change in dissociation, Δ H ¯ diss , of pectic acid in aqueous NaClO4 0.05 M (black symbols), and of the (integral) curve of Δ H ¯ tr excess (red symbols, scale on the right); (b) Dependence on α of the molar entropy change in dissociation, Δ S ¯ diss , of pectic acid in aqueous NaClO4 0.05 M (black symbols), and of the (integral) curve of Δ S ¯ tr excess (red symbols, scale on the right).
Polysaccharides 04 00018 g002
Scheme 2. (a). Schematic representation of the enthalpy (internal energy) profile of the two wells of the conformational energy minimum of galacturonan. Narrow horizontal segments represent the range of states visited in each helical conformation, with the corresponding entropy difference; (b) schematic representation of the enthalpy (internal energy) profile of the “tightened” (red) and the “loosened” (purple) forms of the 21 helix, with the wider range of accessible states (for both cases indicated by the arrows) and the ensuing variations of both enthalpy and entropy.
Polysaccharides 04 00018 sch002
Figure 3. (a) Dependence on α of the molar enthalpy change in dissociation, Δ H ¯ diss , of pectic acid in salt-free aqueous solution (black symbols), and of the (integral) curve of Δ H ¯ t r e x c e s s (red symbols, scale on the right); (b) Dependence on α of the molar entropy change in dissociation, Δ S ¯ diss , of pectic acid in salt-free aqueous solution (black symbols), and of the (integral) curve of Δ S ¯ t r e x c e s s (red symbols, scale on the right).
Polysaccharides 04 00018 g003
Figure 4. (a) Dependence on α of the enthalpy of dilution of pectic acid (concentration halving; initial value of Cp: 1.94·10−2 mole r.u.⋅L−1) (black symbols, l.h.s.) and of the enthalpy of dissociation, (red symbols, data from Figure 3a, at 25 °C in water; inset, dependence on α, in the interval from α = α3 to α = 1.0, of the enthalpy of dilution (red symbols; data from main panel) and of molar ellipticity (blue symbols; data from the following Figure 6b) of pectic acid at 25 °C in water; (b) dependence on the negative logarithm of the polymer concentration of the enthalpy of dilution from the initial concentration, (Cp)i, of pectic acid in water at 25 °C: blue symbols: α = 0.34, (Cp)i = 2.04·10−2 mole r.u.⋅L−1; red symbols: α = 0.96, (Cp)i = 3.42·10−2 mole r.u.⋅L−1. The broken lines represent the corresponding theoretical curves calculated according to the CC theory of polyelectrolytes.
Polysaccharides 04 00018 g004
Figure 5. Excess enthalpy of dilution of Na+ pectate in water at 25 °C. Data from Figure 4b. (a) Data fit with the general hyperbola equation: y = a b 1 + c · x 1 d ; (b) data fit with the Hill equation: y = A + B A · x n k n + x n , with x = 1 C p . The numerical values of the parameters are given in the footnote to Table 3. In both cases, Δ H ¯ 2 1 C p     2 1 C p 0   = Δ H ¯ l o o s e n . e x c e s s α = 1 , C p α = 1 , C p 0 = Δ H ¯ e x c e s s dil . , C p 0   Δ H ¯ e x c e s s dil . , C p   .
Polysaccharides 04 00018 g005
Figure 7. (a) Dependence of the chiro-optical properties of poly(galacturonic acid) in water at 25 °C on α (purple symbols): molar ellipticity at λ = 215 nm (open circles, blue inner scale on r.h.s.) [29]; molar optical activity at λ = 365 nm (crossed-lozenges, purple outer scale on r.h.s.) [29]; ellipticity(arbitrary units) at λ = 208 nm (half-filled circles, red scale on l.h.s. and α as abscissa); ellipticity (arbitrary units) at λ = 208 nm (half-filled circles with magenta small full circle in the core, red scale on l.h.s. and α’ as abscissa) [7]; I, II, III are the three regions defined in Section 2.1; (b) dependence on pH of the optical activity in salt-free aqueous solution: full symbols and connecting curves of different colors at the indicated temperatures for LMP at polymer concentration 0.4 wt% and λ = 436 nm [32]; red open lozenges and dash-dotted connecting curve for poly(galacturonic acid) at 25 °C, polymer concentration 0.47% and λ = 365 nm [29].
Polysaccharides 04 00018 g007
Figure 8. (a) Dependence on α of the molar ellipticity at λ = 215 nm of pectic acid in water at 25 °C. The blue dash-dotted curve and the red one are the parabolic and the hyperbolic best-fit curves calculated for the data in region I and in region III, respectively; the purple dash-dotted curves has been drawn to guide the eye. The short-dotted lines represent the tangents to the dash-dotted curves at the beginning of their respective range; the black short-dashed rectangle is the blow-up area reported in Figure 9b; (b) dependence on α of the difference, δ[ϑ]215, between the best-fit curves of the molar ellipticity data at λ = 215 nm (dash-dotted) and the corresponding tangent curves in panel (a): red curve, 21 helix, blue curve 31 helix. Inset: “A typical snapshot taken from the MD simulation of a galacturonic acid dimer in explicit water solvent showing the relevant direct [r.h.s.] and water-mediated [l.h.s.] intramolecular H-bonds” [31]; it is figure 1 of reference [31], reproduced with permission.
Polysaccharides 04 00018 g008
Figure 9. (a) Blow-up of the black short-dashed rectangle of Figure 8a (see for details). The two opposite effects of the increase in charge density on the conformation of the 31 helix have been indicated with A and B; (b) dependence on α of the mole fractions of 31 (blue full circles) and 21 (red full circles) helical conformations calculated from the experimental data of panel (a); magenta open circles; f l o o s e n . , fraction of repeating units of galacturonan in the “loose” conformation, calculated from calorimetric data (see the discussion in Section 5.1).
Polysaccharides 04 00018 g009
Scheme 3. Schematic representation of the hypothetical exothermic contribution to the Δ H ¯ d i s s curve of pectic acid in water from the tightening of the 31 helical conformation; it masks an endothermic fraction of equal value. This enthalpic process is paralleled by an increase in order, as shown by the parallel increase in [ϑ]215 (red symbols; from Figure 6b). The “missing” endothermic fraction of Δ H ¯ d i s s is sketched as a skewed parabolic segment (light blue); the range of development of the two experimental properties accompanying chain tightening is indicated by the two dotted light blue rectangles. The inset on the r.h.s. sketches the effect of an increase in α on the conformational energy map of galacturonan; the increase in H-boding (ΔE < 0, A) would progressively narrow the accessible area of the map (horizontal blue dotted segments) whereas the electrostatic loosening (ΔE > 0, B) would counteract by widening it. The overall result is a net decrease in accessible states which, however, increasingly loses momentum.
Polysaccharides 04 00018 sch003
Figure 10. Dependence on pH of the thermal properties of LMP solutions (3 wt%) as determined by DSC experiments from 10 °C to 85 °C. Data replotted from [32]. (a) melting temperatures, T m ; (b) experimental Δ H ¯ e x p e r . DSC (blue open circles) and Δ S ¯ e x p e r . DSC , T m values; the latter calculated as Δ S ¯ e x p e r . DSC , T m pH = Δ H ¯ e x p e r . DSC pH T m pH (red full circles). The dashed rectangles identify two ranges of pH which in the T m vs. pH data trends are separated by an abrupt upraise: magenta, pH ≤ 2.0, black, pH ≥ 2.5.
Polysaccharides 04 00018 g010
Figure 11. (a) Dependence of Δ H ¯ e x p e r . DSC on Δ S ¯ e x p e r . DSC , T m for LMP at different pH values (data from Figure 11b). Blue open circles and dash-dotted line: data in the pH range from 2.5 to 4.0; magenta open circles and dash-dotted line: data at pH 1.65 and 2.0; the black dash-dotted line is the linear best-fit through all data points; (b) dependence on polymer concentration of the DSC calorimetric results replotted from figure 10a of reference [32], black symbols and r.h.s scale: full circles, experimental data points; dash-dotted curve, polynomial best fit of experimental data; dotted line, first derivative of the polynomial curve at [Pectin] = 0.0 (wt%) to highlight the polynomial trend. Red open circles and dash-dotted line: Δ H ¯ e x p e r . DSC values as a function of LMP concentration from the polynomial fitting of the black full circles data and transformation to the cal·mole r.u.−1 scale. Horizontal red dashed line: average value of Δ H ¯ e x p e r . DSC from figure 8b of [32]. Inset: reproduction of figure 10b of reference [32]: pectin concentration dependence of the temperature of maximum heat flow (Tmax) or the mid-point temperature (Tm), with permission.
Polysaccharides 04 00018 g011
Figure 12. Dependence on pH of (a) experimental enthalpy change in transition by DSC from [32] ,   Δ H e x p e r . DSC (black squares); calculated values—as described in Supplementary paragraph 3.4—of the enthalpy changes of separation, Δ H ¯ s e p a r . DSC (magenta open circles), of 31 → 21 transition, Δ H 3 1 2 1 DSC (red open circles) and of loosening, Δ H ¯ l o o s e n . DSC (purple open circles). The superscript “DSC” has been omitted in the figure for simplicity; (b) fraction of repeating units in the 31 conformation (open circles, l.h.s. scale) or in the 21 conformation (full lozenges, r.h.s. scale) at T = 10 °C (blue color) and at T = 85 °C (red color); fraction of repeating units (relative to the corresponding maximum value of enthalpy change) in the “associated” form (magenta open circles, l.h.s. scale) and in the “ordered” (tightened) conformation (purple open circles, r.h.s. scale); purple stars represent the fractions (relative to maximum) in the ordered conformation as calculated from the optical activity data of [32]. All curves have been drawn to help the eye only.
Polysaccharides 04 00018 g012
Figure 13. (a) Dependence on the degree of dissociation, α (full circles), or on the degree of neutralization, α’ (open circles), of the wavelength of maximum ellipticity, λmax, (blue symbols, l.h.s. scale) and of the ellipticity, Δε208, (red symbols, r.h.s. scale) of poly(galacturonic acid) in water at λ = 208 nm; data replotted from [7]; (b) dependence on pH (full circles, lower x scale) and on α (open circles, upper x scale) of the enthalpy changes of transition by DSC, Δ H ¯ e x p e r . DSC , (purple symbols, l.h.s. scale), data replotted from [32]; and dependence on the degree of dissociation, α (full circles), or on the degree of neutralization, α’ (open circles), of the ellipticity at λ = 208 nm of LMP in water (red symbols, r.h.s.); data replotted from [7].
Polysaccharides 04 00018 g013
Scheme 4. Dependence on pH of association, conformations and ordering of 3 wt% LMP in water at 10 °C. Vertical bars pertain to % of maximum association (grey) to % transformation to the 31 (blue) and to the 21 (yellow) conformations, respectively. Orange vertical bars pertain to % of maximum ordering resulting from the calorimetric evaluation (see Scheme 4 and the related discussion); the brown stars pertain to % of maximum ordering resulting from the analysis of the optical activity data of figure 11 of [32] (the value at pH = 2.5 has been obtained by linear interpolation of those data at pH = 2.0 and 3.0).
Polysaccharides 04 00018 sch004
Figure 14. Dependence on pH of the modulus of rigidity, G′, of 3.0 wt% LMP after 100 min at 5 °C (black full circles, data replotted from figure 3a of [32], l.h.s. scale), of the fraction of maximum association (purple open circles, data replotted from Scheme 4, r.h.s. scale) and of the logarithm of tan δ (tan δ = G′′/G′; red open circles and dash-dotted curve, outer l.h.s. scale). The magenta and black dotted rectangles correspond to the dotted rectangles in Figure 10. The transition range of the sigmoid is indicated with a light grey rectangle; the three regimes corresponding to the viscoelastic solution, to the weak gel and to the strong gel have been indicated with dashed rectangles: light blue, magenta and purple, respectively. Inset: reproduction of the data on the dependence of the logarithm of <M>w on pH of different LMPs and poly(galacturonic acid) from figure 3 of reference [38], with permission.
Polysaccharides 04 00018 g014
Figure 15. Dependence on pH of the negative value of the average slope of log η* vs. log ω (−slope) across the frequency range studied of 3.0 wt% LMP after 100 min at 5 °C (black open circles, data replotted from figure 3a of [32], l.h.s. scale), and of log tan δ (full grey circles: same data as in Figure 13, r.h.s. scale). The red dashed curve is the parabolic fitting (R2 = 0.9985) of all data points except that at pH = 1.6; the red open circle is the calculated intercept of the fitting parabola with the line at (−slope) = 1.0; the magenta dotted curve is the parabolic extrapolation to minimum of the (−slope) function and the magenta full circle is the calculated point at minimum. The blue dashed line is the linear best fit of the (−slope) data at pH = 1.6 and 2.0; the blue open circle is the calculated intercept of the fitting line with the line at (−slope) = 1.0. A purple arrow indicates the value of pH corresponding to the maximum tightening and expansion of the 31 helical conformation; a red dotted circle represents the close matching of the conditions of the lower pH limit of the conformational transition region, of maximum tightness of the 31 helix and of incipient (weak) gel formation: log tan δ = 0.
Polysaccharides 04 00018 g015
Scheme 5. Images of helices (modified after reproduction from [41], with permission) as viewed along the helical axis represent from left to right: two chains—in the (partially loose) 31 conformation—associated through hydrophobic interactions involving facing COOCH3 groups (as grey circles—pH 1.6 and 2.0); isolated (partially loose) helix in the 31 conformation (pH 2.5); isolated—tightened—helix in the 31 conformation (pH 3.0); conformational equilibrium 3 1 2 1 (pH > 3.0); isolated (partially loose) helix in the 21 conformation (pH > 4.0). For a detailed explanation, see text.
Polysaccharides 04 00018 sch005
Figure 16. Enthalpy changes upon mixing Na+ pectate with NaClO4 in aqueous solution at 25 °C. (a) Blue full circles: salt-free condition (“water”), the abscissa is Ri, the molar ratio of added NaClO4 over the polymer concentration (moles r.u.); (b) red full circles; concentration of supporting 1:1 electrolyte: [NaClO4] = 0.05 M, the abscissa is δRi, the molar ratio of added NaClO4 over the polymer concentration (moles r.u.). Magenta dashed curves in both panels: theoretical values of Δ H ¯ m i x for a polyelectrolyte with a linear charge density, ξ, equal to that of Na+ pectate at α = 1.0 (ξ = lB/b0 = 7.135/4.35 = 1.64, where lB is the Bjerrum length and b0 was defined in Section 1.1). Inset in panel (b): enthalpy change upon mixing Na+ mannuronate with NaClO4 in aqueous [NaClO4] = 0.05 M at 25 °C; purple lozenges, experimental data points, purple dashed curve, theoretical values of Δ H ¯ m i x for a polyelectrolyte with a linear charge density, ξ, equal to that of Na+ mannuronate at α = 1.0 (ξ = lB/b0 = 7.135/5.17 = 1.38) [76].
Polysaccharides 04 00018 g016
Figure 17. Dependence of the difference, Δ   H   ¯ m i x excess , between the experimental and the theoretical values of Δ H ¯ m i x , δRi and Δ H ¯ m i x theor , respectively, as a function of: (a) δRi, i.e., the incremental value of the NaClO4/pectate molar ratio Ri, for the “salt” case (red curve) and the “water” case (blue curve; in this case δRi coincides with Ri). The limit values of Δ H ¯ m i x excess at δRi → ∞ from Figure 15 have been indicated as a red full circle (“salt” case) and a blue full square (“water” case) with the corresponding probable errors. Numbers from (1) to (3) identify the corresponding regions of the two cases as defined in the text (red: “salt”, blue: “water”); (b) the (absolute) value of the molar concentration of NaClO4 (the added salt, Cs), for the cases in “salt” (red dashed curve) and in “water” (blue dashed curve). The values of Δ H ¯ m i x excess and Cs at maximum have been indicated in the figure (red: “salt”, blue: “water”). The two asterisks mark the transition from positive to negative values of the corresponding Δ H ¯ m i x excess functions: their Cs values are 0.67 M and to 0.015 M for the “salt” and the “water” case, respectively.
Polysaccharides 04 00018 g017
Figure 18. Dependence on α (α is the degree of dissociation) of the enthalpy change in loosening, Δ H ¯ l o o s e n . , as blue symbols, and dependence on β (β is the fraction of unscreened charge; for definition, see text) of the excess enthalpy change in mixing, Δ H ¯ m i x excess , red symbols, of pectic acid at 25 °C. The maximum variation of Δ H ¯ l o o s e n . , of Δ H ¯ t i g h t e n . and of Δ H ¯ l y o t r o p . have been indicated in purple, magenta and deep blue colors, respectively. (a) the “water” case, (b) the “salt” case. βθ is the value of β at which the electrostatic and the lyotropic terms are equal; the subscript “θ” has been used to highlight the condition of equality of the opposing interactions, a (kind of) θ-condition of the polyelectrolyte.
Polysaccharides 04 00018 g018
Figure 19. (a) Dependence on α of the reduced specific viscosity, ηred, of pectic acid solutions at 25 °C: blue open lozenges and dash-dotted curve, system in “water” (“w”), red open circles and dash-dotted curve, system in “salt” (“s”). The dashed segments are the best linear fit of the data points in the initial range of α (data replotted from Figure 1a); (b) dependence on α of the difference between the experimental values of ηred and the corresponding values of the linear baseline indicated in panel (a), δ ηred: blue open lozenges and dash-dotted curve, system in “water” (“w”), red open circles and dash-dotted curve, system in “salt” (“s”). The values of α1, α2, α3 for the two cases have also been indicated, together with αc, the critical value of α.
Polysaccharides 04 00018 g019
Scheme 6. Schematic representation of the proposed variation of the hydrodynamic behavior of pectic acid as a function of α. (1)–(5): significant steps in the considered range; A to D intervals of prevailing behavior; blue color: 31 conformation; red color: 21 conformation; the size of the rectangles is proportional to the cooperativity, the number of connected rectangles is inversely proportional to it; the style of the border of rectangles reflects loosening: full line—tightened (at αc); dashed—slightly loosened (at α1 and α1/2); short dashed—moderately loosened (at α3); dotted—very loosened (for α3 < α < α =1.0). Purple color: tightening; violet color, loosening. Fractions of repeating units in the 31 conformation, in the 21 conformation and in the loosened form are given in the corresponding colors. Side views of the 31 helical conformation and of the 21 conformation taken from [41], with permission, and adapted.
Polysaccharides 04 00018 sch006
Figure 21. (a) Dependence on α of the calculated values of the reduced viscosity, ηred, in the limit of infinite ionic strength (I → ∞) of pectic acid at 25 °C. Data replotted from figure 2 of reference [31]. Blue and red full circles represent the limit values of the 31 and of the 21 conformations at α = 0.0 and 1.0, respectively. Indications of the two conformations and of the conformational transition are given on the plots; (b) dependence on α of the data of panel (a) (magenta open circles and dash-dotted curve, r.h.s. scale), of the experimental values of the reduced viscosity, ηred, in “water” for comparison (blue dash-dotted curve, r.h.s scale, together with the indication of the two conformational transition ranges) and the relative values (to the value at α = 1.0) of the derivative of ηred with respect to I −0.5 (red full circles and dash-dotted curve, l.h.s. scale). Comments are given on the plots.
Polysaccharides 04 00018 g021
Figure 22. (a) Transversal 23Na NMR relaxation rates, π · ν 1 2 , for sodium poly(galacturonate) solutions at the concentration of 0.08 wt% as a function of the degree of neutralization, α’, at 24 °C and 26.4 MHz. The blue dashed line has been drawn through the two initial points; the red dashed curve is the best fit polynomial in the range of counterion condensation (for α > 0.61); (b) difference between the line through the two initial points and the experimental data of panel (a), δ Δν1/2, as a function of the degree of neutralization, α’. Magenta symbols and area represent the range of counterion condensation; the two orange dashed segments have been drawn to guide the eye in the two ranges of the conformational transition.
Polysaccharides 04 00018 g022
Table 1. Variation of the experimental thermodynamic functions of pectic acid in aqueous solution. Data obtained as a function of the degree of dissociation.
SourceTransition Δ H ¯ t r e x c e s s Δ S ¯ t r e x c e s s Δ G ¯ t r e x c e s s
kcal·mol−1cal·mol−1·K−1kcal·mol−1
Reference [29]αi → αf, s a+0.70 ± 0.10 b+2.2 ± 0.3 b+0.04 ± 0.13 b
αi → αf, w a+0.50 ± 0.10 b+1.6 ± 0.3 b+0.02 ± 0.13 b
This workαi → αf, s a+0.727 ± 0.05 c+2.27 ± 0.01 c+0.05 ± 0.05 d
αi → αf, w a+0.563 ± 0.05 c+1.62 ± 0.01 c+0.08 ± 0.05 d
a s, experiments in “salt”; w, experiments in “water”; b error estimated by the authors; c error from integration; d probable error from c.
Table 2. Variation in the (excess) thermodynamic functions of pectic acid in aqueous solution. Data obtained as a function of the degree of dissociation.
a.
conditionCp
equiv.·L−1
Cs
M
I
M
Δ H ¯ l o o s e n . e x c e s s α 1 , R α = 1 , R
kcal⋅mole r.u.−1
Δ S ¯ l o o s e n . e x c e s s α 1 , R α = 1 , R
cal⋅mole r.u.−1·K−1
Δ G ¯ l o o s e n . e x c e s s α 1 , R α = 1 , R
kcal⋅mole r.u.−1
Tm
K
T = 25 °C, α = 1
salt (R = 10)0.0050.050.051520.13 ± 0.000.44 ± 0.010.001 ± 0.001300 ± 27
water (R = 0)0.006400.001940.10 ± 0.010.19 ± 0.040.04 ± 0.00511 ± 123
b.
conditionCp
equiv.·L−1
Cs
M
I
M
Δ H ¯ 3 1 2 1 e x c e s s
kcal⋅mole r.u.−1
Δ S ¯ 3 1 2 1 e x c e s s
cal⋅mole r.u.−1·K−1
Δ G ¯ 3 1 2 1 e x c e s s
kcal⋅mole r.u.−1
Tm
K
T = 25 °C, α = 1
salt (R = 10)0.0050.050.051520.59 ± 0.001.84 ± 0.010.05 ± 0.00324 ± 2
water (R = 0)0.006400.001940.46 ± 0.011.43 ± 0.040.04 ± 0.02324 ± 12
c.
conditionCp
equiv.·L−1
Cs
M
I
M
Δ H ¯ total e x c e s s
kcal⋅mole r.u.−1
Δ S ¯ total e x c e s s
cal⋅mole r.u.−1·K−1
Δ G ¯ total e x c e s s
kcal⋅mole r.u.−1
Tm
K
T = 25 °C, α = 1
salt (R = 10)0.0050.050.051520.73 ± 0.002.28 ± 0.010.05 ± 0.00319 ± 2
water (R = 0)0.006400.001940.56 ± 0.021.63 ± 0.060.08 ± 0.02346 ± 16
Table 3. Maximum value of Δ H ¯ l o o s e n . e x c e s s of Na+ pectate at α = 0.96 from extrapolation to Cp → ∞ and to Cp → 0 of the heat of dilution data of Figure 4b.
SourceConditionState Δ H ¯ l o o s e n . e x c e s s α = 1 , C p α = 1 , C p 0
kcal·mole r.u.−1
this workwater ainitialfinalbcd
α = 1, Cs = 0, Cp = ∞α = 1, Cs = 0, Cp = 00.13 ± 0.060.12 ± 0.060.13 ± 0.09
a T = 25 °C, R = 0; b hyperbolic fit, as a function of Cp. Fitting parameters: a = −13.83 ± 58.94, b = −128.84 ± 61.27 (R2 = 0.9892); Δ H ¯ e x c e s s d i l . ,   0 = a − b = 115 ± 85 cal·mole r.u.−1; Δ H ¯ e x c e s s d i l . ,   C p = a = −14 ± 59 cal·r.u.−1; Δ H ¯ l o o s e n . e x c e s s α = 1 , C p α = 1 , C p 0 a − (a − b) = −129 ± 61 cal·mole r.u.−1. c fit using the Hill equation, as a function of 1/Cp. Fitting parameters: A = −17.03 ± 51.47, B = 105.07 ± 31.80, n = 1.5 ± 1.5 (R2 = 0.9821); Δ H ¯ e x c e s s d i l . ,   C p = A = −17 ± 51 cal·mole r.u.−1; Δ H ¯ e x c e s s d i l . ,   C p 0 = B = 105 ± 32 cal·mole r.u.−1; Δ H ¯ l o o s e n . e x c e s s α = 1 , C p α = 1 , C p 0 B − A = −122 ± 60 cal·mole r.u.−1. d average of b and c.
Table 4. Comparison between the ratio of the extent of conformational loosening in the isothermal transition upon full charge neutralization over that in the thermal transition at pH = 3.0, according to the chiro-optical, calorimetric and entropic results.
Isothermal (25 °C), pH-Induced Transition.
Final State: α = 1.0
Iso—pH (3.0), T-Induced Transition.
Final State: T = 85 °C
RATIO
Δ[ϑ]215 (deg·cm2·decimole−1)1.Δ[α]436 (100 deg·dm−1·(% wt)−1)2.2./1.
A. 31 → 211080 a A. 31 → 2115.63 c
B. loosening1449 b B. loosening50.0 d
Chiro-optical ratio, B./A.1.34Chiro-optical ratio, B./A.3.202.4
Δ H ¯ (kcal·mole r.u.−1)1. Δ H ¯ (kcal·mole r.u.−1)2.2./1.
C. 31 → 210.59 e C. 31 → 210.59 e
D. loosening0.13 f D. loosening0.28 g
Calorimetric ratio, D./C.0.22Calorimetric ratio, D./C.0.462.1
Δ S ¯ (kcal·mole r.u.−1·K−1)1. Δ S ¯ (kcal·mole r.u.−1·K−1)2.2./1.
E. 31 → 211.84 h E. 31 → 211.84 h
F. loosening0.44 i F. loosening1.03 j
Entropic ratio, F./E.0.24Entropic ratio, F./E.0.562.3
a Difference at α = 0.22 between blue (31) and red (21) dash-dotted curves in Figure 9a; b Difference at α = 1.0 between dotted (baseline) and dash-dotted (experimental) curves in Figure 8a; c Difference at 10 °C between experimental (triangles) and baseline curves for pH = 3.0 in figure 11b of [32]; d Difference between Δ[α]436 values at 85 °C and 10 °C on the extrapolated baseline for the curve for pH = 3.0 in figure 11b of [32]; e Value of Δ H ¯ 3 1 2 1 e x c e s s α 1 , R α = 1 , R in 0.05 M NaClO4 (Table 2); f Value of Δ H ¯ l o o s e n . e x c e s s α 1 , R α = 1 , R in 0.05 M NaClO4 (Table 2) and Δ H ¯ l o o s e n . e x c e s s α = 1 , C p α = 1 , C p 0 (d in Table 3); g Value calculated as Δ H ¯ l o o s e n . = Δ H ¯ e x p e r . DSC C p = 0 %     Δ H ¯ 3 1 2 1 e x c e s s , with Δ H ¯ e x p e r . DSC C p = 0 % = + 0.87 kcal·mole r.u.−1, Δ H ¯ 3 1 2 1 e x c e s s = +0.59 kcal·mole r.u.−1; h Value of Δ S ¯ 3 1 2 1 e x c e s s α 1 , R α = 1 , R in 0.05 M NaClO4 (Table 2); i Value of Δ S ¯ l o o s e n . e x c e s s α 1 , R α = 1 , R in 0.05 M NaClO4 (Table 2); j Value calculated as Δ S ¯ l o o s e n . = Δ S ¯ e x p e r . DSC , T m C p = 0 % Δ S ¯ 3 1 2 1 e x c e s s , with Δ S ¯ e x p e r . DSC , T m C p = 3 % = +2.87 kcal·mole r.u.−1·K−1, Δ S ¯ 3 1 2 1 e x c e s s = +1.84 cal·mole r.u.−1·K−1.
Table 5. Experimental (third column) and theoretical (fourth column) values of Δ H ¯ m i x of Na+ pectate in aqueous solution at 25 °C, and difference of the above values. Data from Figure 15.
SourceTransition ( ( Δ H ¯ ) m i x e x p ) C s ( ( Δ H ¯ ) m i x theor ) C s ( ( Δ H ¯ ) m i x excess ) C s
kcal ·mole r.u.−1
[75]Cs = 0 → Cs = ∞, wa+0.20 ± 0.01+0.33 ± 0.01−0.13 ± 0.01
[30]Cs = 0.05 M → Cs = ∞, sc+0.10 ± 0.01+0.12 ± 0.01−0.01 ± 0.01
Table 6. Variation of the (excess) order → disorder thermodynamic functions of galacturonan in aqueous solution; data obtained as a function of the degree of dissociation.
a.
conditionstate Δ H ¯ l o o s e n . e x c e s s α 1 , R α = 1 , R Δ H ¯ l o o s e n . e x c e s s α = 1 , R α = 1 , R M A X Δ H ¯ l o o s e n . e x c e s s α 1 , R α = 1 , R M A X
( G ¯ i o n = 0; “as if” α = 0)
initialfinalkcal·mol−1
water aα1, Cs = 0 (R = 0)α = 1, RMAX (=0.8)0.10 ± 0.010.030.13 ± 0.01
salt bα1, Cs = 0.05 M (R = 10)α = 1, RMAX (=64)0.13 ± 0.000.060.19 ± 0.00
b.
α = 1 Δ H ¯ l o o s e n . e x c e s s α = 1 , R α = 1 , R M A X Δ H ¯ t i g h t . e x c e s s α = 1 , R M A X α = 1 , R =  c Δ H ¯ l o o s e n . e x c e s s α 1 , R α = 1 , R M A X * Δ H ¯ l o o s e n . e x c e s s α = 1 , C p α = 1 , C p 0 Δ H ¯ l y o t r o p . α 1 , R α = 1 , R =  c
ABA + B
kcal·mol−1
water a0.03−0.160.13 ± 0.01 *0.13 ± 0.09 †−0.03 ± 0.02 e
salt b0.06−0.070.19 ± 0.00 *+0.12 ± 0.01 e
α = 1 Δ S ¯ l o o s e n . e x c e s s α = 1 , R α = 1 , R M A X d Δ S ¯ t i g h t . e x c e s s α = 1 , R M A X α = 1 , R =  c,d Δ S ¯ l o o s e n . e x c e s s α 1 , R α = 1 , R M A X d Δ S ¯ l y o t r o p . α 1 , R α = 1 , R =  c,d
ABA + B
cal·mol−1·K−1
water a0.06−0.320.25−0.06 ± 0.05 e
salt b0.20−0.240.64+0.40 ± 0.01 e
* and † identify the two methods used to evaluate the enthalpy changes accompanying the maximum possible “loosening” effect; a “water”: salt-free aqueous solution, T = 25 °C, Cp = 0.0064 mole r.u.·L−1, R = 0; b “salt”: aqueous NaClO4 0.05 M, T = 25 °C, Cp = 0.005 mole r.u.·L−1, R = 10; c    G ¯ i o n R = = 0; “as if” α = 0, i.e., <α1; d the entropy changes have been calculated form the corresponding enthalpy changes values (preceding two rows) from Δ S ¯ = Δ H ¯ T m , using the proper values of Tm for the “loosening” process, namely 300 ± 27 K and 511 ± 123 K for the “salt” and the “water” cases, respectively (data from the second block of Table 2); e in “salt” Δ G ¯ l o o s e n . l y o t r o p . = 1 ± 15 cal·mole r.u., in “water” Δ G ¯ l o o s e n . l y o t r o p . = −14 ± 16 cal·mole r.u.
Table 7. Values of the ratio of the relative viscosity extrapolated at I → ∞ for given values of α on the corresponding value at α = 1.0 (column A.) and of the ratio of the derivative of ηred with respect to I−0.5, S’, at α on the corresponding value at α = 1.0 (column B.). Percent values (italics) of variations are relative to the initial value in the range of comparison.
Polysaccharides 04 00018 i001
Disclaimer/Publisher’s Note: The statements, opinions and data contained in all publications are solely those of the individual author(s) and contributor(s) and not of MDPI and/or the editor(s). MDPI and/or the editor(s) disclaim responsibility for any injury to people or property resulting from any ideas, methods, instructions or products referred to in the content.

