Article

Hydrogenation Thermodynamics of Ti16V60Cr24−xFex Alloys (x = 0, 4, 8, 12, 16, 20, 24)

Hydrogen Research Institute, Université du Québec à Trois-Rivières, Trois-Rivières, QC G9A5H7, Canada
*
Author to whom correspondence should be addressed.
Hydrogen 2024, 5(1), 29-38; https://doi.org/10.3390/hydrogen5010003
Submission received: 10 November 2023 / Revised: 13 December 2023 / Accepted: 25 January 2024 / Published: 26 January 2024
(This article belongs to the Topic Metal Hydrides: Fundamentals and Applications)

Abstract

:
The effect of the partial substitution of Cr with Fe on the thermodynamic parameters of vanadium-rich Ti16V60Cr24-xFex alloys (x = 0, 4, 8, 12, 16, 20, 24) was investigated. For each composition, a pressure–concentration isotherm (PCI) was registered at 298, 308, and 323 K. The PCI curves revealed a reduction in plateau pressure and a decrease in desorbed hydrogen capacity with an increasing amount of Fe. For all alloys, about 50% or less of the initial hydrogen capacity was desorbed for all chosen temperatures. Entropy (ΔS) and enthalpy (ΔH) values were deducted from corresponding Van’t Hoff plots of the PCI curves: the entropy values ranged from −150 to −57 J/K·mol H2, while the enthalpy values ranged from −44 to −21 kJ/mol H2. They both decreased with an increasing amount of Fe. Plotting ΔS as function of ΔH showed a linear variation that seems to indicate an enthalpy–entropy compensation. Moreover, a quality factor analysis demonstrated that the present relationship between entropy and enthalpy is not of a statistical origin at the 99% confidence level.

1. Introduction

For the full implementation of hydrogen as an energy vector, safe and low-cost means of storing hydrogen should be available. Many ways to store hydrogen are available such as high-pressure, cryogenic liquid hydrogen, porous materials, liquid hydrogen carriers (e.g., ammonia), complex metal hydrides and intermetallic hydrides [1]. Metal hydrides are promising candidates for many stationary and mobile hydrogen storage applications. Because of their high volumetric densities and relatively low pressures of operation under mild temperatures, metal hydrides are ideally suited for a broad range of applications [2].
There are many families of hydride-forming intermetallic compounds. Usually, they are formed by a combination of elements that have a high affinity for hydrogen (A) and elements with a low affinity for hydrogen (B). The most usual A/B combinations are AB5 (e.g., LaNi5), AB2 (ZrV2), AB3 (CeNi3), A2B7 (Y2Ni7), AB (TiFe) and A2B (Mg2Ni) [3]. These families have been extensively studied using different combinations of A and B elements, the partial substitution of an A (or B) element by another A (or B) element, the addition of a catalyst, mechanical deformation, etc.
Another interesting family of metal hydrides is the solid solution Body-Centered Cubic (BCC) alloys. These alloys are frequently based on vanadium, and they have attracted attention due to their high maximum hydrogen capacity (~4 wt.%) [1,2,3,4,5,6,7,8]. The process of the hydrogenation of pure vanadium occurs two steps. In the first step, the monohydride VH is formed at a very low hydrogen pressure (<1 Pa), while the formation of the dihydride VH2 occurs at much higher pressure (0.4 MPa at 313 K) [4]. The monohydride is so stable that it can only be desorbed at a very high temperature (750 K). The high stability of the monohydride means that the effective capacity of vanadium hydride is about 2 wt.%. The thermodynamics of hydrogenation could be changed by alloying vanadium with other elements to create binary, ternary or quaternary alloys. This modification of thermodynamics is due to the change in the electronic density of state, ionicity and the lattice’s expansion [4]. As Ti forms a solid solution with V for a large range of compositions, it was the first binary system to be investigated for the formation of hydrides [5]. It was found that alloying V with Ti increases the stability of the hydride (with a lower plateau pressure), while alloying Cr with V leads to a less stable dihydride [6,7]. As we will see below, by choosing the right proportion of elements, a ternary alloy could have attractive hydrogen storage characteristics.
However, to meet the commercial needs for hydrogen storage, two aspects should be taken into consideration. The first one is the first hydrogenation, the so-called activation. For vanadium-based metal hydrides, activation is usually slow, requiring a high temperature and/or pressure [9]. Previous studies have solved these drawbacks by using additives [10,11,12,13] or mechanical processing [14,15,16,17,18,19]. The second aspect is thermodynamics. To be commercially attractive, the alloy should have a plateau pressure of a few bars near room temperature. By alloying vanadium with other metals, the plateau pressure and reversibility could be improved [18].
As mentioned previously, the hydrogenation of BCC metal hydrides usually occurs in two stages. First, the phase transition of a BCC solid solution (α-phase) to an intermediate Body-Centered Tetragonal (BCT) monohydride (β-phase) that is associated with a low plateau pressure occurs. Second, the formation of a Face-Centered Cubic (FCC) phase (γ-phase) that is related to a higher plateau pressure with a ratio of hydrogen atoms over metallic atoms (H/M) of approximately two (H/M ≈ 2) occurs [19]. The hydrogen absorption and desorption reactions can occur at moderate temperatures and pressures since the γ-phase is usually not very stable. Consequently, the reversible hydrogen capacity is reduced by approximately half in vanadium metal, which is not sufficient for practical applications [20]. This issue has been partially resolved by adding alloying elements [21,22,23,24,25,26,27,28,29]. For example, Aoki et al. have reported that in the system Ti12Cr23V65, when V is substituted with Fe, the cyclability is improved: Ti12Cr23V64Fe1 released 97% of its initial capacity, while the Fe-free alloy only desorbed 88% [30]. Towata et al. studied the effect of partial niobium and iron substitution on the short-term cycle durability of hydrogen storage Ti-V-Cr alloys [31]. Partial iron substitution enhanced the cyclability of the Ti16V50Cr34 alloy but reduced its hydrogen storage capacity. Partial niobium substitution was not only favorable for the Ti25Cr50V25 alloy’s cyclability; it also did not affect the hydrogen capacity [31]. Moreover, the study of Zr substitution for Ti on the hydrogen absorption–desorption characteristics of Ti1-xZrxCrV (x = 0, 0.05, 0.1 and 0.1) revealed that the presence of a small amount of Zr has advantageous effects on the hydrogen absorption properties of Ti-Cr-V as it suppresses TiH2 phase separation and decreases hysteresis [32].
The hydrogenation/dehydrogenation enthalpy and entropy are obtained from Van’t Hoff plots that are generated from a series of PCI (pressure–composition isotherm) measurements at different temperatures [33]. The enthalpy (ΔH) and the entropy (ΔS) of the metal hydride formation are calculated from the equation ln (peq/p0) = (ΔH/RT) − (ΔS/R), where R is the gas constant. In general, the entropy change ΔS is mainly due to the hydrogen gas. It is approximately −130 J/mol·K and is considered invariant and independent of the nature of the metal hydride. The enthalpy should be of the order of −30 kJ/mol H2 to desorb hydrogen under normal temperature and pressure conditions [34]. However, it was found that enthalpies and entropies derived from Van ‘t Hoff or Arrhenius plots exhibit strong linear correlations in many thermodynamic or kinetic experiments for a series of similar reactions [35,36,37,38]. This so-called enthalpy–entropy compensation (EEC) has been the subject of investigations [39,40,41,42]. Griessen and Dam have reported an accurate verification scheme that allows one to determine the nature of EEC using the so-called K-CQF method [43]. This method permits one to distinguish if the EEC measured is a true effect or just an artefact due to the limited number and range of data points.
In this paper, the effect of Fe substitution on the thermodynamic properties of Ti16V60Cr24-xFex alloys for x = 0, 4, 8, 12, 16, 20, 24 is reported. Firstly, PCI curves of all alloys will be compared. Then, enthalpies and entropies will be deducted from Van’t Hoff plots. Finally, since we have a series of measurements with a systematic change in composition, we will address the correlation between enthalpy and entropy for this composition system.

2. Materials and Methods

All alloys were synthesized by arc melting under argon to avoid any oxidation. The elements were purchased from Alfa-Aesar (Tewksbury, MA, USA) with the following purities: Ti (99.95%, V (99%), Cr (99%), Zr (99.95) and Fe (99.9%). They alloys were re-melted several times to ensure homogeneity. Then, they were hand-crushed in an argon-filled glove box. Hydrogenation measurements were carried out with a homemade Sievert-type apparatus. Each sample was first fully hydrogenated at room temperature under 3 MPa of hydrogen. Then, it was kept under pressure while the temperature was raised to the desired PCI temperature. Only desorption PCIs were recorded. The PCI measurements were performed at 298, 308 and 323 K.

3. Results and Discussion

3.1. Microstructure, Crystal Structure and First Hydrogenation

The microstructure, crystal structure and first hydrogenation were reported in our previous paper [44]. It was found that the microstructure consisted of two main phases: a matrix with a chemical composition close to the nominal one and a Zr-rich region. The crystal structure of the main phases of all as-cast alloys was BCC. For x ≥ 12, the BCC phase abundance decreased, and a C14 Laves phase appeared. The lattice parameter of the BCC phase decreased linearly with an increasing Fe proportion. After hydrogenation, the BCC phase was converted into a BCT phase for all hydrides, and a C14 phase appeared for x = 4 and 8. For x ≥ 16, a C15 phase was present. Table 1 shows the hydrogen capacity and the crystal structure in the as-cast and hydrogenated states of all investigated alloys.

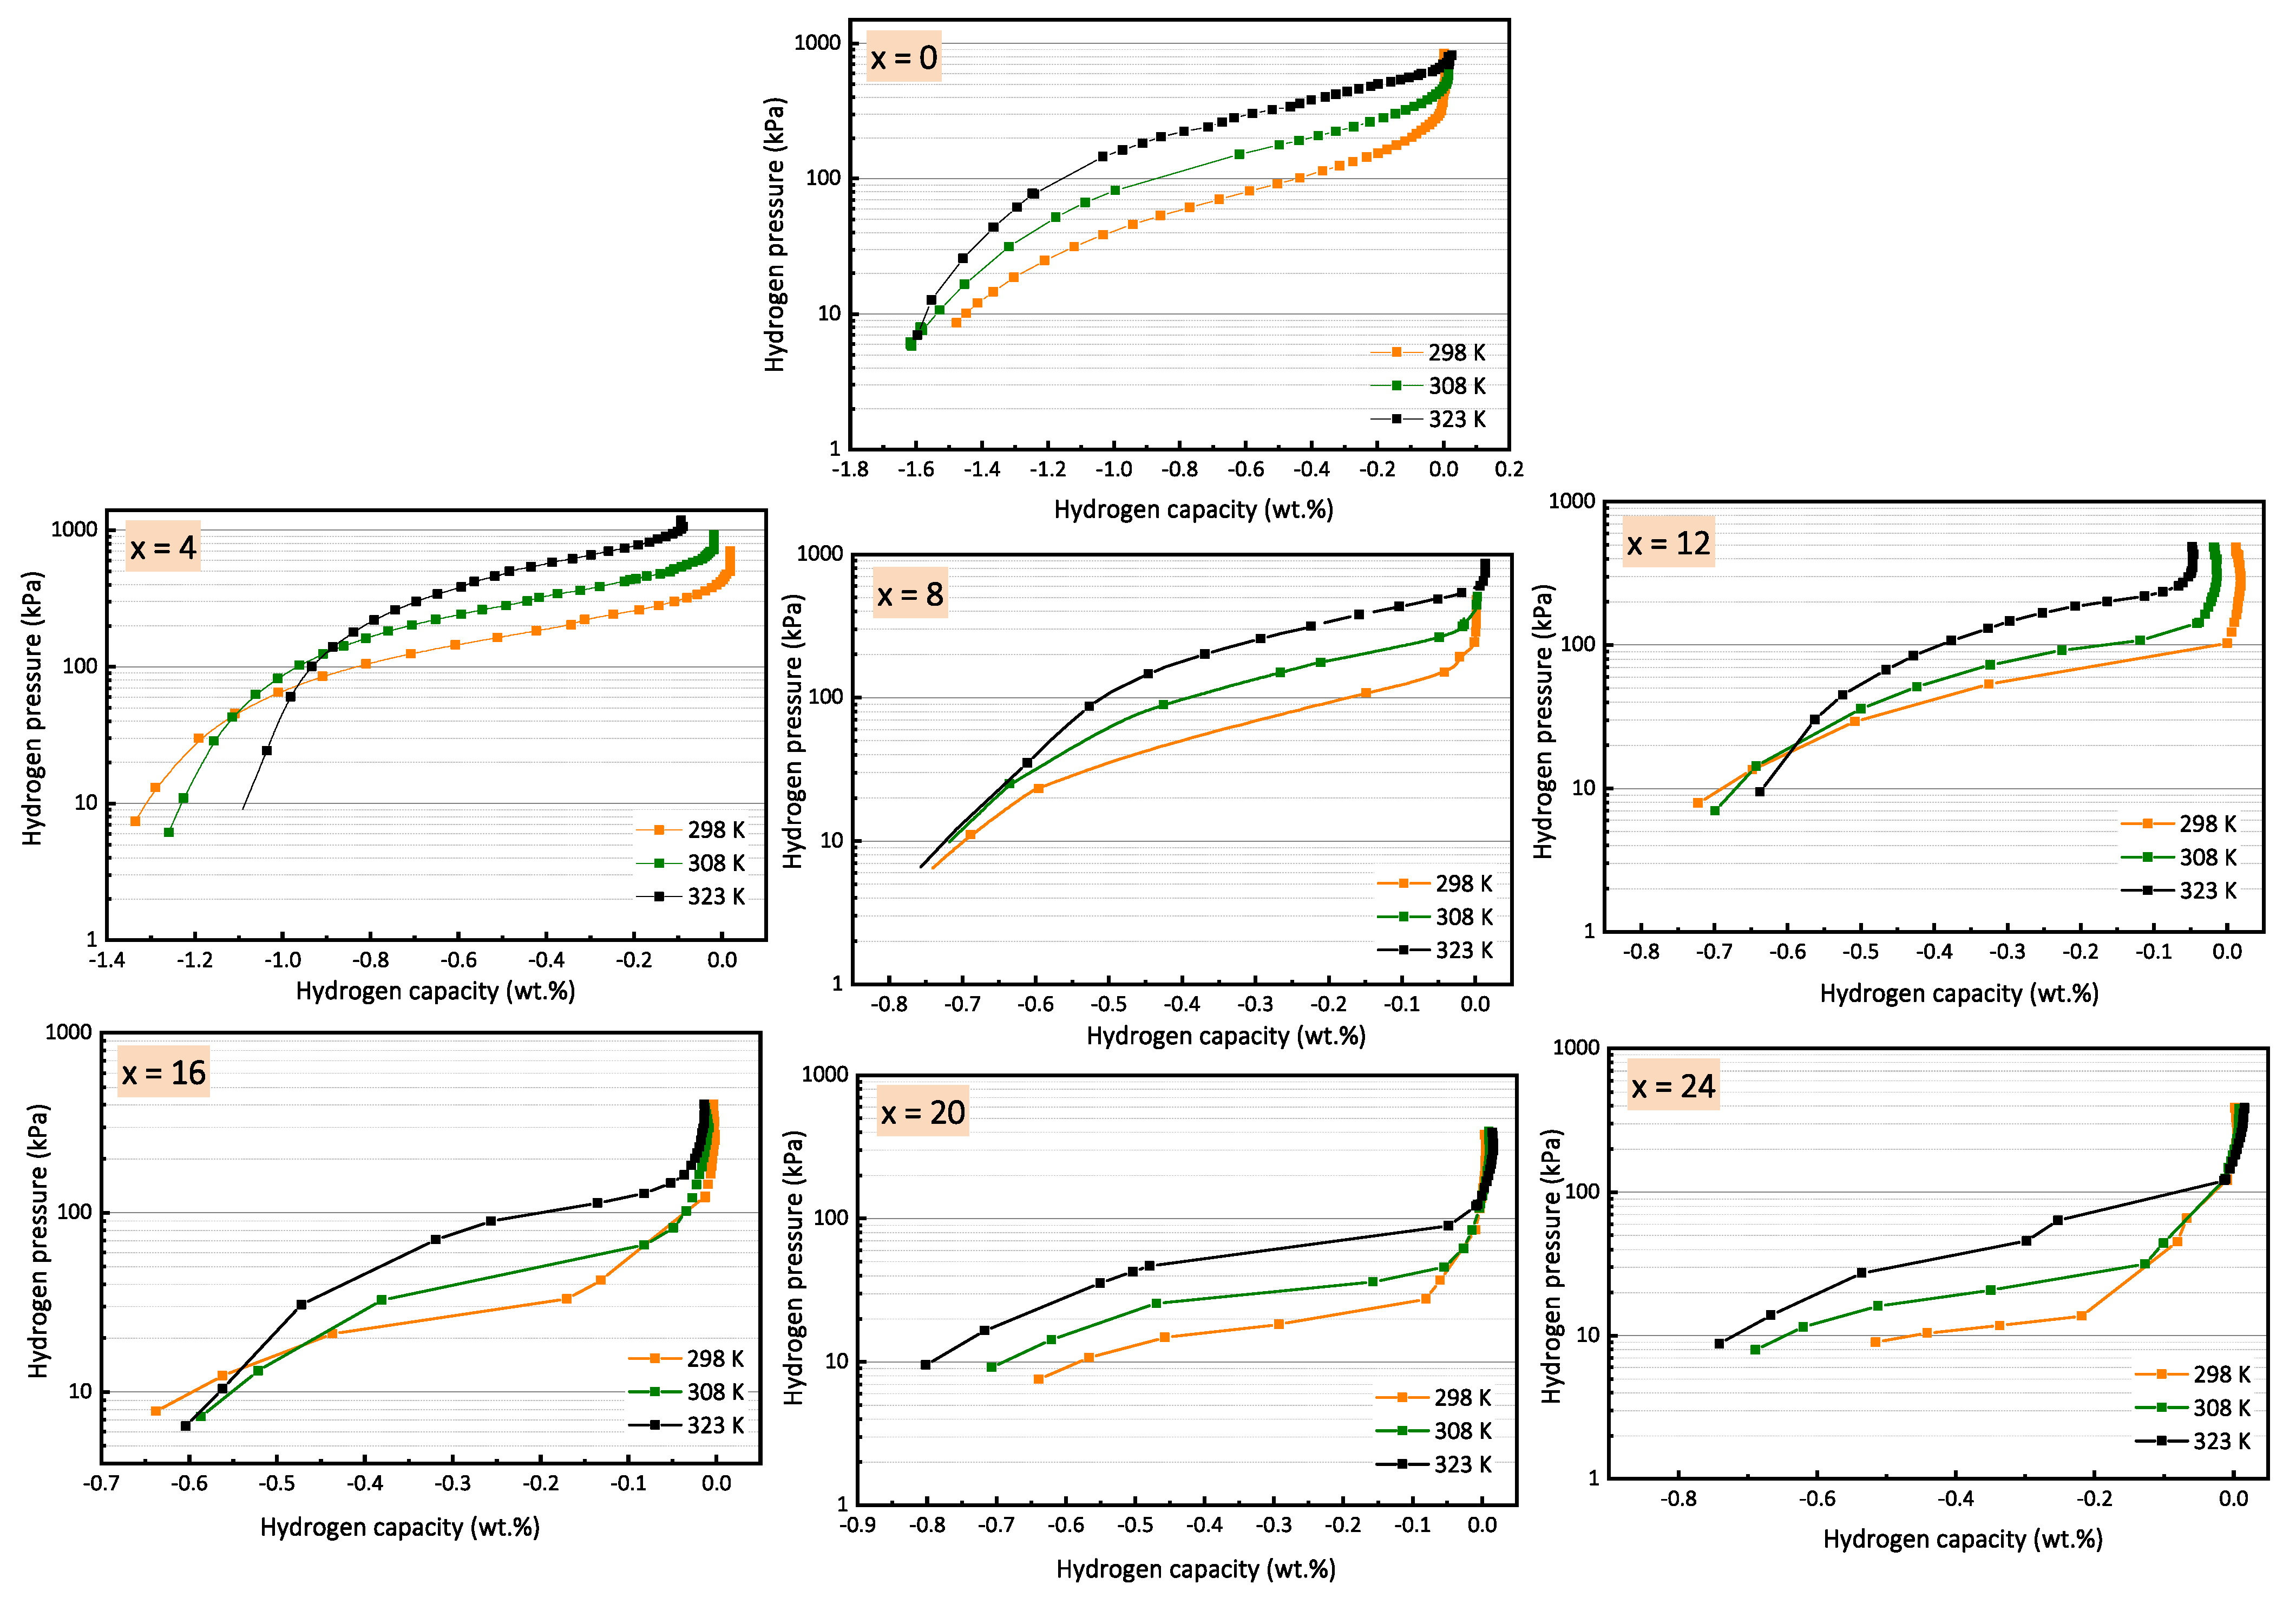
3.2. Pressure Composition Isotherms (PCIs)

Figure 1 shows the desorption PCI curves of all alloys at temperatures of 298, 308 and 323 K. All isotherms show incomplete desorption and a sloping plateau pressure. This is a common behaviour of BCC alloys that indicates that these alloys desorb hydrogen in two steps: at high pressures, a dihydride-to-monohydride transformation occurs, and at low pressures, a monohydride dehydrogenation occurs [18,45]. In our case, as the lowest measurable pressure was 10 kPa, we could only register the dihydride-to-monohydride transformation.
As only the desorption isotherm was registered and the capacity is lowered at higher temperatures due to a low critical point, the isotherms were centered on their inflection points (i.e., middle of the plateau). It is also at this point that the equilibrium pressure was taken for the Van’t Hoff plots.

3.3. Enthalpy and Entropy

The Van’t Hoff plots constructed from the PCI curves of each alloy are presented in Figure 2.
For each composition, the entropy (ΔS) and enthalpy (ΔH), were calculated from the intercept and slope. The results are given in Table 2. As a comparison, the enthalpy and the entropy of the formation of pure vanadium hydride are −40 kJ/mol H2 and −140 J/K·mol H2, respectively [7]. Here, we can notice that from x = 0 to 8, the enthalpies and entropies are in the same ranges as those of the pure vanadium hydride.
Figure 3 displays variations in ΔS and ΔH as functions of the Fe content. We found a linear decrease in both enthalpy and entropy with an increasing iron content. Lynch et al. have reported the same trend [46]. They found that for the system (V0.9Ti0.1)1−xFex (x = 0, 0.01, 0.02, 0.05, 0.075), the enthalpy went from (−51.79 ± 0.36) to (−40.00 ± 2.70) kJ/mol.H2, and the entropy changed from (−149.4 ± 1.0) to (−136.0 ± 8.1) J/K·mol H2. They attributed the reduction in enthalpy to a decrease in the binding energy of hydrogen to the metal. Moreover, the lattice parameter was also diminishing, causing a shrinkage of the size of the tetrahedral site occupied by hydrogen. Both effects were suspected to destabilize the dihydride and then qualitatively reduce the desorption enthalpy. They explained the drop in entropy by an increase in the vibrational entropy of the hydrogen in the hydride lattice. As mentioned earlier, the enthalpy can largely vary but, usually, the entropy value is around −130 J/K·mol H2. Here, there is a clear dependence of entropy on the composition.

3.4. Enthalpy–Entropy Compensation

Figure 4 presents the variation in entropy (ΔS) as a function of enthalpy (ΔH) for the Ti16V60Cr24−xFex alloy for x = 0, 4, 8, 12, 16, 20, 24. It shows a linear variation that seems to be a case of enthalpy–entropy compensation (EEC).
As mentioned above, Griessen and Dam introduced a method called combined K-CQF to verify the nature of EEC. The parameter CQF is a dimensionless factor that is a compensation quality factor, while K is a parameter that indicates the position of the coalescence [43]. The steps for determining K and CQF are as follows:
  • Step 1
The first step consists of calculating the harmonic mean temperature Thm using the following equation:
T h m = 1 M   j = 1 M 1 T j 1
Tj with j = 1, … M is the temperature of the j-th measurement at which the equilibrium pressures of the N samples are determined [43]. In our case, Tlow = 298 K and Thigh = 323 K. Since we used three temperatures for measuring PCTs, M = 3, and we obtain Thm = 309 K.
  • Step 2
The second step is to determine the temperature of compensation Tcomp and the correlation coefficient R2. Tcomp is the slope of the linear fit derived from the ΔHi versus ΔSi plot. The variation in the Tcomp predictable from the change in the thermodynamic parameters is given by the R2 value. An R2 value of 1 means that Tcomp is totally determined by the thermodynamic parameters. From Figure 4, we have Tcomp = 254 K and R2 = 0.982.
  • Step 3
The third step is finding Tmin and calculating the coefficient K. There are two ways to determine Tmin. Firstly, the following equation can be used:
T m i n = T c o m p R s q u a r e  
From Equation (2), the value of Tmin is 258 K. Secondly, a graphical method may be used by extrapolating the Van’t Hoff plots. Then, the temperature where the spread of the Van’t Hoff curves is at a minimum is the Tmin. Figure 5 presents this extrapolation for the Van’t Hoff plots of Figure 2. The value of Tmin in this case is 242 K.
The coefficient K can be calculated using the following equation:
K = 1 T h m 1 T m i n 1 2 1 T l o w 1 T h i g h
  • Step 4
The fourth step consists of calculating the CQF parameter. It is given by the following equation:
C Q F = 1 1 R s q u a r e 1 R s q u a r e T c o m p T * 2 2   T c o m p T * + 1
T* is the temperature at which the measured lnP_spread is the largest. T* = Tlow if 1/Tmin is closer to 1/Thigh or T* = Thigh if 1/Tmin is closer to 1/Tlow. In our case, as 1/Tmin is closer to 1/Tlow, consequently, T* = Thigh = 323 K.
All useful parameters to determine K and CQF are summarized in Table 3. As specified, Tmin can be either calculated from Equation (2) or deducted from the lnP_spread versus 1/T plot. As K is dependent on Tmin, we obtained two different values of K. After completing all calculations, we obtained values of K = −6.909 (for Tmin = 242 K), K = −4.902 (for Tmin = 258 K) and CQF = 0.44219.
To draw a conclusion, Griessen and Dam proposed a graphical method (Figure 6), a 95% or 99% confidence level (CL) contour that depends only on the number of samples. If the (K, CQF) point lays outside the CL% contour, then the EEC is not of a statistical origin at this confidence level [43].
If we refer to Figure 6, for both values of K, the values of the pair (K, CQF) lie outside the 99% confidence contour. Thus, even though CQF is lower than 0.9, the EEC is not due to a statistical effect.

4. Conclusions

A study of the dehydrogenation thermodynamic properties of Ti16V60Cr24−xFex (x = 0, 4, 8, 12, 16, 20, 24) alloys allowed us to draw the following conclusions: first of all, the plateau pressure and the desorbed hydrogen capacity decreased with an increasing Fe proportion. Enthalpy and entropy both diminished when increasing the amount of Fe. Moreover, ΔS, as function of the ΔH plot, showed a linear variation that indicates the possible existence of EEC with Tcomp = 254 K. Finally, the values of (K, CQF) derived from ΔS and ΔS are outside the 99% confidence contour. This means that the origin of the EEC is not a statistical effect at the 99% confidence level.

Author Contributions

All experiments were performed by F.R. under the supervision of J.H. J.H. and F.R. analyzed the results and wrote the paper. All authors have read and agreed to the published version of the manuscript.

Funding

This research received no external funding.

Data Availability Statement

All data and materials are available on request from the corresponding author. The data are not publicly available due to ongoing researches using a part of the data.

Acknowledgments

The authors would like to thank Ronald Griessen of VU University, Amsterdam, for useful discussion.

Conflicts of Interest

The authors declare no conflicts of interest.

References

  1. Tamura, T.; Kamegawa, A.; Takamura, H.; Okada, M. Hydrogen Isotope Effects on Absorption Properties of Ti-Cr-V Alloys. Mater. Trans. 2003, 44, 641–644. [Google Scholar] [CrossRef]
  2. Tamura, T.; Tominaga, Y.; Matsumoto, K.; Fuda, T.; Kuriiwa, T.; Kamegawa, A.; Takamura, H.; Okada, M. Protium Absorption Properties of Ti-V-Cr-Mn Alloys with a b.c.c. Structure. J. Alloys Compd. 2002, 330–332, 522–525. [Google Scholar] [CrossRef]
  3. Fuda, T.; Matsumoto, K.; Tominaga, Y.; Tamura, T.; Kuriiwa, T.; Kamegawa, A.; Okada, M. Effects of Additions of BCC Former Elements on Protium Absorbing Properties of Cr-Ti-V Alloys. Mater. Trans. JIM 2000, 41, 577–580. [Google Scholar] [CrossRef]
  4. Tsukahara, M.; Takahashi, K.; Mishima, T.; Isomura, A.; Sakai, T. Heat-Treatment Effects of V-Based Solid Solution Alloy with TiNi-Based Network Structure on Hydrogen Storage and Electrode Properties. J. Alloys Compd. 1996, 243, 133–138. [Google Scholar] [CrossRef]
  5. Itoh, H.; Arashima, H.; Kubo, K.; Kabutomori, T.; Ohnishi, K. Improvement of Cyclic Durability of BCC s Tructured Ti-Cr-V Alloys. J. Alloys Compd. 2005, 404–406, 417–420. [Google Scholar] [CrossRef]
  6. Lototsky, M.V.; Yartys, V.A.; Zavaliy, I.Y. Vanadium-Based BCC Alloys: Phase-Structural Characteristics and Hydrogen Sorption Properties. J. Alloys Compd. 2005, 404–406, 421–426. [Google Scholar] [CrossRef]
  7. Reilly, J.J.; Wiswall, R.H. The Higher Hydrides of Vanadium and Niobium. Inorg. Chem. 1970, 9, 1678–1682. [Google Scholar] [CrossRef]
  8. Seo, C.Y.; Kim, J.H.; Lee, P.S.; Lee, J.Y. Hydrogen Storage Properties of Vanadium-Based b.c.c. Solid Solution Metal Hydrides. J. Alloys Compd. 2003, 348, 252–257. [Google Scholar] [CrossRef]
  9. Kamble, A. Effect of Additives, Heat Treatment and Mechanical Deformations on Hydrogen Storage Properties of BCC Alloys. Ph.D. Thesis, Université du Québec à Trois, Rivières, QC, Canada, 2018. [Google Scholar]
  10. Sleiman, S.; Huot, J. Microstructure and First Hydrogenation Properties of TiHfZrNb1-XV1 + x Alloy for x = 0, 0.1, 0.2, 0.4, 0.6 and 1. Molecules 2022, 27, 1054. [Google Scholar] [CrossRef]
  11. Kamble, A.; Huot, J.; Sharma, P. Effect of Addition of Zr, Ni, and Zr-Ni Alloy on the Hydrogen Absorption of Body Centred Cubic 52Ti-12V-36Cr Alloy. Int. J. Hydrogen Energy 2018, 43, 7424–7429. [Google Scholar] [CrossRef]
  12. Ravalison, F.; Rabkin, E.; Huot, J. Methods to Improve the First Hydrogenation of the Vanadium-Rich BCC Alloy Ti 16 V 60 Cr 24. Hydrogen 2022, 3, 303–311. [Google Scholar] [CrossRef]
  13. Dixit, V.; Huot, J. Investigation of the Microstructure, Crystal Structure and Hydrogenation Kinetics of Ti-V-Cr Alloy with Zr Addition. J. Alloys Compd. 2019, 785, 1115–1120. [Google Scholar] [CrossRef]
  14. Khajavi, S.; Rajabi, M.; Huot, J. Effect of Cold Rolling and Ball Milling on First Hydrogenation of Ti0.5Zr0.5 (Mn1-XFex) Cr1, X = 0, 0.2, 0.4. J. Alloys Compd. 2019, 775, 912–920. [Google Scholar] [CrossRef]
  15. Sleiman, S.; Aliouat, A.; Huot, J. Materials Enhancement of First Hydrogenation of Ti 1 V 0.9 Cr 1.1 BCC Alloy by Cold Rolling and Ball Milling. Materials 2020, 13, 3106. [Google Scholar] [CrossRef] [PubMed]
  16. Liu, S.; Cui, C.; Wang, X.; Li, N.; Shi, J.; Cui, S.; Chen, P. Effect of Cooling Rate on Microstructure and Grain Refining Behavior of in Situ CeB6/Al Composite Inoculant in Aluminum. Metals 2017, 7, 204. [Google Scholar] [CrossRef]
  17. Lang, J.; Huot, J. A New Approach to the Processing of Metal Hydrides. J. Alloys Compd. 2011, 509, L18–L22. [Google Scholar] [CrossRef]
  18. Kumar, S.; Jain, A.; Ichikawa, T.; Kojima, Y.; Dey, G.K. Development of Vanadium Based Hydrogen Storage Material: A Review. Renew. Sustain. Energy Rev. 2017, 72, 791–800. [Google Scholar] [CrossRef]
  19. Strozi, R.B.; Silva, B.H.; Leiva, D.R.; Zlotea, C.; Botta, W.J.; Zepon, G. Tuning the Hydrogen Storage Properties of Ti-V-Nb-Cr Alloys by Controlling the Cr/(TiVNb) Ratio. J. Alloys Compd. 2023, 932, 167609. [Google Scholar] [CrossRef]
  20. Yukawa, H.; Teshima, A.; Yamashita, D.; Ito, S.; Morinaga, M.; Yamaguchi, S. Alloying Effects on the Hydriding Properties of Vanadium at Low Hydrogen Pressures. J. Alloys Compd. 2002, 337, 264–268. [Google Scholar] [CrossRef]
  21. Verbetsky, V.N.; Zotov, T.A.; Tatarintsev, A.V.; Movlaev, E.A. Hydrogen Sorption Properties of V1-x Crx (x = 0.1−0.5) Alloys. Inorg. Mater. 2013, 49, 149–152. [Google Scholar] [CrossRef]
  22. Kazumi, T.; Tamura, T.; Kamegawa, A.; Takamura, H.; Okada, M. Effect of Absorption-Desorption Cycles on Structure and Stability of Protides in Ti-Cr-V Alloys. Mater. Trans. 2002, 43, 2748–2752. [Google Scholar] [CrossRef]
  23. Asano, K.; Hayashi, S.; Nakamura, Y. Enhancement of Hydrogen Diffusion in the Body-Centered Tetragonal Monohydride Phase of the V-H System by Substitutional Al Studied by Proton Nuclear Magnetic Resonance. Acta Mater. 2015, 83, 479–487. [Google Scholar] [CrossRef]
  24. Kagawa, A.; Ono, E.; Kusakabe, T.; Sakamoto, Y. Absorption of Hydrogen by Vanadium-Rich VTi-Based Alloys. J. Less-Common Met. 1991, 172–174, 64–70. [Google Scholar] [CrossRef]
  25. Lynch, J.F.; Reilly, J.J.; Millot, F. The Absorption of Hydrogen by Binary Vanadium-Chromium Alloys. J. Phys. Chem. Solids 1978, 39, 883–890. [Google Scholar] [CrossRef]
  26. Wang, J.Y.; Jeng, R.R.; Nieh, J.K.; Lee, S.; Lee, S.L.; Bor, H.Y. Comparing the Hydrogen Storage Alloys-TiCrV and Vanadium-Rich TiCrMnV. Int. J. Hydrogen Energy 2007, 32, 3959–3964. [Google Scholar] [CrossRef]
  27. Tsukahara, M. Hydrogenation Properties of Vanadium-Based Alloys with Large Hydrogen Storage Capacity. Mater. Trans. 2011, 52, 68–72. [Google Scholar] [CrossRef]
  28. Yan, Y.; Li, Z.; Wu, Y.; Zhou, S. Hydrogen Absorption-Desorption Characteristic of (Ti0.85Zr0.15)1.1Cr1-XMoxMn Based Alloys with C14 Laves Phase. Prog. Nat. Sci. Mater. Int. 2022, 32, 143–149. [Google Scholar] [CrossRef]
  29. Kumar, A.; Muthukumar, P.; Kumar, E.A. Absorption Based Solid State Hydrogen Storage System: A Review. Sustain. Energy Technol. Assess. 2022, 52, 102204. [Google Scholar] [CrossRef]
  30. Aoki, M.; Noritake, T.; Ito, A.; Ishikiriyama, M.; Towata, S.I. Improvement of Cyclic Durability of Ti-Cr-V Alloy by Fe Substitution. Int. J. Hydrogen Energy 2011, 36, 12329–12332. [Google Scholar] [CrossRef]
  31. Towata, S.I.; Noritake, T.; Itoh, A.; Aoki, M.; Miwa, K. Effect of Partial Niobium and Iron Substitution on Short-Term Cycle Durability of Hydrogen Storage Ti-Cr-V Alloys. Int. J. Hydrogen Energy 2013, 38, 3024–3029. [Google Scholar] [CrossRef]
  32. Shashikala, K.; Banerjee, S.; Kumar, A.; Pai, M.R.; Pillai, C.G.S. Improvement of Hydrogen Storage Properties of TiCrV Alloy by Zr Substitution for Ti. Int. J. Hydrogen Energy 2009, 34, 6684–6689. [Google Scholar] [CrossRef]
  33. C. Julien, J.P.; Pereira-Ramos, A.M. (Eds.) New Trends in Intercalation Compounds for Energy Storage NATO Science Series; Kluwer Academic Publishers: Dordrecht, The Netherlands, 2003; ISBN 9781402005954. [Google Scholar]
  34. Kohlmann, H. Metal Hydrides. Encycl. Phys. Sci. Technol. 2003, 441–458. [Google Scholar] [CrossRef]
  35. Schwarz, J.A.; Felton, L.E. Compensating Effects in Electromigration Kinetics. Solid State Electron. 1985, 28, 669–675. [Google Scholar] [CrossRef]
  36. Widenhorn, R.; Mündermann, L.; Rest, A.; Bodegom, E. Meyer-Neldel Rule for Dark Current in Charge-Coupled Devices. J. Appl. Phys. 2001, 89, 8179–8182. [Google Scholar] [CrossRef]
  37. Ullah, M.; Singh, T.B.; Sitter, H.; Sariciftci, N.S. Meyer-Neldel Rule in Fullerene Field-Effect Transistors. Appl. Phys. A Mater. Sci. Process. 2009, 97, 521–526. [Google Scholar] [CrossRef]
  38. Andreasen, A.; Vegge, T.; Pedersen, A.S. Compensation Effect in the Hydrogenation/Dehydrogenation Kinetics of Metal Hydrides. J. Phys. Chem. B 2005, 109, 3340–3344. [Google Scholar] [CrossRef]
  39. Griessen, R.; Boelsma, C.; Schreuders, H.; Broedersz, C.P.; Gremaud, R.; Dam, B. Single Quality Factor for Enthalpy-Entropy Compensation, Isoequilibrium and Isokinetic Relationships. ChemPhysChem 2020, 21, 1632–1643. [Google Scholar] [CrossRef]
  40. Cornish-Bowden, A. Enthalpy-Entropy Compensation: A Phantom Phenomenon. J. Biosci. 2002, 27, 121–126. [Google Scholar] [CrossRef]
  41. Patelli, N.; Calizzi, M.; Pasquini, L. Inorganics Interface Enthalpy-Entropy Competition in Nanoscale Metal Hydrides. Inorganics 2018, 6, 13. [Google Scholar] [CrossRef]
  42. Perez-Benito, J.F.; Mulero-Raichs, M. Enthalpy-Entropy Compensation Effect in Chemical Kinetics and Experimental Errors: A Numerical Simulation Approach. J. Phys. Chem. A 2016, 120, 7598–7609. [Google Scholar] [CrossRef]
  43. Griessen, R.; Dam, B. Simple Accurate Verification of Enthalpy-Entropy Compensation and Isoequilibrium Relationship. ChemPhysChem 2021, 22, 1774–1784. [Google Scholar] [CrossRef] [PubMed]
  44. Francia, R.; Huot, J. Microstructure and First Hydrogenation Properties of Ti16V60Cr24−xFex + 4 Wt.% Zr Alloy for x = 0, 4, 8, 12, 16, 20, 24. Energies 2023, 16, 5360. [Google Scholar] [CrossRef]
  45. Akiba, E.; Okada, M. Metallic Hydrides III: Cubic Solid- Solution Alloys. MRS Bull. 2002, 27, 699–703. [Google Scholar] [CrossRef]
  46. Lynch, J.F.; Maeland, A.J.; Libowitz, G.G. Lattice Parameter Variation and Thermodynamics of Dihydride Formation in the Vanadium-Rich V—Ti—Fe/H 2 System*. Z. FÜR Phys. Chem. 1985, 145, 51–59. [Google Scholar] [CrossRef]
Figure 1. PCI desorption curves of Ti16V60Cr24−xFex alloy for x = 0, 4, 8, 12, 16, 20, 24, at 298, 308 and 323 K.
Hydrogen 05 00003 g001
Figure 2. Van’t Hoff curves of Ti16V60Cr24−xFex alloy for x = 0, 4, 8, 12, 16, 20, 24, at 298, 308 and 323 K.
Hydrogen 05 00003 g002
Figure 3. Variations in (a) ΔS and (b) ΔH with Fe content.
Hydrogen 05 00003 g003
Figure 4. Variation in enthalpy (ΔH) as a function of entropy (ΔS) for Ti16V60Cr24-xFex alloy for x = 4, 8, 12, 16, 20, 24.
Hydrogen 05 00003 g004
Figure 5. (a) Extrapolation of Van’t Hoff plots. (b) Inverse temperature variation in the LnP_spread of the Van’t Hoff plots in (a).
Hydrogen 05 00003 g005
Figure 6. Confidence contours of 95% (left panel) and 99% (right panel) for N = 4 up to N = 15. From Ref. [43] with permission.
Hydrogen 05 00003 g006
Table 1. Maximum hydrogen capacity upon activation and crystal structure of hydrides [44].
xMaximum Hydrogen Capacity (wt.%)Crystal Structure
As-CastAfter Hydrogenation
03.78BCC (100%)BCT (100%)
43.09BCC (100%)BCT (80%) + C14 (20%)
82.08BCC (100%)BCT (78%) + C14 (22%)
121.89BCC (79%) + C14 (21%)BCT (76%) + C14 (24%)
162.06BCC (77%) + C14 (23%)BCT (58%) + C14 (24%) + C15 (18%)
201.94BCC (74%) + C14 (26%)BCT (64%) + C14 (23%) + C15 (13%)
241.99BCC (72%) + C14 (28%)BCT (53%) + C14 (37%) + C15 (11%)
Table 2. Entropy and enthalpy values of the formation of all hydrides.
xΔS (J/K·mol H2)ΔH (kJ/mol H2)
0−134 ± 14−41 ± 5
4−150 ± 12−44 ± 4
8−126 ± 12−39 ± 4
12−114 ± 6−36 ± 2
16−98 ± 5−33 ± 2
20−84 ± 12−30 ± 4
24−57 ± 5−21 ± 2
Table 3. Useful parameters for determining K and CQF according to [43].
Thm (K)Tcomp (K)R2Tmin (K) (from Equation (2))Tmin (K) (from Figure 5)T* (K)
3092540.982258242323
Disclaimer/Publisher’s Note: The statements, opinions and data contained in all publications are solely those of the individual author(s) and contributor(s) and not of MDPI and/or the editor(s). MDPI and/or the editor(s) disclaim responsibility for any injury to people or property resulting from any ideas, methods, instructions or products referred to in the content.

