Article

Cost Projection of Global Green Hydrogen Production Scenarios

by
Moe Thiri Zun
and
Benjamin Craig McLellan
*
Department of Socio-Environmental Energy Science, Graduate School of Energy Science, Kyoto University, Kyoto 606-8501, Japan
*
Author to whom correspondence should be addressed.
Hydrogen 2023, 4(4), 932-960; https://doi.org/10.3390/hydrogen4040055
Submission received: 13 October 2023 / Revised: 27 October 2023 / Accepted: 3 November 2023 / Published: 9 November 2023

Abstract

:
A sustainable future hydrogen economy hinges on the development of green hydrogen and the shift away from grey hydrogen, but this is highly reliant on reducing production costs, which are currently too high for green hydrogen to be competitive. This study predicts the cost trajectory of alkaline and proton exchange membrane (PEM) electrolyzers based on ongoing research and development (R&D), scale effects, and experiential learning, consequently influencing the levelized cost of hydrogen (LCOH) projections. Electrolyzer capital costs are estimated to drop to 88 USD/kW for alkaline and 60 USD/kW for PEM under an optimistic scenario by 2050, or 388 USD/kW and 286 USD/kW, respectively, under a pessimistic scenario, with PEM potentially dominating the market. Through a combination of declining electrolyzer costs and a levelized cost of electricity (LCOE), the global LCOH of green hydrogen is projected to fall below 5 USD/kgH2 for solar, onshore, and offshore wind energy sources under both scenarios by 2030. To facilitate a quicker transition, the implementation of financial strategies such as additional revenue streams, a hydrogen/carbon credit system, and an oxygen one (a minimum retail price of 2 USD/kgO2), and regulations such as a carbon tax (minimum 100 USD/tonCO2 for 40 USD/MWh electricity), and a contract-for-difference scheme could be pivotal. These initiatives would act as financial catalysts, accelerating the transition to a greener hydrogen economy.

1. Introduction

Hydrogen, the most abundant element in the universe, is not typically found in its pure form in nature and must be produced using a variety of energy sources—renewables and fossil fuels [1,2]. Currently, hydrogen production utilizes a substantial amount of energy, corresponding to 275 Mtoe, or roughly 2% of the global total primary energy demand. The majority of this energy comes from natural gas, with a significant portion directed towards the synthesis of ammonia and methanol [3]. Although such consumption is substantial, it is a mere fraction of what would be necessary if a transition to a widespread hydrogen-based economy were to be achieved, as the International Energy Agency (IEA) has suggested a significant increase in hydrogen use by 2050—250 Mt H2 in the Announced Pledges Scenario (APS) up to 520 Mt H2 in the Net Zero Emission Scenario (NZE)—highlighting hydrogen’s growing role [4,5]. Given that producing hydrogen from fossil fuels is typically the most cost-effective option [4,6], it contributes approximately 830 Mt CO2 annually, equivalent to Indonesia and the United Kingdom’s combined emissions [3,7]. According to the IEA, the levelized cost of hydrogen (LCOH) derived from natural gas ranges from 0.50 to 1.70 USD/kg, depending on regional gas prices [4]. When combined with carbon capture and storage (CCS) technology, this may rise to between USD 2.1 and USD 2.6; however, the viability of CCS implementation on a significant scale for hydrogen production remains uncertain [8]. By contrast, Kumar et al. [9] highlight that electrolysis-based hydrogen production is approximately five times more expensive than established technologies for grey hydrogen.
Given the emission concerns, the uncertainties about CCS that influence blue hydrogen’s cost, and the anticipated rise in natural gas prices by 2050 that would elevate grey hydrogen prices [10], the decarbonization of hydrogen production necessitates a transition from reforming and gasification to renewable energy-powered water electrolysis. However, the current cost disparity between hydrogen produced via water electrolysis (green hydrogen) and that obtained from unrestricted fossil fuels (grey hydrogen) is a significant barrier to the widespread adoption of low-carbon hydrogen technologies [11,12,13]. Closing the cost gap will be important to establish a sustainable hydrogen economy, necessitating concentrated efforts to reduce production costs. The cost of renewable hydrogen is predominantly determined by the cost of electricity [12,14,15,16,17,18], the amount of capital required for electrolysis [16,19,20,21,22,23,24,25,26,27], and the efficiency of the electrolyzer [19,28,29,30]. Even under optimistic assumptions, assuming perfect electrolysis efficiency and no equipment capital costs, the electricity price would need to be low, not exceeding 47 USD/MWh, in order to attain a competitive production cost of 1.6 USD/kg [8]. Consequently, the price of electricity is crucial in determining the economic viability of renewable hydrogen relative to fossil fuel alternatives. However, the significant decline in the cost of renewable energy sources over the past few years offers a promising outlook for the economic viability of producing green hydrogen [31]. This positive trend can be further strengthened with the additional cost decline of electrolyzers, and when combined, provides the possibility of a more cost-effective path to scale up the production of renewable hydrogen and enhance its competitiveness as a sustainable energy solution.
This study aims to first examine the current status of the production and associated costs for green hydrogen globally, then to derive cost projections for the future. Within this aspect, specific countries will be selectively examined based on their respective levels of hydrogen adoption to create a more nuanced projection, followed by a discussion of strategic measures that can be implemented promptly to enhance the competitiveness of green hydrogen relative to grey hydrogen. In order to place this research in the current landscape, first, the status of electrolyzers is surveyed, followed by a review of the methods and the results of studies that have made similar efforts in the past. The following sections present this review. Subsequently, the selected methods for this study and its results are described.

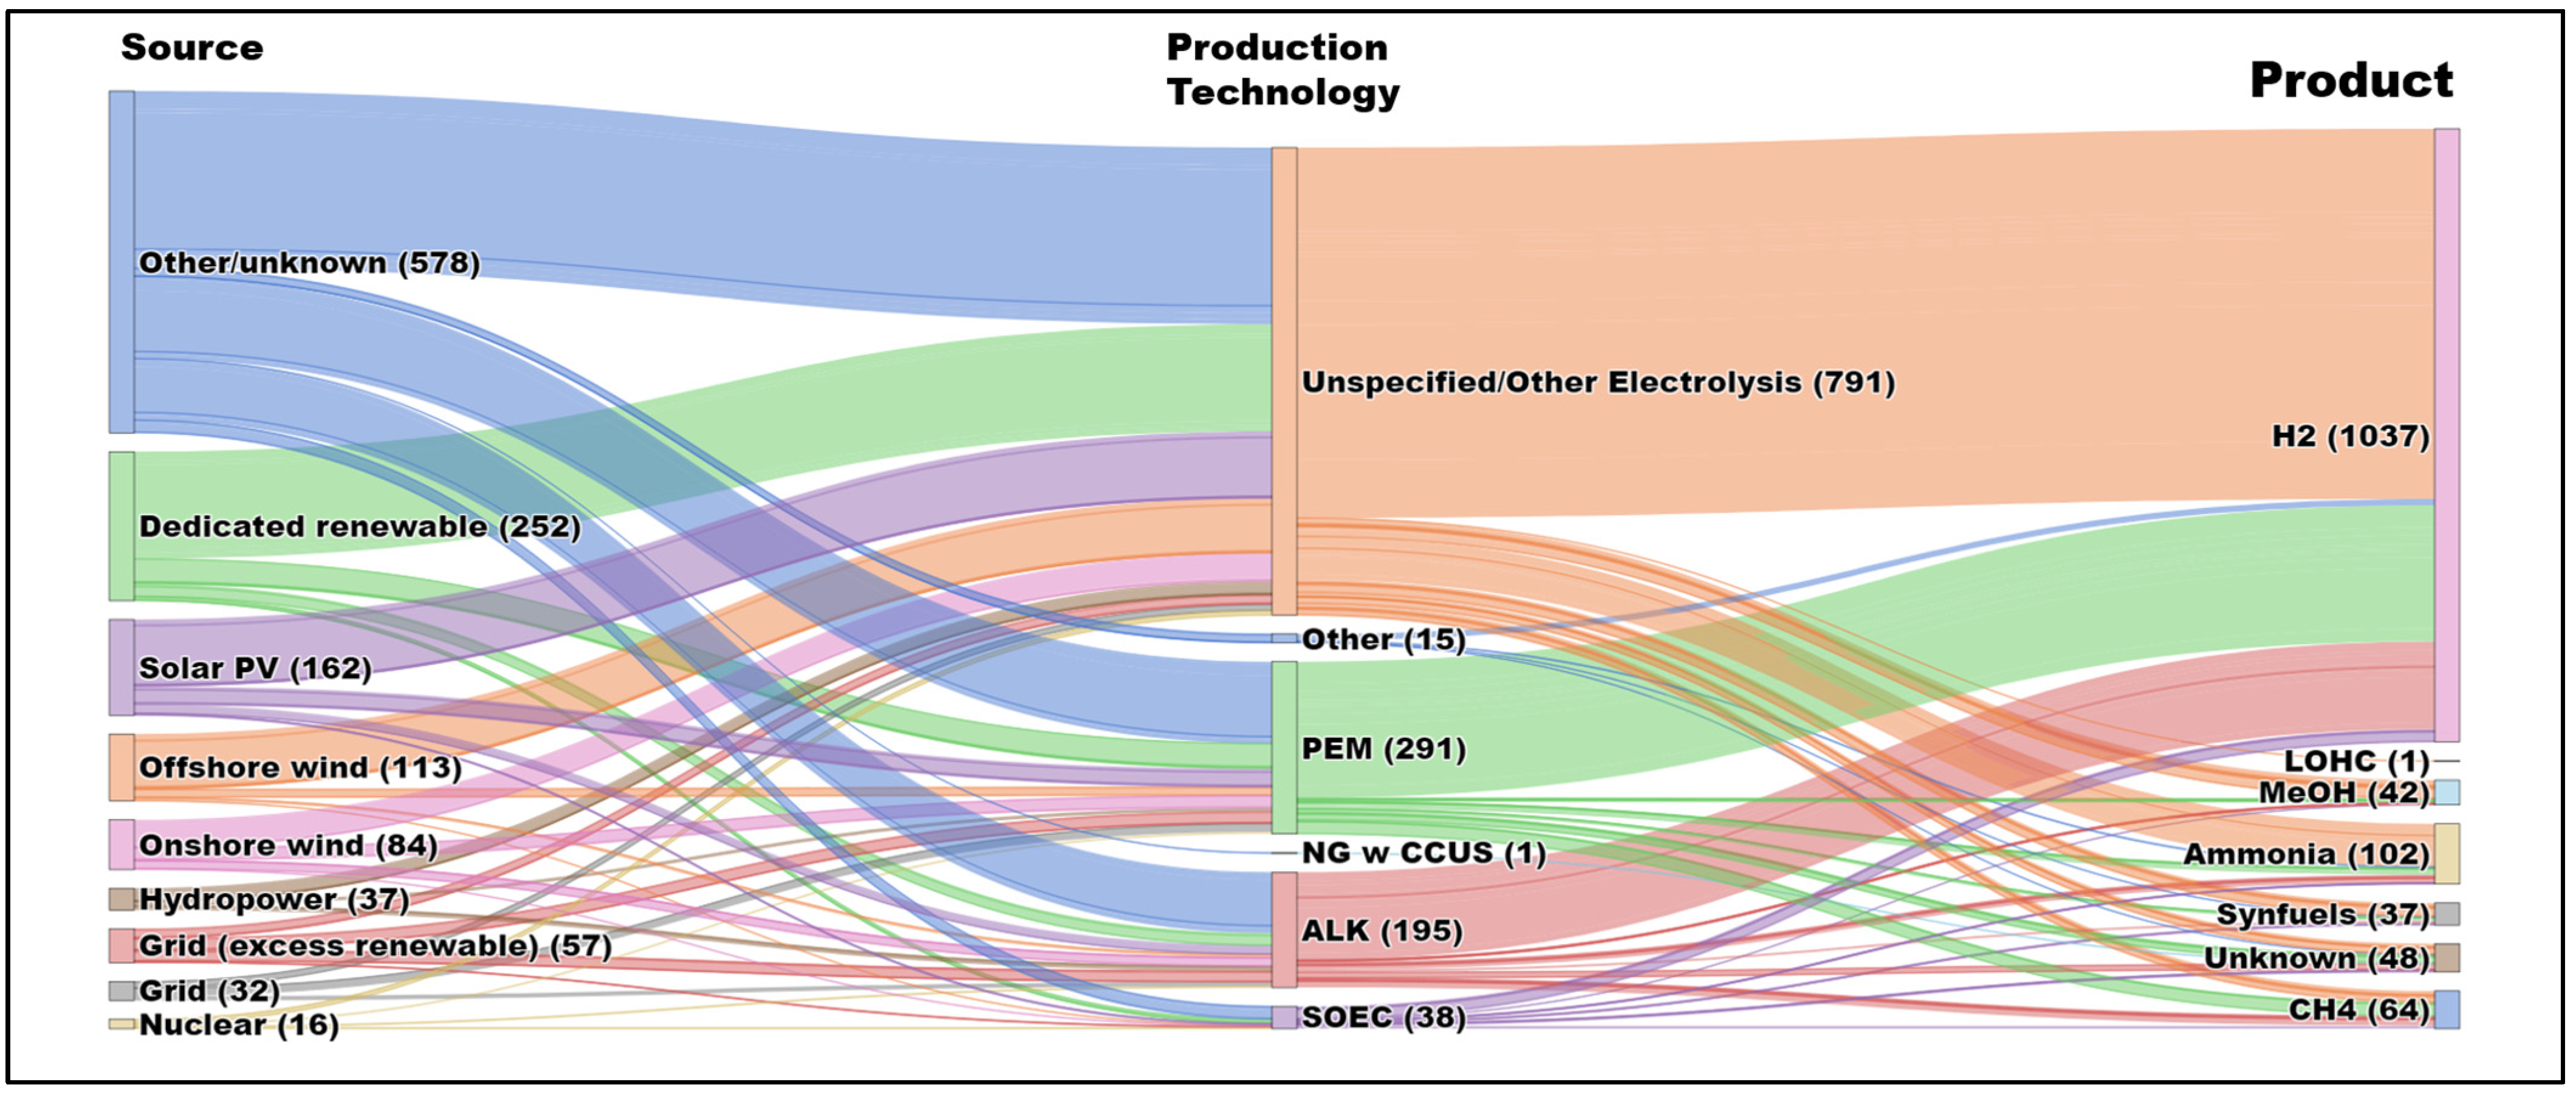
Current Status of Hydrogen from Electrolysis and Its Costs

The IEA’s database of announced hydrogen projects [32] is used here (as the available database with the widest coverage) to examine the global distribution of potential and current hydrogen projects and end uses, some of which—hydrogen and ammonia—can be utilized as large-scale storage capacities for the power sector. These solutions are crucial for balancing seasonal variations in renewable electricity availability and consumption, further reducing reliance on fossil fuels [4]. Figure 1 depicts the findings derived from this database, revealing that 1037 of the identified 1331 projects primarily focus on delivering hydrogen as a final product. The remaining projects involve the utilization of hydrogen in a variety of applications, such as ammonia, CH4 (methane), LOHC (liquid organic hydrogen carrier), and MeOH (methanol). The specific electrolyzer technology employed in many of these projects remains obscure, as approximately 60% of the identified projects utilized “other electrolysis” technology. This observation pins the uncertainty about which electrolyzer will dominate the future electrolysis market despite many scholars’ optimism regarding the potential of Solid Oxide Electrolysis Cells (SOEC) [15,16,33,34]. However, it is important to note that approximately 22% of the projects rely on PEM electrolyzers and 14% on alkaline electrolyzers, and these projects will be used in the current analysis.

2. Literature Review

Modeling Cost Reduction Potential in Electrolyzer Systems

Bohm et al. [34] evaluated the costs of various electrolyzer technologies in 2020 using a component-based analysis that accounted for generalized learning rates of 0.05 and 0.08 for technology-independent and technology-determinant components, respectively [34]. It was determined that the learning rates for alkaline, PEM, and SOEC electrolyzers were 18.8%, 18.0%, and 28.0%, respectively, assuming cumulative production capacities of 20 GW, 1 GW, and 0.1 GW. Expanding on previous research, the authors examined cost estimates for large-scale power-to-gas systems (>50 MW) while taking scaling effects into account [15]. Using component-based strategies and technological learning was demonstrated to potentially reduce capital expenditures by 30–75%, based on a capacity increase from 5 MW to 50 MW [15]. Under a high deployment scenario, the study predicted a rise in total electrolyzer production from 21.1 GW to 4530 GW, with a production share distribution of 20%, 40%, and 40% for alkaline, PEM, and SOEC technologies, respectively [15].
In a 2017 study, Schmidt et al. [35] compiled the views of ten experts from academia and industry on the prospective capital costs, lifespan, and performance of alkaline, PEM, and SOEC technologies. The study indicated that increased R&D funding could result in capital cost reductions ranging from 0% to 24%, while production increases could affect capital costs by 17–30%. Since 2002, learning rates for capital cost development have been estimated at 18 ± 13% for alkaline, 18 ± 2% for PEM, and 28 ± 15% for SOEC electrolyzers (median values due to relatively small sample sizes) [35]. The experts predicted a preferred transition towards PEM systems between 2020 and 2030 in order to effectively integrate renewable technologies. SOEC may become preferable by 2030, achieving competitive costs and lifetimes, albeit with greater uncertainty [35].
Schoots et al. [36] conducted a study on the learning curves of three methods for producing hydrogen: steam methane reforming (SMR), coal gasification, and electrolysis. The researchers utilized cost data encompassing the years 1940 to 2007, as well as corresponding global hydrogen production totals. The results revealed an 18% learning rate with a relatively large uncertainty range of 13% [36]. However, the analysis revealed a low R2 value of 0.2, indicating that the learning curve model has limited explanatory power.
Saba et al. [37] conducted a comprehensive study of the investment costs associated with Power-to-Gas technology over a 30-year period, concentrating on data from 2001 to 2010 for alkaline and PEM electrolyzers. The study highlighted the prevalent issue of insufficient data for comprehensive system comparisons, primarily resulting from a lack of data such as system size and gas conditioning. Different technologies, capacities, and installation years can lead to substantial variances in cost estimates [37]. According to their projections, the range of investment costs for these technologies will converge to between 397 and 940 USD/kW by 2030 [37].
Reksten et al. [38] analyzed the prospective costs of alkaline and PEM electrolyzers in 2022 using a modified power law, taking system size and installed capacity into consideration. The study identified learning rates of 25.1% and 36.4% for alkaline and PEM electrolyzers, respectively, and predicted a significant reduction in the CAPEX gap between these technologies by 2030, particularly for 1–10 MW capacity facilities, and beyond which only modest cost reductions were anticipated [38].
Glenk et al. [31] examined the viability of green hydrogen production in Germany and Texas by extending cost information for alkaline and PEM electrolyzers from 2003 to 2030. Using diverse sources, the study noted yearly cost reduction rates of 2.96 ± 1.23% and 4.77 ± 1.88% for alkaline and PEM electrolyzers, respectively. The research indicates that green hydrogen, which is presently priced at approximately 3.4 USD/kg, is cost-competitive in certain sectors but not for large-scale industrial supply. Following current market trends, the price may fall to 2.6 USD/kg in the coming decade [31].
In a study analyzing the Danish electricity market, Panah et al. [16] examined three electrolyzer technologies based on three scenarios and a Monte Carlo simulation that accounted for a 5% fluctuation in electricity prices. The findings indicate prospective cost reductions in green hydrogen production of 33%, 34%, and 50% for the respective technologies, and up to 70% if subsidized. The SOEC technology demonstrated steeper cost reduction curves due to its higher efficiency, which makes it less vulnerable to expensive electricity. In addition, the study suggested that increasing production could reduce the price of hydrogen to below 3.15 USD/kg for alkaline and PEM electrolyzers and possibly below 2.1 USD/kg for all three technologies if taxes and levies were eliminated [16].
While cost reduction in developing technologies can be accomplished through three primary mechanisms—R&D, learning by doing, and economies of scale [39,40,41,42]—the existing body of the literature predominantly concentrated on individual factors that impact the cost reduction of electrolysis technologies. Nevertheless, certain studies did recognize the cumulative impact resulting from the interaction of multiple factors, notably economies of scale and technological learning, analyzing at most two factors concurrently, as summarized in Table 1. Although these studies offered valuable insights into particular facets of cost reduction, combined effects arising from all three factors simultaneously still remain as a research gap. In contrast to previous work, the current study employs a multifaceted methodology to capture the interaction of factors influencing the potential cost-reduction of electrolysis technologies. First and foremost, the element of time is considered in the assumption that technological advancements and enhancements occur gradually over extended timeframes; therefore, this study aims to comprehend the trajectory of cost reduction and future projections through a temporal analysis. While time does not cause cost-reduction directly, advancements take time to mature and be integrated into commercial technology. In addition, by analyzing the relationship between scale and cost reduction, this study seeks to estimate the rate at which future cost reductions can be anticipated, along with the technological learning rate, which is an integral component of this area of study. This study aims to provide quantifiable insights into the future rate of cost reduction by analyzing the concept of economies of scale and technological learning within the framework of temporal analysis. Importantly, this research derives rates of change, scaling effects, and learning rates from data retrieved from various sources in the literature. The details of the data collection methods and validation can be seen in Appendix A. This method aims to ensure the absence of biases and inaccuracies by avoiding reliance on assumptions and pre-determined values, and considering all three elements and utilization of the reported data without pre-assumption will potentially fill this research gap.

3. Materials and Methods

The main objective of this chapter is to estimate the long-term production costs of two matured electrolysis technologies for producing low-carbon hydrogen. The methodology includes two parts: electrolyzer cost projection and hydrogen-production cost estimation.

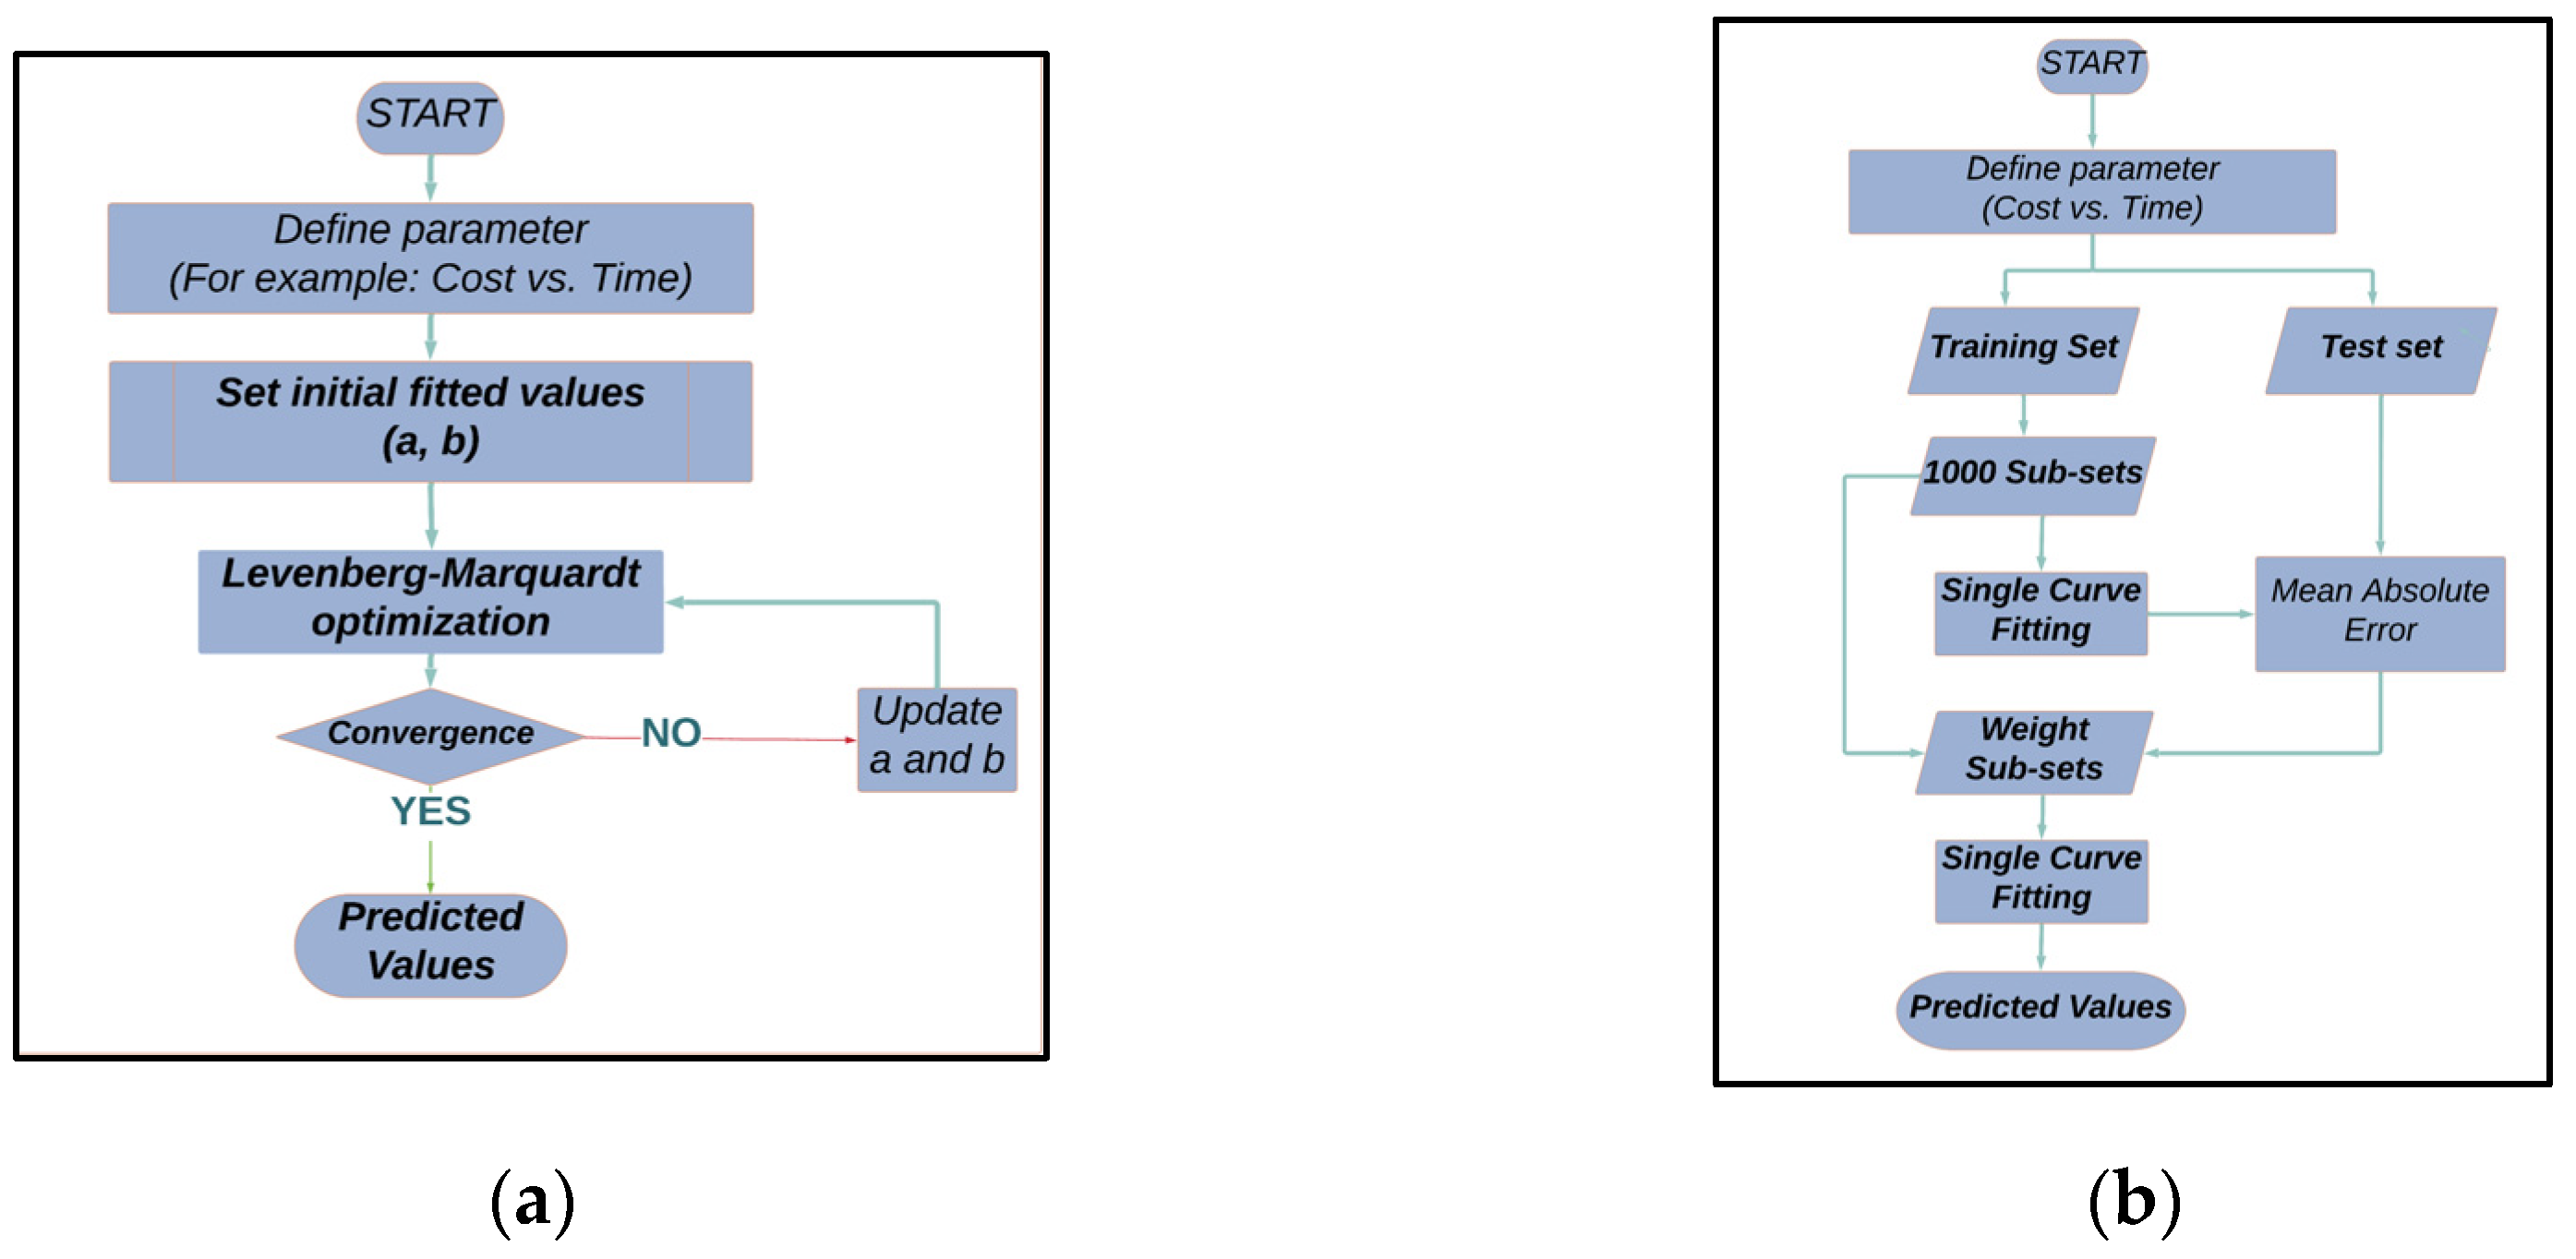
3.1. Projection Models

Two methods were used to compute the rate of change based on an exponential function, while the scaling effect and learning rate were calculated with a power function in order to comprehend the data’s trajectory, as described in Table 2. The first approach computes a general trend, whereas the second approach prioritizes data from the manufacturer. The general trend approach provides a broad perspective, encapsulating an overarching view of the entire dataset. However, its wide lens may inadvertently overlook specific nuances or intricacies associated with individual manufacturers or market segments. Conversely, the manufacturer-specific trend approach delves deep into data from a particular manufacturer’s standpoint, potentially unveiling patterns that broader analyses might miss. Yet, this method’s narrow focus could cause it to overlook more extensive, all-encompassing trends. The comparison of these two methods is therefore crucial. By examining the data through both lenses, the analysis ensures a comprehensive understanding by making any resultant interpretations or decisions more robust and well-rounded. In both methods, a curve-fitting exercise was performed to determine the trend of the parameters. On the basis of the visualization of these parameters, it was hypothesized that the data would follow the respective function, and the function was fitted to verify the data and to extract the fitted values.
As depicted in Figure 2a, the first approach, single curve fitting, entails undertaking the curve fitting exercise only once, regardless of the data category. On the other hand, the second method Figure 2b, double curve fitting, prioritizes manufacturer data by repeating the procedure more than once. With this approach, the original dataset was divided into two subsets: a training set and a validation set. The validation set comprised manufacturer data beyond 2018 and was applied to favor recent manufacturer data, randomly resampling one data point per year using bootstrapping with replacement to accommodate potential data variations. This resulted in the construction of 1000 subsets, generating a variety of potential outcomes. Iteratively, each subset was subjected to a single curve fitting to predict the validation set. The mean absolute error was then applied to weigh the overall score of each sub-dataset. Finally, the procedure of fitting a single curve was repeated to obtain the final trend of the cost data, which was more concentrated on the manufacturers’ data. This prediction method enabled a more reliable estimate of the annual rate of change for electrolyzer costs, as well as a better depiction of market conditions and the identification of potential patterns and trends that may not have been evident in a broader analysis. However, due to the availability of data, only cost parameters can be used with the double-curve-fitting method, while system size and installed capacity data are applied only in single curve fitting.

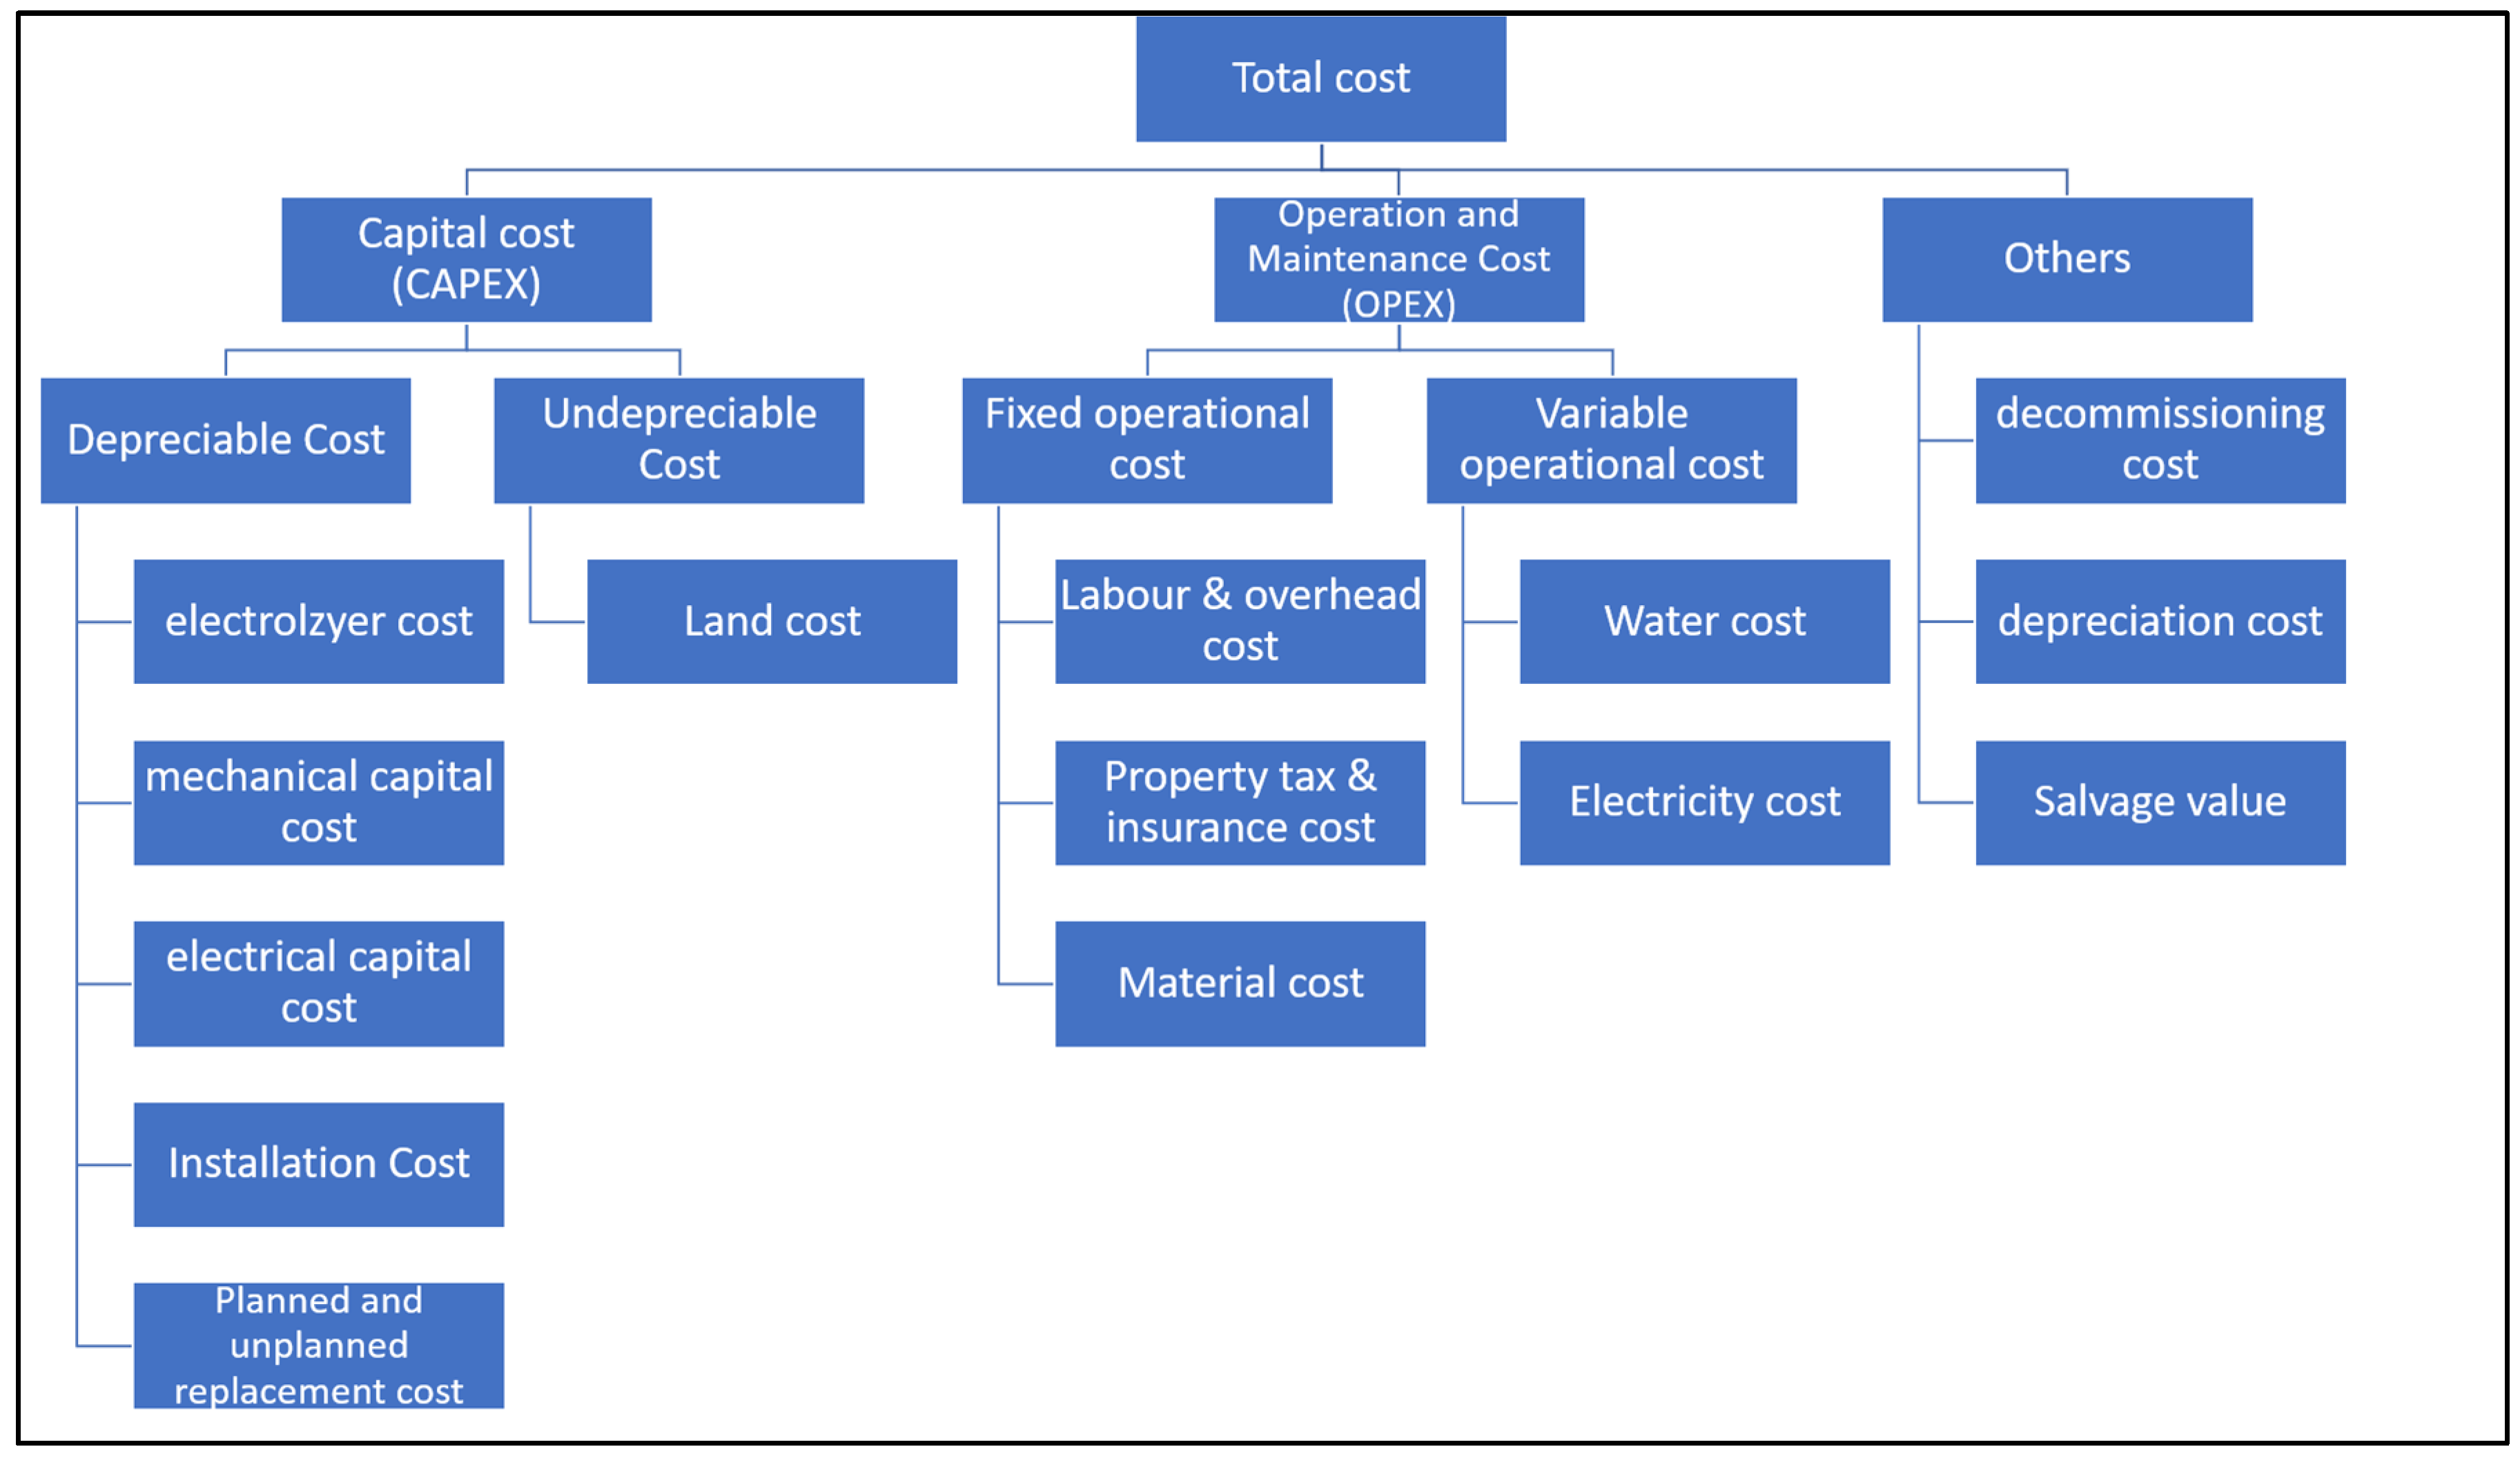
3.2. Levelized Cost of Hydrogen Calculation

The LCOH metric is the average cost per kilogram of hydrogen produced over a plant’s 21-year lifetime (including one year of construction and 20 years of operation), adjusting for inflation at a rate of 7% [43]. State and federal tax rates are considered to be 6% and 21%, respectively, although it is recognized that these will be affected significantly by jurisdiction [39]. A Modified Accelerated Cost Recovery System (MACRS) with a 15-year recovery period was utilized. The levelized costs consider multiple primary energy sources for electrolysis, with capacity factors of 17.2% for solar energy (2010–2021 data) [44], 34% for onshore wind energy (2018 data) [45], and 39% for offshore wind energy (2010–2021 data) [46]. The output from all renewable power plants is exclusively allocated to hydrogen production, thereby equating the capacity factors of both the power plants and electrolyzers. The computations, based on a daily production capacity of 50,000 kg and 13% oversized stacks to compensate for electrolyzer degradation [39], exclude additional compression and transportation costs, representing the production gate price. The composition of the total cost can be seen in Figure 3, and corresponding assumptions and formulae can be seen in Appendix B.
L C O H = n = 1 N C A P E X ( 1 + r ) n + O P E X ( 1 + r ) n + O t h e r s ( 1 + r ) n + L C O E n = 1 N M H 2 ( 1 + r ) n
where
LCOH = levelized cost of hydrogen;
CAPEX = total capital cost;
LCOE = levelized cost of electricity;
OPEX = total operating cost;
N = total plant life;
r = inflation rate.
Figure 3. Composition of the total cost for levelized cost of hydrogen calculation.
Hydrogen 04 00055 g003

3.3. Scenario Development

In conjunction with the projection of the LCOE, the electrolyzer cost projection model enables the development of both optimistic and pessimistic scenarios. These scenarios provide uncertainty regarding potential cost reductions and variations in the future development of renewable energy-based green hydrogen production facilities.
In the optimistic scenario, the decrease in electrolyzer cost is attributable to three major factors: the annual decline rate resulting from ongoing research and development (R&D) activities, scaling effects, and technological learning. These factors collectively contribute to electrolyzer technology advancements and cost reductions. Regarding the LCOE, predictions for renewable energy sources, excluding solar energy, are based on the historical average percentage change. This historical data provide a foundation for estimating the future trajectory of these sources’ LCOE. However, a different approach was adopted due to the significant decline rate observed in solar LCOE. The average percentage change in solar LCOE was calculated using the most recent three years of data, assuming that fluctuations during this time period were relatively stable. This approach disregards the rapid technological advancements and cost reductions observed in solar energy technologies in earlier years as recent data are more representative of the current and future state of the industry, where fluctuations have been relatively stable while the decline in earlier years was drastic.
There is no consensus among R&D activities, scaling effects, and technology learning as to which will be the major cost driver [35,47]; however, in this analysis, R&D was assumed to be a prerequisite to reducing cost and improving technology [37,48]. Therefore, in the pessimistic scenario, the cost reduction of electrolyzers is entirely attributable to R&D, excluding scaling effects and technological learning. In addition, the pessimistic scenario implies that the levelized cost of energy (LCOE) for various renewable energy sources remains stable. The most recent annual data were used to maintain constant values for future LCOE predictions. While it could be argued that more pessimistic cost scenarios could be developed by predicting or extrapolating cost increases, this was not considered here as it would be against the typical trend of technology cost development. The creation of optimistic and pessimistic future scenarios allows for a comprehensive range of the future trajectory of LCOH.

4. Results

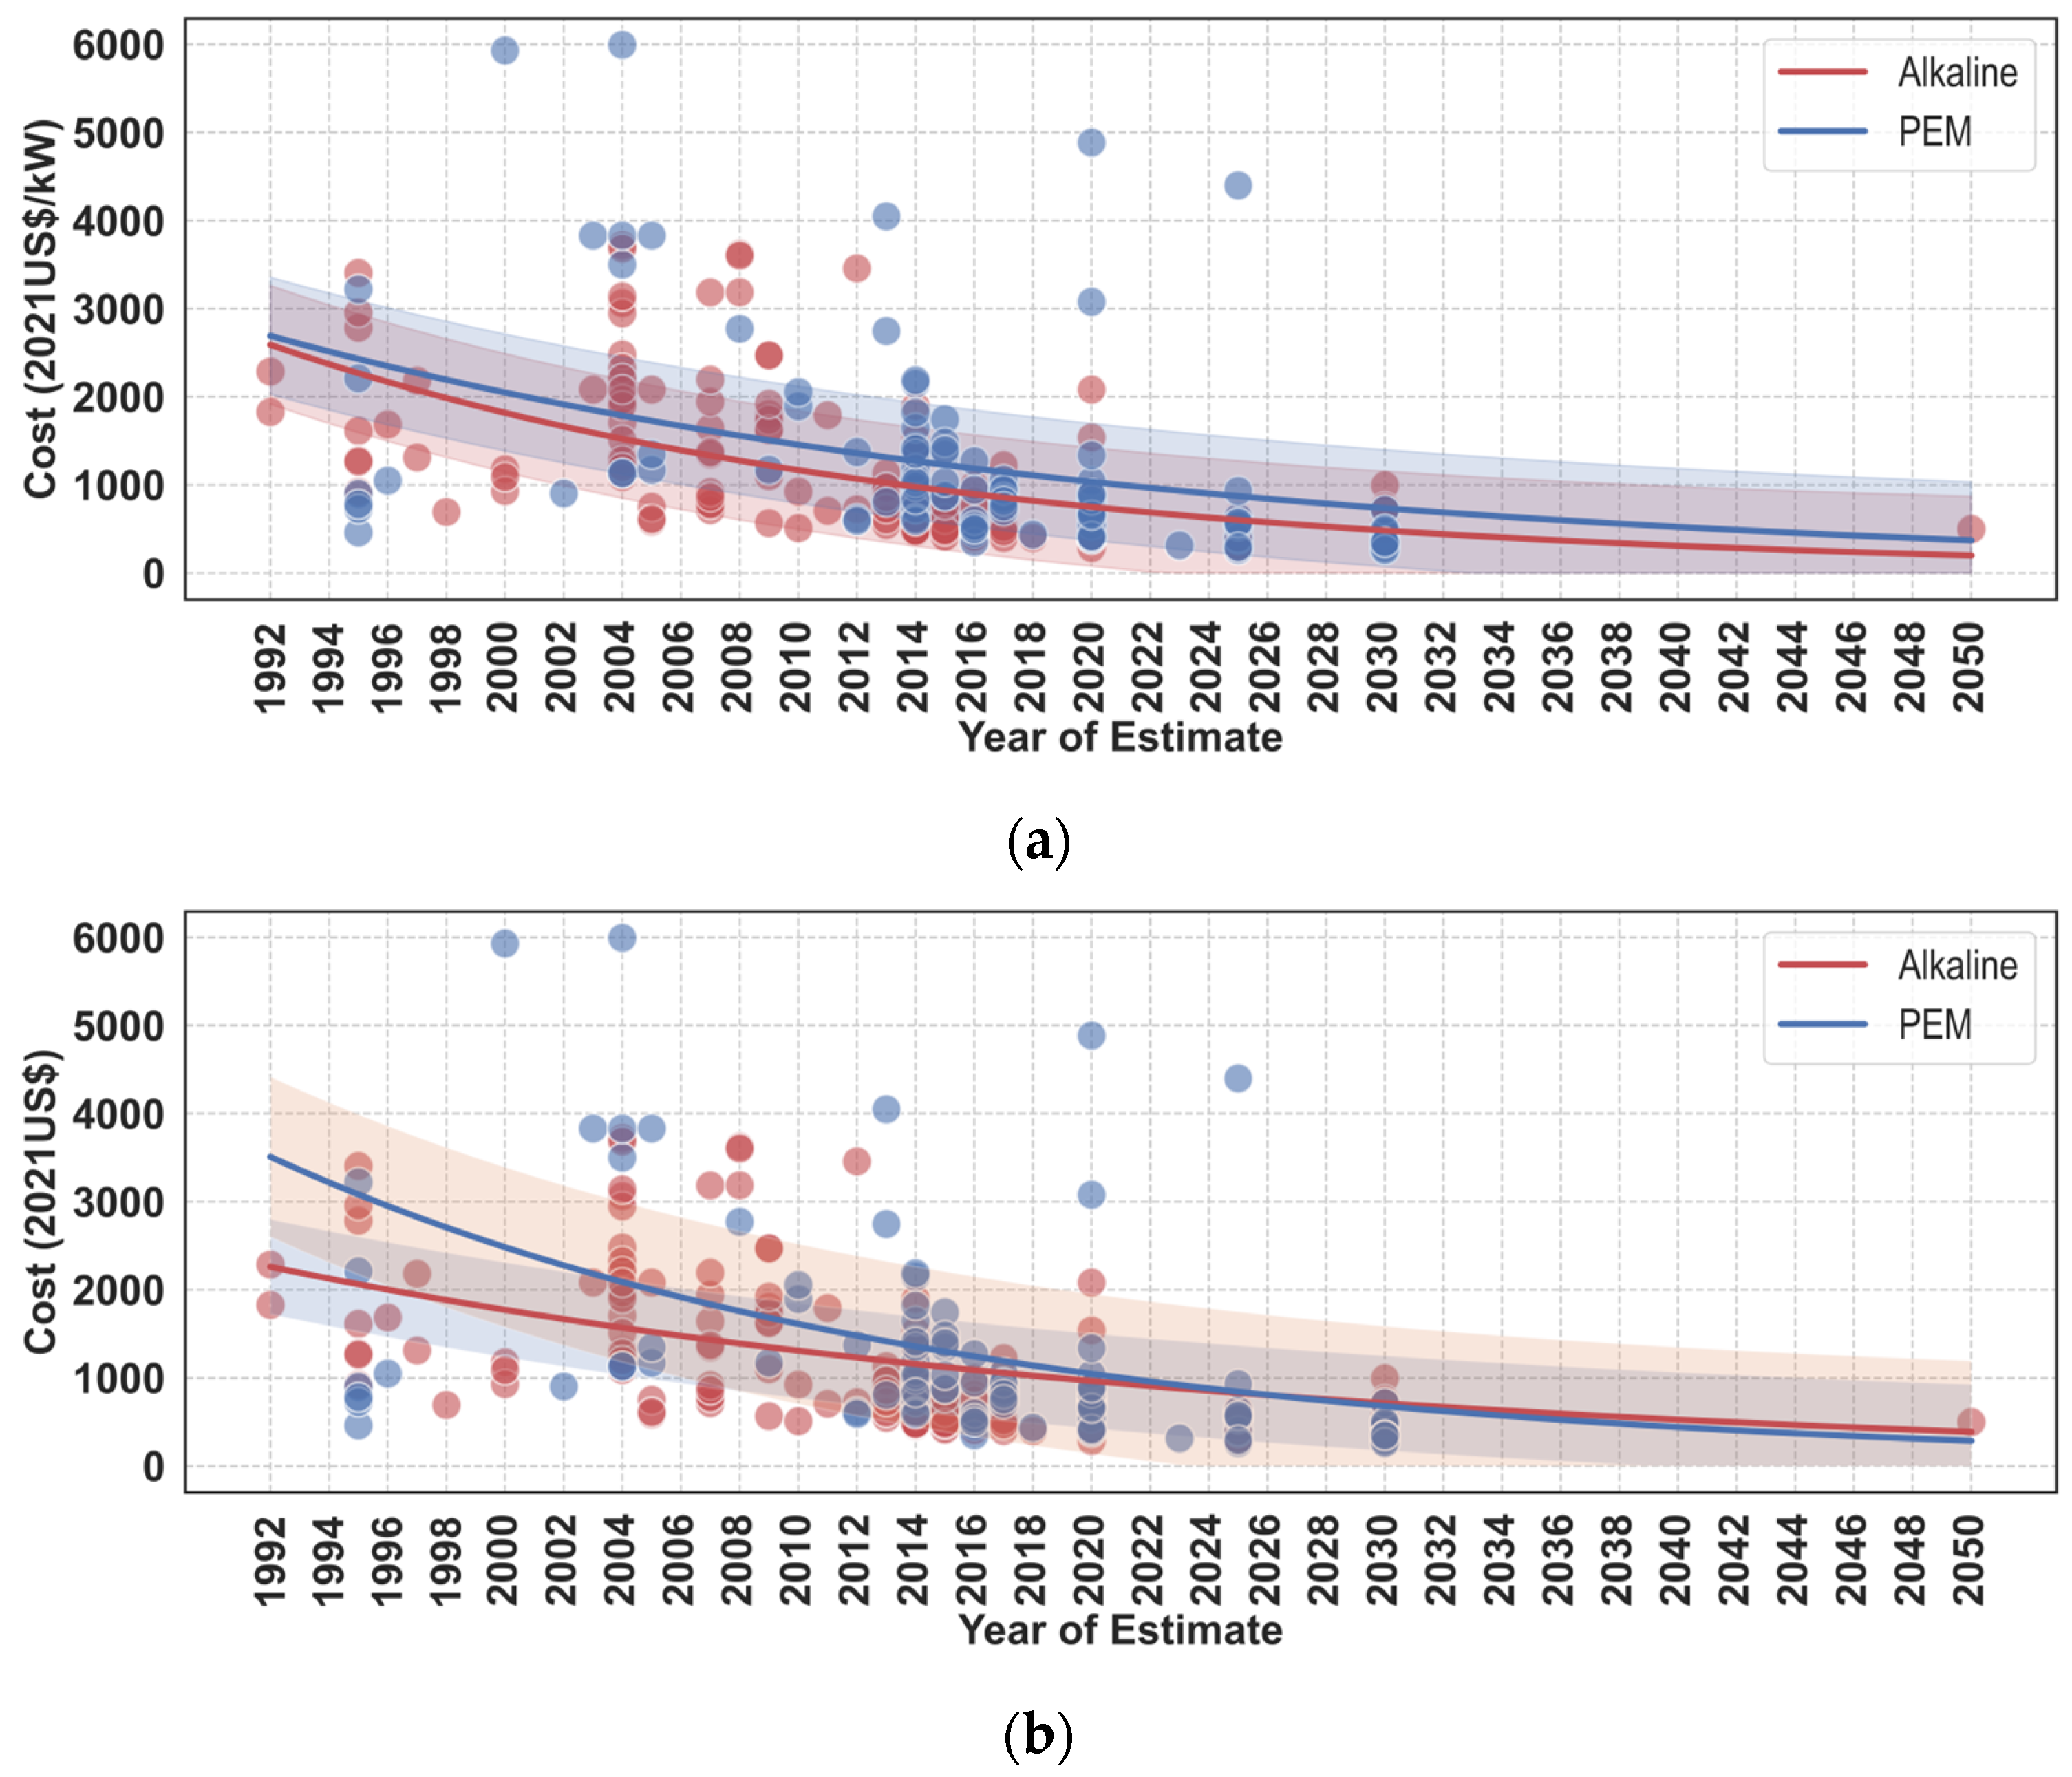
4.1. Cost Projection of Alkaline and PEM Electrolyzer

4.1.1. Yearly Decline Rate: Impact of R&D over Time

The analysis showed varying estimated costs and decline rates for alkaline and PEM electrolyzers, as determined by the two different methodologies (Figure 4). The single-curve-fitting method forecasted a faster decline rate (4.4%) (R2 = 0.32) for alkaline electrolyzers, predicting a cost of 199 USD2021/kW by 2050, which was significantly lower than the 388 USD2021/kW projected by the double-curve-fitting method with a 3% decline rate (R2 = 0.047). The possibility of this optimistic bias in the single-curve-fitting method could be due to its reliance on a larger pool of alkaline cost data points from academic articles. The dynamics of PEM electrolyzers were different, with the double curve fitting method predicting a higher decline rate of 4.3% compared to the single curve method’s 3.4%, indicating a faster-anticipated cost decrease. This method estimated a reduced cost of 286 USD2021/kW by 2050 compared to the single curve method’s estimate of 371 USD2021/kW. Nonetheless, it had a lower R2 score of 0.016, indicating that it correlates less with overall historical data than the single curve method’s R2 score of 0.16.
A higher R2 value suggests that the single curve fitting procedure may be superior at capturing the trend underlying the historical data. However, it is crucial to exercise caution and avoid relying solely on the R2 score as an indicator of superior predictive performance. In the case of the double-curve-fitting method, the emphasis on manufacturer data tends to increase the difference between the predicted values and the entire historical data set. Consequently, despite the fact that it may result in a lower R2 score, it provides a potentially closer depiction of the actual market landscape. Moreover, considering previous studies indicating that PEM electrolyzers will likely surpass alkaline electrolyzers in terms of market dominance and market share, further analysis was based on the double curve fitting method’s results. These variances in projected cost declines of the two methodologies highlight the complexity and inherent uncertainty of estimating the future costs of these relatively low TRL technologies. The disparities in cost projections and decline rates between the methodologies for alkaline and PEM electrolyzers exemplify the research gap necessary to bridge academic research and market realities in order to increase the accuracy and relevance of predictions, inform policy decisions, and facilitate the development and adoption of electrolyzer technologies in an evolving market.

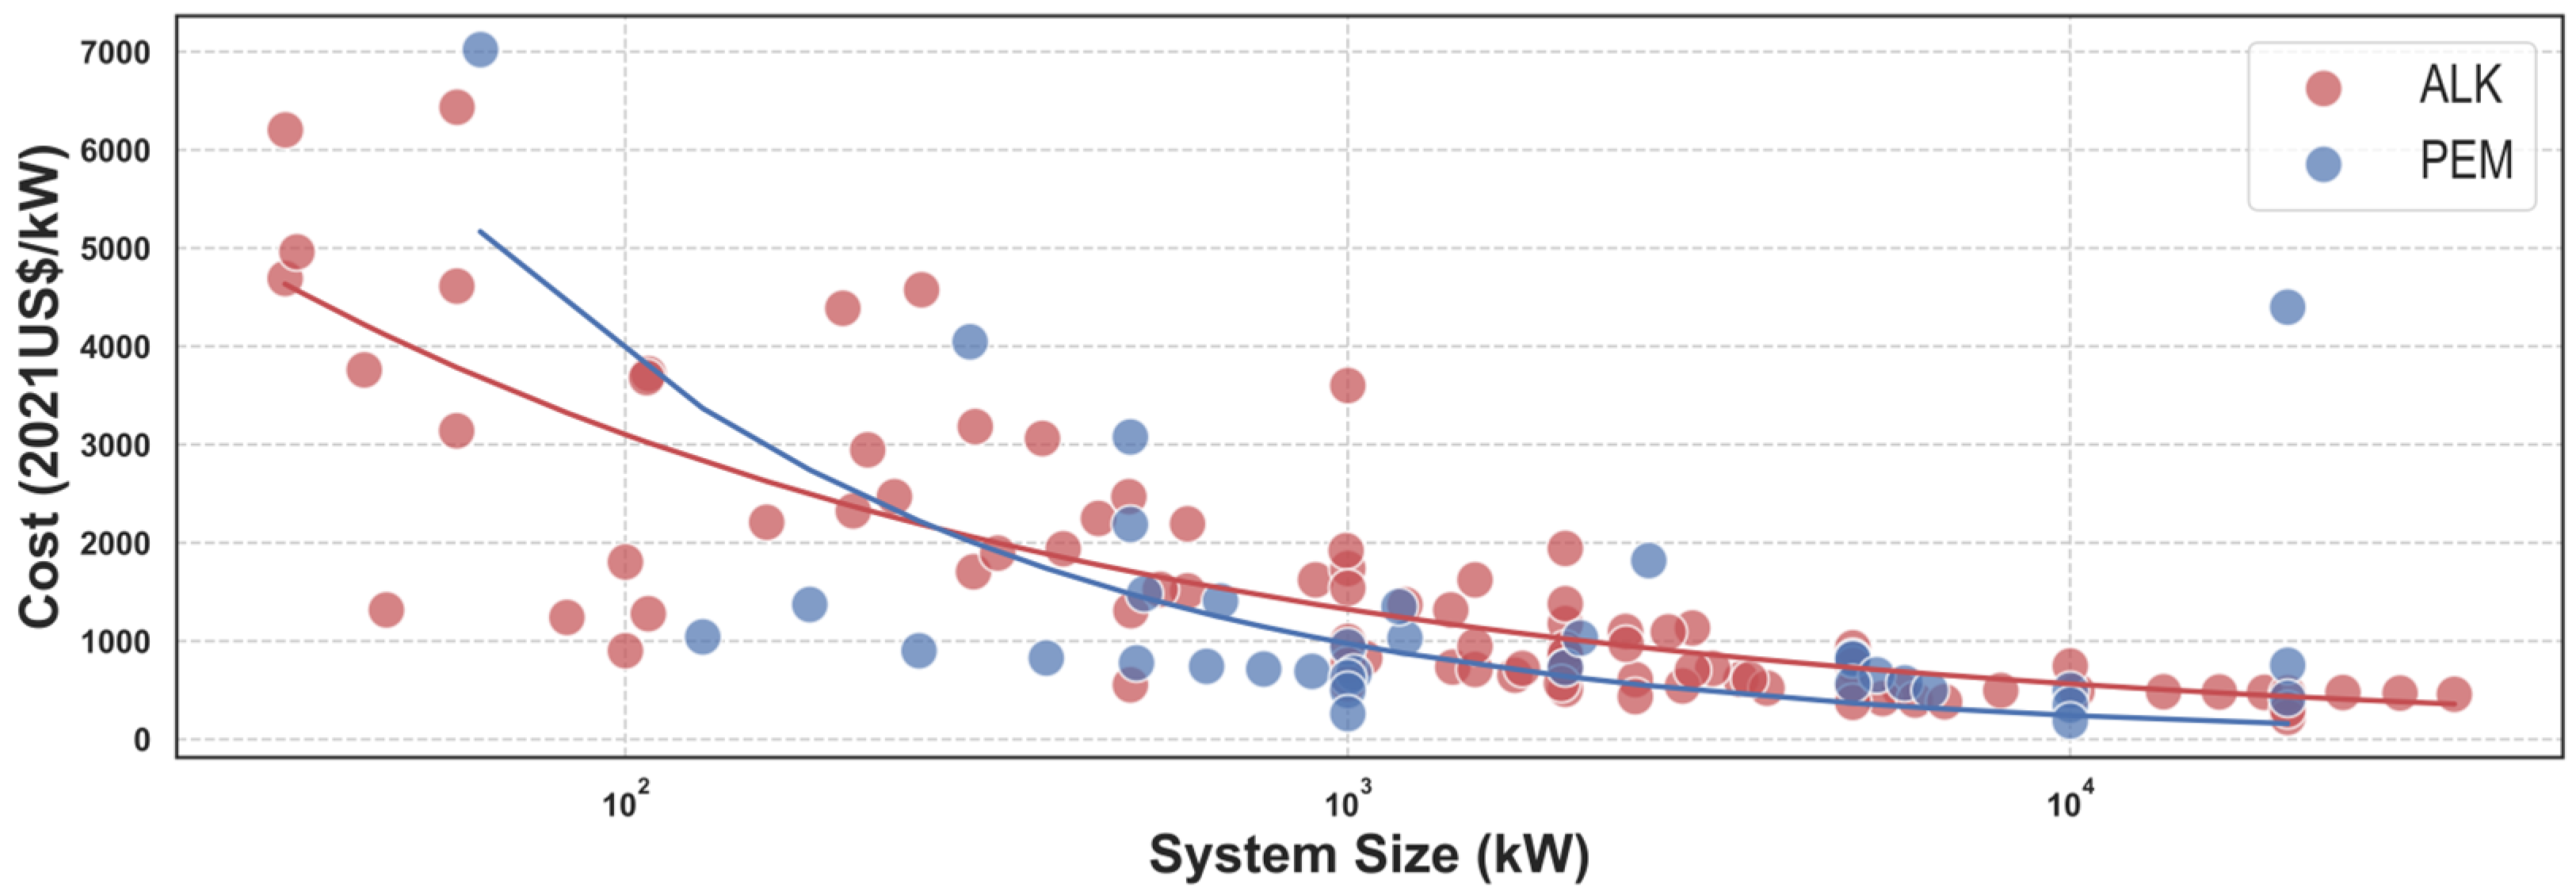
4.1.2. Scaling Effect

Figure 5 illustrates the scaling effects on alkaline and PEM electrolyzers, showing a correlation between system size and costs. The former exhibited a stronger economy of scale with a 0.37 scaling factor and a 0.64 R2 value, implying that cost decreases as the system expands. Conversely, PEM electrolyzers had a 0.6 scaling factor and a 0.33 R2 value, indicating a slower rate of cost reduction as the scale increases.
Both alkaline and PEM electrolyzers benefit from economies of scale, but alkaline electrolyzers, being a more mature technology with established production processes, show a faster cost reduction rate when scaled up. On the other hand, PEM electrolyzers, still in the process of fine-tuning their production, witness a comparatively moderate rate of cost reduction, although it is not expected to persist indefinitely. Previous analysis has claimed that the impact of scale on alkaline systems is primarily visible at capacities lower than 0.5 MW, with subsequent diminishing cost reductions at higher scales [49]. In a more detailed study conducted by [15], for smaller-scale systems, the mean scale factors were found to be approximately 0.69 for alkaline systems and 0.72 for PEM systems. Conversely, larger-scale systems exhibited scale factors exceeding 0.9. Those ranges indicate a gap in value, particularly for alkaline electrolyzers; however, the calculated scaling factor applies uniformly across the various ranges of system sizes. The obtained scaling factor by this study is consistent with those reported in the literature for chemical plants, especially for PEM electrolyzers [15,50].

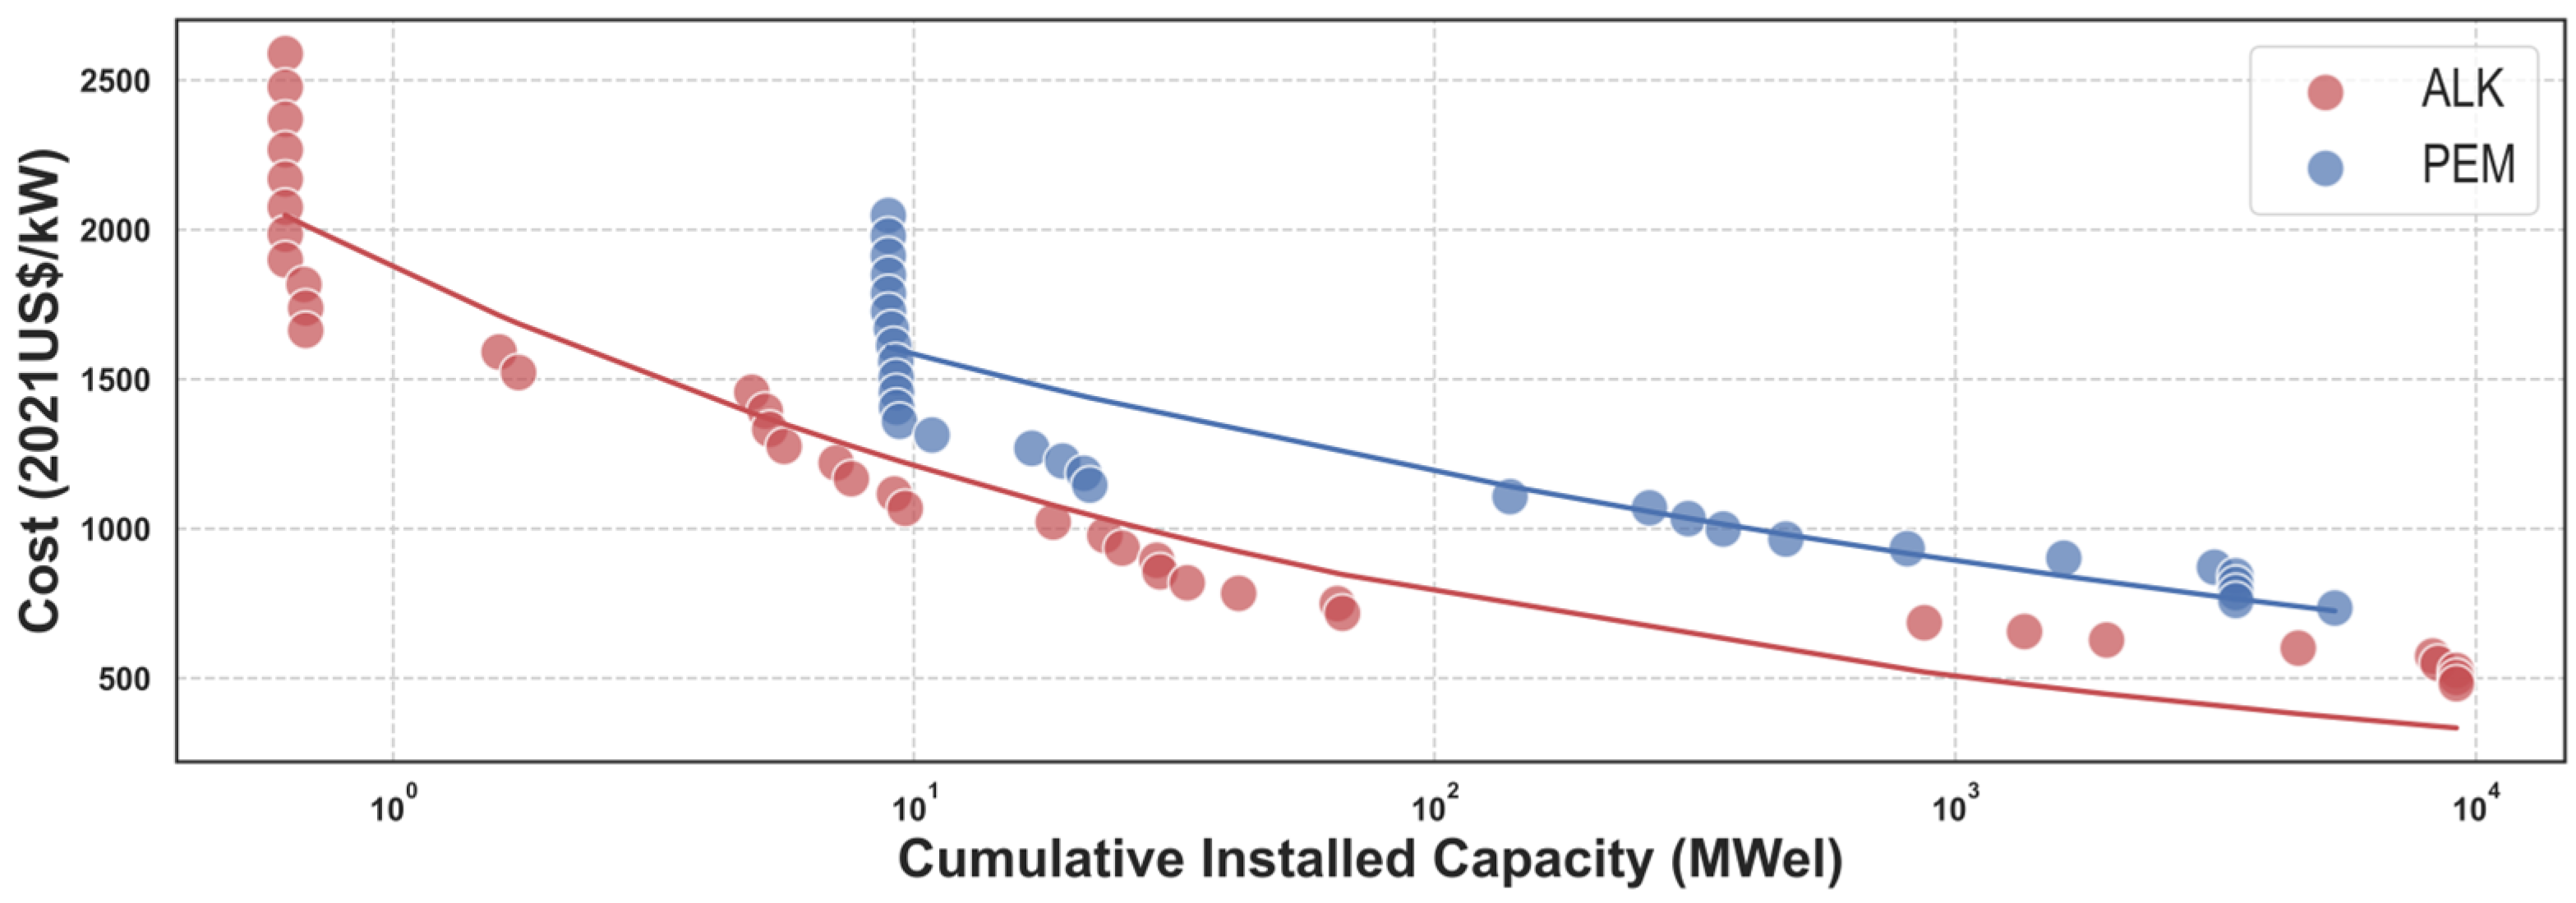
4.1.3. Learning Rate: Impact of Learning by Doing

The technological learning rate, which gauges cost reductions as production and experience increase, is commonly represented by learning curves. Applying the double-curve-fitting method lowered the learning rate to 8% but enhanced the data fit, as indicated by a higher R2 score of 0.918. Conversely, for PEM electrolyzers, this method slightly raised the learning rate to 10%, albeit with a decreased R2 score of 0.763. Figure 6 suggests that alkaline electrolyzers may have a higher learning rate below a 1 MW capacity, while PEM electrolyzers excel up to 10 MW. Beyond these points, learning rates and cost reductions slow down, aligning with typical technological learning patterns where advancements are more prominent during early technology phases and lead to diminishing returns as technologies near their potential efficiency and cost limits. However, the resulting learning rate was averaged on the timeline of 1992 to 2050, which is why it was comparatively lower than those from previous studies, as summarized in Table 1.

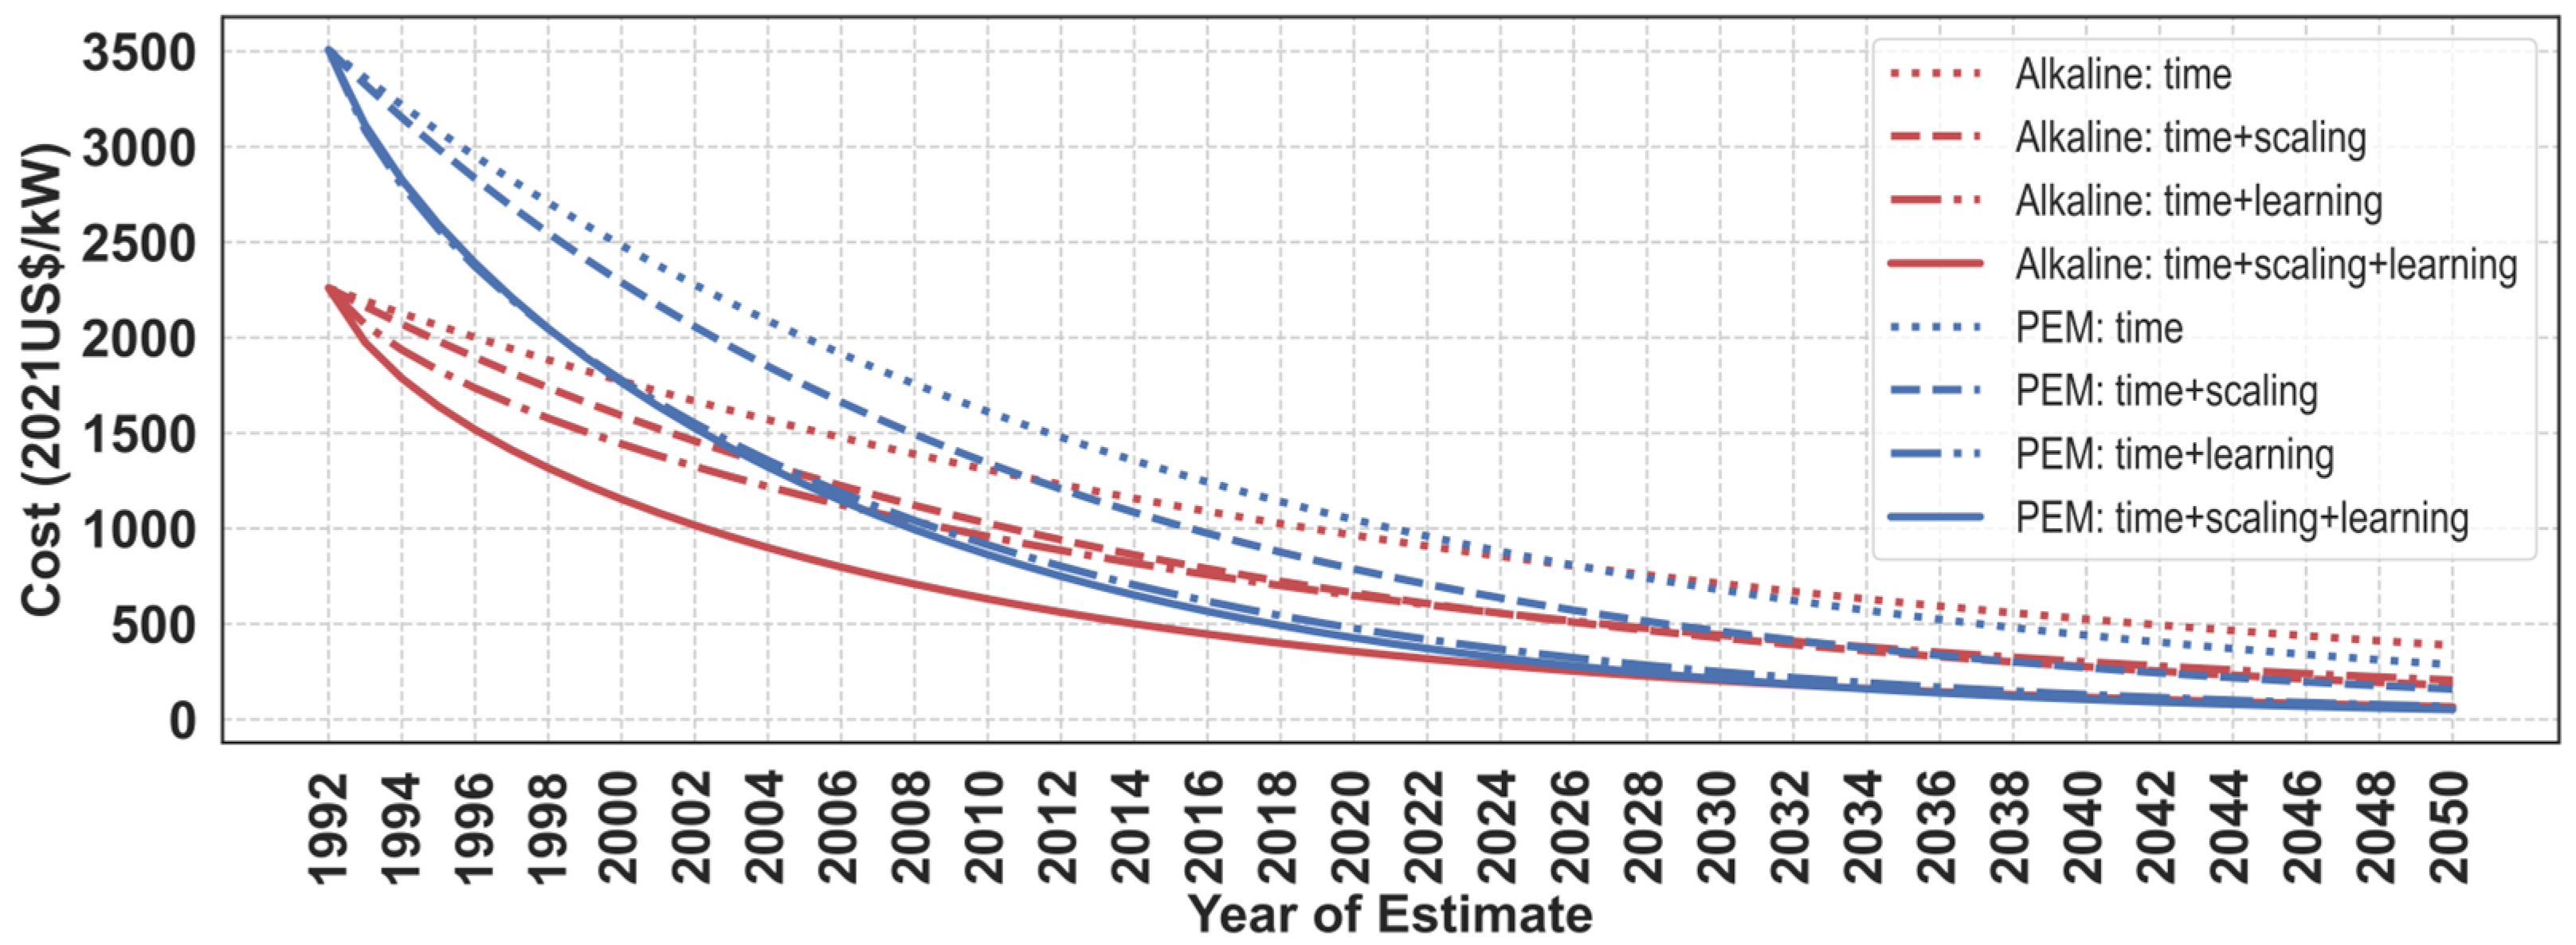
4.1.4. Maximizing Electrolyzer Cost Competitiveness: The Synergistic Effects of R&D-Time, Economies of Scale, and Learning by Doing

As shown in the literature review, evaluating the cost reduction potential for electrolyzers is essential to comprehending their economic viability and comparative advantage. The emergence of cost reduction over time is a combination of several influences, such as the advancements realized through research and development (R&D) initiatives, the implementation of the economies of scale principle, and the enhancements accrued through the production experience advancements. Nevertheless, R&D activities over time are assumed as the prerequisite for cost reduction, while the economies of scale and technology learning have compounding effects for further reduction.
Scaling effect: This principle demonstrated a 54% cost reduction for alkaline and a 44% cost reduction for PEM electrolyzers when combined with R&D initiatives. This suggests that alkaline electrolyzers benefit more from economies of scale than PEM electrolyzers.
Learning by doing: Combined with R&D activities, this component can reduce alkaline electrolyzer costs by 47%, while PEM electrolyzer costs can be reduced by 76%. This indicates that while both technologies stand to benefit from technological advancement, the effect will be more pronounced for PEM electrolyzers, which are anticipated to account for a larger share of installed capacity.
The potential for cost reduction for alkaline electrolyzers was calculated at 77%, and for PEM electrolyzers, it was 79%, as shown in Figure 7, when both the scaling effect and technological learning were considered in addition to R&D activities. This equates to a cost in 2050 reaching 88 USD2021/kW for alkaline and 60 USD2021/kW for PEM. These remarkable cost reductions highlight the synergistic effects of economies of scale, production experience gains, and the temporal dimension of R&D activities. The findings indicate that alkaline and PEM electrolyzers have substantial potential for cost reduction, with the PEM taking over its counterparts eventually, as in Table 3. Continuous investment in R&D initiatives, an expansion of production scale, and accumulated production experience can substantially enhance these technologies’ economic competitiveness. Table 4 presents a comparative analysis between the findings of previous studies and the present study, concentrating on projected values for the year 2030. The cost ranges derived from the current study are broadly similar to those reported in earlier studies, although the upper range of both electrolyzer types is higher than in other studies. This analysis predicts that PEM systems will eventually become more affordable than alkaline systems.
The potential for cost reduction discussed in this article is contingent on particular scenarios, including a specific incline rate and projection of system size and installed capacity. These forecasts affect the eventual cost reduction potentials for alkaline and PEM electrolyzers, which result from the projection data of system size and installed capacity. In the scenario developed for the scaling effect, based on the temporal projection of the electrolyzer size and the installed capacity it was predicted that the incline rate for system size would be 6% for alkaline electrolyzers, increasing to 70 MW, and 3% for PEM electrolyzers, increasing to 15 MW. A 10% incline rate for installed capacity was assumed for technological learning, increasing to 7 GWel for alkaline electrolyzers, and 20% for PEM electrolyzers, increasing to 70 GWel. The detailed projection, uncertainty ranges, and comparison with other studies can be seen in Appendix C. These specified incline rates, terminal system sizes, and installed capacities represent the anticipated technological advancements, market expansion, and experiential gains until 2050. Nevertheless, it is essential to recognize that these scenarios are theoretical constructs that will not perfectly reflect future realities. These rates and, consequently, the actual cost reduction potentials of alkaline and PEM electrolyzers may be affected by technological breakthroughs, market dynamics, regulatory policies, and other variables. Nonetheless, these scenarios provide insights into these technologies’ potential development and cost competitiveness in the emerging hydrogen economy.

4.2. Future LCOH Outlook

4.2.1. Projection of Global Levelized Cost of Hydrogen

Figure 8 provides a comparative analysis of the global LCOH trajectory from 1992 to 2050 using alkaline and PEM electrolyzer technologies, considering three renewable energy sources, offshore wind, solar, and onshore wind, under various scenarios. The data show a decline in LCOH across all sources, indicating growing cost-effectiveness in hydrogen production, with solar energy showing a significant drop due to technological advancements. Initially, PEM electrolyzers had higher LCOH values compared to alkaline electrolyzers, highlighting the latter’s cost-effectiveness during the early 2000s. However, convergence in LCOH values is expected post-2030, with costs potentially falling below 5 USD2021/kg, suggesting a leveling competitive landscape due to ongoing technological advancements and increased efficiency.
Under both scenarios, onshore wind-based LCOH remains cost-competitive, with optimistic projections showing the potential for solar-based LCOH to fall below 1 USD2021/kgH2. This implies a possible convergence of solar and onshore wind LCOH under significant electrolyzer cost reductions, promising for the hydrogen-production potential of these renewable sources. This trend could foster a wider adoption of green hydrogen, facilitating a transition to a hydrogen economy. However, offshore wind-based LCOH remains the least cost-effective option among the renewables throughout the analysis period due to higher installation and maintenance costs or challenges unique to offshore environments, despite advancements in technology [53].

4.2.2. Sensitivity Analysis of LCOH

In this study, both types of electrolyzers were assumed to have similar base cases, with variations only in current densities and capital cost distributions. Given that the electrolyzer type did not significantly influence sensitivity analysis results, PEM was selected for detailed discussion. The cost breakdown of the baseline scenario in in Figure 9 and the detailed values used in the sensitivity analysis can be seen in Table 5. The sensitivity analysis of alkaline electrolysis (change in current density and the electrolyzer cost breakdown) is reported in Appendix D. The sensitivity analysis, illustrated in Figure 10 quantifies how the model’s output uncertainties are spread across different input variables—electrolyzer efficiency, LCOE, electrolyzer capacity factor, electrolyzer cost, and water cost—which are mostly included in the debate [15,54,55].
This analysis demonstrates that LCOH is markedly influenced by changes in electrolyzer efficiency and LCOE. Notably, a 30% rise in electrolyzer efficiency can lower LCOH by 21.8%, while the same decrease can increase LCOH by roughly 40%, indicating a nonlinear or asymmetric relationship with LCOH, a fact corroborated by prior studies [15,55]. A 30% cut in LCOE can reduce LCOH by 26.7%, underscoring the direct correlation between electricity input and hydrogen production costs. Conversely, the capacity factor has a limited but asymmetric impact on LCOH, with a larger effect noted during underutilization. Electrolyzer cost exhibits a parallel impact to the capacity factor, with a 30% fluctuation causing a 3.1% change in LCOH, aligning with previous research [55]. In contrast, water cost has a minimal influence on LCOH, with a 30% alteration, changing LCOH by just 0.12%, owing to its minor role in the overall hydrogen production cost structure [57,58].
Examining asymmetric parameters, electrolyzer efficiency significantly influences both the electricity cost and electrolyzer stack cost, indirectly affecting the overall capital expenses due to degradation effects. Essentially, a more efficient electrolyzer consumes less electricity per kilogram of hydrogen generated, lowering operational costs since electricity constitutes a major part of the overall costs. Furthermore, higher efficiency decreases the necessary system unit size, assuming constant hydrogen production rates, thereby reducing lifetime capital costs and further lowering LCOH. Thus, improving electrolyzer efficiency is crucial, though it may lead to higher capital costs for electrolyzers. The balance between stack performance and associated costs is emphasized in [18]. It delves into the challenges and advantages of various activities, such as expanding the catalyst surface area for alkaline electrolyzers and addressing membrane contamination from foreign elements in PEM electrolyzers. The capacity factor, representing the actual to potential output ratio if continuously operated at full capacity, is critically important. It affects LCOH both directly and indirectly: directly by spreading fixed costs over a larger hydrogen production volume when operated closer to peak potential, and indirectly by impacting the size and cost of the electrolyzer unit needed to meet production demands at lower capacity factors. Particularly at a low-capacity factor (0.2), as in Figure 10b, the influence of electrolyzer cost intensifies even with similar value changes. Consequently, optimizing the capacity factor is a complex yet necessary task, entailing the maximization of electrolyzer usage while balancing the pros and cons of increased output versus higher maintenance and a decreased equipment lifespan.
The sensitivity analysis showcases the importance of symmetric and asymmetric changes, the latter denoting a nonlinear or variable degree of responsiveness in the input–output relationship, adding complexity and dependency between output and various input parameters. Recognizing these dynamics is crucial for informed decision making, especially in technology development and strategic investments, where these insights guide efforts to optimize outputs.

4.2.3. Mapping the Country-Specific Timeline to Cost Convergence with Grey Hydrogen (2 USD/kg)

The largest component of LCOH is electricity cost, highlighting the importance of utilizing optimal renewable resources worldwide for cost-effective hydrogen production [18]. This analysis outlines the potential evolution of the green hydrogen economy in several countries to achieve an LCOH under 2 USD/kg in both optimistic and pessimistic scenarios, considering their hydrogen adoption levels and established roadmaps as in Figure 11.
In the optimistic scenario, countries like Australia, Germany, Japan, the UK, France, and China are gravitating towards solar energy, with China and Australia expected to reach the LCOH target by 2024, respectively, due to significant recent declines in LCOE. Meanwhile, nations such as Spain and the U.S. predominantly lean on onshore wind energy to achieve their LCOH targets. Conversely, the pessimistic scenario, assuming steady LCOE and electrolyzer cost reductions driven only by R&D, forecasts only China and Spain hitting the LCOH target before 2050, with China projected to do so by 2044 and the latter by 2030 utilizing wind power. Under this scenario, other nations might miss the 2050 target despite efforts to slash electrolyzer costs, underscoring the vital role of reducing renewable energy costs and leveraging the scaling effect and technological advancements alongside R&D to foster the green hydrogen economy.
This analysis indicates significant implications for the global energy and hydrogen markets, with early target achievers like Spain and China potentially becoming green hydrogen exporters, while latecomers like Japan might emerge as key importers. This trajectory aligns with individual country roadmaps [59] and is shaped by various factors, including renewable energy deployment pace, electrolyzer technology advancements, and policy support for the green hydrogen sector, collectively sculpting the evolving global green hydrogen market. However, the current study prioritized solar and onshore wind energy due to their widespread adoption, potentially overlooking more cost-effective options available to certain nations, such as nuclear power in France, thus highlighting an area for further analysis.

5. Discussion

5.1. Strategies for Establishing Green Hydrogen as a Competitive Alternative to Grey Hydrogen

The current global cost of green hydrogen ranges between 3 and 6 USD/kgH2, which is deemed acceptable for certain applications, particularly in the power-to-liquids (PtL) industry and transportation sector. Hydrogen is appealing to the transportation industry, which is dominated by heavy-duty trucks and fuel-cell forklifts, due to its zero tailpipe emissions and swift refueling capabilities. In addition, the aviation industry may accept high-priced hydrogen, particularly for jet fuel applications. In these niche applications, renewable hydrogen is already economically viable, according to the research conducted by [31]. Even at higher prices, it is anticipated that long-distance transport, followed by rail, shipping, and aviation, will be the first sector to implement green hydrogen in the future [16]. When the price falls below 5 USD/kg; however, it becomes economically feasible to decarbonize steel production, engage in power-to-methane (PtM) processes, and use hydrogen as a gas for heat production, either via boilers in industrial settings or combined heat and power (CHP) systems for district heating. However, for renewable hydrogen to be economically viable for commercial and residential use, the price per kilogram would need to be below approximately 2 USD [60].
In the current situation, the cost of green hydrogen (2.5 USD2021/kW for onshore wind and 3.8 USD2021/kW for solar) continues to exceed that of its fossil-based counterpart. Hence, it is imperative to establish appropriate incentives that would not only offset the demand for grey hydrogen but also stimulate its application in new areas as alternative fuels. This is vital to achieving net-zero carbon emissions. Nevertheless, policy measures are likely to vary from one nation to the next based on factors such as a country’s priorities and constraints, the availability of resources, and the existing infrastructure. A country with abundant resources and underground storage, such as Australia, could, for example, consider a strategy incorporating CCUS/CCS. In countries such as Spain, where the cost of natural gas is exceptionally high, it may be preferable to forego blue hydrogen altogether and instead progress directly to green hydrogen. In other nations with limited renewable energy potential, such as Japan, strategic emphasis could be placed on drafting policies that encourage the import of hydrogen with minimal carbon emissions. Regardless of the specific policy options that various governments may choose, their impact will be significantly amplified if there is broad alignment in terms of ambition and timing across multiple government levels and internationally. It is essential to recognize that these strategies do not exist in isolation; rather, advancements in one area can potentially complement advancements in others, reducing LCOH. By leveraging the synergies between various strategies, each successful policy implementation could pave the way for success in other domains. In the sections that follow, we will discuss a variety of strategies that could make green hydrogen economically competitive with grey hydrogen at present.

5.1.1. Revenue beyond Hydrogen

To enhance the commercial viability of green hydrogen production, it is essential to consider additional revenue streams in addition to hydrogen sales. The study by [61] proposed the framework of a hydrogen credit system to stimulate the hydrogen economy. The hydrogen credit system begins with a life cycle assessment, evaluating the environmental impact of hydrogen production and transportation. Based on the calculated carbon emissions, a hydrogen tax is imposed on higher emission methods, while carbon-saving methods earn hydrogen credits (H.C.s). These H.C.s, symbolizing the environmental benefits of green hydrogen, can be traded in specialized markets governed by international regulations. Overall, the system incentivizes green hydrogen production by monetizing its environmental benefits and discouraging carbon-intensive production methods. This system is quite similar to the carbon credit system, where entities earn credits by reducing carbon dioxide emissions below certain benchmarks, and these credits can then be traded or sold to entities exceeding those benchmarks. Therefore, the direct use of the carbon credit system can also be effectively leveraged to create financial incentives for green hydrogen companies. Businesses could receive carbon credits, creating a valuable revenue stream for green hydrogen companies. The implementation of these credit systems may accelerate the transition towards a more sustainable hydrogen economy by making green hydrogen production more economically attractive.
Oxygen, which has industrial significance, can also generate additional revenue, as it is produced as a byproduct of the production of green hydrogen [62,63,64,65]. Oxygen is utilized extensively in a variety of industries, such as blast furnaces, electric furnaces, and glass processing. Consequently, the surplus oxygen obtained as a byproduct can be sold to these industries, thereby reducing the overall cost of electrolysis-produced hydrogen. In addition, the considerable amount of oxygen produced by electrolysis has the potential for use in medical and specialized applications [63,66]. Therefore, selling the byproduct oxygen, as well as the heat produced by the electrolyzer system in cases of high-temperature electrolysis, provides an additional incentive. However, in this study, the oxygen revenue stream will be discussed briefly. The basic stoichiometric balance indicates that approximately 8 kg of oxygen, with a purity level exceeding 99%, is produced for every kg of hydrogen [58,64]. Electrolysis-obtained oxygen’s quality suggests that it may charge a higher selling price comparable to medical-grade oxygen without further purification. Compressed oxygen of high purity (grade 4.5) can cost up to 4.4 USD/kgO2, and prices for medical use are even higher due to stringent quality control measures to ensure minimal impurities [63,67]. Notably, certain nations, such as Finland, experience considerably inflated prices for bottled oxygen intended for medical applications, ranging from 3.2 to 7.4 USD/kgO2, excluding bottle and bottle rack rental costs. Consequently, pricing the byproduct oxygen below 3.2 USD/kgO2 could make it competitive on the market [63,68].
To evaluate the potential revenue stream generated by oxygen in green hydrogen production, three scenarios were developed to obtain a comprehensive understanding of the economic implications and viability of incorporating oxygen as a revenue stream into the hydrogen production process by examining various approaches to cost allocation and pricing assumptions.
For the first scenario, as in Figure 12 the impact of selling oxygen as a secondary revenue stream on the levelized cost of hydrogen is examined under a 50% capacity factor and electricity price of 50 USD/MWh. A 50% decrease in LCOH, from 3.3 to 1.7 USD/kgH2, is achieved at the minimum oxygen selling price of 1.4 USD/kg O2 [62]. This demonstrates the potential financial advantages of adding an additional oxygen revenue stream to the operational model. For capacity factors of 50% and above, the oxygen selling price can begin at approximately 1 USD/kg O2. However, for lower-capacity factors of 20%, a higher starting price of approximately 1.3 USD/kgO2 is required to be competitive with grey hydrogen, assuming a gas price of 31.5 USD/MWh. This disparity between the 50% to 80% and 20% capacity factor ranges highlights the significance of maintaining high-capacity factors in order to optimize LCOH. Moreover, the figure indicates that for an oxygen selling price of approximately 2 USD/kgO2, the cost of producing hydrogen could be lower than the cost of producing hydrogen from SMR. It also suggests that electrolysis could become a cost-effective method for hydrogen production if oxygen market conditions are favorable. Moreover, according to [63], the identified selling price for oxygen (roughly 2 USD/kgO2) is still within the lower range for high-purity oxygen. It highlights that electrolysis could become a cost-effective method for hydrogen production if oxygen market conditions are favorable.
The second scenario examines a mass-based allocation method for the production of hydrogen and oxygen, where more capital cost is allocated for oxygen production. This method produces a Levelized Cost of Oxygen (LCOO) of 0.363 USD/kgO2, in contrast to the LCOH of 0.567 USD/kgH2. This disparity in cost suggests that this model may offer economic advantages for the production of hydrogen, whereas that for oxygen production is less apparent due to the relatively elevated LCOO when compared to the standard derived from cryogenic air separation units at 0.1 USD/kgO2 [69]. The third scenario employs an economic allocation model for the simultaneous synthesis of hydrogen and oxygen. The cost structure of this model is predicated on average production costs of 2 USD/kg for hydrogen and 0.1 USD/kg for oxygen [69]. Consequently, this model results in an increased LCOH of 3.1 USD/kg and a decreased LCOO of 0.014 USD/kg. The LCOO in this model is competitive with the standard; however, the LCOH exceeds the cost levels achieved by the first scenario, leading to questions about the economic viability of this hydrogen production scenario.
Following an analysis of these scenarios, it can be concluded that the first scenario of mass allocation is the cost-effective option, followed by the second scenario; although the LCOO is higher than the norm, it is still within the reasonable range considering the retail price. Therefore, considering the retail price and the oxygen purity level, both scenarios can be a viable pathway to reduce the overall LCOH. However, the validity of this conclusion is contingent on a number of influencing factors, such as market demands, price volatility for oxygen and hydrogen, and other operational parameters endemic to the production process.

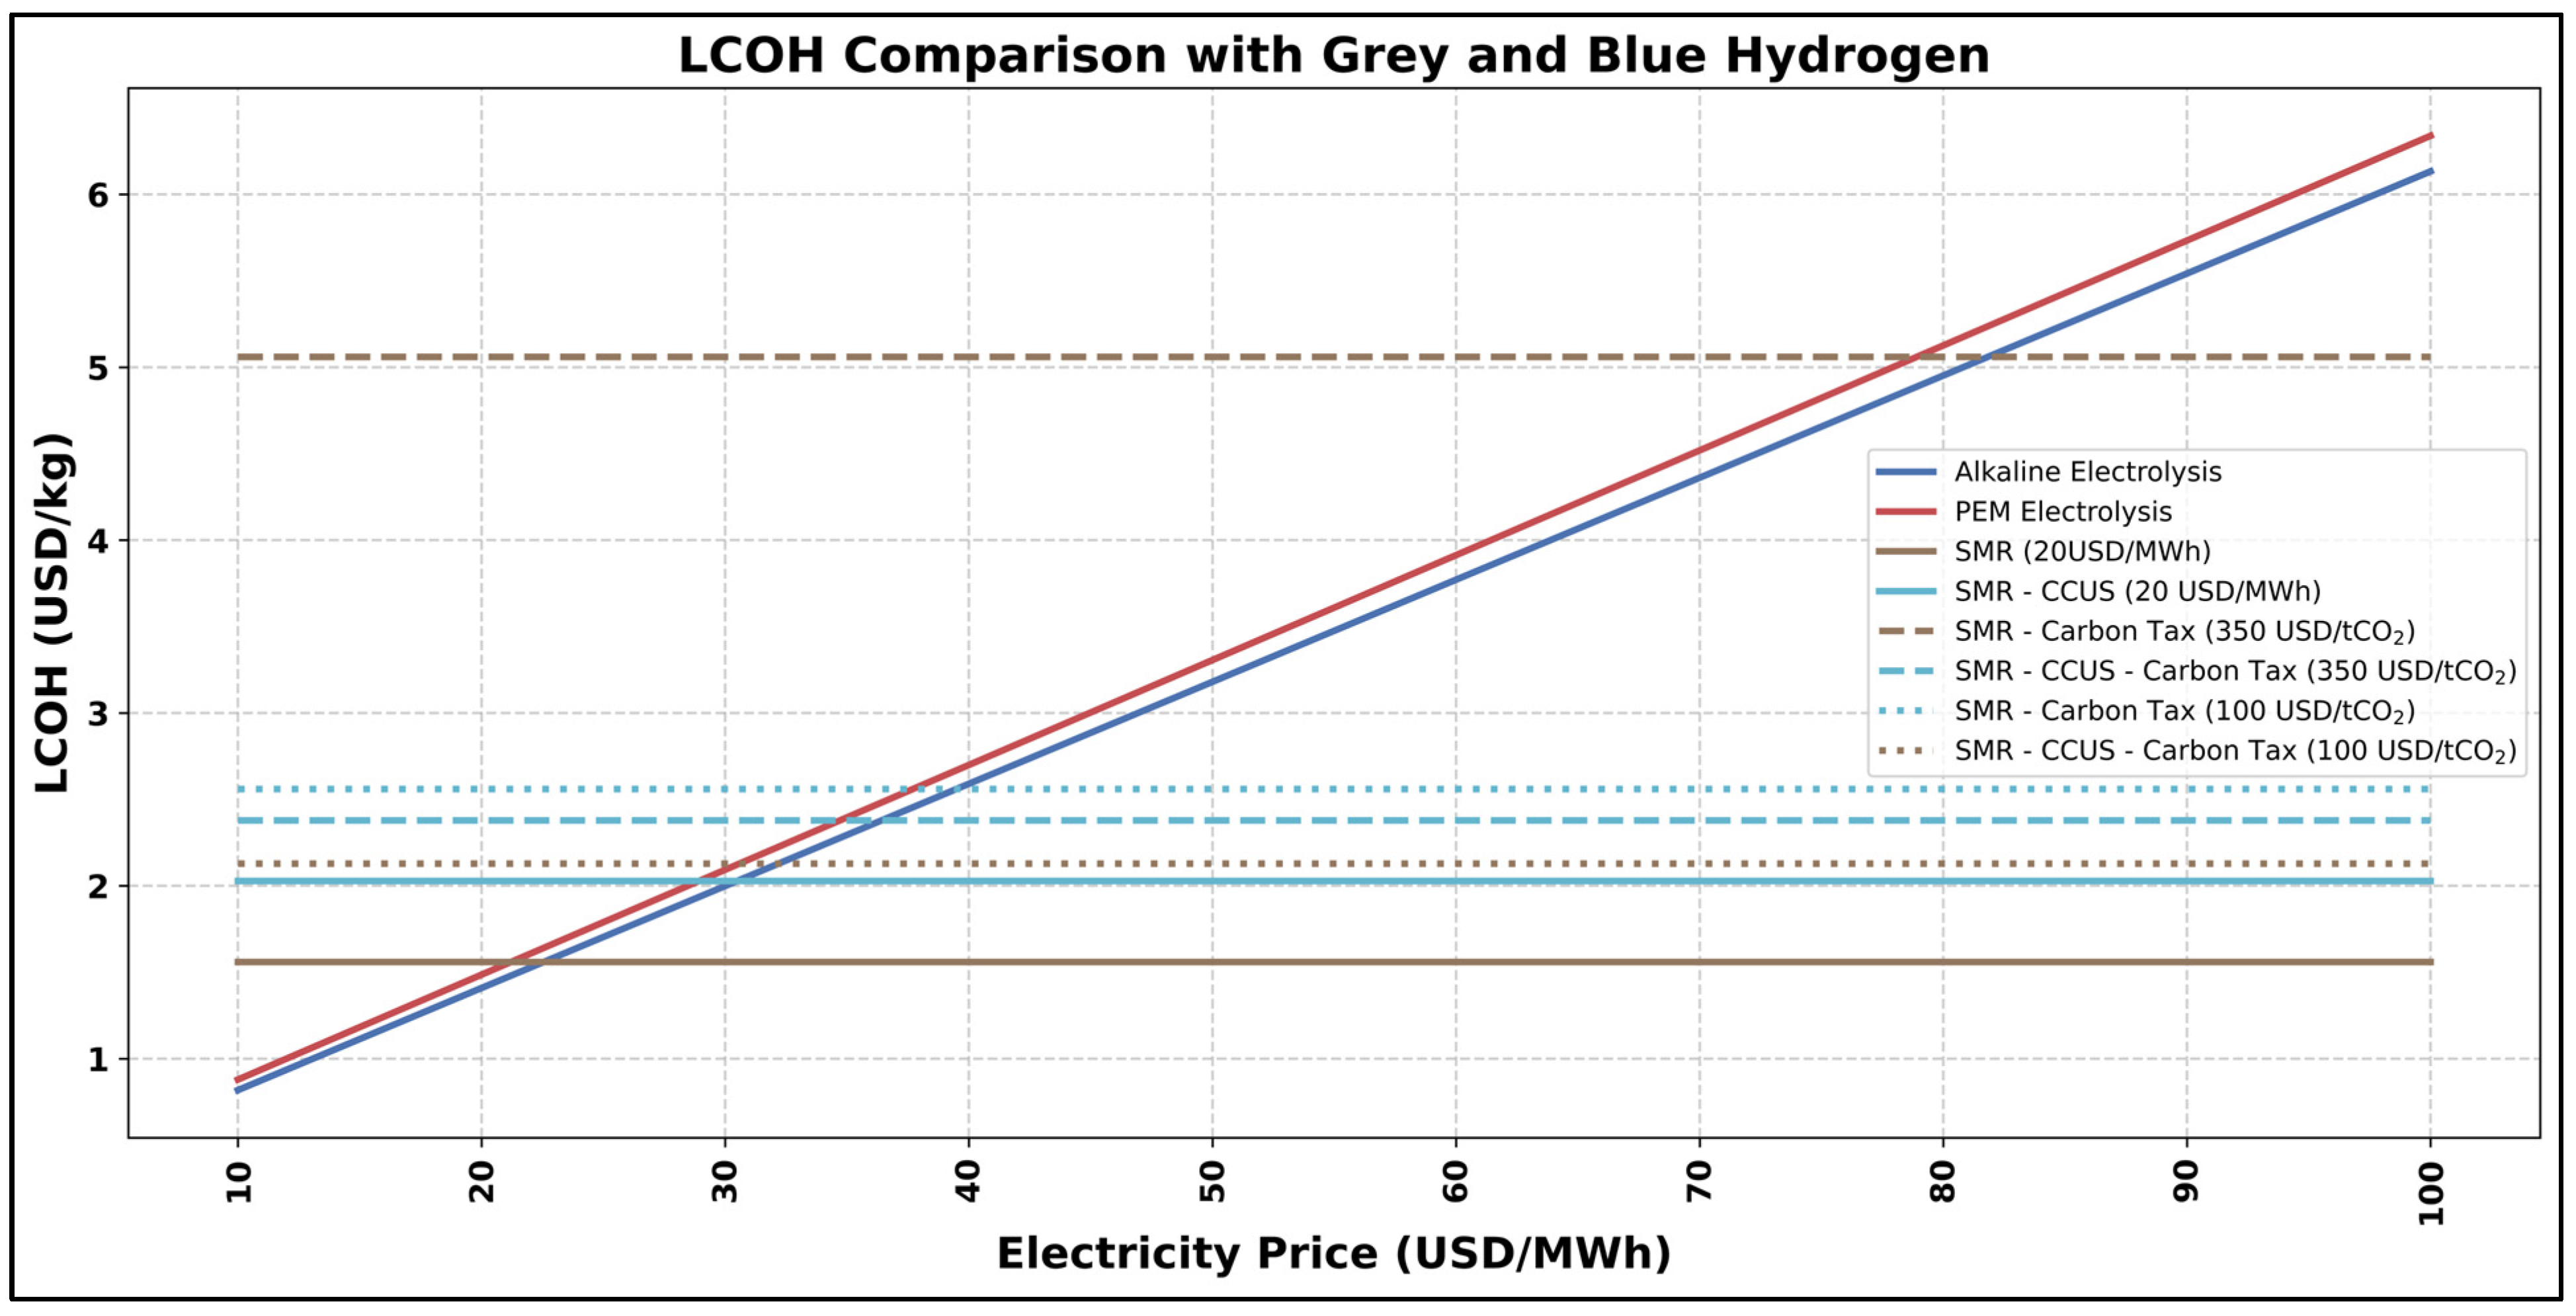
5.1.2. Bridging the Cost Gap: Carbon Tax and Contract for Difference as Catalysts for Green–Grey Hydrogen Parity

Figure 13 demonstrates that the competitiveness of hydrogen production is significantly dependent on the price of electricity, using the current prices of electrolyzers. For example, if natural gas prices are approximately 20 USD/MWh, electricity prices would need to drop below 22 USD/MWh for hydrogen production to be competitive with grey hydrogen. The minimum production costs could fall below 1 USD/kgH2 if electricity costs fall to less than 12 USD/MWh. In addition, taking into account an additional carbon tax of 100 USD/tCO2—established by the International Energy Agency (IEA) as a benchmark for a net-zero emissions scenario [2]—the price of electricity would have to fall below USD40/MWh in order to maintain competitiveness. The implementation of such a carbon tax remains a distant objective for the majority of nations, let alone to satisfy the significantly higher Paris Agreement baseline tax of 350 USD/tCO2 [70].
There is a promising potential for green hydrogen to reach cost parity with conventional methods in the long run. Countries with CO2 storage facilities will likely acquire a cost advantage for hydrogen production via natural gas with CCS/CCUS, making it a viable option for the medium-term transition to a low-carbon hydrogen market [16,31,57,60,71]. Blue hydrogen remains the most cost-effective option in the landscape, even with the highest proposed carbon taxes, unless extremely optimistic electricity prices are achieved.
In addition, the Contract for Difference (CfD) scheme arises as a potential strategy to level the landscape and boost the viability of green hydrogen. The CfD can be an agreement that ensures the grey hydrogen consumer’s financial interests by guaranteeing a specific price level, also known as the “strike price”. Implementing a CfD agreement in the context of green hydrogen production would provide a financial guarantee equivalent to the price of grey hydrogen. This strategy can be made possible by government subsidies that cover the price difference between green and grey hydrogen production techniques. This price guarantee serves as a powerful incentive, encouraging consumers of hydrogen to shift their production from traditional grey hydrogen to green hydrogen while maintaining price consistency for consumers. The CfD strategy establishes an economically feasible path by mitigating price volatility for consumers and ensuring consistent pricing comparable to grey hydrogen. This shift also eliminates the susceptibility of consumers to fluctuations in petrol prices endemic to the production of grey hydrogen, thereby making the transition to green hydrogen more appealing. In this context, the CfD can facilitate a widespread transition from grey to green hydrogen utilization, backed by the substantial existing global hydrogen demand.

5.2. Limitation of the Present Study and Future Work

The first limitation of this study pertains to the approach toward projecting hydrogen production facilities. Specifically, this projection does not incorporate the inherent competition among various hydrogen production alternatives. For example, industrial large-scale processes using natural gas and coal currently constitute the most important routes, but increasing prices for natural gas are likely to render coal gasification more competitive. Furthermore, biomass gasification could become crucial if current technological barriers are overcome [71]. However, the study does not adequately address these potential shifts in the competitive landscape of hydrogen production—which can affect the installed capacity projection.
The second significant limitation of this study concerns its approach to analyzing the interplay between hydrogen production and the larger energy ecosystem. In this study, hydrogen production is treated as a closed system, a necessary simplification employed to provide cost estimates across a wide array of countries. However, this approach is somewhat far from reality, as it overlooks the interconnected nature of hydrogen production within the broader energy market. Factors such as gas demand and prices may not be solely dependent on hydrogen production, and conversely, renewable energy facilities are not exclusively dedicated to electrolysis for hydrogen production. The decision to produce hydrogen is often influenced by the opportunity costs associated with alternative uses of gas and electricity, and in reality, an investment would only be pursued if the expected profit, inclusive of opportunity costs, is positive.
The third limitation is the assumption of constant capacity factors throughout the calculations. In reality, capacity factors—the ratio of a power plant’s actual output over a period of time to its potential output if it were possible for it to operate at full capacity continuously—may fluctuate optimistically to a higher ratio in the future. A more nuanced analysis would involve a detailed assessment of capacity factors that accommodate potential future changes due to climate change and technological advancements. However, such an analysis would significantly broaden the scope of this study and necessitate access to additional data and modeling capabilities. Consequently, the present analysis recommends this assessment as a potential area for future research, acknowledging its limitation in fully accounting for the variability in capacity factors.
The fourth limitation of this study is rooted in the fact that electrolyzer cost projection does not account for potential material shortages, which could lead to an increase in the cost of components. The current cost estimation model presupposes an uninterrupted and ample supply of necessary materials, and it does not contemplate the possibility of supply chain constraints or limitations to the scale-up of production.

6. Conclusions

This study analyzes the economic and competitive dynamics of alkaline and PEM electrolyzers in the evolving hydrogen economy, with an emphasis on their cost reduction potentials, sensitivity analyses, global LCOH trajectory, country-specific timelines, and the importance of incentives in promoting green hydrogen. By critically examining the interplay of key variables such as the LCOE, electrolyzer efficiency, capacity factor, and electrolyzer costs, the following conclusion can be made.
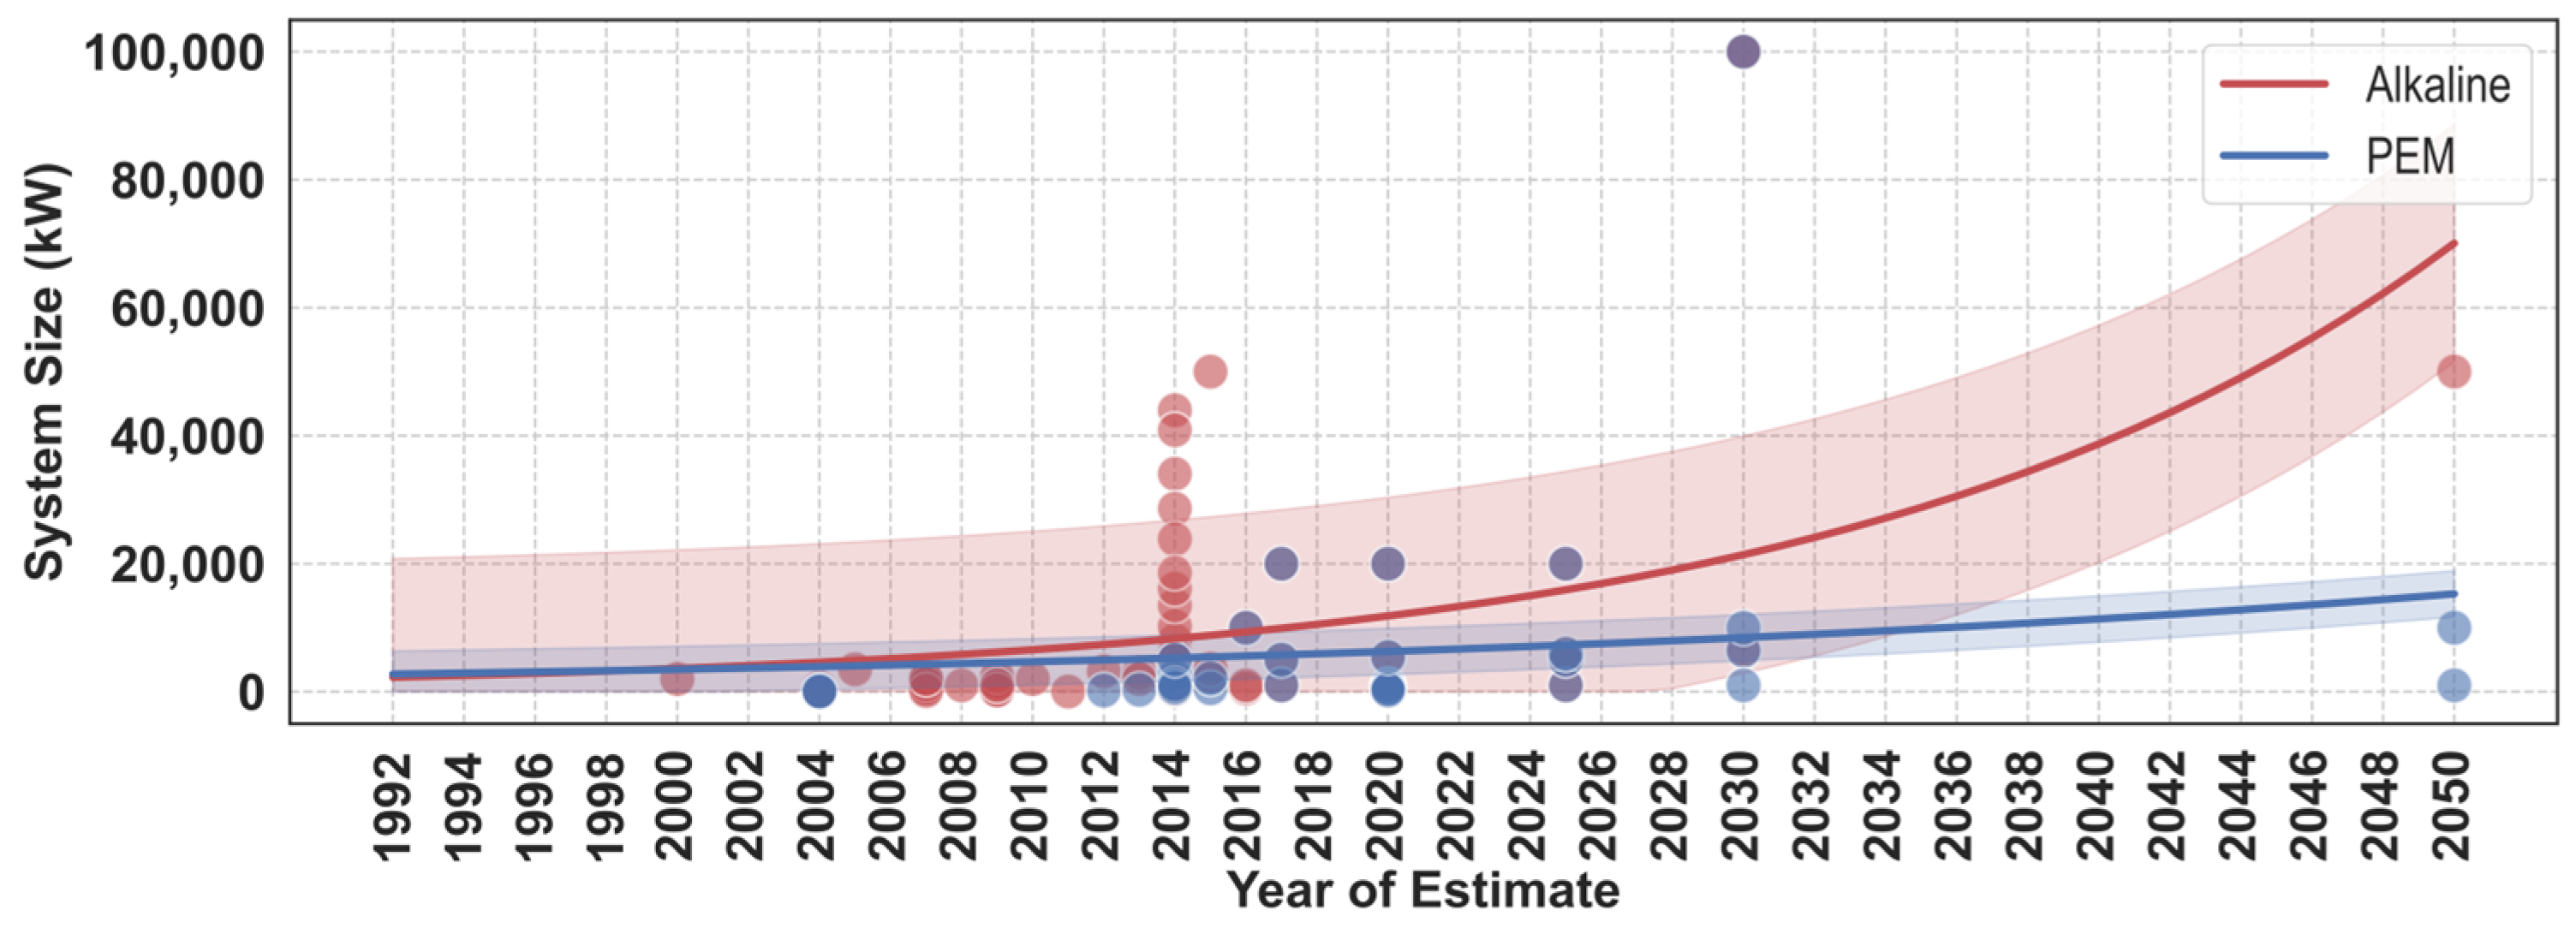
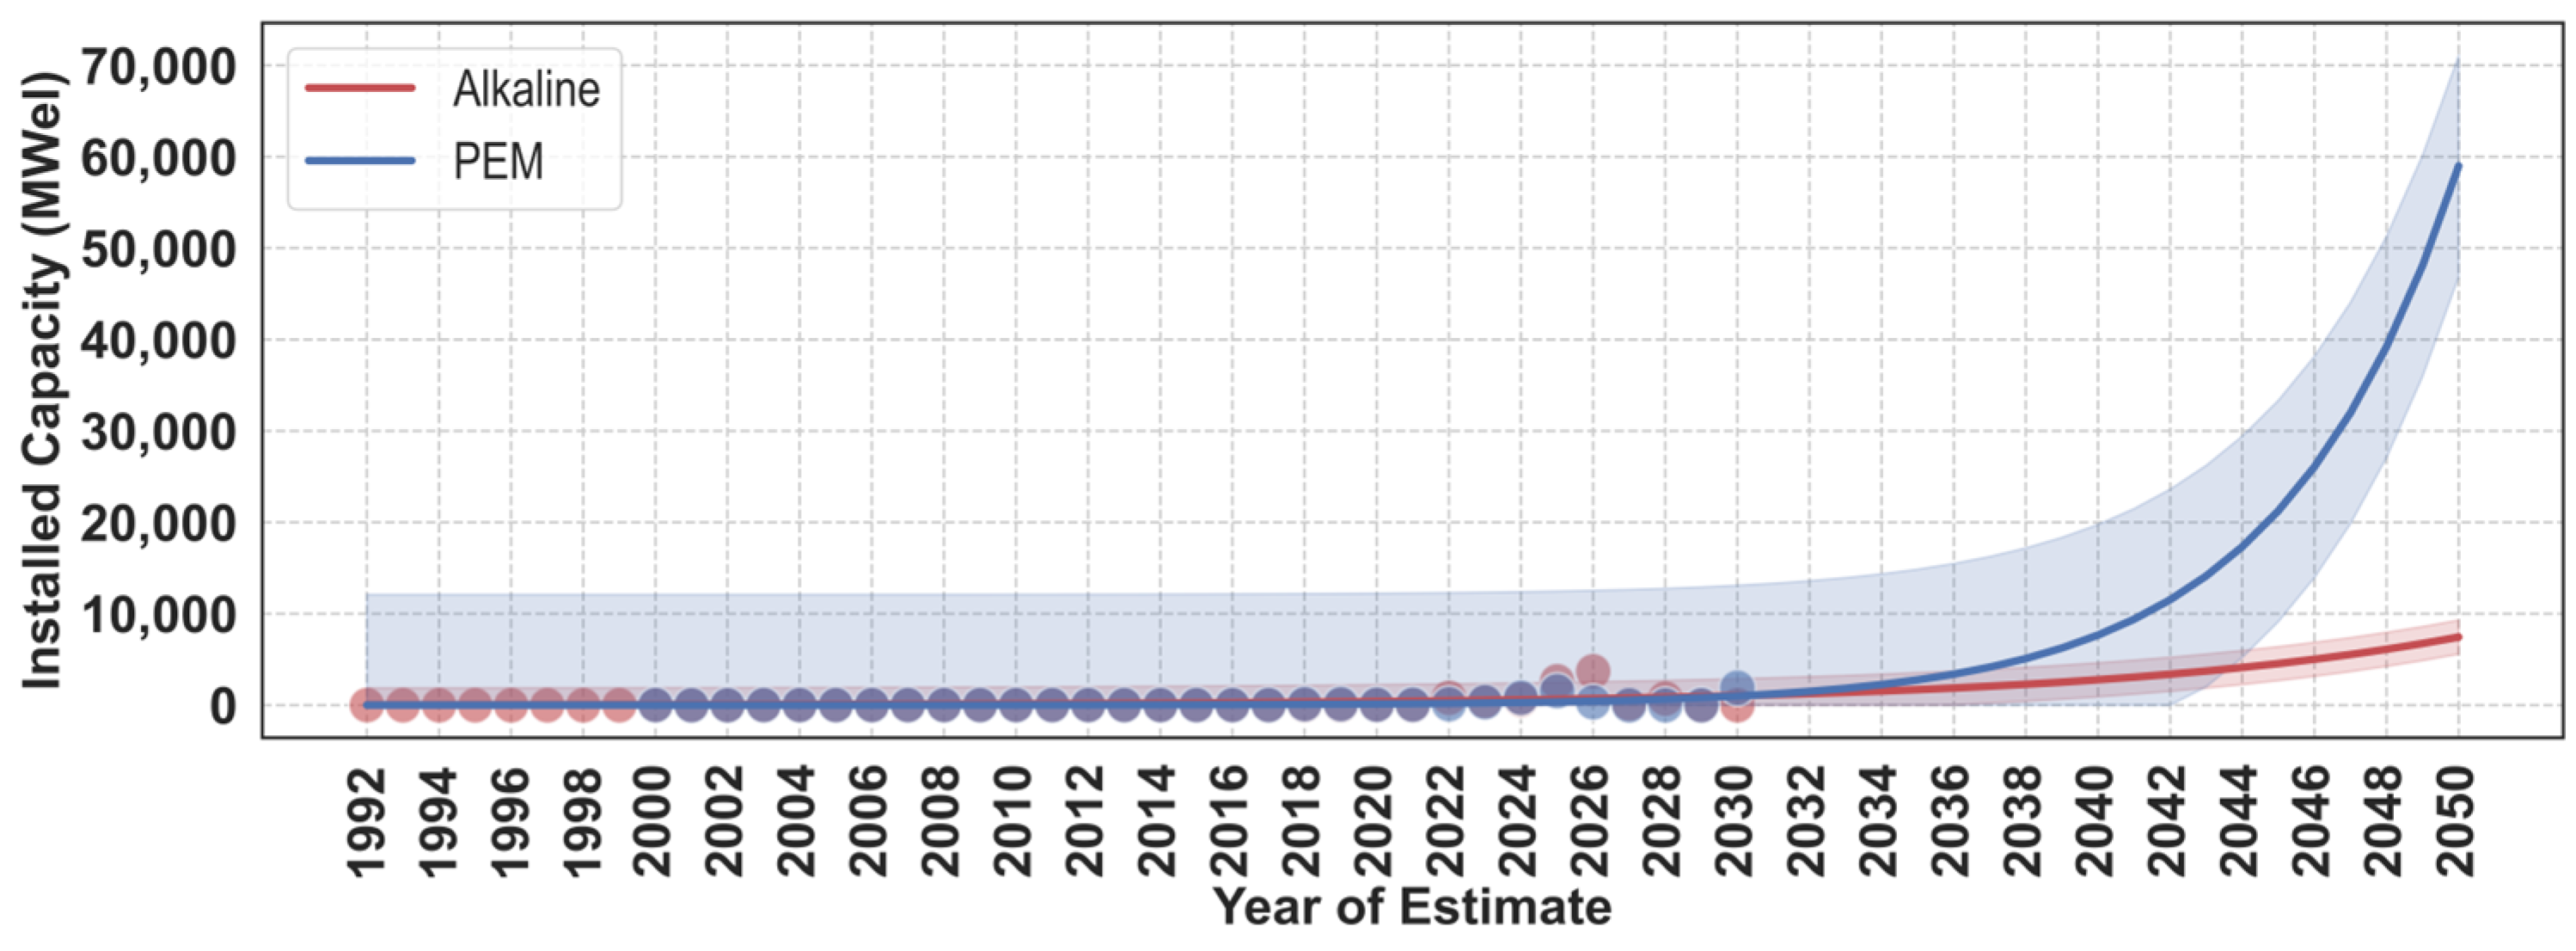
  • The economic viability and competitive advantage of alkaline and PEM electrolyzers rest largely on their potential cost reductions, which stem from the synergy of research and development (R&D) initiatives, economies of scale, and technological learning over time. The analysis reveals that the cost reduction potential for alkaline electrolyzers is 77%, and for PEM electrolyzers, it is 79% when both economies of scale and technological learning are considered over R&D activities. Despite these promising figures, the precise trajectory of cost reduction is contingent on several factors, including the rates of increase in system size and installed capacity. However, the cost reduction of both alkaline and PEM electrolyzers is predicted to be substantial, and PEM will take over alkaline electrolyzers if the conditions are met.
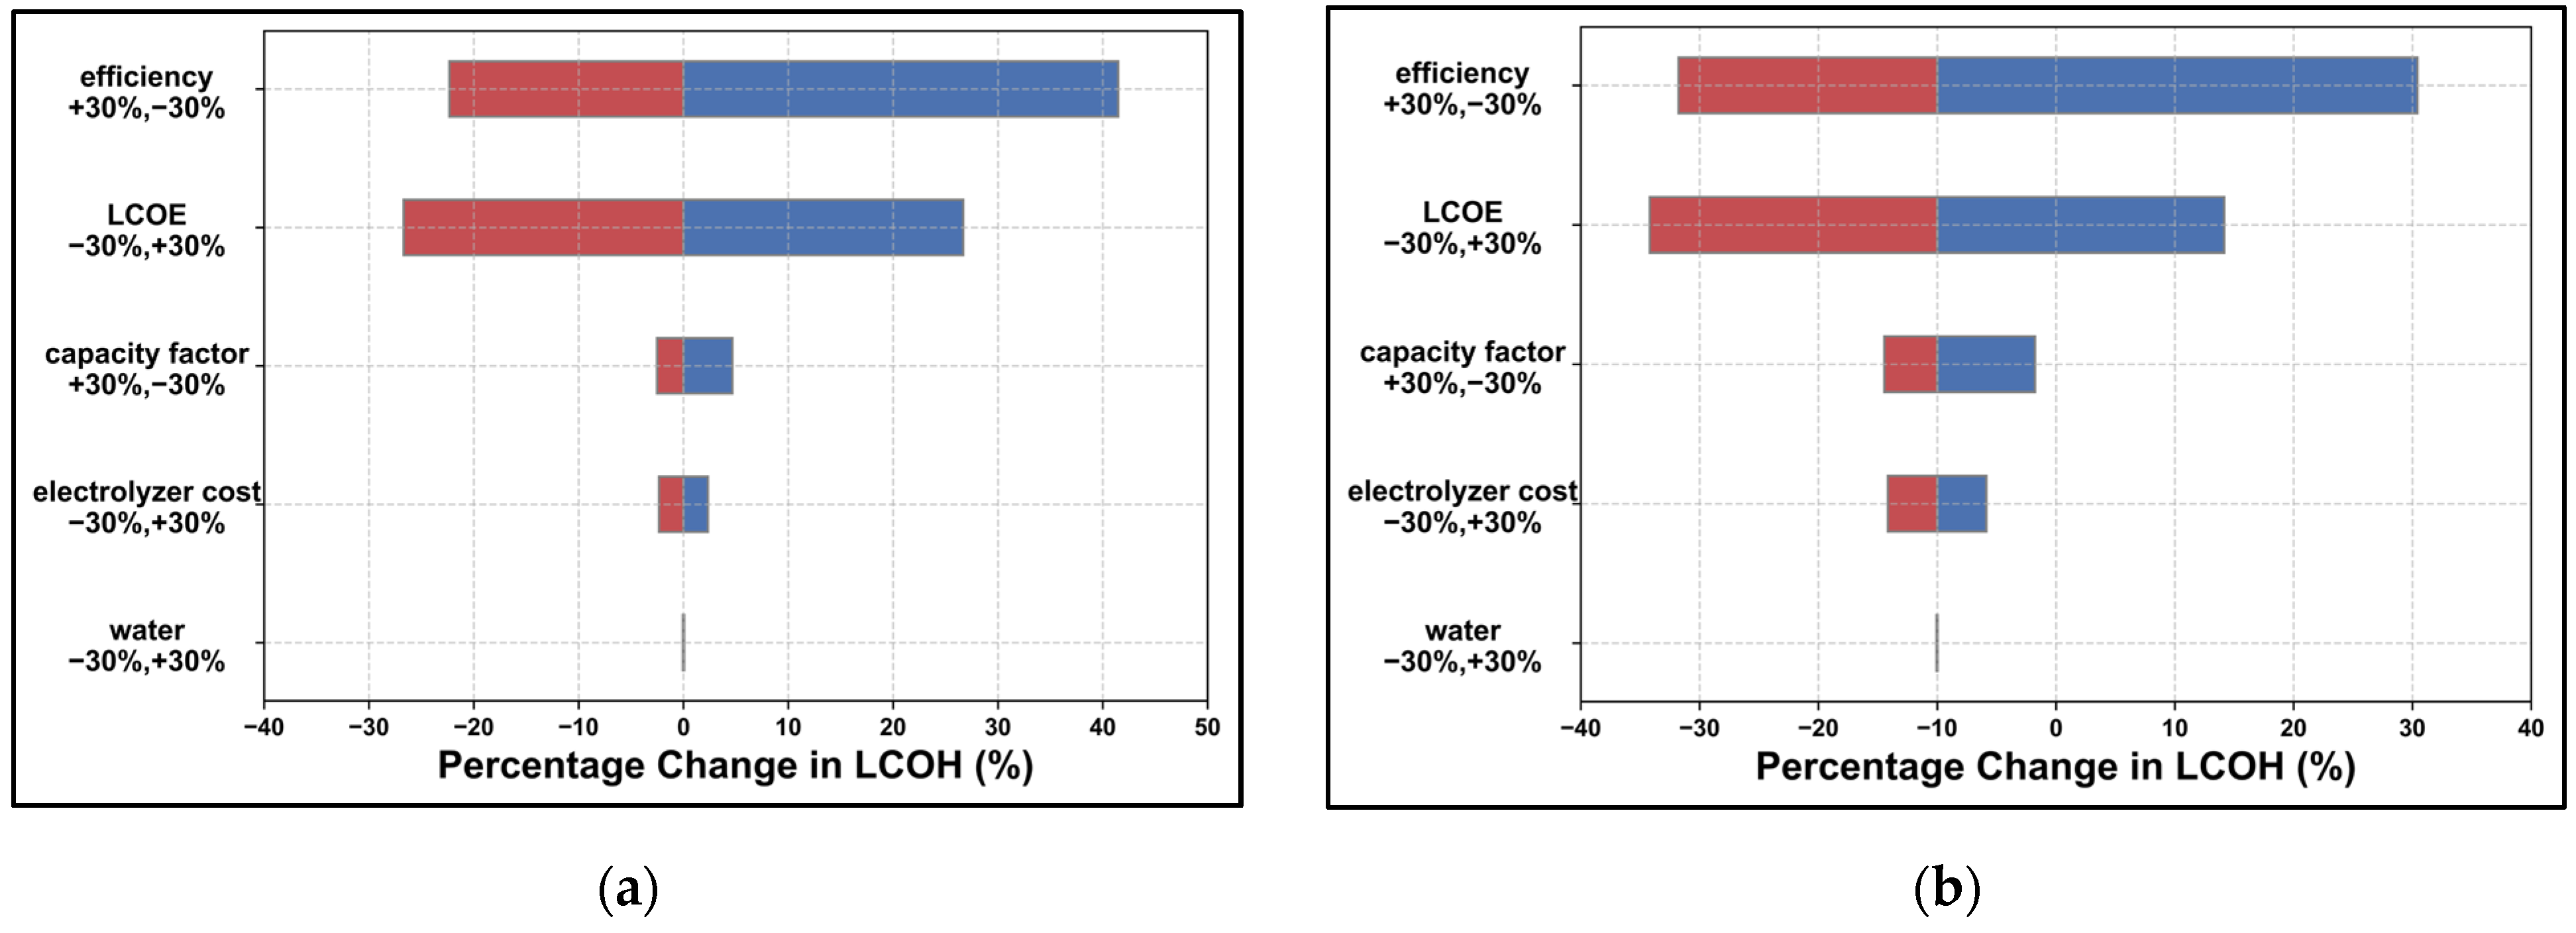
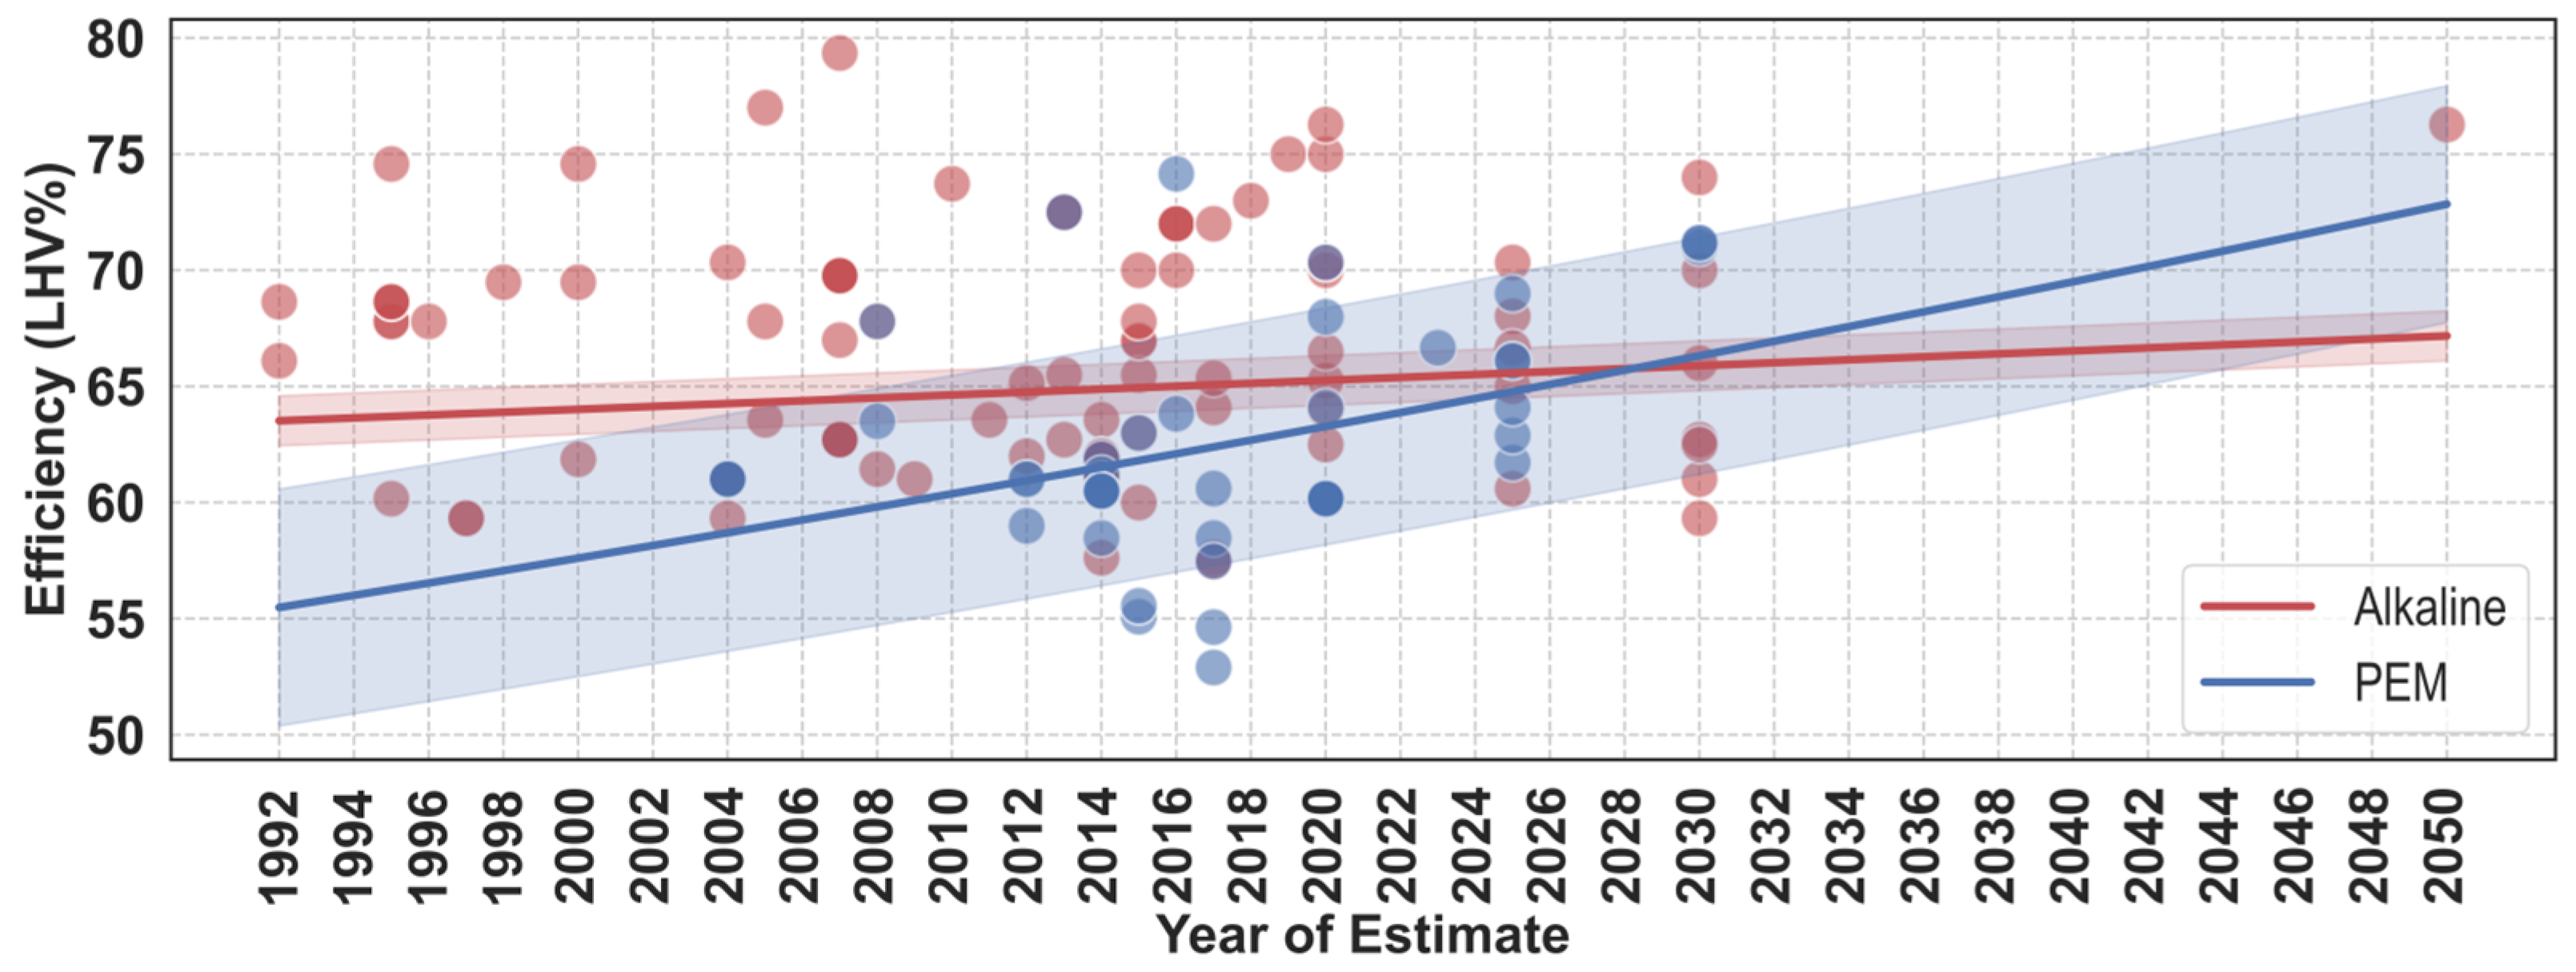
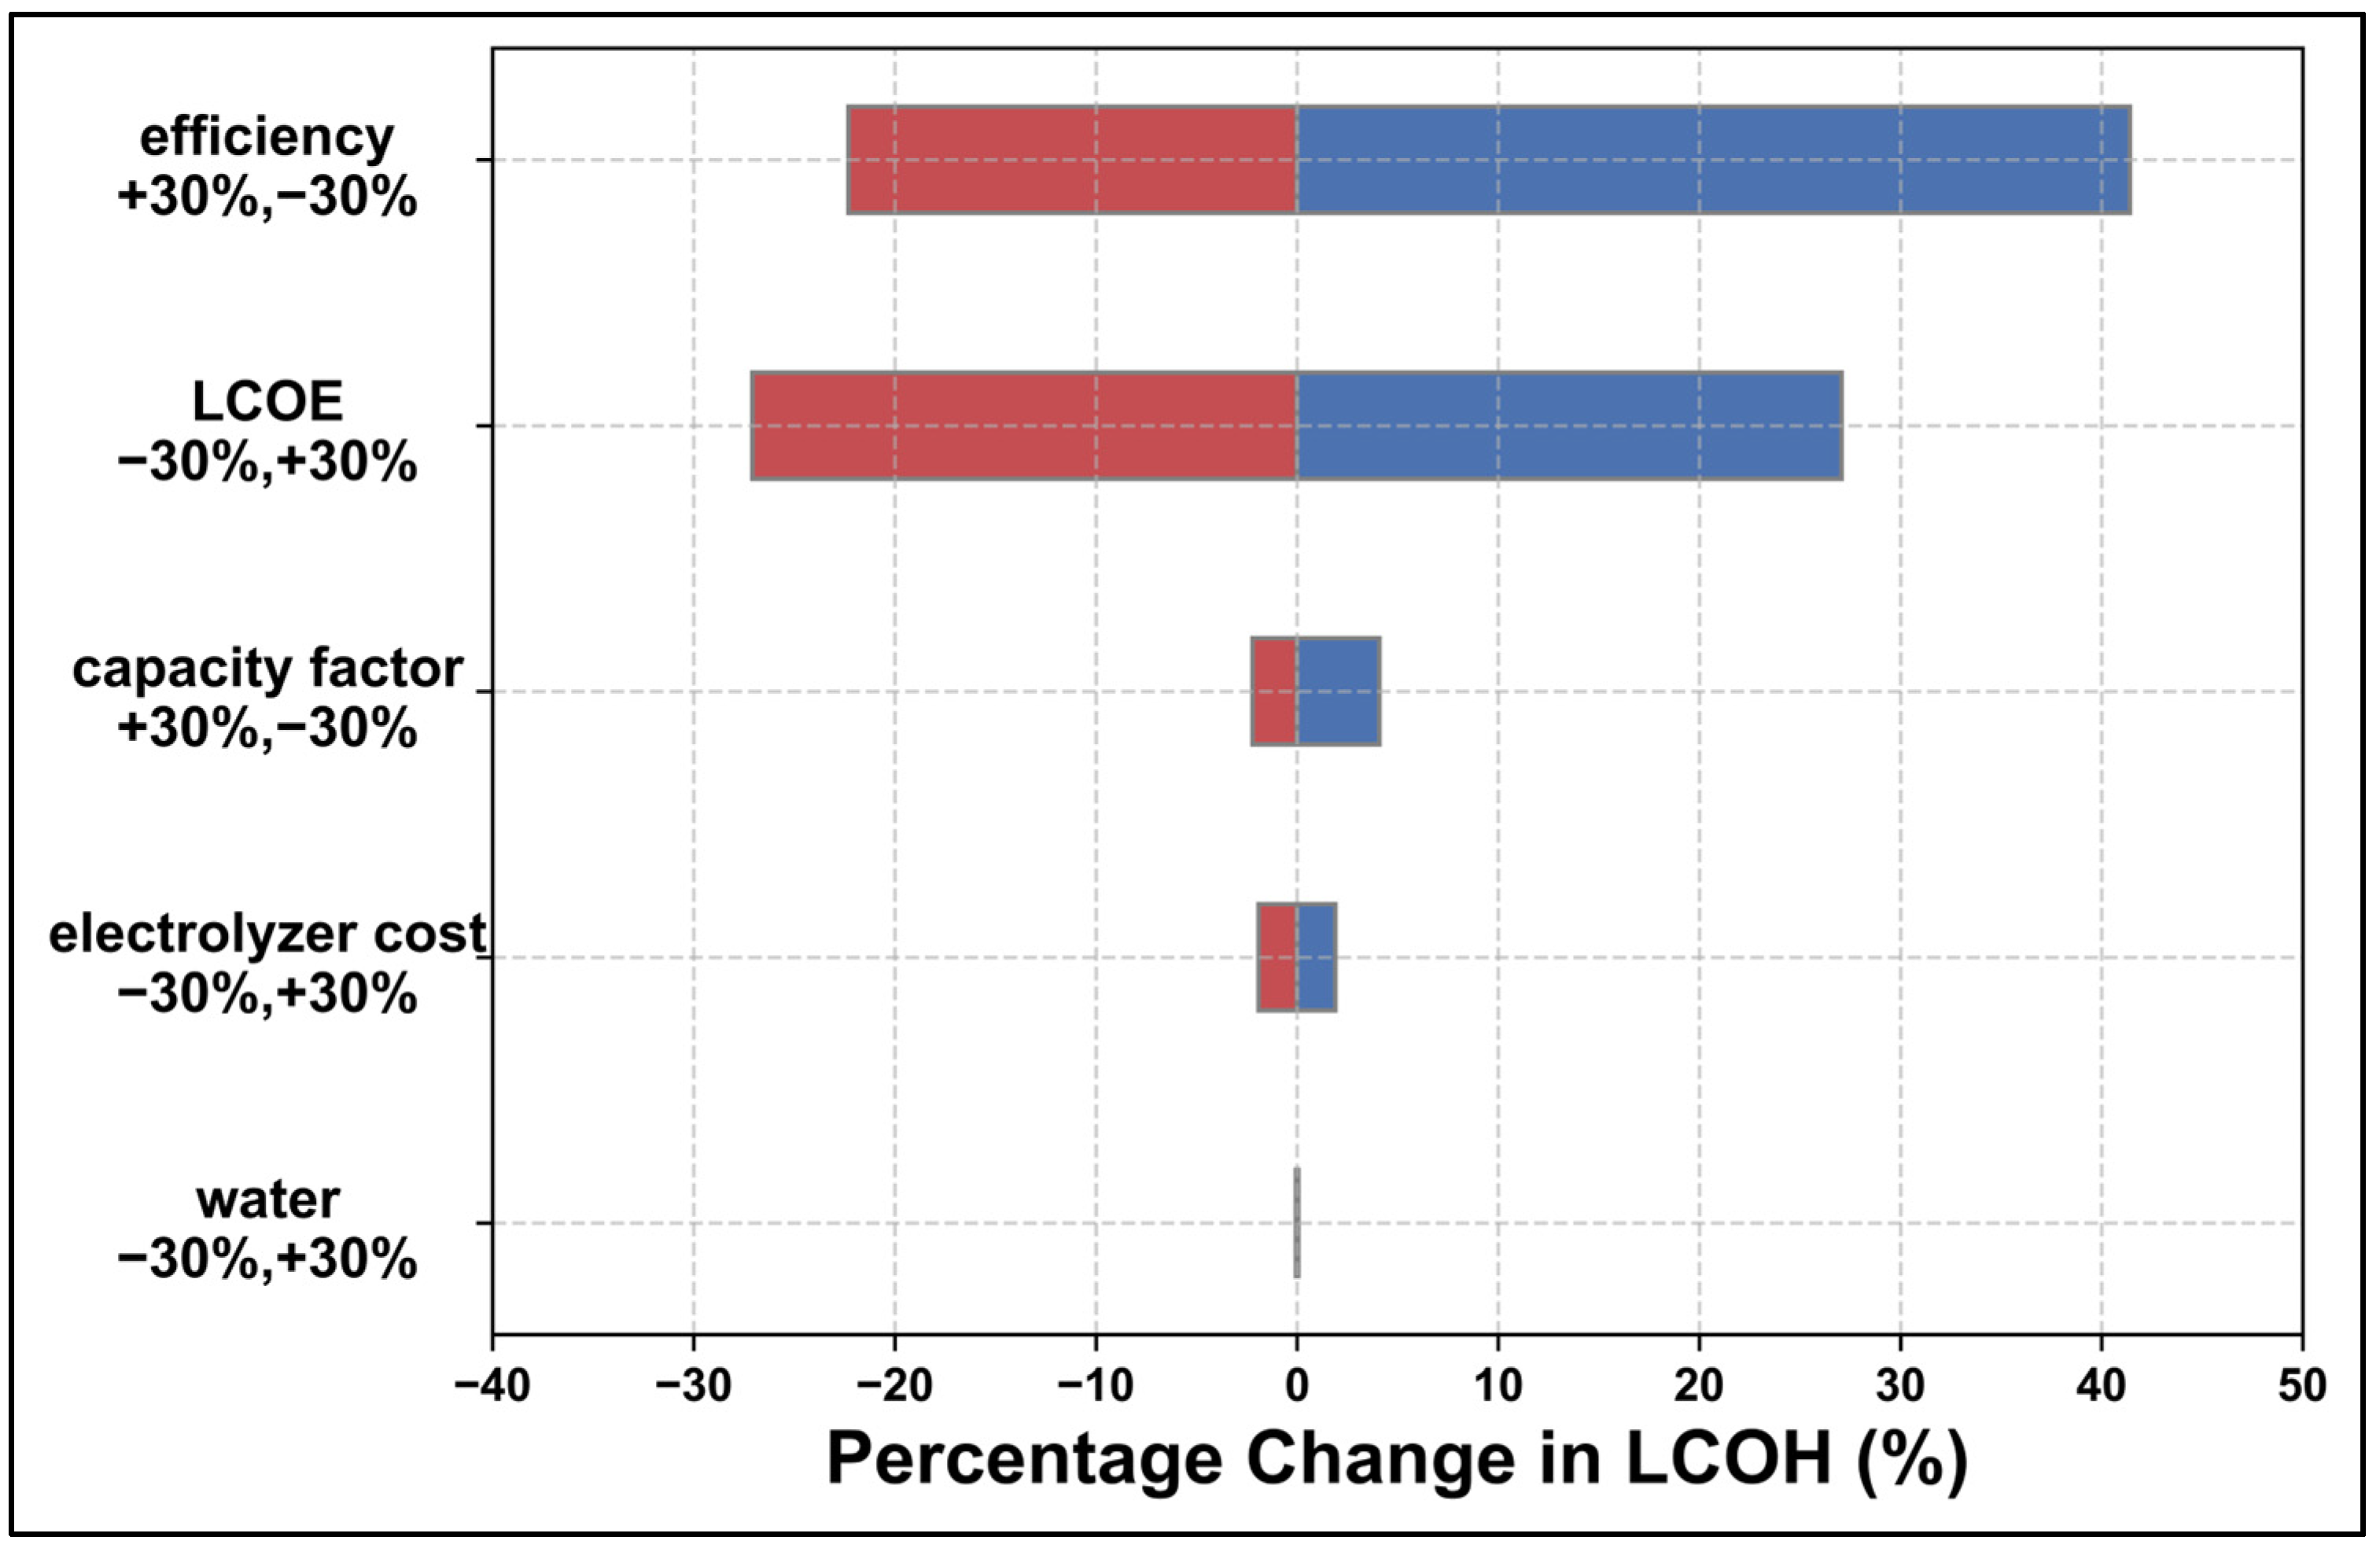
  • The sensitivity analysis indicates that LCOH is most sensitive to variations in electrolyzer efficiency and LCOE. However, increasing efficiency and optimizing capacity factors emerge as key areas to focus on for reducing LCOH, with asymmetries in these relationships underscoring the need to prioritize efforts that prevent decreases.
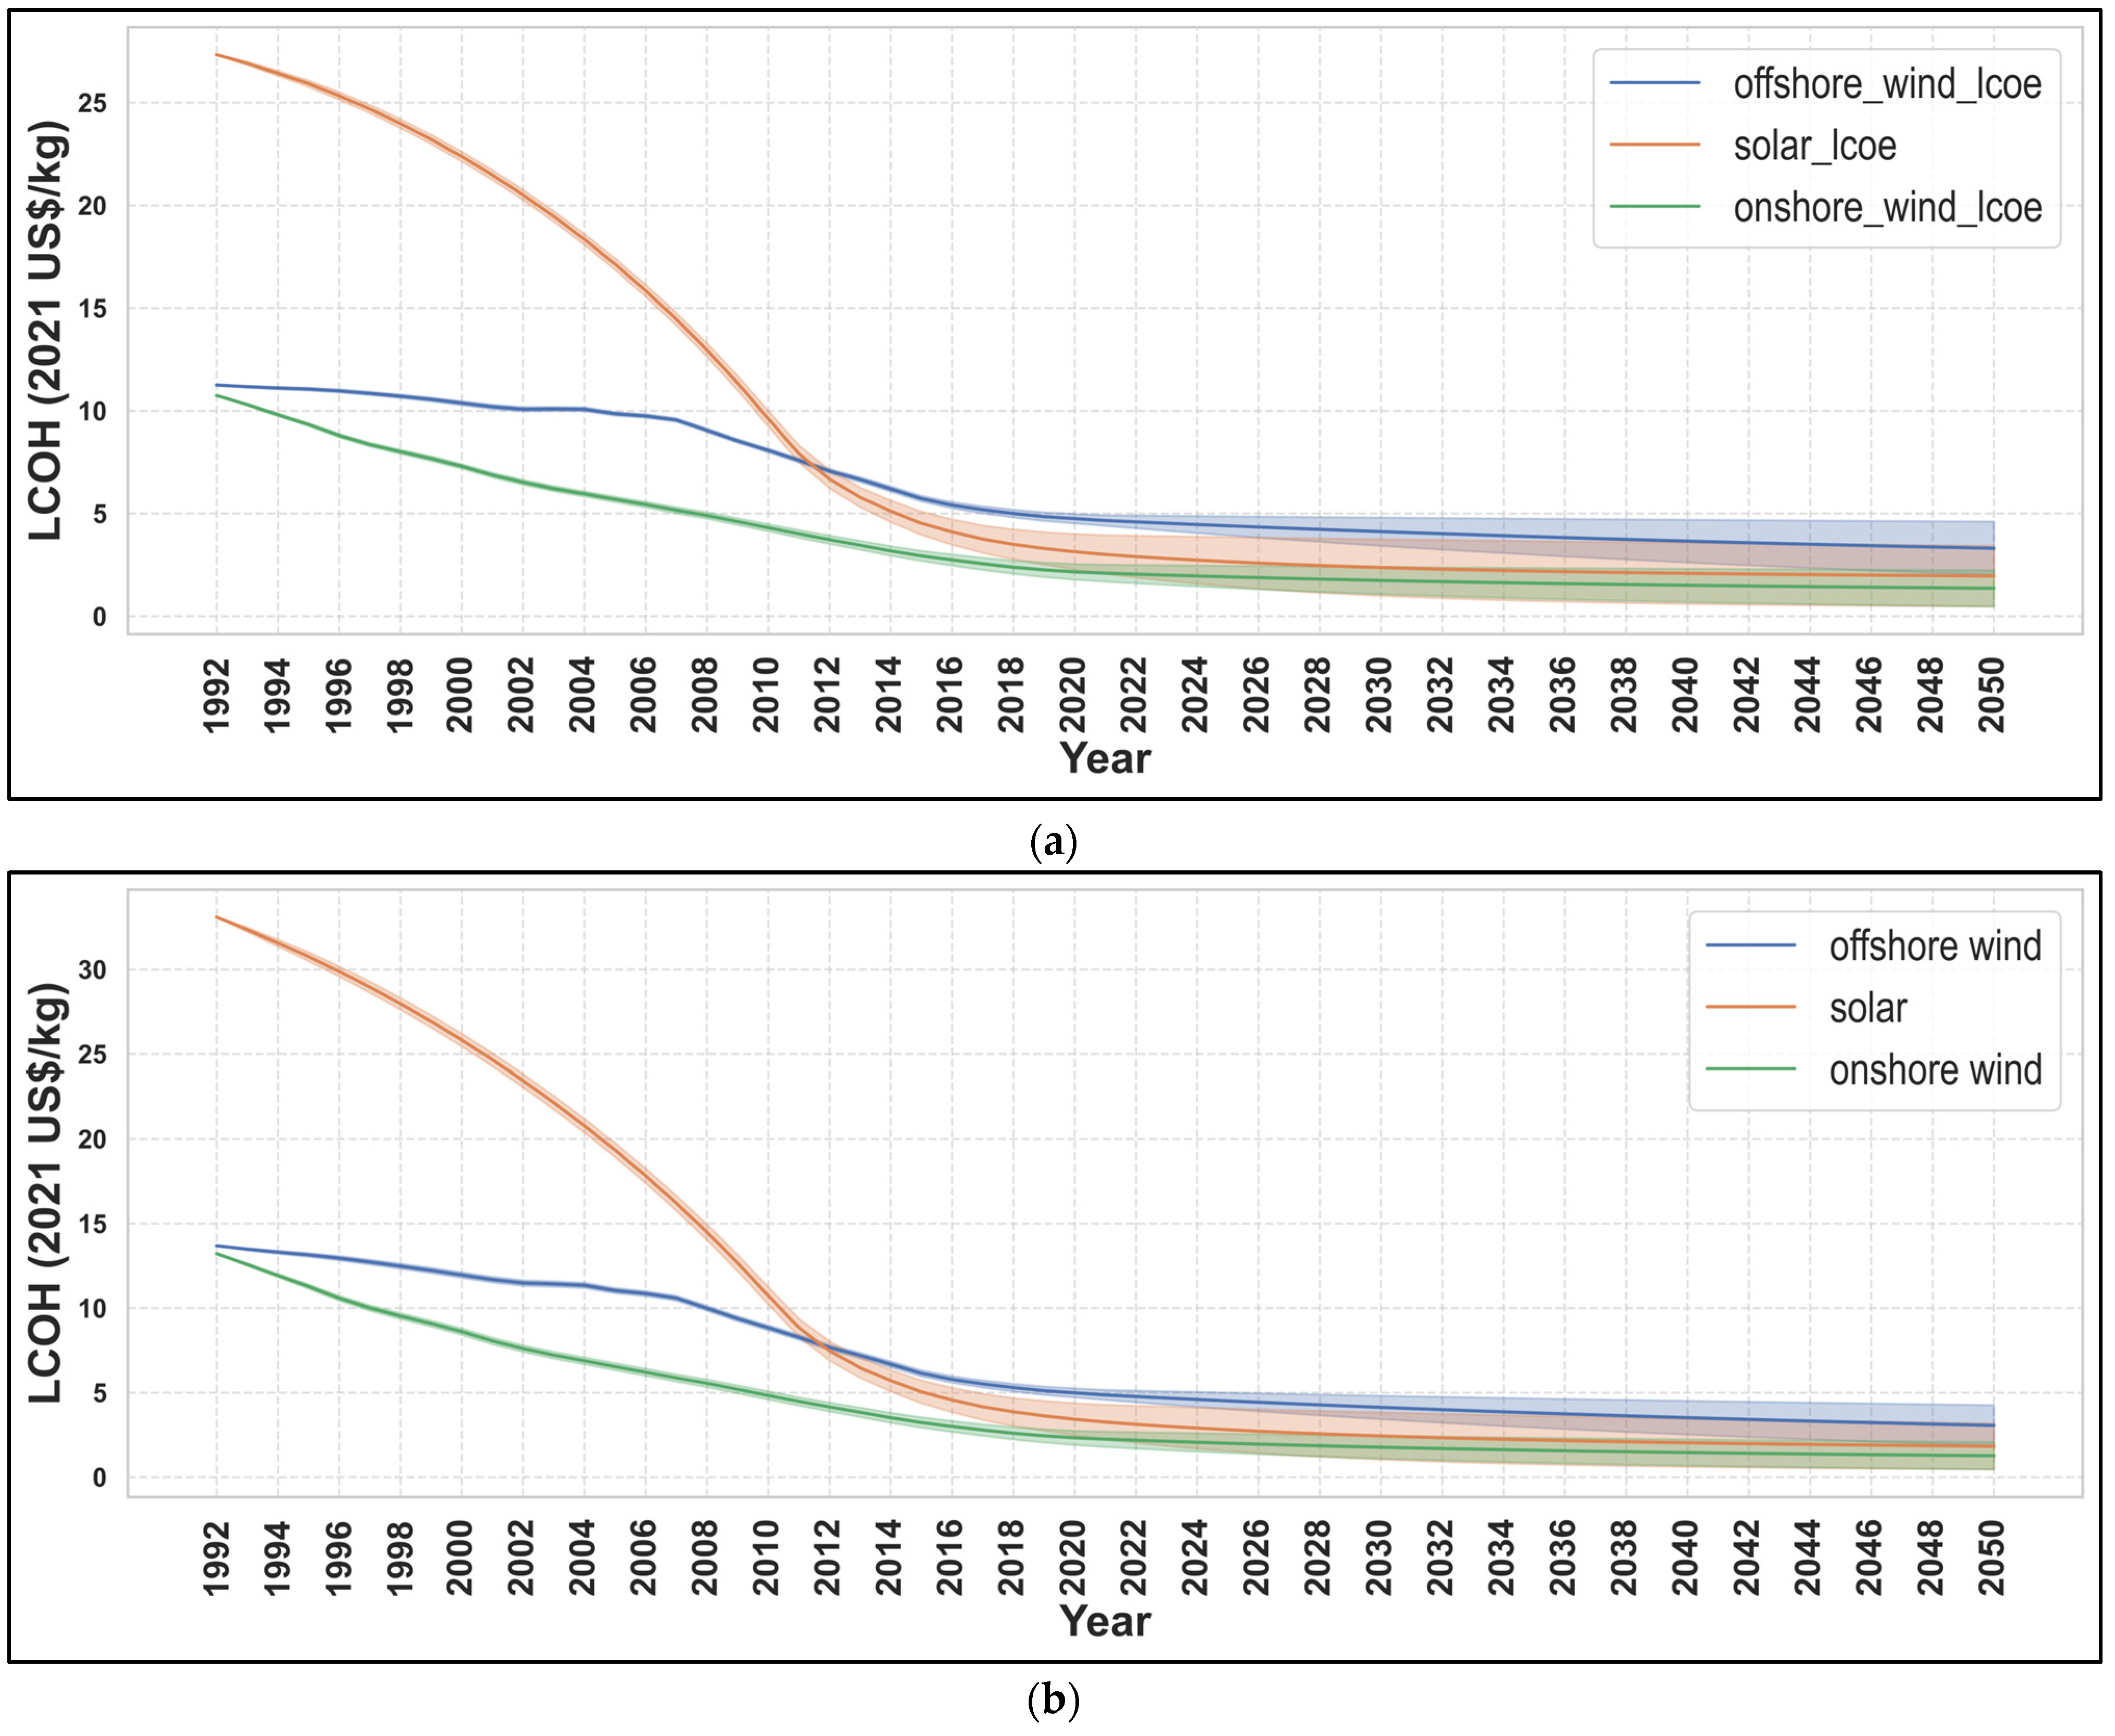
  • The comparative analysis of the global LCOH trajectory from 1992 to 2050 using alkaline and PEM electrolyzers, in combination with offshore wind, solar, and onshore wind energy sources, reveals a consistent decline in LCOH across all scenarios, suggesting improved cost-effectiveness in hydrogen production. However, despite the optimistic reduction in electrolyzer costs, achieving targeted LCOH still requires a significant decline in the LCOE, particularly for solar and onshore wind energy to fully exploit the potential of green hydrogen in the envisioned hydrogen economy, and electrolyzer cost reduction alone may not be sufficient to meet the targeted LCOH.
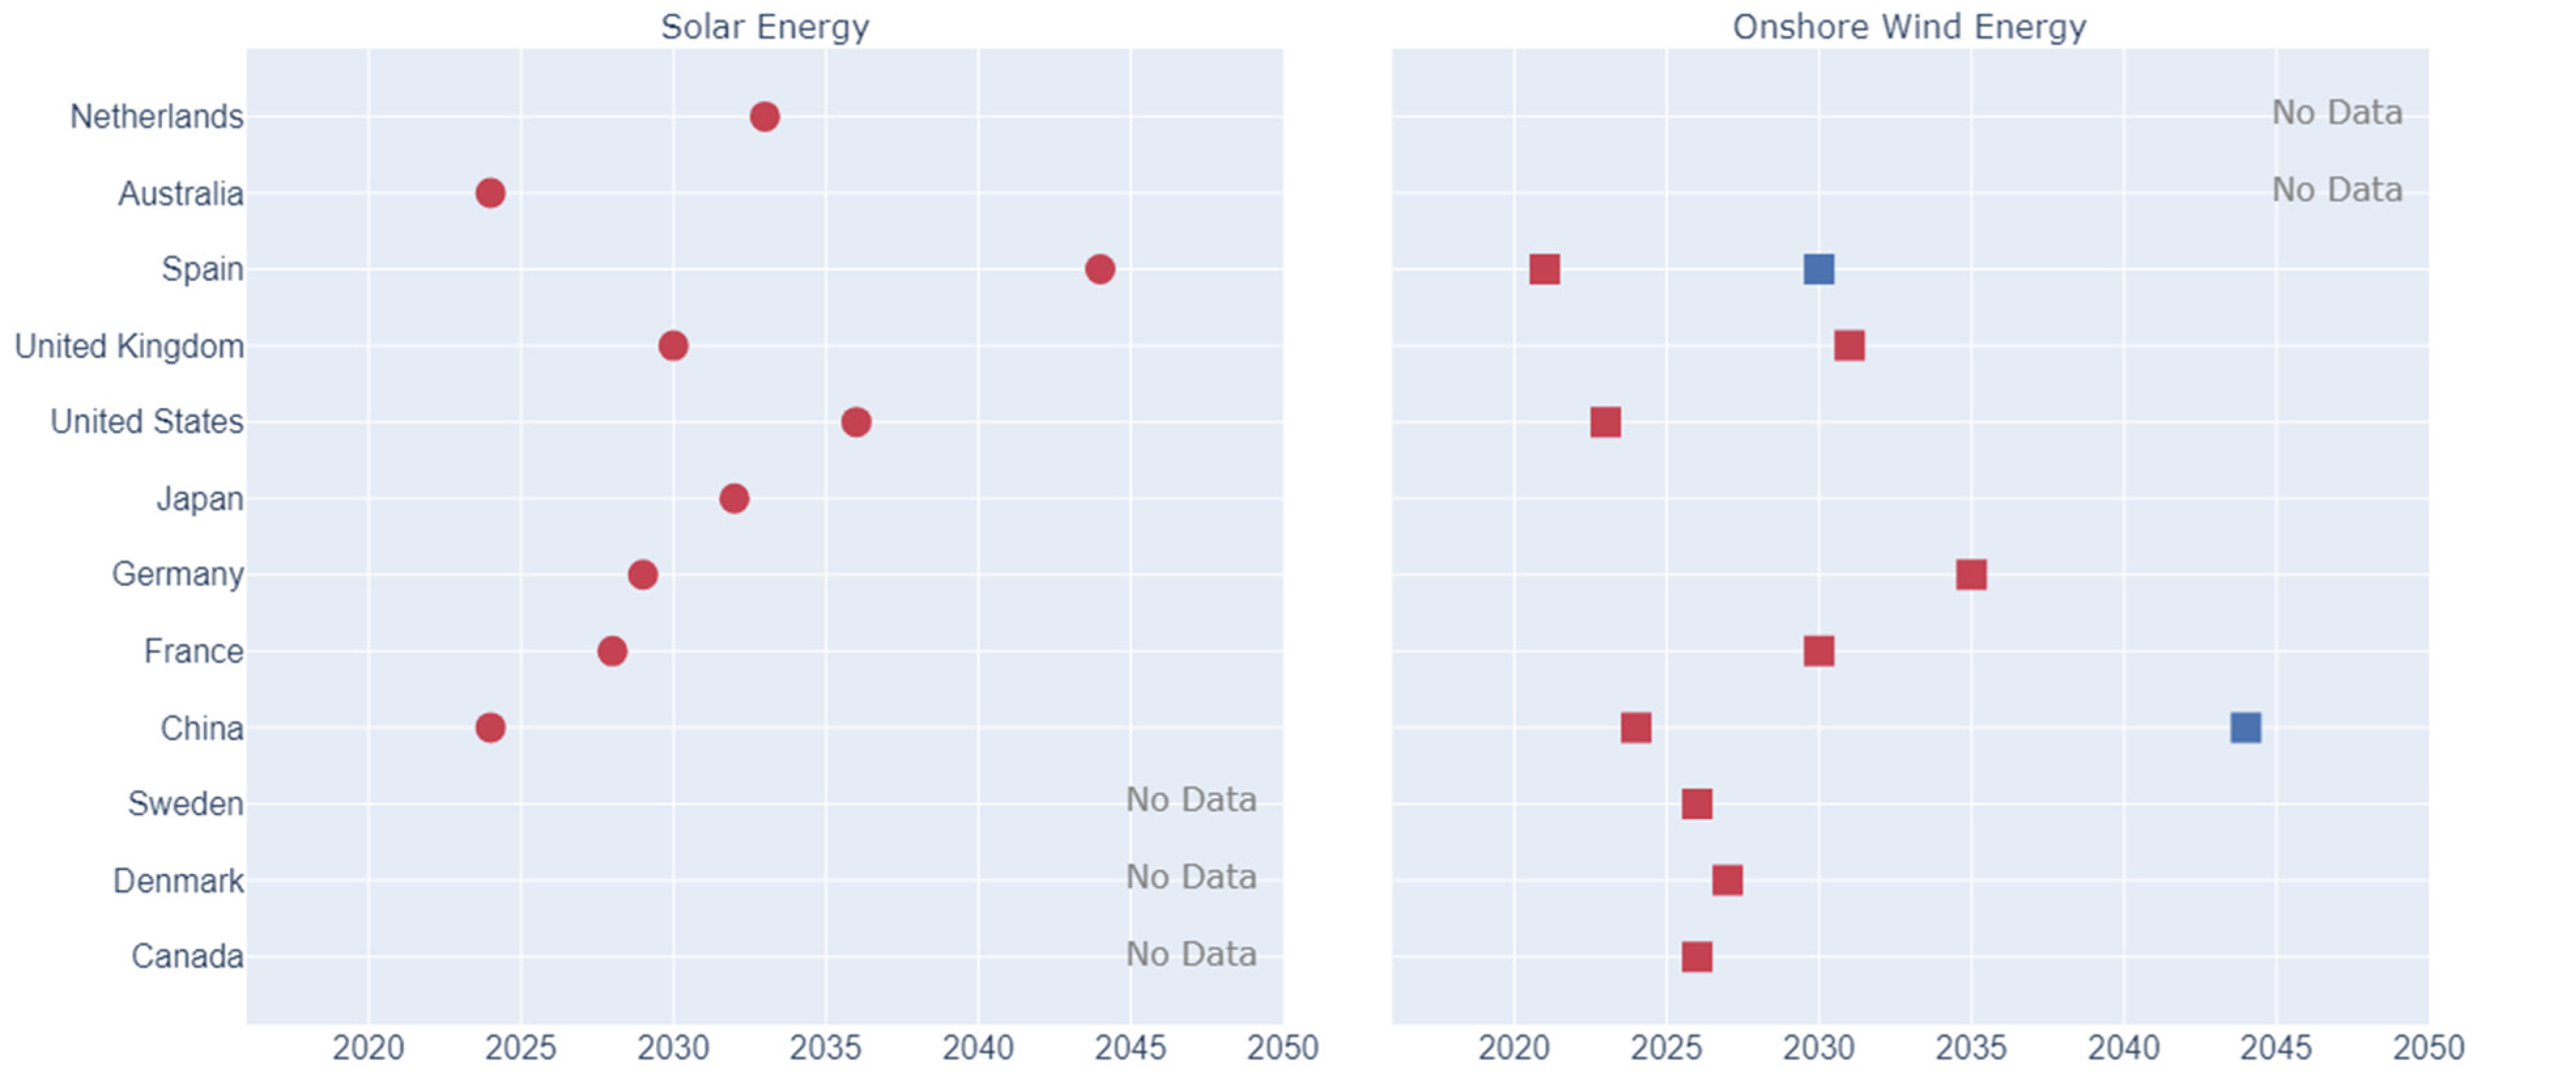
  • Under optimistic scenarios, Spain is projected to reach the LCOH target of 2 USD/kg by 2021, largely due to cheap electricity from onshore wind energy. In a pessimistic scenario, where LCOE and electrolyzer costs remain constant, only China and Spain are expected to reach the LCOH target before 2050, underscoring the necessity of reducing renewable energy costs. These developments have significant implications for the global energy and hydrogen markets, positioning early achievers as potential exporters of green hydrogen, while those achieving targets later are likely to become importers.
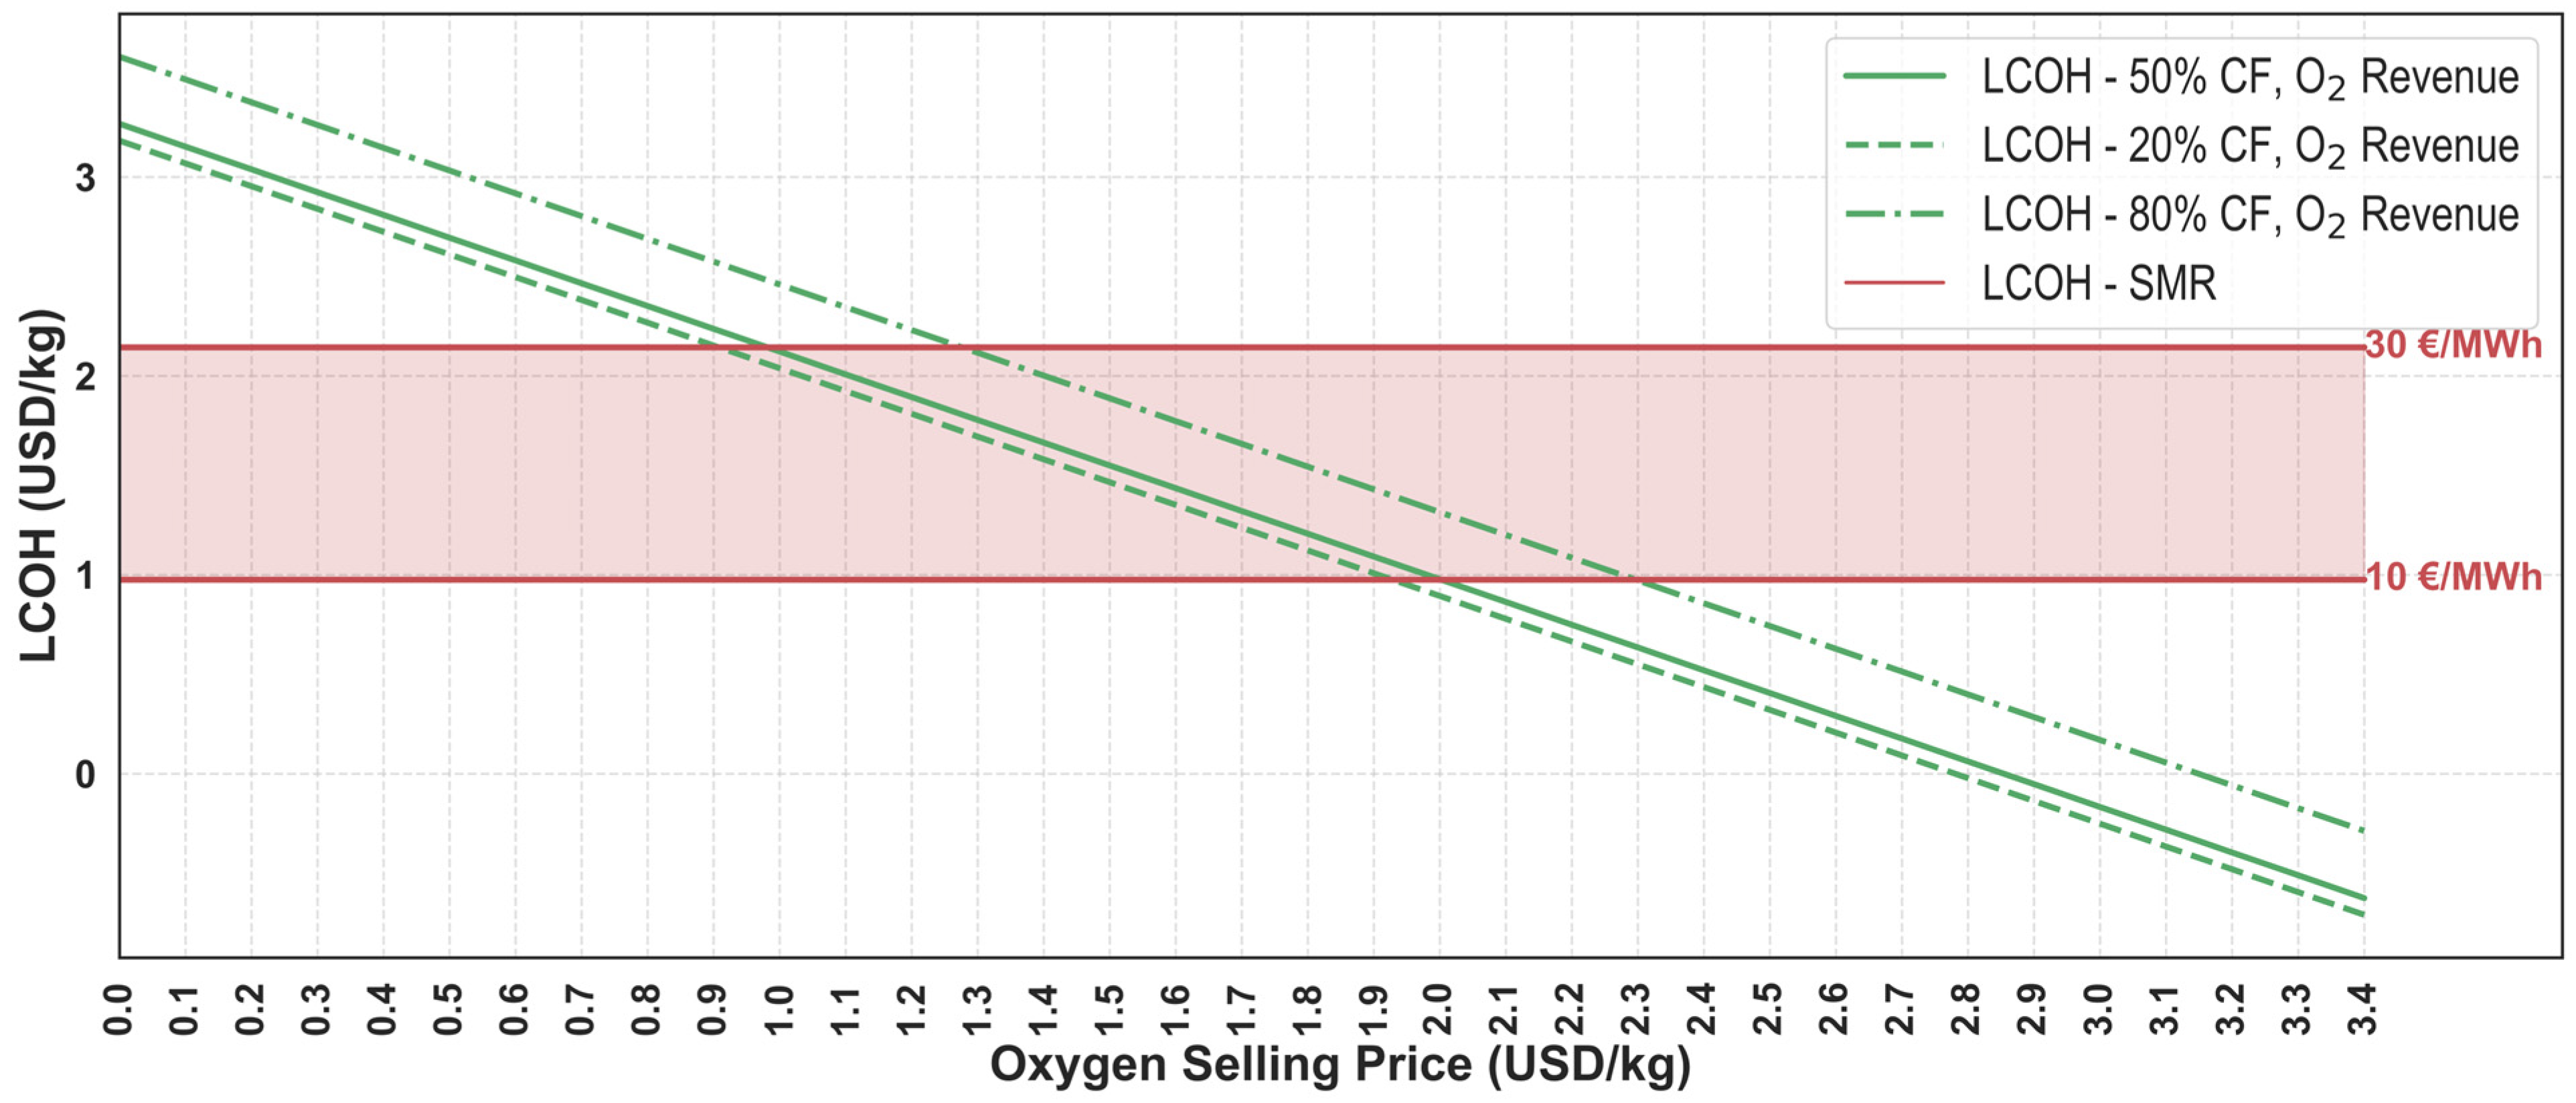
  • A hydrogen credit, similar to a carbon credit market, can serve as a significant financial incentive for companies transitioning to green hydrogen production. The byproduct of oxygen, a valuable resource for various industries, can also be sold to supplement revenue and reduce production costs. The most cost-effective scenario under the provided conditions is the byproduct production, depending on factors such as market demand. Nevertheless, the minimum oxygen selling price of only 2 USD/kgO2 is necessary to be competitive with grey hydrogen production cost at a low gas price of (10 USD/MWh).
  • The economic viability of hydrogen production is highly dependent on electricity pricing and carbon taxes. With the current electrolyzer costs, electricity prices need to drop below 22 USD/MWh for green hydrogen production to compete with grey hydrogen produced from natural gas priced at around 20 USD/MWh. Nevertheless, SMR with CCS/CCUS appears to be the most cost-effective production route with or without carbon tax, which is the most suitable option in the short-medium term. Moreover, strategies such as the Contract for Difference (CfD) scheme could promote the transition to green hydrogen by ensuring price stability for consumers.

Author Contributions

Conceptualization, M.T.Z. and B.C.M.; methodology, M.T.Z.; software, M.T.Z.; validation, M.T.Z. and B.C.M.; data curation, M.T.Z.; writing—original draft preparation, M.T.Z.; writing—review and editing, B.C.M. and M.T.Z.; visualization, M.T.Z.; supervision, B.C.M. All authors have read and agreed to the published version of the manuscript.

Funding

This research received no external funding.

Data Availability Statement

The datasets generated during the current study are available in the following ways: Code, raw & resulted data: GitHub repository is provided as supplementary at the following link: [https://github.com/MTZun97/master-thesis-public]. Interactive visualizations: For a more dynamic exploration of the data, readers can access the interactive dashboard. This platform allows for customized visualizations and further analysis of the data presented. The dashboard can be accessed at the following link: [https://green-hydrogen-analysis.onrender.com].

Conflicts of Interest

The authors declare no conflict of interest.

Abbreviations

The following abbreviations are used in this manuscript:
ALKAlkaline electrolyzer
PEMProton exchange membrane electrolyzer
SOECSolid oxide electrolytic cell electrolyzer
LCOHLevelized cost of hydrogen
LCOELevelized cost of electricity
LOHCLiquid organic hydrogen carrier
CCSCarbon capture and storage
CCUSCarbon capture, utilization, and storage
CfDContract for difference
CH4Methane
MeOHMethanol
H.C.Hydrogen credits

Appendix A. Data Acquisition

In order to conduct a comprehensive analysis, data were collected on three important parameters—cost, efficiency, and system size—with a focus on the cost parameter and the installed capacity data, which is retrieved from the IEA hydrogen production database [32]. Due to their well-established technology and abundance of readily available data, alkaline and PEM electrolyzers are frequently mentioned in the scientific literature as methods for producing hydrogen. However, the lack of country- or region-specific cost data for electrolyzers substantially hinders the ability to comprehensively analyze the most economically viable pathways for hydrogen production. According to [72], costs vary depending on the employed technology and the manufacturer country (US/EU or China). Notably, an interesting observation is that the price per capacity of electrolyzers decreases exponentially with size, regardless of technology or country of origin. Moreover, it is reported that Chinese suppliers typically offer products that are one magnitude cheaper than their Western counterparts. However, there are concerns regarding the reliability and quality of these low-cost alternatives. Although there is a price gap between China and the rest of the world [72], it is expected that global costs will converge with China in the near future. Consequently, the study assumes a globally uniform cost for electrolyzers in accordance with the prevalent practice in prior research due to a lack of reported data for electrolyzers of equivalent quality.
The interpretation and alignment of data from various sources relative to the defined system boundary, which encompasses the entire electrolysis system, represents an additional significant challenge in this study. The designated data collection pertains specifically to the electrolyzer systems as a whole and not to individual cell stacks within the system. This distinction is essential to comprehending the scope of the cost estimates considered in the present study. By considering the entire system, factors such as auxiliary equipment and system integration can be properly accounted for, hopefully resulting in a more realistic estimate of the total cost implications. Different studies have used different interpretations for system boundaries—including the compressor in the electrolyzer cost—and have not consistently provided efficiency and cost data that correspond precisely to the same system boundaries. The considered system boundary for the analysis can be seen in Figure A1.
Figure A1. System boundary-considered electrolyzer systems.
Hydrogen 04 00055 g0a1
To collect scientific articles related to the term “electrolyzer cost”, a comprehensive search was conducted across databases such as Web of Science and Google Scholar. The evaluation included the top 100 search results from both platforms. In addition, the grey literature was examined using the same query on Google’s search engine to collect pricing estimates and specific information from companies and government organizations. In addition, a citation chain approach was implemented. This procedure identified three databases, as in Table A1, and self-collected values from the previous literature. The obtained data estimates were examined and cross-verified, with their origins traced back to their primary sources. This validation process was implemented to ensure the accuracy, dependability, and precision of the collected data. Any sources that could not be successfully traced back to their sources, or references lacking a clear description of the analyzed system, were excluded from the analysis (e.g., merely classifying it as a low- or high-temperature electrolyzer without specifying the precise type). By adhering to these criteria, the study establishes a base of exhaustive and verifiable data sources, thereby enhancing the robustness and credibility of the subsequent data estimates.
Table A1. Summary of 3 databases for electrolyzer cost and year of estimate.
TimelineData PointsResearch Gap
2001–2020123[38]
2000–2030160[31]
1992–201368[37]
In certain scholarly works, there is a substantial discrepancy between the reported cost estimates and the corresponding year’s market valuations. This discrepancy can be attributed to a number of factors, including the omission of a processing phase and overly optimistic estimates. These extreme estimates for electrolyzers were excluded from the study to ensure data integrity. To acquire accurate cost estimates, cost ranges were transformed into the arithmetic mean of the highest and lowest values within the range for all observations, if available. This method ensures a proportionate representation of the cost spectrum and eliminates any bias towards either end of the range. When dealing with cost projections denominated in currencies other than the United States Dollar (USD), the World Bank’s average exchange rate for the corresponding year was used to convert to USD [73]. This conversion was required to eliminate the potential effect of cross-country currency fluctuations and ensure analysis consistency. In order to account for the impact of inflation on historical cost estimates, the World Bank’s harmonized index of consumer prices was used to make adjustments [74]. This inflation adjustment factor facilitates equitable comparisons by reducing the impact of inflationary effects on estimated costs over time.
This study collected a total of 332 data points that were categorized according to the methodology employed in the corresponding articles to derive cost estimates. In particular, 203 data points were related to ALK, 120 to PEM, 7 to SOEC, and others. While most of the literature on hydrogen production has focused on alkaline and PEM electrolyzers due to their well-established technological maturity, there is limited information on the investment costs of SOEC. This knowledge gap is because SOEC installations have not yet attained the level of technological maturity required for accurate techno-economic projections and cost estimates. Consequently, the present study’s analysis, such as determining the cost reduction potential of each technology, which approximates an individual decline rate, scaling effect, and learning rate based on observations of production cost development, is not applicable to emerging technologies with a low Technology Readiness Level (TRL) such as SOEC. These technologies have not yet attained significant market penetration, making accurate cost projections difficult. Therefore, the assumption was made that SOECs are unlikely to play an important role in the mid-term low-carbon hydrogen market, and they were, therefore, excluded from further analysis. Given the extensive discussion surrounding these two electrolyzers in the literature, the scope of this analysis was restricted to these two technologies. This ensured a more concentrated examination of the cost dynamics and associated factors pertinent to alkaline and PEM electrolyzers, which are currently at the forefront of discussions regarding hydrogen production and exhibit greater availability of comprehensive data for analysis.
To assure the quality and consistency of the data, a winsorization procedure was applied, with the exception of the efficiency dataset, because the spread of the data was acceptable. It was applied at the 5% level, which entails removing extreme values outside the 5th and 95th percentiles, thereby minimizing the effect of outliers. All in all, despite significant advances in PEM technology and the emergence of numerous manufacturers on the market over the past few decades, the availability of reported data for alkaline electrolyzers was relatively greater. Obtaining greater data would help to improve our understanding of PEM electrolyzers and their associated cost and performance parameters.

Appendix B. Levelized Cost of Hydrogen Calculation

Table A2. The assumption on the total capital cost of green hydrogen production.
Direct Capital Cost
Stack capital cost 1 [75]= 50 %   o f   e l e c t r o l y z e r   c o s t   f o r   a l k a l i n e 60 %   o f   e l e c t r o l y z e r   c o s t   f o r   P E M
Mechanical capital cost [75]= 20 %   o f   e l e c t r o l y z e r   c o s t   f o r   a l k a l i n e 20 %   o f   e l e c t r o l y z e r   c o s t   f o r   P E M
Electrical capital cost [75]= 30 %   o f   e l e c t r o l y z e r   c o s t   f o r   a l k a l i n e 20 %   o f   e l e c t r o l y z e r   c o s t   f o r   P E M
Installation factor [43]= 1   f o r   m e c h a n i c a l 1.12   f o r   e l e c t r i c a l
Indirect Capital Cost
Stack capital cost =2% of direct capital cost
Mechanical capital cost=1% of direct capital cost
Electrical capital cost=15% of direct capital cost
Installation factor=15% of direct capital cost
Total Capital Cost
Depreciable cost=direct cost + indirect cost
Land cost= l a n d   c o s t × l a n d   r e q u i r e d
Planned replacement cost 2= 50 %   o f   d i r e c t   c a p i t a l   c o s t   f o r   a l k a l i n e 60 %   o f   d i r e c t   c a p i t a l   c o s t   f o r   P E M
Unplanned replacement cost=0.5% of depreciable cost
1 It is assumed that large-scale electrolyzer facilities will employ multiple MW-sized units as opposed to a single stack unit. The electrolyzer is based on a per-unit-capacity basis, rendering the actual system capacity arbitrary and making the model applicable to a variety of capacity scales. 2 The stack’s expected durability is 7 years.
Table A3. The assumption on the operational costs and others of green hydrogen production.
Fixed Operational Cost 1
Labor cost=total plant staff × labor cost per hour × work hour
Overhead GA cost=2% of labor cost
Property tax insurance cost=2% of total capital cost
Material cost=3% of the direct cap
Variable Operational Cost
Water cost=water required × water cost
Electricity cost=LCOE [56]
Others
Decommissioning cost=1% of depreciable cost
Salvage value=1% of depreciable cost
Depreciation costMACRS–15 years
1 In the first year of operational life, only 75% of the fixed operational cost will be accounted for.
Table A4. Cost breakdown of alkaline and PEM electrolyzers [75].
Electrolyzer TypeCurrent Density (A/cm2)StackPower ConditioningGas ConditioningOthers
Alkaline0.2–0.650%15%15%20%
PEM1–260%15%10%15%

Appendix C. Temporal Projection of Electrolyzer System Sizes and Installed Capacity

Figure A2. LHV efficiency projection of alkaline and PEM electrolyzers.
Hydrogen 04 00055 g0a2
Table A5. LHV efficiency projection of alkaline and PEM electrolyzers.
Electrolyzer TypeIncline RateR2 Score
Alkaline0.1%0.01
PEM0.47%0.14
Figure A3. System size projection of alkaline and PEM electrolyzers.
Hydrogen 04 00055 g0a3
Table A6. System size projection of alkaline and PEM electrolyzers.
Electrolyzer TypeIncline RateR2 Score
Alkaline6%0.24
PEM3%0.04
Figure A4. Installed capacity projection of alkaline and PEM electrolyzers.
Hydrogen 04 00055 g0a4
Table A7. Installed capacity projection of alkaline and PEM electrolyzers.
Electrolyzer TypeIncline RateR2 Score
Alkaline10%0.19
PEM20%0.34
Table A8. Cumulative installed capacity projection comparison with other studies.
The LiteratureElectrolyzer Type20302050
Current studyAlkaline
PEM
10.8 GW
5.4 GW
79 GW
320 GW
[4]Total180 GW (APS 1)
850 GW (NZE 2)
-
[15]Total 1350–4530 GW
1 APS: announced pledge scenario; 2 NZE: net zero energy scenario.

Appendix D. Sensitivity Analysis of Alkaline Electrolyzer

Figure A5. Sensitivity analysis LCOH using an alkaline electrolyzer.
Hydrogen 04 00055 g0a5

References

  1. Touili, S.; Alami Merrouni, A.; El Hassouani, Y.; Amrani, A.; Rachidi, S. Analysis of the yield and production cost of large-scale electrolytic hydrogen from different solar technologies and under several Moroccan climate zones. Int. J. Hydrog. Energy 2020, 45, 26785–26799. [Google Scholar] [CrossRef]
  2. IEA. World Energy Outlook 2019; International Energy Agency: Paris, France, 2019. [Google Scholar]
  3. IEA. The Future of Hydrogen: Seizing Today’s Opportunities; International Energy Agency: Paris, France, 2019. [Google Scholar]
  4. IEA. Global Hydrogen Review 2021; International Energy Agency: Paris, France, 2021. [Google Scholar]
  5. Guan, D.; Wang, B.; Zhang, J.; Shi, R.; Jiao, K.; Li, L.; Wang, Y.; Xie, B.; Zhang, Q.; Yu, J.; et al. Hydrogen society: From present to future. Energy Environ. Sci. 2023. [Google Scholar] [CrossRef]
  6. Hubert, M.A.; King, L.A.; Jaramillo, T.F. Evaluating the Case for Reduced Precious Metal Catalysts in Proton Exchange Membrane Electrolyzers. ACS Energy Lett. 2022, 7, 17–23. [Google Scholar] [CrossRef]
  7. Jovan, D.J.; Dolanc, G. Can Green Hydrogen Production Be Economically Viable under Current Market Conditions. Energies 2020, 13, 6599. [Google Scholar] [CrossRef]
  8. Janssen, J.L.L.C.C.; Weeda, M.; Detz, R.J.; van der Zwaan, B. Country-specific cost projections for renewable hydrogen production through off-grid electricity systems. Appl. Energy 2022, 309, 118398. [Google Scholar] [CrossRef]
  9. Shiva Kumar, S.; Himabindu, V. Hydrogen production by PEM water electrolysis—A review. Mater. Sci. Energy Technol. 2019, 2, 442–454. [Google Scholar] [CrossRef]
  10. EIA. Annual Energy Outlook 2022 with Projections to 2050; U.S. Department of Energy: Washington, DC, USA, 2022. [Google Scholar]
  11. Bhandari, R.; Shah, R.R. Hydrogen as energy carrier: Techno-economic assessment of decentralized hydrogen production in Germany. Renew. Energy 2021, 177, 915–931. [Google Scholar] [CrossRef]
  12. Ginsberg, M.J.; Venkatraman, M.; Esposito, D.V.; Fthenakis, V.M. Minimizing the cost of hydrogen production through dynamic polymer electrolyte membrane electrolyzer operation. Cell Rep. Phys. Sci. 2022, 3, 100935. [Google Scholar] [CrossRef]
  13. Carmo, M.; Fritz, D.; Mergel, J.; Stolten, D. A comprehensive review on PEM water electrolysis. Int. J. Hydrog. Energy 2013, 38, 4901–4934. [Google Scholar] [CrossRef]
  14. Hosseini, S.E.; Wahid, M.A. Hydrogen production from renewable and sustainable energy resources: Promising green energy carrier for clean development. Renew. Sustain. Energy Rev. 2016, 57, 850–866. [Google Scholar] [CrossRef]
  15. Böhm, H.; Zauner, A.; Rosenfeld, D.C.; Tichler, R. Projecting cost development for future large-scale power-to-gas implementations by scaling effects. Appl. Energy 2020, 264, 114780. [Google Scholar] [CrossRef]
  16. Panah, P.G.; Cui, X.; Bornapour, M.; Hooshmand, R.-A.; Guerrero, J.M. Marketability analysis of green hydrogen production in Denmark: Scale-up effects on grid- connected electrolysis. Int. J. Hydrog. Energy 2022, 47, 12443–12455. [Google Scholar] [CrossRef]
  17. Perez, R.J.; Brent, A.C.; Hinkley, J. Assessment of the Potential for Green Hydrogen Fuelling of Very Heavy Vehicles in New Zealand. Energies 2021, 14, 2636. [Google Scholar] [CrossRef]
  18. IRENA. Green Hydrogen Cost Reduction: Scaling up Electrolysers to Meet the 1.5 °C Climate Goal; National Renewable Energy Laboratory: Abu Dhabi, United Arab Emirates, 2020. [Google Scholar]
  19. Götz, M.; Lefebvre, J.; Mörs, F.; McDaniel Koch, A.; Graf, F.; Bajohr, S.; Reimert, R.; Kolb, T. Renewable Power-to-Gas: A technological and economic review. Renew. Energy 2016, 85, 1371–1390. [Google Scholar] [CrossRef]
  20. Graf, F.; Götz, M.; Schaaf, T.; Tichler, R. Technoökonomische Studie von Power-to-Gas-Konzepten Teilprojekte B-D Abschlussbericht; DVGW: Bonn, Germany, 2014. [Google Scholar]
  21. Müller-Syring, G.; Henel, M.; Köppel, W.; Mlaker, H. Entwicklung von Modularen Konzepten zur Erzeugung, Speicherung und Einspeisung von Wasserstoff und Methan ins Erdgasnetz; DVGW: Bonn, Germany, 2013. [Google Scholar]
  22. Graf, F.; Götz, M.; Wonneberger, A.-M.; Köppel, W. Techno-Ökonomische Studie zur Biologischen Methanisierung bei PtG-Konzepten; DVGW: Bonn, Germany, 2014. [Google Scholar] [CrossRef]
  23. Aicher, T.; González, M.; Schaub, G.; Götz, M. Arbeitspaket 5: Betrachtungen des Gesamtsystems im Hinblick auf Dynamik und Prozessintegration. Energ. Wasser-Prax. 2014, 65, 51–55. [Google Scholar]
  24. Buchholz, O.S.; van der Ham, A.G.J.; Veneman, R.; Brilman, D.W.F.; Kersten, S.R.A. Power-to-Gas: Storing surplus electrical energy. A design study. Energy Procedia 2014, 63, 7993–8009. [Google Scholar] [CrossRef]
  25. Lehner, M.; Tichler, R.; Steinmüller, H.; Koppe, M. Power-to-Gas: Technology and Business Models; Springer International Publishing: Cham, Switzerland, 2014. [Google Scholar] [CrossRef]
  26. Zhang, Y.; Wang, N.; Tong, X.; Duan, L.; Lin, T.-E.; Maréchal, F.; Van Herle, J.; Wang, L.; Yang, Y. Reversible solid-oxide cell stack based power-to-x-to-power systems: Economic potential evaluated via plant capital-cost target. Appl. Energy 2021, 290, 116700. [Google Scholar] [CrossRef]
  27. McDonagh, S.; Ahmed, S.; Desmond, C.; Murphy, J.D. Hydrogen from offshore wind: Investor perspective on the profitability of a hybrid system including for curtailment. Appl. Energy 2020, 265, 114732. [Google Scholar] [CrossRef]
  28. Gutiérrez-Martín, F.; Ochoa-Mendoza, A.; Rodríguez-Antón, L.M. Pre-investigation of water electrolysis for flexible energy storage at large scales: The case of the Spanish power system. Int. J. Hydrog. Energy 2015, 40, 5544–5551. [Google Scholar] [CrossRef]
  29. Oi, T.; Wada, K. Feasibility study on hydrogen refueling infrastructure for fuel cell vehicles using the off-peak power in Japan. Int. J. Hydrog. Energy 2004, 29, 347–354. [Google Scholar] [CrossRef]
  30. Matute, G.; Yusta, J.M.; Beyza, J.; Correas, L.C. Multi-state techno-economic model for optimal dispatch of grid connected hydrogen electrolysis systems operating under dynamic conditions. Int. J. Hydrog. Energy 2021, 46, 1449–1460. [Google Scholar] [CrossRef]
  31. Glenk, G.; Reichelstein, S. Economics of converting renewable power to hydrogen. Nat. Energy 2019, 4, 216–222. [Google Scholar] [CrossRef]
  32. IEA. Hydrogen Project Database; IEA: Paris, France, 2022. [Google Scholar]
  33. Schmidt, O.; Hawkes, A.; Gambhir, A.; Staffell, I. The future cost of electrical energy storage based on experience rates. Nature Energy 2017, 2, 17110. [Google Scholar] [CrossRef]
  34. Böhm, H.; Goers, S.; Zauner, A. Estimating future costs of power-to-gas—A component-based approach for technological learning. Int. J. Hydrog. Energy 2019, 44, 30789–30805. [Google Scholar] [CrossRef]
  35. Schmidt, O.; Gambhir, A.; Staffell, I.; Hawkes, A.; Nelson, J.; Few, S. Future cost and performance of water electrolysis: An expert elicitation study. Int. J. Hydrog. Energy 2017, 42, 30470–30492. [Google Scholar] [CrossRef]
  36. Schoots, K.; Ferioli, F.; Kramer, G.; Vanderzwaan, B. Learning curves for hydrogen production technology: An assessment of observed cost reductions. Int. J. Hydrog. Energy 2008, 33, 2630–2645. [Google Scholar] [CrossRef]
  37. Saba, S.M.; Müller, M.; Robinius, M.; Stolten, D. The investment costs of electrolysis—A comparison of cost studies from the past 30 years. Int. J. Hydrog. Energy 2018, 43, 1209–1223. [Google Scholar] [CrossRef]
  38. Reksten, A.H.; Thomassen, M.S.; Møller-Holst, S.; Sundseth, K. Projecting the future cost of PEM and alkaline water electrolysers; a CAPEX model including electrolyser plant size and technology development. Int. J. Hydrog. Energy 2022, 47, 38106–38113. [Google Scholar] [CrossRef]
  39. Mayyas, A.; Mann, M. Emerging Manufacturing Technologies for Fuel Cells and Electrolyzers. Procedia Manuf. 2019, 33, 508–515. [Google Scholar] [CrossRef]
  40. Elshurafa, A.; Albardi, S.; Bollino, C.A. Estimating the Learning Curve of Solar PV Balance-of-Systems for Over 20 Countries. J. Clean. Prod. 2018, 196, 122–134. [Google Scholar] [CrossRef]
  41. Jamasb, T. Learning Curves for Energy Technology: A Critical Assessment; Cambridge University: Cambridge, UK, 2007. [Google Scholar]
  42. Nykvist, B.; Nilsson, M. Rapidly falling costs of battery packs for electric vehicles. Nat. Clim. Chang. 2015, 5, 329–332. [Google Scholar] [CrossRef]
  43. Ministry of Industry and Trade of the Czech Republic. The Czech Republic’s Hydrogen Strategy; Ministry of Industry and Trade of the Czech Republic: Prague, Czech Republic, 2021. [Google Scholar]
  44. Statista Global. Solar PV Capacity Factor. 2021. Available online: https://www.statista.com/statistics/799330/global-solar-pv-installation-cost-per-kilowatt/ (accessed on 26 September 2023).
  45. IRENA. Future of Wind: Deployment, Investment, Technology, Grid Integration and Socio-Economic Aspects (A Global Energy Transformation Paper); International Renewable Energy Agency: Abu Dhabi, United Arab Emirates, 2019. [Google Scholar]
  46. Statista Global. Offshore Wind Capacity Factor. 2021. Available online: https://www.statista.com/statistics/1368679/global-offshore-wind-capacity-factor/ (accessed on 26 September 2023).
  47. Zoulias, M.; Gløckner, R.; Lymberopoulos, N.; Vosseler, I.; Tsoutsos, T.; Mydske, H.J.; Brodin, M.; Taylor, P. Market Potential Analysis for the Introduction of Hydrogen Energy Technology in Stand-Alone Power Systems; CRES: Pikermi, Greece, 2004. [Google Scholar]
  48. Rogner, H.-H. Hydrogen technologies and the technology learning curve. Int. J. Hydrog. Energy 1998, 23, 833–840. [Google Scholar] [CrossRef]
  49. Buttler, A.; Spliethoff, H. Current status of water electrolysis for energy storage, grid balancing and sector coupling via power-to-gas and power-to-liquids: A review. Renew. Sustain. Energy Rev. 2018, 82, 2440–2454. [Google Scholar] [CrossRef]
  50. Carberry, J.J.; Fair, J.R.; Schowalter, W.P.; Tipell, M.; Wei, J.; Peters, M.S. Plant Design and Economics for Chemical Engineers, 4th ed.; McGraw Hill: New York, NY, USA, 1991. [Google Scholar]
  51. IRENA. Global Hydrogen Trade to Meet the 1.5 °C Climate Goal: Part III—Green Hydrogen Cost and Potential; International Renewable Energy Agency: Abu Dhabi, United Arab Emirates, 2022. [Google Scholar]
  52. BloombergNEF. New Energy Outlook 2022; Bloomberg: New York, NY, USA, 2019. [Google Scholar]
  53. Kaldellis, J.K.; Kapsali, M. Shifting towards offshore wind energy—Recent activity and future development. Energy Policy 2013, 53, 136–148. [Google Scholar] [CrossRef]
  54. Rezaei, M.; Akimov, A.; Gray, E.M. Economics of solar-based hydrogen production: Sensitivity to financial and technical factors. Int. J. Hydrog. Energy 2022, 47, 27930–27943. [Google Scholar] [CrossRef]
  55. Ainscough, P. Hydrogen Production cost from PEM Electrolysis; U.S. Department of Energy: Washington, DC, USA, 2014. [Google Scholar]
  56. Our World in Data. Levelized Cost of Energy by Technology. Our World in Data. 2021. Available online: https://ourworldindata.org/grapher/levelized-cost-of-energy (accessed on 9 July 2023).
  57. Brändle, G.; Schönfisch, M.; Schulte, S. Estimating long-term global supply costs for low-carbon hydrogen. Appl. Energy 2021, 302, 117481. [Google Scholar] [CrossRef]
  58. Khan, M.H.A.; Daiyan, R.; Han, Z.; Hablutzel, M.; Haque, N.; Amal, R.; MacGill, I. Designing optimal integrated electricity supply configurations for renewable hydrogen generation in Australia. iScience 2021, 24, 102539. [Google Scholar] [CrossRef]
  59. Wappler, M.; Unguder, D.; Lu, X.; Ohlmeyer, H.; Teschke, H.; Lueke, W. Building the green hydrogen market—Current state and outlook on green hydrogen demand and electrolyzer manufacturing. Int. J. Hydrog. Energy 2022, 47, 33551–33570. [Google Scholar] [CrossRef]
  60. Blanco, H.; Nijs, W.; Ruf, J.; Faaij, A. Potential for hydrogen and Power-to-Liquid in a low-carbon EU energy system using cost optimization. Appl. Energy 2018, 232, 617–639. [Google Scholar] [CrossRef]
  61. Dong, Z.Y.; Yang, J.; Yu, L.; Daiyan, R.; Amal, R. A green hydrogen credit framework for international green hydrogen trading towards a carbon neutral future. Int. J. Hydrog. Energy 2022, 47, 728–734. [Google Scholar] [CrossRef]
  62. Kazi, M.-K.; Eljack, F.; El-Halwagi, M.M.; Haouari, M. Green hydrogen for industrial sector decarbonization: Costs and impacts on hydrogen economy in qatar. Comput. Chem. Eng. 2021, 145, 107144. [Google Scholar] [CrossRef]
  63. Nicita, A.; Maggio, G.; Andaloro, A.P.F.; Squadrito, G. Green hydrogen as feedstock: Financial analysis of a photovoltaic-powered electrolysis plant. Int. J. Hydrog. Energy 2020, 45, 11395–11408. [Google Scholar] [CrossRef]
  64. Finke, C.E.; Leandri, H.F.; Karumb, E.T.; Zheng, D.; Hoffmann, M.R.; Fromer, N.A. Economically advantageous pathways for reducing greenhouse gas emissions from industrial hydrogen under common, current economic conditions. Energy Environ. Sci. 2021, 14, 1517–1529. [Google Scholar] [CrossRef]
  65. Bellotti, D.; Rivarolo, M.; Magistri, L.; Massardo, A.F. Feasibility study of methanol production plant from hydrogen and captured carbon dioxide. J. CO2 Util. 2017, 21, 132–138. [Google Scholar] [CrossRef]
  66. Kato, T.; Kubota, M.; Kobayashi, N.; Suzuoki, Y. Effective utilization of by-product oxygen from electrolysis hydrogen production. Energy 2005, 30, 2580–2595. [Google Scholar] [CrossRef]
  67. Dorris, C.; Lu, E.; Park, S.; Toro, F. High-Purity Oxygen Production Using Mixed Ionic-Electronic Conducting Sorbents; University of Pennsylvania: Philadelphia, PA, USA, 2016. [Google Scholar]
  68. Hurskainen, M. Industrial Oxygen Demand in Finland; Technical Research Centre of Finland VTT Ltd.: Espoo, Finland, 2017. [Google Scholar]
  69. Ebrahimi, A.; Meratizaman, M.; Akbarpour Reyhani, H.; Pourali, O.; Amidpour, M. Energetic, exergetic and economic assessment of oxygen production from two columns cryogenic air separation unit. Energy 2015, 90, 1298–1316. [Google Scholar] [CrossRef]
  70. Nami, H.; Rizvandi, O.B.; Chatzichristodoulou, C.; Hendriksen, P.V.; Frandsen, H.L. Techno-economic analysis of current and emerging electrolysis technologies for green hydrogen production. Energy Convers. Manag. 2022, 269, 116162. [Google Scholar] [CrossRef]
  71. Muellerlanger, F.; Tzimas, E.; Kaltschmitt, M.; Peteves, S. Techno-economic assessment of hydrogen production processes for the hydrogen economy for the short and medium term. Int. J. Hydrog. Energy 2007, 32, 3797–3810. [Google Scholar] [CrossRef]
  72. Gallandat, N.; Romanowicz, K.; Züttel, A. An Analytical Model for the Electrolyser Performance Derived from Materials Parameters. J. Power Energy Eng. 2017, 5, 34–49. [Google Scholar] [CrossRef]
  73. The World Bank. Official Exchange Rate. World Bank Open Data 2023. Available online: https://data.worldbank.org (accessed on 8 July 2023).
  74. The World Bank. Inflation, Consumer Prices. 2023. Available online: https://data.worldbank.org/indicator/FP.CPI.TOTL.ZG (accessed on 8 July 2023).
  75. Bertuccioli, L.; Chan, A.; Hart, D.; Lehner, F.; Madden, B.; Standen, E. Development of Water Electrolysis in the European Union; Fuel Cells and Hydrogen Joint Undertaking: Brussels, Belgium, 2014. [Google Scholar]
Figure 1. Current and potential flow from hydrogen production to application (drawn by authors on the basis of data from [32]) (CH4: methane, LOHC: liquid organic hydrogen carrier, MeOH: methanol, NG w CCUS: natural gas with carbon capture, utilization, and storage, ALK: alkaline, PEM, polymer electrolyte membrane, SOEC: solid oxide electrolytic cell, H2: hydrogen).
Hydrogen 04 00055 g001
Figure 2. Flow diagram: (a) single curve fitting; (b) double curve fitting.
Hydrogen 04 00055 g002
Figure 4. Cost projection of alkaline and PEM Electrolyzer: (a) single curve fitting (b) double curve fitting).
Hydrogen 04 00055 g004
Figure 5. Scaling effect of alkaline and PEM electrolyzer (cost vs. system size).
Hydrogen 04 00055 g005
Figure 6. The technological learning rate of alkaline and PEM electrolyzers using double curve fitting.
Hydrogen 04 00055 g006
Figure 7. Combined cost reduction potential of alkaline and PEM electrolyzers.
Hydrogen 04 00055 g007
Figure 8. Global levelized cost of green hydrogen from different renewable energy sources using (a) alkaline electrolyzer and (b) PEM electrolyzer.
Hydrogen 04 00055 g008
Figure 9. Cost breakdown of LCOH for the baseline scenario.
Hydrogen 04 00055 g009
Figure 10. Sensitivity analysis LCOH using PEM electrolyzer: (a) capacity factor = 0.39; (b) capacity factor = 0.2.
Hydrogen 04 00055 g010
Figure 11. Timeline plot of case study countries to achieve LCOH lower than 2 USD/kg. Optimistic (red circle and square); Pessimistic (bule square). (If a country’s data are not provided and ‘No Data’ is not specified, it indicates that the country will not achieve the target LCOH in either the optimistic or pessimistic scenario.).
Hydrogen 04 00055 g011
Figure 12. Impact of additional oxygen revenue stream to LCOH.
Hydrogen 04 00055 g012
Figure 13. LCOH comparison: green, grey, and blue hydrogen.
Hydrogen 04 00055 g013
Table 1. Summary of the previous literature on the cost reduction potential of electrolyzers and highlighted research gap.
ReferencesElectrolyzer TypeLearning RateResearch Gap
[4]-15%
-
derived from the literature review without explicit specification of the type of electrolyzer.
[15,34]Alkaline18.8%
-
computed the stack-level learning rate by employing pre-determined learning rates for individual components.
-
derived the system learning rate based on the assumption that SOEC will have a share of 40% in total electrolyzer production.
PEM18%
SOEC28%
[35]Alkaline18%
-
derived the learning rate solely based on the expert’s opinions.
PEM18%
SOEC28%
[36]-18%
-
derived the learning rate without explicit specification of the type of electrolyzer.
[38]Alkaline25.1%
-
derived the learning rate based on the average cost per year of electrolyzers.
PEM36.4%
[18]-16–21%
-
based on the assumption that the potential learning rate of fuel cells and electrolyzers is similar to solar PV.
Table 2. Summary of calculation steps.
FunctionInputOutput
Exponential
f x , a , b = a × e b x
year, costRate of change, parameter projection
year, system size
year, installed capacity
Power
f x , a , b = a × x b
cost, system sizeScaling effect
cost, installed capacityLearning rate
Table 3. Combined cost reduction potential of alkaline and PEM electrolyzers using double curve fitting (additional decline based on the reference of cost achieved by R&D activities in 2050).
TechnologyAlkalinePEM
Time (R&D activities)–2050 Value388 USD/kW286 USD/kW
Time + Scaling Effect−54%−44%
Time + Technological Learning−47%−76%
Time + Scaling Effect + Technological Learning−77%−79%
Table 4. Comparison of electrolyzer costs with those in the previous literature for 2030 in USD2021/kW.
SourceAlkalinePEM
Current study270–712243–679
[51]<126<126
[3]252412
[31]230–322230–414
[37]276–417311
[52]72–85268–630
Table 5. Values used in sensitivity analysis (±30%).
ParametersDecrease in LCOHBaseline
(2021 Values)
Increase in LCOH
Electrolyzer efficiency (%)83.264
(Appendix C: efficiency projection)
44.8
Capacity factor (%)50.739
(offshore wind)
27.3
Electrolyzer cost (USD/kW)701.41002
(cost projection: R&D)
1302.6
Electricity price (USD/kWh)0.0560.08
(offshore wind [56])
0.104
Water cost (USD/gal)0.001610.0023
(The United States [39])
0.00299
Disclaimer/Publisher’s Note: The statements, opinions and data contained in all publications are solely those of the individual author(s) and contributor(s) and not of MDPI and/or the editor(s). MDPI and/or the editor(s) disclaim responsibility for any injury to people or property resulting from any ideas, methods, instructions or products referred to in the content.

