
A Review on Mathematical Modeling of Different Biological Methods of Hydrogen Production


Abstract
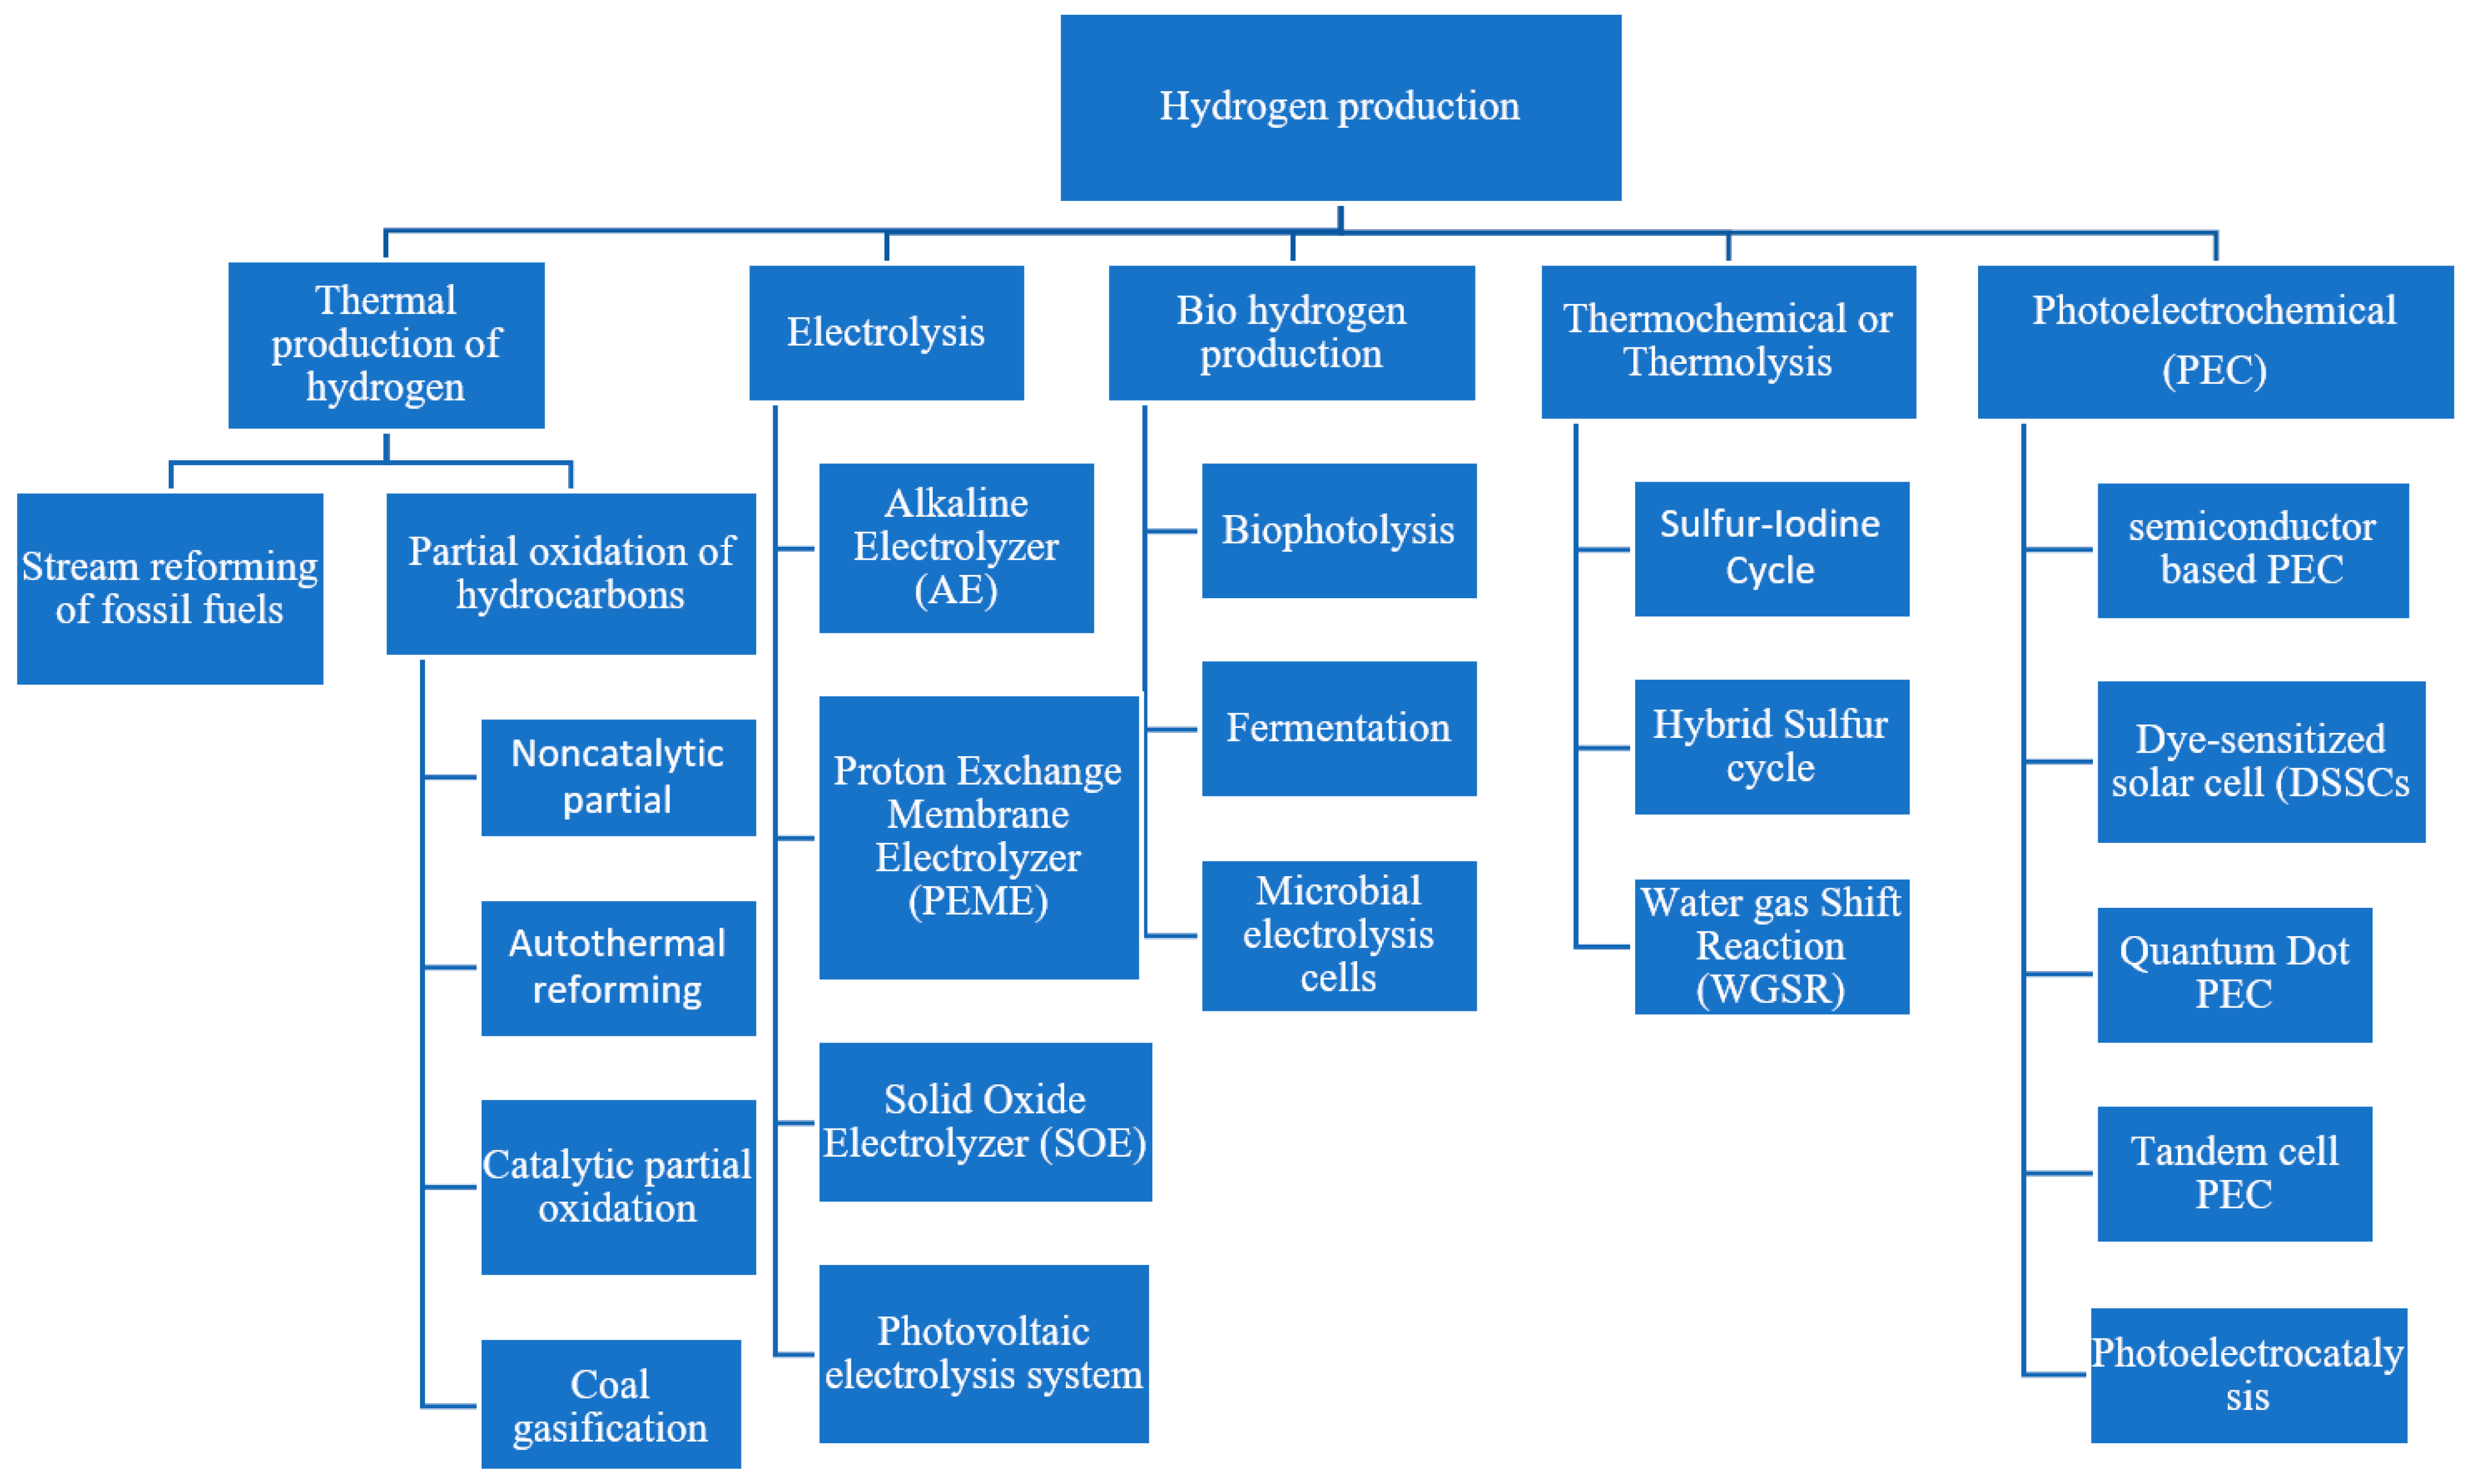
:1. Introduction
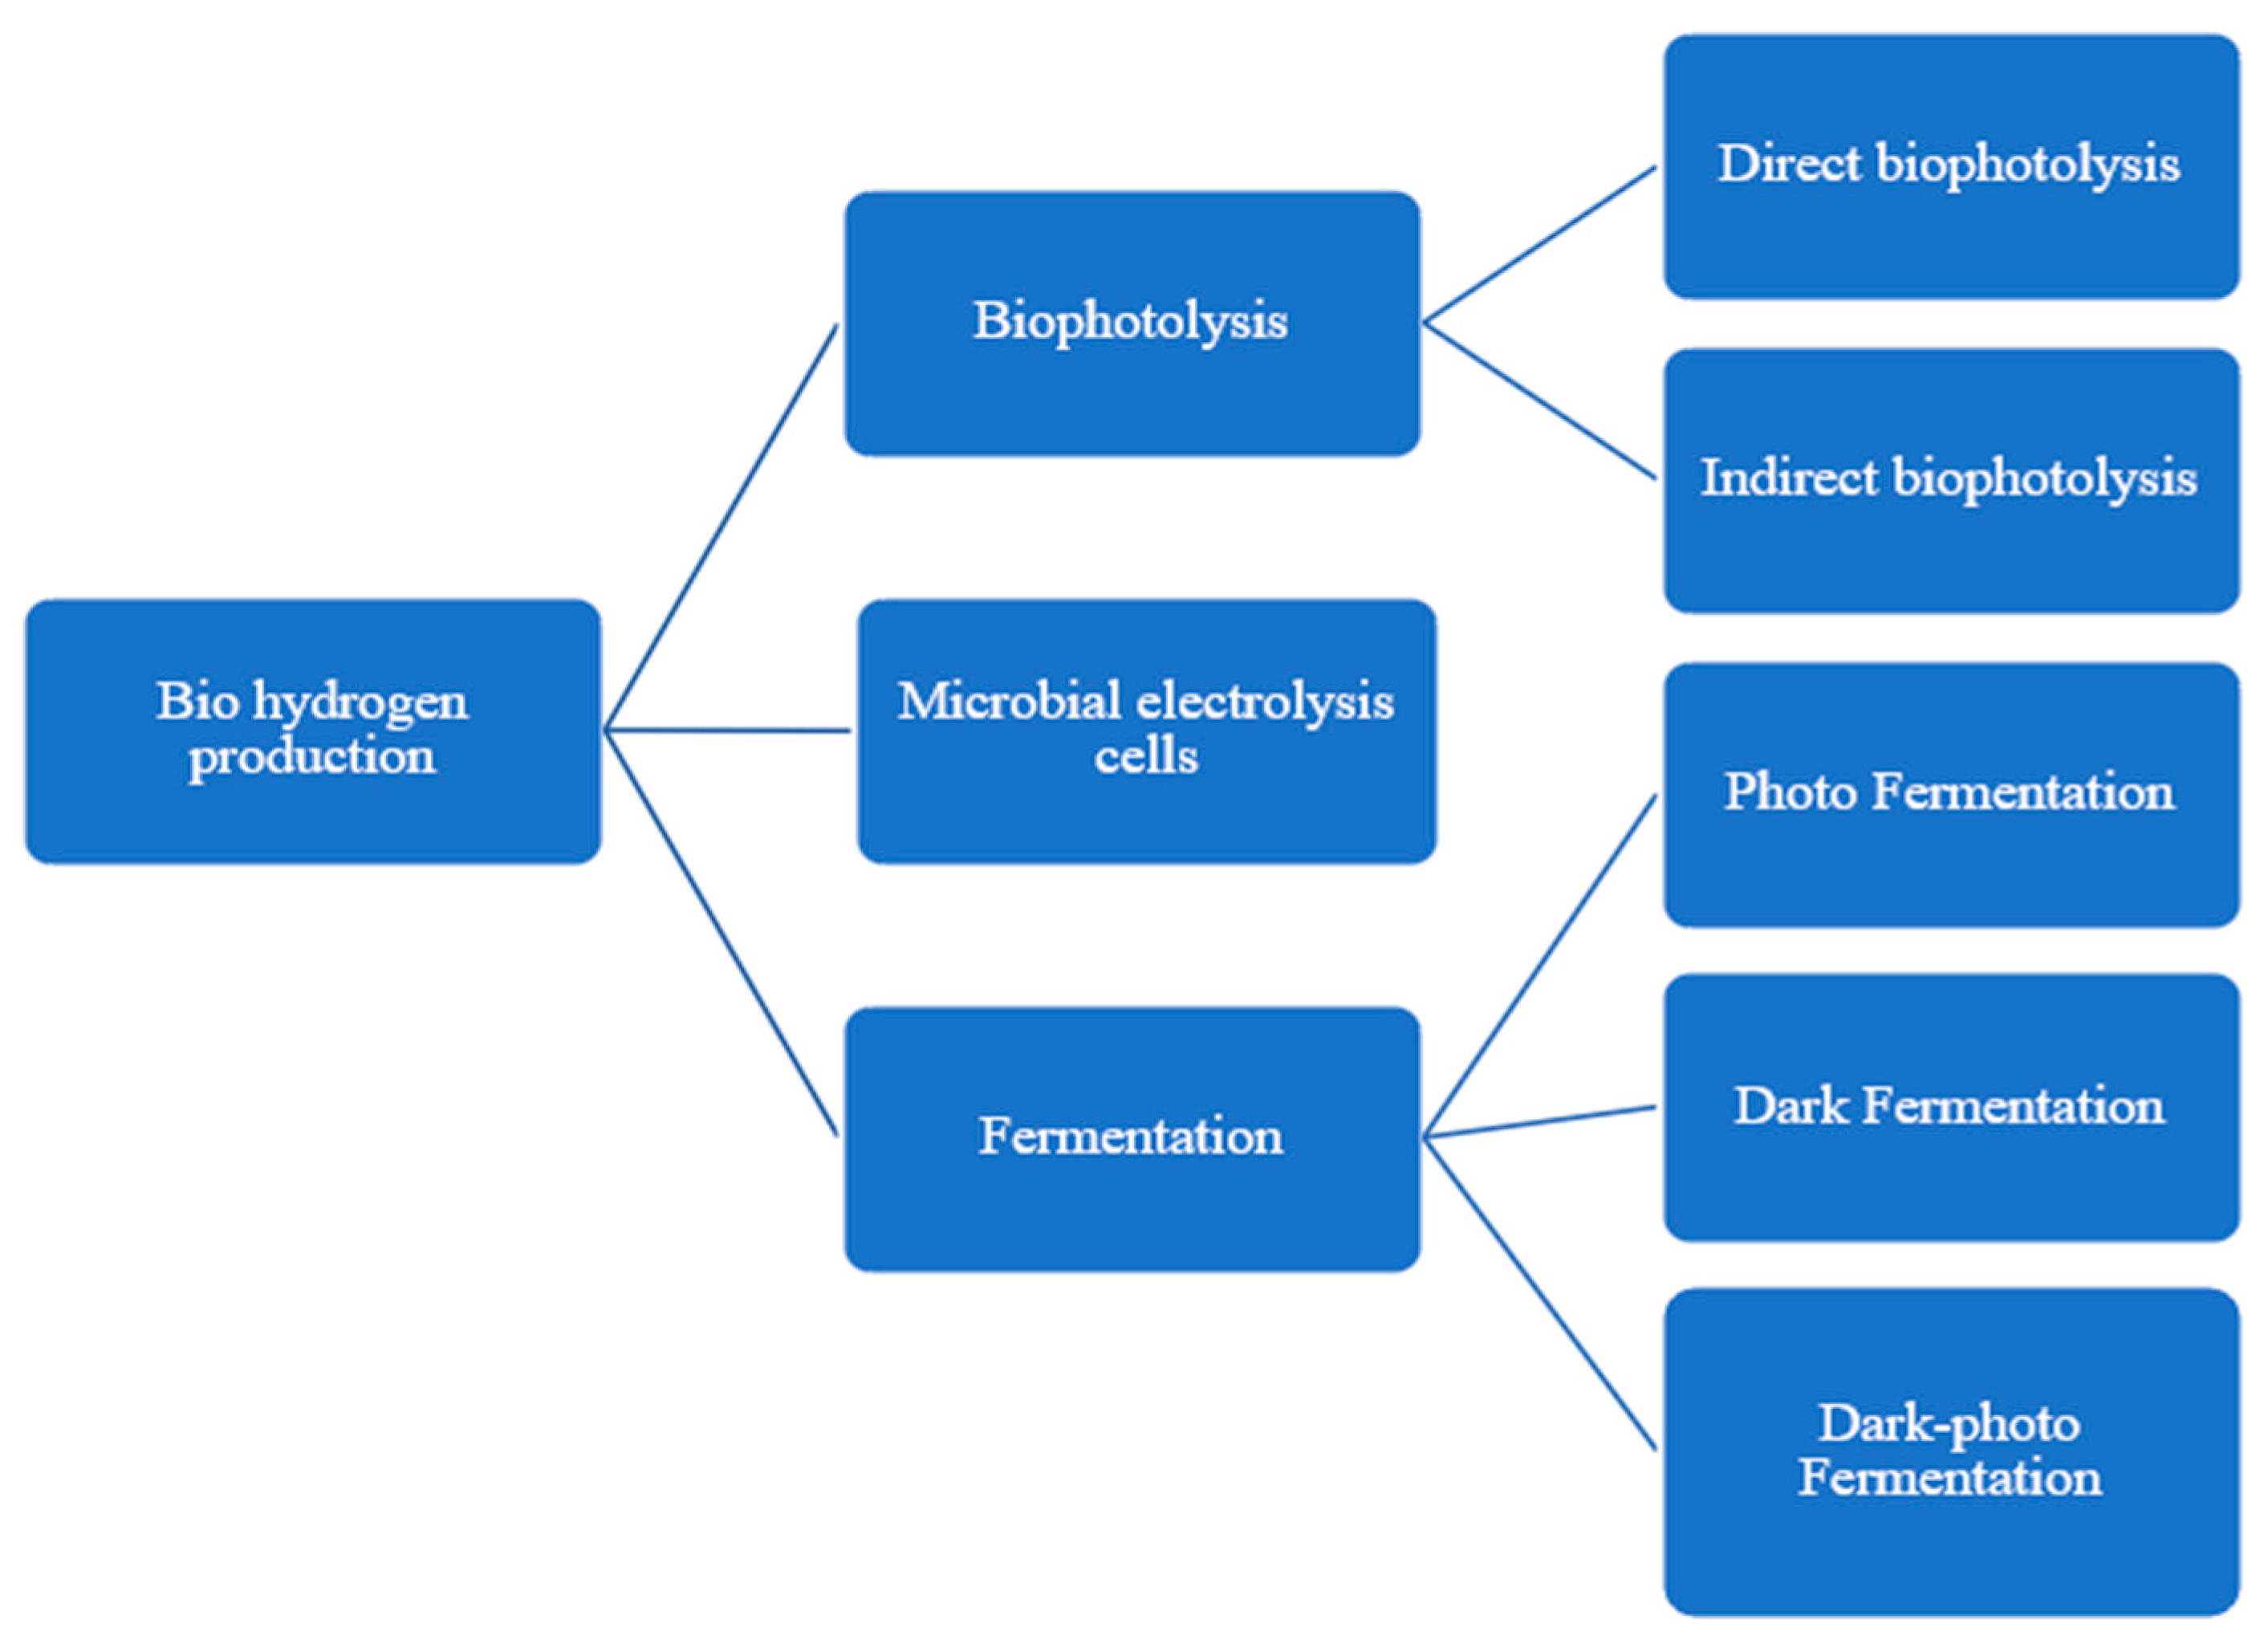
2. Biophotolysis
2.1. Direct Biophotolysis
2.2. Indirect Biophotolysis
(Hydrogen produced during nitrogen fixation)
(Energy for the reaction)
2.3. Mathematical Modeling of Biophotolysis
- = the microalgae-specific production (growth) rate.
- = is the specific maintenance rate.
- γ = microalgae biomass consumption while producing H2.
- = biomass concentration.
- = extinction coefficient of biomass.
- p = light path.
- = specific growth rate.
- = maximum specific growth rate.
- = irradiance constant.
- = maximum irradiance constant.
- = average light radiation.
- = (change in temperature).
- t = simulation time (in seconds).
- = initial simulation time.
- = time after the minimum temperature occurred (in seconds).
- = hydrogen mass fraction at the end of the anaerobic stage.
- = total biomass growth (microalgal mass fraction at the end of the aerobic stage).
3. Fermentation
3.1. Dark Fermentation
3.2. Photofermentation
3.3. Dark Photofermentation
3.4. Mathematical Modeling of Dark Fermentation and Photofermentation
3.5. Mathematical Modeling of Dark Photofermentation
- = biomass yield coefficient with respect to acetic acid.
- = product (acetic acid) yield coefficient in terms of biomass.
- = biomass yield coefficient with respect to butyric acid.
- = product (butyric acid) yield coefficient in terms of biomass.
- = product (hydrogen) yield coefficient in terms of biomass (initial substrate).
- = product (hydrogen) yield coefficient in terms of biomass (acetic acid).
- = product (hydrogen) yield coefficient in terms of biomass (butyric acid).
- = the mass transfer coefficient of H2.

| Microorganism | Substrate | Biomass Growth Rate Model | Substrate Consumption Model | Model of Hydrogen Production | Ref. |
|---|---|---|---|---|---|
| Mix culture | Seed sludge | Monod | Monod | - | [83] |
| Rhodobacter capsulatus DSM 1710 | Acetic acid and lactic acid | Logistic model | Lactic acid—first-order kinetics Acetic acid—zero and first order | Modified Gompertz | [64] |
| Mixed population | Wastewater | Monod | First-order kinetics Michaelis_Menten-based | Monod | [82] |
| Rhodopseudomonas palustris | Malic acid, glutamic acid, and FeCl3 | Logistic | Monod | Leudeking–Piret | [80] |
| R. sphaeroides O.U.001 | Cheese whey effluent from dark fermentation | Logistic | Monod | Modified Gompertz equation and Luedeking–Piret model | [42] |
| Rhodobacter sphaeroides | Malic acid (C) (photo and dark) | Logistic | First order | - | [69] |
| Clostridium pasteurianum (dark) Rhodopseudomonas palustrisWP3–5 | Sucrose from effluent of dark fermentation | - | - | Modified Gompertz equation | [85] |
| Rhodobacter sphaeroides | Glucose and acetic acid (dark and photo) | Monod and logistic | Monod | Modified Gompertz equation | [81] |
| Enterobacter aerogenes | Cheese whey | Logistic equation | Monod | Modified Gompertz equation | [73] |
| Microorganism | Substrate | Method | Investigating Factor | Ref. |
|---|---|---|---|---|
| Rhodopseudomonas palustis WP3–5 | Acetate (C) and glutamate (N) | Ordinary differential equations | Biomass growth, acetic acid, COD, PHB | [88] |
| Rhodobacter capsulatus DSM 1710. | Acetic acid (C), sodium glutamate (N) | The RSM and Box–Behnken design | Initial substrate, initial VSS, and light intensity | [78] |
| R. sphaeroides O.U.001 | Cheese whey effluent | Plackett–Burman | Organic acid concentration, temperature, and light intensity | [20] |
| Rhodopseudomonas palustris | Malic acid, glutamic acid, and FeCl3 | Full factorial design | Malic acid, glutamate, FeCl3 | [80] |
| HAU-M1 | Platanus orientalis leaves | Plackett–Burman and central composite design (CCD) | pH, temperature, and inoculation amount | [87] |
| Rhodobacter sphaeroides | Sewage water | Box–Behnken design and central composite design | Difference in the concentration of carbon and nitrogen source | [86] |
| R. palustris | Immobilized inoculum from dark fermented palm oil mill effluent (DPOME) | RMS | pH, inoculum-substrate percentage (ISP), and light intensity | [79] |
| Rhodobacter sphaeroides DSM 158 | Malic acid and glutamic acid | RSM and Box–Behnken experimental design (BBD) | pH, carbon-to-nitrogen ratio, and light intensity | [68] |
| Enterobacter aerogenes 2822 | Cheese whey | Box–Behnken | Temperature, pH | [73] |
4. Microbial Electrolysis Cells
4.1. Simplified Biofilm Growth Model
- is the fermentative microorganism.
- is the substrate consumption rate by the fermentative microorganism.
- So and S are the organic substrate concentration in the influent and the anodic compartment.
- is the concentration of electricigenic microorganisms.
- is the concentration of fermentative microorganisms.
- is the acetoclastic methanogenic microorganism.
- is the substrate consumption rates by electricigenic microorganisms.
- is the substrate consumption rates by acetoclastic methanogenic microorganism.
- is the substrate consumption rate by fermentative microorganism.
- is the dilution rate.
- YCOD is acetate yield from an organic substrate.
- Ao and A are the acetate concentration in the influent and the anodic compartment.
- and are the growth rates.
- are the concentrations of anodophilic and methanogenic microorganisms.
- γ is the mediator molar mass.
- m is the number of electrons transferred per mol of the mediator.
- YM is the oxidized mediator yield.
- Mox is the oxidized mediator fraction per electricigenic microorganism.
- Mred is the reduced mediator fraction per electricigenic microorganism.
- F is the Faraday constant.
- is current in MECs.
- is the lowest internal resistance observed.
- is the maximum internal resistance observed.
- K is the constant.
4.2. Time-Dependent Growth Model
- is the substrate concentration.
- is the biofilm density.
- is the mass fractions of acetoclastic methanogenic microorganisms.
- is potential variation through the biofilm.
- jmax is the maximum current density.
- S is the substrate concentration.
- is the apparent half-saturation substrate concentration in the biofilm.
- is a conversion factor.
- is the maximum specific rate of substrate utilization.
- is the active biomass concentration in the biofilm.
- is the biofilm thickness.
- jo is the current density.
- is the electron transfer coefficient for anodic and cathodic reactions.
- is the anode potential.
- is the standard potential.
4.3. Production Time-Space Growth Model
- is the current density in the anode.
- is the density of active biomass.
- is the thickness of the biofilm in the anode.
- is the concentration of the electrogenic substrate.
- is the half-max-rate substrate concentration.
- is the electrode potential.
- is the potential of the biofilm.
- is the anode potential with the half-maximum rate of electrogenic substrate consumption.
- is the exchange current density.
- is the anode potential.
- is the anode potential.
- is the equilibrium potential of the anode reaction.
- is the electrolyte potential, where is the transfer coefficient.
- is the electroactive microbial biomass.
- is the reduced species of the mediator.
- is the mediator to its oxidized form.
- is the exchange current density.
- is the cathode potential.
- is the electrolyte potential close to the cathode.
- is the equilibrium potential of the cathode reaction.
- b is the Tafel slope.
- J is the current density vector.
- σ is the conductivity.
- is the electrolyte potential.
- and are the partial derivatives with respect to spatial coordinates r and z.
- is the exchanged current density.
- is the specific surface area of the developed attached biofilm.
- is the specific area of the porous matrix.
- is the maximum current density.
- is the open circuit potential.
- is the charge transfer coefficient.
- and are the axial and radial dispersion coefficients.
- is the linear velocity.
- is the substrate concentration.
- is the apparent electrode porosity.
- is the radial dispersion term.
- is the convection term.
- is the effective diffusion coefficient.
- is the substrate consumption rate.
- is the substrate molecular weight.
- is the concentration of electroactive microorganisms.
- is the substrate consumption rate per mass of electroactive microorganisms.
- The subscript refers to the liquid phase.
- is the diffusion coefficient.
- is the diffusive flux.
- is the electroactive biomass concentration.
- is the microbial decay rate.
- is the biofilm retention constant.
- is the growth rate per electroactive biomass.
- Q is the volumetric flow rate.
- V is the volume of the tank.
- is the concentration of the microorganism at the outlet.
- is the concentration of the microorganism in the reactor.
- is the substrate concentration in the recirculation tank.
- is the average substrate concentration at the MEC outlet.
- is the substrate consumption rate in the tank.
- is the variation of input (conductivity or flow rate).
- I1 is the base.
4.4. Optimizing Features Affecting the MEC System Design for Hydrogen Production
4.4.1. Anode
4.4.2. Cathode
4.4.3. pH
4.4.4. Temperature
4.4.5. Applied Potential Difference
5. Advantages and Disadvantages of Different Types of Biohydrogen Production
6. Limitations of Mathematical Modeling in Biohydrogen Production
- The mathematical models are based on simplified assumptions; hence, it may not fully capture the complexity of a real-time hydrogen production system, leading to inaccuracies.
- Hydrogen production involves a series of chemical reactions, and each catalytic process has its own reaction kinetics, catalyst behavior, and rate-limiting factors and can follow multiple pathways. Modeling such complex reactions accurately is a challenge and may vary under different conditions.
- Hydrogen production systems often exhibit nonlinear behavior. Therefore, a slight change in one of the parameters may lead to a significant change in the output.
- The growth of one community or the addition of one nutrient substrate may inhibit the growth of another community; the modeling of these transient states accurately can be complex and may provide inaccuracy in hydrogen production predictions.
- Several catalysts, both biological enzymes and chemical compounds, are involved, and catalyst deactivation or prediction of the longevity of the catalyst is challenging in mathematical modeling.
- Mass balance transfer modeling is critical in many hydrogen production processes as these processes are complex and occur in multiphase and multi-physical systems.
- Measurement error is very prominent in the biological world, so accurate modeling relying on high-quality data may not be readily available as it may be subjected to multiple errors in different steps.
- Assessing the uncertainty and sensitivity of model predictions to parameter variations is important for robust modeling but can be computationally intensive.
- Accuracy for validating mathematical models against experimental data is challenging as the experiments are costly and difficult to conduct on a large scale.
- Scaling up from the laboratory scale to the industrial scale for hydrogen production is a challenge in mathematical modeling as it introduces additional complexities of equipment designs.
7. Way toward Future or Future Research Scope
- Only a few microbes are explored for biohydrogen production. There is always a way to explore and discover new microbial strains or use genetic engineering to create genetically modified microbes for higher hydrogen production.
- It is necessary to investigate the metabolic pathways of the microorganisms that are involved in hydrogen production and optimize the pathways by providing suitable nutrients or catalysts or making them favorable for better efficiency.
- It is also necessary to study the bioprocess optimization of parameters like temperature, pH, substrate concentration, and reactor design for developing advanced fermentation and bioprocessing techniques to maximize hydrogen production rate and yield.
- Developing effective catalysts for hydrogen evolution from different substrates remains a significant challenge in renewable hydrogen production. So, developing new catalysts to enhance hydrogen production opens a wide scope.
- It is necessary to design a scalable and cost-effective reactor design suitable for maintaining optimal growth conditions for hydrogen-producing microorganisms in industrial and laboratory conditions.
- It is necessary to develop more comprehensive mathematical models describing the kinetics of hydrogen-producing microorganisms with an account of parameters like substrate utilization, metabolic pathways, and extrinsic and intrinsic factors.
- Extensive research should be conducted to develop a mathematical model for the multiphase and multiscale modeling of mass transfer in biofilms, mixed populations of microbes, and reactor geometry.
- A proper mathematical model to predict the transient responses has not been formulated so far. A new study to develop dynamic models that can predict transient responses and adapt to changes in the environmental conditions of microbial populations can be a way forward.
- There is an open field of research on sensitivity and uncertainty analysis to assess the robustness of mathematical models’ identification of key parameters affecting biohydrogen production.
- The storage and transportation of hydrogen are still a problem. A wide field of research is open for modeling efforts to include the optimization of hydrogen storage and distribution systems in a cost-effective way.
8. Conclusions
Author Contributions
Funding
Data Availability Statement
Conflicts of Interest
References
- Brandon, N.P.; Kurban, Z. Clean energy and the hydrogen economy. Philos. Trans. R. Soc. A Math. Phys. Eng. Sci. 2017, 375, 20160400. [Google Scholar] [CrossRef] [PubMed]
- Singh, M.; Mukoma, P.; North, B.; Majozi, T. A mathematical model for optimum design and synthesis of a hybrid electrolyser-fuel cell system: Production of hydrogen and freshwater from seawater. J. Clean. Prod. 2020, 277, 123899. [Google Scholar] [CrossRef]
- Azwar, M.Y.; Hussain, M.A.; Abdul-Wahab, A.K. Development of biohydrogen production by photobiological, fermentation and electrochemical processes: A review. Renew. Sustain. Energy Rev. 2014, 31, 158–173. [Google Scholar] [CrossRef]
- Lumbers, B.; Agar, D.W.; Gebel, J.; Platte, F. Mathematical modelling and simulation of the thermo-catalytic decomposition of methane for economically improved hydrogen production. Int. J. Hydrogen Energy 2022, 47, 4265–4283. [Google Scholar] [CrossRef]
- Talaghat, M.R.; Naamaki, N. Mathematical modeling of hydrogen production using methanol steam reforming in the coupled membrane reactor when the output materials of the reformer section is used as feed for the combustion section. Int. J. Hydrogen Energy 2021, 46, 2282–2295. [Google Scholar] [CrossRef]
- Murat, M.N.; Sapuan, S.M. Mathematical modelling of hydrogen production system in fuel cell technology. Int. J. Chem. Sci 2008, 6, 1385–1398. [Google Scholar]
- Lee, J.E.; Shafiq, I.; Hussain, M.; Lam, S.S.; Rhee, G.H.; Park, Y.K. A review on integrated thermochemical hydrogen production from water. Int. J. Hydrogen Energy 2022, 47, 4346–4356. [Google Scholar] [CrossRef]
- El Hajj Chehade, A.M.; Daher, E.A.; Assaf, J.C.; Riachi, B.; Hamd, W. Simulation and optimization of hydrogen production by steam reforming of natural gas for refining and petrochemical demands in Lebanon. Int. J. Hydrogen Energy 2020, 45, 33235–33247. [Google Scholar] [CrossRef]
- Boretti, A.; Banik, B.K. Advances in Hydrogen Production from Natural Gas Reforming. Adv. Energy Sustain. Res. 2021, 2, 2100097. [Google Scholar] [CrossRef]
- Kothari, R.; Buddhi, D.; Sawhney, R.L. Comparison of environmental and economic aspects of various hydrogen production methods. Renew. Sustain. Energy Rev. 2008, 12, 553–563. [Google Scholar] [CrossRef]
- Sojoudi, A.; Sefidan, A.M.; Alam, K.C.A.; Saha, S.C. Hydrogen production via electrolysis: Mathematical modeling approach. Bioenergy Resour. Technol. 2021, 199–235. [Google Scholar] [CrossRef]
- Midilli, A.; Kucuk, H.; Topal, M.E.; Akbulut, U.; Dincer, I. A comprehensive review on hydrogen production from coal gasification: Challenges and Opportunities. Int. J. Hydrogen Energy 2021, 46, 25385–25412. [Google Scholar] [CrossRef]
- Ahmed, M.; Dincer, I. A review on photoelectrochemical hydrogen production systems: Challenges and future directions. Int. J. Hydrogen Energy 2019, 44, 2474–2507. [Google Scholar] [CrossRef]
- Saifuddin, N.; Priatharsini, P. Developments in Bio-hydrogen Production from Algae: A Review. Res. J. Appl. Sci. Eng. Technol. 2016, 12, 968–982. [Google Scholar] [CrossRef]
- Yu, J.; Yu, J.; Takahashi, P. Biophotolysis-Based Hydrogen Production by Cyanobacteria and Green Microalgae. 2007. Available online: https://www.researchgate.net/publication/242768941 (accessed on 31 August 2023).
- Vargas, S.R.; dos Santos, P.V.; Giraldi, L.A.; Zaiat, M.; Calijuri, M.D.C. Anaerobic phototrophic processes of hydrogen production by different strains of microalgae Chlamydomonas sp. FEMS Microbiol. Lett. 2018, 365, fny073. [Google Scholar] [CrossRef] [PubMed]
- Flores-Estrella, R.A.; Rodríguez-Valenzuela, G.; Ramírez-Landeros, J.R.; Alcaraz-González, V.; González-Álvarez, V. A simple microbial electrochemical cell model and dynamic analysis towards control design. Chem. Eng. Commun. 2020, 207, 493–505. [Google Scholar] [CrossRef]
- Dudek, M.; Dębowski, M.; Kazimierowicz, J.; Zieliński, M.; Quattrocelli, P.; Nowicka, A. The Cultivation of Biohydrogen-Producing Tetraselmis subcordiformis Microalgae as the Third Stage of Dairy Wastewater Aerobic Treatment System. Sustainability 2022, 14, 12085. [Google Scholar] [CrossRef]
- Gadhamshetty, V.; Arudchelvam, Y.; Nirmalakhandan, N.; Johnson, D.C. Modeling dark fermentation for biohydrogen production: ADM1-based model vs. Gompertz model. Int. J. Hydrogen Energy 2010, 35, 479–490. [Google Scholar] [CrossRef]
- Rao, R.; Basak, N. Process optimization and mathematical modelling of photo-fermentative hydrogen production from dark fermentative cheese whey effluent by Rhodobacter sphaeroides O.U.001 in 2-L cylindrical bioreactor. Biomass Convers. Biorefinery 2023, 13, 3929–3952. [Google Scholar] [CrossRef]
- Wan, C.; Zhou, L.; Xu, S.; Jin, B.; Ge, X.; Qian, X.; Xu, L.; Chen, F.; Zhan, X.; Yang, Y.; et al. Defect engineered mesoporous graphitic carbon nitride modified with AgPd nanoparticles for enhanced photocatalytic hydrogen evolution from formic acid. Chem. Eng. J. 2022, 429, 132388. [Google Scholar] [CrossRef]
- Hassan, I.A.; Ramadan, H.S.; Saleh, M.A.; Hissel, D. Hydrogen storage technologies for stationary and mobile applications: Review, analysis and perspectives. Renew. Sustain. Energy Rev. 2021, 149, 111311. [Google Scholar] [CrossRef]
- Rivard, E.; Trudeau, M.; Zaghib, K. Hydrogen storage for mobility: A review. Materials 2019, 12, 1973. [Google Scholar] [CrossRef] [PubMed]
- Zhang, L.; Nyahuma, F.M.; Zhang, H.; Cheng, C.; Zheng, J.; Wu, F.; Chen, L. Metal organic framework supported niobium pentoxide nanoparticles with exceptional catalytic effect on hydrogen storage behavior of MgH2. Green Energy Environ. 2023, 8, 589–600. [Google Scholar] [CrossRef]
- Wang, Y.; Zhong, S.; Sun, F. Research Progress in Vehicular High Mass Density Solid Hydrogen Storage Materials. Chin. J. Rare Met. 2022, 46, 796–812. [Google Scholar] [CrossRef]
- Melitos, G.; Voulkopoulos, X.; Zabaniotou, A. Waste to Sustainable Biohydrogen Production Via Photo-Fermentation and Biophotolysis—A Systematic Review. Renew. Energy Environ. Sustain. 2021, 6, 45. [Google Scholar] [CrossRef]
- Vargas, J.V.C.; Mariano, A.B.; Corrêa, D.O.; Ordonez, J.C. The microalgae derived hydrogen process in compact photobioreactors. Int. J. Hydrogen Energy 2014, 39, 9588–9598. [Google Scholar] [CrossRef]
- Xuan, J.; He, L.; Wen, W.; Feng, Y. Hydrogenase and Nitrogenase: Key Catalysts in Biohydrogen Production. Molecules 2023, 28, 1392. [Google Scholar] [CrossRef]
- Show, K.Y.; Lee, D.J.; Tay, J.H.; Lin, C.Y.; Chang, J.S. Biohydrogen production: Current perspectives and the way forward. Int. J. Hydrogen Energy 2012, 37, 15616–15631. [Google Scholar] [CrossRef]
- Nagarajan, D.; Lee, D.J.; Kondo, A.; Chang, J.S. Recent insights into biohydrogen production by microalgae—From biophotolysis to dark fermentation. Bioresour. Technol. 2017, 227, 373–387. [Google Scholar] [CrossRef]
- Vargas, J.V.C.; Kava, V.; Ordonez, J.C.; Balmant, W.; Mariano, A.B. Mass transfer modeling and maximization of hydrogen rhythmic production from genetically modified microalgae biomass. Int. J. Heat Mass Transf. 2016, 101, 1–9. [Google Scholar] [CrossRef]
- Sivaramakrishnan, R.; Shanmugam, S.; Sekar, M.; Mathimani, T.; Incharoensakdi, A.; Kim, S.H.; Parthiban, A.; Edwin Geo, V.; Brindhadevi, K.; Pugazhendhi, A. Insights on biological hydrogen production routes and potential microorganisms for high hydrogen yield. Fuel 2021, 291, 120136. [Google Scholar] [CrossRef]
- Zhang, X.; Sherman, D.M.; Shermana, L.A. The uptake hydrogenase in the unicellular diazotrophic cyanobacterium cyanothece sp. strain PCC 7822 protects nitrogenase from oxygen toxicity. J. Bacteriol. 2014, 196, 840–849. [Google Scholar] [CrossRef] [PubMed]
- Eroglu, E.; Melis, A. Photobiological hydrogen production: Recent advances and state of the art. Bioresour. Technol. 2011, 102, 8403–8413. [Google Scholar] [CrossRef] [PubMed]
- Sánchez, J.F.; Fernández-Sevilla, J.M.; Acién, F.G.; Cerón, M.C.; Pérez-Parra, J.; Molina-Grima, E. Biomass and lutein productivity of Scenedesmus almeriensis: Influence of irradiance, dilution rate and temperature. Appl. Microbiol. Biotechnol. 2008, 79, 719–729. [Google Scholar] [CrossRef] [PubMed]
- Vargas, J.V.C.; Kava, V.; Balmant, W.; Mariano, A.B.; Ordonez, J.C. Modeling microalgae derived hydrogen production enhancement via genetic modification. Int. J. Hydrogen Energy 2016, 41, 8101–8110. [Google Scholar] [CrossRef]
- Baebprasert, W.; Jantaro, S.; Khetkorn, W.; Lindblad, P.; Incharoensakdi, A. Increased H2 production in the cyanobacterium Synechocystis sp. strain PCC 6803 by redirecting the electron supply via genetic engineering of the nitrate assimilation pathway. Metab. Eng. 2011, 13, 610–616. [Google Scholar] [CrossRef]
- Kossalbayev, B.D.; Tomo, T.; Zayadan, B.K.; Sadvakasova, A.K.; Bolatkhan, K.; Alwasel, S.; Allakhverdiev, S.I. Determination of the potential of cyanobacterial strains for hydrogen production. Int. J. Hydrogen Energy 2020, 45, 2627–2639. [Google Scholar] [CrossRef]
- Hussain Rather, A.; Kumar Srivastav, A.; Abdul, A. A Study on Biohydrogen Production Based on Biophotolysis from Cyanobacteria. 2021. Volume 25. Available online: http://annalsofrscb.ro (accessed on 31 March 2023).
- Skizim, N.J.; Ananyev, G.M.; Krishnan, A.; Dismukes, G.C. Metabolic pathways for photobiological hydrogen production by nitrogenase- and hydrogenase-containing unicellular cyanobacteria Cyanothece. J. Biol. Chem. 2012, 287, 2777–2786. [Google Scholar] [CrossRef]
- Huesemann, M.H.; Hausmann, T.S.; Carter, B.M.; Gerschler, J.J.; Benemann, J.R. Hydrogen generation through indirect biophotolysis in batch cultures of the nonheterocystous nitrogen-fixing cyanobacterium plectonema boryanum. Appl. Biochem. Biotechnol. 2010, 162, 208–220. [Google Scholar] [CrossRef]
- Tinpranee, N.; Incharoensakdi, A.; Phunpruch, S. Screening cyanobacteria from marine coastal waters of Thailand for biohydrogen production. J. Appl. Phycol. 2018, 30, 3471–3481. [Google Scholar] [CrossRef]
- Prabaharan, D.; Arun Kumar, D.; Uma, L.; Subramanian, G. Dark hydrogen production in nitrogen atmosphere—An approach for sustainability by marine cyanobacterium Leptolyngbya valderiana BDU 20041. Int. J. Hydrogen Energy 2010, 35, 10725–10730. [Google Scholar] [CrossRef]
- Wu, T.Y.; Hay, J.X.W.; Kong, L.B.; Juan, J.C.; Jahim, J.M. Recent advances in reuse of waste material as substrate to produce biohydrogen by purple non-sulfur (PNS) bacteria. Renew. Sustain. Energy Rev. 2012, 16, 3117–3122. [Google Scholar] [CrossRef]
- Ni, M.; Leung, D.Y.C.; Leung, M.K.H.; Sumathy, K. An overview of hydrogen production from biomass. Fuel Process. Technol. 2006, 87, 461–472. [Google Scholar] [CrossRef]
- Duangjan, K.; Nakkhunthod, W.; Pekkoh, J.; Pumas, C. Comparison of hydrogen production in microalgae under autotrophic and mixotrophic media. Bot. Lith. 2017, 23, 169–177. [Google Scholar] [CrossRef]
- Liu, J.Z.; Ge, Y.M.; Xia, S.Y.; Sun, J.Y.; Mu, J. Photoautotrophic hydrogen production by Chlorella pyrenoidosa without sulfur-deprivation. Int. J. Hydrogen Energy 2016, 41, 8427–8432. [Google Scholar] [CrossRef]
- Zhang, L.; He, M.; Liu, J.; Li, L. Role of the mitochondrial alternative oxidase pathway in hydrogen photoproduction in Chlorella protothecoides. Planta 2015, 241, 1005–1014. [Google Scholar] [CrossRef]
- Fouchard, S.; Pruvost, J.; Degrenne, B.; Legrand, J. Investigation of H2 production using the green microalga Chlamydomonas reinhardtii in a fully controlled photobioreactor fitted with on-line gas analysis. Int. J. Hydrogen Energy 2008, 33, 3302–3310. [Google Scholar] [CrossRef]
- Batyrova, K.; Gavrisheva, A.; Ivanova, E.; Liu, J.; Tsygankov, A. Sustainable hydrogen photoproduction by phosphorus-deprived marine green microalgae chlorella sp. Int. J. Mol. Sci. 2015, 16, 2705–2716. [Google Scholar] [CrossRef]
- Faraloni, C.; Ena, A.; Pintucci, C.; Torzillo, G. Enhanced hydrogen production by means of sulfur-deprived Chlamydomonas reinhardtii cultures grown in pretreated olive mill wastewater. Int. J. Hydrogen Energy 2011, 36, 5920–5931. [Google Scholar] [CrossRef]
- Mona, S.; Kumar, S.S.; Kumar, V.; Parveen, K.; Saini, N.; Deepak, B.; Pugazhendhi, A. Green technology for sustainable biohydrogen production (waste to energy): A review. Sci. Total Environ. 2020, 728, 138481. [Google Scholar] [CrossRef]
- Ghosh, S.; Dutta, S.; Chowdhury, R. Ameliorated hydrogen production through integrated dark-photo fermentation in a flat plate photobioreactor: Mathematical modelling and optimization of energy efficiency. Energy Convers. Manag. 2020, 226, 113549. [Google Scholar] [CrossRef]
- Ghimire, A.; Trably, E.; Frunzo, L.; Pirozzi, F.; Lens, P.N.L.; Esposito, G.; Cazier, E.A.; Escudié, R. Effect of total solids content on biohydrogen production and lactic acid accumulation during dark fermentation of organic waste biomass. Bioresour. Technol. 2018, 248, 180–186. [Google Scholar] [CrossRef] [PubMed]
- Chandra, R.; Venkata Mohan, S. Enhanced bio-hydrogenesis by co-culturing photosynthetic bacteria with acidogenic process: Augmented dark-photo fermentative hybrid system to regulate volatile fatty acid inhibition. Int. J. Hydrogen Energy 2014, 39, 7604–7615. [Google Scholar] [CrossRef]
- Gadhe, A.; Sonawane, S.S.; Varma, M.N. Ultrasonic pretreatment for an enhancement of biohydrogen production from complex food waste. Int. J. Hydrogen Energy 2014, 39, 7721–7729. [Google Scholar] [CrossRef]
- Sarangi, P.K.; Nanda, S. Biohydrogen Production through Dark Fermentation. Chem. Eng. Technol. 2020, 43, 601–612. [Google Scholar] [CrossRef]
- Hosseini, S.E.; Wahid, M.A. Hydrogen production from renewable and sustainable energy resources: Promising green energy carrier for clean development. Renew. Sustain. Energy Rev. 2016, 57, 850–866. [Google Scholar] [CrossRef]
- Budiman, P.M.; Wu, T.Y. Role of chemicals addition in affecting biohydrogen production through photofermentation. Energy Convers. Manag. 2018, 165, 509–527. [Google Scholar] [CrossRef]
- Akhlaghi, N.; Najafpour-Darzi, G. A comprehensive review on biological hydrogen production. Int. J. Hydrogen Energy 2020, 45, 22492–22512. [Google Scholar] [CrossRef]
- Ghosh, S.; Dairkee, U.K.; Chowdhury, R.; Bhattacharya, P. Hydrogen from food processing wastes via photofermentation using Purple Non-sulfur Bacteria (PNSB)—A review. Energy Convers. Manag. 2017, 141, 299–314. [Google Scholar] [CrossRef]
- Argun, H.; Kargi, F. Bio-hydrogen production by different operational modes of dark and photo-fermentation: An overview. Int. J. Hydrogen Energy 2011, 36, 7443–7459. [Google Scholar] [CrossRef]
- Blanco, V.M.C.; Oliveira, G.H.D.; Zaiat, M. Dark fermentative biohydrogen production from synthetic cheese whey in an anaerobic structured-bed reactor: Performance evaluation and kinetic modeling. Renew. Energy 2019, 139, 1310–1319. [Google Scholar] [CrossRef]
- Sevinç, P.; Gündüz, U.; Eroglu, I.; Yücel, M. Kinetic analysis of photosynthetic growth, hydrogen production and dual substrate utilization by Rhodobacter capsulatus. Int. J. Hydrogen Energy 2012, 37, 16430–16436. [Google Scholar] [CrossRef]
- Zhang, T.; Jiang, D.; Zhang, H.; Jing, Y.; Tahir, N.; Zhang, Y.; Zhang, Q. Comparative study on bio-hydrogen production from corn stover: Photo-fermentation, dark-fermentation and dark-photo co-fermentation. Int. J. Hydrogen Energy 2020, 45, 3807–3814. [Google Scholar] [CrossRef]
- Boodhun, B.S.F.; Mudhoo, A.; Kumar, G.; Kim, S.H.; Lin, C.Y. Research perspectives on constraints, prospects and opportunities in biohydrogen production. Int. J. Hydrogen Energy 2017, 42, 27471–27481. [Google Scholar] [CrossRef]
- Srikanth, S.; Venkata Mohan, S.; Prathima Devi, M.; Peri, D.; Sarma, P.N. Acetate and butyrate as substrates for hydrogen production through photo-fermentation: Process optimization and combined performance evaluation. Int. J. Hydrogen Energy 2009, 34, 7513–7522. [Google Scholar] [CrossRef]
- Al-Mohammedawi, H.H.; Znad, H.; Eroglu, E. Synergistic effects and optimization of photo-fermentative hydrogen production of Rhodobacter sphaeroides DSM 158. Int. J. Hydrogen Energy 2018, 43, 15823–15834. [Google Scholar] [CrossRef]
- Koku, H.; Eroǧlu, I.; Gündüz, U.; Yücel, M.; Türker, L. Kinetics of biological hydrogen production by the photosynthetic bacterium Rhodobacter sphaeroides O.U. 001. Int. J. Hydrogen Energy 2003, 28, 381–388. [Google Scholar] [CrossRef]
- Bolatkhan, K.; Kossalbayev, B.D.; Zayadan, B.K.; Tomo, T.; Veziroglu, T.N.; Allakhverdiev, S.I. Hydrogen production from phototrophic microorganisms: Reality and perspectives. Int. J. Hydrogen Energy 2019, 44, 5799–5811. [Google Scholar] [CrossRef]
- Dasgupta, C.N.; Jose Gilbert, J.; Lindblad, P.; Heidorn, T.; Borgvang, S.A.; Skjanes, K.; Das, D. Recent trends on the development of photobiological processes and photobioreactors for the improvement of hydrogen production. Int. J. Hydrogen Energy 2010, 35, 10218–10238. [Google Scholar] [CrossRef]
- Rezania, S.; Din, M.F.M.; Taib, S.M.; Sohaili, J.; Chelliapan, S.; Kamyab, H.; Saha, B.B. Review on fermentative biohydrogen production from water hyacinth, wheat straw and rice straw with focus on recent perspectives. Int. J. Hydrogen Energy 2017, 42, 20955–20969. [Google Scholar] [CrossRef]
- Rao, R.; Basak, N. Optimization and modelling of dark fermentative hydrogen production from cheese whey by Enterobacter aerogenes 2822. Int. J. Hydrogen Energy 2021, 46, 1777–1800. [Google Scholar] [CrossRef]
- Silva, F.T.M.; Moreira, L.R.; de Souza Ferreira, J.; Batista, F.R.X.; Cardoso, V.L. Replacement of sugars to hydrogen production by Rhodobacter capsulatus using dark fermentation effluent as substrate. Bioresour. Technol. 2016, 200, 72–80. [Google Scholar] [CrossRef] [PubMed]
- Li, X.; Wang, Y.H.; Zhang, S.L.; Chu, J.; Zhang, M.; Huang, M.Z.; Zhuang, Y.P. Enhancement of phototrophic hydrogen production by Rhodobacter sphaeroides ZX-5 using a novel strategy-shaking and extra-light supplementation approach. Int. J. Hydrogen Energy 2009, 34, 9677–9685. [Google Scholar] [CrossRef]
- Tiang, M.F.; Fitri Hanipa, M.A.; Abdul, P.M.; Jahim, J.M.; Mahmod, S.S.; Takriff, M.S.; Lay, C.H.; Reungsang, A.; Wu, S.Y. Recent advanced biotechnological strategies to enhance photo-fermentative biohydrogen production by purple non-sulphur bacteria: An overview. Int. J. Hydrogen Energy 2020, 45, 13211–13230. [Google Scholar] [CrossRef]
- Gonzales, R.R.; Kim, S.H. Dark fermentative hydrogen production following the sequential dilute acid pretreatment and enzymatic saccharification of rice husk. Int. J. Hydrogen Energy 2017, 42, 27577–27583. [Google Scholar] [CrossRef]
- Akman, M.C.; Erguder, T.H.; Gündüz, U.; Eroʇlu, I. Investigation of the effects of initial substrate and biomass concentrations and light intensity on photofermentative hydrogen gas production by response surface methodology. Int. J. Hydrogen Energy 2015, 40, 5042–5049. [Google Scholar] [CrossRef]
- Mishra, P.; Wahid, Z.A.; Zaid, R.M.; Rana, S.; Tabassum, S.; Karim, A.; Singh, L.; Islam, M.A.; Jaing, X.; Sakinah, M. Kinetics and statistical optimization study of bio-hydrogen production using the immobilized photo-bacterium. Biomass Convers. Biorefinery 2020, 13, 8629–8640. [Google Scholar] [CrossRef]
- Basak, N.; Jana, A.K.; Das, D. CFD modeling of hydrodynamics and optimization of photofermentative hydrogen production by Rhodopseudomonas palustris DSM 123 in annular photobioreactor. Int. J. Hydrogen Energy 2016, 41, 7301–7317. [Google Scholar] [CrossRef]
- Nath, K.; Muthukumar, M.; Kumar, A.; Das, D. Kinetics of two-stage fermentation process for the production of hydrogen. Int. J. Hydrogen Energy 2008, 33, 1195–1203. [Google Scholar] [CrossRef]
- Puyol, D.; Barry, E.M.; Hülsen, T.; Batstone, D.J. A mechanistic model for anaerobic phototrophs in domestic wastewater applications: Photo-anaerobic model (PAnM). Water Res. 2017, 116, 241–253. [Google Scholar] [CrossRef]
- Park, J.H.; Sim, Y.B.; Kumar, G.; Anburajan, P.; Park, J.H.; Park, H.D.; Kim, S.H. Kinetic modeling and microbial community analysis for high-rate biohydrogen production using a dynamic membrane. Bioresour. Technol. 2018, 262, 59–64. [Google Scholar] [CrossRef] [PubMed]
- Singh, A.; Sevda, S.; Abu Reesh, I.M.; Vanbroekhoven, K.; Rathore, D.; Pant, D. Biohydrogen production from lignocellulosic biomass: Technology and sustainability. Energies 2015, 8, 13062–13080. [Google Scholar] [CrossRef]
- Chen, C.Y.; Yeh, K.L.; Lo, Y.C.; Wang, H.M.; Chang, J.S. Engineering strategies for the enhanced photo-H2 production using effluents of dark fermentation processes as substrate. Int. J. Hydrogen Energy 2010, 35, 13356–13364. [Google Scholar] [CrossRef]
- Garimella, S.; Vimal, A.; Merugu, R.; Kumar, A. Optimization for enhanced hydrogen production from Rhodobacter sphaeroides using response surface methodology. SN Appl. Sci. 2019, 1, 156. [Google Scholar] [CrossRef]
- Li, Y.; Zhang, Z.; Jing, Y.; Ge, X.; Wang, Y.; Lu, C.; Zhou, X.; Zhang, Q. Statistical optimization of simultaneous saccharification fermentative hydrogen production from Platanus orientalis leaves by photosynthetic bacteria HAU-M1. Int. J. Hydrogen Energy 2017, 42, 5804–5811. [Google Scholar] [CrossRef]
- Policastro, G.; Luongo, V.; Frunzo, L.; Fabbricino, M. A comprehensive review of mathematical models of photo fermentation. Crit. Rev. Biotechnol. 2021, 41, 628–648. [Google Scholar] [CrossRef]
- Rani, G.; Nabi, Z.; Rajesh Banu, J.; Yogalakshmi, K.N. Batch fed single chambered microbial electrolysis cell for the treatment of landfill leachate. Renew. Energy 2020, 153, 168–174. [Google Scholar] [CrossRef]
- Azwar, Y.; Khairi Abdul-Wahab, A.; Hussain, M.A. Chemical Engineering Transactions Optimal Production of Biohydrogen Gas via Microbial Electrolysis Cells (MEC) in a Controlled Batch Reactor System. 2013. Available online: www.aidic.it/cet (accessed on 31 August 2023).
- Jayabalan, T.; Matheswaran, M.; Preethi, V.; Naina Mohamed, S. Enhancing biohydrogen production from sugar industry wastewater using metal oxide/graphene nanocomposite catalysts in microbial electrolysis cell. Int. J. Hydrogen Energy 2020, 45, 7647–7655. [Google Scholar] [CrossRef]
- Pinto, R.P.; Srinivasan, B.; Escapa, A.; Tartakovsky, B. Multi-population model of a microbial electrolysis cell. Environ. Sci. Technol. 2011, 45, 5039–5046. [Google Scholar] [CrossRef]
- Flores-Estrella, R.A.; Garza-Rubalcava, U.d.J.; Haarstrick, A.; Alcaraz-González, V. A dynamic biofilm model for a Microbial Electrolysis Cell. Processes 2019, 7, 183. [Google Scholar] [CrossRef]
- Dudley, H.J.; Lu, L.; Ren, Z.J.; Bortz, D.M. Sensitivity and bifurcation analysis of a differential-algebraic equation model for a microbial electrolysis cell. SIAM J. Appl. Dyn. Syst. 2019, 18, 709–728. [Google Scholar] [CrossRef]
- Torres, C.I.; Kato Marcus, A.; Rittmann, B.E. Kinetics of consumption of fermentation products by anode-respiring bacteria. Appl. Microbiol. Biotechnol. 2007, 77, 689–697. [Google Scholar] [CrossRef] [PubMed]
- Hernández-García, K.M.; Cercado, B.; Rodríguez, F.A.; Rivera, F.F.; Rivero, E.P. Modeling 3D current and potential distribution in a microbial electrolysis cell with augmented anode surface and non-ideal flow pattern. Biochem. Eng. J. 2020, 162, 107714. [Google Scholar] [CrossRef]
- Hernández-García, K.M.; Cercado, B.; Rivero, E.P.; Rivera, F.F. Theoretical and experimental evaluation of the potential-current distribution and the recirculation flow rate effect in the performance of a porous electrode microbial electrolysis cell (MEC). Fuel 2020, 279, 118463. [Google Scholar] [CrossRef]
- Dange, P.; Pandit, S.; Jadhav, D.; Shanmugam, P.; Gupta, P.K.; Kumar, S.; Kumar, M.; Yang, Y.H.; Bhatia, S.K. Recent developments in microbial electrolysis cell-based biohydrogen production utilizing wastewater as a feedstock. Sustainability 2021, 13, 8796. [Google Scholar] [CrossRef]
- Liu, D.; Roca-Puigros, M.; Geppert, F.; Caizán-Juanarena, L.; Na Ayudthaya, S.P.; Buisman, C.; Heijne, A. Granular carbon-based electrodes as cathodes in methane-producing bioelectrochemical systems. Front. Bioeng. Biotechnol. 2018, 6, 78. [Google Scholar] [CrossRef]
- Pawar, A.A.; Karthic, A.; Lee, S.; Pandit, S.; Jung, S.P. Microbial electrolysis cells for electromethanogenesis: Materials, configurations and operations. Environ. Eng. Res. 2022, 27, 200484. [Google Scholar] [CrossRef]
- Speranza, G. The Role of Functionalization in the Applications of Carbon Materials: An Overview. C J. Carbon Res. 2019, 5, 84. [Google Scholar] [CrossRef]
- Zakaria, B.S.; Dhar, B.R. Progress towards catalyzing electro-methanogenesis in anaerobic digestion process: Fundamentals, process optimization, design and scale-up considerations. Bioresour. Technol. 2019, 289, 121738. [Google Scholar] [CrossRef]
- Ahn, Y.; Im, S.; Chung, J.W. Optimizing the operating temperature for microbial electrolysis cell treating sewage sludge. Int. J. Hydrogen Energy 2017, 42, 27784–27791. [Google Scholar] [CrossRef]
- Zhang, Y.; Angelidaki, I. Microbial electrolysis cells turning to be versatile technology: Recent advances and future challenges. Water Res. 2014, 56, 11–25. [Google Scholar] [CrossRef] [PubMed]
- Sun, R.; Zhou, A.; Jia, J.; Liang, Q.; Liu, Q.; Xing, D.; Ren, N. Characterization of methane production and microbial community shifts during waste activated sludge degradation in microbial electrolysis cells. Bioresour. Technol. 2015, 175, 68–74. [Google Scholar] [CrossRef] [PubMed]
- Nam, J.Y.; Tokash, J.C.; Logan, B.E. Comparison of microbial electrolysis cells operated with added voltage or by setting the anode potential. Int. J. Hydrogen Energy 2011, 36, 10550–10556. [Google Scholar] [CrossRef]


| Organism | Description | Maximum Hydrogen Production Rate or Accumulation | Growth Condition | Hydrogen Evolution Assay Condition | Hydrogen Enzymes | Ref. |
|---|---|---|---|---|---|---|
| Cyanothece 51142 | Unicellular and nitrogen-fixing cyanobacteria | 2.13 mL/L/h | ASP2 with nitrogen Temp 30 °C pH 7.4 Light intensity 46 µmol/m2/s | 50 mM glycerol in the medium | Nitrogenase and hydrogenase | [39] |
| Cyanothece sp. Miami BG 043511 | Unicellular nitrogen-fixing cyanobacteria | 16.4 µmol/g dry weight or 15.8 mL/L/h | ASP2 medium, no nitrogen, temp 3 °C, light intensity 30 µEm2/s, diurnal condition | Argon (100%) 30 µEm2/s | Nitrogenase and hydrogenase | [40] |
| Synechocystis sp. PCC 6803 | Non-nitrogen-fixing cyanobacterium | 0.037 µmol H2/mg/h | 70 mL of liquid BG-11 growth medium and aerated 45 µmol photon/m2/s | Argon (100%) 30 µEm2/s | Hydrogenase | [38] |
| Desertifilum sp. IPPAS B-1220 | Filamentous cyanobacterium | 0.229 µmol H2/mg/h | -do- | Argon (100%) 30 µEm2/s | Nitrogenase and hydrogenase | [38] |
| Synechococcus sp. I12 | Thermophilic cyanobacterium | 0.019 µmol H2/mg/h | -do- | Argon (100%) 30 µEm2/s | Hydrogenase | [38] |
| Phormidium corium B-26 | Filamentous cyanobacterium | 0.02 µmol H2/mg/h | -do- | Argon (100%) 30 µEm2/s | Hydrogenase | [38] |
| Plectonema boryanum ATCC 18200 | Non-heterocyst nitrogen-fixing cyanobacterium | 0.18 mL/mg/day | Chu #10 growth medium Light intensity 100 µ/m2/s (24 h) pH 7.5, temp 22 °C | Argon and CO2 temp 35 °C Light intensity 100 µ/m2/s | Hydrogenase | [41] |
| Geitlerinema sp. RMK-SH10 | Filamentous cyanobacteria | 0.271 μmol/mg/dry wt/h | ANS III medium Light intensity 30 µmol/m2/s Temp 30 °C | Argon + Medium without Nitrogen + 0.2 M NaCl + 18.9 mmol C-atom/ L glucose + 0.1 μM Ni+2, no light, temp 30 °C | Hydrogenase | [42] |
| Leptolyngbya valderiana BDU 20041 | Nitrogen-fixing cyanobacteria | 0.02 μmol/mg/dry wt/h | ASN III medium Light intensity 13.7 W/m2/s Temp 27–29 °C | Medium without nitrogen No light Temp 27–29 °C | Nitrogenase and hydrogenase | [43] |
| Synechocystis sp. strain PCC 6803 | Mutant formed by disrupting narB:ΔnirA cyanobacteria | 143 nmol/mg Chl-a/h | BG11 with Nitrogen + 20 mM HEPES Light intensity 40 µmol of photons/m2/s, temp 25 °C, pH 7.5 | Argon in dark for 12 h at room temperature | Nitrogenase and hydrogenase | [37] |
| Synechocystis sp. strain PCC 6803 | Mutant formed by disrupting narB:ΔnirA cyanobacteria | 186 nmol/mg Chl-a/h | BG11 + 20 mM HEPES Light intensity 40 µmol of photons/m2/s, temp 25 °C, pH 7.5 | Argon in dark for 12 h at room temperature | Hydrogenase | [37] |
| Organism Strains | pH | Temp | Light Intensity | Growth Medium | Hydrogen Evolution Assay Condition | Hydrogen Production Rate or Accumulation | Ref. |
|---|---|---|---|---|---|---|---|
| Tetraselmis subcordiformis | 7.6 | - | - | BG-11 growth medium with sulfur | medium + deionized water and chloride compounds instead of sulfur | 1.73 ± 0.31 cm3/h | [18] |
| Selenastrum bibraianum AARL G052 | - | 25 °C | 30.8 µmol photon/m2/s (24 h) | JM-S medium | - | 0.28 µmol/mg Chl-a/h | [46] |
| Selenastrum bibraianum AARL G052 | - | 25 °C | 30.8 µmol photon/m2/s (24 h) | Sulfur-deprived TAP | - | 0.71 µmol/mg Chl-a/h | [46] |
| Chlamydomonas reinhardtii (CC425) | 7.2 | 24 °C | 60 µmol photon/m2/s 12 h light/12 h dark | TAP + air | Sulfur-deprived TAP | 17.02 ± 3.83 µmol/L/h | [16] |
| Chlamydomonas moewusii (SAG 24.91) | 7.2 | 24 °C | 60 µmol photon 12 h light/12 h dark/m2/s | TAP + air | Sulfur-deprived TAP | 5.12 ± 0.37 µmol/L/h | [16] |
| Cyanothece PCC7822 | - | 30 °C | Continuous light at 30–50 µmol photon/m2/s | BG-11 aerated | Medium with no nitrogen No oxygen | 2474.4 ± 496.8 µmol H2/mg Chl-a/day | [33] |
| Cyanothece ΔhupL mutant | - | 30 °C | Continuous light at 30–50 µmol photon/m2/s | BG-11 | Medium with no nitrogen No oxygen | 84.0 ± 21.6 µmol H2/mg Chl-a/day | [33] |
| Cyanothece C ΔhupL | - | 30 °C | Continuous light at 30–50 µmol photon/m2/s | BG-11 | Medium with no nitrogen No oxygen | 2224.8 ± 434.4 µmol H2/mg Chl-a/day | [33] |
| Desmodesmus armatus var. bicaudatus AARL G019 | - | 25 °C | 30.8 µmol photon/m2/s (24 h) | JM-S | - | 0.30 µmol/mg Chl-a/h | [46] |
| Desmodesmus armatus var. bicaudatus AARL G019 | 25 °C | 30.8 µmol photon/m2/s (24 h) | TPA-S | - | 0.15 µmol/mg Chl-a/h | [46] | |
| Chlamydomonas reinhardtii 137c | 7.2 | 25 °C | 100 µmol photon/m2/s | TAP without sulfur | TAP + sulfur + nitrogen | 2.5 mL/L/h | [49] |
| Marine C. Pyrenoidosa IOAC707S | 7.2 | 28 °C | 25 µmol photon/m2/s (24 h) | TAP | TAP-P + 30 g/L NaCl | 22 mL/L | [50] |
| Stigeoclonium sp. AARL G030 | - | 25 °C | 30.8 µmol photon/m2/s (24 h) | TPA-S | - | 0.27 µmol/mg Chl-a/h | [46] |
| Marine C. Pyrenoidosa IOAC707S | 7.2 | 28 °C | 25 µmol photon/m2/s (24 h) | TAP | TAP-P and sea water | 38 mL/L | [50] |
| Chlamydomonas reinhardtii CC124 | 7.2 | 28 °C | 70 µmol photon/m2/s | TAP medium | Sulfur-deprived TAP | 3.3 mL/L/h | [51] |
| Chlorellaceae pyrenoidosa | 7 | 28 °C | 180 µmol photon/m2/s (24 h) | TAP medium | Sulfur-deprived TAP (alternate day dark: light) | 23.12 mL/L | [47] |
| Chlorellaceae pyrenoidosa | 7 | 28 °C | 180 µmol photon/m2/s (24 h) | TCP medium | TCP + DCMU (alternate day dark: light) | 93.86 mL/L | [47] |
| Chlorella sp. AARL G014 | - | 25 °C | 30.8 µmol photon/m2/s (24 h) | JM-S medium | - | 0.46 µmol/mg Chl-a/h | [46] |
| Chlorella sp. AARL G014 | - | 25 °C | 30.8 µmol photon/m2/s (24 h) | Sulfur-deprived TAP | - | 0.49 µmol/mg Chl-a/h | [46] |
| C. protothecoides | 7.3 | 30 °C | 30–35 µmol photon/m2/s (14 h light: 10 h dark) | TPA + 0.35 mM N4Cl | Nitrogen-deficient TPA 24 h light | 59.5 mL/L | [48] |
| C. protothecoides | 7.3 | 30 °C | 30–35 µmol photon/m2/s (14 h light: 10 h dark) | TPA + 0.35 mM N4Cl | Nitrogen- and sulfur-deficient TPA 24 h light | 82.5 mL/L | [48] |
| Microorganism | Fermentative Process | Substrate | Biohydrogen Production | Highest Hydrogen Production Rate | Environmental Factors | Ref. |
|---|---|---|---|---|---|---|
| Rhodobacter capsulatus DSM 1710. | Photofermentation | Acetic acid | 0.05 to 0.11 g H2/g acetete | 1.04 mmol/L/h | Light intensity 263.6 W/m2 Acetate concentratiom 35.35 mM VSS (suspended volatile substance) 0.27 gVSSL/L | [78] |
| Rhodobacter sphaeroides | Photofermentation | Mallic acid | 960 mL H2/L malate | 41.74 mL/L/h | pH (6.5 to 8) Light intensity (35–185 W/m2) Carbon/nitrogen (15–35) | [68] |
| Rhodopseudomonas palustris | Photofermentation | Dark fermented palm oil mill effluent (DPOME) | 30.59 mL. H2/g-CODremoved | 0.514 mL/h | pH-6 Inoculum substrate percentage 20% Light intensity 350 W/m2 | [79] |
| Rhodobacter sphaeroides | Dark and photofermentation | Malic acid + 0.2 g/L yeast extract | 0.008 L/L/h | 0.012 L/L/h | Light intensity (150–250 W/m2) pH 7 to 8.25 | [69] |
| R. capsulatus | Photofermentation | Dark fermentation effluent + lactose + glucose | 1.59 mmol H2/mLmedium | 208.4 mmol H2/Ld | Temperature (35 ± 3 °C) Light intensity (70 photon µmole/m2/s) agitation (130 rpm) | [74] |
| Enterobacter aerogenes | Dark fermentation | Carbohydrate in cheese whey (CW) | 32.5 g/L CW | 24.7 mL/L/h | Temperature (25–37 °C) pH (5.5–7.5) | [73] |
| Clostridium and Enterobacter | Dark fermentation | Rice husk | 320.6 mL/g DAH | 2608 mLH2 /L/day | pH of 7 to 7.5 | [77] |
| Clostridium and Enterobacter | Dark fermentation | Dilute acid hydrolysis of rice husk + 0.75 mg cellulase/mL | 473.1 mL/g DAH | 3793 mL H2 /L/day | pH of 7 to 7.5 | [77] |
| Mode of Operation | Advantages/Benefits | Disadvantages/Limitations |
|---|---|---|
| Direct biophotolysis |
|
|
| Indirect biophotolysis |
|
|
| Dark fermentation |
|
|
| Photofermentation |
|
|
| Dark photofermentation |
|
|
| Microbial electrolysis cell |
|
|
Disclaimer/Publisher’s Note: The statements, opinions and data contained in all publications are solely those of the individual author(s) and contributor(s) and not of MDPI and/or the editor(s). MDPI and/or the editor(s) disclaim responsibility for any injury to people or property resulting from any ideas, methods, instructions or products referred to in the content. |
© 2023 by the authors. Licensee MDPI, Basel, Switzerland. This article is an open access article distributed under the terms and conditions of the Creative Commons Attribution (CC BY) license (https://creativecommons.org/licenses/by/4.0/).
Share and Cite
Yumnam, P.; Debnath, P. A Review on Mathematical Modeling of Different Biological Methods of Hydrogen Production. Hydrogen 2023, 4, 881-916. https://doi.org/10.3390/hydrogen4040053
Yumnam P, Debnath P. A Review on Mathematical Modeling of Different Biological Methods of Hydrogen Production. Hydrogen. 2023; 4(4):881-916. https://doi.org/10.3390/hydrogen4040053
Chicago/Turabian StyleYumnam, Priyakrishna, and Pradip Debnath. 2023. "A Review on Mathematical Modeling of Different Biological Methods of Hydrogen Production" Hydrogen 4, no. 4: 881-916. https://doi.org/10.3390/hydrogen4040053