Article

Stability of the TiO2 Nanuclusters Supported on Fe2O3-Hematite for Application in Electrocatalytic Water Splitting—An Insight from DFT Simulations

by
Tomasz Dymkowski
1,†,
Wiktor Żuczkowski
1,†,
Wojciech Kołodziejczyk
2,
Glake Hill
2 and
Bartłomiej M. Szyja
1,*
1
Faculty of Chemistry, Wrocław University of Science and Technology, Gdańska 7/9, 50-344 Wrocław, Poland
2
Department of Chemistry, Physics and Atmospheric Sciences, Jackson State University, 1400 J.R. Lynch St., Jackson, MS 39217, USA
*
Author to whom correspondence should be addressed.
These authors contributed equally to this work.
Hydrogen 2023, 4(3), 573-584; https://doi.org/10.3390/hydrogen4030037
Submission received: 23 July 2023 / Revised: 18 August 2023 / Accepted: 22 August 2023 / Published: 24 August 2023
(This article belongs to the Special Issue Feature Papers in Hydrogen (Volume 2))

Abstract

:
We present the analysis of the stability of the (TiO2)n nanoclusters, where n = 2–4, supported on the Fe3O3-hematite (100) surface. The analysis is focused on the size and geometry of the nanocluster, which defines the contact with the supporting hematite surface. The aim of the work is to explore the role of the interaction within the nanocluster as well as between the nanocluster and the surface in the structure of the composite system. We have used an in-house developed variant of the solids docking procedure to determine the most stable initial configurations of the nanoclusters with respect to the surface. Subsequently, we have carried out molecular dynamics simulations to enable finding a more stable configurations by the systems. The results show the three possible binding modes for the (TiO2)2 systems, but many more such modes for the larger clusters. Additionally, we have found that the partial dissociation of the nanocluster takes place upon the contact with the surface.

Graphical Abstract

1. Introduction

Escalating usage of fossil fuels, coupled with its consequent environmental contamination and the looming depletion of these resources, has invigorated the quest for novel, sustainable fuel alternatives that are not only facile to produce, but also mitigate the rising levels of atmospheric carbon [1,2]. This calls for countermeasures to make energy consumption more sustainable, especially considering the projected doubling of energy consumption by 2050 [3]. Of the numerous options under scrutiny, hydrogen is progressively acknowledged as a pivotal catalyst for the prospective, large-scale, and enduring storage of green, renewable [4,5,6]. Hydrogen is crucial in the so-called hydrogen economy [3]—in which many applications of this chemical have been found in important industry branches. Besides using it directly as a fuel—either in fuel [7,8] combustion [9], hydrogen is the key ingredient of ammonia synthesis [10] or important from the environmental protection point of view hydrogenation reactions [11,12,13], including CO2 hydrogenation [14].
Worldwide, scientific communities are engaging in the exploration of inventive ways to acquire hydrogen. Photoinduced water splitting is one of techniques that have gained significant attention. Tracing its origin to the early 1970s, the interest in this innovative method has substantially increased in the second decade of the 21st century [15,16].
The most important factor from the point of view of the catalysis is the interaction of the intermediates with the catalyst surface, and in this respect, the transition metal oxides are most commonly used [17]. These materials are also suitable too be used in the photocatalysis, as they are capable of light absorption [18], and depending on the properties of the given catalytic system, the hydrogen can be obtained water using the solar energy.
The hematite form of Fe2O3 is one of the materials capable of the photon absorption in the visible light spectrum, as its band gap value amounts to 2.1 eV; however, its other properties limit its efficiency in practical applications. First of all, its conduction band position is lower than the water reduction potential—as such, hematite is not able to drive the water splitting photocatalytically, but rather in the photo-electrocatalytic process [19]. Hematite is characterized by a small depth of penetration by light (180–550 nm) and short hole diffusion length (2–4 nm) [20]. This causes the excitons to be formed only at the surface, and leads to the quick recombination of the electron/hole pair, without promoting the redox reaction to take place. Hence, the design of the more efficient traps to prevent fast electron/hole recombination is desired.
The design of intricate heterojunction photocatalyst structures serves as an efficacious approach for enhancing their performance in the conversion of solar energy. Incorporating an accessible electron path layer beneath the Fe2O3 top layer is indispensable in enhancing the photocurrent, thereby facilitating a more effective water-splitting process [21].
In parallel research, Satti et al. demonstrated that the engineered TiO2/Fe2O3 nanocomposite functions as a potent catalyst for hydrogen production through water splitting, photocatalytic dye degradation, and antimicrobial applications. The composite, formed through the combined incorporation of iron (III) oxide (Fe2O3) and titanium oxide (TiO2), exhibits substantial promise for oxygen evolution reactions, in addition to its photocatalytic and antimicrobial applications. The developed nanocomposite manifests superior performance in electrocatalytic water splitting, enhanced photocatalytic activity, and advanced antimicrobial efficacy [22].
In contrast, Niu et al. explicated in their study that α−Fe2O3@TiO2 core-shell nanoparticles show amplified absorption across ultraviolet and visible spectra. The remarkable catalytic efficiency of α−Fe2O3@TiO2 is attributed to its unique core-shell structures, significant specific surface area, powerful light absorption, and the synergistic effects conferred by the heterojunction [23].
With the growing demand for catalysts in photoelectric water splitting, the discovery of novel materials suitable for this process has been expedited. Progress in computational chemistry has simplified the understanding of the underlying phenomena of this process, employing an extensive array of computational methodologies [24,25,26].
Nanoclusters of TiO2 exhibit diverse arrangements on the surface, which subsequently influence their properties. In this paper, we have employed computational methods to examine various configurations of TiO2 clusters on the surface of hematite, with the intent to assess the potential changes to the band gap and the ability to create effective traps originating from titanium. In addition, the Fe−O−Ti bridges may help in the formation of the catalytically active sites, what can help in otherwise poor oxygen evolution reaction kinetics [27].

2. Aim and Scope of the Work

This work aims to unravel the interactions between the TiO2 nanoclusters and the hematite surface. These interactions are responsible for the stability of the nanoclusters and, in turn, for the activity of the system in the water splitting reaction. For the investigations, we have chosen the (TiO2)n nanoclusters, where n = 2–4, and the hematite (110) surface.
The activity of the isolated nanoclusters in water splitting has been investigated by us previously [28]. However, we expect that the interaction with the surface will significantly alter the geometry of the nanoclusters. In addition, we assess the role of the solvent in the stability of the supported nanoclusters.

3. Model and Computational Details

3.1. Energy of the Systems
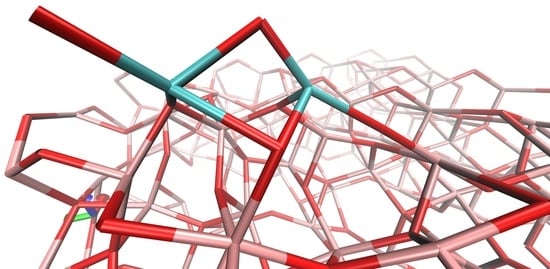
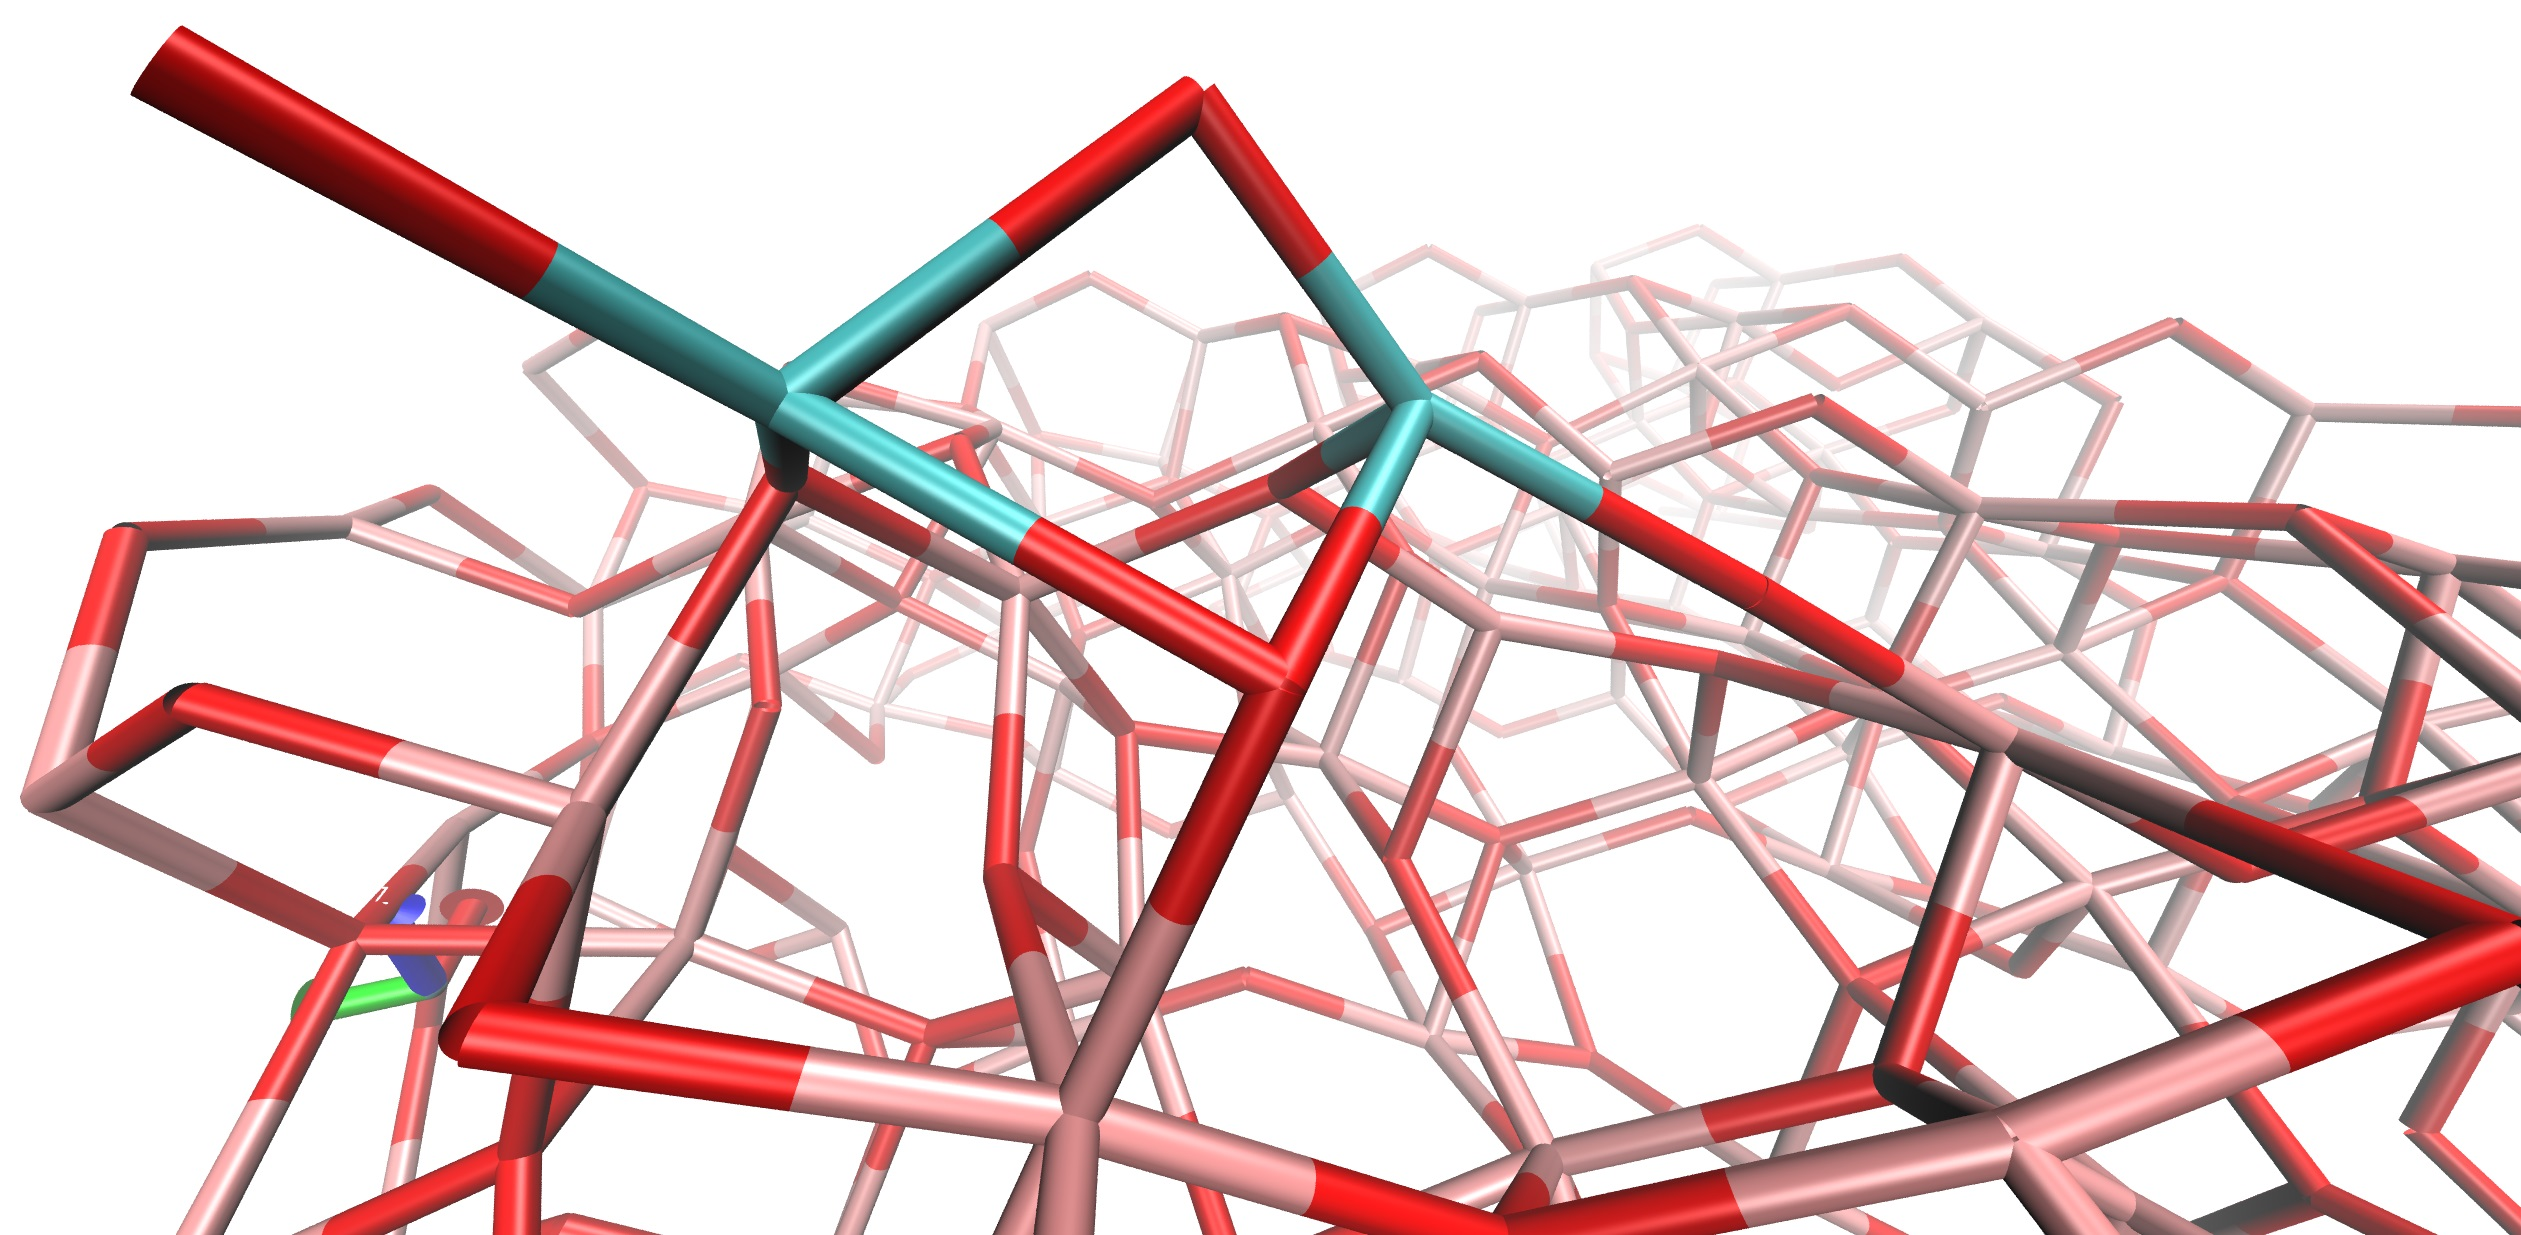
All calculations in this work were carried out using the Density Functional Theory (DFT) framework [29]. We employed the Perdew–Burke–Ernzernhof functional [30,31] and the DZP numerical basis set, as implemented in the SIESTA code version 4.1 [32]. The numerical mesh was truncated with a 200 Ry cutoff. Given the size of the system under investigation, we used the Γ -point approximation. Strong on-site Coulomb interactions were accounted for using the Hubbard U correction. The values for U were set to 4.3 eV for Fe and 10.0 eV for Ti, as reported in the literature [33].

3.2. Base Model

The system we investigated was the (110) surface of Fe2O3-hematite, chosen for consistency with our previous studies on this subject [34,35,36]. The hematite is an antiferromagnet, with the ferromagnetic ordering in a (0001) plane and opposite direction of magnetic moments in every other layer of atoms [37]—this was accounted for by setting the initial spin up/down in relevant atoms. Additionally, the atoms of the bottom layer have been fixed to simulate the effect of bulk.
The TiO2 clusters chosen for analysis were based on the work by Qu and Kroes [38] and are depicted in Figure 1.

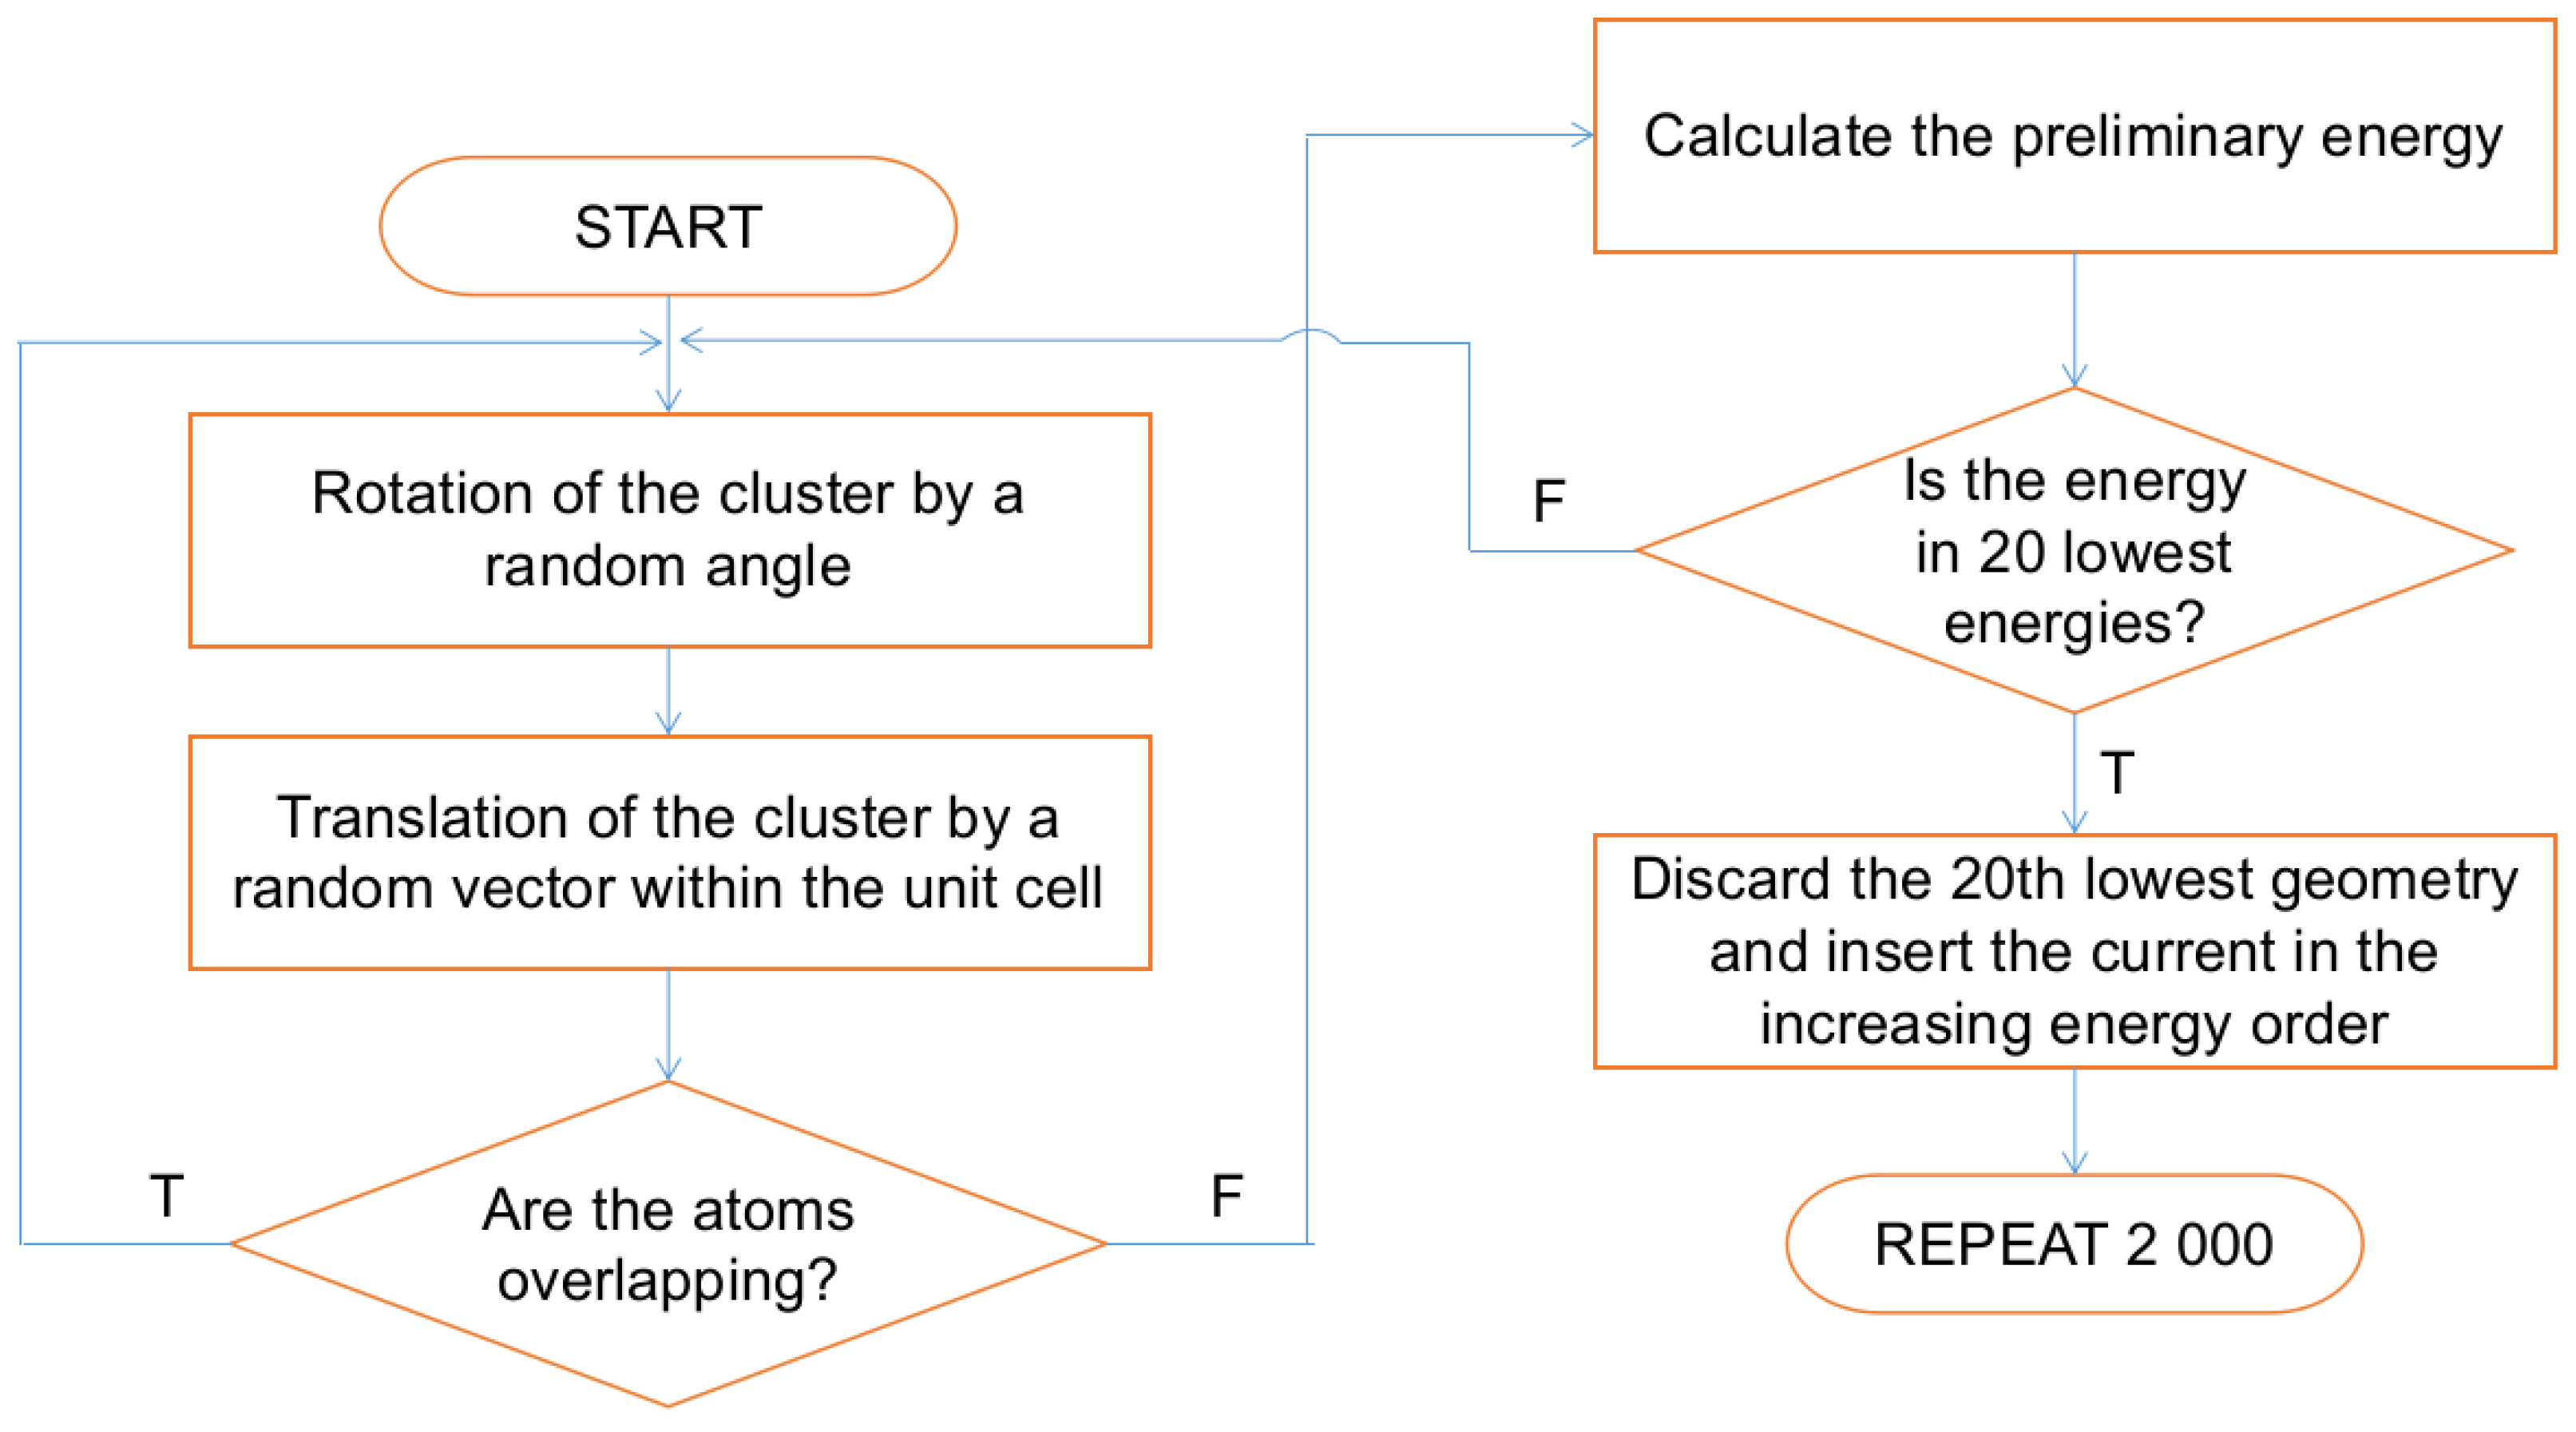
3.3. Initial Geometries

The pivotal aspect of this study revolves around the geometrical factor. Given the multitude of possible orientations of the (TiO2)n nanoclusters relative to the surface, we devised an algorithm to generate a wide variety of samples. The flowchart of this algorithm is illustrated in Figure 2.
We implemented the algorithm using ASE [39]. It comprises a main loop that attempts to generate a new geometry. Initially, the cluster is randomly rotated and translated within a unit cell. This can potentially result in the cluster being positioned too deeply within the hematite surface. Such positioning is verified using the contact distances between the system components. Configurations where the distance is less than or equal to r 0.5 Å are discarded, prompting the algorithm to restart.
Upon successful positioning, an energy evaluation ensues. Owing to the computational demands of this repetitive step, we employed a simplified energy evaluation method using the SIESTA code, albeit with a significantly reduced mesh cutoff parameter (50 Ry as opposed to the usual 200 Ry). This method was exclusively for rapid energy evaluations; all subsequent calculations reverted to the 200 Ry mesh cutoff.
The energy derived from the preceding step was then associated with the geometry, building a list of potential candidates. If this list contained fewer than 20 structures, the geometry was directly added in order of increasing energy. If not, the new candidate replaced the least stable geometry.
We repeated this procedure 2000 times to ensure comprehensive sampling of the initial geometries. All the derived structures were then optimized before proceeding to the MD simulations.

3.4. Molecular Dynamics Simulations

The Molecular Dynamics simulations were conducted using the computational setup detailed in Section 3.1. We set the simulation temperature to 350 K, controlled by the Nosé-Hoover thermostat [40,41]. The total simulation duration was 1 ps, encompassing 10,000 steps, each lasting 1 fs. Cell parameters remained unchanged during the MD run, with the initial 10% of each run dedicated to system equilibration and subsequently excluded from the analysis.
Given the vast number of initial geometries for each system under consideration, we chose not to replicate simulations for every unique initial geometry. We assumed the breadth of geometry sampling would suffice. Subsequent results validate this assumption, a topic further elaborated upon in the following sections.

4. Results and Discussion

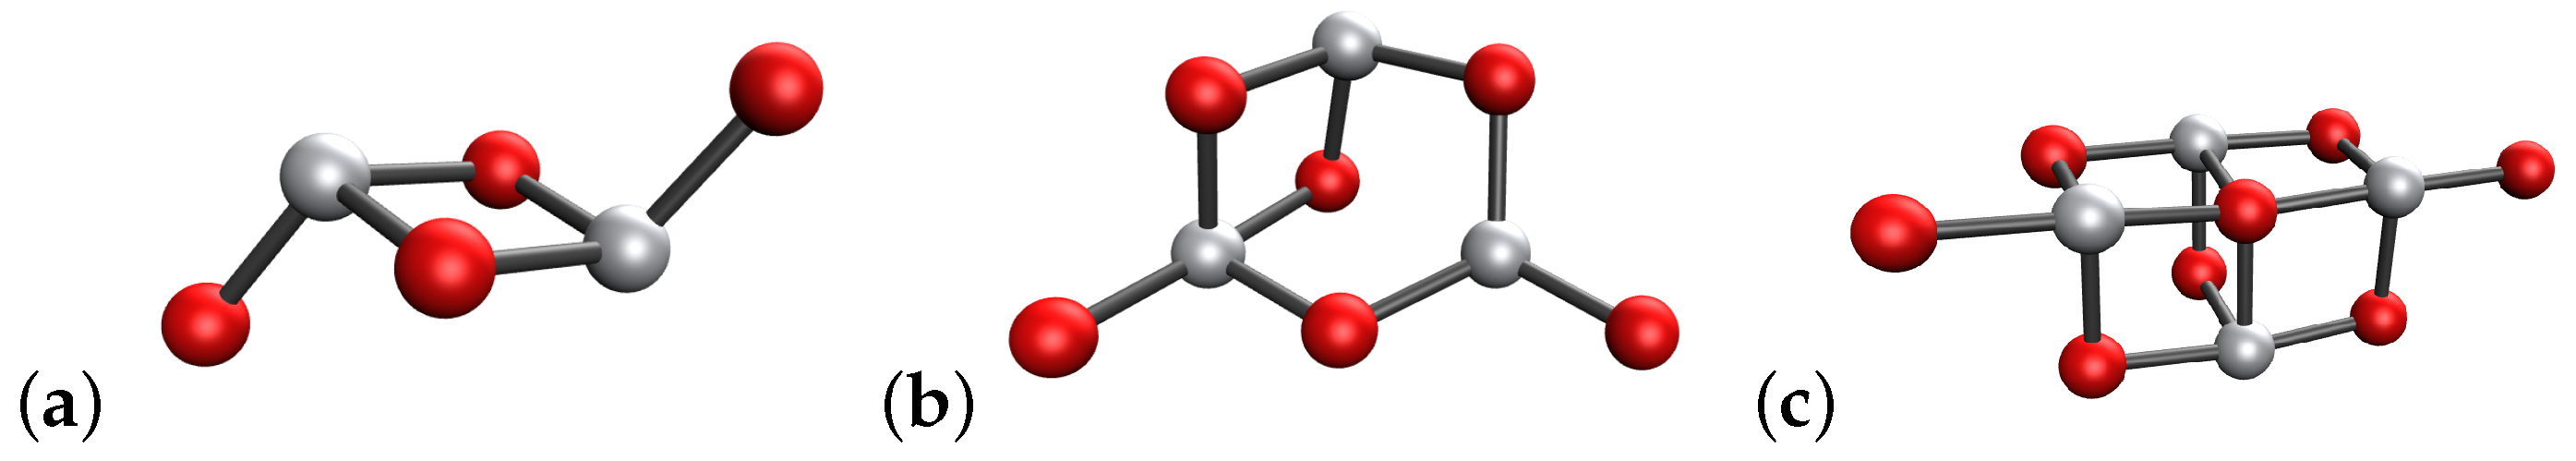
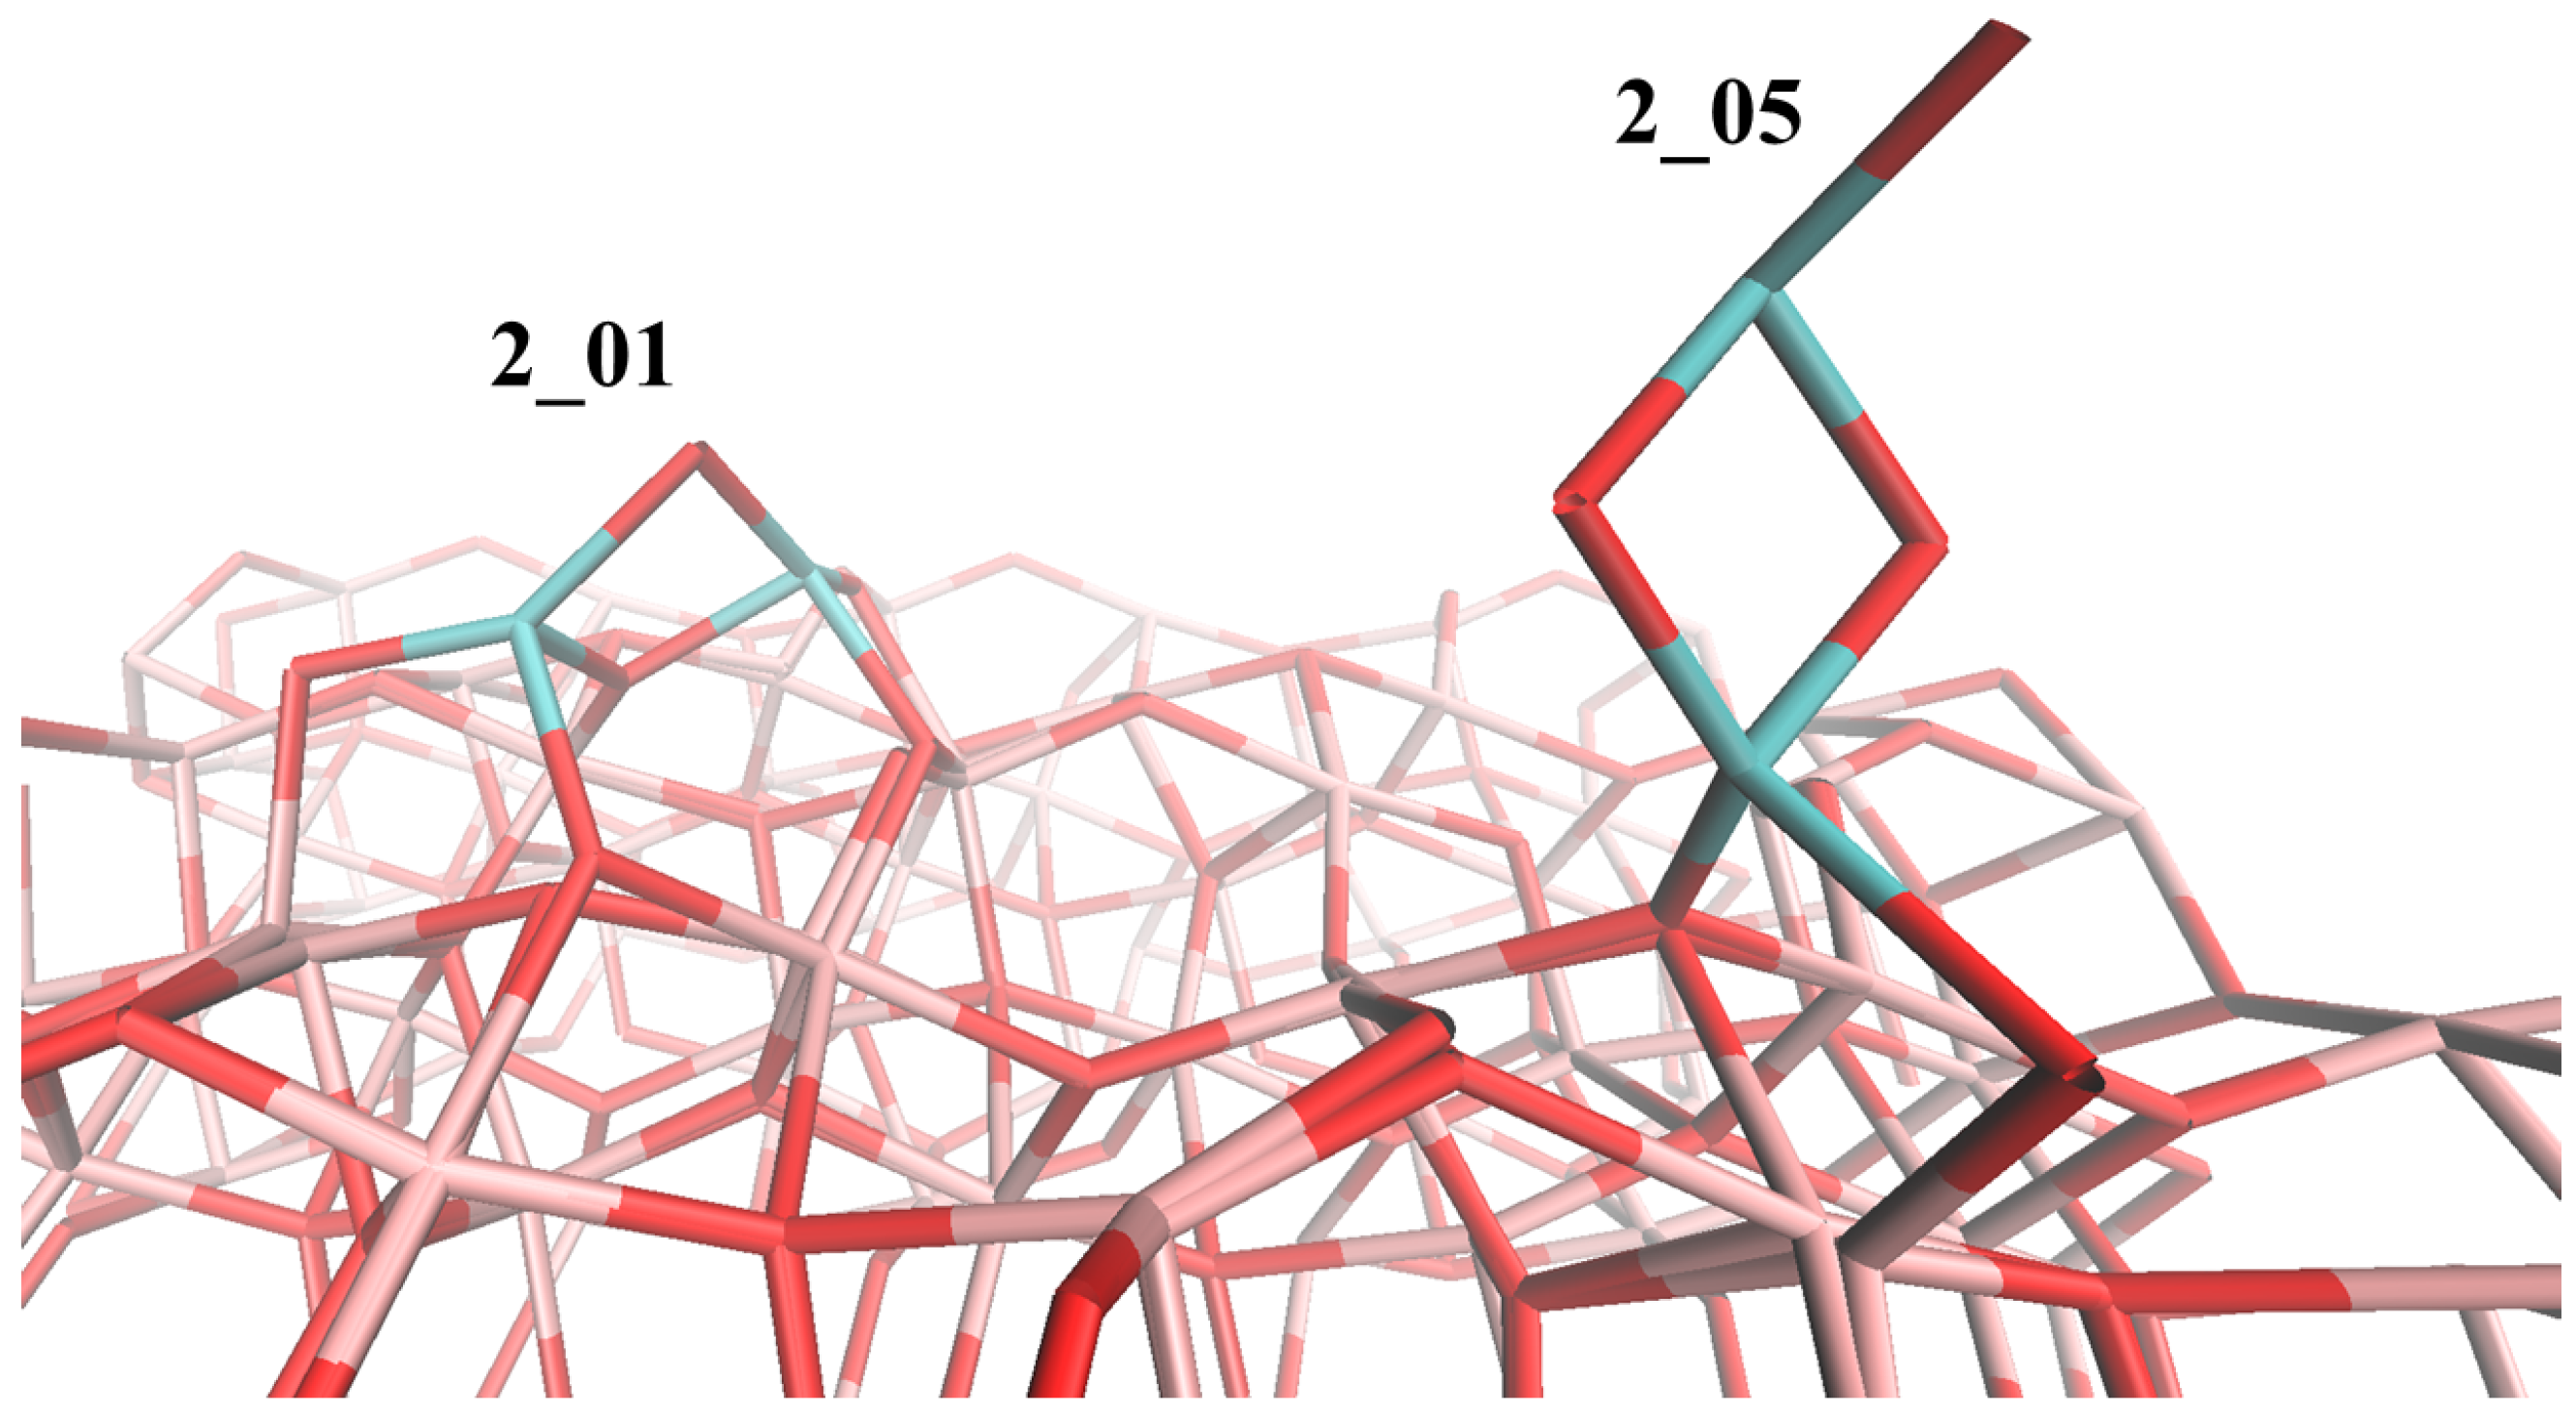
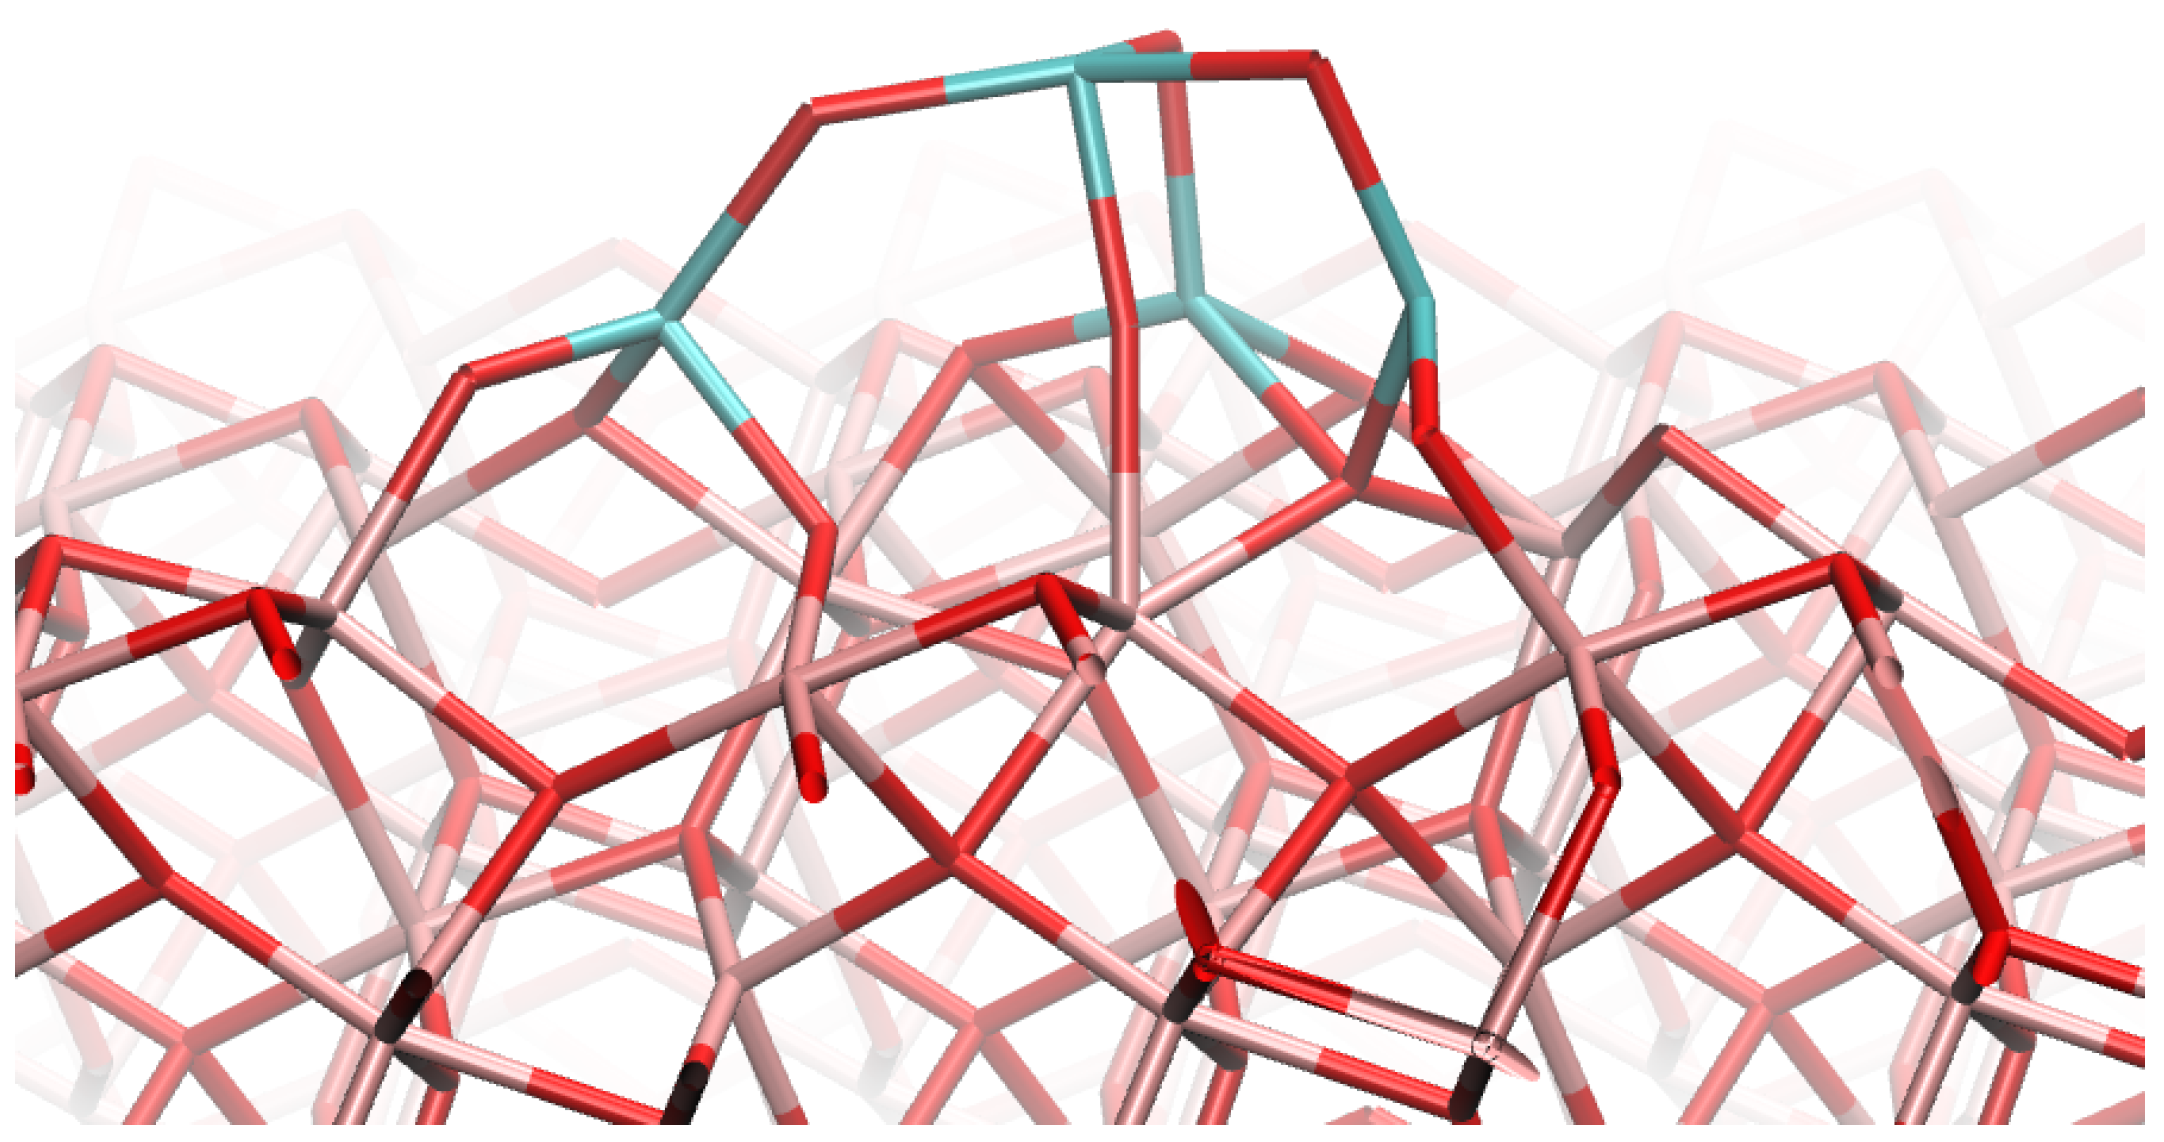
4.1. (TiO2)2 Systems

The energies of the optimized systems are presented in Table 1. Notably, the resultant geometries can be classified into two categories: the more stable configurations, where the energy difference, Δ E, is approximately 0.5 eV relative to the most stable systems, and those with considerably higher energy, ranging between 1–5 eV. The systems labeled as 2_08 and 2_12 emerge as the most stable configurations.
The significant variations in energy can be attributed to the orientation of the nanocluster relative to the surface. Specifically, the orientation of the (TiO2)2 tends to be either parallel or perpendicular to the surface. The parallel orientation is more energetically favorable, as it facilitates the formation of a greater number of covalent bonds between the nanocluster and the hematite surface, as depicted in Figure 3.
The optimal geometry is typified by the oxygen bridges connecting the Ti and Fe atoms. These Fe−OTi bonds, with a length of 2.07 Å, are longer than the Ti−OTi bonds found within the TiO2 cluster, which span 1.81–1.85 Å.
Subsequent MD simulations were performed to probe the possibility of interconversions among the systems. The goal was to discern the circumstances under which the system could transition from one local minimum to a more stable configuration, especially at slightly elevated temperatures.
It can be observed that the MD simulations in all investigated cases led to a decrease in the potential energy upon the reorganization of the cluster. Most importantly, all configurations with a very high relative energy (more than 5.0 eV) relaxed to more stable states. An example of this is the 2_00 system, which, prior to MD simulation, belonged to the group of the least stable ones (5.03 eV). After MD, its potential energy decreased to 0.07 eV upon the formation of the Fe−OTi bonds.
The results demonstrate that there are three different binding modes of the (TiO2)2 to the hematite surface; all of them have the nanocluster parallel to the surface. These are shown in Figure 4. By the end of the MD simulation, the 2_00 system belonged to the type 2 binding mode, which is energetically the most preferred. Besides 2_00, the systems showing this binding mode are 2_01, 2_03, 2_08, 2_12, and 2_15.
Increases in energy have also been observed for the (TiO2)2 systems, but these are only related to energy fluctuations due to the thermal motion of the atoms and are minor in general.
The least energetically stable group of systems includes 2_05, 2_16, 2_17, and 2_19. Their energy is approximately 1.5 eV higher than the reference, the most stable system, and they all exhibit binding mode 3.

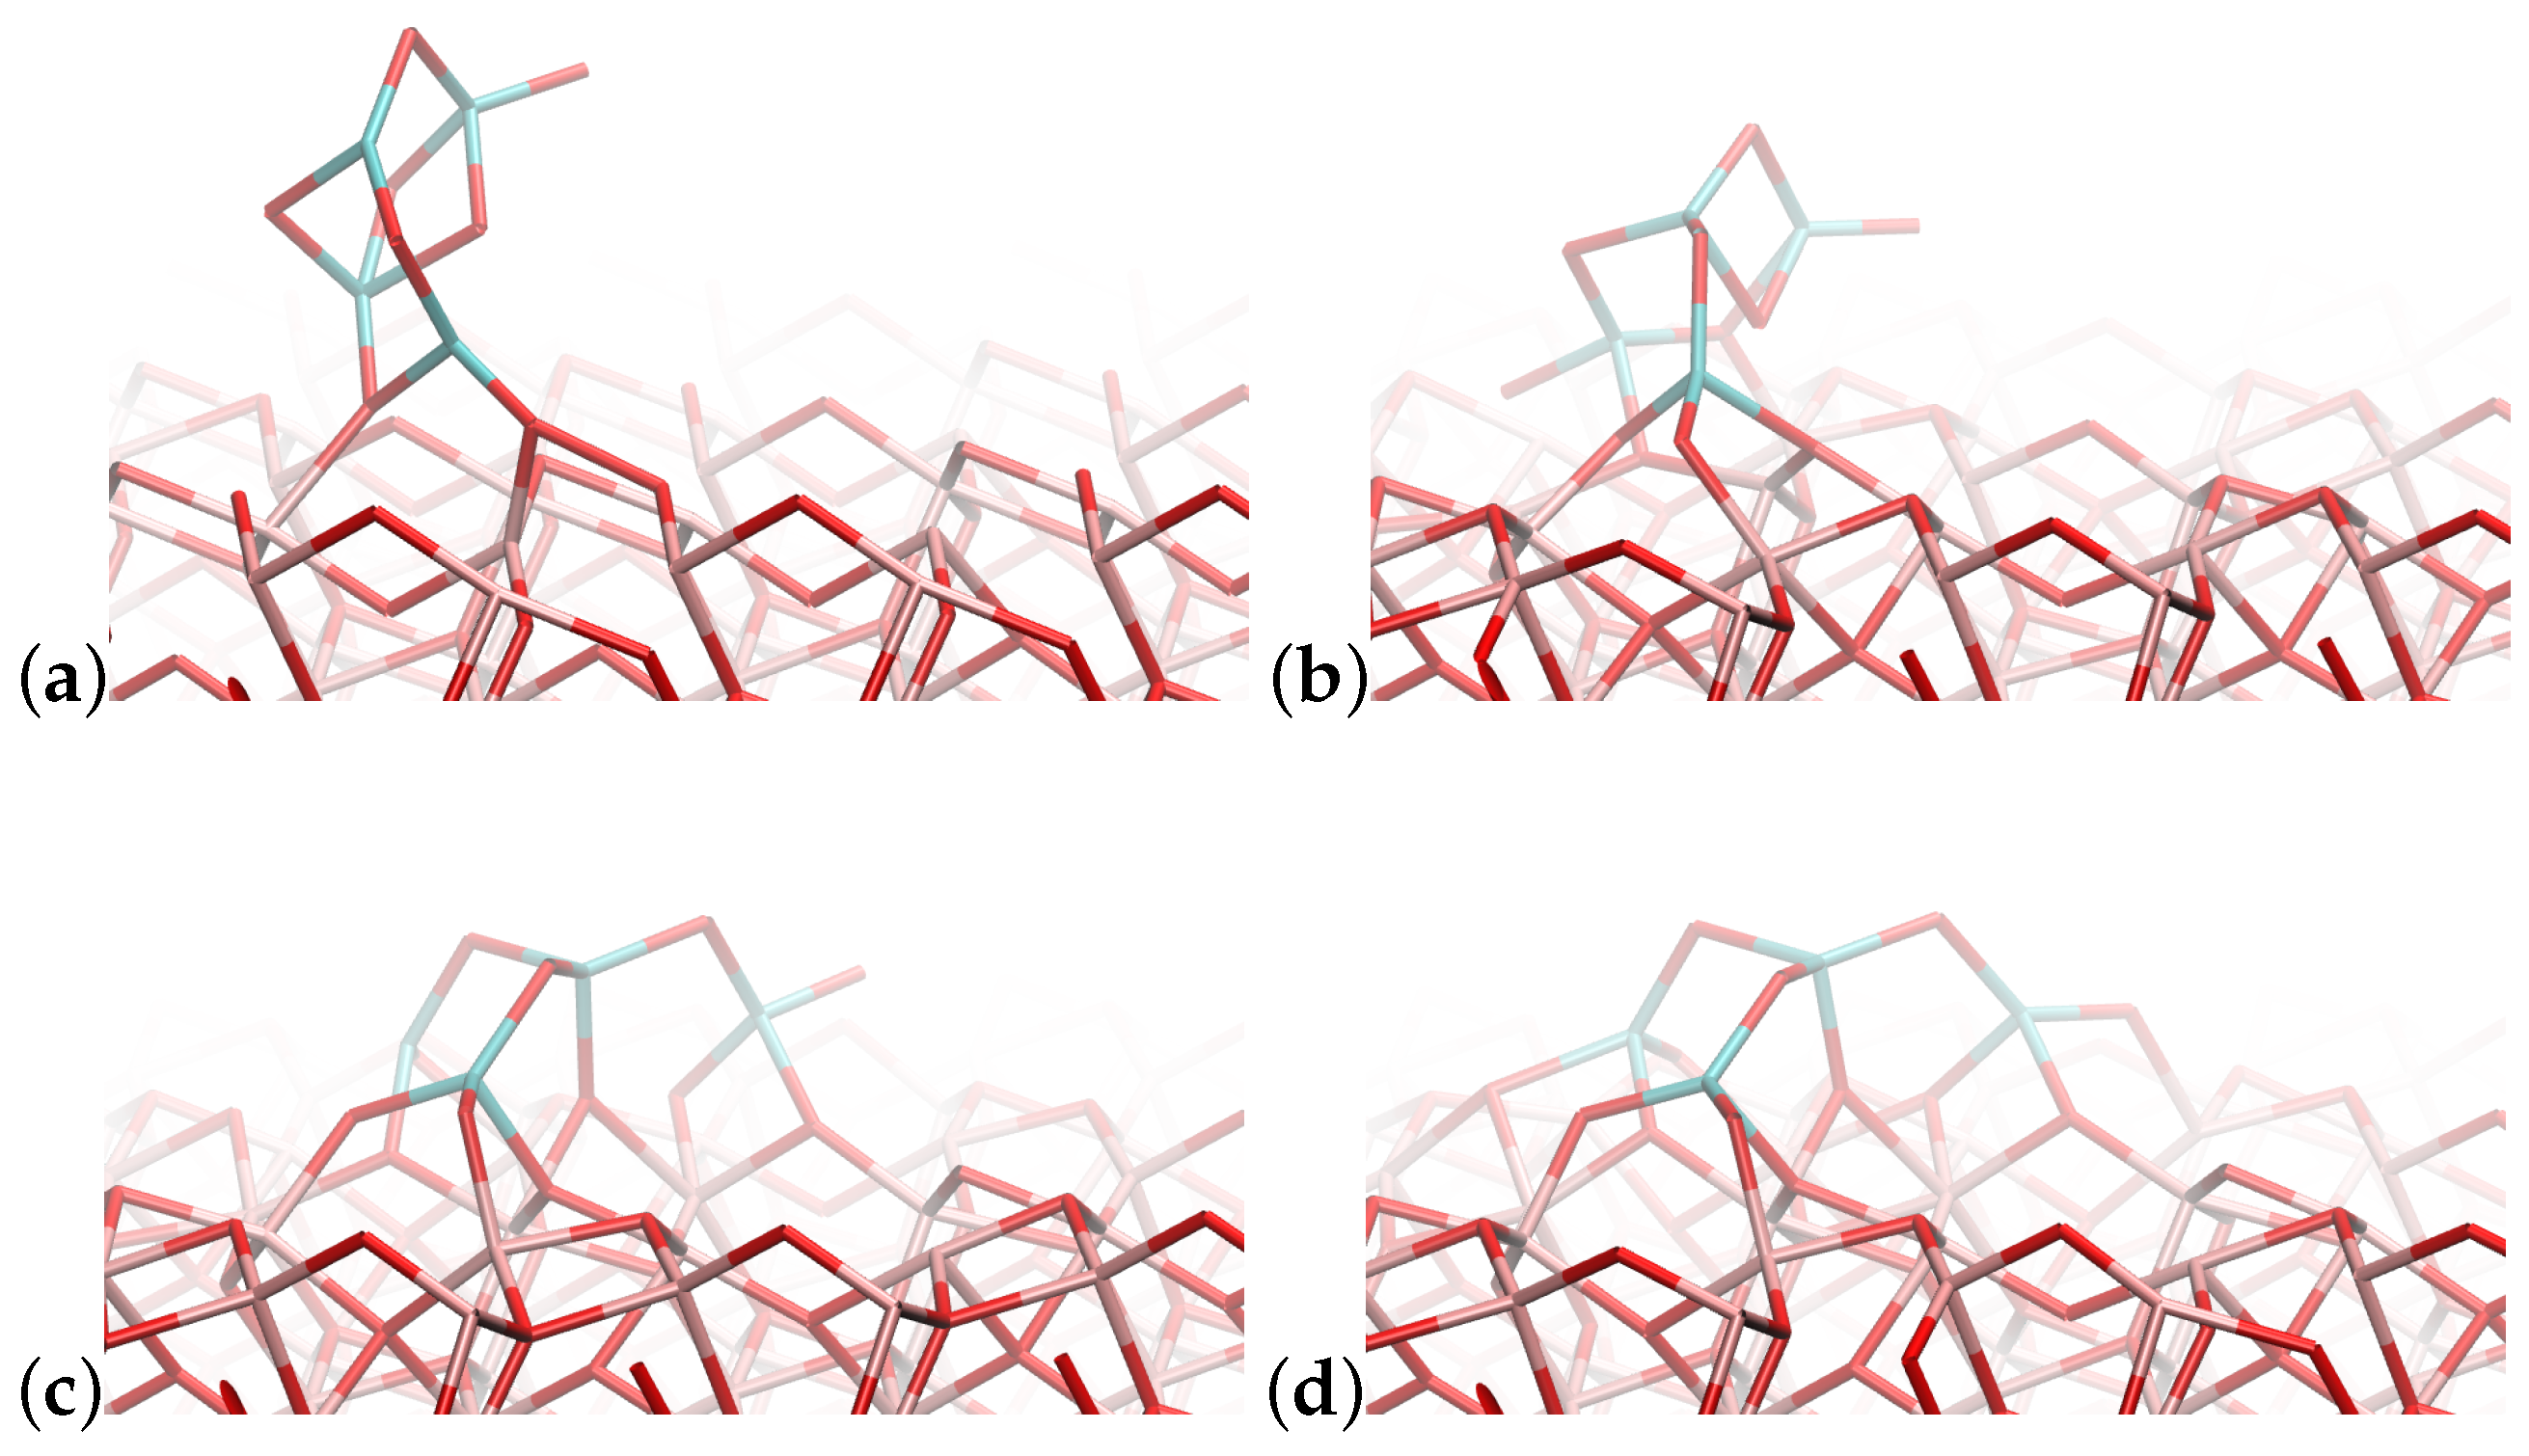
4.2. (TiO2)3 Systems

The results for the (TiO2)3 systems are quite different. Consistent with the results described above, the interaction between the nanocluster and the surface is significant. This translates to the Ti−O−Fe bridges being formed, releasing a significant amount of energy. The (TiO2)3 systems are characterized by low symmetry, as shown in Figure 1. This leads to a wide range of possible orientations of the nanoclusters concerning the surface.
Table 2 contains the potential energy values calculated for the optimized (TiO2)3 clusters. Unlike the (TiO2)2 systems, we observe a significant variation in potential energies compared to the most stable one, 3_12. In fact, it is impossible to assign a binding mode to a specific group of nanoclusters interacting with the surface, as each system has its unique binding mode.
Additionally, there are only three systems besides the most stable 3_12, namely 3_04, 3_05 and 3_08, whose potential energy is within 1.0 eV with respect to the 3_12. Considering the smallest difference in stability amounts to 0.61 eV, we can conclude the significantly lesser stability of the (TiO2)3 systems.
The explanation of this observation is shown in Figure 5a. The most stable system—3_12—undergoes a partial dissociation of the nanocluster. One of the Ti−O−Ti bridges is cleaved, and instead new oxygen bridges between the Ti and the Fe atoms are formed. This is consistent with the significant strength of the interactions between the nanocluster and the surface, which in this case are able to overcome the internal stability of the nanocluster.
Figure 5b shows the 3_16 system, which does not show the signs of the dissociation, and the nanocluster remains intact. This configuration, however, is characterized by a significantly lower stability. The potential energy of this system amounts to 2.46 eV with respect to the reference 3_12.
Interestingly, the MD simulations do not lead to the stabilization of the system, as it was the case for the (TiO2)2 systems. In most cases, the potential energy upon the MD simulation remains the same, or changes only slightly. This is again the result of the thermal vibrations, which leads to insignificant potential energy fluctuations.
Interestingly, the 3_16 system undergoes the cleavage of one of the Ti−O−Ti bridges during the MD run. The initial and final geometries are shown in Figure 6a,b, respectively. This again confirms the observation of the preferable formation of the Ti−O−Fe formations with respect to Ti−O−Ti.

4.3. (TiO2)4 Systems
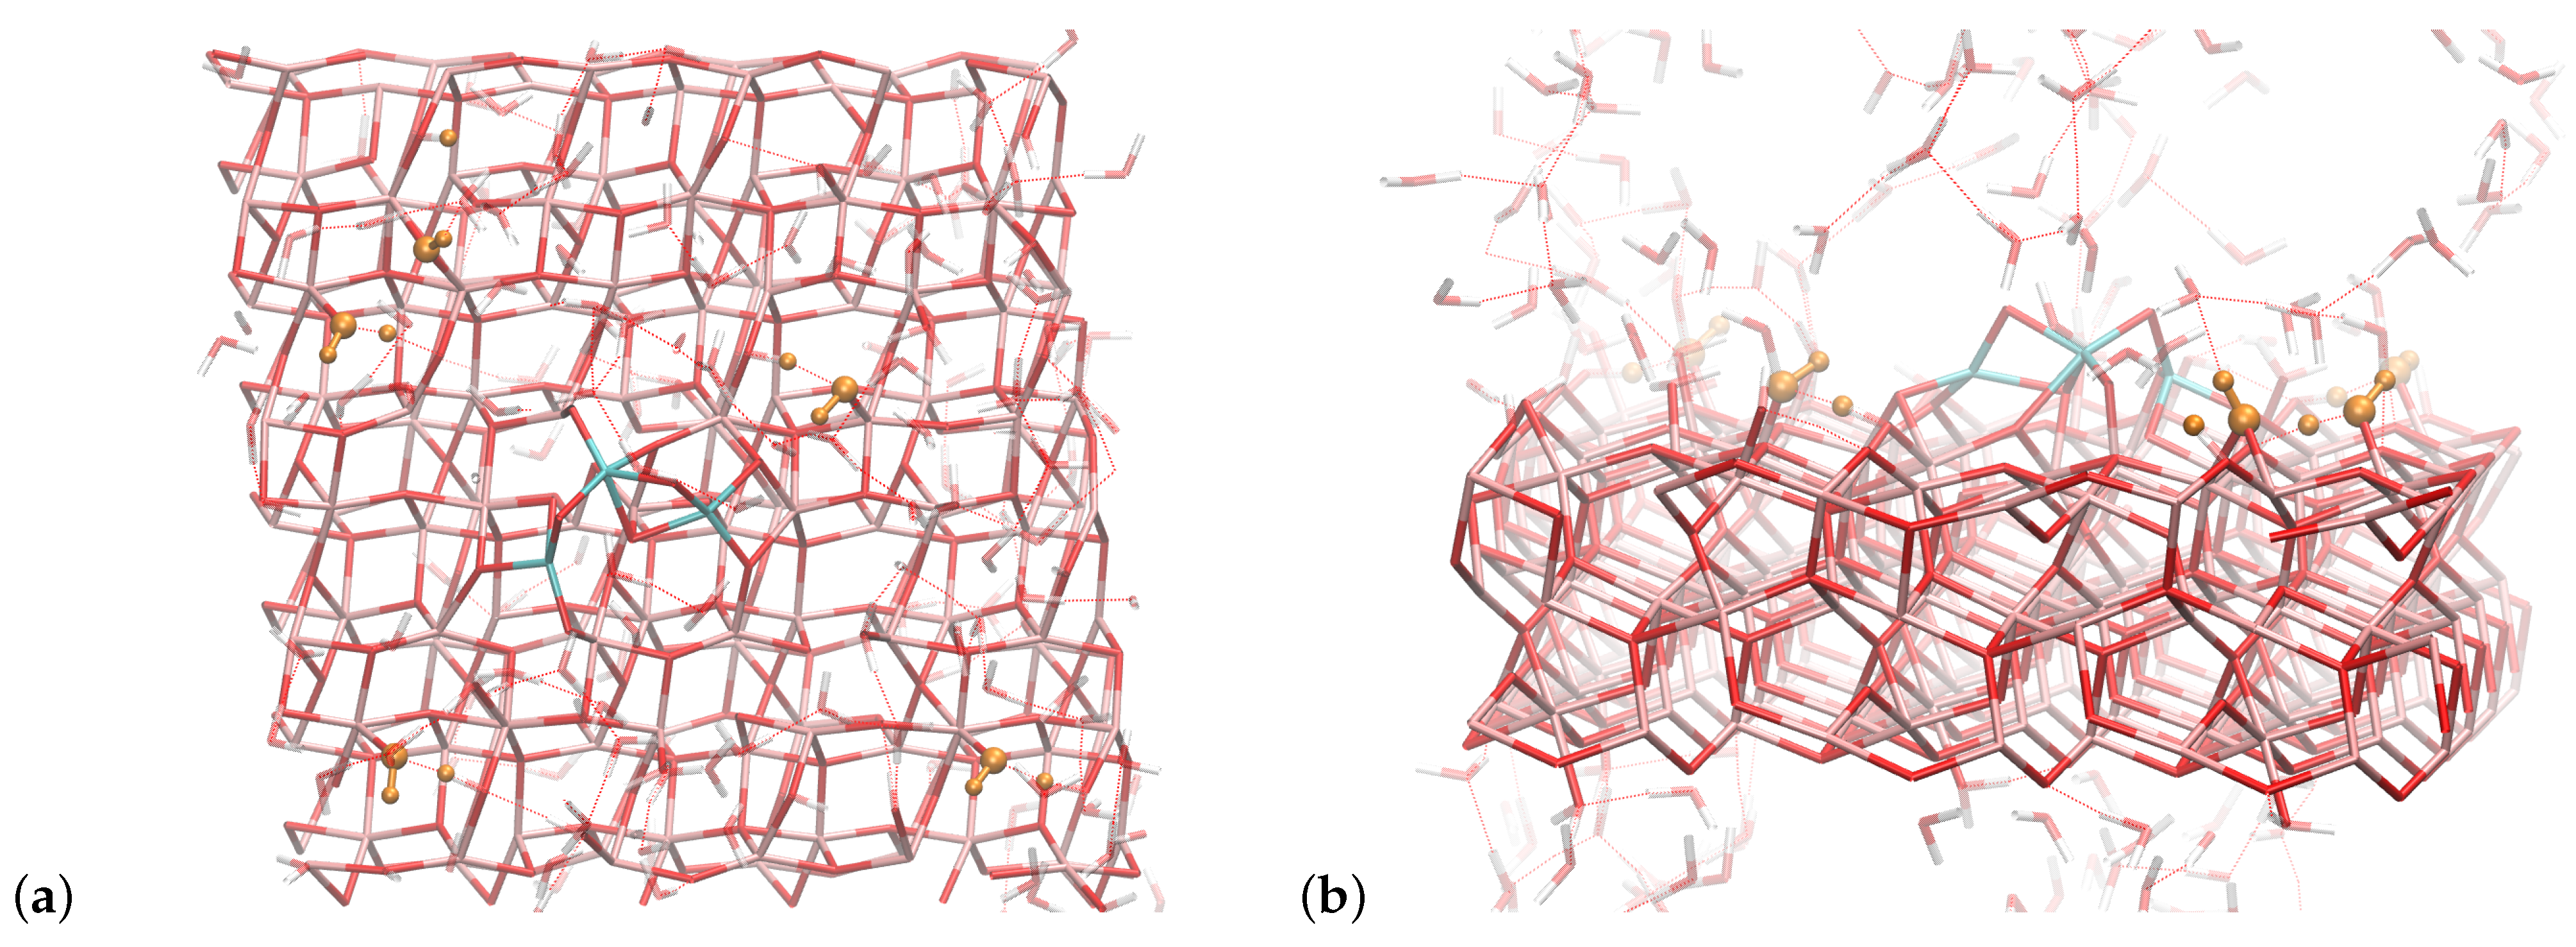
The systems containing (TiO2)4 clusters exhibit behavior similar to the (TiO2)3 systems. Based on our results, we could not identify any preferred binding modes; each cluster essentially displays a distinct binding mode. The most stable configuration, upon geometry optimization, was observed for the 4_14 system, as detailed in Table 3.
Figure 7 shows the optimized geometry of the 4_14 cluster. Similarly to the (TiO2)3 systems, some of the oxygen bridges connecting the Ti atoms has been cleaved, and instead the connections with the hematite surface have been formed. This once again is consistent with the observations for the other types of clusters, where the interactions with the surface were determined to be stronger that those within the cluster.
Interestingly, the relative stability of the optimized geometries did not always reflect the most stable ones obtained from the MD simulations. In some cases—such as 4_03 or 4_07—only minor fluctuations of the geometry have been observed, and the relative stability did not change significantly.
The 4_14 system, which was the most stable after geometry optimization, changed the geometry during the MD simulation. This resulted in switching to a less stable local minimum and an increase in the potential energy of the system by 2.0 eV.
Contrary to that, the system 4_09, which was the least stable after simple geometry optimization, located itself in the global minimum. Potential energy decreased by as much as 5.62 eV. This is the result of the perpendicular orientation at the beginning of the MD run. This is shown in Figure 8a. During the simulation, more connections are being formed with the surface, what is responsible for such a significant stabilization. Figure 8c shows the dissociation of the Ti−O−Ti bridges within the cluster, what finally leads to the geometry with only Ti−O−Ti bridges between the central Ti atom and each of the other Ti atoms, which in turn form 3 Ti−O−Fe bridges each. Compared to the most stable optimized system (4_14), the finale MD geometry is similar; however, it forms more connections with the hematite surface.

4.4. Solvent Effect

It is intuitive that the investigated TiO2 clusters would exhibit distinct behavior depending on whether the interface is with a vacuum or with water. The hydroxylation/protonation of the pure hematite surface has been described in the literature previously [42,43]. Our research focuses on the Fe−O−Ti bridges, which connect the Fe3+ and Ti4+ species. This effect—bridging species with different oxidation states—is analogous to the mechanism responsible for the formation of Brønsted Acid Sites (BAS) in zeolites. It has been reported to accelerate water deprotonation in Ru-W binary oxide [44].
For the explicit solvent analysis, we chose the 3_16 system, which emerged as the most stable from the (TiO2)3 set. It showcases both types of internal connections, those with and without cleaved Ti−O−Ti bridges. We added 220 water molecules to the system, approximating a solvent density of 1.0 g/mL. In total, the system comprises 1029 atoms, with the bottom two layers of the hematite fixed to simulate the bulk.
Figure 9 depicts the system’s final geometry post the MD simulation. Several water molecules are observed to have dissociated their protons, forming hydroxyl groups atop the hematite surface. These hydroxyls are attached to the most exposed Fe atoms. Conversely, the H+ ions are bound to the surface’s exposed oxygen atoms.
Interestingly, none of the Ti−O−Fe bridges were protonated during the MD run. This indicates that the charge imbalance of the Ti−O−Fe bridges differs from that observed in zeolites. This discrepancy can be attributed to the different connection types. In zeolites, silicon oxide is the primary component, with Si holding a formal 4+ charge. Substitutions of Si → Al introduce an imbalance because of the smaller formal charge (3+) and the consistent type of connection within the zeolite framework. In our study, the Ti atom, with its 4+ formal charge, forms four oxygen bridges, suggesting that the extra charge is counterbalanced by the oxygen atoms.

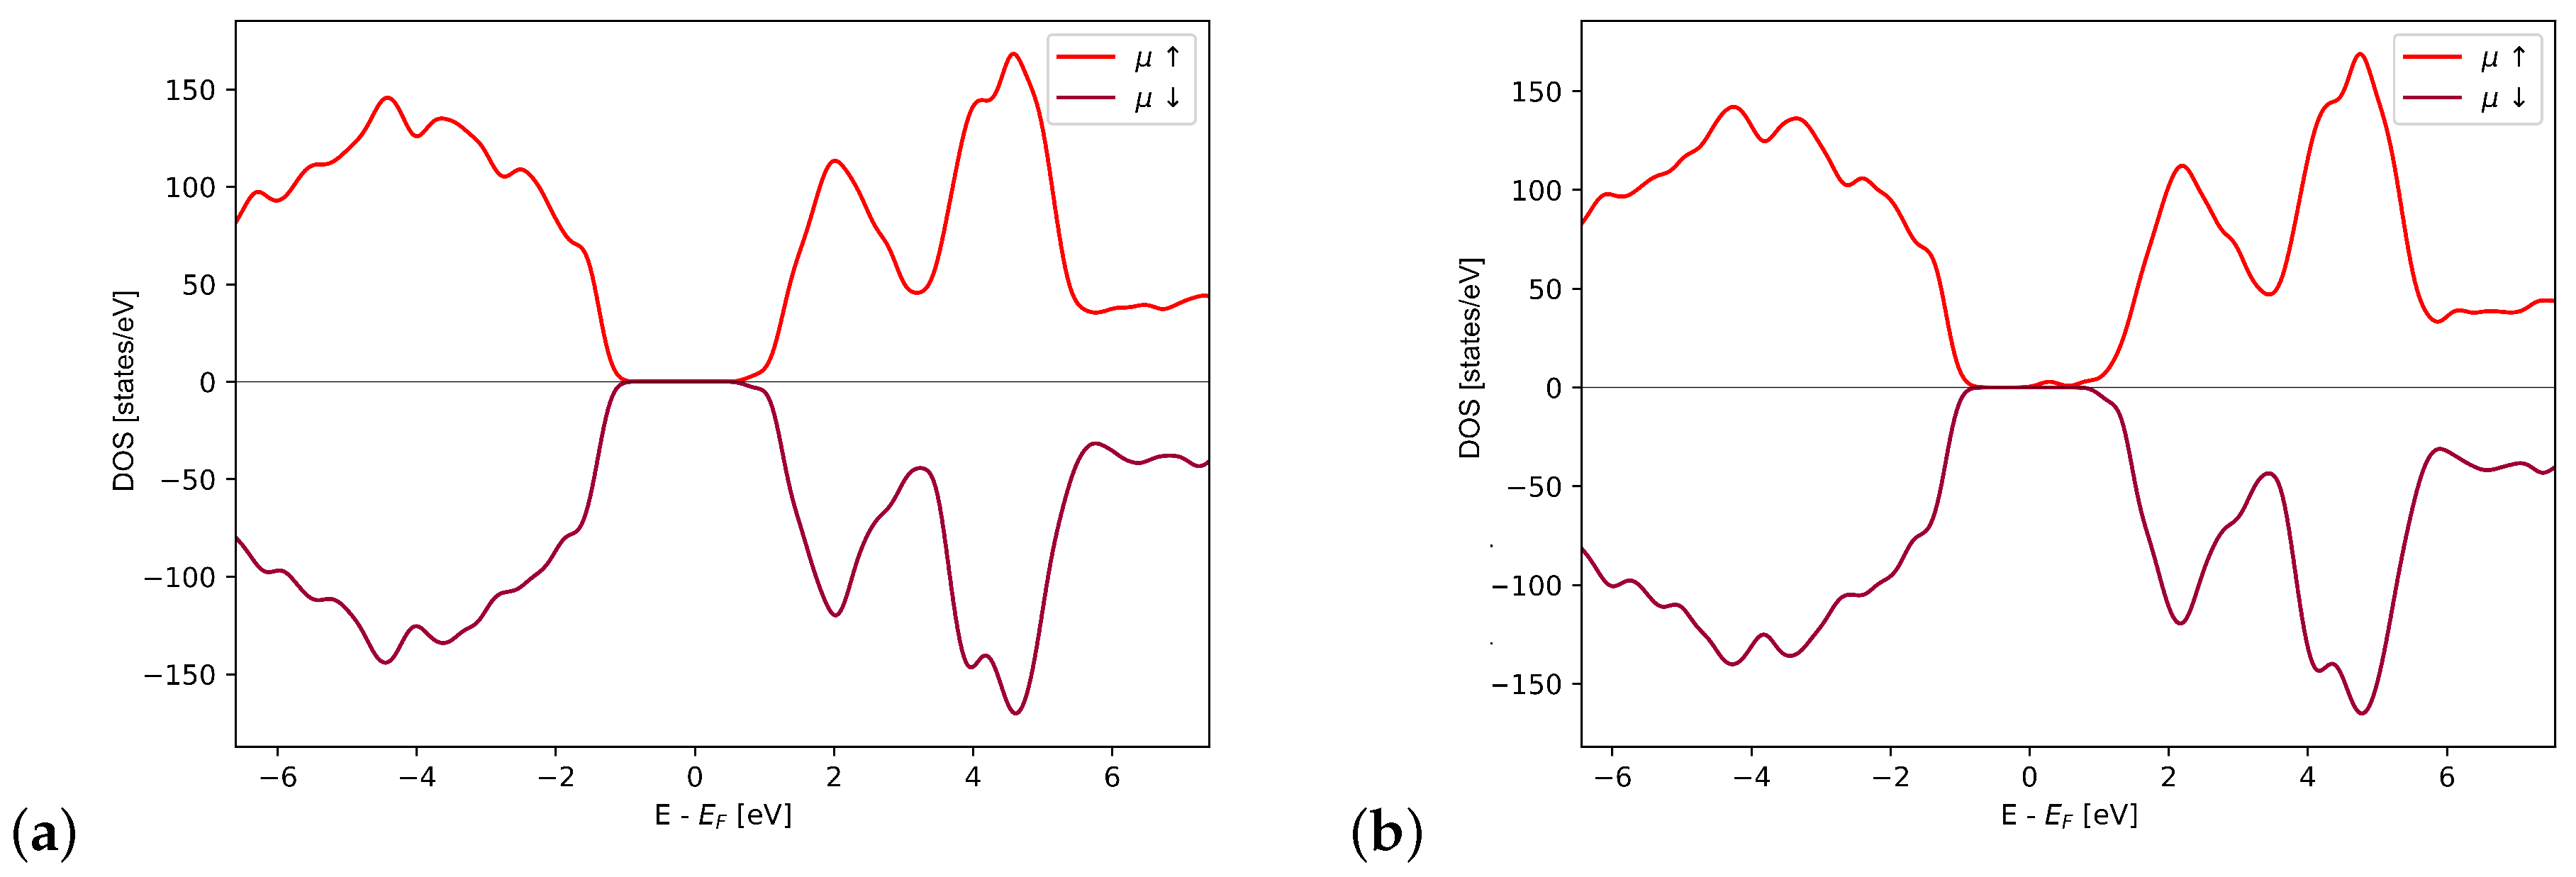
4.5. Density of States

The presence of the nanocluster supported on the hematite surface can be beneficial in one of two ways. The first option is the one in which doping states act as the electron/hole traps, which extends the lifetime of the excitons formed upon irradiation. In order to investigate this effect, we have carried out the Density of States (DOS) analysis. The results are shown in Figure 10.
The DOS plot for the pure hematite surface shows the gap between the valence and conduction bands of approximately 2 eV, consistently with experimental value of 2.1 eV [19,20]. In Figure 10b, the DOS of the hematite supported (TiO2)2 with the optimized 2_08 geometry is shown. It can be noted that the states of both systems show very similar characteristics, as most of them belong to the Fe and O atoms in the hematite surface. The presence of the doping Ti states can be seen as the small bulge in the gap. The number of these states is small, as there are only two Ti atoms present in this system, compared to 144 Fe atoms. This is in line with the previous findings from our group [34] and implies that the role of the doping states in altering the photoactivity of the investigated system is negligible.
Thus, the role of the nanoclusters can only influence the formation of the new Fe−O−Ti bridges, which can act as new catalytic sites. This observation coincides with the results described in the Section 4.4, where the dissociation of the protons and formation of the hydroxyls has been observed on the hematite surface. That leaves the newly formed Fe−O−Ti bridges available for other water molecules to undergo oxidation, but falls beyond the scope of this study.

5. Conclusions

We presented the analysis of the stability of the small (TiO2)n, where n = 2 to 4 clusters supported by the hematite (110) surface. The analysis is based on the in-house developed algorithm, which is a modification of the solids docking algorithm. By combining the solids docking method with molecular dynamics simulations, we identified three different binding modes of the (TiO2)2 clusters to the surface. All these modes are characterized by the parallel orientation of the cluster concerning the surface. This implies a strong binding between Ti and Fe through the oxygen bridges. For the (TiO2)3 systems, we could not pinpoint specific binding modes. Furthermore, we observed partial dissociation of the cluster. After geometry optimization, all (TiO2)3 system geometries exhibited at least one cleaved Ti−O−Ti bond. This observation is in line with the strong binding seen in the (TiO2)2 systems. The (TiO2)4 systems behaved similarly to the (TiO2)3 systems: there was no discernible preferred binding mode, and every cluster had at least one Ti−O−Ti bond cleaved. Lastly, when simulating one of the investigated systems in explicit solvent conditions, we noted acid-base dissociation of water molecules near the hematite surface into OH and H+. These ions bound to the surface Fe atoms and O bridges, respectively. Interestingly, the charge imbalance in the Ti−O−Fe did not show a preference for binding to the dissociated protons.

Author Contributions

Conceptualization, B.M.S.; methodology, B.M.S. and W.K.; software, B.M.S. and W.K.; validation, T.D. and W.Ż.; formal analysis, T.D., W.Ż., W.K. and B.M.S.; investigation, T.D., W.Ż., W.K. and B.M.S.; resources, W.K. and B.M.S.; data curation, B.M.S.; writing—original draft preparation, W.K. and B.M.S.; writing—review and editing, W.K., B.M.S. and G.H.; visualization, T.D. and W.Ż.; supervision, B.M.S.; project administration, B.M.S.; funding acquisition, B.M.S. and G.H. All authors have read and agreed to the published version of the manuscript.

Funding

This work has been carried out within the M.ERANET-2 project “Multiscale Modeling and Design of Photo-Electrochemical interfaces” Grant No. 4089, for which authors gratefully acknowledge the financial support from National Centre of Science Grant nr. 2016/23/Z/ST4/04376. This article is based upon work from COST Action 18234, supported by COST (European Cooperation in Science and Technology).

Data Availability Statement

Due to the volume of the files, the data will be made available upon request.

Acknowledgments

The simulations have been performed at Academic Computer Centre Cyfronet in Kraków, Tri-City Academic Computer Network in Gdańsk and Interdisciplinary Centre for Mathematical and Computational Modeling in Warsaw, and have been made possible by PL-Grid Infrastructure.

Conflicts of Interest

The authors declare no conflict of interest.

References

  1. Rosa, L.P.; Ribeiro, S.K. The present, past, and future contributions to global warming of CO2 emissions from fuels a key for negotiation in the climate convention. Clim. Chang. 2001, 48, 289–307. [Google Scholar] [CrossRef]
  2. Hansen, J.; Sato, M.; Ruedy, R.; Lacis, A.; Oinas, V. Global warming in the twenty-first century: An alternative scenario. Proc. Natl. Acad. Sci. USA 2000, 97, 9875–9880. [Google Scholar] [CrossRef]
  3. Crabtree, G.W.; Dresselhaus, M.S.; Buchanan, M.V. The hydrogen economy. Phys. Today 2004, 57, 39–44. [Google Scholar] [CrossRef]
  4. Shiva Kumar, S.; Himabindu, V. Hydrogen production by PEM water electrolysis—A review. Mater. Sci. Energy Technol. 2019, 2, 442–454. [Google Scholar] [CrossRef]
  5. Ajanovic, A.; Sayer, M.; Haas, R. The economics and the environmental benignity of different colors of hydrogen. Int. J. Hydrogen Energy 2022, 47, 24136–24154. [Google Scholar] [CrossRef]
  6. Arcos, J.M.M.; Santos, D.M.F. The Hydrogen Color Spectrum: Techno-Economic Analysis of the Available Technologies for Hydrogen Production. Gases 2023, 3, 25–46. [Google Scholar] [CrossRef]
  7. Ali, D.M.; Salman, S.K. A comprehensive review of the fuel cells technology and hydrogen economy. In Proceedings of the 41st International Universities Power Engineering Conference, UPEC 2006, Newcastle upon Tyne, UK, 6–8 September 2006; Volume 1, pp. 98–102. [Google Scholar] [CrossRef]
  8. Zegers, P. Fuel cell commercialization: The key to a hydrogen economy. J. Power Sources 2006, 154, 497–502. [Google Scholar] [CrossRef]
  9. McGlashan, N.R. The thermodynamics of chemical looping combustion applied to the hydrogen economy. Int. J. Hydrogen Energy 2010, 35, 6465–6474. [Google Scholar] [CrossRef]
  10. Christensen, C.H.; Johannessen, T.; Sørensen, R.Z.; Nørskov, J.K. Towards an ammonia-mediated hydrogen economy? Catal. Today 2006, 111, 140–144. [Google Scholar] [CrossRef]
  11. Zhao, C.; Kou, Y.; Lemonidou, A.; Li, X.; Lercher, J. Highly Selective Catalytic Conversion of Phenolic Bio-Oil to Alkanes. Angew. Chem. 2009, 121, 4047–4050. [Google Scholar] [CrossRef]
  12. Hellinger, M.; Baier, S.; Mortensen, P.M.; Kleist, W.; Jensen, A.D.; Grunwaldt, J.D. Continuous Catalytic Hydrodeoxygenation of Guaiacol over Pt/SiO2 and Pt/H-MFI-90. Catalysts 2015, 5, 1152–1166. [Google Scholar] [CrossRef]
  13. Cui, K.; Yang, L.; Ma, Z.; Yan, F.; Wu, K.; Sang, Y.; Chen, H.; Li, Y. Selective conversion of guaiacol to substituted alkylphenols in supercritical ethanol over MoO3. Appl. Catal. B Environ. 2017, 219, 592–602. [Google Scholar] [CrossRef]
  14. Zhang, S.; Fan, Q.; Xia, R.; Meyer, T.J. CO2 Reduction: From Homogeneous to Heterogeneous Electrocatalysis. Accounts Chem. Res. 2020, 53, 255–264. [Google Scholar] [CrossRef]
  15. Nabgan, W.; Nabgan, B.; Jalil, A.A.; Ikram, M.; Hussain, I.; Bahari, M.B.; Tran, T.V.; Alhassan, M.; Owgi, A.H.; Parashuram, L.; et al. A bibliometric examination and state-of-the-art overview of hydrogen generation from photoelectrochemical water splitting. Int. J. Hydrogen Energy, 2023; in press. [Google Scholar] [CrossRef]
  16. Fujishima, A.; Honda, K. Electrochemical photolysis of water at a semiconductor electrode. Nature 1972, 238, 37–38. [Google Scholar] [CrossRef]
  17. Rossmeisl, J.; Qu, Z.W.; Zhu, H.; Kroes, G.J.; Nørskov, J.K. Electrolysis of water on oxide surfaces. J. Electroanal. Chem. 2007, 607, 83–89. [Google Scholar] [CrossRef]
  18. Kudo, A.; Miseki, Y. Heterogeneous photocatalyst materials for water splitting. Chem. Soc. Rev. 2009, 38, 253–278. [Google Scholar] [CrossRef] [PubMed]
  19. Zhang, H.; Liu, J.; Xu, T.; Ji, W.; Zong, X. Recent Advances on Small Band Gap Semiconductor Materials (≤2.1 eV) for Solar Water Splitting. Catalysts 2023, 13, 728. [Google Scholar] [CrossRef]
  20. Tamirat, A.G.; Rick, J.; Dubale, A.A.; Su, W.N.; Hwang, B.J. Using hematite for photoelectrochemical water splitting: A review of current progress and challenges. Nanoscale Horizons 2016, 1, 243–267. [Google Scholar] [CrossRef] [PubMed]
  21. Kim, B.R.; Oh, H.J.; Yun, K.S.; Jung, S.C.; Kang, W.; Kim, S.J. Effect of TiO2 supporting layer on Fe2O3 photoanode for efficient water splitting. Prog. Org. Coatings 2013, 76, 1869–1873. [Google Scholar] [CrossRef]
  22. Satti, U.Q.; Zaidi, S.J.A.; Riaz, A.; ur Rehman, M.A.; Li, C.X.; Basit, M.A. Simple two-step development of TiO2/Fe2O3 nanocomposite for oxygen evolution reaction (OER) and photo-bio active applications. Colloids Surfaces A Physicochem. Eng. Asp. 2023, 671, 131662. [Google Scholar] [CrossRef]
  23. Niu, Y.; Li, M.; Jia, X.; Shi, Z.; Liu, H.; Zhang, X. Structures and photocatalytic activity of α-Fe2O3@TiO2 core-shell nanoparticles. Solid State Commun. 2022, 345, 114683. [Google Scholar] [CrossRef]
  24. Sharma, V.; Dixit, M.; Satsangi, V.R.; Dass, S.; Pal, S.; Shrivastav, R. Photoelectrochemical splitting of water with nanocrystalline Zn1-xMnxO thin films: First-principle DFT computations supporting the systematic experimental endeavor. Int. J. Hydrogen Energy 2014, 39, 3637–3648. [Google Scholar] [CrossRef]
  25. Mavros, M.G.; Tsuchimochi, T.; Kowalczyk, T.; McIsaac, A.; Wang, L.P.; Voorhis, T.V. What can density functional theory tell us about artificial catalytic water splitting? Inorg. Chem. 2014, 53, 6386–6397. [Google Scholar] [CrossRef]
  26. Yatom, N.; Neufeld, O.; Caspary Toroker, M. Toward Settling the Debate on the Role of Fe2O3 Surface States for Water Splitting. J. Phys. Chem. C 2015, 119, 24789–24795. [Google Scholar] [CrossRef]
  27. Ahn, H.J.; Kment, S.; Naldoni, A.; Zbořil, R.; Schmuki, P. Band gap and Morphology Engineering of Hematite Nanoflakes from an Ex Situ Sn Doping for Enhanced Photoelectrochemical Water Splitting. ACS Omega 2022, 7, 35109–35117. [Google Scholar] [CrossRef]
  28. Rodríguez-Hernández, F.; Tranca, D.C.; Szyja, B.M.; Van Santen, R.A.; Martínez-Mesa, A.; Uranga-Piña, L.; Seifert, G. Water Splitting on TiO2-Based Electrochemical Cells: A Small Cluster Study. J. Phys. Chem. C 2016, 120, 437–449. [Google Scholar] [CrossRef]
  29. Kohn, W.; Sham, L.J. Self-consistent equations including exchange and correlation effects. Phys. Rev. 1965, 140. [Google Scholar] [CrossRef]
  30. Perdew, J.P.; Burke, K.; Ernzerhof, M. Generalized gradient approximation made simple. Phys. Rev. Lett. 1996, 77, 3865–3868. [Google Scholar] [CrossRef]
  31. Perdew, J.P.; Burke, K.; Ernzerhof, M. Erratum: Generalized gradient approximation made simple (Physical Review Letters (1996) 77 (3865)). Phys. Rev. Lett. 1997, 78, 1396. [Google Scholar] [CrossRef]
  32. Soler, J.M.; Artacho, E.; Gale, J.D.; García, A.; Junquera, J.; Ordejón, P.; Sánchez-Portal, D. The SIESTA method for ab initio order-N materials simulation. J. Phys. Condens. Matter 2002, 14, 2745. [Google Scholar] [CrossRef]
  33. Dudarev, S.L.; Botton, G.A.; Savrasov, S.Y.; Humphreys, C.J.; Sutton, A.P. Electron-energy-loss spectra and the structural stability of nickel oxide: An LSDA+U study. Phys. Rev. B 1998, 57, 1505. [Google Scholar] [CrossRef]
  34. Podsiadły-Paszkowska, A.; Tranca, I.; Szyja, B.M. Tuning the Hematite (110) Surface Properties to Enhance Its Efficiency in Photoelectrochemistry. J. Phys. Chem. C 2019, 123, 5401–5410. [Google Scholar] [CrossRef]
  35. Szyja, B.M.; Podsiadły-Paszkowska, A. Helping Thy Neighbor: How Cobalt Doping Alters the Electrocatalytic Properties of Hematite. J. Phys. Chem. Lett. 2020, 11, 4402–4407. [Google Scholar] [CrossRef] [PubMed]
  36. Włodarczyk, A.; Uchroński, M.; Podsiadły-Paszkowska, A.; Irek, J.; Szyja, B.M. Mixing ReaxFF parameters for transition metal oxides using force-matching method. J. Mol. Model. 2022, 28. [Google Scholar] [CrossRef] [PubMed]
  37. Sandratskii, L.M.; Uhl, M.; Kübler, J. Band theory for electronic and magnetic properties of. J. Phys. Condens. Matter 1996, 8, 983. [Google Scholar] [CrossRef]
  38. Qu, Z.W.; Kroes, G.J. Theoretical study of the electronic structure and stability of titanium dioxide clusters (TiO2)n with n = 1–9. J. Phys. Chem. B 2006, 110, 8998–9007. [Google Scholar] [CrossRef]
  39. Hjorth Larsen, A.; Jørgen Mortensen, J.; Blomqvist, J.; Castelli, I.E.; Christensen, R.; Dułak, M.; Friis, J.; Groves, M.N.; Hammer, B.; Hargus, C.; et al. The atomic simulation environment—A Python library for working with atoms. J. Phys. Condens. Matter 2017, 29, 27. [Google Scholar] [CrossRef]
  40. Nosé, S. A unified formulation of the constant temperature molecular dynamics methods. J. Chem. Phys. 1984, 81, 511–519. [Google Scholar] [CrossRef]
  41. Hoover, W.G.; Holian, B.L. Kinetic moments method for the canonical ensemble distribution. Phys. Lett. A 1996, 211, 253–257. [Google Scholar] [CrossRef]
  42. Lo, C.S.; Tanwar, K.S.; Chaka, A.M.; Trainor, T.P. Density functional theory study of the clean and hydrated hematite (1102) surfaces. Phys. Rev. B Condens. Matter Mater. Phys. 2007, 75, 075425. [Google Scholar] [CrossRef]
  43. Schienbein, P.; Blumberger, J. Nanosecond solvation dynamics of the hematite/liquid water interface at hybrid DFT accuracy using committee neural network potentials. Phys. Chem. Chem. Phys. 2022, 24, 15365–15375. [Google Scholar] [CrossRef] [PubMed]
  44. Wen, Y.; Liu, C.; Huang, R.; Zhang, H.; Li, X.; García de Arquer, F.P.; Liu, Z.; Li, Y.; Zhang, B. Introducing Brønsted acid sites to accelerate the bridging-oxygen-assisted deprotonation in acidic water oxidation. Nat. Commun. 2022, 13, 4871. [Google Scholar] [CrossRef] [PubMed]
Figure 1. The structures of the (TiO2)n clusters used in the present work. (a) n = 2, (b) n = 3 and (c) n = 4.
Hydrogen 04 00037 g001
Figure 2. The algorithm used for generating initial geometries for the analysis.
Hydrogen 04 00037 g002
Figure 3. Two potential orientations of the (TiO2)2 nanocluster relative to the hematite surface. Light blue, pink, and red colors represent Ti, Fe, and O atoms, respectively.
Hydrogen 04 00037 g003
Figure 4. Three distinct binding modes of (TiO2)2. Light blue, pink, and red colors correspond to Ti, Fe, and O atoms, respectively.
Hydrogen 04 00037 g004
Figure 5. The dissociated (a) vs. intact (b) systems geometries observed upon the optimization of 3_12 and 3_16 systems, respectively. Light blue, pink and red colors denote Ti, Fe and O atoms, respectively.
Hydrogen 04 00037 g005
Figure 6. The initial (a) and final (b) geometries of the 3_16 system showing the cleavage of the Ti−O−Ti bridge observed during the MD simulation. Light blue, pink and red colors denote Ti, Fe and O atoms, respectively.
Hydrogen 04 00037 g006
Figure 7. The most stable geometry of a (TiO2)4 cluster. Light blue, pink and red colors denote Ti, Fe and O atoms, respectively.
Hydrogen 04 00037 g007
Figure 8. Changes of the geometry of the 4_09 system during the MD simulation. (a) 1 fs, (b) 500 fs, (c) 1000 fs and (d) 10,000 fs. Light blue, pink and red colors denote Ti, Fe and O atoms, respectively.
Hydrogen 04 00037 g008
Figure 9. The top (a) and side (b) view of the 3_16 system with explicit solvent molecules. Light blue, pink and red colors denote Ti, Fe and O atoms, respectively. The orange spheres denote dissociated water molecules.
Hydrogen 04 00037 g009
Figure 10. Density of States plots for the pure hematite surface (a) and 2_08 system (b). The negative values signify the states, in which the magnetic moment is pointing down.
Hydrogen 04 00037 g010
Table 1. Relative energies of the optimized (TiO2)2 systems in comparison to the most stable configurations 2_08 and 2_12. Systems with stability less than 1.0 eV are highlighted in red, while the most stable configurations are highlighted in blue.
System ID Δ E (opt) Δ E (MD)System ID Δ E (opt) Δ E (MD)
2_005.030.072_100.890.40
2_010.000.152_110.570.72
2_026.100.412_120.000.00
2_036.100.062_135.230.59
2_040.320.492_145.240.62
2_056.671.582_155.070.13
2_060.460.602_161.201.37
2_070.330.502_176.881.79
2_080.000.142_181.261.44
2_090.840.592_196.591.93
Table 2. The relative energies of the optimized (TiO2)3 systems with respect to the most stable configuration—3_12, which is marked in blue. Red color signifies the configurations with the stability lesser than 1.0 eV.
System ID Δ E (opt) Δ E (MD)System ID Δ E (opt) Δ E (MD)
3_003.223.753_102.071.77
3_011.531.133_113.644.01
3_024.441.143_120.000.58
3_033.593.753_133.813.07
3_041.001.463_143.594.14
3_050.741.203_155.572.72
3_064.233_162.460.00
3_071.320.073_173.961.08
3_080.613.753_182.222.72
3_094.014.363_192.941.40
Table 3. The relative energies of the optimized (TiO2)4 systems with respect to the most stable configuration—3_12. Red color signifies the less stable configurations, blue – the most stable ones.
System ID Δ E (opt) Δ E (MD)System ID Δ E (opt) Δ E (MD)
4_000.292.324_100.732.71
4_010.692.694_110.500.90
4_023.095.104_123.712.56
4_034.214.064_132.850.32
4_042.854.054_140.002.00
4_053.803.484_154.462.51
4_061.163.104_163.582.70
4_071.121.684_173.480.86
4_082.490.914_180.462.49
4_095.620.004_193.862.98
Disclaimer/Publisher’s Note: The statements, opinions and data contained in all publications are solely those of the individual author(s) and contributor(s) and not of MDPI and/or the editor(s). MDPI and/or the editor(s) disclaim responsibility for any injury to people or property resulting from any ideas, methods, instructions or products referred to in the content.

