2. Grey Hydrogen, Blue Hydrogen and Green Hydrogen
Hydrogen is already in use in a multitude of functions globally. In 2020 some 90 million tons (~1 billion cubic meters) were essentially employed in oil refining (45%) and industrial uses comprised of ammonia production as a fertilizer (33%), methanol production as a feedstock for chemicals (11%) and in iron and steel manufacturing (11%) [
3]. A very small amount of hydrogen (less than 0.001%) was used as a transportation fuel in conjunction with fuel cells. The current global demand for hydrogen is met from fossil fuels, primarily (80%) the steam reforming of fossil natural gas and secondarily the gasification of coal and heavy oil, with less than 0.01% coming from renewable resources such as solar and wind power via electrolysis of water as well as biomethane via reformation. The resulting CO
2 emissions from the current use of hydrogen are estimated to be about 900 million tons per year [
3].
Conventional hydrogen produced from natural gas is classified as “grey” hydrogen to differentiate it from “brown” hydrogen produced from the gasification of coal. As indicated above, the production of one ton of hydrogen generates about 10 tons of carbon dioxide. However, detailed calculation of the carbon dioxide emission in the production of grey hydrogen indicates a value of 77 g CO
2/MJ of H
2 or 11 tons of carbon dioxide per ton of hydrogen [
4]. Thus, conventional hydrogen produced from fossil fuels is obviously not sustainable.
Consequently, the production of hydrogen from steam reforming of natural gas along with the simultaneous carbon capture and either use (CCU), storage (CCS) or both (CCUS) is advocated in Europe and the US as representing a sustainable process and resulting in a sustainable fuel [
3,
5]. Incidentally, hydrogen produced from natural gas with carbon capture is designated as “blue” hydrogen. The steam reforming of natural gas, i.e., essentially methane, is an endothermic reaction requiring the burning of natural gas (methane) to supply necessary energy (heat and pressure) for the reforming process. The required amount of additional methane to supply the reforming energy ranges from 2.0 to 2.5 kWh/m
3 of hydrogen [
6]. The overall process of steam methane reforming or SMR is given by Equation (1):
where we have used the average of the range for the energy use in the process. The gross calorific values of methane and hydrogen are 0.772 MJ/mol and 0.286 MJ/mol, respectively. Based on Equation (1), it is straightforward to calculate the amount of methane used for the production of hydrogen as follows:
Stochiometric conversion of CH
4 to H
2:
with 2.25 kWh CH
4 input as process energy:
Thus, the production of hydrogen via steam reforming requires 0.403 MJ of methane to produce one mole of hydrogen. The conversion efficiency of the SME process is: 0.286 MJ H
2/0.403 MJ CH
4 = 0.709 or almost 71%. Moreover, the split of energy use per Equations (2) and (3) of 55% and 45%, respectively, suggests that the carbon dioxide is also emitted in a similar ratio. As of 2021, there are two large commercial facilities producing “blue” hydrogen from natural gas: one operated by Shell in Edmonton, Canada; and the other operated by Air Products in Port Arthur, Texas, TX, USA [
7]. The limited available data regarding the percentage of carbon dioxide capture indicate a CCS rate ranging from a low of 53% to a high of 90% [
8]. The Shell plant in Alberta exhibits a similar CCS range with a mean capture efficiency of 78.8% [
9]. These efficiencies apply to the SMR proper per Equation (2). Apparently, no carbon dioxide is captured from the process energy used to drive the conversion. Hopefully, in the future, there could be a significant capture of that carbon dioxide as well, perhaps as much two-thirds of it [
10]. Lastly, the CCS process requires additional energy in order to be carried out. This energy is also obtained via the combustion of natural gas. While hard data for the required energy and associated carbon dioxide emissions of the CCS are not readily available, a figure of 25% of the total energy and consequently of the total carbon dioxide emitted in the steam reforming of methane is proposed as being applicable [
10,
11,
12,
13]. Thus, the energy required for the CCS and the resulting carbon dioxide emissions will be as follows:
We summarize the calculated emissions of carbon dioxide for various scenarios of capture rates in
Table 1. Regarding the carbon dioxide capture, we have assumed an 85% rate for the SMR process per Equation (2), a 65% rate for the process energy used per Equation (4) and no capture for the energy used for the CCS. These capture rate figures are quite optimistic and the decreasing rate is due to the lower concentration of carbon dioxide of the subprocesses described by Equations (2) to (4) [
14]. We also note that the conversion efficiency of methane into blue hydrogen via SMR with CCS is equal to 0.286 MJ H
2/0.504 MJ CH
4 = 0.567. This result suggests that more than 40% of the energy in the converted methane is lost during the process of obtaining blue hydrogen with CSS. Moreover, the emissions of carbon dioxide for blue hydrogen are reduced by 51% from those of grey hydrogen, i.e., better than a factor of two.
Blue hydrogen shows a significant environmental improvement with respect to grey hydrogen under admittedly quite optimistic assumptions for CCS, but it is still resulting in an emission of about 5 million tons of carbon dioxide per 1 million tons of hydrogen produced. Thus, there will be a need for “green” hydrogen ultimately, which is produced from renewable energy exclusively, with essentially minimal carbon dioxide emissions. Green hydrogen would be the one that is envisioned to be an energy carrier in the global economy, if the concept of the hydrogen economy were to become a reality. While any renewable energy can be used for the production of hydrogen, intermittent sources such as wind, solar and hydropower can be used to that end, whereby hydrogen serves as a storage medium for these renewable resources. Historically, the need to store hydropower some one hundred years ago led to the commercialization of electrolysis for the production of hydrogen. However, the magnitude of the hydropower resource is not sufficient to act as the energy source for a universal hydrogen economy. Moreover, the use of biomethane produced via anaerobic digestion of organic wastes, energy crops and biomass in general to generate hydrogen via SMR is redundant and not necessary, given that biomethane is also an energy carrier in its own right as a fuel. Thus, solar and wind are the two natural renewable energy sources for the production of hydrogen. Both are abundant. However, based on the respective occurrence patterns of solar energy (horizontal capture) and of wind energy (vertical capture) on land and along coastal areas and the associated technologies for the generation of electricity, solar energy appears to be more suitable in general for powering buildings, particularly in urban areas, and for supplying power to utilities for the use of their customers. Wind, on the other hand, can serve as the main source of energy for the production of hydrogen in rural and relatively remote areas. Historically, wind has been associated with hydrogen at a large scale. In the 1930s, one of the pioneers of hydrogen as the fuel of the future, namely, Hermann Honnef in Germany, envisioned huge wind turbines 480 m in height with a 450 m rotor diameter and 100 MW of power as being the means of production of hydrogen via electrolysis [
1]. It would take at least 70 years before wind turbines in the megawatt size would become available. Moreover, while 100 MW wind turbines may never become practical, wind turbines at 15 MW are already being commercialized [
15,
16]. The water electrolysis technology has also advanced greatly in the past one hundred years [
17]. Although the standard potassium hydroxide (KOH) electrolysis remains the technology of choice in large hydrogen production applications, proton exchange membranes (PEM), phosphoric acid (H
3PO
4) and solid oxide (SO) electrolytes are also available in different stages of maturity and cost. Individual electrolysis units with a nominal capacity of 4000 Nm
3/h of hydrogen are commercially available and hydrogen plants exceeding 30,000 Nm
3/h output and 60 MW input are already in operation [
18]. Typical conversion efficiencies of alkaline electrolysis units range from 3.8 kWh/Nm
3 to 4.4 kWh/Nm
3 [
17,
18]. Taking as an average efficiency 4.1 kWh/Nm
3, the calculated wind energy required per megajoule of hydrogen would be:
Since one mole of hydrogen contains 0.286 MJ, the conversion efficiency, which is essentially the efficiency of the electrolysis unit, is 0.286 MJ H
2/0.330 MJ wind = 0.866. The carbon dioxide emissions from wind power have been calculated in several studies. While the actual generation of wind power does not emit any carbon dioxide, the manufacture and installation of wind turbines requires, among others, large quantities of steel, concrete and fiberglass. Because wind power carbon emissions are occurring upfront, i.e., before a turbine begins producing any power, these emissions are accounted for in the so-called life cycle analysis (LCA) and are calculated on a per generated kilowatt hour basis over the life of the turbine [
19]. Thus, the reported LCA carbon dioxide emissions figure is 11 g/kWh for the average fleet of wind turbines in operation. This figure is reduced to 6 g/kWh for the 15 MW wind turbines that are just starting to be commercialized. Incidentally, the same report indicates that solar photovoltaic power has a carbon dioxide emissions footprint four times as much at 44 g/kWh. Since 1 MJ of hydrogen requires 0.330 MJ wind/mol H
2 × 3.5 mol H
2/MJ H
2 = 1.155 MJ wind/MJ H
2, the carbon dioxide emissions of wind power per megajoule of hydrogen produced are thus calculated to be:
These results regarding green hydrogen are also shown in
Table 1. We note that the green hydrogen carbon dioxide emissions are 1/20 or 5% of those of grey hydrogen and 1/10 or 10% of those of blue hydrogen. We also note that, as the size of wind turbines increases in the tens of megawatts rated capacity, carbon dioxide emissions have the potential to decrease by as much as a factor of two compared to the numbers shown in
Table 1. Lastly, wind power employed for the production of green hydrogen represents a significantly better choice than solar photovoltaic energy in terms of life CO
2 emissions.
The preceded analysis clearly shows that green hydrogen is the only choice, if hydrogen is going to become a universal energy carrier at some point in the future. However, green hydrogen is quite expensive to produce compared to the current alternatives of oil and natural gas. The cost for the production of green hydrogen in Europe currently ranges between EUR 2.5 and EUR 5.5/kg [
20]. Taking the mean of this cost range, we calculate the cost of green hydrogen to be about USD 0.0336/MJ (the exchange rate of EUR 1 = USD 1.2 is used throughout). By comparison the city gate price of natural gas in the US averaged in 2020 about USD 3.2/GJ or USD 0.0032/MJ [
21]. Thus, green hydrogen is roughly a factor of ten more expensive than natural gas. The cost of green hydrogen is driven essentially by the cost of renewable electricity and the cost of the electrolysis units.
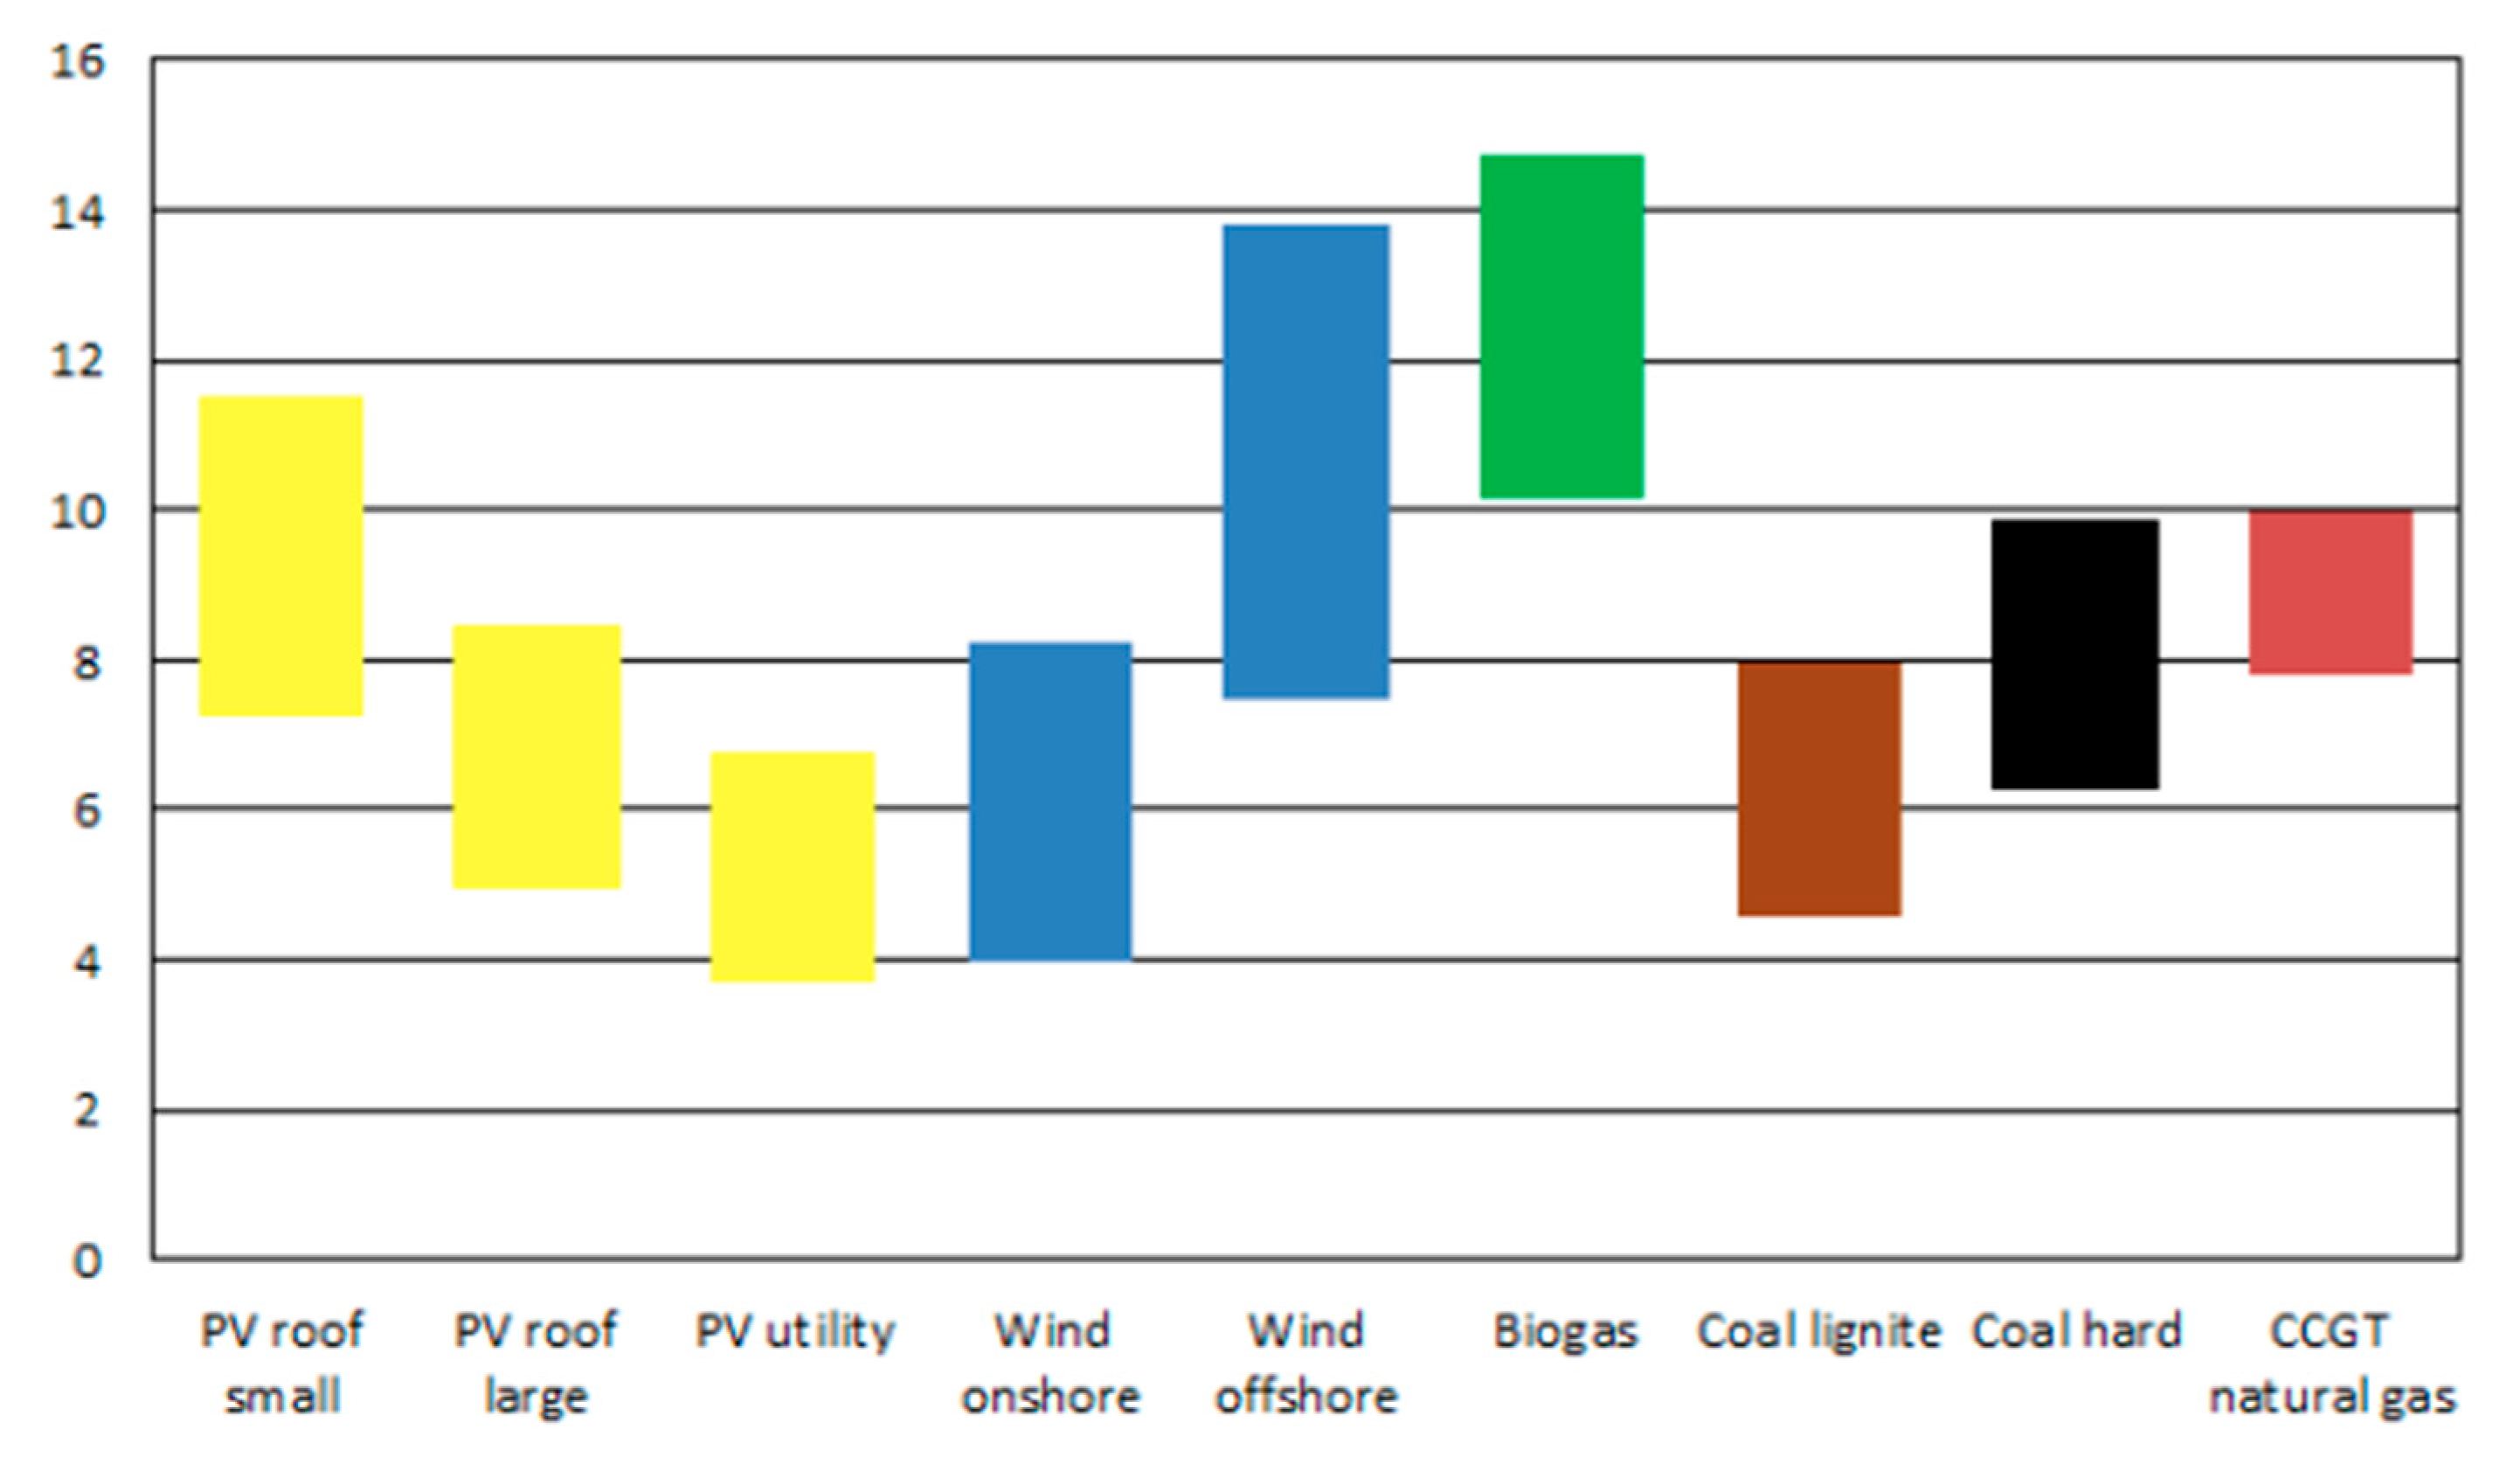
The cost of renewable electricity is well established by numerous studies. Thus, the levelized cost of renewable electricity in Germany from a variety of sources according to a study published in 2018 by the Fraunhofer Institute for Solar Energy Systems (
Fraunhofer-ISE) is reproduced in
Figure 1 [
22]. Wind power has a mean cost of about EUR 61/MWh for onshore generation and about EUR 106/MWh for offshore generation. An updated study for 2021 showed no change in the production cost of onshore wind but a reduction of the average cost of the offshore wind generation to about €97/MWh [
23]. The International Renewable Energy Agency (IRENA) reported in 2020 that the cost of wind electricity per megawatt hour stood at about USD 40 for onshore and about USD 80 for offshore generation [
24]. The U.S. Energy Information Administration projects that by 2026 onshore wind cost will be about USD 31/MWh and offshore wind cost will be USD 115/MWh (as of 2021 there were no offshore wind installations in the USA) [
25]. The trend in the cost of wind power shown in these studies suggest that by 2030, the cost of onshore wind power could be as low as one-half of what it is today.
The cost of water electrolysis units has also been falling fast at a rate of 20% per doubling capacity [
21]. At the moment, the 11 largest hydrogen production via electrolysis projects under construction and/or expansion range in capacity from 200 MW to 11 MW [
26]. These projects with a total capacity of 756 MW are expected to be completed by 2025. The largest of these projects with a capacity of 200 MW is located in the UAE. Three of these projects with a total capacity of 380 MW are located in Germany, while the EU accounts cumulatively for 480 MW. The EU hydrogen strategy is to reduce the current cost of electrolysis units from EUR900/kW to EUR 450/kW by 2030 [
20]. This will require increasing the 2020 capacity by almost a factor of ten in this decade. The current EU plans are to have 1.3 GW of electrolysis capacity associated with refineries and 0.7 GW of capacity associated with merchant use by 2025, and 40 GW of capacity of electrolysis plants by 2030 [
3,
20]. Incidentally, based on results reported by the industry, 1 MW of power generates 200 Nm
3/h and the annual operational capacity of the average current electrolysis plan is about 86% or 7500 h per year such that a 1 MW electrolysis unit will generate annually 1.5 million cubic meters or about 150 tons of hydrogen [
3,
18]. Thus, the replacement of just the current global consumption of grey and brown hydrogen with green hydrogen would require 600 GW of electrolysis units at a cost of USD 120 billion, considering an ultimate price of electrolysis units at USD 200/kW [
20]. The required wind power would be about 1800 GW with a cost of USD 2.7 trillion for onshore power priced at USD 1500/kW.
The preceding analysis suggests that the average cost of green hydrogen may be reduced by a factor of two by 2030 to USD 0.017/MJ. However, the required targets that must be met in terms of installed electrolysis units and associated wind along with even solar power are unlikely to be met with the current rate of development [
3,
20]. On the other hand, the cost of blue hydrogen is estimated to be EUR 2/kg or USD 0.017/MJ in Europe [
20]. It is likely that the cost of blue hydrogen in the USA is one half of the EU cost figure given that the price of natural gas in the USA is two to three times lower than that in Europe. Therefore, in the foreseeable future, i.e., at least in the next ten years and perhaps longer, green hydrogen cannot compete with blue hydrogen on economic terms.
3. Grey Methane, Blue Methane and Green Methane
Blue hydrogen, as we have already discussed, is not a sustainable fuel and consequently cannot become the energy carrier in a hydrogen economy. From a practical point of view, both in terms of emissions and cost, the direct use of methane or natural gas is a far better choice. In analogy to the hydrogen classification, we can distinguish grey methane, which is essentially fossil natural gas, blue methane, which is methane with some capture of carbon dioxide, and green methane, which is biomethane produced via the anaerobic digestion of organic wastes and energy crops. The carbon dioxide emissions of methane can be calculated from the combustion of one mole of methane generating one mole of carbon dioxide. Since one mole of methane contains 0.888 MJ of energy or 1.126 mol/MJ, we have:
Thus, the direct utilization of fossil or grey methane generates 1.31 times the carbon dioxide emissions of blue hydrogen, but only 0.643 times or 64.3% the carbon dioxide emissions of grey hydrogen. Applying a conservative and realistic 75% CCS for the blue methane and assuming as before that the energy use for the CCS is 25% of the grey methane energy used in the process, we have for the energy use and carbon dioxide emission of blue methane:
Green methane or biomethane is produced from organic wastes as well as energy crops via anaerobic digestion (AD) and is a well-established technology [
27]. The AD process generates biogas, which is typically a mixture of 60% methane and 40% carbon dioxide by volume. The biogas is then separated into its components via a number of commercially available technologies with a recovery rate of up to 99% for the methane [
28]. The carbon dioxide can be captured via liquefaction and be used as an industrial gas as green carbon dioxide in lieu of the current grey carbon dioxide derived from the combustion of natural gas [
29]. Moreover, the carbon dioxide rejected from the upgrading of the biogas to methane can be utilized in two additional ways, both of which recycle it into the global environmental system. The first way is designated as “Green Methane from Green Hydrogen” and entails the use of the separated carbon dioxide from the biogas to react it with green hydrogen via a biological methanation process to convert it to additional methane according to the reaction:
The green hydrogen and the carbon dioxide are introduced into an anaerobic trickle bed reactor operating at a thermophilic temperature of 55 °C. Hydrogenothrophic archaea predominated by
Methanothermobacter thermoautotrophicuc convert almost 99% of the carbon dioxide into higher than 98% methane gas output [
30,
31]. The biological conversion of the carbon dioxide with green hydrogen into green methane is offered commercially [
32]. One commercial facility is already in operation in Denmark and a proposal for its large-scale application in the USA has been made in conjunction with the conversion of waste wood into green methane [
33]. Based on Equation (11) one ton of carbon dioxide will require 182 kg of hydrogen to generate 363 kg of methane. The second way is designated as “Green Methane from Microalgae” and entails the use of the carbon dioxide to grow microalgae, which are in turn harvested and converted via AD to obtain biogas [
34]. The biogas is then separated into green methane and carbon dioxide which is recycled in the same fashion. The concept of growing algae has been around for some time, is quite efficient in capturing over 90% and potentially up to 99% of the carbon dioxide in open ponds, but it requires large surface areas in temperate climates and the generated biomass is very wet, i.e., less than 5% total solids. It is estimated that one ton of carbon dioxide can generate about 0.55 tons of dry biomass and would require a surface area of about 10 m
2 for cultivation.
Returning to the upgrading of biogas, a three-stage membrane separation of the methane in the biogas with the concurrent liquefaction of the carbon dioxide is already offered commercially [
35]. The carbon dioxide emissions of green or renewable methane can vary depending on the feedstock used in the process from −264 g CO
2/MJ CH
4 from livestock manure to a high of 19 g CO
2/MJ CH
4 from sewage sludge [
36,
37,
38]. We will use an average of −6 g CO
2/MJ of CH
4 from energy crops, which could become the norm after all organic wastes have been used up. The rate of capture and liquefaction of the CO
2 in the biogas could be as high as 98%, and the energy used for the liquefaction is conservatively 0.124 kWh/kg CO
2 or 0.446 MJ/kg [
28,
39]. We also note that biogas contains on average 40% carbon dioxide by volume. Thus, in every normal cubic meter of biogas there will 0.4302 kg (0.6 m
3 × 0.717 kg/m
3) of methane and 0.7908 kg (0.4 m
3 × 1.997 kg/m
3) of carbon dioxide. This ratio indicates that for every mole of methane produced there will be 16 g × (0.7908/0.4302) = 29.411 g of carbon dioxide generated. The CO
2 capture and liquefaction removes 29.411 × 0.98 g = 28.82 g CO
2/mol CH
4. The CO
2 captured and the wind energy for CO
2 liquefaction per MJ of CH
4 produced are:
The liquefaction of carbon dioxide uses about 1.5% of the energy in the produced methane. The CO
2 emissions from grey methane, blue methane and green methane, without and with the capture of the carbon dioxide in the biogas, are summarized in
Table 2. We may also note that if the CO
2 in the biogas is reacted with hydrogen to produce more methane, we will have the following results per original megajoule of CH
4 produced:
The results for the production of additional methane from the carbon dioxide in the initial biogas are also summarized in
Table 2. We note that the energy efficiency of the entire process is higher than 100% due to the use of wind power to create more methane. Moreover, the total carbon dioxide emissions for the production of 1.655 MJ of green methane stand at −35.47 g. This translates to −35.46/1.655 g = −21.43 g of CO
2 per megajoule of methane.
The difference in the results in
Table 2 compared to those in
Table 1 can be explained on the basis of the following facts. First, hydrogen is not a primary energy source, is derived from other primary sources such as methane and wind power and serves as an energy carrier, although there is some evidence of seepage of “natural” hydrogen from rock formations [
40]. Second, biomethane depending on the feedstock materials from which it is derived can have negative carbon dioxide emissions, because the feedstock materials such as biomass contain carbon captured during photosynthesis that is then converted in part to methane and in part to carbon dioxide via anaerobic digestion. Third, the low energy use for the capture via liquefaction of the carbon dioxide in the biogas is due to the fact that the biogas upgrading process rejects essentially pure carbon dioxide. Fourth, the utilization of the carbon dioxide in the biogas with green hydrogen to produce more green methane results in an overall conversion efficiency over 100% because of wind power use and in even more negative carbon dioxide emissions.
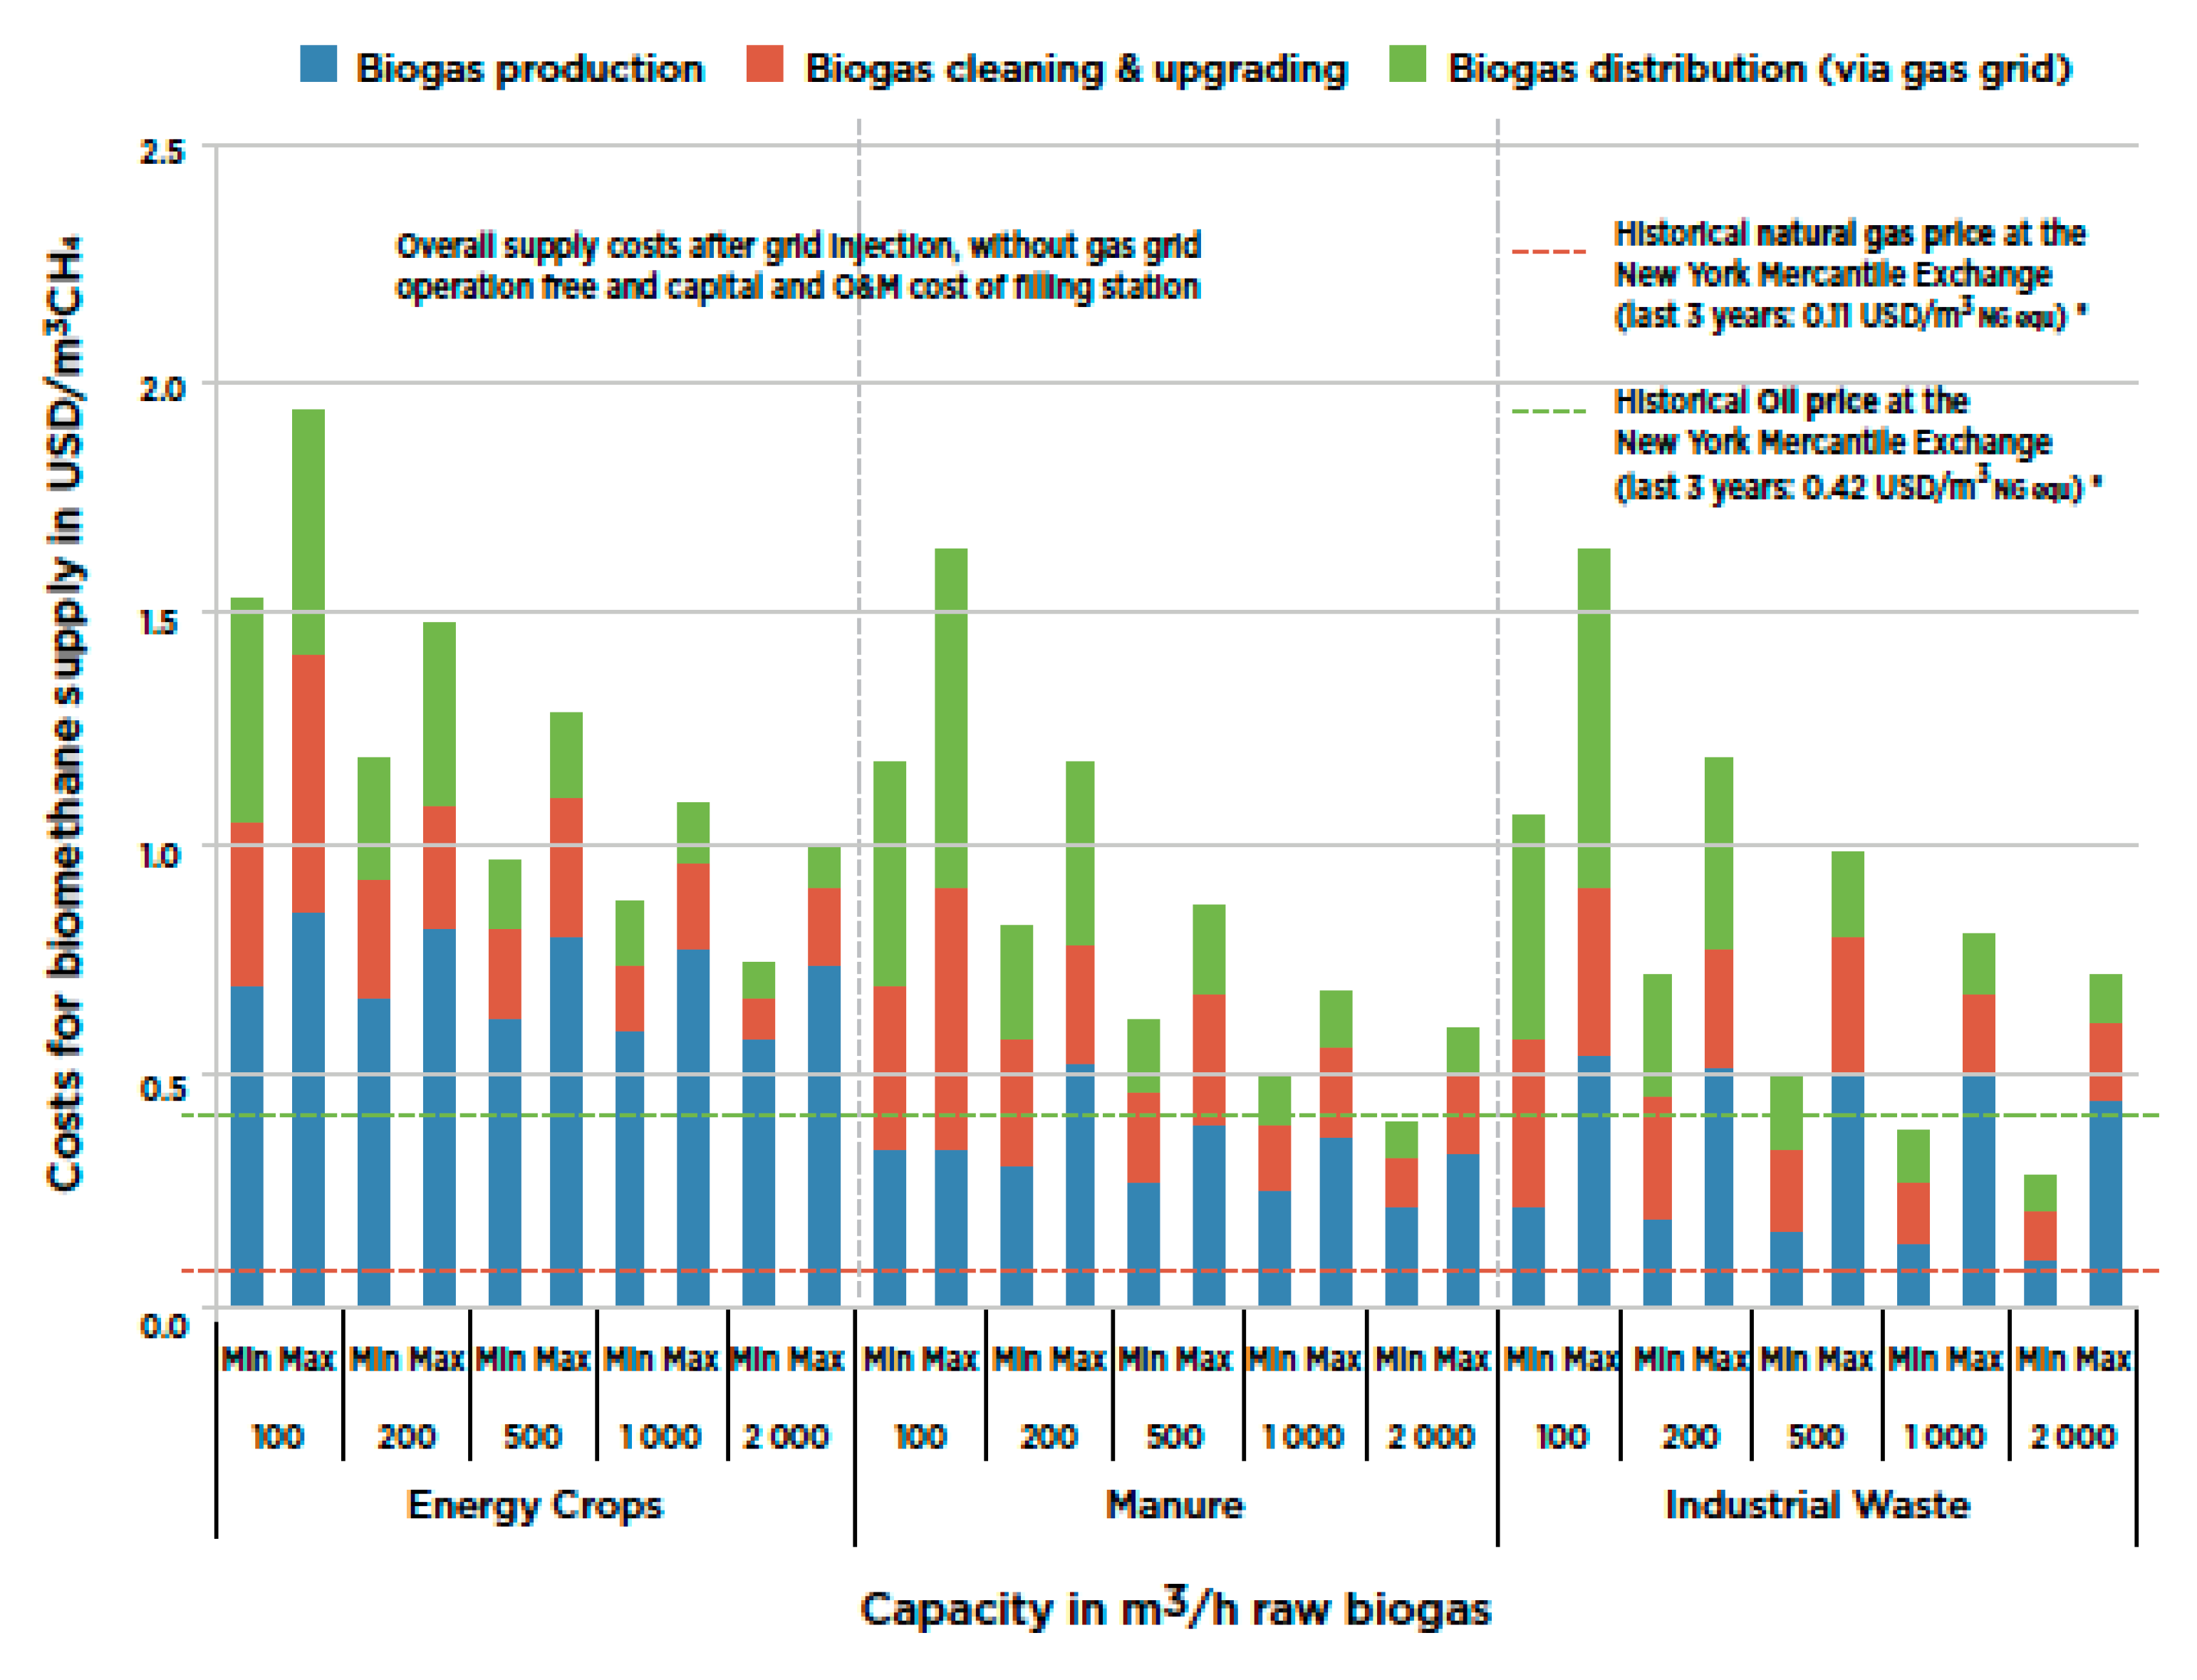
The cost of the production of biomethane varies with the feedstock materials as well as the magnitude of production [
28]. Assuming large installations with a production of biogas of 2000 Nm
3/h, we have the following average cost values for biomethane: production of biomethane at USD 0.305/Nm
3 from animal manures and industrial wastes and twice as much from animal crops; upgrading at USD 0.125/m
3; transmission via pipeline, including the interconnection cost at USD 0.1/m
3. Thus, the average price of biomethane supplied to the market is on the order of USD 0.530/m
3 for organic wastes to USD 0.835/m
3 for energy crops.
Figure 2 shows a detailed set of costs associated with biomethane production, upgrading and transmission [
28]. We may also note that the cost of the carbon dioxide liquefaction employing wind power averages about EUR 6.7/ton for large facilities [
39].
A comparison of the costs of green hydrogen (GM), green methane or biomethane without (GM) and with capture of CO
2 in the biogas (GM+), and of green methane with the utilization of the carbon dioxide in the biogas along with green hydrogen to produce more green methane (GM + H) is given in
Table 3. The cost of production of green methane augmented with carbon dioxide and hydrogen has been calculated by (a) calculating the cost of hydrogen used (5.90 g) at a price of USD 0.0336/MJ of hydrogen (5.90 g × 0.143 MJ/g × USD 0.0336/MJ), (b) dividing that figure by 1.655, because 1.655 MJ are ultimately produced, and (c) adding it to the cost figure of straight green methane. The distribution cost of hydrogen via pipeline is estimated to be three times that of bio-methane due the higher pressure required to deliver it because of its lower density compared to methane [
41]. The city gate price of grey methane (natural gas), which includes production, upgrading and transmission, is also given as the baseline fuel. Obviously, there is no difference in the cost of the production of green methane whether there is capture of the carbon dioxide in the biogas or not. In addition, the delivery price of green methane from energy crops is about 50% higher than that from organic wastes. Lastly the total cost of green hydrogen is one to three times higher than that of green methane. We may also note that the cost of production of blue hydrogen is comparable to the cost of production of green methane from energy crops.
4. Pathway for the Adoption of Green Hydrogen
The preceding cost analysis suggests that in the next decade and perhaps through 2050 a smart strategy must be adopted in order to establish the large-scale introduction of green hydrogen into the economy permanently this time around. A key component of this strategy is to determine the most important end uses of green hydrogen to facilitate its entry in the economy [
42]. Important end uses are those that make the most sense in terms of cost effectiveness as well as the reduction in greenhouse gas emissions. End uses of green hydrogen may include: (a) replacing grey hydrogen in refining, ammonia, methanol and steel production; (b) water and space heating as well as industrial applications; (c) transportation; and (d) wind and solar power storage. Replacing grey hydrogen with green hydrogen in industrial applications is unlikely to occur any time soon and definitely cannot lead the transition because of cost. At the moment and in the foreseeable future, i.e., by 2050, blue hydrogen at best can replace grey hydrogen. However, new technologies in manufacturing, such as steel production from direct reduction using electricity, could eliminate the need of hydrogen altogether. In terms of water and space heating, the replacement of natural gas (grey methane) with green hydrogen makes no sense because of not only cost, but also technological developments and efficiency issues. The replacement of water heaters and furnaces with heat pumps driven by wind and solar electricity can be at least four times as efficient given that the best water heater, boiler or furnace can be 96–98% efficient, but a heat pump driven by electricity from wind or solar can be 350–400% efficient and also provide air-conditioning. Moreover, heat pumps are under development that can deliver process heat to industrial applications at high temperatures such as pulp, paper, food processing, and preheating for even higher temperature processes such as cement, glass and chemical manufacturing. A recent study suggests that electricity can supply 78% of process heat in industry using currently available technologies and up to 99% with technologies under development [
43]. Hydrogen can be an excellent energy storage medium for renewable but intermittent wind and solar power as these sources increase in penetration to replace fossil fuel generated power. However, it will take at least a decade and probably longer before wind and solar account for 30 to 40% penetration, at which point there would be a need for longer term storage. Batteries can be good for a few days, but for longer storage periods, the grid would need a fuel such as green methane and/or green hydrogen [
44]. Transportation is the end use where green hydrogen can make an early entry in the market for a number of reasons to be discussed shortly. The thrust for the use of hydrogen in transportation has been based on fuel cell technology. Fuel cells were promoted twenty years ago and are promoted today once more by the Hydrogen Council, which was formed in 2017 and represents a fast-growing association of oil and gas companies [
14,
42,
45]. Fuel cell technology has advanced substantially over the past several decades [
40]. However, the use of fuel cells in transportation applications has yet to materialize. Of the various technologies, the polymer electrolyte membrane (PEM) fuel cells are considered to be the ones appropriate in transportation applications because of suitable operating temperature (80 °C) and power density (up to 1200 mW/cm
2) and total power output (up to 500 kW). However, the required amount of platinum makes them quite expensive. Moreover, the system efficiency of a PEM fuel cell is in the 30–50% range [
46]. Taking also into account the energy required to transport, compress or liquefy hydrogen and store it on board a vehicle, the overall efficiency of a PEM-fuel-cell-powered small passenger vehicle could be about 0.5 kWh/km. By comparison a similar size battery electric vehicle has a fuel consumption of 0.25 kWh/km, including the losses of charging/discharging the battery and transmission of electricity [
42]. That is to say, hydrogen fuel cell vehicles are half as efficient as battery electric vehicles. On the other hand, carbon dioxide emissions from power generation are relatively high at the present time, thereby making battery electric vehicles also high emitters of carbon dioxide despite their high efficiency. The carbon dioxide emissions from power generation, using those in the USA as an example, are summarized in
Table 4 [
47], and while there has been a reduction in carbon dioxide emissions by 24% from 2005 to 2019, the current rate of 0.646 kg/kWh or 179 g/MJ is still high compared to those of green hydrogen and of green methane.
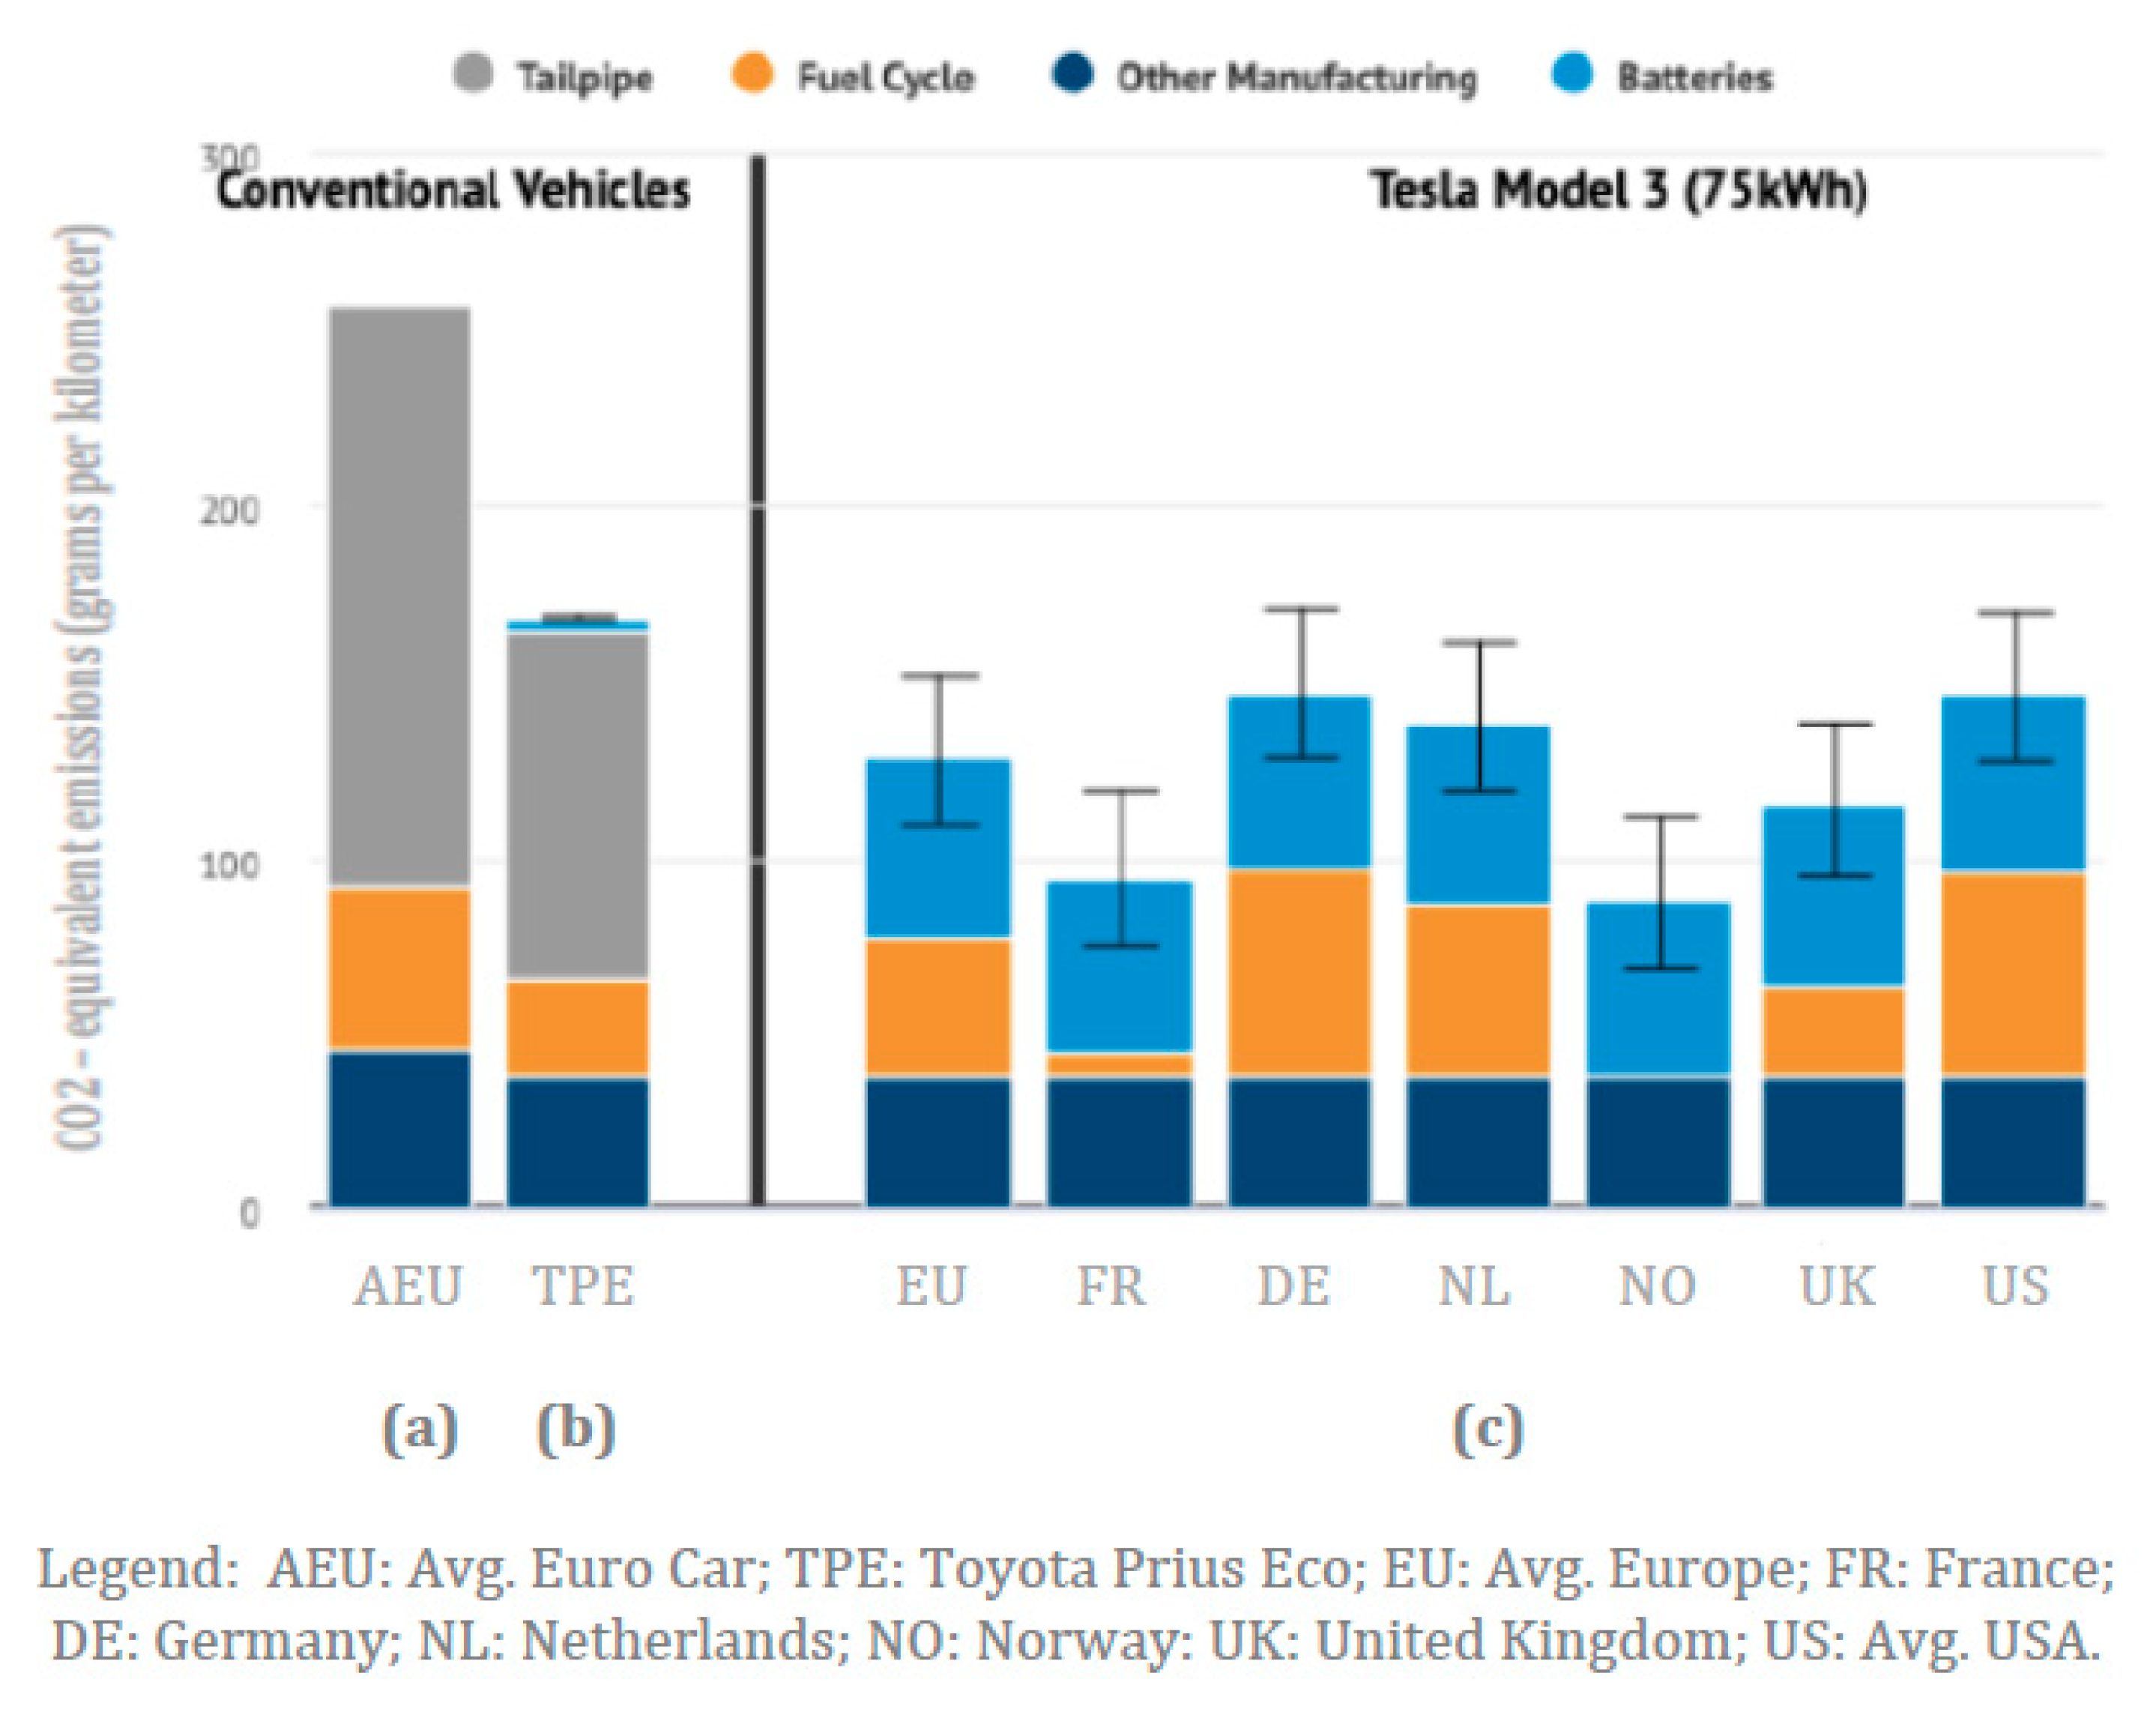
A recent study has compared the life cycle carbon dioxide emissions per kilometer of three types of passenger vehicles as follows: (a) a conventional gasoline vehicle (CGV) representing the average European car; (b) the most efficient hybrid electric vehicle (HEV), a Toyota Prius Eco; and (c) the battery electric vehicle (BEV) Tesla Model 3, having an energy use of 15.6 kWh/100 km, with average electricity emissions from a number of European countries and the USA [
48,
49]. The results of this study are shown in
Figure 3.
The calculated life cycle emissions of carbon dioxide show a number of important patterns that may be summarized as follows: (a) the manufacturing emissions of all these types of vehicles, excluding batteries for the BEVs, are comparable at about 50 g CO
2/km; (b) the fuel cycle emissions for the gasoline vehicles that comprise oil production, transport, refining and distribution range from a low of 25 g CO
2/km for the HEV to a high of 50 g CO
2/km for the CGV, i.e., they depend on the vehicle fuel efficiency; (c) the fuel cycle emissions for the electric vehicles, comprised of electricity generation and transmission, varies from a low of less than 5 g CO
2/km for countries with high penetration of nuclear power (France) and renewable power (Norway) to a high of 90 g CO
2/km for countries with still significant coal generation (Germany and the USA); (d) the battery manufacturing for BEVs is on the order of 50 g CO
2/km, while that for HEVs is around 5 g CO
2/km, because of the onboard size of batteries; and (e) the tailpipe emissions are on the order of 100 g CO
2/km for the HEVs and over 160 g CO
2/km for the CGVs. Obviously, these life cycle carbon dioxide emission figures depend on assumptions made by the modelling entities and can vary to a certain degree, occasionally showing electric vehicles emitting more carbon dioxide than conventional vehicles [
48]. We may also note that the average life cycle greenhouse gas emissions for electric vehicle batteries (lithium-ion) are presently about 100 kg of carbon dioxide per kilowatt-hour [
48]. This translates to 50 g/km for the Tesla Model 3 BEV. Even if all the power required for the manufacturing of electric vehicle batteries were to have zero carbon dioxide emissions, there still would be a minimum of 31 g CO
2/km just from the batteries alone.
The consensus appears to be that when all electricity is derived from renewable sources, then the electric vehicles could provide the lowest possible carbon dioxide emissions. Furthermore, the inherent inefficiency of the drivetrain of a fuel cell electric vehicle (FCEV) vs. a BEV as well as the high cost suggests that FCEVs will never be able to compete with BEVs in terms of both carbon dioxide emissions and cost. We may also note that FCEVs are typically twice as efficient as CGVs and consequently roughly as efficient as HEVs [
50]. Thus, the use of green hydrogen in transportation will not come about because of the large-scale introduction of FCEVs. This is contrary to what, for example, the Hydrogen Council, is advocating [
42]. Furthermore, wind and solar power are penetrating the market at a slow, but justifiable pace for a number of reasons: (a) existing power plants that cannot be closed down overnight because they represent a significant investment; (b) inadequate grid that needs upgrading to better accommodate distributed renewable sources; (c) relatively inexpensive and abundant natural gas (grey methane); and (d) higher capital cost of wind and solar power vs. natural gas power. In fact, fossil natural gas, being by far the cleanest fossil fuel with CO
2 emissions per energy output, roughly half those from coal and about two-third those from oil, will accommodate the transition from fossil energy to renewable energy in the next several decades at the local as well at the global levels. That is to say, the impact of BEVs on climate change will remain marginal until power generation is fully decarbonized in industrialized countries initially and around the globe later on. This realization presents an opportunity for the introduction of green hydrogen into the economy as a fuel for vehicles. The details of this opportunity will be considered next.
5. The Concept of the RHYME Fuel
The competing technologies in road transportation consist of: (a) conventional vehicle (CV) with internal combustion engine (ICE) and a hydrocarbon fuel, typically gasoline, diesel or natural gas, representing the majority of vehicles on the road today; (b) hybrid electric vehicle (HEV) combining an ICE fueled by a hydrocarbon fuel with an electric motor and batteries charged by the ICE; (c) plug-in hybrid electric vehicle (PHEV), which is similar to the HEV with the added feature that batteries can be charged externally (grid); (d) battery electric vehicle (BEV) with only an electric motor and batteries charged externally (grid); and (e) fuel cell electric vehicles (FCEV) with an electric motor powered by a fuel cell utilizing onboard stored hydrogen fuel. The characteristics of these technologies are summarized qualitatively in
Table 5. A number of important conclusions can be drawn. First, the BEVs and the PHEVs in the electric mode have the lowest energy use, while CVs have roughly four times higher energy use with HEVs and FCEVs being in the middle. The life cycle carbon dioxide emissions are not reduced proportionally to the energy use of the particular type, although HEVs, PHEVs and BEVs have 40% lower emissions compared to the CVs and FCEVs under the prevailing current energy production schemes in industrialized countries. Third, the FCEVs show at the present time no environmental benefit and a high cost. Fourth, the two technologies that stand out are the PHEVs and the BEVs. Fifth, the PHEVs represent the better environmental choice in light of the fact that most daily trips are less than 50 km, which means that these vehicles will be operated in the electric mode most of the time. For example, in the USA in 2017 the average daily distanced traveled was about 41.5 km and was comprised of an average of 2.7 trips of 15.4 km each [
51].
The PHEV technology has the potential to facilitate the introduction of green hydrogen fuel in lieu of gasoline in the transportation sector, particularly for light-duty vehicles. We will demonstrate this potential by comparing two well-known production vehicles: (a) the PHEV Toyota Prius Prime; and (b) the BEV Tesla Model 3 with medium battery capacity as marketed in the USA for model year 2022. Relevant characteristics of these two vehicles are shown in
Table 6 [
52]. The annually driven distance is 15,000 km over a 10-year life of each vehicle and consists of 45% urban and 55% highway driving.
The results in
Table 6 are quite instructive in three important aspects: (a) the life cycle carbon dioxide emissions of BEVs are about 10% higher than those of PHEVs at the present time; (b) the tailpipe emissions of the PHEV running on gasoline are similar, albeit slightly lower, than the lithium-ion battery emissions and (c) the price of BEVs is 30% to 50% higher than those of the PHEVs. Granted this conclusion is based on the careful examination of the two best models in their respective category, but a cursory examination of several models by other manufacturers shows similar results [
52]. On the other hand, these two production models showcase what the respective technology can attain at the present time. We know that in the future, say, by 2050 when hopefully most of electricity is generated by renewable energy, the fuel cycle emissions of the BEVs may be reduced to as low as about 1.00 g/km assuming wind power at 6 g/kWh of carbon dioxide emissions and a 90% power transmission efficiency. Carbon dioxide emissions for manufacturing may be reduced by 30% with the use of green electricity to 31.5 g/km. Moreover, the lithium battery emissions for the BEVs may be as low as 31 g/km (see
Section 4), bringing the total carbon dioxide life cycle emissions of the Tesla Model 3 to about 63.5 g/km. Studies have shown that 73% of trips on PHEVs with 56 km (35 mi) electric range are performed on the electric mode [
53]. The electric portion of the fuel life cycle carbon dioxide emission of the PHEVs will be reduced accordingly from 37.41 g/km presently (73% driving on electric power and 27% driving on gasoline) to 4.38 g/km, while the gasoline portion will remain unchanged at 51.25 g/km − 37.41 g/km = 13.84 g/km. Moreover, the lithium-ion battery life cycle CO
2 emissions of the PHEV will also be reduced by 40% (20/50) to 2.34 g/km. Thus, the total carbon dioxide life cycle emission of the Toyota Prius Prime would be: 48.75 g/km + 4.38 g/km + 13.84 g/km + 45.00 g/km + 2.34 g/km = 114.31 g/km. Of the carbon dioxide life cycle emissions for the PHEVs, 48.75 g/km + 13.84 g/km = 62.59 g/km or 54.7% of the total would be the result of using gasoline. If we were to employ a different fuel such as green hydrogen (GH), the carbon dioxide emissions of the PHEVs would fall well below those of the BEVs in the future. Moreover, if we were to employ green methane with carbon dioxide capture (GM+) or green methane augmented with the conversion of carbon dioxide in the biogas with green hydrogen (GE + GM + H), the total carbon dioxide emission of PHEVs would become even lower, the existence of tailpipe emissions notwithstanding. The BEVs have no such option available to them. The life cycle carbon dioxide emissions of BEVs operating on wind power and of the PHEV employing wind power along with either GH, or GM+ or GM+H are summarized in
Table 7. The fuel cycle carbon dioxide emissions are: for green hydrogen 12.708 g/kWh (3.53 g /MJ per
Table 1); for green methane with CO
2 capture −136.69 g /kWh (−37.97 g/MJ per
Table 2); and for green methane augmented with capture of CO
2 and conversion with green hydrogen to additional green methane −77.16 g/kWh (−35.47 g/1.655 MJ per
Table 2). The energy use by a PHEV is divided in the proportion 73–27% between the electric mode and the fuel mode, respectively. Thus, the carbon dioxide fuel cycle (FC) emissions of the PHEV on the electric mode for either fuel would be:
The carbon dioxide tailpipe (TP) emissions for the green methane are calculated to be:
The results in
Table 7 indicate that on a life cycle basis, BEVs powered by wind energy emit 50% more carbon dioxide than PHEVs powered by wind energy and fueled by either green hydrogen or green methane with carbon dioxide capture.
The scale of implementation of wind power required to electrify an advanced industrial economy such as that of the USA or of the EU, so that BEVs can approach the lower carbon dioxide emissions as shown in
Table 7, would be quite massive in the next 30 years. However, even if this massive renewable energy electrification were to happen, the results of the preceding analysis indicate that BEVs would not offer the best solution in terms of reducing the life cycle carbon dioxide emissions in transportation. The better choice would be PHEVs employing either green hydrogen or green methane or a combination of both of these green fuels. This avoids the need for large battery storage on board the vehicle and is consistent with the fact that almost three-quarters of daily travel is under 50 km. In addition to having significantly lower life cycle carbon dioxide emissions, a PHEV also has a significantly lower cost, which is dictated by the size of the onboard lithium-ion batteries. A PHEV will operate roughly three-quarters of the distance traveled annually on electricity and the remainder on the green fuel. The green fuel of choice should be a combination of green or renewable hydrogen and of green methane choice to reduce the life cycle emission of carbon dioxide and compete economically with fossils fuels and their cleaner derivatives, as we examine in the following section. Thus, the introduction of PHEVs operating on such a green fuel will also ensure and facilitate the introduction of hydrogen into the economy. We call this green fuel conceptually “Renewable HYdrogen and MEthane” or RHYME for short. We discuss the characteristics of the RHYME fuel in transportation in the next section.
6. The RHYME Fuel Characteristics
The proposed RHYME fuel represents a concept with a flexible green fuels composition in order to take advantage in transportation of the resulting significant reduction of life cycle carbon dioxide emissions vis-à-vis an electricity-only mode in a cost-effective approach that can begin its realization right away. Because green hydrogen is a component of the RHYME fuel, the utilization of green hydrogen can begin becoming part of the energy system of an industrial economy right away as well. There are two elements already in place to facilitate the introduction of the RHYME fuel: (a) all major automotive manufacturers include in their line of production PHEVs [
52]; and (b) biomethane is already part of the alternative transportation fuels market and is gradually increasing its contribution both in the USA and the EU [
28,
36,
37,
38,
54,
55]. For example, in the USA in 2020 some 1.45 billion gasoline-equivalent liters of renewable natural gas (RNG) was used and RNG accounted for 53% of the natural gas used in transportation in the country. Moreover, the use of RNG in the USA has almost quadrupled since 2016. The missing element is the production of green hydrogen that can be used along with green methane or biomethane as the alternative fuel to gasoline in PHEVs. At the present time, there is a limited number of FCEVs that are fueled by hydrogen. We believe that this is the not the best path toward the commercialization of green hydrogen for at least two major reasons: (a) FCEVs are not the best choice compared to BEVs and PHEVs due to higher vehicle cost and lower efficiencies; and (b) the price of green hydrogen is too high, thereby making the ownership of an FCEV even costlier. A mixture of green hydrogen and green methane can be readily accommodated in ICEs employed by PHEVs. In fact, a mixture of up to 20% hydrogen and at least 80% (fossil) methane by volume has been promoted for use in ICEs as far back as the late 1980s under the trade name “Hythane” [
56]. It appears that the optimal mix of hydrogen and methane in an ICE is in the range of 15% to 20% by volume, the lower percentage being applicable to heavy duty vehicle engines and the higher to light duty vehicle engines [
57,
58]. The mixture of hydrogen and methane (both in their gaseous forms) improves the combustion of methane by expanding the narrow flammability range, increasing the burning speed and lowering the ignition temperature of pure methane, thereby improving fuel efficiency [
59,
60]. The hydrogen and methane mixture reduces also the emissions of nitrous oxide by as much as a factor of two from the already lower such emissions of a natural-gas-fueled vehicle by allowing an even leaner air–fuel mixture that is supported by the high flammability of hydrogen [
58,
60]. It should be also noted that the high-octane number of methane and the even higher one for hydrogen support the use of high compression-spark-ignited ICEs approaching that of compression-ignited ICEs for increased fuel efficiency. The tail pipe carbon dioxide emissions of the mixture of green hydrogen and green methane will be modified in proportion to the mass percentage composition of the respective emissions of the two components. The concept of the RHYME fuel is different from the trademark Hythane fuel in two significant aspects: (a) it is composed by definition of 100% green fuels, respectively, hydrogen and methane; and (b) the hydrogen–methane volumetric ratio can vary to accommodate a particular type of ICE with a likely range of 15–85 to 20–80 percent. The RHYME fuel being gaseous would have to be compressed to the standard 250 bar pressure that compressed natural gas vehicles employ. Depending on the hydrogen (X%) to methane ratio (Y%), we can designate the RHYME fuel as RHYME X-Y. Thus RHYME 100–0 would be pure green hydrogen and RHYME 0–100 would be pure green methane. Some of the relevant-to-transportation characteristics of the RHYME fuel for the likely range of X and Y values are summarized in
Table 8. The use of the RHYME fuel may also increase the fuel efficiency of an ICE engine by a conservative 5%, resulting in an energy consumption of 0.37 kWh/km for mid-side passenger vehicles and a reduction of the corresponding carbon dioxide life cycle emissions of green methane to 38.42 g/km and 44.69 g/km for the two different options of green methane per
Table 7.
The use of natural gas as a cleaner source of fossil energy compared to coal and to oil has been increasing steadily in the past 40 years. It has been projected that by 2030, natural gas would constitute the largest primary energy source globally [
61]. Since the beginning of the 21st century, the application of new techniques for the extraction of natural gas have accelerated its production and use [
62]. The production of natural gas in the USA, for example, has increased from 531 × 10
9 m
3 in 2000 to 932 × 10
9 m
3 in 2021 [
63]. Thus, in a twenty-year period, the production of natural gas in the USA has almost doubled and natural gas has become the largest primary energy source in the country, allowing among others, the reduction by a factor of two in the use of coal for power generation. The USA has also a large and well-integrated natural gas pipeline system comprised of about 3.2 million kilometers of distribution and almost 0.6 million kilometers of collection and transmission pipelines. The production of green methane in the USA as a transportation fuel began less than ten years ago and is now increasing at an annual rate of about 25 percent [
55]. The near future potential for the production of the green methane in the US has been estimated at about 800 PJ per year or roughly 25 × 10
9 m
3 per year [
28]. We believe that the long-term potential for the production of green methane in the USA is at least an order of magnitude larger and perhaps as high 25 times higher at about 650 × 10
9 m
3 per annum [
27,
33]. Other countries with large near future green methane production potential include China, India, Germany and Brazil, but only Germany has an extensive natural gas distribution system similar to that in the USA [
28]. Consequently, the majority of biogas production globally is employed to supply heat and electricity instead of being upgraded into green methane and injected into the pipeline grid. However, a shift is underway, at least among industrialized countries, to upgrade biogas into green methane and inject it into the respective national natural gas pipeline grid where it can be used for any suitable use, including transportation. The driving force of this shift is derived from climate change concerns and the advancement of “net zero carbon” policies, which promote through a variety of financial incentives the use of low carbon fuels.
7. The Implementation of the RHYME Fuel
The implementation of the concept of the RHYME fuel in the short term, i.e., in the next ten years or so, represents a practical means to introduce green hydrogen into the energy sector on a permanent basis. An implementation scenario is considered using as an example the current situation with green methane in the USA. As we already mentioned, the use of RNG in the United States stands at about 1.45 billion gasoline-equivalent liters as of 2020 and has shown an average increase rate of about 28% per annum in the past five years. This amount of green methane, which does not include any carbon dioxide capture and reuse at the moment, is equal to about 1.3 × 10
9 Nm
3 of methane and represents roughly 5% of the country’s short-term biomethane potential and a little over 0.1% of the current production of natural gas. If the average annual increase rate of 28% can be maintained in this decade, then it will take about 12 years for the produced green methane to reach an annual production rate of just over 25 × 10
9 Nm
3, i.e., reach the short-term potential of the country. The capture of the carbon dioxide in the generated biogas and its use along with green hydrogen will generate an additional 25.2 × 10
9 Nm
3 × 0.655 = 16.5 × 10
9 Nm
3 of green methane (see
Table 2). The amount of hydrogen required for the production of one billion normal cubic meters of green methane (717,200,000 kg at an STP density of 0.7172 kg/m
3) is equal to 358,600,000 kg or 3.989 × 10
9 Nm
3 of hydrogen (STP density of 0.0899 kg/m
3) based on Equation (11) whereby 8 kg of hydrogen are required to generate 16 kg of methane. The required wind electricity to produce via electrolysis this amount of hydrogen is going to be: 3.989 × 10
9 m
3 × 4.1 kWh/m
3 = 16.355 × 10
9 kWh. The required wind power would be 6.2 GW at an average 30% capacity factor. The required electrolysis capacity is calculated on the basis of a production rate of 55 × 10
6 Nm
3 of hydrogen per year by a 100 MW unit. There will be additional need for hydrogen production in order to generate the RHYME fuel. For example, the RHYME 20–80 fuel would require 0.2 × 10
9 Nm
3 of green hydrogen for every 0.8 × 10
9 Nm
3 of green methane. The results of this analysis with the aforementioned assumptions are summarized in
Table 9.
We have also calculated the required capital cost for implementing the short-term introduction of the RHYME 20–80 fuel in the next 12 years. The capital cost for green methane production is estimated to be USD 0.1/Nm
3 of methane produced [
28]. The capital cost of electrolysis is expected to be around USD 540/kW and the cost of wind power could be as low as USD 1000/kW as we have already discussed (
Section 2). The calculated capital cost is also included in
Table 9. The required average total annual capital investment over the 12-year period amounts to about USD 66.5 billion. The wind power capital cost amounts to almost 86% of the total investment. While this amount of investment is well within the ability of the private sector to finance, it will require a concerted effort on the part of both the private and public sectors, the latter developing a coherent policy toward the objective. We may also note that additional wind power generation will be required to supply the electric portion of the energy required for the PHEVs. This electricity will represent the energy use for the average 73% of the annual driving distance with electric propulsion.
It is instructive to also calculate the benefits of such an investment in the energy sector beyond the obvious environmental benefits in attaining “net zero carbon dioxide emissions”. The average fuel efficiency of new gasoline fueled light-duty vehicles in the USA is 0.84 kWh/km (25 mpg). These vehicles comprise passenger cars, sport utility vehicles, small vans, small (pick-up) trucks and motorcycles and consumed 428 billion liters of gasoline in 2020 [
64]. It should also be noted that 10% by volume of gasoline is renewable ethanol. Thus, the oil-derived portion of the gasoline usage was about 385 billion liters in 2020 and the bioethanol amounted to 43 billion liters. The use of PHEV technology across the board may increase the average fuel efficiency by a conservative 50%, thereby bringing it to 0.56 kWh/km [
58]. For example, the 2022 PHEV sport utility vehicle models for sale in the USA range in fuel efficiency from a high of 0.20 kWh/km (electric) and 0.46 kWh/km (gasoline) to a low of 0.26 kWh/km (electric) and 0.60 kWh/km (gasoline). Thus, the implementation of PHEVs across all categories of vehicles could reduce gasoline consumption conservatively to:
Given that 1 Nm
3 of the RHYME 20–80 fuel has nearly the same energy content as one liter (L) of gasoline with 10% ethanol content, we conclude that the equivalent amount of RHYME 20–80 fuel required to replace the annual gasoline consumption of PHEVs would be about 77 × 10
9 Nm
3 per year. About 68% of this demand can be met from the existing organic wastes per
Table 8. The remainder 22% or about 25 × 10
9 Nm
3 of RHYME 20–80 fuel can be met by increasing the production of green methane through the utilization of some of the corn used in bioethanol production to produce more green methane via anaerobic digestion, capture the carbon dioxide in the biogas and utilize it with green hydrogen to generate additional green methane. It is well established than one hectare of corn can produce on an energy content three times as much green methane as it does bioethanol, because the entire biomass of the corn plant is used for the production of methane vs. just the corn kernels used for bioethanol [
28]. Moreover, 1 Nm
3 of green methane is equal to about 1.5 L of bioethanol in terms of energy content. Consequently, if the entire corn production for bioethanol was shifted to produce green methane instead, then we would obtain as many as 86 × 10
9 m
3 of green methane annually. In the case of the implementation of the (WE + GM + H) fuel, there will be a need to produce an additional 12 × 10
9 Nm
3 of green methane from corn in order to generate ultimately 20 × 10
9 Nm
3 of green methane (12 × 10
9 Nm
3 × 1.655) and 25 Nm
3 of RHYME 20–80 fuel. Thus, it would be necessary to reduce bioethanol production by 6 billion liters and utilize 14% of the current production of corn to bioethanol to produce instead 12 × 10
9 Nm
3 of green methane. In addition, the remainder of the corn used for bioethanol can be shifted to produce 74 × 10
9 Nm
3 of green methane annually via anaerobic digestion. This green methane can be further augmented to 122 × 10
9 Nm
3 of green methane with the capture of carbon dioxide and green hydrogen to produce more (WE + GM + H) fuel. The long-term development, i.e., by 2050 of the use of green hydrogen in transportation through the expansion of the use of the RHYME fuel is summarized in
Table 10 as option A.
We may also note that additional wind power generation will be required to supply the electric portion of the energy required for the PHEVs. For light-duty PHEVs this electricity will represent the energy use for the average 73% of the annual driving distance with electric propulsion. Assuming conservatively that the annual driving of light-duty vehicles will not be reduced over the next thirty years from the present value of about 4.8 trillion kilometers [
65], but that the average electric mode efficiency will average 0.23 kWh/km and will apply to 73% of the traveled distance, we can calculate the electricity required as:
The required wind power to generate this amount of electricity will be 307 GW. We note that about three-quarters of the required wind power will be dedicated to the production of green hydrogen and one-quarter to the supply of power for the supply of electricity of the vehicles. By way of comparison the alternative of 100% electric light duty vehicle transportation would require 420 GW of wind power.
Obviously, the huge requirement of wind power to produce additional green methane from carbon dioxide and green hydrogen dictates that the environmentally equally good alternative fuel (WE + GM+) of not converting the carbon dioxide in the biogas into additional green methane, but rather sequestering it permanently is also presented as Option B in
Table 10. In that instance, there would be a need to produce more green methane from energy crops, assuming that all the organic wastes have been used up, while utilizing the same amount of electricity of 307 GW for the electric propulsion. The required wind power to produce the green hydrogen to be part of the RHYME 20–80 fuel is then reduced to 121 GW. The alternative option for the supply of the RHYME 20–80, whereby the carbon dioxide in the biogas is permanently sequestered, along with being used as required in the production of other chemicals, is more realistic in terms of the required wind power as well as the associated cost over the next thirty years. In this instance, indicated as B in
Table 10, the wind power required for the production of green hydrogen is only a little over one-quarter of the total power required per option A in
Table 10. The required green methane to be produced from the current corn energy crops used for ethanol is 52 × 10
9m
3 per year and represents 60% of that crop. We would also like to remark that a lot of marketing emphasis has been placed on BEVs in the past few years. However, the number of PHEVs marketed and sold by all the major automotive manufactures are quietly capturing the market share of electric vehicles in the USA [
66]. For example, in 2017, a roughly equal number of BEVs and PHEVs were sold numbering altogether about 200,000 vehicles with a rate of sales increase of about 20 percent annually.
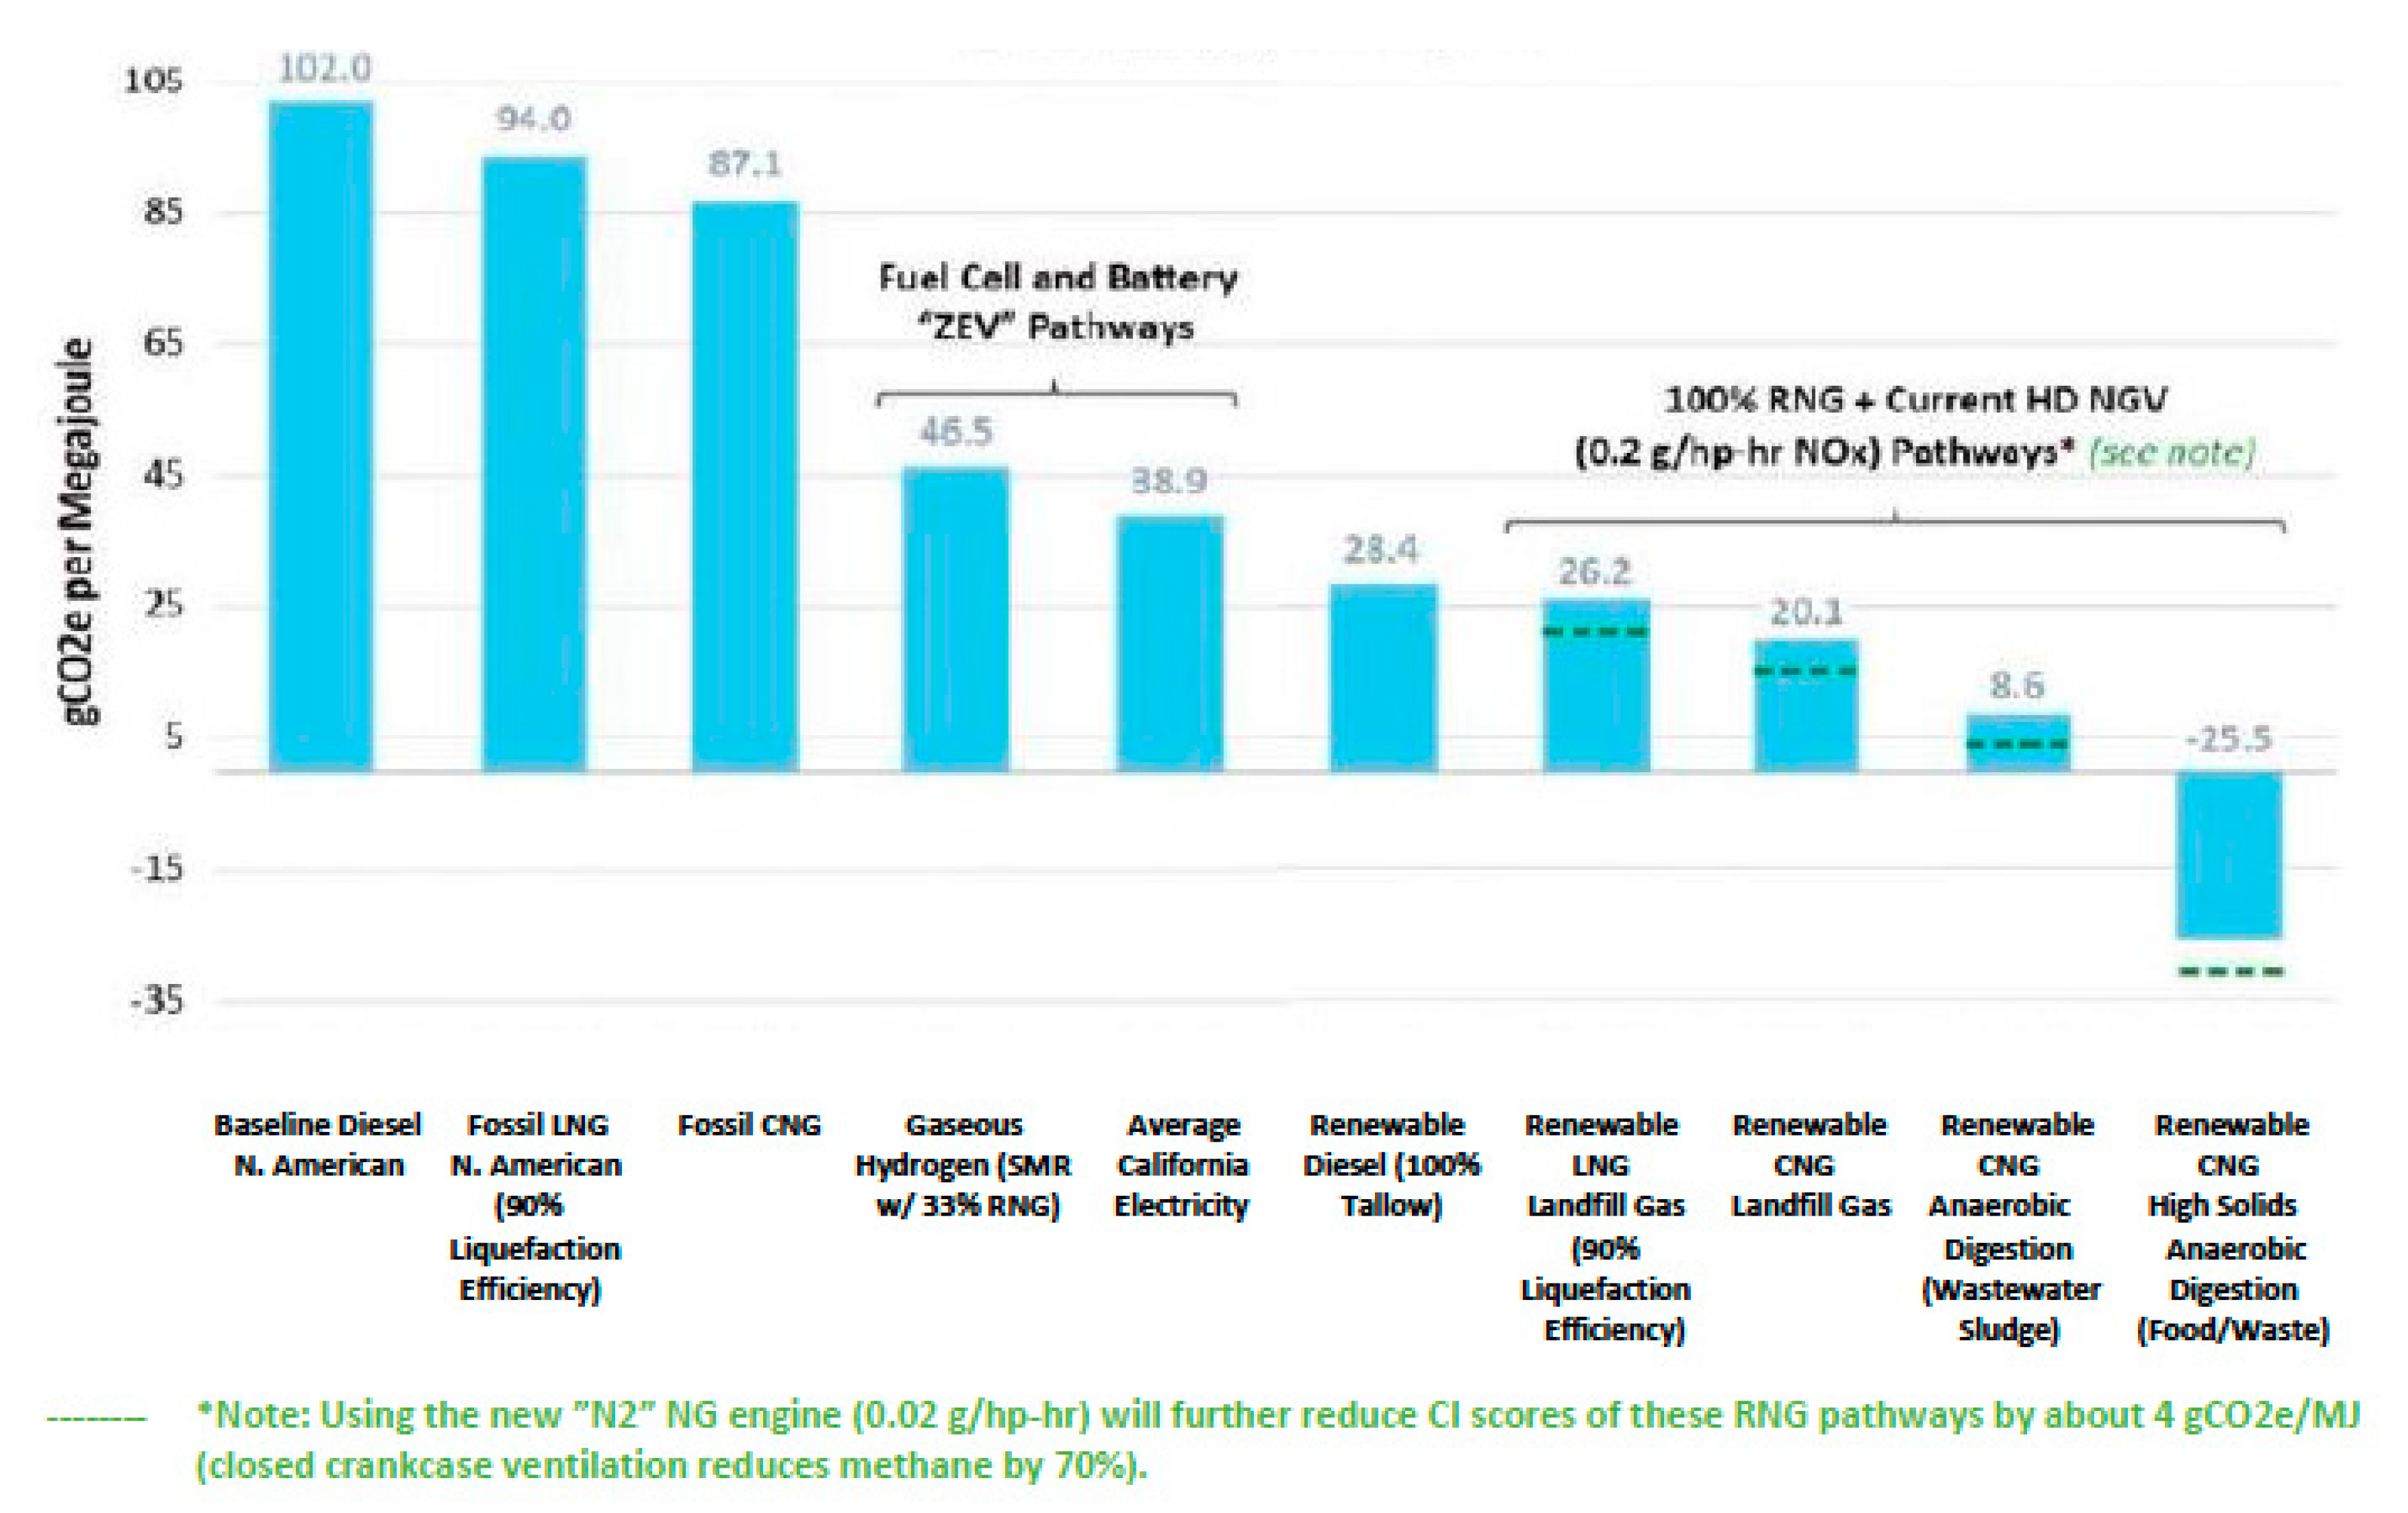
Lastly, we conclude this section by addressing the replacement of diesel fuel for on-the-road heavy-duty vehicles with a RHYME fuel. Once more, we utilize the USA as an example, where the current annual consumption of diesel fuel stands at 170 billion liters, two-thirds of which are used for on-the-road vehicles [
67]. The 15% to 85% green hydrogen to green methane ratio of the RHYME fuel composition appears to be a better choice for heavy-duty vehicles as already mentioned. In the past two decades, fossil natural gas has gradually been replacing diesel in the operations of transit buses, refuse collection trucks, delivery vans and medium trucks, and heavy-duty trucks as a means to reduce air pollution. Moreover, the implementation of renewable natural gas in heavy-duty vehicles is now actively promoted in both the USA and the EU via suitable policies as a means to reduce life cycle carbon dioxide emissions [
68]. The carbon index of renewable natural gas, a measure of the carbon dioxide emissions of the fuel, is well below any other fuel, including the use of brown hydrogen in fuel cells and current electricity generation for battery-powered vehicles as shown in
Figure 4 [
69]. These results are consistent with the analysis presented in this work (
Section 2 and
Section 3). The use of green hydrogen with green methane in a RHYME 15–85 fuel, as already discussed, has the potential to equal and better the life cycle carbon dioxide emissions in heavy-duty vehicles of green methane alone. Moreover, the use of green hydrogen to create the RHYME fuel extends the availability of green natural gas from organic wastes and energy crops resulting from the conversion of wind energy into a green fuel.
The current use of diesel fuel for on-the-road heavy-duty vehicles in the USA amounts to 112 billion liters per annum. Moreover, the current average fuel consumption of heavy-duty vehicles weighted by miles traveled is 3.6 kWh/km. It is projected that fuel consumption may decrease by as much as a factor of three by 2050 with the introduction of fuel-cell-powered HEVs (hybrid electric vehicles) [
70]. As we have indicated the use of hydrogen with fuel cell technology is of questionable value due to inherent inefficiencies in the entire process and the cost of the technology itself. Thus, we consider a more modest, but pragmatic, increase in fuel efficiency with an HEV system to 2.4 kWh/km based on an ICE with electric propulsion and a RHYME 15–85 fuel. The use of a PHEV technology for some of the heavy-duty vehicles that operate exclusively in an urban area is also feasible, although we estimate that a small amount of the fuel can be substituted with electricity, perhaps no more than 5% of the total. Thus, the 112 billion liters per year of diesel used today for on-the-road vehicles could be reduced to about 75 billion liters per year of diesel by 2050. The replacement of that diesel fuel by 2050 can occur with a net zero or even negative carbon fuel supplied by the combination of mostly (95%) RHYME 15-85 fuel and some electricity (5%). Thus, the annual energy consumption of heavy-duty vehicles could amount to 71 billion diesel-fuel-equivalent liters supplied by RHYME 15–85 fuel and 4 billion diesel-equivalent liters of green electricity. We also note that a liter of diesel contains 9.80 kWh of energy, while 1 Nm
3 of the RHYME 15–85 fuel contains 8.95 kWh of energy. This, in essence, necessitates by 2050 the annual availability of 11.7 × 10
9 m
3 of green hydrogen and 66.3 × 10
9 m
3 of green methane. The former will be produced from wind power via water electrolysis and the latter from the anaerobic digestion of energy crops. The implementation of option A per
Table 10 leaves available up to 77 × 10
9 m
3 of green methane from corn, which is more than sufficient to supply the needs for diesel replacement as RHYME 15–85 fuel. On the other hand, the implementation of option B per
Table 10, leaves at most 34 × 10
9 m
3 of green methane available from corn crops. In that case, additional energy crops generating 32.3 × 10
9 m
3 of green methane per year need to be developed. The most likely scenario for gasoline replacement by RHYME 20–80 fuel will be somewhere between option A and option B, thereby requiring the development of new energy crops or sources of biomass to be digested to generate an average of 22 × 10
9 m
3 of green methane annually. This objective can be easily attained given the size of landmass of the country and the variety of climates. In addition, there will be a need for the direct supply of wind electricity amounting to 15 GW of power. We also estimate that by 2032 at most 20% of the final 2050 replacement of the diesel fuel with more fuel-efficient heavy-duty vehicles operating on RHYME 15–85 fuel and electricity in a HEV and/or PHEV mode may be in place. The results of the analysis of the replacement of the on-the-road use of diesel fuel are also included in
Table 10 as option C.
The RHYME fuel will be able to take advantage of the existing natural gas pipeline system in the most industrialized countries for its transportation and distribution from its production sites to the end users. Obviously, the natural gas pipelines transport at the present time fossil natural gas and will do so for a significant time into the future. Consequently, the utilization of the RHYME fuel by an end user will be essentially an accounting scheme akin to the present one of injecting bio-methane or RNG at one point in the system and having an end user at another point, who would pay for that particular product. One may argue that under this delivery arrangement the end user will not receive the exact RHYME fuel. This is strictly true, but the environmental benefit would still apply. An alternative delivery scheme may entail a twostep process as follows: (a) the green methane is injected into the pipeline system at the site of its production as it is done today; and (b) green hydrogen produced at the site of a dedicated RHYME fuel station via electrolysis powered by renewable electricity that the station operator is purchasing through the electric grid, along with green methane that is also purchased from the natural gas pipeline system, is then mixed to the right proportion and sold to customers. As it turns out the RHYME fuel stations can be strategically located in urban areas and along highways to accommodate the fueling needs of owners of PHVEs. Moreover, the RHYME fuel stations do not have to be numerous, given that on the average the owner of a PHEV such as the Prius Prime visits a gasoline fueling station about four times annually [
53]. For heavy-duty vehicles, the fueling with diesel occurs typically at the depots where these vehicles are serviced. The RHYME fuel can become available at these depots by the same process as described above. In locations where no natural gas pipelines exist, the RHYME fuel can be transported from the production site to the end user site, i.e., a fueling dispensing station, via truck. This practice has been around for the transport of natural gas and can be extended for the transport of the RHYME fuel, as well in specialized situations.
8. Conclusions
The results of the preceding analysis indicate that the permanent establishment of green hydrogen into the energy sector would require the concurrent use of green methane as a means of facilitating this introduction at least in the early stages of that realization over the next 10 to 30 years. The reasons have already been discussed and are summarized here as well:
- (a)
Green hydrogen is not an energy source, but an energy carrier, while green methane is an energy source;
- (b)
Converting other renewable energy sources such as wind power or even biomethane so that green hydrogen becomes a universal energy source is noncompetitive economically, is overall suboptimal and does not provide the best environmental results;
- (c)
The green hydrogen–green methane combination combines the best aspects of both of these fuels, namely, the efficiency of combustion for a higher fuel efficiency in vehicles, the reduction in carbon dioxide emissions to even a negative level and a high energy density for a feasible storage in a limited space such as on board vehicles;
- (d)
It allows the utilization of the existing natural gas transmission and distribution pipeline system without major modifications, thereby reducing substantially the need of, and the cost for new delivery infrastructure;
- (e)
The road transportation sector can attain a net zero carbon status in the near future by implementing currently available, cost-effective technology for light-duty as well as heavy-duty vehicles.
A possible concern associated with the use of green methane is the issue of fugitive emissions. Methane is a potent greenhouse gas and the production and distribution of natural gas is known to result in atmospheric leaks [
14]. Green methane is produced under anaerobic conditions that are critical for the success of the process. Consequently, the leakage of green methane at its production sites cannot occur unless a failure in the process takes place that is then remedied for the operation to continue. Leaks in the transmission and distribution system can occur and do occur, but they can be tracked down easily with existing space satellites and be repaired [
71,
72].
Another possible concern is that the distribution of renewable energy is not uniform around the globe. Consequently, some regions or countries may be more favorably endowed with wind, solar or biomass, such as, for example, the USA. In addition, other counties may have a large industrial base for manufacturing, advanced technology and a highly developed infrastructure such as a power grid and a natural gas pipeline system, such as, for example, the already mentioned cases of the USA and Germany. It would seem then that such countries or regions are favorably predisposed to develop the production and utilization of green hydrogen along with green methane for the RHYME fuel and the associated transportation technology as we have already discussed. Obviously, relevant regional and country policies need to be developed to address such dissimilarities. It is suggested, for example, that in the region of Southeast Europe a diversified supply of natural gas and a network of natural gas pipelines be developed as a precursor to the introduction and utilization of green hydrogen [
73]. Moreover, on the broader global state of the introduction of green hydrogen, a recent study concludes that the aforementioned disparities do not pose a risk for the less fortunate in this regard regions, because there will be regional trade-offs such as, for example, between the EU and countries of the African Union to level the playing field [
74].
The implementation of the proposed RHYME fuel in order to introduce green hydrogen into the energy sector, and more specifically in road transportation, would require the involvement of stakeholders in both the public and private sectors. The public sector would consist of the local, state and federal governments through appropriate agencies or departments. The private sector would involve energy companies, electric and natural gas utilities, automotive manufacturers and financing institutions at a minimum. A strategy must be developed to achieve the objective at hand, namely, the introduction of green hydrogen into the energy sector of a country or even a group of contiguous countries. Such a strategy is also referred to as a “roadmap” or more appropriately as a “technology roadmap” because it pertains to the introduction of green hydrogen [
75]. The International Energy Agency (IEA) defines a technology roadmap as “a dynamic set of technical, policy, legal, financial, market, and organizational requirements identified by all stakeholders involved in its development”. A number of scenarios have been presented in this work to describe specific outcomes in terms of the implementation of green hydrogen through the concept of the RHYME fuels. These scenarios are hypothetical, but internally consistent, attempt to establish the desired goals by certain dates and can be used to develop the relevant technological roadmap. The roadmap must also include the necessary steps to be taken in order to reach the intended goals presented in the scenarios, with the participation of all key shareholders. Creating the roadmap for the implementation of the green hydrogen economy is obviously outside the purview of this work.


