1. Introduction
It was demonstrated previously that the risk of using hydrogen vehicles on London roads is acceptable if an onboard tank’s fire-resistance rating (FRR), i.e., time to its rupture in a fire if a thermally activated pressure relief device (TPRD) is not triggered in a localised fire or blocked from the fire, is above 50 min [
1]. The assessment was performed for scenarios when onboard hydrogen storage was tank filled to 100% of the nominal working pressure (NWP). The pressure of the compressed hydrogen storage system (CHSS) is not always the NWP, i.e., the state of charge (SoC) is below 100%. SAE J2601 defines the SoC as the “ratio of CHSS hydrogen density to the density at NWP rated at the standard temperature 15 °C”: SoC = [
ρ(
P, T)/
ρ(NWP, 15 °C)] × 100 [
2]. Normative documents define the “normal boundary conditions” during the fuelling of NWP = 70 MPa tanks from 0.5 MPa to a maximum of 87.5 MPa, i.e., 1.25 of NWP [
2,
3]. In our study, we consider scenarios with NWP = 70 MPa rather than the maximum allowable fuelling pressure of 87.5 MPa. The use of hydrogen tank capacity at NWP or SoC = 100% is characteristic for a period immediately after tank refuelling only.
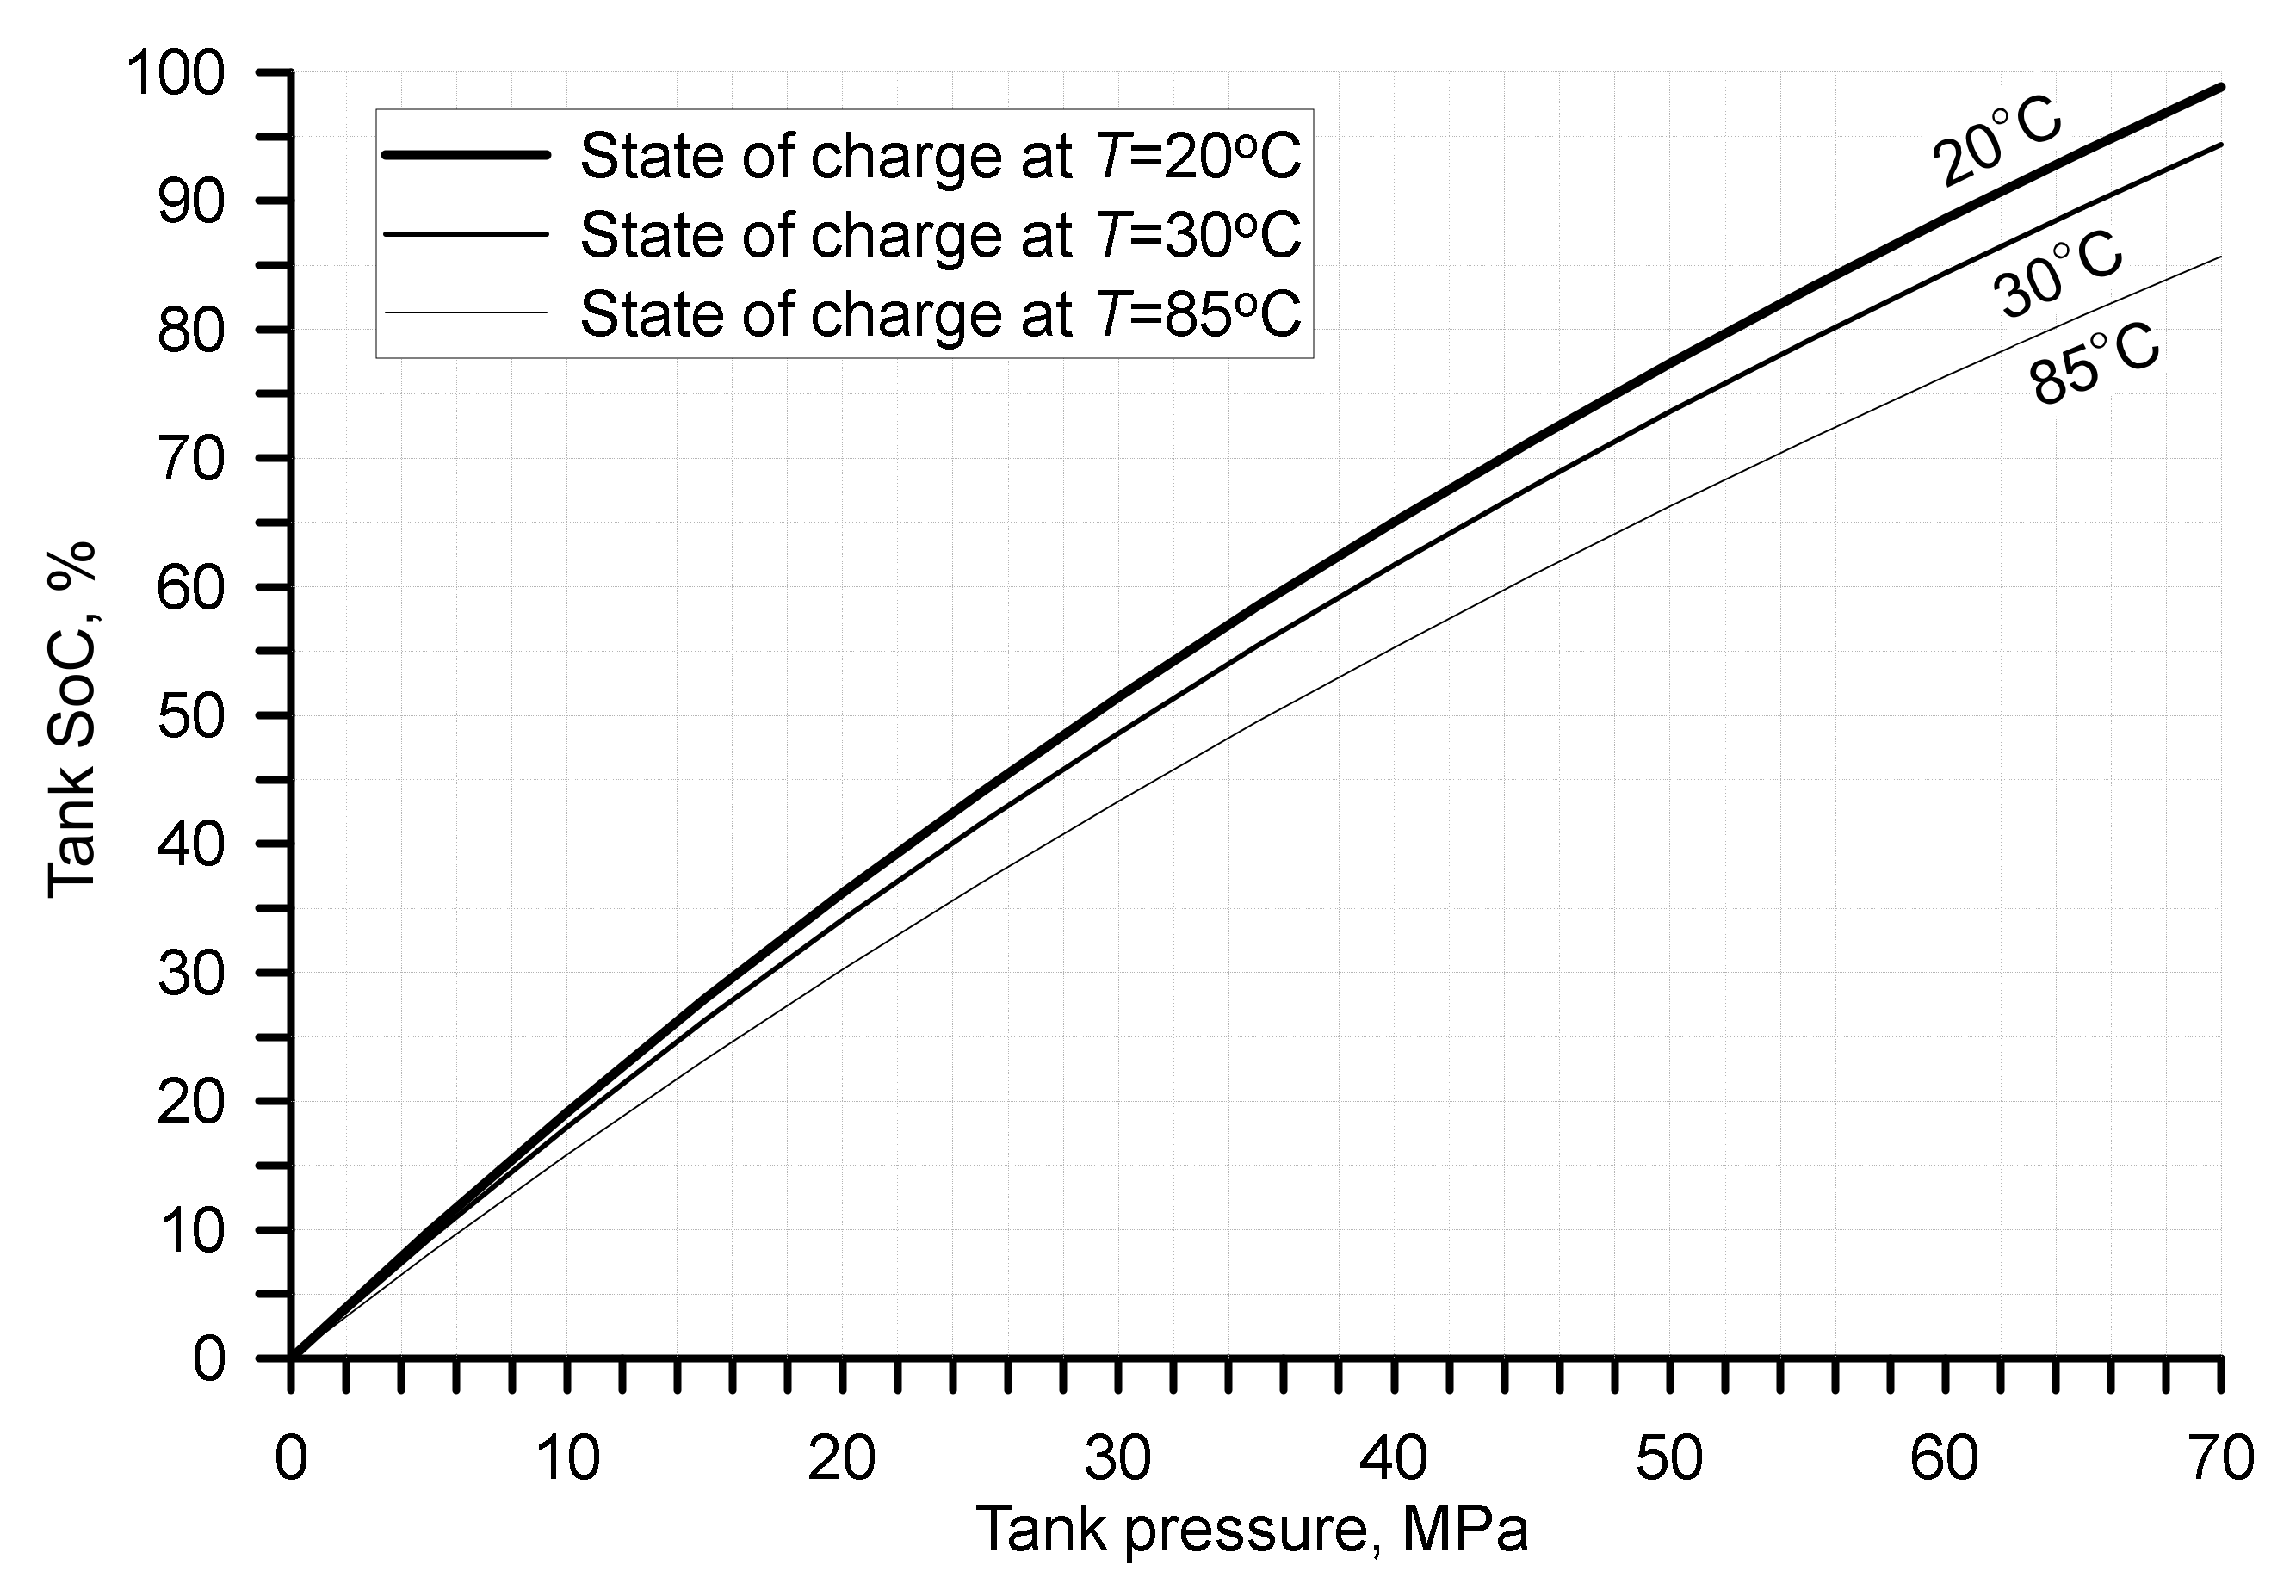
Figure 1 plots the tank SoC as a function of hydrogen pressure calculated for different temperatures inside the tank: 20 °C, 30 °C and 85 °C. The last temperature is the currently regulated upper limit during fuelling [
2,
3].
The above curves were built as a result of calculations of the ratio of hydrogen densities at the selected temperatures, i.e., 20 °C, 30 °C and 85 °C, and different SoCs and the density of hydrogen at NWP = 70 MPa and 15 °C.
Let us analyse the experimental results of CHSS fire testing at different SoC. In the experimental work [
4], NWP = 70 MPa Type IV tanks of 36 L were tested in localised and engulfing fires without TRPD at different SoCs to define their FRR. The initial pressures were 70.3, 70.6, 35.6 and 17.8 MPa. The fire source was a heptane pan of an area of 0.96 m
2. Tanks filled at 70.3 MPa and 70.6 MPa ruptured after 6 min 32 s and 5 min 20 s respectively. The first fire test was an engulfing fire and the second tank was tested in a localised (“partial”) fire. The first important conclusion from these experiments is that the time to tank rupture depends on neither the engulfing nor the localised fire it is subject to. The second conclusion is that the tank would not withstand the 10 min localised portion of the fire test following GTR#13, as the tank will rupture in less than 10 min in the heptane fire. The authors recommended that the “cylinder as a whole needs to be protected from localised fire impact” [
4].
These experiments also demonstrated that when one of the NWP = 70 MPa tanks was filled at 35.6 MPa (51% NWP) and underwent the same engulfing fire, it ruptured later—after 9 min 49 s (the FRR almost 1.5 times longer than the FRR of the first tank filled at almost NWP, i.e., at 70.3 MPa). This can be explained when the original composite tank failure in a fire mechanism developed at Ulster University is applied (see for example [
5]). It states that when the resin decomposition front propagating inward inside the composite tank overwrap encounters an outward expanding load-bearing fraction of the composite wall thickness,
, a tank ruptures. In this test, with reduced initial pressure, the thinner
is required to bear this pressure. Thus, a longer time is required for the resin decomposition front to travel through the remaining or virgin wall depth to encounter it.
Finally, in the experiments with the tank filled at lower pressure of 17.8 MPa (25% NWP), the hydrogen leak without tank rupture was observed at 11 min 4 s. In this case, the thermally degradable virgin wall thickness fraction was larger, thus it allowed for the heat transferred inside which had melted the liner. The authors state that hydrogen “was leaking across its entire surface with slightly more leakages at the ends” and that during the test “epoxy resin seems to have disappeared but the carbon fibres did not burn” [
4].
There is another experimental study on fire testing of NWP = 70 MPa 36 L Type IV tanks at different initial pressures [
6]. There were no hydrogen gas temperature measurements, but the composite in-depth integrated thermocouples showed the initial temperatures to be about 42 °C (315 K). The fire source was represented as a hydrogen-oxygen premixed burner consisting of 4 pipes directed at tanks from two opposite sides. The tanks’ filling pressures were 70 MPa (NWP), 52.5 MPa (75% NWP), 25 MPa (36% NWP) and 10 MPa (14% NWP). The first two tanks, one at pressure 70 MPa and another at 52.5 MPa, ruptured after 3 min 58 s and 5 min 11 s respectively. The other two tanks, filled at lower pressures, i.e., 25 MPa and 10 MPa respectively, did not rupture but leaked after 6 min 40 s and 8 min 10 s respectively. These experiments had even been performed with a different fire source, confirming the conclusions of the previous study [
4]. Indeed, the lowered initial pressures in the tank would avail the larger virgin wall thickness portion to be decomposed without causing a rupture, while the liner would be melted and could allow hydrogen to escape through the hydrogen non-tight composite wall.
The liner material, e.g., high density polyethylene (HDPE), being a thermoplastic polymer, may have a melting temperature of 118 °C [
7] up to 135 °C [
8]. Before the melting point, the polymer undergoes its property alterations as a solid body, such as an elastic modulus, known to be obtained at a heat distortion temperature [
9]. Afterwards, as the temperature elevates, the polymer becomes softer until it becomes a liquid at the melting point. The assumption is that when the tank is in a fire, the hydrogen leak starts when the entire liner thickness reached the minimum of the polymer melting temperature. This implies that the liner in that spot starts flowing plastically, being unable to perform a barrier function to hydrogen, thus allowing it to escape and permeate/leak through the composite (that is not tight to hydrogen). Some tank manufacturers tend to use other thermoplastics for the liners, such as Nylon, i.e., polyamide (PA). PA has a higher melting temperature, e.g., 129 °C [
10].
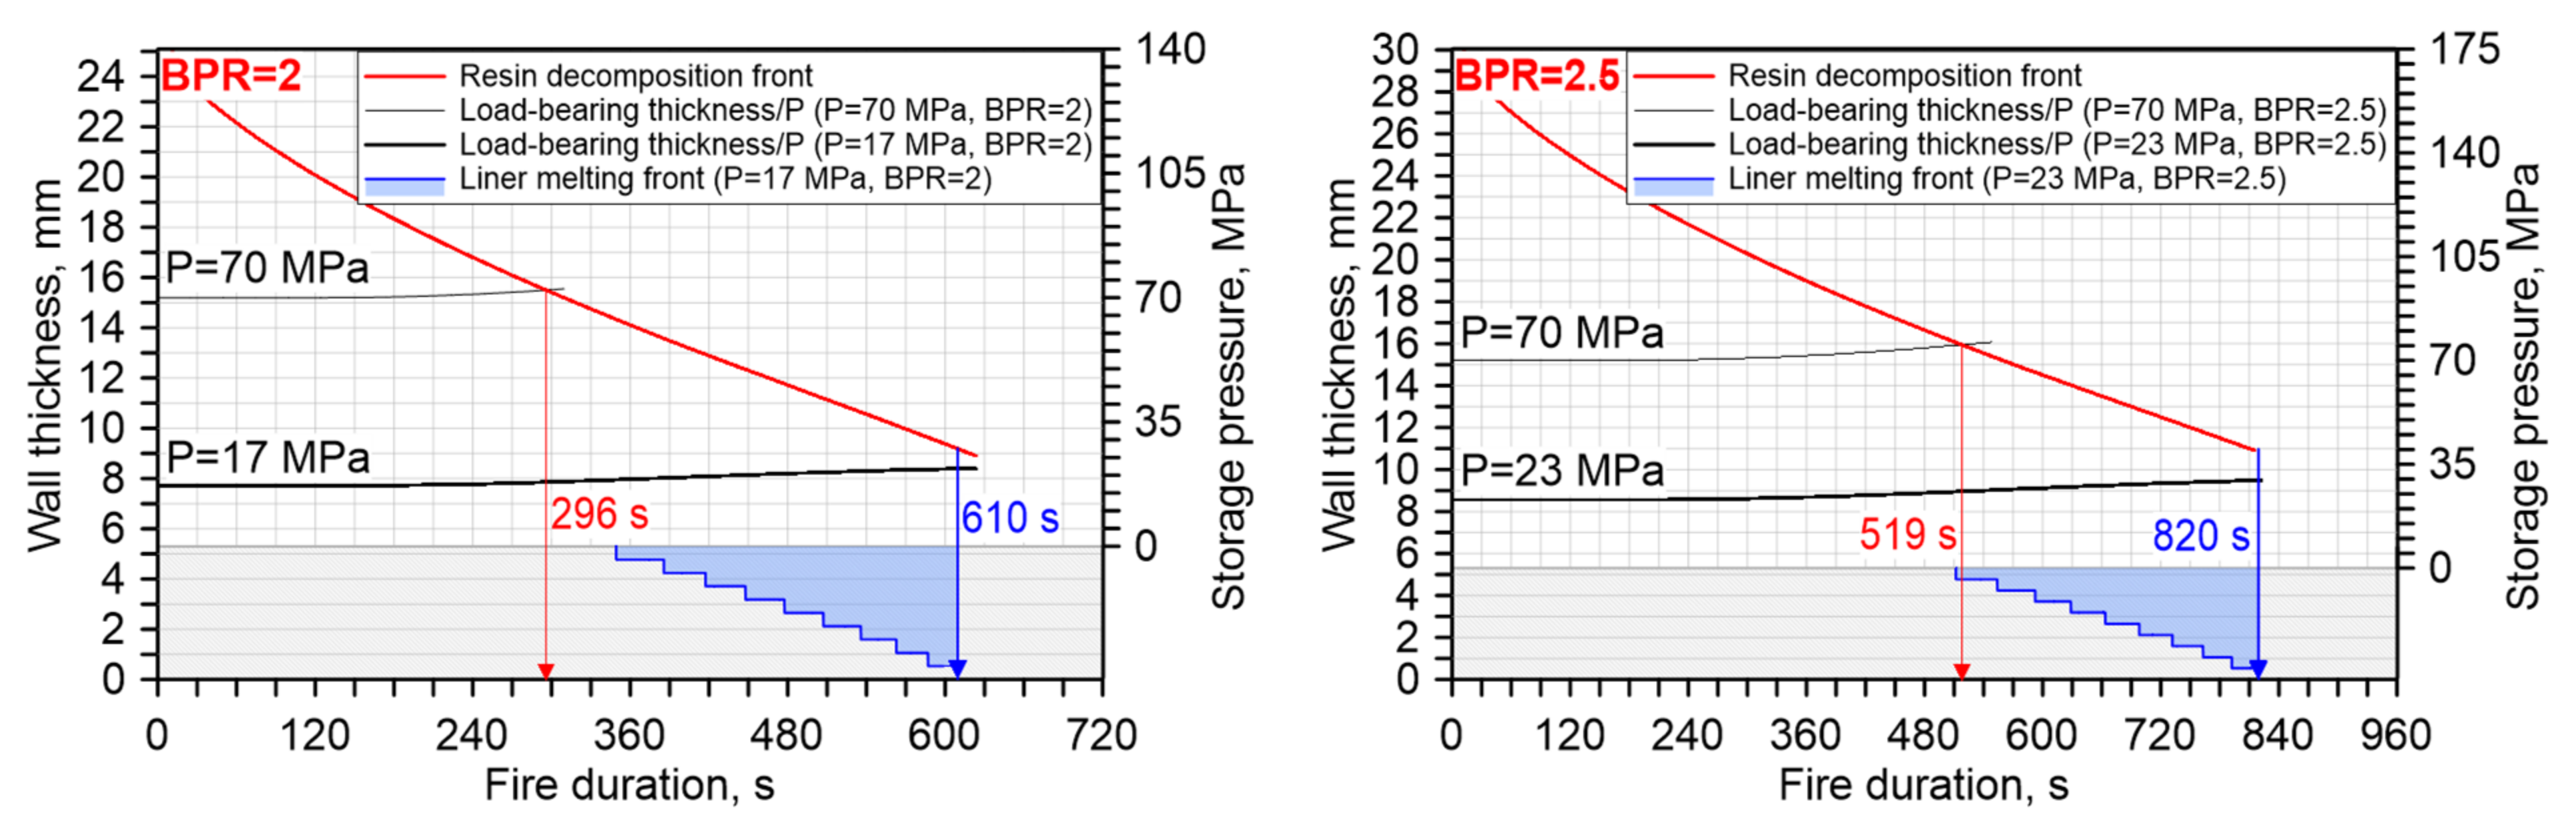
The UN Global technical regulation on hydrogen and fuel cell vehicles No. 13 (GTR#13) [
3], the EC No. 406/2010 implementing the Regulation No. 79/2009 [
11] establish the minimum burst pressure,
, for tanks overwrapped with carbon fibre reinforced polymer (CFRP) to be 2.25 times NWP, i.e., the burst pressure ratio (BPR). This means that for the 70 MPa tank, its wall will be able to withstand up to 2.25 × 70 MPa = 157.5 MPa. It should be noted that the BPR is different to the tank safety factor (SF) and is defined as the ratio of
to the maximum allowable pressure during the fuelling
= 87.5 MPa. Hence, the SF for a CFRP overwrapped 70 MPa tank with
= 157.5 MPa would be SF = 157.5 MPa/87.5 MPa = 1.8. There are discussions at UN ECE GTR#13 IWG SGS on the reduction of this burst pressure ratio from BPR = 2.25 to BPR = 2.00. This is only the minimum requirement and any higher value is accepted, especially if the safety, and not only the availability of carbon fibre is at stake, e.g., BPR = 2.5, which is quite common. To the best of the authors’ knowledge, the effect of the BPR on the FRR of tanks has not been studied and published.
The original tank failure in a fire mechanism suggested at Ulster University has been proven to work well in predicting the tank’s FRR. For the entire tank wall thickness,
, withstanding 157.5 MPa, only its fraction of 1/2.25 = 0.44 is sufficient to withstand NWP = 70 MPa. The remainder of the fraction 1 − 0.44 = 0.56 would be as called here “load+”, which can be thermally decomposed by heat flux from a fire without tank rupture (thus reducing burst pressure ratio to BPR = 1). If the tank pressure increases above NWP = 70 MPa, e.g., due to increasing temperature because of heat transfer from a fire, the
increases proportionally and thus, the “load+” fraction decreases. Thus, for instance, for the tank of NWP = 70 MPa and current pressure,
= 70 MPa too, the load-bearing wall fraction will be as
=
/(NWP × BPR) = 70 MPa/(70 MPa × 2.25) = 0.44. The higher the current pressure in the tank is,
, the thinner the fraction “load+” is and the faster it will degrade, causing tank rupture. If the tank pressure decreases, e.g., due to blowdown in a fire through TPRD,
will decrease respectively. It will allow for more heat transfer through the tank wall and for a longer time, with subsequent liner melting. This is the mechanism behind the “no rupture but a leak” of tanks in fire tests with lower pressure compared to the NWP initial hydrogen pressure in a tank observed experimentally in [
4,
6].
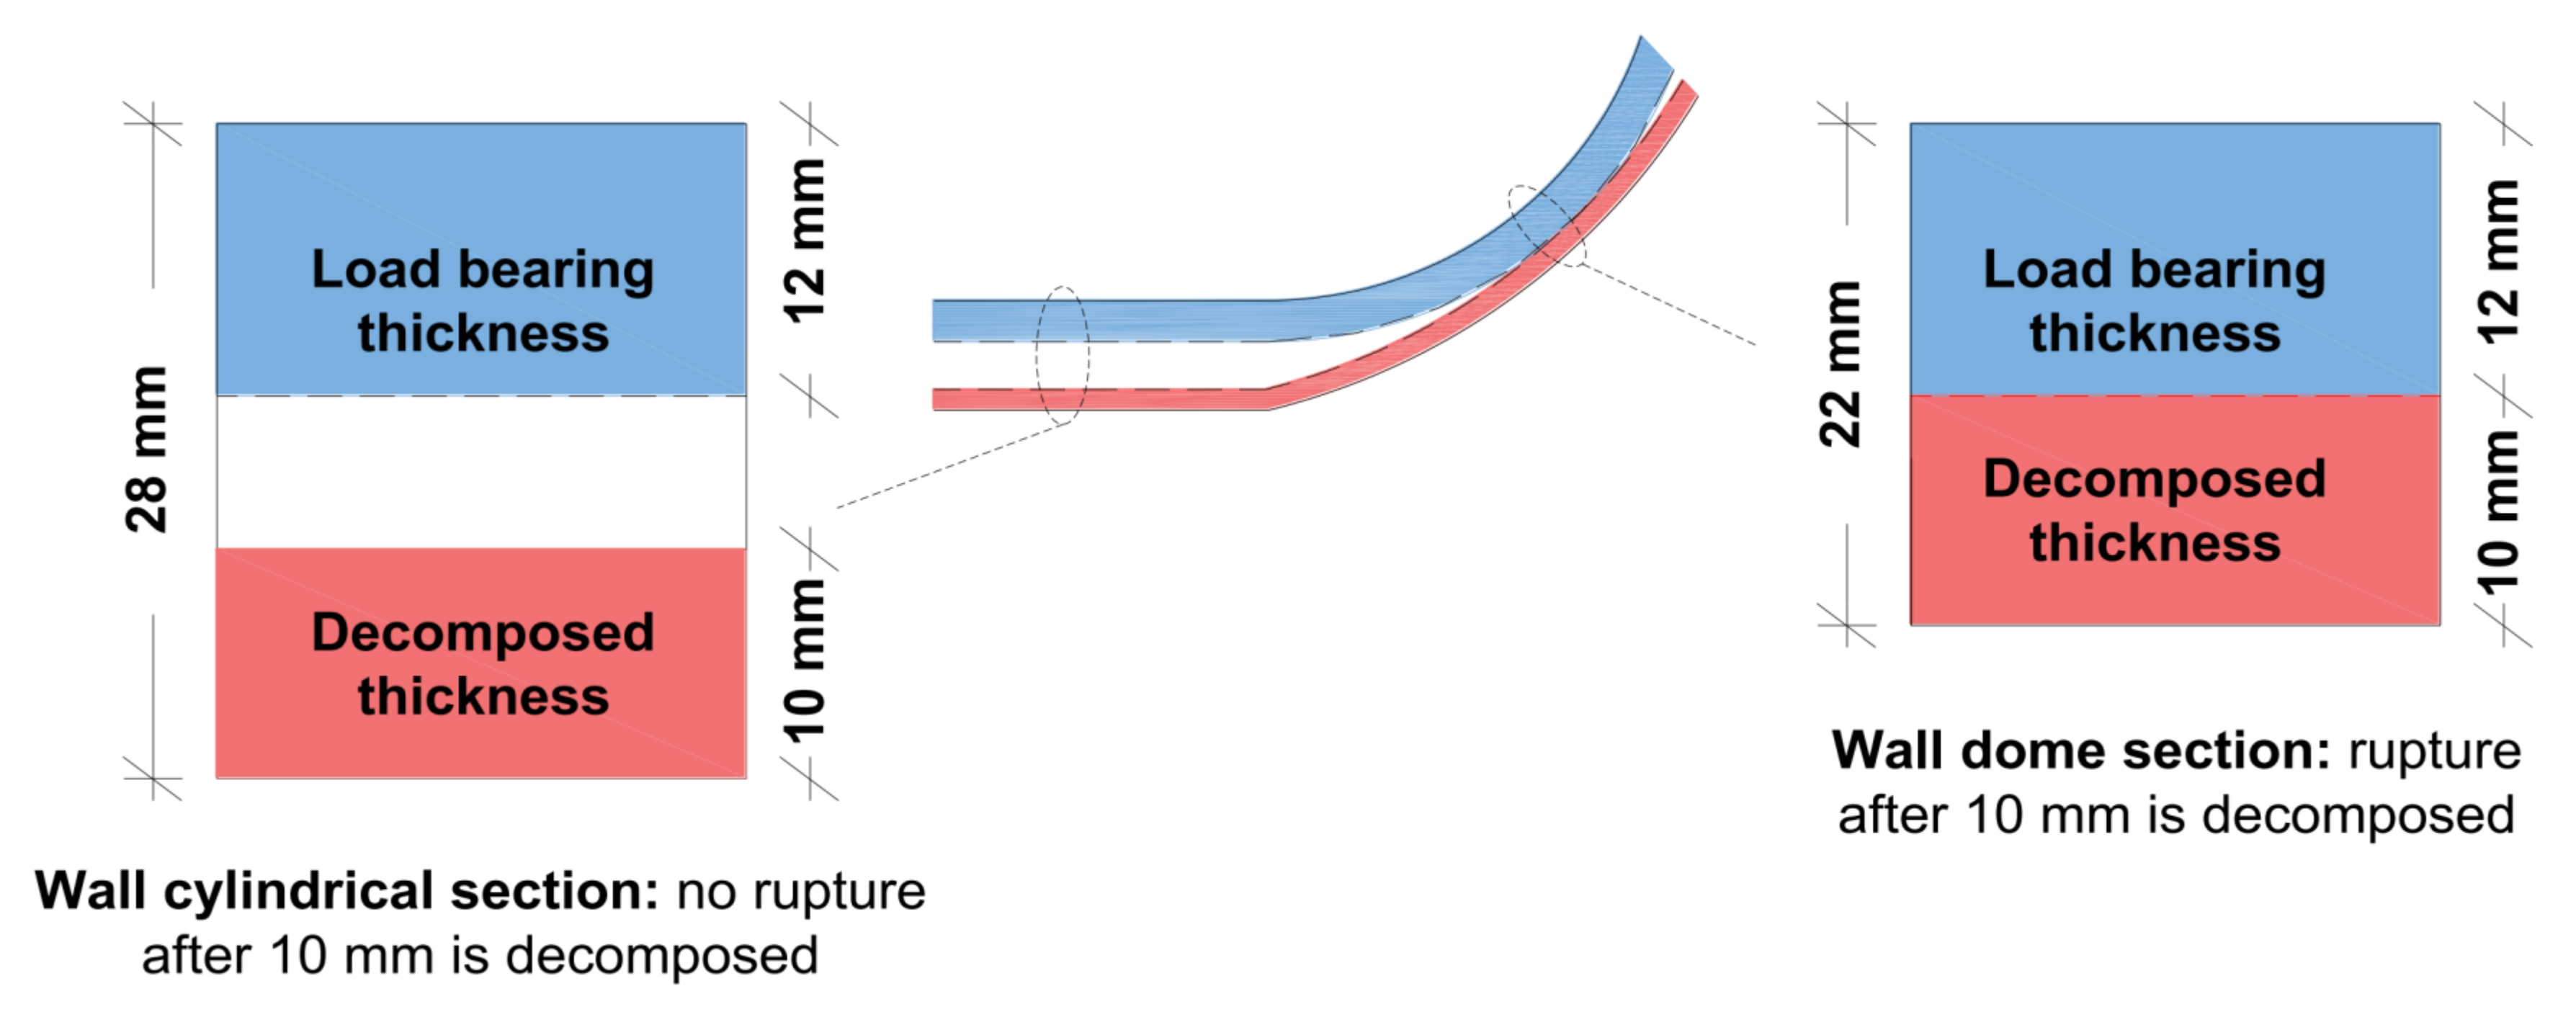
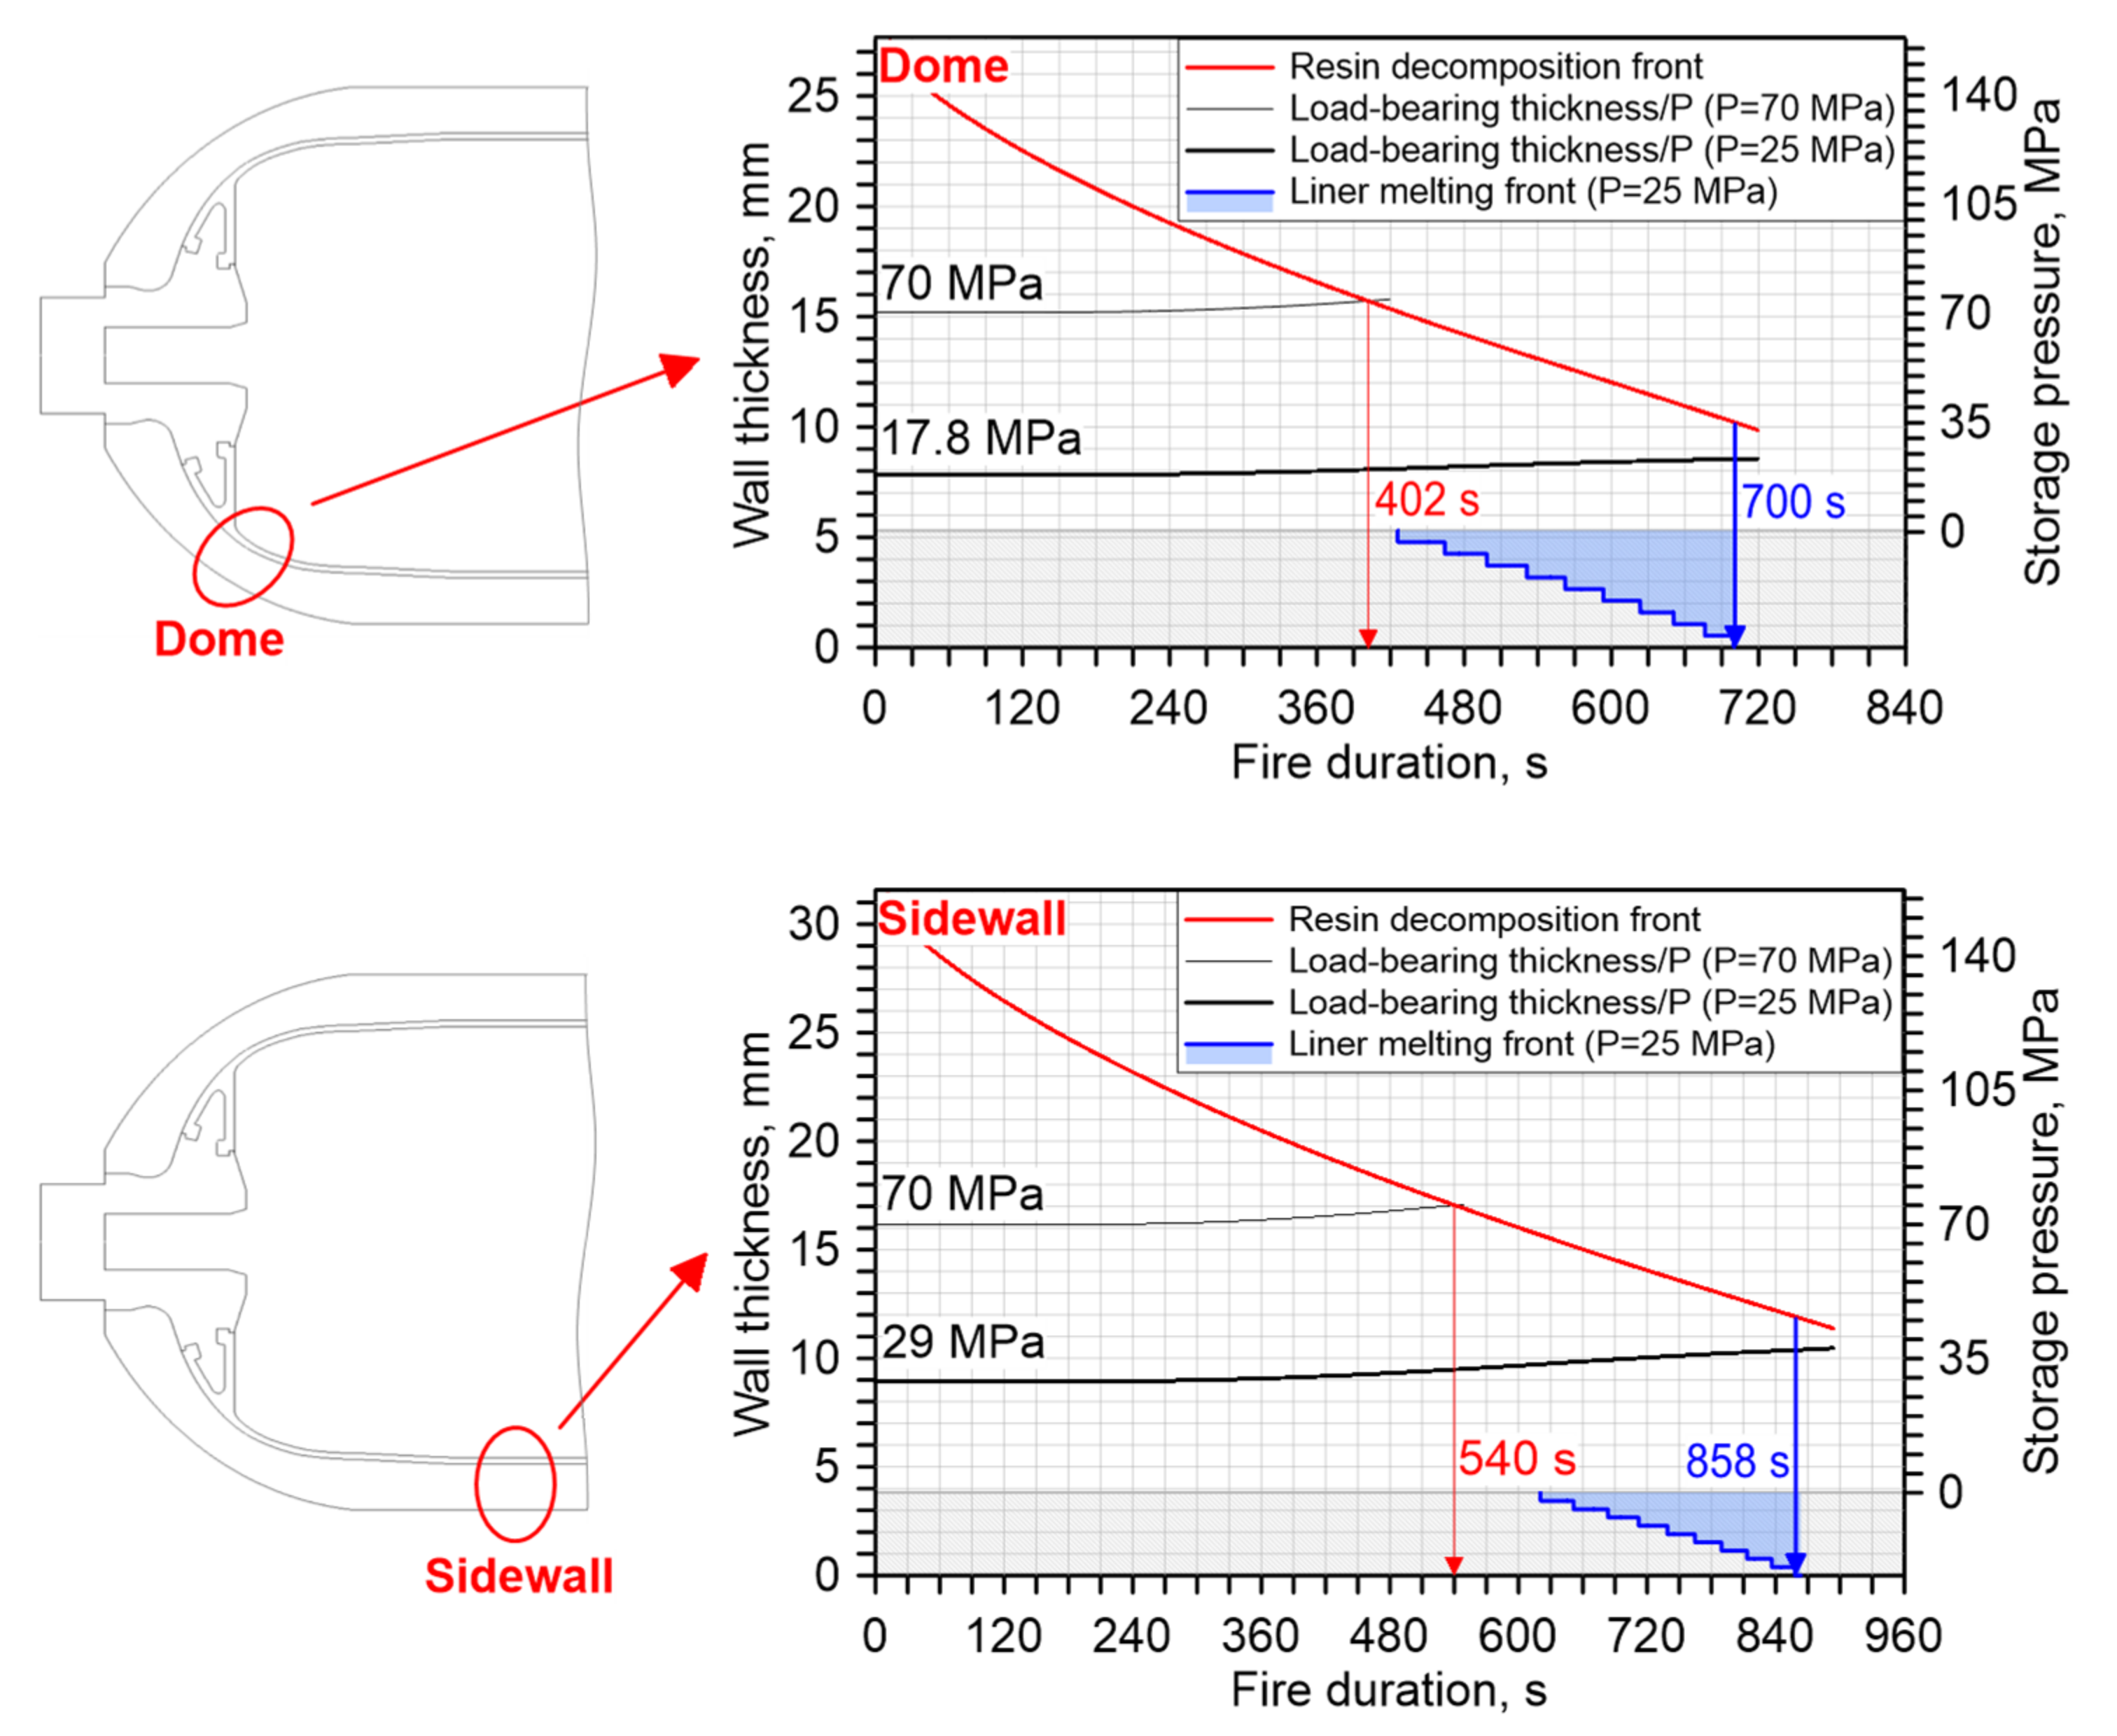
The above-described tank failure in a fire mechanism implies that a tank with a varying wall thickness will rupture when it loses the load-bearing ability in the thinnest wall location, which is usually the dome area. The wall thickness non-uniformity issue in the state-of-the-art designs of composite hydrogen tanks was raised by the authors previously. Composite-overwrapped tanks are usually manufactured by the filament winding process. During the winding process, a combination of helical and hoop layers in the cylindrical/sidewall region usually provides a thicker wall. The thinnest regions, mostly wound as helical layers, are the domes, especially midways between the cylindrical part end and the boss neck. These thinnest regions nevertheless are sufficient to provide mechanical strength to the tank up to
, which it is designed for. Due to the reduced thickness, the dome is more vulnerable to a fire. The tank’s FRR will be defined by resin thermal degradation and the composite failure in the dome region rather than in the sidewall [
5,
12].
Figure 2 schematically demonstrates the tank composite overwrap performance in a fire in the sidewall (left) and the dome (right) regions at the same moment.
The manufacturers focus mainly on the mechanical strength of the composite overwrap, rather than its thermal performance in a fire. Carbon fibres would either be the last component of the composite to degrade thermally in a fire or would be not degraded at all, as noted in the experimental study [
4]. The worst-case scenario of tank rupture may occur due to TPRD malfunction or a localised fire when TPRD is not affected. The loss of the composite overwrap’s strength will be determined by the resin degradation, as per the above-described tank failure in a fire mechanism [
5,
12]. The speed of the resin decomposition front in-depth progression is affected by the heat flux from the fire to the tank surface, resin decomposition temperature range,
, the heat of decomposition,
, etc. Variations of these parameters affect the tank FRR.
Data on the
of the resins found elsewhere shows that these usually range within 300–400 °C (573–673 K). The relatively low decomposition temperatures can be 592 K, as per 10% of mass loss, as obtained by the thermogravimetric analysis [
13]. In [
14] it was stated that the first stage of decomposition (resin oxidative decomposition) occurs between 496–730 K. The resin
published in [
15,
16] are 623 K and 633 K respectively. Paper [
17] provides data on
varying 569–639 K. Some applications have epoxy resins with
= 713 K [
18]. In paper [
19], the
of the epoxy resins in composites with polypropylene content were analysed;
varied 553–648 K. The work [
20] provides
= 647 K. In our study we shall investigate the effect of resin
on the tank FRR, using the values that are close to or within the above-reviewed ranges of 554–683 K [
21] and 643–653 K [
17,
20].
The resin
varies depending on the literature source. For instance, study [
22] recommends
= 3.50
10
5 J/kg. Another differential scanning calorimetry study [
21] of CFRP in a nitrogen atmosphere helped to “isolate” resin decomposition from carbon with two peaks at 652 K and 810 K respectively. The first temperature peak agrees with most of those met in literature values of
, where the mass loss is the highest, and where we assume the mechanical strength of the composite was lost (due to the loss of fibres’ bonding). The second peak agrees well with that mentioned in another study temperature measurement (813 K) [
23] when the resin is degraded completely. The cumulative for these two stages
= 3.48
10
4 J/kg + 3.04
10
4 J/kg = 6.52
10
4 J/kg.
This study aims to investigate the effect of the state of charge (SoC), burst pressure ratio (BPR) and thermal properties of a resin in a composite tank overwrap, i.e.,
and
, on tank FRR. The issue of the tank wall thickness non-uniformity on FRR is addressed also. The study will be performed using the validated non-adiabatic blowdown in a fire model [
5,
12].
2. The Model and Parameters of Studied Tanks
The non-adiabatic blowdown in a fire model, including the mechanism of a composite hydrogen tank failure in a fire, is described in detail in [
5,
12]. The under-expanded jet theory is used to describe this model. It was developed further and included the tank performance in fire conditions. The thermal degrading of the resin in a composite and the melting of the liner due to the unsteady heat transfer from the surroundings through the tank wall and liner are accounted for. The blowdown experiment and destructive fire test for a tank with no TPRD were used to validate the model. The thermal characteristics of hydrogen and tank materials, heat flow from a fire to the tank, diameter of TPRD that the tank is equipped with, and the TPRD activation time delay in a fire, are among the model inputs. Experimentally obtained hydrogen temperature and pressure dynamics, depressurization time and tank fire-resistance rating, i.e., time to rupture in a fire (when no TPRD installed), are all correctly reproduced in the model.
Here, the model is applied to simulate the pressure dynamics inside the tank, temperature distribution inside the composite wall, liner, and hydrogen temperature during the fire. The dependence of the FRR as a function of the HRR/A [
5] demonstrates that FRR practically does not change at HRR/A ≥ 1 MW/m
2. The absence of a further decrease in FRR with the increase of HRR/A above 1–2 MW/m
2, which are typical values for gasoline/diesel spill fires, can be explained by the flame length increase above the tank location for this fire test protocol. Hence, the fire with HRR/A = 1 MW/m
2 and corresponding transient heat flux to the tank surface is selected here to study the thermal behaviour of tanks in the fire at different initial pressures below the NWP. The heat flux to the tank
from the fire at a specific heat release rate HRR/A = 1 MW/m
2 was extracted from 3D simulations of the tank in a fire. The heat flux as a function of time used in our simulations is:
= (−11.81
+ 113.97)
[
5]. This heat flux was applied throughout all our simulations for consistency.
Table 1 represents the properties of the investigated three tanks, including thermal decomposition temperature and heat of decomposition.
Table 2 shows the difference in parameters of the three tanks studied in this paper.
It is assumed in our study that all composite overwraps are made of the same CFRP and the liners are the same HDPE in all tanks, to be consistent in comparison to the tests. The initial tank and hydrogen gas temperature are 293.15 K, giving 70 MPa calculated SoC = 99% (it is 100% for hydrogen = 288.15 K at 70 MPa).
3. Effect of Tank SoC on Fire-Resistance Rating
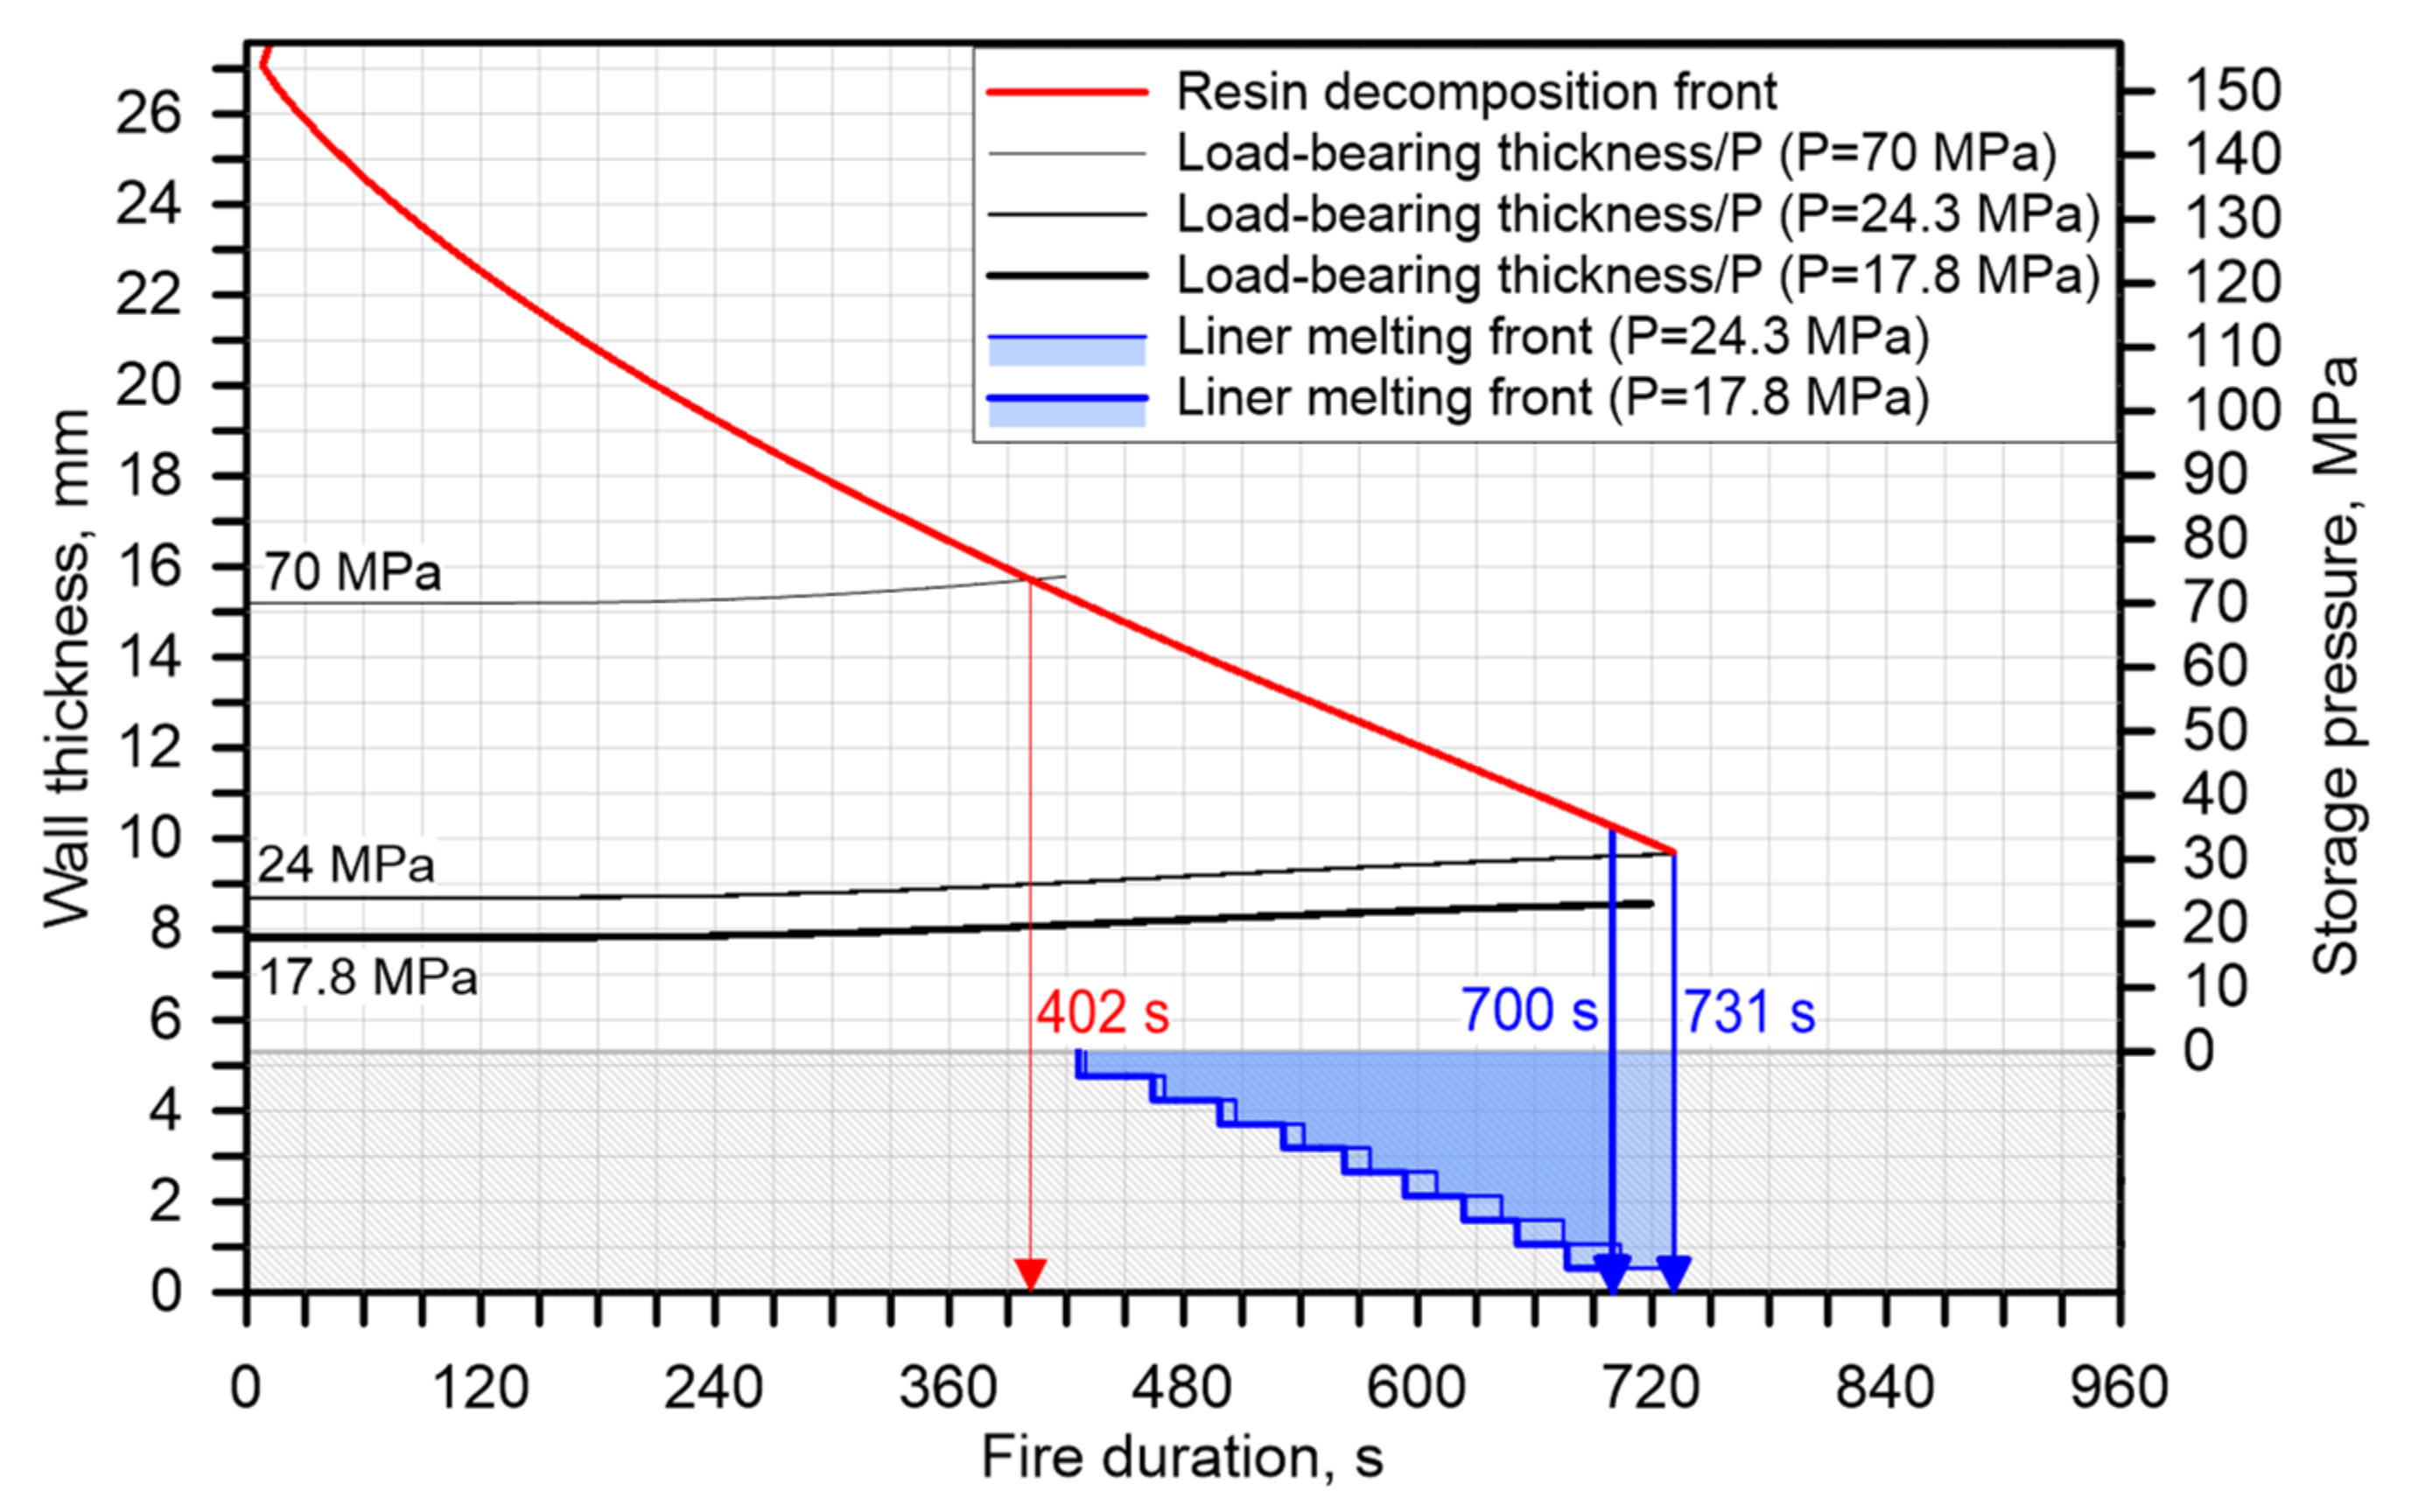
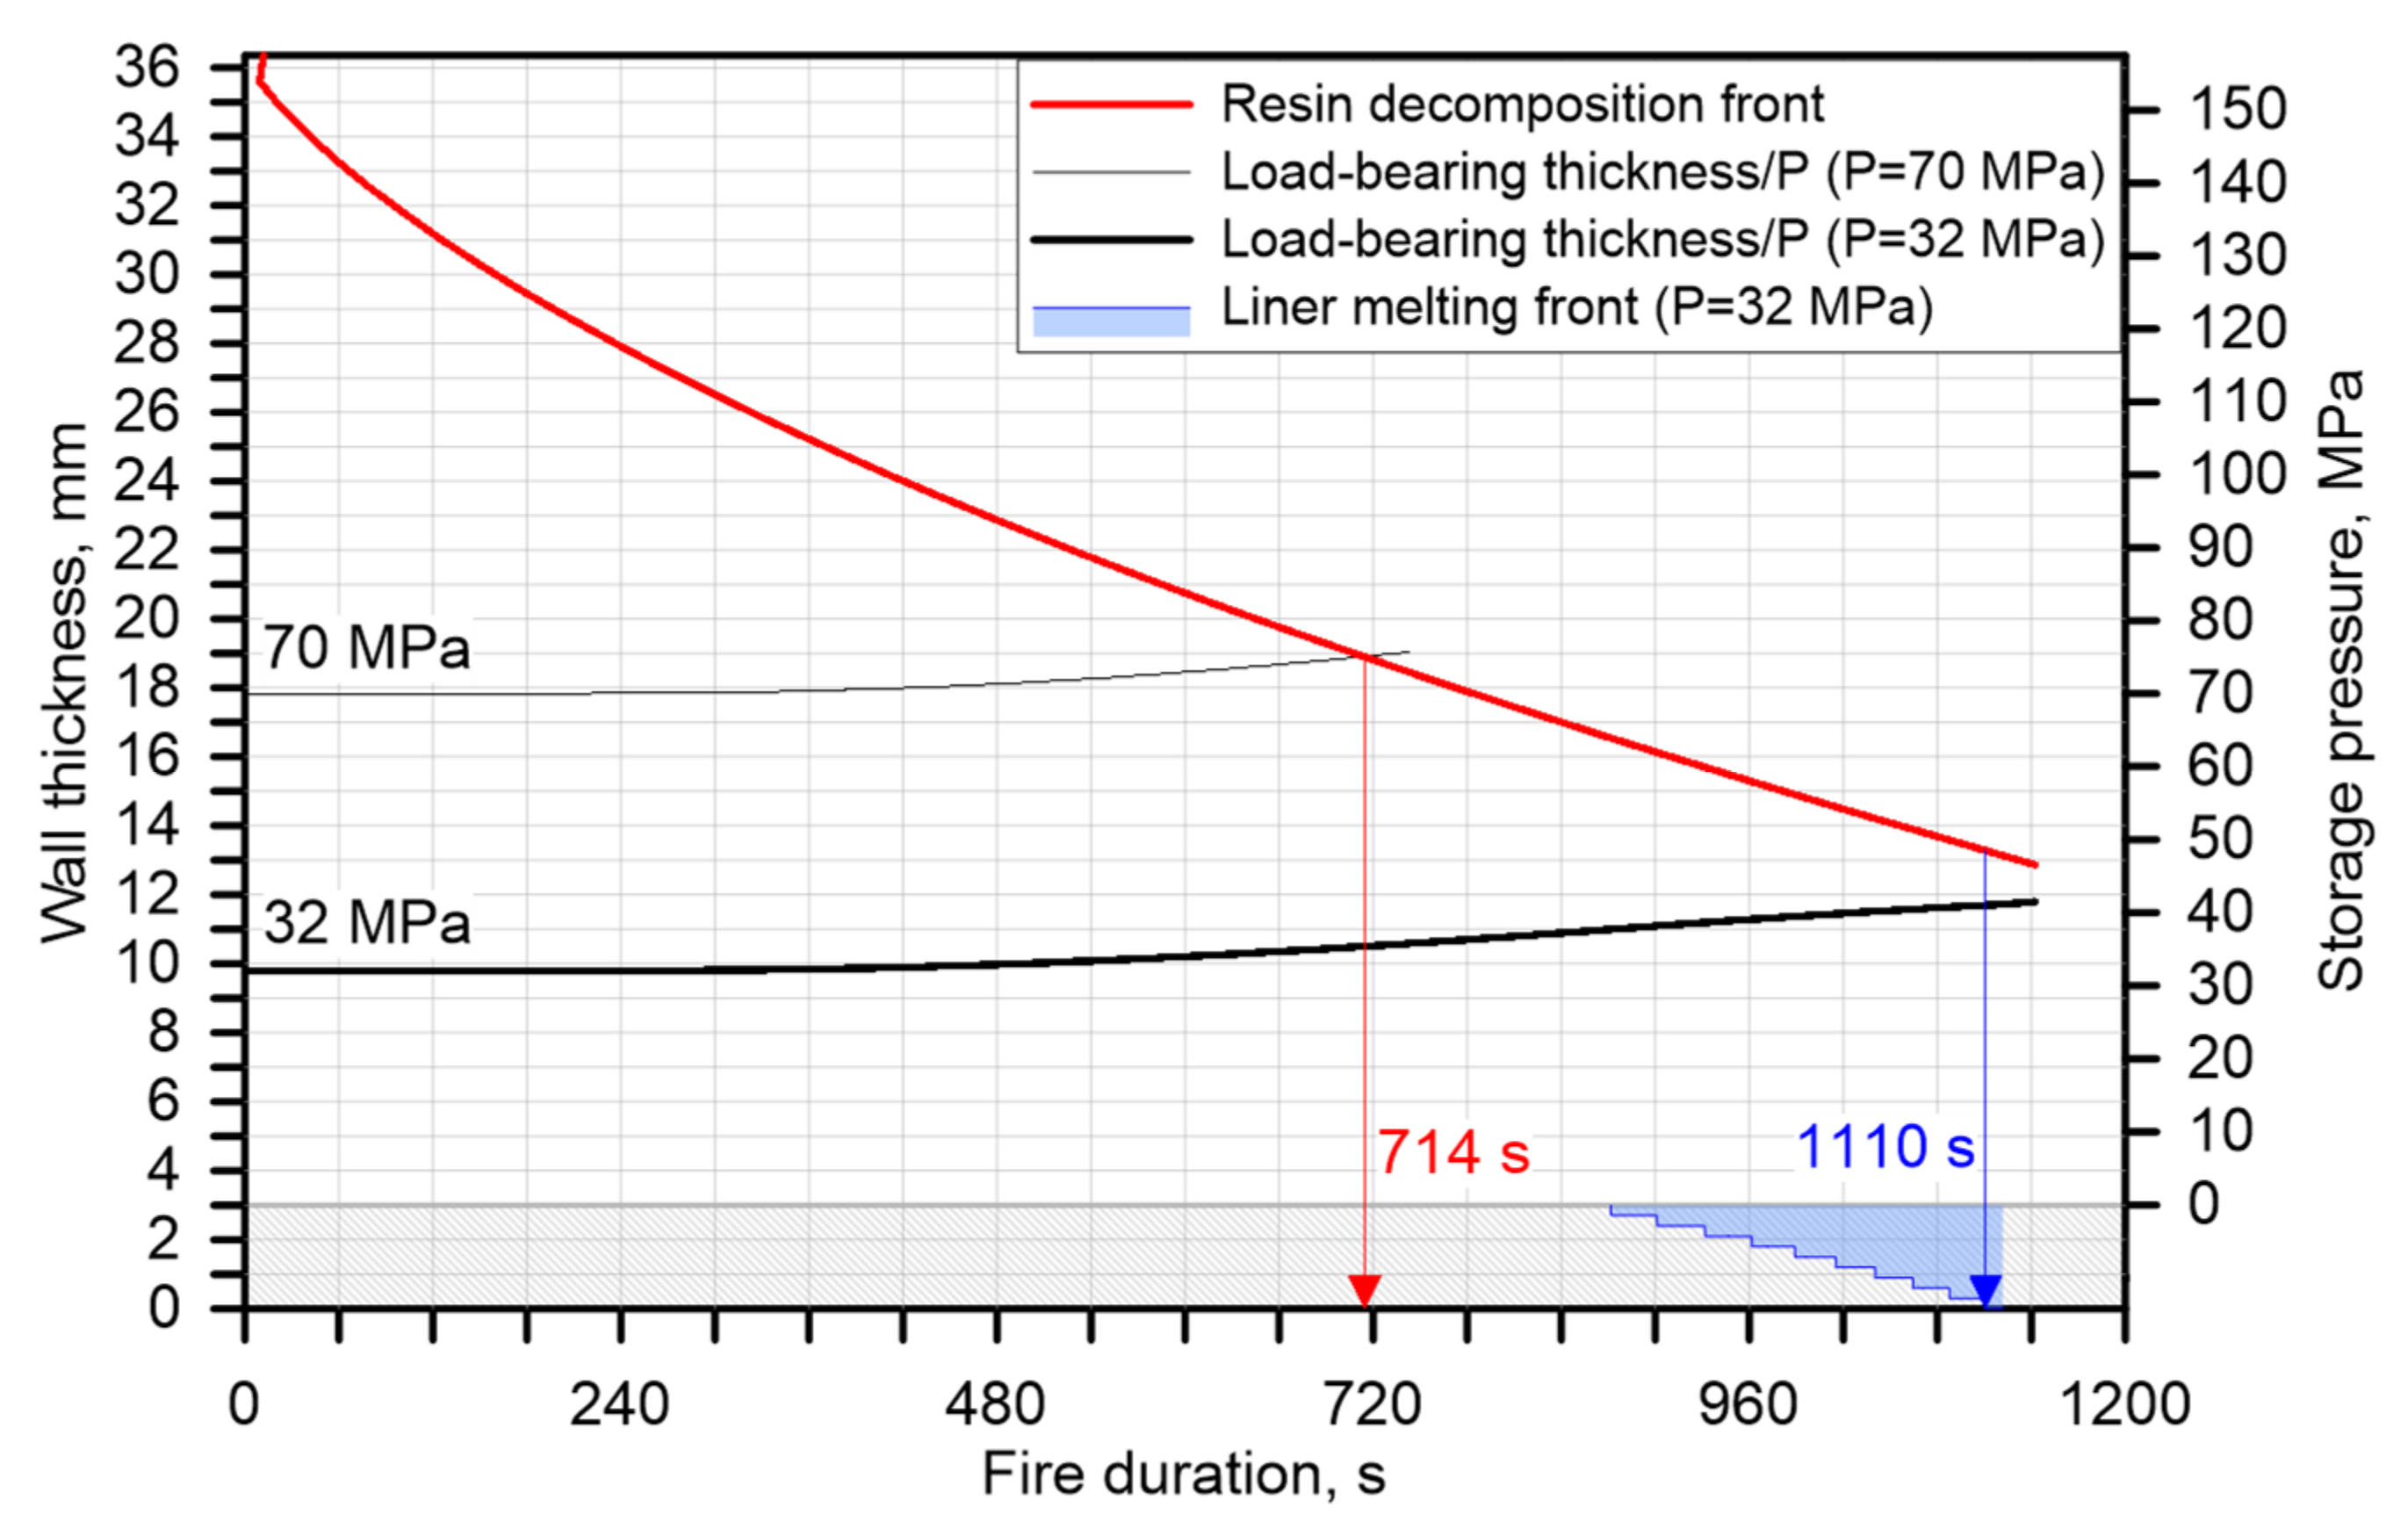
Figure 3 shows the dynamics of the inward propagation of the resin decomposition front and outward propagation of the load-bearing wall thickness fraction for three initial pressures, i.e., NWP = 70 MPa and two reduced initial pressures 24 MPa and 17.8 MPa, in a 36 L volume tank. Therefore, 3 different load-bearing wall thicknesses were obtained, i.e., about 2.6 mm, 3.4 mm and 9.9 mm (excluding liner) for 17.8 MPa, 24 MPa and 70 MPa respectively. The dependence of the load-bearing wall thickness on the tank SoC was described as a part of the tank failure mechanism in the Introduction. The simulations show that for the initial pressure equal to NWP = 70 MPa, the tank ruptures after 402 s in the fire (when the two fronts meet).
The decrease in pressure to 17.8 MPa (in NWP = 70 MPa, 36 L tank), the same as in the experiment [
4], excludes the tank rupture in the fire due to melting of the liner after 700 s. Instead, the hydrogen leakage through the wall would be initiated (see
Figure 3). The tank’s SoC = 32.6% was calculated as follows. Hydrogen density at NWP = 70 MPa and
= 15 °C (288.15 K) is
= 40.54 kg/m
3 (calculated by Abel-Noble equation of state for real gas). Hydrogen density at 17.8 MPa and
= 20 °C (293.15 K) is
= 13.22 kg/m
3. For 17.8 MPa we obtain SoC = [13.22 kg/m
3/40.54 kg/m
3] × 100% = 32.6%. It should be underlined that the ratio of initial pressure to NWP is less, i.e., 17.8/70 × 100% = 25.4%.
The simulated 70 MPa tank with the initial pressure of 17.8 MPa in the fire with no rupture but leakage, is the accurate reproduction of the result observed in fire tests with the same tanks at an initial pressure of 17.8 MPa [
4]. Afterwards, in the simulation, we increase the pressure to the maximum upper bound value, above which the tank will rupture. The initial pressure of 24 MPa (SoC = 42.5%) was found to be “on the border” between rupture and leak and this is very close to the experimental value of 25 MPa [
6] (only 4% difference), where the leak without burst was observed. It is seen that with the decrease in the tank SoC, the “load plus” thickness (everything above the load-bearing wall thickness black curves), enabling for a longer time for the resin decomposition front to travel and therefore, increasing the tank FRR or allowing for the liner to melt and provide leak initiation.
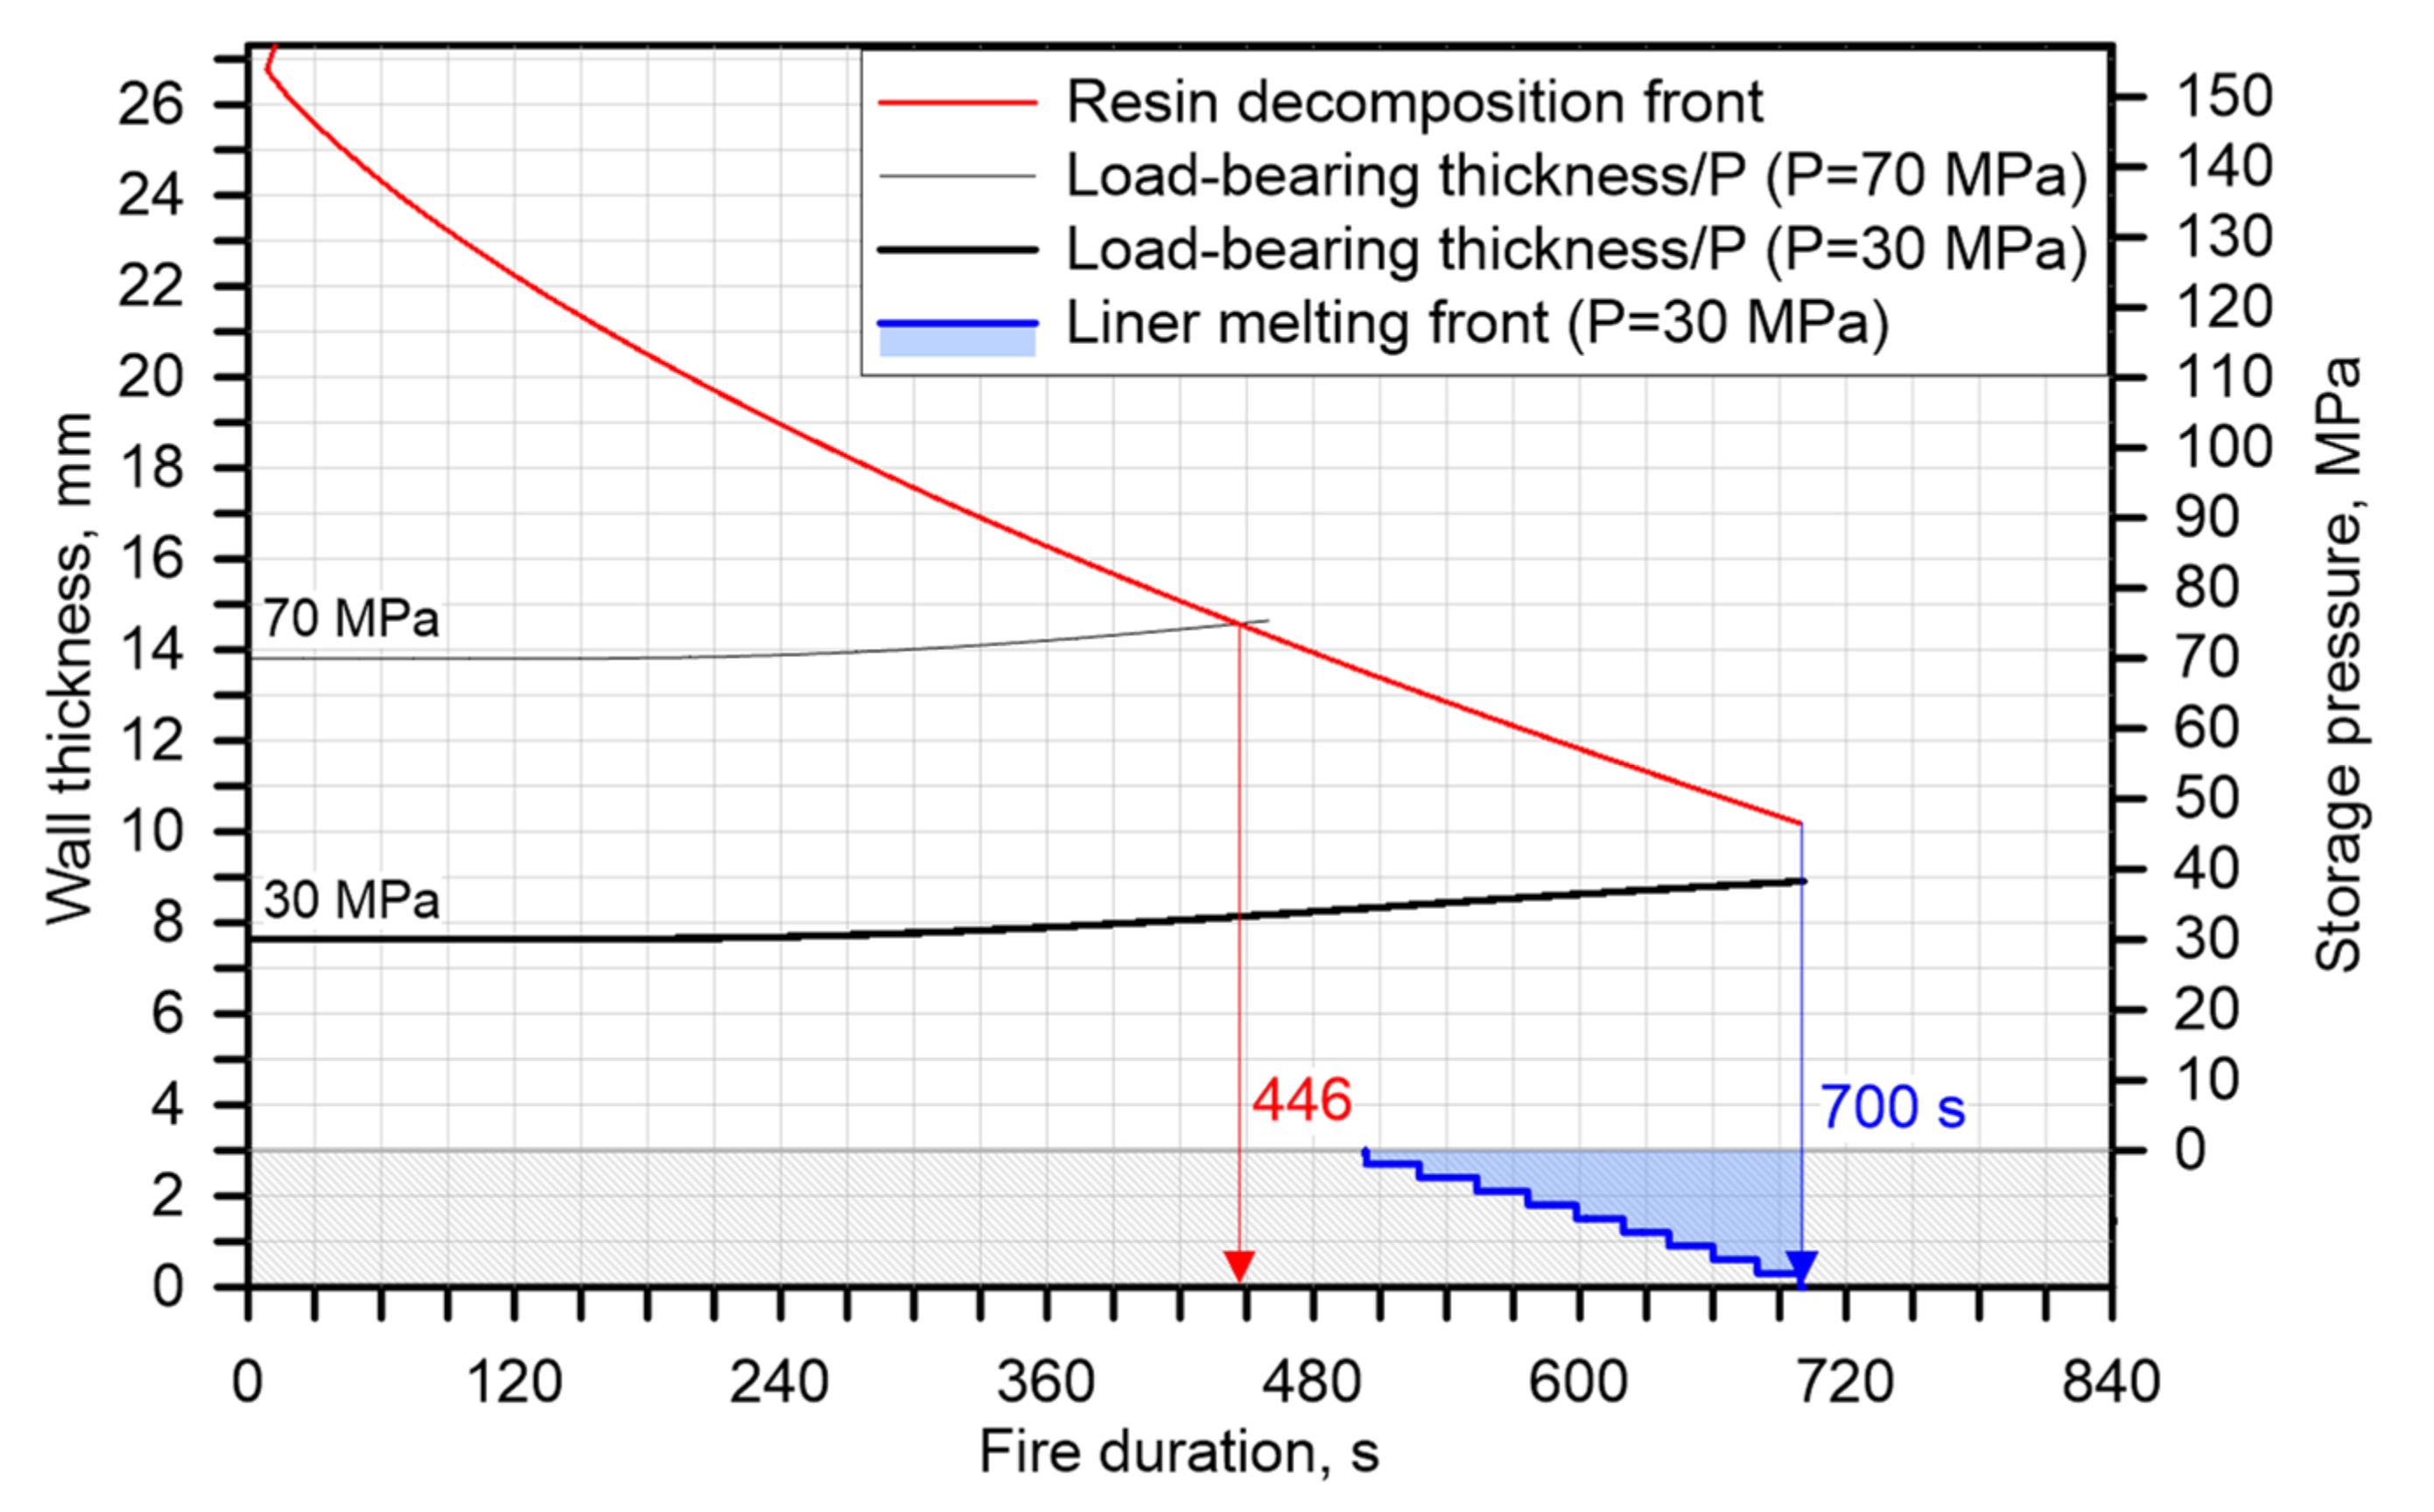
The performance of the 62.4 L tank at 70 MPa (rupture) and 30 MPa (no rupture) is shown in
Figure 4.
Figure 4 demonstrates that the 62.4 L, NWP = 70 MPa tank will not rupture in the fire if hydrogen pressure inside the tank is 30 MPa (SoC = 51%). This is believed to happen due to the increased wall thickness for the tank of a bigger volume, and the thinner liner, making it melting faster.
The performance of the 244 L, NWP = 70 MPa tank at pressure 70 MPa (rupture) and 32 MPa (no rupture) is shown in
Figure 5.
Figure 5 shows an effect similar to the 62.4 L tank trend, but the initial hydrogen pressure sufficient for leak and rupture prevention is slightly higher, i.e., 32 MPa (SoC = 54%), as the composite is thicker in the 244 L tank.
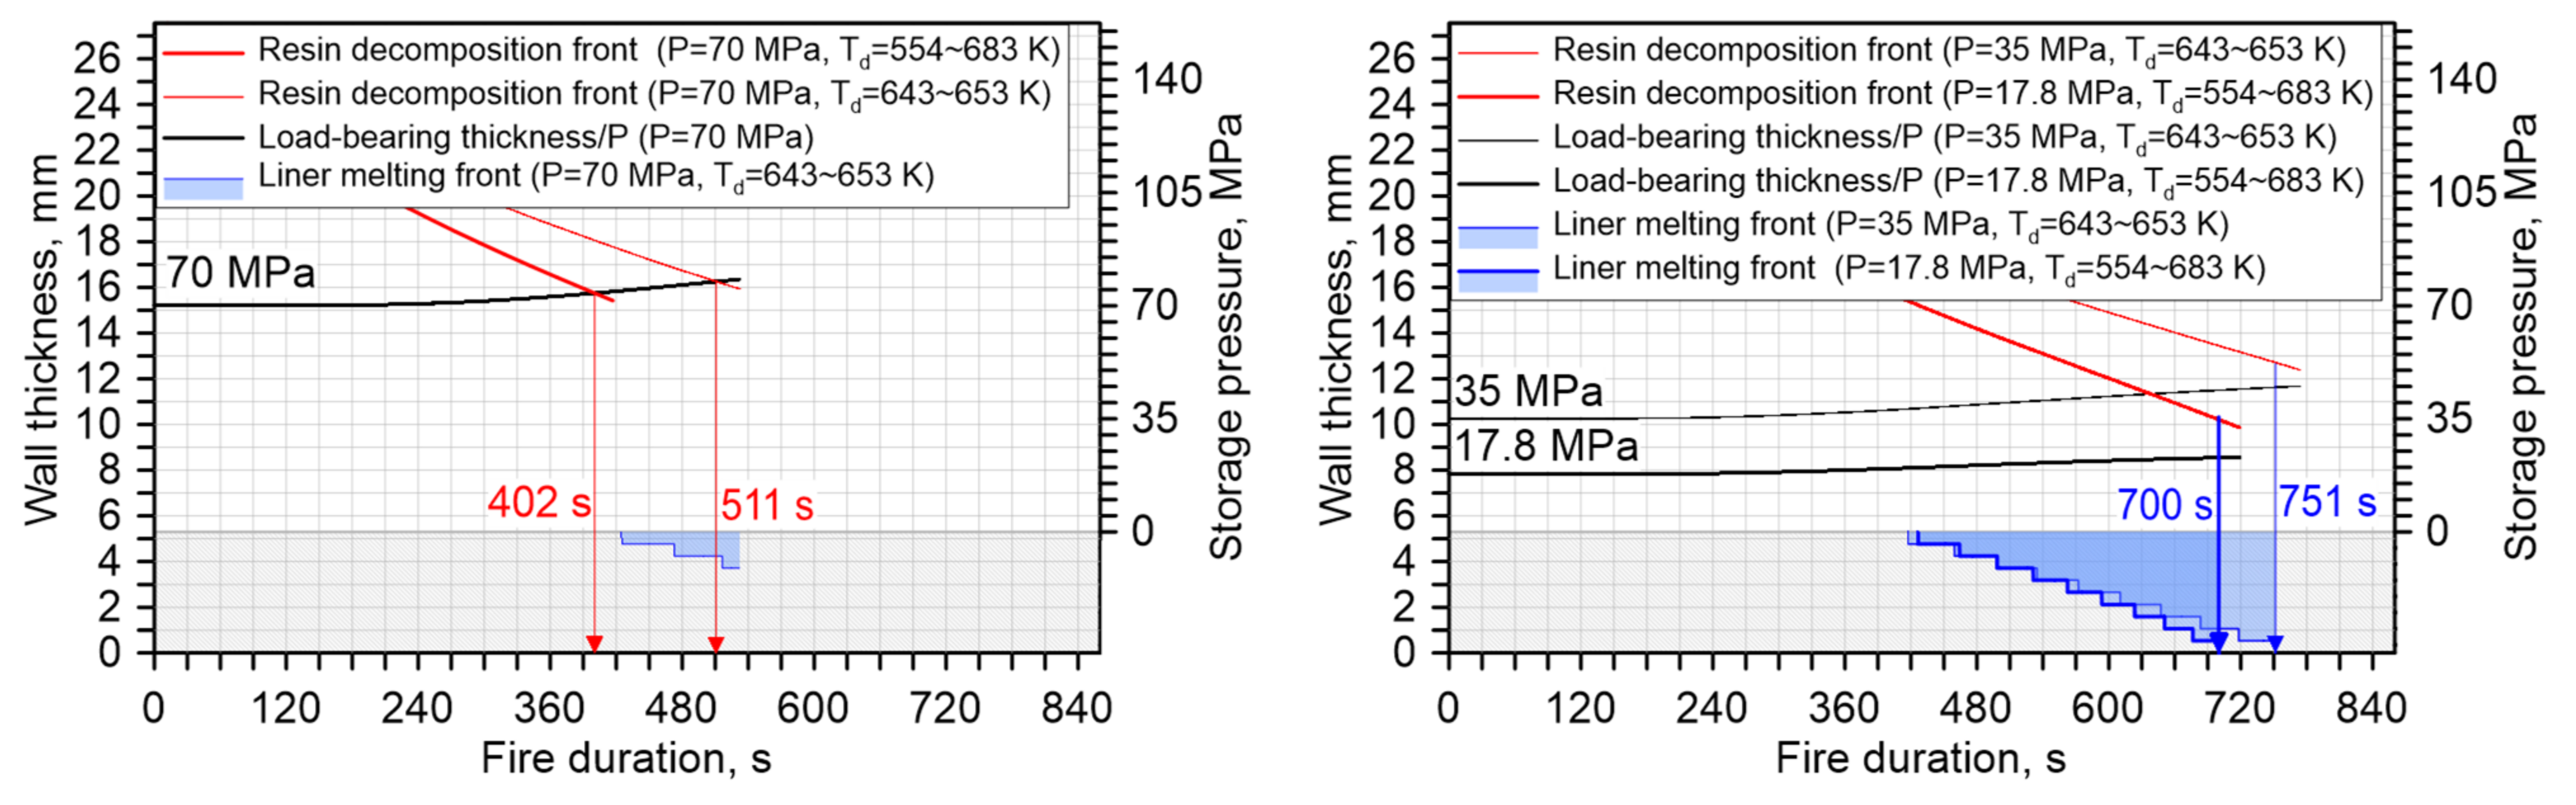
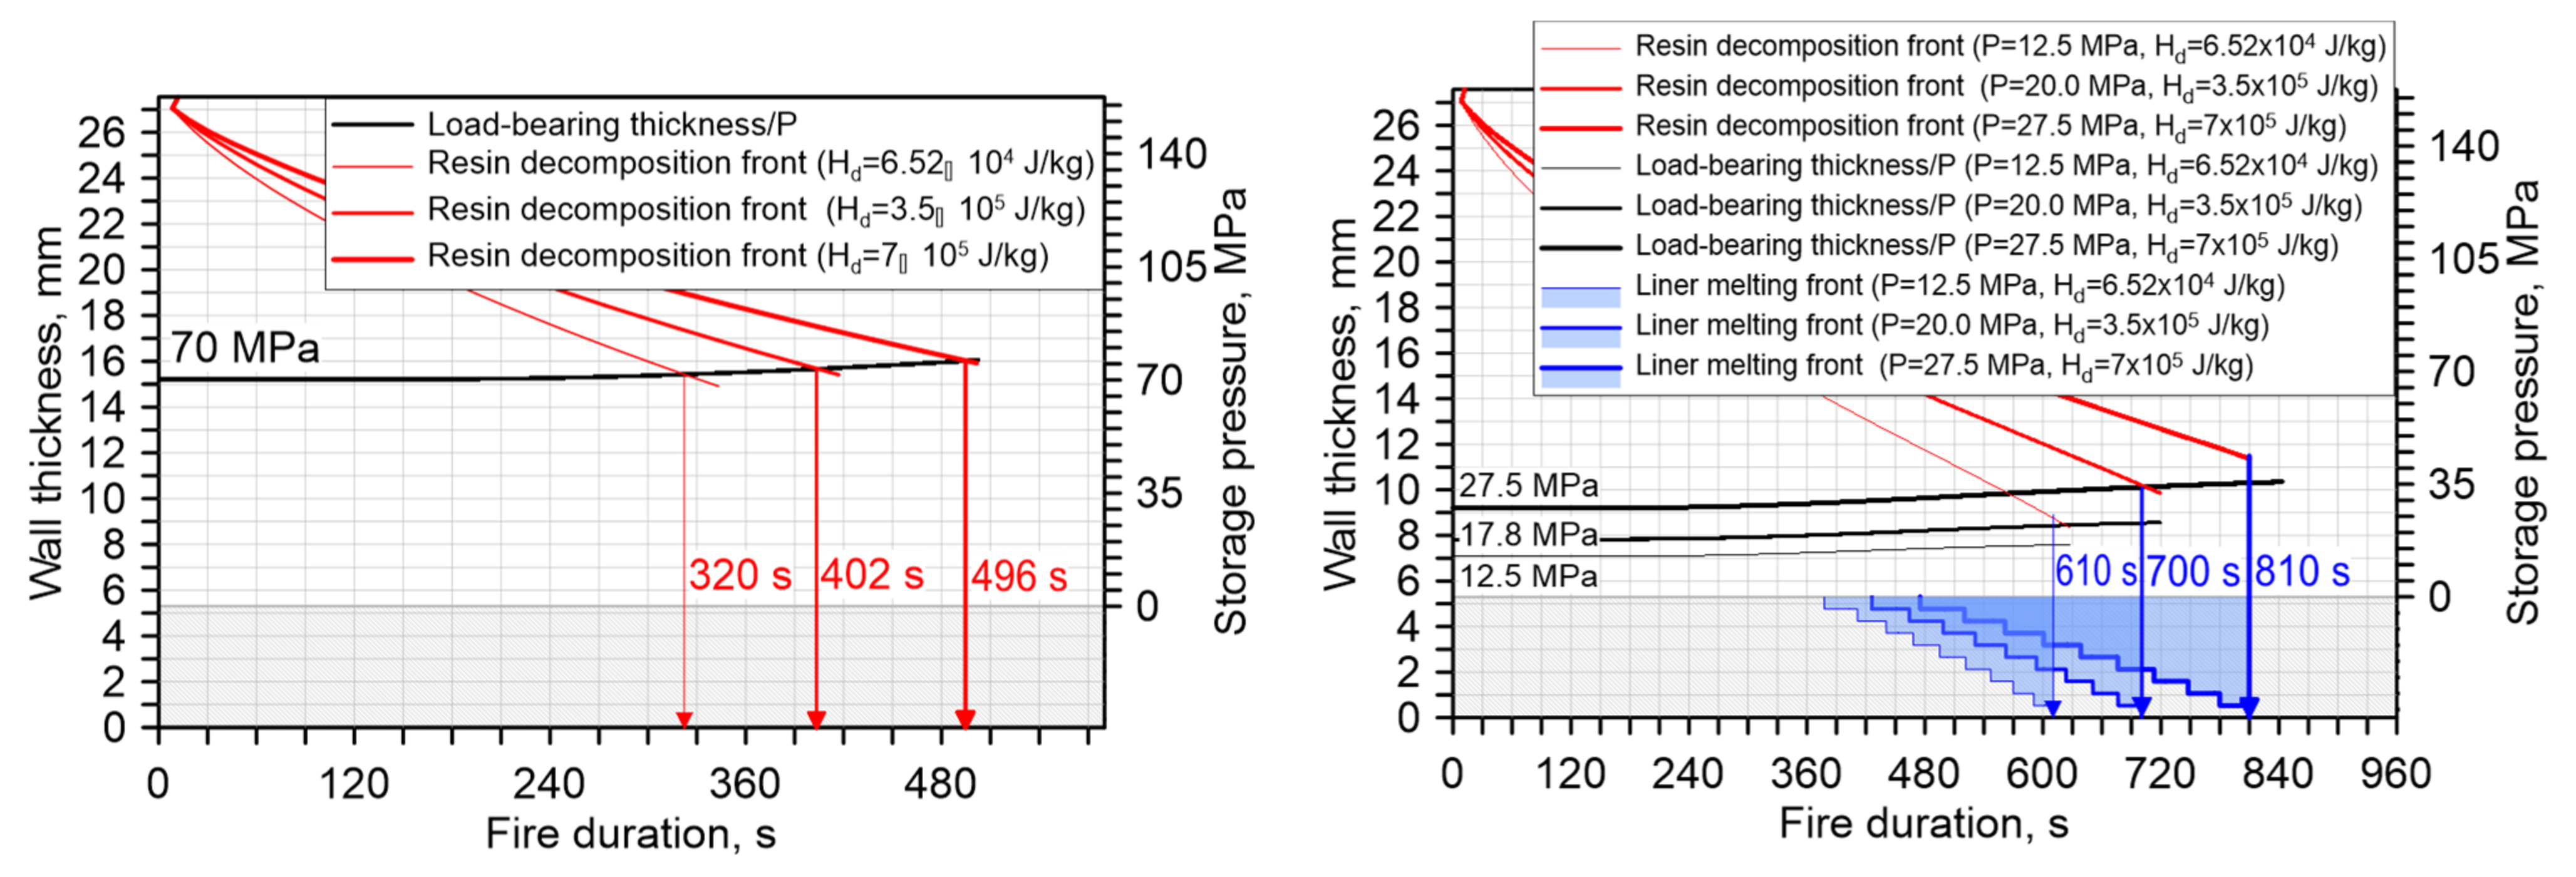
6. Effect of Resin Thermal Properties, and , on the FRR
According to our tank failure mechanism, the fraction of the composite wall thickness, e.g., a layer, becomes non-load-bearing after the resin decomposition front reaches this layer and passes it. The resin decomposition front is described by the resin decomposition temperature range between and and the resin heat of decomposition, , energy consumed to decompose the resin polymer when the temperature in the layer is within ≥ and ≤ . Let us study how the parameters of resin in composite, such as and , affect the resin decomposition front propagation and hence the tank FRR.
First, we shall fix
= 3.5 × 10
5 J/kg and change the decomposition temperature ranges to see the effect of
on the FRR. Let us take
range as 554–683 K (as in all previous simulations) and a higher one of 643–653 K (initial
increased by 89 K), as per references in
Table 1. We shall look at FRR for 36 L at NWP = 70 MPa and lower pressures sufficient to make the liner melt and prevent tank rupture (see
Figure 8).
Figure 8 left demonstrates that a higher
(by 16%) increases the tank FRR from 402 s (6 min 42 s) to 511 s (8 min 31 s), i.e., by 27%. It also allows prevents tank rupture by melting the liner at a significantly higher hydrogen pressure inside the tank of 35 MPa (SoC = 58%) instead of 17.8 MPa (SoC = 32.6%), as shown in
Figure 8 right.
Figure 9 shows the effect of three different
on tank FRR at the fixed
range 554–683 K.
The increase in the resin
increases the tank FRR (
Figure 9 left). For instance, the previously used 3.5
10
5 J/kg compared to hypothetical value 7
10
5 J/kg (100% increase) raises the tank FRR to 496 s (8 min 16 s), i.e., by 23%. In this respect, we see that doubling of resin
gives a relatively small FRR increase. It can be concluded that the effect of
is stronger compared to
resulting in an increase of FRR with
(27% and 16% respectively).
Figure 9 right shows that the higher the resin
is, the higher the upper limit of pressure inside the tank, which prevents tank rupture due to the liner melting, i.e., 12.5 MPa (SoC = 24%), 17.8 MPa (SoC = 32.6%) and 27.5 MPa (SoC = 48%).
7. Conclusions
The effect of 70 MPa Type IV tank SoC on the FRR is studied using a previously validated model of non-adiabatic tank blowdown in fire conditions with our original mechanism of a composite tank failure in a fire. The experimentally observed phenomenon of tank leaking instead of rupture in a fire at initial pressures below about NWP/3 is accurately reproduced in the simulations and underlying physics is discussed. The effect of tank wall non-uniformity on the reduction of the tank FRR is studied. It is concluded that tank manufacturers should address this issue to provide a higher level of life safety and property protection by increasing the FRR. The effect of composite properties such as the resin heat of decomposition, , and a range of decomposition temperature, , as well as the burst pressure ratio (BPR) on the tank FRR is investigated and understood. The FRR increases with the increase of and , yet the effect of is more pronounced. These findings define the originality of this work.
The significance of the study is in the closure of knowledge gaps in understanding a tank performance in a fire at different SoCs, the expansion of the validation domain of the physical model that can reproduce the experimental data. It is demonstrated that the tanks with selected material properties, NWP = 70 MPa and volumes 36 L, 62.4 L and 244 L do not rupture in a fire at SoC = 43% corresponding to hydrogen pressure of 24 MPa, SoC = 51% (30 MPa) and SoC = 54% (32 MPa) respectively. The wall thickness and non-uniformity of the selected industrial 36 L tank demonstrated the difference in FRR of 34%. The increase in the tank FRR by 43% was found for the BPR increase from 2 to 2.5. It was shown that the increase in resin has a stronger effect than on the FRR increase. The avoidance of a catastrophic tank rupture in a fire at a decreased SoC due to melted liner and hydrogen release is only possible for Type IV tanks, and not for Type III tanks, where the liner is metallic. This is a safety advantage of Type IV tanks. The safety “feature” achieved through “no rupture but a leak” phenomenon may open a strand of safety questions to be answered, such as what would be the effect of liner polymer type, e.g., thermoset vs. thermoplastic? How would the leak react in the event of a fire termination, e.g., when a hydrogen-powered car is rapidly towed out of a fire, or even when fire extinction with water is applied? The leak behaviour depending on a fibre and resin in the composite overwrap is also an open question.
The rigour of this study is in the reproduction of the experimentally observed phenomenon of leaking of tanks at hydrogen pressures below about NWP/3, due to the use of referenced thermal parameters in simulations. The numerical tests performed for the industrial 36 L, NWP = 70 MPa tank and the decreased initial pressure of 24 MPa (and below) demonstrated the prevention of tank rupture due to the liner melting and follow-up leakage of hydrogen through the tank wall. This pressure is in line with the experimentally determined pressure of 25 MPa [
6] (4% difference) when the tank leakage was observed instead of rupture. A further pressure decrease to 17.8 MPa, matching with equivalent experimental pressure [
4], also provided the rupture avoidance due to liner melting, as observed in the corresponding experiment [
4] with another fire source. The rigour of the work is also underpinned in the range of studied parameters that affect the FRR. These include the SoC below 100%, including the limits of SoC below which the tanks leak in the fire instead of rupture; the wide range of tanks’ volumes, i.e., 36 L, 62.4 L and 244 L, etc.


