

Aquatic Macroinvertebrates as Bioindicators of Water Quality: A Study of an Ecosystem Regulation Service in a Tropical River


School of Sciences and Technology, Environmental Sciences Program, Ana G. Méndez University, Gurabo Campus, P.O. Box 3030, Gurabo, PR 00778-3030, USA
*
Author to whom correspondence should be addressed.
Ecologies 2023, 4(2), 209-228; https://doi.org/10.3390/ecologies4020015
Submission received: 2 March 2023
/
Revised: 17 March 2023
/
Accepted: 20 March 2023
/
Published: 23 March 2023
(This article belongs to the Special Issue The Ecology of Rivers, Floodplains and Oxbow Lakes)
Abstract
:In this study, aquatic macroinvertebrates were used as bioindicators to determine the ecological conditions of the Lapa River, located between the municipalities of Cayey and Salinas, Puerto Rico. The water quality of the river was evaluated through the calculation of the Puerto Rico Biological Monitoring Working Party (BMWP-PR), as well as its degree of contamination using the Puerto Rico Family Biotic Index (FBI-PR). Bimonthly sampling was conducted across four sampling sites for a period of 12 months. The sampling sites were positioned upstream and downstream within the nature reserve, and outside and downstream its borders. The BMWP-PR results showed that the site upstream-inside the nature reserve had good water quality, and the site downstream-inside the nature reserve had regular water quality, showing some areas with eutrophication. The water quality outside-downstream from the nature reserve was poor. The FBI-PR results showed that there was mild organic contamination inside the nature reserve, while there was substantial organic contamination in the site that was outside-downstream from the nature reserve. We concluded that the section of the river located within the nature reserve had better ecological conditions than the stretch of the river located outside-downstream of the nature reserve, because it is located within a protected area that has barely been impacted by human activity.
1. Introduction
Rivers are natural freshwater streams that flow into other rivers, lakes, or the sea [1]. River ecosystems benefit society in multiple ways, such as by providing water and food, acting in climate regulation, and serving as recreational spaces. Ecosystem services are the benefits that ecosystems provide to human beings. These benefits are classified into four categories: provisioning, regulating, cultural, and supporting services [2]. Provisioning ecosystem services refers to those benefits obtained by humans to maintain their livelihoods, such as water and food [3], while regulating ecosystem services include benefits related to climate regulation, water quality, and air quality [2,4]. Cultural ecosystem services include benefits such as spaces for recreation, meditation, and inspiration [2,5]. Finally, supporting ecosystem services, which are the basis of all ecosystem services, include soil formation, nutrient cycling, energy processing, and the provision of habitats for species [2,6,7,8].
In rivers, regulating ecosystem services are natural processes, such as the water cycle, sediment, and nutrient movement, that directly and indirectly benefit human well-being [4]. For instance, the water cycle regulates and supports all the processes that move water, nutrients, and organisms across the watershed, linking atmospheric, aquatic, and terrestrial systems [9,10]. These processes help with the functioning and productivity of ecosystems. For example, the Freshwater Information System [FIS] [10] states that rivers provide flood protection by controlling the frequency and magnitude of runoff and flooding through water interception and storage. Water purification is another regulating ecosystem service provided by rivers and streams [11,12]. Sedimentation and filtration are processes that occur in rivers and help purify water [13]. Freshwater plants and some aquatic fauna, including fish and macroinvertebrates, can break down and transform natural materials, pollutants, and multiple anthropogenic stressors in water [10,14,15], thus contributing to water purification [13].
Aquatic macroinvertebrates are invertebrate organisms that are found in most rivers and streams, and are large enough to see with the naked eye [15,16]. Aquatic macroinvertebrate communities reflect the quality of aquatic ecosystems [17]. The greatest diversity of macroinvertebrates is found in clean rivers and streams with well-oxygenated water [16]. In contrast, aquatic ecosystems impacted by local environmental factors, such as contamination or other anthropogenic factors, will have a decreased richness and composition of such organisms [18,19]. Several biomonitoring methodologies have been developed to measure water quality. Macroinvertebrates can be used as indicators of water quality, serving as a very useful and relatively inexpensive tool widely used throughout the world [20].
Researchers have implemented biomonitoring in rivers using indices based on the pollution tolerance of aquatic macroinvertebrates. Rivers and streams with good water quality will show biodiverse aquatic macroinvertebrates and a high number of organisms. The Biological Monitoring Working Party (BMWP) and the Family Biotic Index (FBI) are the most common indices used to evaluate water quality using aquatic macroinvertebrates. The BMWP index uses the presence of taxonomic groups. It is independent of the number of individuals collected, while the FBI uses the relative number of individuals in each sample [17,21,22,23]. Aquatic macroinvertebrates have been used as bioindicators of water quality in many rivers and streams [17,24]. For example, Valbuena and Gualtero [25] evaluated water quality using aquatic macroinvertebrates found at six sampling points at the El Quimbo Hydroelectric Station on the Magdalena River in Colombia. In terms of abundance and taxonomic groups, the authors reported that the most common orders collected at the six sampling points were Diptera, with 33.35% abundance; Ephemeroptera, with 15.81% abundance; Hemiptera, with 11.5% abundance; and Trichoptera, with 6.21% abundance. In terms of the evaluation of water quality, the results of the BMWP index adapted for Colombia (BMWP-C) showed that the river had good water quality according to the six sampling points. In Puerto Rico, aquatic macroinvertebrate biodiversity was studied in a stream of the Río Grande. The study aimed to describe the river’s aquatic fauna, and to evaluate the stream’s water quality. A variety of indices were used to study the biodiversity of the river, including the FBI Index to evaluate water quality. The study reported that the most common orders and families were Trichoptera-Hydroptilidae (26.62%), Coleoptera-Staphylinidae (20.94%), Coleoptera-Elmidae (13.94%), Ephemeroptera-Baetidae (12.95%), Diptera-Simuliidae (7.17%), and Diptera-Chironomidae (6.44%). The FBI index indicates that the river had excellent water quality [26].
Using the same method, Gutiérrez and Ramírez [17] evaluated the water quality of the streams of the Mameyes River, Quebrada Sonadora, Río Piedras-El Señorial, and Canal Sur Capetillo. The authors adapted the FBI and BMWP indices to the Puerto Rican taxa of aquatic macroinvertebrates. The results showed that the organisms from the orders Ephemeroptera (families: Baetidae and Leptophlebiidae), Odonata (family: Libellulidae), Trichoptera (family: Philopotamidae), and Diptera (families: Chironomidae and Simuliidae) were found in most of the streams. The results for the BMWP index showed that the streams of the Mameyes River and Quebrada Sonadora had excellent to good water quality, and that the streams of the Rio Piedras and Canal Sur Capetillo showed regular to bad water quality. The FBI index showed excellent water quality for the Mameyes River, and regular water quality for the streams of the Quebrada Sonadora.
Rivers are aquatic systems that provide invaluable ecosystem services to sustain society. These ecosystems are the main source of freshwater, which is used for human consumption, crop irrigation, and industrial and domestic purposes. Globally, freshwater scarcity is on the rise. Since 2012, the World Economic Forum has included the water crisis as one of the top five risks to the global economy [27]. At a worldwide level, the 2030 Agenda for Sustainable Development, adopted by the United Nations in 2015, established 17 Sustainable Development Goals (SDGs) as “an urgent call to end poverty and hunger, improve health and education, among other goals that include to take action with the climate change, clean water, protect life on land, and conserve the aquatic ecosystems” [28]. Therefore, conservation (the terms “conserve”, “conserving”, and “conservation” mean to use, and the use of, all methods and procedures which are necessary to bring any endangered species or threatened species to the point at which the measures provided pursuant to [the] act are no longer necessary [29]) and preservation (preservation is the act of maintaining natural resources in their complete natural state of rivers and all aquatic ecosystems) are fundamental to ensuring the use of these water resources for future generations and their sustainable development [30,31]. At a local level, in Puerto Rico, the Department of Natural and Environmental Resources [DNER] is responsible for establishing mechanisms to protect rivers, particularly those stretches whose natural characteristics have been conserved or have not been heavily impacted by humans [32]. On 29 October 2014, the 180 Act of 2014 was signed, creating the Puerto Rico Heritage Rivers, Natural High-Value Rivers, and Recreational Rivers Program (Heritage Rivers Program (HRP)) [32]. This program’s mission is to identify and protect rivers or stretches of rivers that have retained their full natural state, have been subjected to minimal human intervention, and have recreational, scenic, cultural, or historical value.
Problem and Objective
The Lapa River is part of the HRP of the DNER. The ecosystem is located in the Planadas-Yeyesa Nature Reserve between the municipalities of Cayey and Salinas, Puerto Rico. The lack of knowledge regarding the ecological conditions and the regulation of ecosystem services offered by the Lapa River is the core problem that prompted this study. The lack of knowledge of the ecological conditions of the river could be a barrier preventing the safe use of this water source for human consumption in the face of increased droughts due to global warming. Similarly, anthropogenic activities, such as farming and septic tanks in residences near the river, could contaminate the ecosystem. This could affect the quality of the water and other resources that could serve as food for the communities near the river, and for citizens in general in the event of future hunger. Studying the river’s ecosystem regulation services and ensuring that they are viable is crucial.
Therefore, our main objective was to evaluate the regulating ecosystem services of the Lapa River inside and downstream of the Planadas-Yeyesa Nature Reserve. The specific objectives were (1) to describe the number of macroinvertebrates detected according to the four sites of the Lapa River (Puerto Rico), analyzing the mean differences among the sampling sites; (2) to determine the water quality of the Lapa River inside and downstream of the Planadas-Yeyesa Nature Reserve through the BMWP of Puerto Rico (BMWP-PR), analyzing the mean differences among the sampling sites; (3) to assess the degree of contamination of the Lapa River inside and downstream of the Planadas-Yeyesa Nature Reserve through the FBI of Puerto Rico (FBI-PR), analyzing the mean differences among the sampling sites; (4) to compare the water quality and degree of contamination of the river and its physicochemical parameters upstream and downstream of the Planadas-Yeyesa Nature Reserve, analyzing the differences among the sampling sites; (5) to estimate the relationship between water quality, contamination, and physicochemical parameters; and (6) to explore the predictive power of water quality, contamination, and physicochemical parameters in the variation of macroinvertebrate families. We hypothesized that there were significant correlations between the ecological conditions of the Lapa River inside and downstream the Planadas-Yeyesa Nature Reserve. We also expected that sites with good water quality would show aquatic macroinvertebrate taxa such as those from the Ephemeroptera, Plecoptera, and Trichoptera orders, which are usually present in healthy streams. In terms of the water quality and the degree of river contamination, we expected there to be significant correlations with the river’s physicochemical parameters.
2. Methodology
We performed ecological evaluations of the Lapa River based on both the BMWP-PR and the FBI-PR. Gutiérrez and Ramírez [17] proposed these indices in their study, Ecological evaluation of streams in Puerto Rico: Major threats and evaluation tools. The guide established by Gutiérrez et al. [33] was used to calculate both indices.
2.1. Site Selection and Sample Collection Methodology
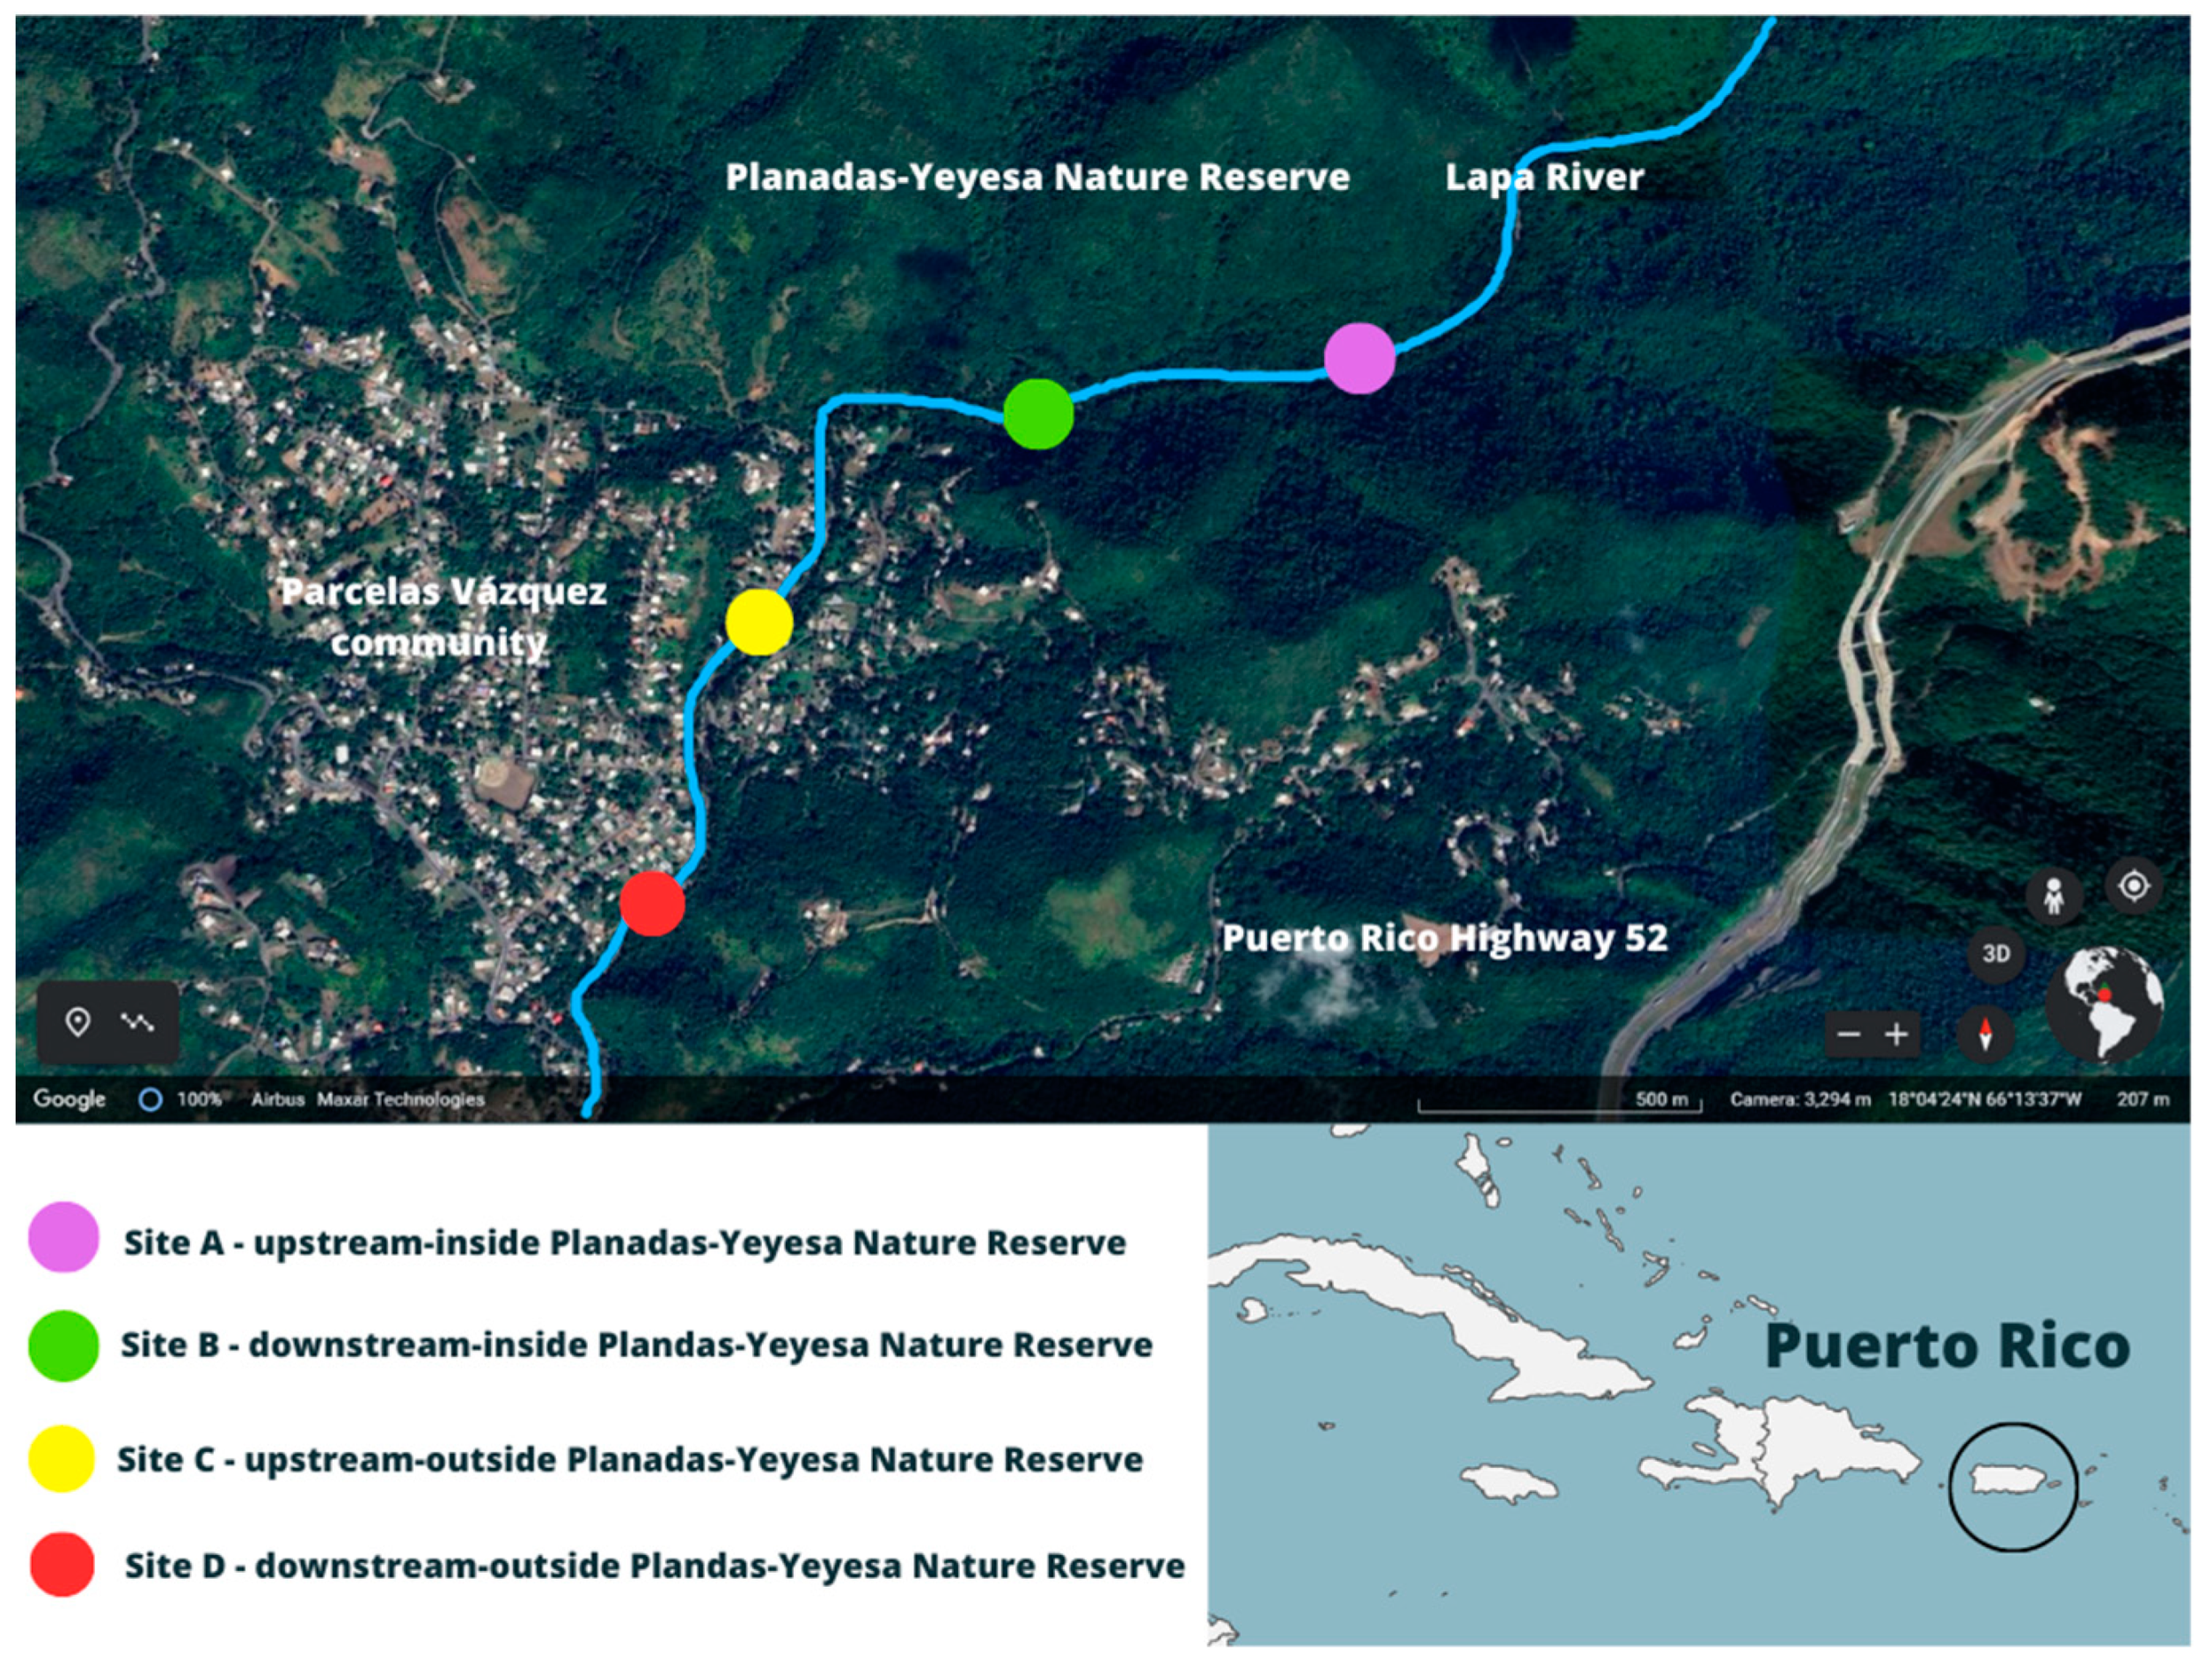
The DNER granted the research permit (O-VS-PVS15-SJ-01147-10092020) to sample the water and animals from the Lapa River, while the Animal Care and Use Committee (ACUC) from Universidad Ana G. Méndez approved the protocol (A03-064-20) used to sample the animals from the Lapa River. We established four sampling sites at the Planadas-Yeyesa Nature Reserve to collect the samples along the gradient of the Lapa River (Figure 1). Two sampling sites were positioned within the Planadas-Yeyesa Nature Reserve (Site A upstream-inside and Site B downstream-inside), and two were positioned outside and downstream the limits of the reserve but within the Vázquez community (Site C upstream-outside and Site D downstream-outside). The northeastern area of the Vazquez community borders the nature reserve’s southern area, while the Lapa River stretches outside the nature reserve and intersects with the Vazquez community. Each sampling site was 100 m in length. Three samples were collected from each site bimonthly for one year. The samples were collected in April 2021 (T1); June 2021 (T2); August 2021 (T3); October 2021 (T4); December 2021 (T5); February 2022 (T6); and April 2022 (T7).
All of the microhabitats at each sampling site were evaluated, including stones, sediments, and litter. A type D net with a 250 μm mesh was also submerged in the water for three minutes to collect any aquatic macroinvertebrates. By kicking the substrate, the net was swept upward to the water’s surface several times to ensure the capture of all organisms present at the site. The collected organisms were placed in plastic containers labeled with the appropriate site and date information. After sample collection, they were transported to Labor207 at the Department of Sciences and Technology, Ana G. Méndez University, Gurabo Campus, Gurabo, Puerto Rico, in a cooler containing ice.
The samples were separated from the substrate in the laboratory using a Petri dish, a magnifying glass, and tweezers. The substrate was discarded into a designated waste container and kept in the laboratory until a licensed professional waste disposal service removed the material. The organisms were identified and counted using the Identification Guide to Freshwater Macroinvertebrates© from the Stroud Water Research Center and the Photographic Guide of the Aquatic Macroinvertebrates of Puerto Rico. The organisms were then placed in glass containers filled with 500 mL of 80% ethanol solution and were stored in the laboratory’s designated cabinet at room temperature (20–22 °C, 68–72 °F) until the identification process was finalized. Once the research was completed, the samples were discarded in a labeled waste container and kept in the laboratory (207) until a licensed professional waste disposal service removed the material.
2.2. Calculation of Indices: The Biological Monitoring Working Party of Puerto Rico (BMWP-PR) and Family Biotic Index of Puerto Rico (FBI-PR)
According to Gutiérrez et al. [33], each family of aquatic macroinvertebrates can be assigned two tolerance values: the first corresponding to the BMWP-PR, and the second corresponding to the FBI-PR. A detailed description of the calculation processes is described by Gutiérrez et al. [33], as follows:
2.2.1. BMWP-PR Index
- A tolerance value is assigned only once per family regardless of the number of individuals collected.
- The value of the index for each site is obtained by summing the values of the tolerance indices (ti) for each family (BMWP = Σti).
- The resulting value determines the quality of the water according to the categories listed in Table 1.
2.2.2. FBI-PR Index
- The tolerance values are derived from a combination of the abundance of each family and the total number of individuals in a sample.
- The index value is obtained by summing the tolerance values of each family (ti) multiplied by the number of organisms (ni) and dividing this by the total number of individuals (N) collected (FBI = Σ(ni × ti)/N).
- The value obtained is associated with a category of water quality, which are listed in Table 2.
The physiochemical analysis of the water included the evaluation of nitrate, ammonium, dissolved oxygen, phosphate, pH, turbidity, and total phosphorus levels. Measurements of temperature and stream velocity were also included. The data obtained were used to compare the sites and to determine the degree of homogeneity along the river’s gradient. Similarly, the bimonthly results were compared to identify any periodic changes.
2.3. Protocol for Collecting Water Samples from the River
2.3.1. Water Quality Parameters and Analytical Methods for Stream Water Source Evaluation: On-Site Evaluation
Measurements of the stream acidity (pH), salinity, total dissolved solids, and temperature parameters were completed on-site using PC60 Premium® APERA Instruments Columbus, Ohio, USA Multiparameter probes for uncapped bottles (see Table 3; APERA Instruments). Before using the multiparameter probe, the instrument was calibrated according to the PC60 Premium® Multiparameter Tester instruction manual. Once calibrated, a water sample was taken from the Lapa River, and this water sample was placed into the uncapped bottles. The multiparameter probe was then inserted into the uncapped bottles. Following the instructions of the PC60 Premium® Multiparameter probe, the probe calculated acidity (pH), salinity, total dissolved solids, and temperature. The water sample was returned to the river once the evaluation was completed. To evaluate the dissolved oxygen concentration, the CHEMets® CHEMetrics, LLC Virginia, USA Dissolved Oxygen Water Test (on-site) was used. The following steps from the CHEMets® manual were followed to conduct the test:
- Fill the sample cup to the 25 mL mark with the sample to be tested.
- Place the ampoule, tip first, into the sample cup. Snap the tip. The ampoule will fill, leaving a bubble for mixing.
- To mix the ampoule, invert it several times, allowing the bubble to travel from end to end.
- Dry the ampoule and wait 2 min for color development.
- Obtain a test result by placing the ampoule between the color standards until the best color match is found.
A stopwatch, a calculator, and a floating object (ping pong ball) were used to evaluate water velocity, while a Secchi disc was used to assess water turbidity.
2.3.2. Water Quality Parameters and Analytical Methods for Stream Water Source Evaluation: Laboratory Evaluation
The evaluation of nitrate, ammonium, phosphate, turbidity, and total phosphorus levels occurred in a laboratory setting (see Table 4). The samples were collected at each site and stored in 1.8 L plastic containers until they could be analyzed in the laboratory. Before collection, each container was labeled with the parameter, date, time, and site number/name. Individual plastic containers were used to collect the samples to measure each parameter. For water collection, we held an uncapped bottle upside down and submerged it while standing at the edge of the water. To collect the samples, we tipped the bottle upright to allow the water to fill the plastic container and then removed the bottle from the water and screwed on the cap. All samples were transported to the CREST Center for Aquatic Chemistry and Environment Laboratory at the Florida International University Biscayne Bay Campus in a portable cooler with dry ice via FedEx for the corresponding analysis. The data gathered were used to compare the sites and to determine the degree of homogeneity along the river’s gradient.
2.4. Statistical Analysis
The statistical analysis plan for this study is shown in Table 5.
To analyze the relationship between the water quality (BMWP-PR), contamination (FBI-PR), and physicochemical (nitrate, nitrite, ammonia/ammonia, phosphorus, and soluble reactive phosphorus, temperature, pH, conductivity, total dissolved solids, and salinity) parameters, Pearson bivariate correlations were calculated using the mean score of each variable at the four sites of the Lapa River: upstream (Site A and Site C) and downstream (Site C and Site D). Before applying this statistical test, a verification to ensure compliance with the normality requirements of the data was performed using the Kolmogorov–Smirnov test.
Multiple linear regression was performed using the water quality (BMWP-PR), contamination (FBI-PR), and physicochemical (nitrate, nitrite, ammonia/ammonium, phosphorus, and soluble reactive phosphorus, temperature, pH, conductivity, total dissolved solids, and salinity) parameters as predictors of the aquatic macroinvertebrate variability. Aquatic macroinvertebrate families with more than 20 organisms in total were selected for this estimation. The stepwise method with a significance level of p ≤ 0.05 was used for entering a given variable, and a level of p ≥ 0.10 was used for excluding predictive variables in the multivariate model.
3. Results
3.1. Aquatic Macroinvertebrates
The mean number of aquatic macroinvertebrates found for the seven sample times at Site A (upstream-inside) was 37.1 (SD = 7.7); at Site B (downstream-inside), the mean was 29.7 (SD = 3.0); at Site C (upstream-outside), the mean was 26.4 (SD = 2.7); and at Site D (downstream-outside), the mean was 24.3 (SD = 3.3). A significantly higher mean number of macroinvertebrates (p < 0.001, X2 = 17.80) was obtained from the samples located inside (Site A and Site B) than outside (Site C and Site D). Appendix A details the number of aquatic macroinvertebrates identified at the four sites of the Lapa River (upstream and downstream) and at the seven sample times.
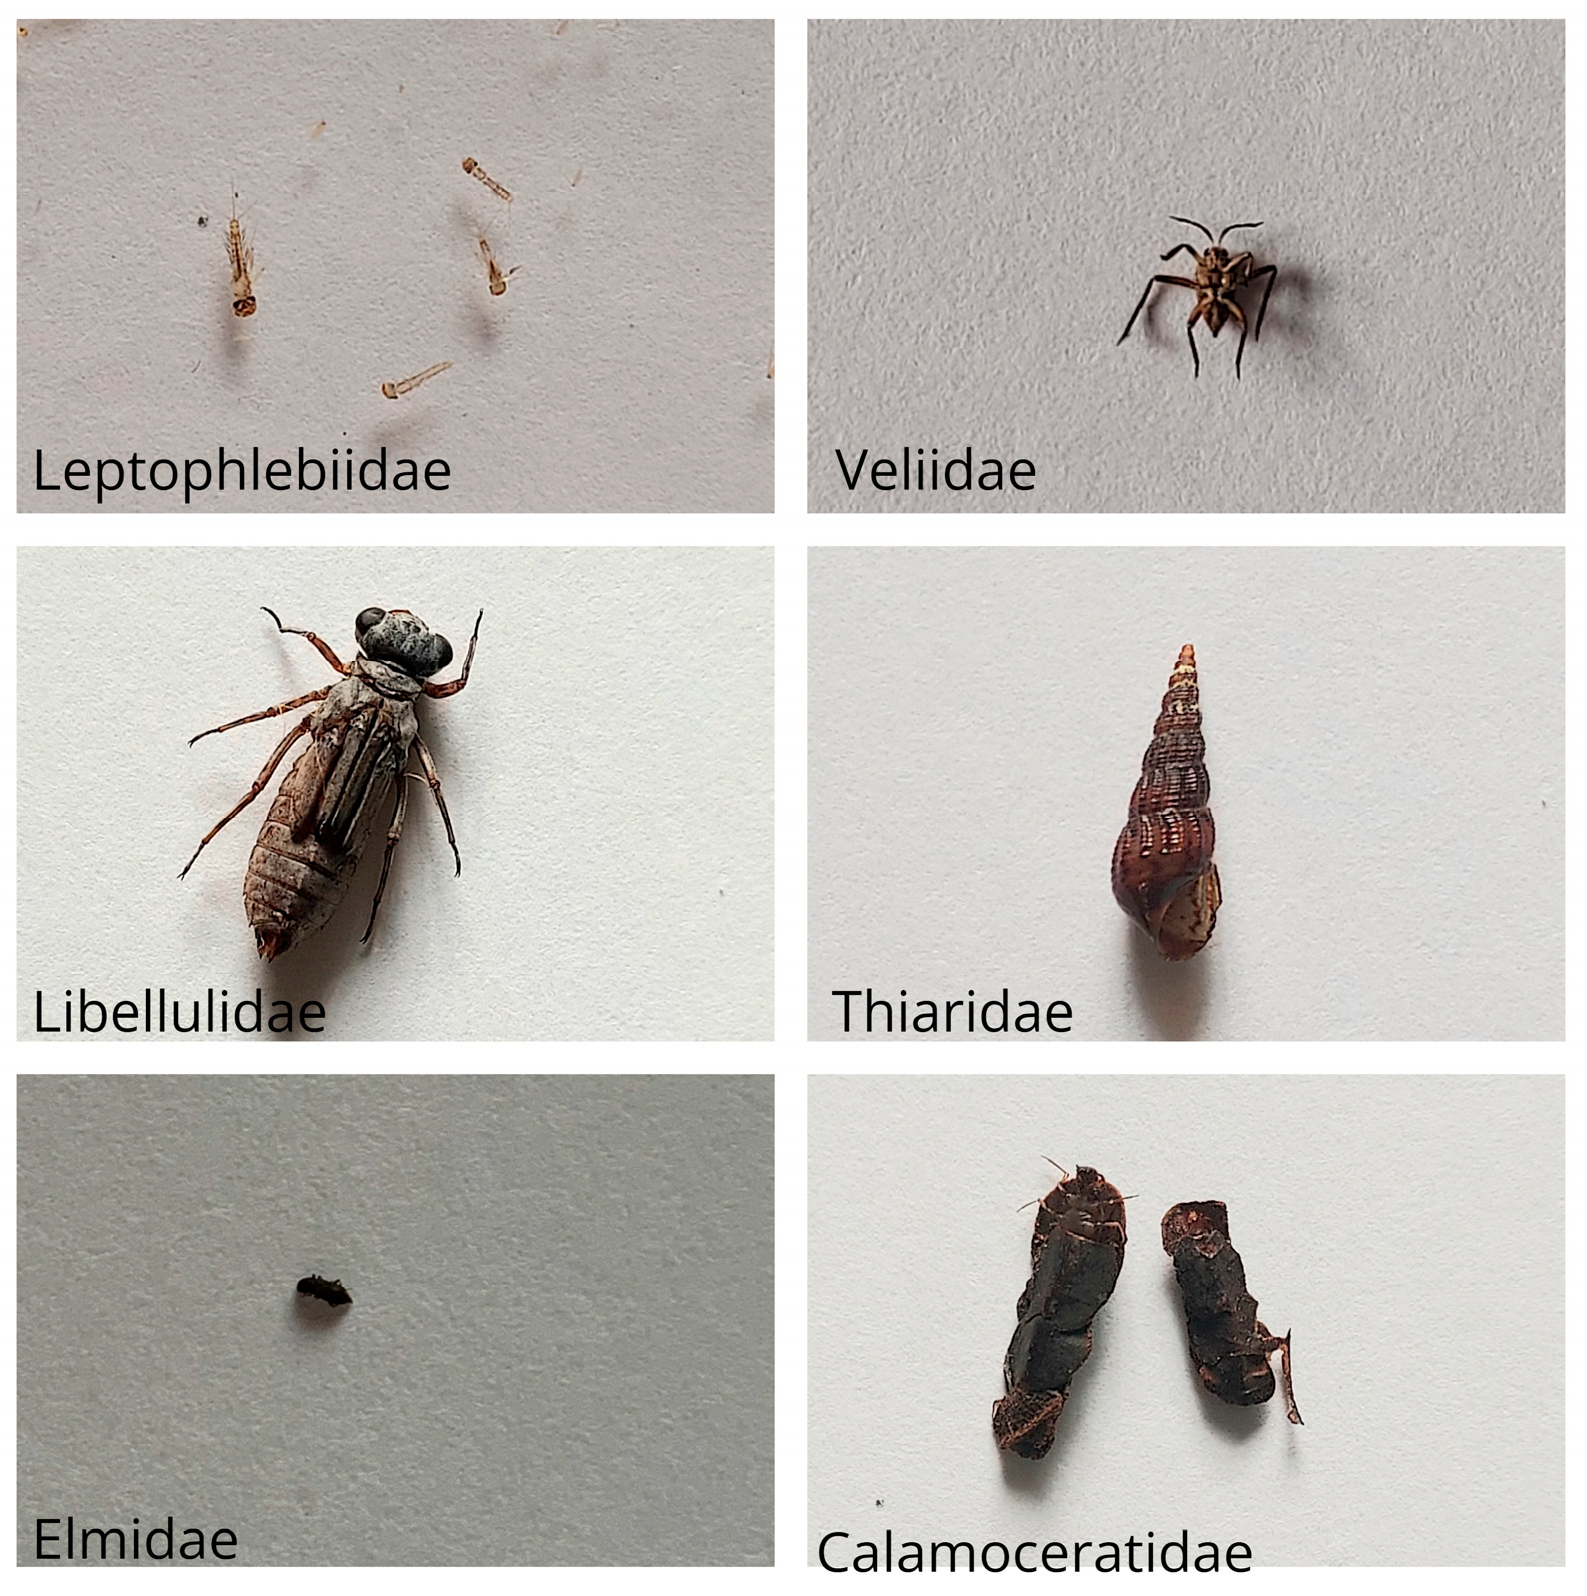
The most frequently found aquatic macroinvertebrates at Site A (upstream-inside) were from the families Leptophlebiidae (n = 51), Elmidae (n = 34), Libellulidae (n = 34), and Calamoceratidae (n = 32); at Site B (downstream-inside), the most common aquatic macroinvertebrates found were those from the families Leptophlebiidae (n = 38), Libellulidae (n = 38), Elmidae (n = 28), and Calamoceratidae (n = 21); at Site C (upstream-outside), the most common aquatic macroinvertebrates found were from the families Thiaridae (n = 31), Veliidae (n = 31), Leptophlebiidae (n = 29), and Elmidae (n = 26); and at Site D (downstream-outside), the most common aquatic macroinvertebrates found were from the families Thiaridae (n = 37), Veliidae (n = 35), Leptophlebiidae (n = 27), and Elmidae (n = 16).
Considering the total mean of the four sample sites, the most common aquatic macroinvertebrates in the Lapa River were those of the families Leptophlebiidae (M = 36.3; SD = 10.9), Libellulidae (M = 27.0; SD = 11.3), Elmidae (M = 26.0; SD = 7.5), Veliidae (M = 23.0; SD = 13.4), Thiaridae (M = 15.5; SD = 13.5), and Calamoceratidae (M = 15.5; SD = 13.5). No aquatic macroinvertebrates of the Crambidae, Helicopsychidae, Hydroptilidae, Leptoceridae, and Polycentropodidae families were detected, see Figure 2.
3.2. Water Quality
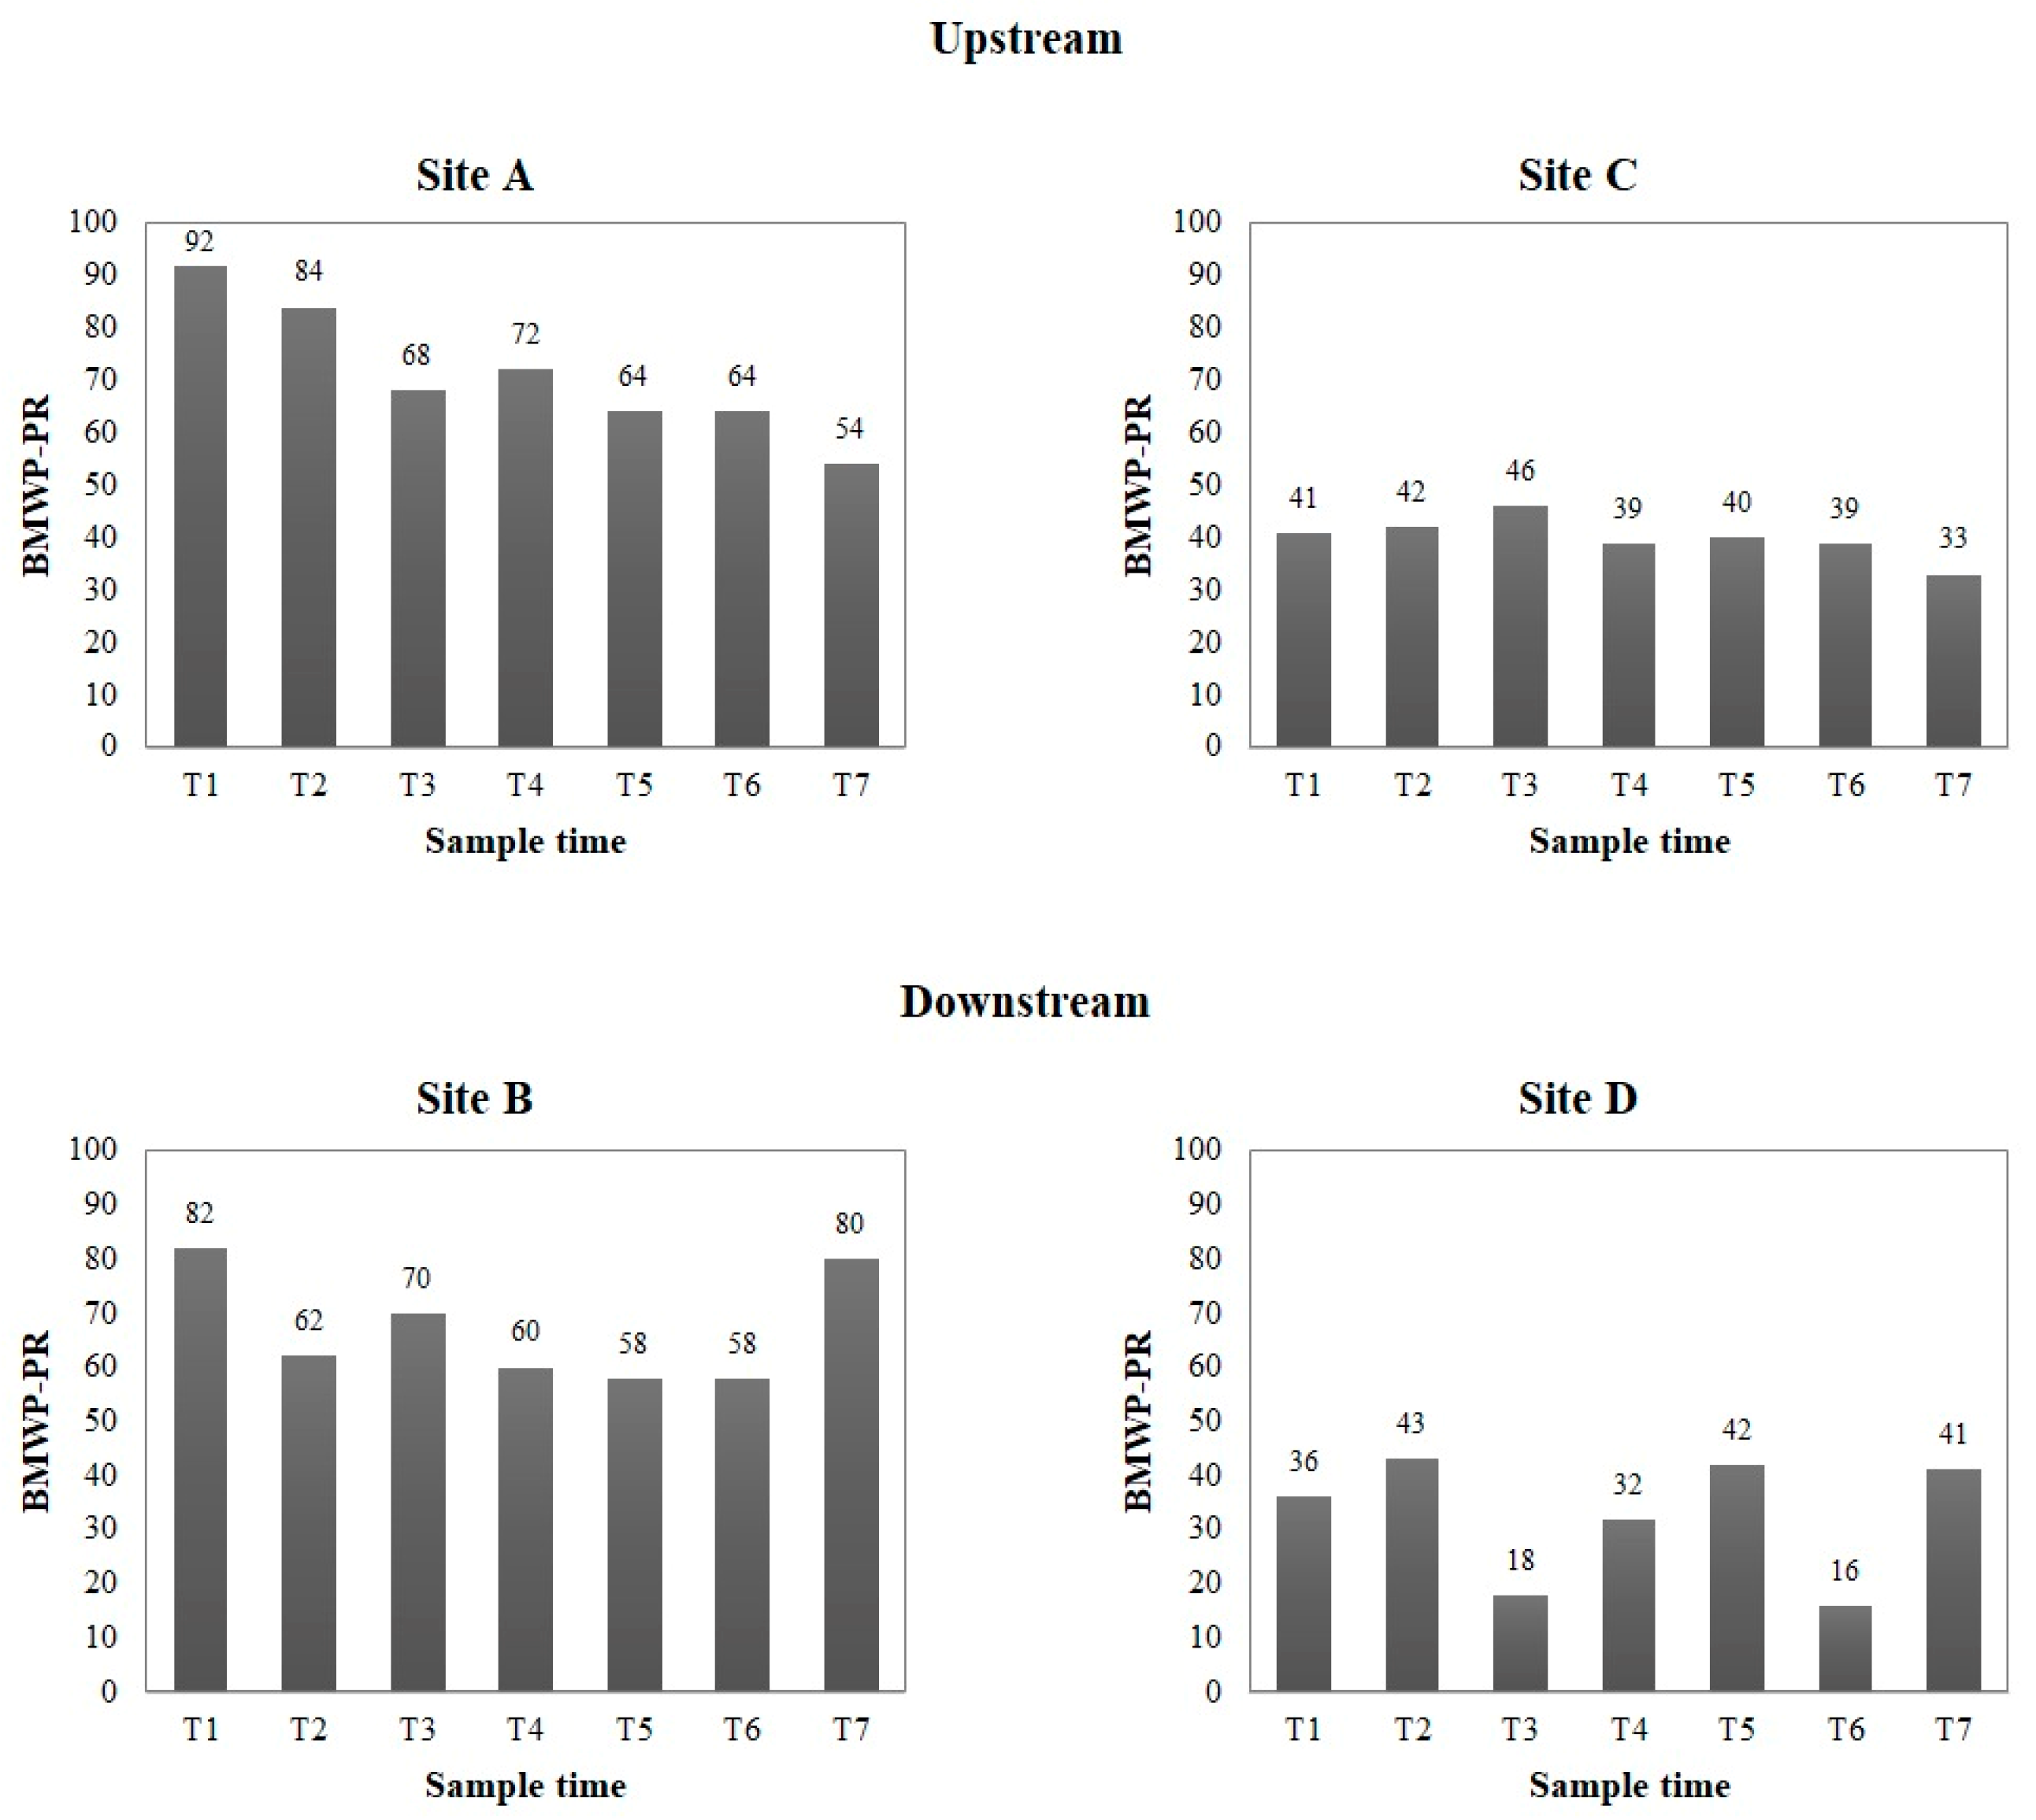
Figure 3 shows the water quality observed at the four sites (upstream and downstream) in the Lapa River at the seven sample times. The mean BMWP-PR at the seven sample times at Site A was 71 (SD = 13.0; range = 54 to 92); at Site B, it was 67 (SD = 10.3; range = 58 to 82); at Site C, it was 40 (SD = 3.9; range = 33 to 46); and at Site D, it was 33 (SD = 11.3; range = 16 to 43). The above mean differences were statistically significant according to the sampling site (p < 0.001, F = 24.93). According to the BMWP-PR water quality classification criteria, Site A (upstream-inside) had good water quality, and Site B (downstream-inside) had regular water quality; Sites C (upstream-outside) and D (downstream-outside) had poor water quality.
3.3. Contamination
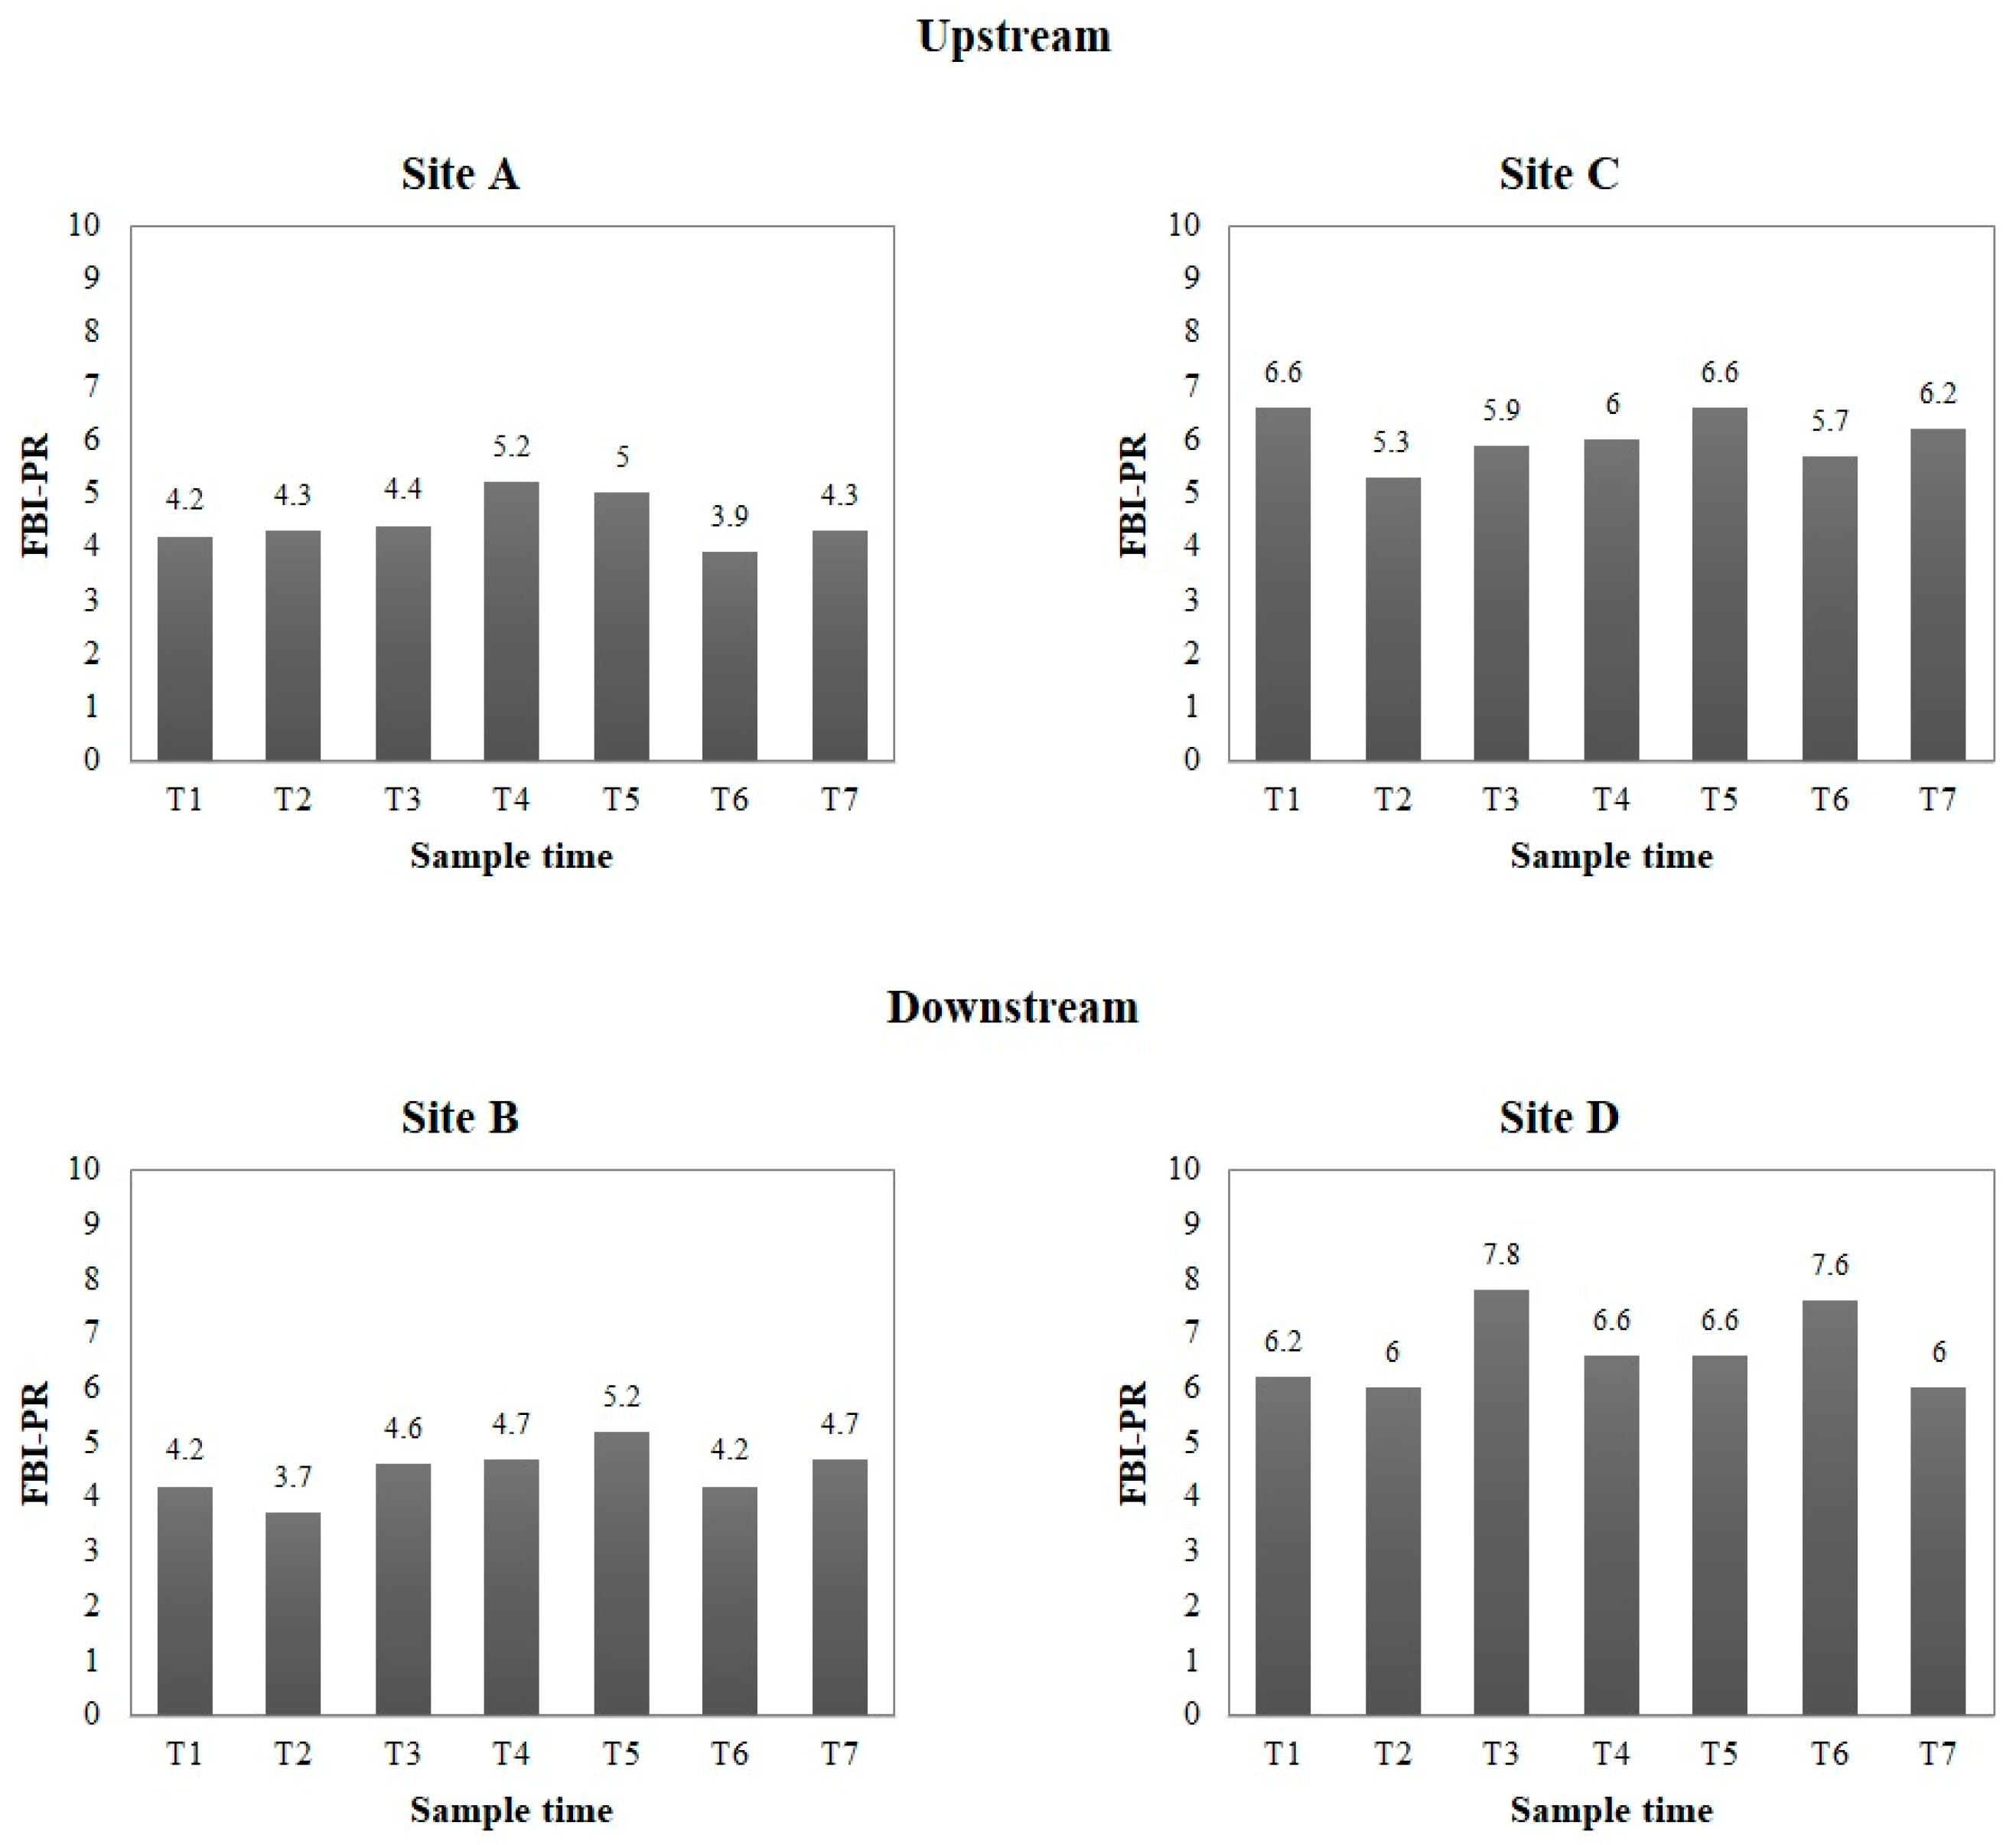
Figure 4 illustrates the degree of contamination detected at the four sites in the Lapa River at the seven sample times. The mean FBI-PR at the seven sample times at Site A was 4.5 (SD = 0.5; range = 3.9 to 5.2); at Site B, it was 4.5 (SD = 0.5; range = 3.7 to 5.2); at Site C, it was 6.0 (SD = 0.5; range = 5.3 to 6.6); and at Site D, it was 6.7 (SD = 0.7; range = 6.0 to 7.8). These differences were statistically significant according to sampling site (p < 0.001, F = 29.17). Based on the FBI-PR degree of contamination classification obtained via the FBI-PR criteria, Site A (upstream-inside) and Site B (downstream-inside) had mild organic contamination (Category 2, in both cases), and Site C (upstream-outside) and Site D (upstream-outside) had substantial organic contamination (Category 4, in both cases).
3.4. Water Physicochemical Parameters
Appendix A shows the physicochemical parameters according to the four Lapa River sites and the seven sample times. Site A (upstream-inside) reported the highest mean scores in temperature (M = 28.2; SD = 1.5; range = 27.4 to 30.3) and pH (M = 8.2; SD = 0.2; range = 7.8 to 8.4); Site B (downstream-inside) reported the highest scores in dissolved oxygen (M = 8.0 mg/L; SD = 0.0; range = 8.0 to 8.0); Site C (upstream-outside) reported the highest scores in stream velocity (M = 0.25 m/s; SD = 1.8; range = 23 to 28) and phosphorus (M = 1.5; SD = 1.3; range = 0.9 to 4.0); and Site D (downstream-outside) reported the highest scores in conductivity (M = 828.3 EC; SD = 167.5; range = 641 to 1083), dissolved solids (M = 583.9 ppm; SD = 115.0; range = 453 to 790), salinity (M = 0.4 ppt; SD = 0.1; range = 0.3 to 0.6), nitrite and nitrate (M = 70.7 µmol/L; SD = 68.3; range = 20.5 to 194.1), nitrate (M = 70.5 µmol/L; SD = 68.2; range = 20.1 to 193.8), nitrite (M = 0.3 µmol/L; SD = 0.1; range = 0.1 to 0.5), ammonia/ammonium (M = 4.5 µmol/L; SD = 6.8; range = 0.7 to 18.2), and soluble reactive phosphorus (M = 0.7 µmol/L; SD = 0.4; range = 0.5 to 1.4).
As shown in Appendix A, Site B (downstream-inside) reported the highest significant mean scores in dissolved oxygen (M = 8.0; SD = 0.0, p = 0.002, X2 = 14.90), and Site D (downstream-outside) reported the highest scores in conductivity (M = 828.3; SD = 167.5, p < 0.001, F = 9.12), dissolved solids (M = 583.9; SD = 115.0, p < 0.001, F = 8.67), salinity (M = 0.4; SD = 0.1, p < 0.001, X2 = 16.90), nitrite and nitrate (M = 70.7; SD = 68.3, p = 0.005, X2 = 12.64), nitrate (M = 70.5; SD = 68.2, p = 0.006, X2 = 12.62), and soluble reactive phosphorus (M = 0.7; SD = 0.4, p = 0.005, X2 = 12.82).
3.5. Correlations between Water Quality, Contamination, and Physicochemical Parameters
As shown in Appendix A, positive and negative correlations between water quality, contamination, and physicochemical parameters were found. BMWP-PR had a negative correlation with FBI-PR, and a positive correlation with temperature. Nitrate had a positive correlation with ammonia/ammonium, soluble reactive phosphorus, conductivity, total dissolved solids, and salinity. Ammonia/ammonium had a positive correlation with soluble reactive phosphorus. Phosphorus had a negative correlation with temperature. Soluble reactive phosphorus had a positive correlation with conductivity, total dissolved solids, and salinity. Conductivity had a positive correlation with total dissolved solids.
3.6. Predictive Power of Water Quality, Contamination, and Physicochemical Parameters in the Variation of Aquatic Macroinvertebrate Families
As shown in Appendix A, the variability in the Blattidae (β = −0.96; p = 0.04) and Libellulidae (β = −0.98; p = 0.02) families was negatively predicted by the FBI-PR scores; variability in the Thiaridae (β = −1.0; p < 0.001) family was positively predicted by BMWP-PR scores; and in the Baetidae (β = 0.99; p = 0.01) and Calamoceratidae (β = 0.96; p < 0.04) families, variability was positively predicted by temperature. No evidence indicating the predictive power of the physical parameters on the variability of the macroinvertebrates explored was identified.
4. Discussion
This study evaluated water quality as a function of the regulating ecosystem services in the Lapa River at sampling sites located inside and outside the Planadas-Yeyesa Nature Reserve. The use of aquatic macroinvertebrates as bioindicators of water quality made it possible to determine the water quality of the ecosystem and its degree of contamination through the calculation of the BMWP-PR and FBI-PR indices. Similarly, spatiotemporal changes in the ecological condition of the Lapa River inside and downstream of the Planadas-Yeyesa Nature Reserve were evaluated.
The results showed that the families with the highest abundances at the sampling points within the Planadas-Yeyesa Nature Reserve during the entire sampling period were Leptophlebiidae, Elmidae, Libelulidae, and Calamoceratidae. According to Gutiérrez and Ramírez [17], all of these families obtained high scores (≥5) on the BMWP-PR quality index, and low scores (≤5) on the FBI-PR. This indicates that their presence and abundance reflect that the water quality in the river is good and that there is a low degree of contamination. However, in the sampling points located upstream and downstream outside the Planadas-Yeyesa Nature Reserve, the families present in the highest abundance were Thiaridae, Veliidae, Leptophlebiidae, and Elmidae. According to the study by Gutiérrez and Ramírez [17], the families Thiaridae and Veliidae have low scores (≤2) on the BMWP-PR quality index, and high scores (≥8) on the FBI-PR. This indicates that their presence and abundance reflect poor water quality in the river and a high degree of pollution. The spatial variability of the water quality inside and outside the nature reserve could be due to anthropogenic activities. In the area outside the nature reserve, the construction of septic tanks adjacent to the river, the presence of animal pens, and the entry and exit of four-wheelers and other motor vehicles into the river could impact water quality.
In this study, we used the BMWP-PR index to evaluate the water quality of the Lapa River, and the FBI-PR index to evaluate the degree of contamination. Both indices were proposed by Gutiérrez and Ramírez [17] to evaluate the ecological condition of rivers in Puerto Rico, along with the Photographic Guide to Aquatic Macroinvertebrates of Puerto Rico. In terms of water quality, the mean BMWP-PR at the seven sampling times at Site A (upstream-within the nature reserve) had good water quality, and Site B (downstream-within the nature reserve) had fair water quality. The water quality at Sites C (upstream-outside) and D (downstream-outside) was poor. In the case of Site B, the intermittent entry and exit of terrestrial animals, such as horses, pigs, and goats, into the water may have slightly impacted water quality over the past few years. In the case of Sites C and D, the same factors occur, with the addition of used water, septic tank waste from houses near the river, the presence of chicken coops in areas near the river, and other contaminants from the Parcelas Vázquez community affecting water quality. Similarly, based on the BMWP-PR pollution classification criteria, Site A (upstream-within the nature reserve) and Site B (downstream-within the nature reserve) had light organic pollution (Category 2 in both cases), and Site C (upstream-outside the nature reserve) and Site D (upstream-outside the nature reserve) had significant organic pollution (Category 4 in both cases).
Overall, the BMWP-PR and FBI-PR indices reflect good ecological status in the section of the Lapa River located within the Planadas-Yeyesa Nature Reserve, and impaired ecological status in the section located within the Parcelas Vázquez community. These results are aligned with the study conducted by Gutiérrez and Ramírez [17]. They evaluated both indices in two rivers scarcely impacted by urbanization (Río Mameyes and Quebrada Sonadora) and in two highly impacted rivers (Río Piedras and Canal Sur Capetillo). The BMWP-PR index for Río Mameyes and Quebrada Sonadora reflected good to excellent water quality, and for the Río Piedras and Canal Sur Capetillo, the index reflected regular to poor water quality. In the case of the evaluation carried out using the FBI-PR index, the barely impacted rivers had mild to unlikely organic contamination, and the highly impacted rivers had severe to very severe organic contamination. Other studies have shown the same trends when using the BMWP and FBI indices to assess river water quality [34,35,36,37,38].
The physicochemical parameters of water are another type of variable taken into consideration in studies evaluating water quality. This study reported that the highest mean scores in the categories of conductivity, dissolved solids, salinity, nitrite and nitrate, nitrate, nitrite, ammonia/ammonium, and soluble reactive phosphorus were found at Site D (downstream-outside the nature reserve). This could be because as the river flows through the Parcelas Vázquez community, runoff carries contaminants originating from where the community begins upstream, and the contamination concentration increases as the water travels downstream. In general, it is possible that fecal material from animals entering and leaving the river, and sources of contamination such as septic tanks, oil waste, and spillage of detergents and other chemicals into sewers and ditches, could be filtering into the river and altering these physicochemical parameters [39].
According to Ruiz et al. [36], urbanized areas tend to be characterized by high concentrations of wastewater, with water quality presenting high values of fecal coliforms, nitrites, nitrates, and total phosphorus, among other physicochemical parameters. This study reported different positive correlations between the physicochemical parameters of the water samples. For example, a positive correlation was reported between soluble reactive phosphorus and nitrate. This means that as the soluble reactive phosphorus increased, the nitrates increased the levels of conductivity and total dissolved solids. This increase in the concentration of these physiochemical parameters in the rivers could be due to the presence of contaminants in the water, a product of anthropogenic activities such as agriculture and the illegal dumping of raw sewage into the river, among other factors [40,41]. Similarly, a positive correlation was reported between total dissolved solids and conductivity. Total dissolved solids and conductivity are correlated and can come from both natural and human sources, including seawater, agriculture, and detergent usage, among other sources [39,42]. On the other hand, an increase in the concentrations of nitrogen, phosphorus, ammonium, and other nutrients due to anthropogenic activities causes algal blooms, resulting in increased oxygen consumption [43,44].
5. Conclusions
We conclude that the section of the Lapa River located within the Planadas-Yeyesa Nature Reserve has better ecological conditions than the stretch of the Lapa River adjacent to the community of Parcelas Vázquez, because it is located within a nature reserve that has barely been impacted by human activity. On the other hand, the stretch of the Lapa River adjacent to the community of Parcelas Vázquez is ecologically impacted by modifications to its course, and by the construction of residences with septic tanks located near the river. In addition, the introduction of horses, pigs, and goats and the construction of chicken coops in areas near the river may have affected water quality. Overall, the Lapa River provides the ecosystem service of good water quality within the nature reserve area. It is advisable to carry out educational interventions in the community to make the local population aware of human actions that negatively impact the river. It is also essential to educate them to create awareness of the benefits of a river with good water quality. Finally, it is important to note that the impact of global warming will continue to increase periods of extreme drought, forest fires, and sea level rise. Protecting the natural state of the Lapa River will help to guarantee the water supply for present and future generations in the communities close to the river.
Author Contributions
Conceptualization, C.E.O.-G.; software, C.E.O.-G.; validation, C.E.O.-G.; formal analysis, C.E.O.-G.; investigation, C.E.O.-G.; resources, C.E.O.-G. and M.E.O.-T.; data curation, C.E.O.-G.; writing—original draft preparation, C.E.O.-G.; writing—review and editing, C.E.O.-G. and M.E.O.-T.; visualization, C.E.O.-G. and M.E.O.-T.; supervision, M.E.O.-T.; project administration, C.E.O.-G.; funding acquisition, C.E.O.-G. and M.E.O.-T. All authors have read and agreed to the published version of the manuscript.
Funding
This is contribution number 1538 from the Institute of Environment at Florida International University. This work was supported by the National Science Foundation Luquillo Long-Term Ecological Research (NSF; grant number DEB-1546686 V), Florida International University Southeast Environmental Research Center.
Institutional Review Board Statement
The Puerto Rico Department of Natural and Environmental Resources granted the research permit (O-VS-PVS15-SJ-01147-10092020) to sample the water and animals from the Lapa River, while the Animal Care and Use Committee (ACUC) from the Ana G. Méndez University approved the protocol (A03-064-20) used to sample the animals from the Lapa River.
Informed Consent Statement
Not applicable.
Data Availability Statement
Data sets are available in Appendix A.
Conflicts of Interest
The authors declare no conflict of interest.
Appendix A. Results Breakdown

Table A1.
Number of aquatic macroinvertebrates identified according to the four sites of the Lapa River and the seven sample times.
Table A1.
Number of aquatic macroinvertebrates identified according to the four sites of the Lapa River and the seven sample times.
| Inside | Outside | |||||||||||||||||||||||||||
|---|---|---|---|---|---|---|---|---|---|---|---|---|---|---|---|---|---|---|---|---|---|---|---|---|---|---|---|---|
| Site A (Upstream) | Site B (Downstream) | Site C (Upstream) | Site D (Downstream) | |||||||||||||||||||||||||
| T1 | T2 | T3 | T4 | T5 | T6 | T7 | T1 | T2 | T3 | T4 | T5 | T6 | T7 | T1 | T2 | T3 | T4 | T5 | T6 | T7 | T1 | T2 | T3 | T4 | T5 | T6 | T7 | |
| Blattodea | ||||||||||||||||||||||||||||
| Blattidae | 1 | 3 | 2 | 1 | 2 | 3 | 0 | 3 | 4 | 1 | 1 | 1 | 2 | 3 | 1 | 2 | 1 | 1 | 0 | 1 | 0 | 1 | 2 | 0 | 0 | 1 | 0 | 1 |
| Coleoptera | ||||||||||||||||||||||||||||
| Gyrinidae | 0 | 0 | 0 | 0 | 0 | 0 | 3 | 1 | 0 | 2 | 0 | 0 | 0 | 0 | 0 | 1 | 0 | 0 | 0 | 0 | 0 | 0 | 1 | 0 | 0 | 0 | 0 | 0 |
| Elmidae | 4 | 7 | 5 | 3 | 6 | 5 | 4 | 4 | 3 | 5 | 6 | 3 | 4 | 3 | 3 | 5 | 4 | 3 | 2 | 5 | 4 | 5 | 5 | 0 | 2 | 0 | 0 | 4 |
| Decapoda | ||||||||||||||||||||||||||||
| Atyidae | 0 | 0 | 0 | 0 | 0 | 0 | 0 | 2 | 1 | 0 | 1 | 1 | 2 | 0 | 1 | 0 | 2 | 1 | 1 | 0 | 2 | 0 | 0 | 0 | 0 | 0 | 2 | 2 |
| Epiloboceridae | 1 | 2 | 1 | 1 | 1 | 2 | 1 | 1 | 0 | 2 | 1 | 0 | 1 | 2 | 1 | 2 | 1 | 0 | 2 | 2 | 0 | 1 | 2 | 1 | 2 | 1 | 0 | 0 |
| Xiphocarididae | 0 | 1 | 0 | 1 | 2 | 1 | 2 | 0 | 0 | 0 | 0 | 0 | 0 | 0 | 0 | 0 | 0 | 0 | 0 | 0 | 0 | 0 | 0 | 0 | 0 | 0 | 0 | 0 |
| Diptera | ||||||||||||||||||||||||||||
| Chironomidae | 2 | 1 | 0 | 1 | 0 | 0 | 0 | 0 | 0 | 0 | 0 | 0 | 0 | 0 | 1 | 0 | 0 | 1 | 2 | 0 | 0 | 1 | 0 | 2 | 2 | 1 | 0 | 0 |
| Empididae | 0 | 0 | 1 | 0 | 1 | 0 | 0 | 0 | 0 | 0 | 0 | 0 | 0 | 0 | 0 | 0 | 0 | 0 | 0 | 0 | 0 | 0 | 0 | 0 | 0 | 0 | 0 | 0 |
| Ephemeroptera | ||||||||||||||||||||||||||||
| Baetidae | 3 | 4 | 3 | 0 | 2 | 1 | 0 | 2 | 1 | 1 | 3 | 1 | 0 | 2 | 0 | 0 | 0 | 0 | 0 | 0 | 0 | 0 | 0 | 0 | 0 | 0 | 0 | 0 |
| Leptophlebiidae | 8 | 10 | 7 | 4 | 6 | 7 | 9 | 5 | 6 | 4 | 5 | 5 | 7 | 6 | 4 | 3 | 4 | 6 | 5 | 4 | 3 | 4 | 2 | 4 | 4 | 6 | 3 | 4 |
| Hemiptera | ||||||||||||||||||||||||||||
| Belostomatidae | 0 | 1 | 0 | 2 | 0 | 0 | 0 | 0 | 0 | 0 | 0 | 0 | 0 | 0 | 0 | 0 | 0 | 0 | 0 | 0 | 0 | 0 | 0 | 0 | 0 | 0 | 0 | 0 |
| Hydrometridae | 1 | 2 | 0 | 1 | 0 | 1 | 0 | 1 | 0 | 1 | 0 | 1 | 0 | 1 | 0 | 0 | 0 | 0 | 0 | 0 | 0 | 0 | 0 | 0 | 0 | 0 | 0 | 0 |
| Veliidae | 2 | 5 | 0 | 6 | 5 | 3 | 0 | 0 | 0 | 0 | 3 | 2 | 0 | 0 | 4 | 3 | 5 | 4 | 7 | 5 | 3 | 4 | 3 | 5 | 5 | 4 | 8 | 6 |
| Lepidoptera | ||||||||||||||||||||||||||||
| Crambidae | 0 | 0 | 0 | 0 | 0 | 0 | 0 | 0 | 0 | 0 | 0 | 0 | 0 | 0 | 0 | 0 | 0 | 0 | 0 | 0 | 0 | 0 | 0 | 0 | 0 | 0 | 0 | 0 |
| Mollusca | ||||||||||||||||||||||||||||
| Thiaridae | 1 | 0 | 2 | 0 | 3 | 0 | 2 | 2 | 0 | 2 | 1 | 3 | 0 | 3 | 5 | 7 | 2 | 4 | 6 | 3 | 4 | 4 | 5 | 7 | 5 | 7 | 5 | 4 |
| Odonata | ||||||||||||||||||||||||||||
| Aeshnidae | 1 | 0 | 2 | 1 | 0 | 0 | 0 | 0 | 1 | 0 | 0 | 0 | 0 | 0 | 0 | 0 | 0 | 0 | 0 | 0 | 0 | 0 | 0 | 0 | 0 | 0 | 0 | 0 |
| Lestidae | 2 | 1 | 0 | 1 | 0 | 2 | 1 | 1 | 1 | 2 | 1 | 1 | 1 | 2 | 0 | 0 | 0 | 0 | 0 | 0 | 0 | 0 | 0 | 0 | 0 | 0 | 0 | 0 |
| Libellulidae | 3 | 5 | 7 | 4 | 3 | 5 | 7 | 6 | 7 | 5 | 3 | 5 | 8 | 4 | 2 | 3 | 4 | 4 | 3 | 4 | 3 | 2 | 3 | 0 | 3 | 2 | 0 | 3 |
| Trichoptera | ||||||||||||||||||||||||||||
| Calamoceratidae | 5 | 7 | 4 | 2 | 3 | 6 | 5 | 3 | 4 | 3 | 2 | 2 | 4 | 3 | 0 | 0 | 1 | 0 | 2 | 0 | 2 | 0 | 0 | 0 | 0 | 2 | 0 | 2 |
| Glossomatidae | 0 | 0 | 0 | 0 | 0 | 0 | 0 | 1 | 0 | 1 | 0 | 0 | 0 | 1 | 0 | 0 | 0 | 0 | 0 | 0 | 0 | 0 | 0 | 0 | 0 | 0 | 0 | 0 |
| Helicopsychidae | 0 | 0 | 0 | 0 | 0 | 0 | 0 | 0 | 0 | 0 | 0 | 0 | 0 | 0 | 0 | 0 | 0 | 0 | 0 | 0 | 0 | 0 | 0 | 0 | 0 | 0 | 0 | 0 |
| Hydrobiosidae | 1 | 0 | 1 | 0 | 0 | 0 | 0 | 0 | 0 | 0 | 0 | 0 | 1 | 1 | 0 | 0 | 0 | 0 | 0 | 0 | 0 | 0 | 0 | 0 | 0 | 0 | 0 | 0 |
| Hydropsychidae | 0 | 0 | 0 | 0 | 0 | 0 | 0 | 0 | 0 | 0 | 0 | 0 | 0 | 0 | 0 | 1 | 0 | 1 | 0 | 0 | 0 | 0 | 1 | 0 | 1 | 2 | 0 | 0 |
| Hydroptilidae | 0 | 0 | 0 | 0 | 0 | 0 | 0 | 0 | 0 | 0 | 0 | 0 | 0 | 0 | 0 | 0 | 0 | 0 | 0 | 0 | 0 | 0 | 0 | 0 | 0 | 0 | 0 | 0 |
| Leptoceridae | 0 | 0 | 0 | 0 | 0 | 0 | 0 | 0 | 0 | 0 | 0 | 0 | 0 | 0 | 0 | 0 | 0 | 0 | 0 | 0 | 0 | 0 | 0 | 0 | 0 | 0 | 0 | 0 |
| Philopotamidae | 2 | 3 | 1 | 0 | 1 | 0 | 1 | 2 | 1 | 1 | 1 | 0 | 0 | 1 | 0 | 0 | 0 | 0 | 0 | 1 | 0 | 0 | 0 | 0 | 0 | 0 | 0 | 0 |
| Polycentropodidae | 0 | 0 | 0 | 0 | 0 | 0 | 0 | 0 | 0 | 0 | 0 | 0 | 0 | 0 | 0 | 0 | 0 | 0 | 0 | 0 | 0 | 0 | 0 | 0 | 0 | 0 | 0 | 0 |
| Xiphocentronidae | 2 | 1 | 0 | 0 | 0 | 0 | 0 | 0 | 0 | 0 | 0 | 0 | 0 | 0 | 0 | 0 | 0 | 0 | 0 | 0 | 0 | 0 | 0 | 0 | 0 | 0 | 0 | 0 |
| No insects | ||||||||||||||||||||||||||||
| Oligochaeta | 0 | 0 | 0 | 0 | 0 | 0 | 0 | 0 | 0 | 2 | 0 | 1 | 2 | 0 | 2 | 0 | 3 | 0 | 2 | 0 | 4 | 1 | 2 | 1 | 2 | 1 | 2 | 2 |
Note. April 2021 (T1); June 2021 (T2); August 2021 (T3); October 2021 (T4); December 2021 (T5); February 2022 (T6); and April 2022 (T7).
Table A2.
Water physicochemical parameters of the Lapa River according to the four sites of the Lapa River and the seven sample times.
Table A2.
Water physicochemical parameters of the Lapa River according to the four sites of the Lapa River and the seven sample times.
| Inside | ||||||||
|---|---|---|---|---|---|---|---|---|
| Variables | Site A (Upstream) | |||||||
| T1 | T2 | T3 | T4 | T5 | T6 | T7 | Total | |
| M (SD) | ||||||||
| Other parameters | ||||||||
| Temperature (°C) | 28.9 | 30.3 | 29.3 | 27.4 | 25.5 | 28 | 27.8 | 28.2 (1.5) |
| pH | 8.4 | 8.3 | 8.4 | 8.2 | 8 | 8.2 | 7.8 | 8.2 (0.2) |
| Conductivity (μS) | 482 | 477 | 527 | 614 | 633 | 549 | 468 | 535.7 (66.8) |
| Total dissolved solids (ppm) | 350 | 340 | 375 | 440 | 448 | 396 | 332 | 383.0 (47.0) |
| Turbidity (NTU) | 0 | 0 | 0 | 0 | 0 | 0 | 0 | 0.0 (0.0) |
| Stream velocity (m/s) | 0.24 | 0.27 | 0.29 | 0.28 | 0.26 | 0.21 | 0.21 | 0.25 (3.2) |
| Dissolved oxygen (mg/L) | 8 | 8 | 8 | 8 | 8 | 8 | 8 | 8.0 (0.0) |
| Salinity (ppt) | 0.2 | 0.2 | 0.3 | 0.3 | 0.3 | 0.3 | 0.2 | 0.3 (0.1) |
| Physicochemical parameters | ||||||||
| Nitrite + nitrate (µmol/L) | * | 2.7 | 0.7 | 16 | 26.2 | 1.7 | 0.9 | 8.0 (10.6) |
| Nitrate (µmol/L) | * | 2.6 | 0.7 | 15.8 | 26.1 | 1.6 | 0.5 | 7.9 (10.7) |
| Nitrite (µmol/L) | * | 0.1 | 0.1 | 0.2 | 0.1 | 0.2 | 0.5 | 0.2 (0.2) |
| Ammonia/ammonium (µmol/L) | * | 1.3 | 1.6 | 6.1 | 3.2 | 0.4 | 0.8 | 2.2 (2.1) |
| Phosphorus (µmol/L) | * | 0.7 | 0.4 | 0.7 | 0.5 | 0.7 | 0.5 | 0.6 (0.1) |
| Soluble reactive phosphorus (µmol/L) | * | 0.1 | 0.1 | 0.2 | 0.1 | 0.1 | 0.4 | 0.2 (0.1) |
| Inside | ||||||||
| Variables | Site B (Downstream) | |||||||
| T1 | T2 | T3 | T4 | T5 | T6 | T7 | Total | |
| M (SD) | ||||||||
| Other parameters | ||||||||
| Temperature (°C) | 28.3 | 29.6 | 28.7 | 27.2 | 26 | 27.8 | 28.1 | 28.0 (1.1) |
| pH | 8.4 | 8.1 | 8.4 | 7.8 | 8 | 7.7 | 7.6 | 8.0 (0.3) |
| Conductivity (EC) | 500 | 504 | 527 | 593 | 619 | 624 | 510 | 553.9 (55.9) |
| Total dissolved solids (ppm) | 359 | 359 | 373 | 453 | 439 | 443 | 359 | 397.9 (44.6) |
| Turbidity (NTU) | 0 | 0 | 0 | 0 | 0 | 0 | 0 | 0.0 (0.0) |
| Stream velocity (m/s) | 0.25 | 0.24 | 0.24 | 0.27 | 0.25 | 0.22 | 0.22 | 0.24 (1.8) |
| Dissolved oxygen (mg/L) | 8 | 8 | 8 | 8 | 8 | 8 | 8 | 8.0 (0.0) |
| Salinity (ppt) | 0.3 | 0.3 | 0.3 | 0.3 | 0.3 | 0.3 | 0.3 | 0.3 (0.0) |
| Physicochemical parameters | ||||||||
| Nitrite + nitrate (µmol/L) | * | 3.1 | 1.6 | 16.9 | 17.1 | 2.8 | 1 | 7.1 (7.7) |
| Nitrate (µmol/L) | * | 3 | 1.5 | 16.8 | 17 | 2.7 | 0.6 | 6.9 (7.8) |
| Nitrite (µmol/L) | * | 0.1 | 0.1 | 0.2 | 0.1 | 0.1 | 0.4 | 0.2 (0.1) |
| Ammonia/ammonium (µmol/L) | * | 0.5 | 1 | 1.2 | 2.1 | 1.4 | 0.8 | 1.2 (0.6) |
| Phosphorus (µmol/L) | * | 0.4 | 0.4 | 1.1 | 0.5 | 0.7 | 0.5 | 0.6 (0.3) |
| Soluble reactive phosphorus (µmol/L) | * | 0 | 0.1 | 0.2 | 0.1 | 0.1 | 0.3 | 0.1 (0.1) |
| Variables | Site C (Outside Upstream) | |||||||
| T1 | T2 | T3 | T4 | T5 | T6 | T7 | Total | |
| M (SD) | ||||||||
| Other parameters | ||||||||
| Temperature (°C) | 27.5 | 28.5 | 28 | 24.6 | 25.3 | 23.2 | 28.7 | 26.5 (2.2) |
| pH | 7.3 | 8 | 7.3 | 8.1 | 7.9 | 8.3 | 8 | 7.8 (0.4) |
| Conductivity (EC) | 513 | 511 | 618 | 853 | 622 | 843 | 650 | 658.6 (140.1) |
| Total dissolved solids (ppm) | 367 | 362 | 441 | 603 | 446 | 599 | 460 | 468.3 (98.4) |
| Turbidity (NTU) | 0 | 0 | 0 | 0 | 0 | 0 | 0 | 0.0 (0.0) |
| Stream velocity (m/s) | 0.26 | 0.25 | 0.28 | 0.26 | 0.26 | 0.23 | 0.23 | 0.25 (1.8) |
| Dissolved oxygen (mg/L) | 8 | 8 | 8 | 7 | 8 | 7 | 8 | 7.7 (0.5) |
| Salinity (ppt) | 0.3 | 0.3 | 0.3 | 0.4 | 0.3 | 0.4 | 0.3 | 0.3 (0.0) |
| Physicochemical parameters | ||||||||
| Nitrite + nitrate (µmol/L) | * | 2.3 | 5.6 | 20.2 | 18.8 | 62.3 | 20.6 | 21.6 (21.4) |
| Nitrate (µmol/L) | * | 2.2 | 5.4 | 20 | 18.7 | 62.1 | 20.4 | 21.5 (21.4) |
| Nitrite (µmol/L) | * | 0.1 | 0.2 | 0.2 | 0.1 | 0.2 | 0.2 | 0.2 (0.1) |
| Ammonia/ammonium (µmol/L) | * | 1 | 4.4 | 6.5 | 0.9 | 0.7 | 1.5 | 2.5 (2.4) |
| Phosphorus (µmol/L) | * | 1.1 | 0.6 | 4 | 0.9 | 1.6 | 0.9 | 1.5 (1.3) |
| Soluble reactive phosphorus (µmol/L) | * | 0.1 | 0.4 | 0.3 | 0.1 | 0.2 | 0.4 | 0.3 (0.1) |
| Variables | Site D (Outside Downstream) | |||||||
| T1 | T2 | T3 | T4 | T5 | T6 | T7 | Total | |
| M (SD) | ||||||||
| Other parameters | ||||||||
| Temperature (°C) | 26.8 | 26.6 | 26.9 | 24.9 | 24.7 | 23.8 | 29.6 | 26.2 (1.9) |
| pH | 8 | 8.1 | 7.9 | 8.1 | 8.1 | 8.1 | 8 | 8.0 (0.1) |
| Conductivity (EC) | 709 | 707 | 1083 | 816 | 816 | 1026 | 641 | 828.3 (167.5) |
| Total dissolved solids (ppm) | 507 | 504 | 790 | 579 | 584 | 670 | 453 | 583.9 (115.0) |
| Turbidity (NTU) | 0 | 0 | 0 | 0 | 0 | 0 | 0 | 0.0 (0.0) |
| Stream velocity (m/s) | 0.23 | 0.22 | 0.25 | 0.28 | 0.24 | 0.21 | 0.21 | 0.23 (2.5) |
| Dissolved oxygen (mg/L) | 7 | 7 | 6 | 7 | 7 | 6 | 8 | 6.9 (0.7) |
| Salinity (ppt) | 0.4 | 0.4 | 0.6 | 0.4 | 0.4 | 0.5 | 0.3 | 0.4 (0.1) |
| Physicochemical parameters | ||||||||
| Nitrite + nitrate (µmol/L) | * | 22.6 | 22.6 | 194.1 | 100.3 | 64.2 | 20.5 | 70.7 (68.3) |
| Nitrate (µmol/L) | * | 22.4 | 22.5 | 193.8 | 100.1 | 64 | 20.1 | 70.5 (68.2) |
| Nitrite (µmol/L) | * | 0.2 | 0.1 | 0.3 | 0.2 | 0.2 | 0.5 | 0.3 (0.1) |
| Ammonia/ammonium (µmol/L) | * | 1 | 1.3 | 3.9 | 1.7 | 0.7 | 18.2 | 4.5 (6.8) |
| Phosphorus (µmol/L) | * | 0.5 | 1 | 2.4 | 1.4 | 1.6 | 0.8 | 1.3 (0.7) |
| Soluble reactive phosphorus (µmol/L) | * | 0.5 | 0.4 | 1.4 | 0.3 | 0.9 | 0.5 | 0.7 (0.4) |
* These data were not collected on April 2021 (T1).
Table A3.
One-factor analysis of variances (ANOVA) of study variables according to sampling site.
| Variable | Inside | Outside | X2/F/W | p Value | ||
|---|---|---|---|---|---|---|
| Site A (Upstream) | Site B (Downstream) | Site C (Upstream) | Site D (Downstream) | |||
| M (SD) | M (SD) | M (SD) | M (SD) | |||
| Species | ||||||
| Macroinvertebrates * | 37.1 (7.7) | 29.7 (3.0) | 26.4 (2.7) | 24.3 (3.3) | 17.80 | <0.001 |
| Water quality | ||||||
| BMWP-PR | 71.1 (13.0) | 67.1 (10.3) | 40.0 (3.9) | 32.6 (11.3) | 24.93 | <0.001 |
| Contamination | ||||||
| FBI-PR | 4.5 (0.5) | 4.5 (0.5) | 6.0 (0.5) | 6.7 (0.7) | 29.17 | <0.001 |
| Other parameters | ||||||
| Temperature (°C) | 28.2 (1.5) | 28.0 (1.1) | 26.5 (2.2) | 26.2 (1.9) | 2.30 | 0.102 |
| pH | 8.2 (0.2) | 8.0 (0.3) | 7.8 (0.4) | 8.0 (0.1) | 11.20 ** | 0.280 |
| Conductivity (μS) | 535.7 (66.8) | 553.9 (55.9) | 658.6 (140.1) | 828.3 (167.5) | 9.12 | <0.001 |
| Total dissolved solids (ppm) | 383.0 (47.0) | 397.9 (44.6) | 468.3 (98.4) | 583.9 (115.0) | 8.67 | <0.001 |
| Turbidity (NTU) | 0.0 (0.0) | 0.0 (0.0) | 0.0 (0.0) | 0.0 (0.0) | - | - |
| Stream velocity (m/s) | 0.25 (3.2) | 0.24 (1.8) | 0.25 (1.8) | 0.23 (2.5) | 0.93 | 0.441 |
| Dissolved oxygen (mg/L) * | 8.0 (0.0) | 8.0 (0.0) | 7.7 (0.5) | 6.9 (0.7) | 14.90 | 0.002 |
| Salinity (ppt) * | 0.3 (0.1) | 0.3 (0.0) | 0.3 (0.0) | 0.4 (0.1) | 16.90 | <0.001 |
| Physicochemical parameters | ||||||
| Nitrite + nitrate (µmol/L) * | 8.0 (10.6) | 7.1 (7.7) | 21.6 (21.4) | 70.7 (68.3) | 12.64 | 0.005 |
| Nitrate (µmol/L) * | 7.9 (10.7) | 6.9 (7.8) | 21.5 (21.4) | 70.5 (68.2) | 12.62 | 0.006 |
| Nitrite (µmol/L) * | 0.2 (0.2) | 0.2 (0.1) | 0.2 (0.1) | 0.3 (0.1) | 2.81 | 0.421 |
| Ammonia/ammonium (µmol/L) * | 2.2 (2.1) | 1.2 (0.6) | 2.5 (2.4) | 4.5 (6.8) | 1.25 | 0.741 |
| Phosphorus (µmol/L) * | 0.6 (0.1) | 0.6 (0.3) | 1.5 (1.3) | 1.3 (0.7) | 10.46 | 0.015 |
| Soluble reactive phosphorus (µmol/L) * | 0.2 (0.1) | 0.1 (0.1) | 0.3 (0.1) | 0.7 (0.4) | 12.82 | 0.005 |
Note. * For this variable, the normality assumption was not met, and the nonparametric Kruskal–Wallis test was performed. ** The assumption of homogeneity of variances was not met, and the unequal variances test (Welch) was applied. Statistically significant differences are shown in bold.
Table A4.
Pearson correlations between water quality, contamination, and physicochemical parameters.
Table A4.
Pearson correlations between water quality, contamination, and physicochemical parameters.
| Variables | 1 | 2 | 3 | 4 | 5 | 6 | 7 | 8 | 9 | 10 | 11 | 12 |
|---|---|---|---|---|---|---|---|---|---|---|---|---|
| 1. BMWP-PR | - | - | - | - | - | - | - | - | - | - | - | - |
| 2. FBI-PR | −0.99 ** | - | - | - | - | - | - | - | - | - | - | - |
| 3. Nitrate | −0.84 | 0.88 | - | - | - | - | - | - | - | - | - | - |
| 4. Nitrite | −0.47 | 0.56 | 0.85 | - | - | - | - | - | - | - | - | - |
| 5. Ammonia/ammonium | −0.80 | 0.86 | 0.95 * | 0.88 | - | - | - | - | - | - | - | - |
| 6. Phosphorus | −0.95 | 0.92 | 0.62 | 0.21 | 0.64 | - | - | - | - | - | - | - |
| 7. Soluble reactive phosphorus | −0.81 | 0.86 | 0.99 ** | 0.88 | 0.96 * | 0.60 | - | - | - | - | - | - |
| 8. Temperature | 0.99 ** | −0.99 * | −0.81 | −0.44 | −0.78 | −0.96 * | −0.79 | - | - | - | - | - |
| 9. pH | 0.66 | −0.57 | −0.18 | 0.35 | −0.08 | −0.79 | −0.14 | 0.68 | - | - | - | - |
| 10. Conductivity | −0.93 | 0.95 * | 0.98 * | 0.74 | 0.92 | 0.76 | 0.97 * | −0.91 | −0.37 | - | - | - |
| 11. Total dissolved solids | −0.93 | 0.95 * | 0.98 * | 0.73 | 0.92 | 0.76 | 0.97 * | −0.91 | −0.38 | 0.99 * | - | - |
| 12. Salinity | −0.70 | 0.75 | 0.97 * | 0.92 | 0.91 | 0.44 | 0.98 * | −0.67 | 0.00 | 0.91 | 0.91 | - |
Note. Significant correlations are indicated in bold. * p < 0.05; ** p < 0.01.
Table A5.
Multiple linear regression for macroinvertebrates (stepwise method).
| Adjusted R2 | Change in Adjusted R2 | β | t | |
|---|---|---|---|---|
| Family Blattidae | ||||
| FBI-PR | 0.87 | 0.92 | −0.96 * | −4.63 |
| Family Libellulidae | ||||
| FBI-PR | 0.94 | 0.96 | −0.98 * | −6.96 |
| Family Thiaridae | ||||
| BMWP-PR | 1.00 | 1.00 | −1.0 *** | −190.63 |
| Family Baetidae | ||||
| Temperature | 0.96 | 0.97 | 0.99 ** | 8.91 |
| Family Calamoceratidae | ||||
| Temperature | 0.89 | 0.93 | 0.96 * | 5.04 |
Note. * p < 0.05, ** p < 0.01, *** p < 0.001.
References
- Erős, T.; Lowe, W.H. The landscape ecology of rivers: From patch-based to spatial network analyses. Curr. Landsc. Ecol. Rep. 2019, 4, 103–112. [Google Scholar] [CrossRef] [Green Version]
- Millenium Ecosystem Assessment [MEA]. Guide to the Millennium Assessment Reports. 2005. Available online: https://www.millenniumassessment.org/en/Index-2.html (accessed on 12 March 2022).
- Grizzetti, B.; Liquete, C.; Pistocchi, A.; Vigiak, O.; Zulian, G.; Bouraoui, F.; Roo, A.; Cardoso, A.C. Relationship between ecological condition and ecosystem services in European rivers, lakes, and coastal waters. Sci. Total Environ. 2019, 671, 452–465. [Google Scholar] [CrossRef] [PubMed]
- Gao, J.; Yu, Z.; Wang, L.; Vejre, H. Suitability of regional development based on ecosystem service benefits and losses: A case study of the Yangtze River Delta urban agglomeration, China. Ecol. Indic. 2019, 107, 105579. [Google Scholar] [CrossRef]
- Rodrigues, J.M.G. Cultural services in aquatic ecosystems. In Ecosystem Services and River Basin Ecohydrology; Springer: Berlin/Heidelberg, Germany, 2015. [Google Scholar]
- Balvanera, P. Los servicios ecosistémicos que ofrecen los bosques tropicales. Ecosistemas 2012, 21, 136–147. [Google Scholar]
- Karabulut, A.; Egoha, B.N.; Lanzanova, D.; Grizzetti, B.; Bidoglio, G.; Pagliero, L.; Bouraoui, F.; Aloe, A.; Reynaud, A.; Maes, J.; et al. Mapping water provisioning services to support the ecosystem–water–food–energy nexus in the Danube River basin. Ecosyst. Serv. 2016, 17, 278–292. [Google Scholar] [CrossRef]
- Pedersen-Zari, M.; Hecht, K. Biomimicry for regenerative built environments: Mapping design strategies for producing ecosystem services. Biomimetics 2020, 5, 18. [Google Scholar] [CrossRef]
- Allen, G.H.; Pavelsky, T.M. Global extent of rivers and streams. Science 2018, 361, 585–588. [Google Scholar] [CrossRef] [Green Version]
- Freshwater Information System [FIS]. Regulating and Maintaining Ecosystem Services. 2022. Available online: http://fis.freshwatertools.eu/index.php/infolib/ecoservices/regulating-services.html (accessed on 29 October 2022).
- Van-Looy, K.; Tormos, T.; Souchon, Y.; Gilvear, D. Analyzing riparian zone ecosystem services bundles to instruct river management. Int. J. Biodivers. Sci. Ecosyst. Serv. Manag. 2017, 13, 330–341. [Google Scholar] [CrossRef]
- Xu, X.; Chen, M.; Yang, G.; Jiang, B.; Zhang, J. Wetland ecosystem services research: A critical review. Glob. Ecol. Conserv. 2020, 22, e01027. [Google Scholar] [CrossRef]
- Mourad, K.A.; Sang, J. Effectiveness of contour farming and filter strips on ecosystem services. Water 2018, 10, 1312. [Google Scholar] [CrossRef] [Green Version]
- Gao, H.; Qian, X.; Wu, H.; Li, H.; Pan, H.; Han, C. Combined effects of submerged macrophytes and aquatic animals on the restoration of a eutrophic water body: A case study of Gonghu Bay, Lake Taihu. Ecol. Eng. 2017, 102, 15–23. [Google Scholar] [CrossRef]
- Hauer, R.; Resh, V.H. Macroinvertebrates. Methods Stream Ecol. 2017, 1, 97–319. [Google Scholar]
- Hanson, P.; Springer, M.; Ramírez, A. Introducción a los grupos de macroinvertebrados acuáticos. Rev. Biol. Trop. 2010, 58, 3–37. [Google Scholar] [CrossRef]
- Gutiérrez, P.E.; Ramírez, A. Evaluación de la calidad ecológica de los ríos en Puerto Rico: Principales amenazas y herramientas de evaluación. Hidrobiológica 2016, 26, 433–441. [Google Scholar]
- Morán-Ordóñez, A.P.; Pavlova, A.; Pinder, A.M.; Sim, L.; Sunnucks, P.; Thompson, R.M.; Davis, J. Aquatic communities in arid landscapes: Local conditions, dispersal traits and landscape configuration determine local biodiversity. Divers. Distrib. 2015, 21, 1230–1241. [Google Scholar] [CrossRef]
- Stenert, C.; Íris, C.M.; Pires, M.M.; Knauth, D.S.; Katayama, N.; Maltchik, L. Responses of macroinvertebrate communities to pesticide application in irrigated rice fields. Environ. Monit. Assess. 2018, 190, 74. [Google Scholar] [CrossRef]
- Sumudumali, R.G.I.; Jayawardana, J.M. A Review of Biological Monitoring of Aquatic Ecosystems Approaches: With Special Reference to Macroinvertebrates and Pesticide Pollution. Environ. Manag. 2021, 67, 263–276. [Google Scholar] [CrossRef]
- Gutiérrez, P.E.; Loríon, C.M. Application of the BMWP-Costa Rica biotic index in aquatic biomonitoring: Sensitivity to collection method and sampling intensity. Rev. Biol. Trop. 2014, 62, 275–289. [Google Scholar] [CrossRef]
- López, E.; Sedeño, J.E. Biological indicators of water quality: The role of fish and macroinvertebrates as indicators of water quality. Biol. Indic. Water Qual. 2015, 37, 643–661. [Google Scholar] [CrossRef]
- Ruiz, R.A.; Sedeño-Díaz, J.E.; López-López, E. Calibrating and validating the Biomonitoring Working Party (BMWP) index for the Bioassessment of water quality in neotropical streams. Water Qual. 2017, 3, 39–58. [Google Scholar] [CrossRef] [Green Version]
- United States Environmental Protection Agency. Indicators: Benthic Macroinvertebrates. 2022. Available online: https://www.epa.gov/national-aquatic-resource-surveys/indicators-benthic-macroinvertebrates#:~:text=Benthic%20(meaning%20%E2%80%9Cbottom%2Ddwelling,snails%2C%20worms%2C%20and%20beetles (accessed on 13 March 2022).
- Valbuena, R.D.; Gualtero, D.M. Aquatic macroinvertebrates (Animalia: Invertebrata) of the area of influence of El Quimbo Hydroelectric Station, Huila, Colombia. Boletín Científico. Centro de Museos. Mus. Hist. Nat. 2021, 25, 15–31. [Google Scholar] [CrossRef]
- Nieves, E.; Rosas, K. Biodiversidad de Insectos Acuáticos Asociados a la Cuenca del Río Grande de Manatí; Departamento de Recursos Naturales: San Juan, PR, USA, 2009.
- La Nottea, A.; D’Amato, D.; Mäkinenc, H.; Paracchini, M.L.; Liquete, C.; Egogh, B.; Geneletti, D.; Crossman, N.D. Ecosystem services classification: A systems ecology perspective of the cascade framework. Ecol. Indic. 2017, 74, 392–402. [Google Scholar] [CrossRef] [PubMed]
- United Nations. Sustainable Developments Goals. 2015. Available online: https://sdgs.un.org/goals (accessed on 12 March 2022).
- U.S. Fish & Wildlife Service. Section 3. Definitions. Endangered Species Act. 1973. Available online: https://www.fws.gov/laws/endangered-species-act/section-3 (accessed on 12 March 2022).
- Boon, P.; Raven, P. River Conservation and Management; John Wiley & Sons: Hoboken, NJ, USA, 2012. [Google Scholar]
- Greger, K. What Is Preservation? The Living Systems Laboratory. 2016. Available online: https://wordpress.clarku.edu/fisherville/katie-articles/what-is-preservation/#:~:text=The%20Living%20Systems%20Laboratory%20is,and%20mushrooms%2C%20to%20remove%20toxins (accessed on 31 January 2022).
- Department of Natural and Environmental Resources [DNER]. Programa Ríos Patrimoniales de Puerto Rico. Designación Tipo 2: Tramos de los Ríos Que Nacen en los Bosques Protegidos por el DNER u Otras Áreas Protegidas. 2016. Available online: http://DNER.pr.gov/wp-content/uploads/formidable/Designaci%C3%B3nRíosPatrimoniales.pdf (accessed on 15 February 2022).
- Gutiérrez, P.E.; Alonso-Rodríguez, A.M.; Ramírez, A. Macroinvertebrados Acuáticos de Puerto Rico Como Bioindicadores de Calidad Ambiental; Universidad de Puerto Rico: Río Piedras, PR, USA, 2016. [Google Scholar]
- Castillo, D.; Garzón-Salamanca, L.L.; Albarracín-Caro, J.F. Aquatic macroinvertebrates as water quality bioindicators in Colombia: A systematic review. Neotrop. Biol. Conserv. 2018, 13, 235–248. [Google Scholar]
- Magallón, G.; Escalera, C.; López-López, E.; Sedeño-Díaz, J.E.; López-Hernández, M.; Arroyo-Damián, M.; Moncayo-Estrada, R. Water Quality Analysis in a Subtropical River with an Adapted Biomonitoring Working Party (BMWP) Index. Diversity 2021, 13, 606. [Google Scholar] [CrossRef]
- Ruiz, R.A.; Sedeño-Díaz, J.E.; López-López, E. Ensambles de macroinvertebrados acuáticos relacionados con diversos usos del suelo en los ríos Apatlaco y Chalma-Tembembe (cuenca del Río Balsas), México. Hidrobiológica 2016, 26, 443–458. [Google Scholar]
- Ruiz, R.A.; Kohlmann, J.E.; Sedeño-Díaz, E.; López-López, E. Assessing ecological impairments in neotropical rivers of Mexico: Calibration and validation of the Biomonitoring Working Party Index. Int. J. Environ. Sci. Technol. 2017, 14, 1835–1852. [Google Scholar] [CrossRef]
- Ruperto, J.M. Benthic Macroinvertebrates as Bioindicators of Water Quality in the Yaguez River, Mayaguez, Puerto Rico. Ph.D. Thesis, University of Puerto Rico, San Juan, PR, USA, 2008. Available online: https://scholar.uprm.edu/handle/20.500.11801/1099 (accessed on 12 March 2022).
- Potter, J.D.; McDowell, W.H.; Helton, A.M.; Daley, M.L. Incorporating urban infrastructure into biogeochemical assessment of urban tropical streams in Puerto Rico. Biogeochemistry 2014, 121, 271–286. [Google Scholar] [CrossRef]
- McDowell, R.W.; Larned, S.T.; Houlbrooke, D.J. Nitrogen and phosphorus in New Zealand streams and rivers: Control and impact of eutrophication and the influence of land management. N. Z. J. Mar. Freshw. Res. 2009, 43, 985–995. [Google Scholar] [CrossRef]
- Nieder, R.; Benbi, D.K.; Reichl, F.X. Reactive water-soluble forms of nitrogen and phosphorus and their impacts on environment and human health. In Soil Components and Human Health; Springer: Berlin/Heidelberg, Germany, 2018; pp. 223–255. [Google Scholar]
- Rusydi, A.F. Correlation between conductivity and total dissolved solid in various type of water: A review. In IOP Conference Series: Earth and Environmental Science; IOP Publishing: Bristol, UK, 2018; p. 012019. [Google Scholar]
- Environmental Protection Agency [EPA]. Contaminación por Nutrientes. 2022. Available online: https://espanol.epa.gov/espanol/contaminacion-por-nutrientes (accessed on 7 October 2022).
- Hilton, J.; Hare, M.; Bowes, M.J.; Jones, J.I. How green is my river? A new paradigm of eutrophication in rivers. Sci. Total Environ. 2006, 365, 66–83. [Google Scholar] [CrossRef]
Figure 1.
Sampling sites—adapted from Google Earth.

Figure 2.
Aquatic macroinvertebrates.

Figure 3.
Water quality observed at the four sites in the Lapa River and at the seven sample times (Site A = upstream-inside; Site B = downstream-inside; Site C = upstream-outside; and Site D = downstream-outside).
Figure 3.
Water quality observed at the four sites in the Lapa River and at the seven sample times (Site A = upstream-inside; Site B = downstream-inside; Site C = upstream-outside; and Site D = downstream-outside).

Figure 4.
Degree of contamination detected at the four sites in the Lapa River at the seven sample times (Site A = upstream-inside; Site B = downstream-inside; Site C = upstream-outside; and Site D = downstream-outside).
Figure 4.
Degree of contamination detected at the four sites in the Lapa River at the seven sample times (Site A = upstream-inside; Site B = downstream-inside; Site C = upstream-outside; and Site D = downstream-outside).

Table 1.
Classification of water quality according to values of BMWP-PR (adapted from Gutiérrez et al. [33]).
Table 1.
Classification of water quality according to values of BMWP-PR (adapted from Gutiérrez et al. [33]).
| BMWP-PR | Water Quality |
|---|---|
| ≥97 | Excellent |
| 77–96 | Good—not polluted or significantly altered |
| 57–76 | Regular—eutrophic, moderately contaminated |
| 37–56 | Poor—water contaminated |
| 18–36 | Poor—water very contaminated |
| ≤17 | Very poor—water extremely contaminated |
Table 2.
Classification of water quality according to the FBI-PR value (adapted from Gutiérrez et al. [33]).
Table 2.
Classification of water quality according to the FBI-PR value (adapted from Gutiérrez et al. [33]).
| FBI-PR | Water Quality | Extent of Pollution | Category |
|---|---|---|---|
| 0.00–4.24 | Excellent | Little organic contamination | 1 |
| 4.25–5.11 | Very good | Mild organic contamination | 2 |
| 5.12–5.98 | Good | Some organic contamination | 3 |
| 5.99–6.85 | Regular | Substantial organic contamination | 4 |
| 6.86–7.72 | Regular-poor | Very substantial organic contamination | 5 |
| 7.73–8.59 | Poor | Severe organic pollution | 6 |
| 8.60–9.46 | Very poor | Very severe organic pollution | 7 |
Table 3.
Water quality parameters and analytical methods for stream water source evaluation: on-site evaluation.
Table 3.
Water quality parameters and analytical methods for stream water source evaluation: on-site evaluation.
| Parameter | Analytical Method | Instrument |
|---|---|---|
| Acidity (pH) | Instrumental, analyze on-site | APERA INSTRUMENTS-PC60 Premium® Multiparameter probe |
| Salinity | Instrumental, analyze on-site | APERA INSTRUMENTS-PC60 Premium® Multiparameter probe |
| Total dissolved solids | Instrumental, analyze on-site | APERA INSTRUMENTS-PC60 Premium® Multiparameter probe |
| Temperature | Instrumental, analyze on-site | APERA INSTRUMENTS-PC60 Premium® Multiparameter probe |
| Dissolved oxygen | Instrumental, analyze on-site | CHEMets® Dissolved Oxygen Water Test |
| Stream velocity | Instrumental, analyze on-site | Stopwatch, calculator, and a ping pong ball |
| Turbidity | Instrumental, analyze on-site | Secchi disc |
Table 4.
Laboratory analyses of water quality parameters and analytical methods for stream water source evaluation.
Table 4.
Laboratory analyses of water quality parameters and analytical methods for stream water source evaluation.
| Parameter | Analytical Method | Instrument |
|---|---|---|
| Nitrite + Nitrate (NO2) + (NO3−) | ||
| Nitrate (NO3−) | Analyzed in laboratory | Plastic containers |
| Nitrite (NO2) | ||
| Ammonium (NH4+) | Analyzed in laboratory | Plastic containers |
| Phosphorus (PO43−) | Analyzed in laboratory | Plastic containers |
| Soluble reactive phosphorus (SRP) | Analyzed in laboratory | Plastic containers |
Table 5.
Statistical analysis plan for the study.
| Analysis | Description |
|---|---|
| BMWP-PR index | To determine water quality (BMWP-PR). |
| FBI-PR index | To determine the degree of contamination (FBI-PR). |
| One-factor analysis of variances (ANOVA) | To analyze the differences in means between the four sampling sites according to the variables of interest of the study (i.e., number of macroinvertebrates, water quality, degree of contamination, and physicochemical parameters). |
| Multiple linear regression | To explore the predictive power of water quality (BMWP-PR), degree of contamination (FBI-PR), and physicochemical parameters (nitrate, nitrite, ammonia/ammonia, phosphorus, and soluble reactive phosphorus, temperature, pH, conductivity, total dissolved solids, and salinity) in the variation of macroinvertebrate families. |
| Pearson correlation | To determine if there is a statistically significant relationship between the water quality (BMWP-PR) and the physicochemical parameters (nitrate, nitrite, ammonia/ammonia, phosphorus, and soluble reactive phosphorus, temperature, pH, conductivity, total dissolved solids, and salinity). |
| Pearson correlation | To determine whether there is a statistically significant relationship between the degree of contamination (FBI-PR) and the physicochemical parameters (nitrate, nitrite, ammonia/ammonia, phosphorus, soluble reactive phosphorus, temperature, pH, conductivity, total dissolved solids, and salinity). |
Disclaimer/Publisher’s Note: The statements, opinions and data contained in all publications are solely those of the individual author(s) and contributor(s) and not of MDPI and/or the editor(s). MDPI and/or the editor(s) disclaim responsibility for any injury to people or property resulting from any ideas, methods, instructions or products referred to in the content. |
© 2023 by the authors. Licensee MDPI, Basel, Switzerland. This article is an open access article distributed under the terms and conditions of the Creative Commons Attribution (CC BY) license (https://creativecommons.org/licenses/by/4.0/).
Share and Cite
MDPI and ACS Style
Orozco-González, C.E.; Ocasio-Torres, M.E. Aquatic Macroinvertebrates as Bioindicators of Water Quality: A Study of an Ecosystem Regulation Service in a Tropical River. Ecologies 2023, 4, 209-228. https://doi.org/10.3390/ecologies4020015
AMA Style
Orozco-González CE, Ocasio-Torres ME. Aquatic Macroinvertebrates as Bioindicators of Water Quality: A Study of an Ecosystem Regulation Service in a Tropical River. Ecologies. 2023; 4(2):209-228. https://doi.org/10.3390/ecologies4020015
Chicago/Turabian StyleOrozco-González, Christopher E., and María E. Ocasio-Torres. 2023. "Aquatic Macroinvertebrates as Bioindicators of Water Quality: A Study of an Ecosystem Regulation Service in a Tropical River" Ecologies 4, no. 2: 209-228. https://doi.org/10.3390/ecologies4020015