Article

The Effects of Roundup™ on Benthic Microbial Assemblages

by
Shannon P. Weatherley
,
Hannah K. Laird
,
Caitlyn M. Gatley-Montross
and
Sarah B. Whorley
*
Department of Natural Sciences, Daemen University, 4380 Main St., Amherst, NY 14226, USA
*
Author to whom correspondence should be addressed.
Ecologies 2022, 3(4), 557-569; https://doi.org/10.3390/ecologies3040041
Submission received: 11 October 2022 / Revised: 22 November 2022 / Accepted: 22 November 2022 / Published: 24 November 2022

Abstract

:
Given the wide usage of Roundup, a common herbicide, the impacts of its presence in ecological communities are of great interest. Many studies have investigated the effects of glyphosate, the active ingredient in Roundup, on different factions of an ecosystem including on animals, plants, microorganisms, and nutrients. The current study expanded upon these works using Roundup instead of glyphosate to provide a realistic application in which to observe the development of microbial assemblages and nutrient composition in two different habitats. Winogradsky columns were prepared using benthic material from a ditch and a pond. Varying concentrations of Roundup were introduced to the columns at the beginning of the study and microbial growth and nutrient compositions from each column were measured weekly. The results indicate that the presence of Roundup has varying effects on microorganisms and nutrients. While photosynthetic microbes were negatively impacted, a shift in the microbial composition to heterotrophic microbes indicates that these microorganisms were able to utilize some ingredients in Roundup as a nutrient source. Additionally, the temporal analysis of nutrient compositions indicated that microbes metabolize glyphosate starting with the phosphate moiety even when the other compounds in Roundup are present. While these trends were observed in both benthic habitats, the composition of the ecological community can affect its ability to utilize the ingredients in Roundup as a nutrient source.

1. Introduction

Ecosystems cycle valuable natural resources including nutrients such as carbon, nitrogen, and phosphorus [1]. Nutrients enter and move throughout the environment in numerous ways such as decomposition, organismal respiration, photosynthesis, and other metabolic processes [2]. Organisms within ecosystems and allochthonous nutrients entering an ecosystem all play a large role in nutrient cycling [1]. Microbial organisms, such as bacteria, are a key constituent in ecosystem nutrient cycling. However, they are often an understudied sector due to their vast and under-described biodiversity and diverse metabolic processes [3].
In aquatic ecosystems, phosphorus can come from terrestrial runoff via the weathering of stones, soil erosion, and runoff of human-made products (fertilizers and pesticides) [4]. Microbes often release free ortho-phosphate from inorganic substrates or incorporate that phosphorus into their biomass, serving as a food source for higher trophic levels [5]. Another important nutrient common in many aquatic ecosystems is nitrogen. Nitrogen enters the aquatic ecosystem through fixation of nitrogen gas and additional ammonium from the sediment. Microbes and select plant species can perform nitrogen fixation which allows for the intake of nitrogen. Microbes circulate various forms of nitrogen through the nitrogen cycle creating pools of ammonium, nitrite, and nitrate [6].
Microbes also utilize organic carbon as an energy source [1,7], making them crucial in the formation, transformation, and storage of natural organic matter (NOM) in environments such as soil and freshwater [8]. Once NOM becomes dissolved in water, it becomes dissolved organic matter (DOM) [8]. Specifically, in an aquatic ecosystem, aquatic bacteria use organic carbon for respiration and growth [9]. The availability of organic materials is crucial to a microbial community as microbe metabolism is dependent on a carbon source [8,9]. NOM is characterized by the measurement of total organic carbon (TOC) or dissolved organic carbon (DOC), which is specifically organic carbon that is present after filtration via a 0.45 μm filter [10]. TOC measures the total amount of carbon in organic compounds in aqueous solutions including DOC and non-dissolved organic carbon (NDOC) [11]. While the measurement of organic carbon is dependent on the methods utilized in the study, the collected values can be a useful measurement to investigate nutrients available for microbes to metabolize.
A convenient, inexpensive approach to studying ecosystems, microbes, and changes in nutrient cycling utilizes a Winogradsky column [12]. Using an environment’s soil, water, nutrients, and microbial organisms, Winogradsky columns create aerobic and anaerobic gradients promoting the growth of different collections of microorganisms [13]. Microbes develop in these defined zones from different concentration gradients of nutrients, light, oxygen, and sulfur [13]. With the assistance of the columns, scientists are able to control and observe many variables and processes that are difficult to observe in situ [12].
Of the anthropogenic substances that can affect both terrestrial and aquatic ecosystems, glyphosate, a commonly used herbicide, is heavily investigated [14,15,16]. Glyphosate is a nonselective, systemic, post-emergent herbicide known to control more than 150 plant species [17,18]. Glyphosate’s control mechanism targets an enzyme in the shikimate metabolic pathway [17,18]. Shikimic acid pathway is defined as the biosynthetic sequence in plants and microbes to produce the aromatic amino acids phenylalanine (Phe), tyrosine (Tyr), and tryptophan (Trp). After applying glyphosate to the plant, the herbicide enters through leaf tissues and travels to the active growing regions, where it inhibits the activity of the enzyme called 5-enol-pyruvyl-shikimate-3-phosphate synthase (EPSPS) [18]. By blocking this enzyme, glyphosate prevents the biosynthesis of aromatic amino acids, which eliminate the production of Phe, Tyr, and Trp through the shikimic pathway [18]. However, many manufactured toxins affect more organisms than their intended target organisms. Glyphosate has been found to adversely affect numerous other organisms ranging from unicellular organisms such as some fungi [19] and microbes [20,21] and algae [22] to multicellular organisms such as earthworms [23,24,25], and complex vertebrates such as humans [26,27,28] (for a thorough review see [29]).
Glyphosate has been applied onto agricultural fields such as corn or soybean fields as well can be applied directly to wetlands and aquatic areas [14,30]. While glyphosate has shown to be a toxic pesticide to animals, glyphosates inclusion within other formulations, such as Roundup, can produce a more dangerous chemical mixture [31]. The contamination of aquatic environments is evident given the broad usage of the herbicide and runoff from fields and other terrestrial areas [14,32]. A recent study explored phosphorus nutrient cycling in invasive Phragmites australis stands along the Lake Erie shoreline. This study examined nutrient availability (nitrogen and phosphorus) and net primary production following application of glyphosate. After glyphosate application, both nutrient availability and net primary production had decreased, although there was a rebound after a single spray [32].
In this experiment, two different aquatic ecosystems were studied, one exposed to high levels of run off from roadways and agricultural fields and another in a secluded area less prone to run off. Microcosms of both ecosystems were dosed with varying concentrations of glyphosate and the microbial growth and nutrient levels monitored for the next 8 weeks. We hypothesize that increasing concentrations of glyphosate will negatively affect benthic microbial assemblages by delaying development time and decreasing abundance and will reduce microbial ability to metabolize Roundup components into constituent nutrient functional groups, thereby reducing the amount of nutrient ions available for cycling.

2. Materials and Methods

2.1. Winogradsky Column Construction

This experiment used benthic material from a pond and a ditch in eastern Niagara County, NY, USA, originally belonging to the Wenrohronon Tribe, to create Winogradsky columns [33]. Eastern Niagara County comprises mostly rural areas with some suburban areas. It is comprised by a majority of wetland habitat which was formerly covered by Lake Ontario thousands of years ago, where the soil is a mixture of Appleton soil, Hilton soil, Sun soil, and a majority of minor soils which gives the soil a silt loam surface layer as well as a heavy loam subsoil [34].
Winogradsky columns were made using 2 L (30 cm height × 10 cm diameter) clear plastic bottles with the top 5 cm cut off [35,36]. The bottom 25%, 5 cm, were filled with a mixture of either the ditch or pond benthic material with cut-up newspaper, 2 egg yolks, and 2 eggshells [36]. The middle layer was 50%, 10 cm, of the bottle filled with either the pond or the ditch benthic material, respectively [36]. The top portion of the bottle was filled with rainwater approximately 5 cm above the middle layer [36]. Different concentrations of glyphosate from Roundup (Concentrate Plus with 18% glyphosate, 0.73% diquat dibromide, EPA Reg No. 71995-29) were prepared: 7.2 g/L glyphosate (herein known as 1x), 14.4 g/L glyphosate (herein known as 2x), and 21.6 g/L glyphosate (herein known as 3x) [37]. All concentrations were prepared using rainwater collected from the site. The final experimental design resulted in six columns for each concentration with three columns containing pond mud and three columns containing ditch mud. Columns were placed on a bench top exposed to natural light with a grid design. Each week, a random number generator was used to rotate the location of the columns to ensure even exposure to sunlight.

2.2. Microbe and Water Chemistry Sampling

Each week for seven weeks, starting with the second week of incubation, water samples were removed and microbial growth was measured. For each identified colony, color (RBG numbers) was recorded using the Color Picker app developed by Achim Heynen on iOS. A Vernier (Beaverton, OR, USA) pH sensor (PH-BTA) with LabQuest2 (Beaverton, OR, USA) interface was used to measure the pH of the standing water. A 10 mL sample of water was collected and filtered through a 0.2 μm syringe filter and preserved with 12.25% H2SO4 then stored at 4 °C until later analysis [38]. New, undosed, rainwater was then added to each column to replace what was sampled and lost through evaporation. All containers and pipette tips were acid washed in 10% HCl to remove residual nutrient ions. Collected water samples were analyzed for N-NH4+, P-PO4, and N-NO32− following colorimetric assays [38]. Assay range for N-NH4+ was [0.05–4.0 mg/L], range for P-PO4 was [0.01–2.0 mg/L], and the range for N-NO32− was [0.02–5.0 mg/L]. Any samples over the specified range were diluted for analysis. Samples were analyzed on an Astoria-Pacific rAPID-T nutrient analyzer (Clackamas, OR, US). Due to the limited budget and available instrumentation, the DOC concentrations were obtained using a Thermo scientific Genesys 180 UV-Visible spectrophotometer measuring the absorbance at 254 nm. (Waltham, MA, USA) [39]. A calibration curve was generated using a series of diluted Roundup samples. The absorbance of the samples was measured and the DOC was determined using a Shimadzu total carbon analyzer (Kyoto, Japan) to obtain DOC by the University of Buffalo’s Department of Geology (Figure S1).

2.3. Statistical Analyses

The normality of the data was checked by Shapiro–Wilks test and found to be normal. A chi-squared test was used to determine differences in purple sulfur bacteria (PSB) colony formation between habitats. A 2-way repeated-measures analysis of variance (ANOVA) and post-hoc Bonferroni test were used to determine differences in PSB red color, nutrient, and DOC concentrations across habitat, Roundup concentrations, across the weeks of sampling. All statistics were performed in SYSTAT v.13 (IBM Corp., Armonk, NY, USA) with a critical alpha of 0.05.

3. Results

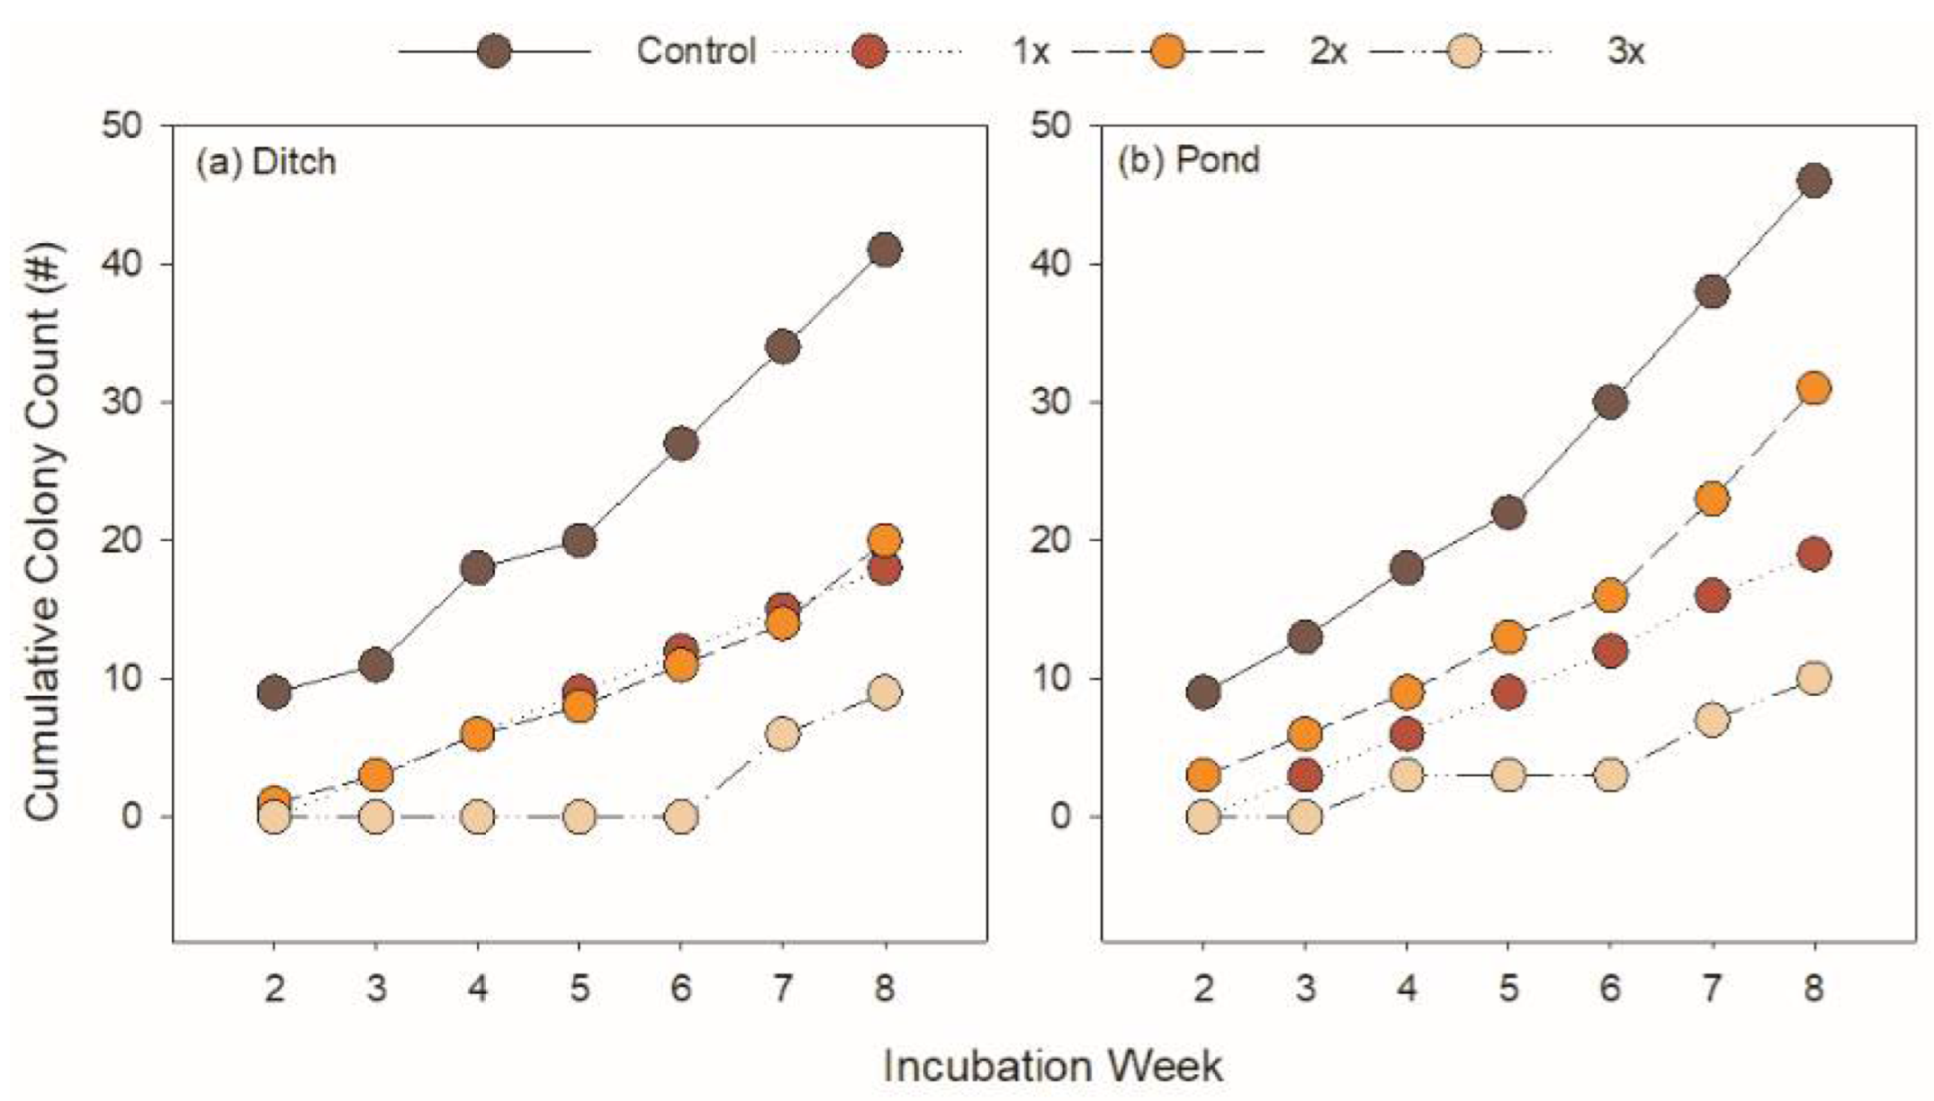
3.1. Roundup Reduces Microbial Productivity

Microbial growth varied between substrates from different habitats. Growth was assessed by enumeration of visible colony formation through the Winogradsky column. A total of 105 colonies were observed from the pond habitat while only 90 colonies were observed from the ditch habitat. These colonies were likely purple sulfur bacteria (PSB) as they occurred in the sediments below the sediment-water interface and were a deep red color. Control columns in each habitat had the soonest and most prolific microbial growth, starting in the second week of incubation with an average of three colonies in each replicate, for both the ditch and pond habitat. The highest concentration of Roundup did not produce any visible microbial growth in the pond until the fourth week with a latent burst of development at week seven. No noticeable growth occurred in the highest Roundup concentration in the ditch until the seventh week; however, the soils were considerably darker and it was more challenging to measure colonies.
Visible microbial colonies accumulated in all treatments for both habitats. Control Winogradsky columns typically had double the number of visible colonies compared with all Roundup treatments (Figure 1). However, the differences between cumulative counts within each habitat were never significantly greater in either the ditch (χ2df = 18 = 28.20, p = 0.06) or pond (χ2df = 18 = 18.84, p = 0.40). Colony developments in the 1x and 2x treatments were very similar across both habitats.
The color of each measured PSB colony changed considerably over time. Between the ditch (Figure 2) and pond (Figure 3) habitat, the intensity of the red portion of colony color was not different (p = 0.10), where ditch PSB averaged a red-color measurement of 134.7 ± 5.5 (out of 255 maximum value) and pond PSB colonies averaged 123.2 ± 4.3. However, within each habitat, the PSB were affected by the addition of Roundup differently. Within the ditch habitat, the highest red values were observed in the 2x Roundup treatment (159.6 ± 6.5), but dropped off sharply in the 3x treatment to a low of 95.4 ± 21.9 (F3,86 = 5.90, p < 0.01). Over the course of the incubation, red color gradually increased, reaching a high of 159.6 ± 10.8 by week 8 (F6,83 = 4.37, p < 0.01).
In the pond sediments, PSB reacted differently. Colony color exhibited similar differences across Roundup treatments, where the most intense red color could be found in the 1x treatment (152.3 ± 7.5), and the lowest color was found in the 3x treatment (116.8 ± 11.1) (F3,10 = 4.58, p = 0.01). However, red-intensity decreased over time, to its lowest values during the final week of incubation (119.0 ± 9.3). There was no significant difference in colony color from week to week within the pond habitat (F6,98 = 1.03, p = 0.41).

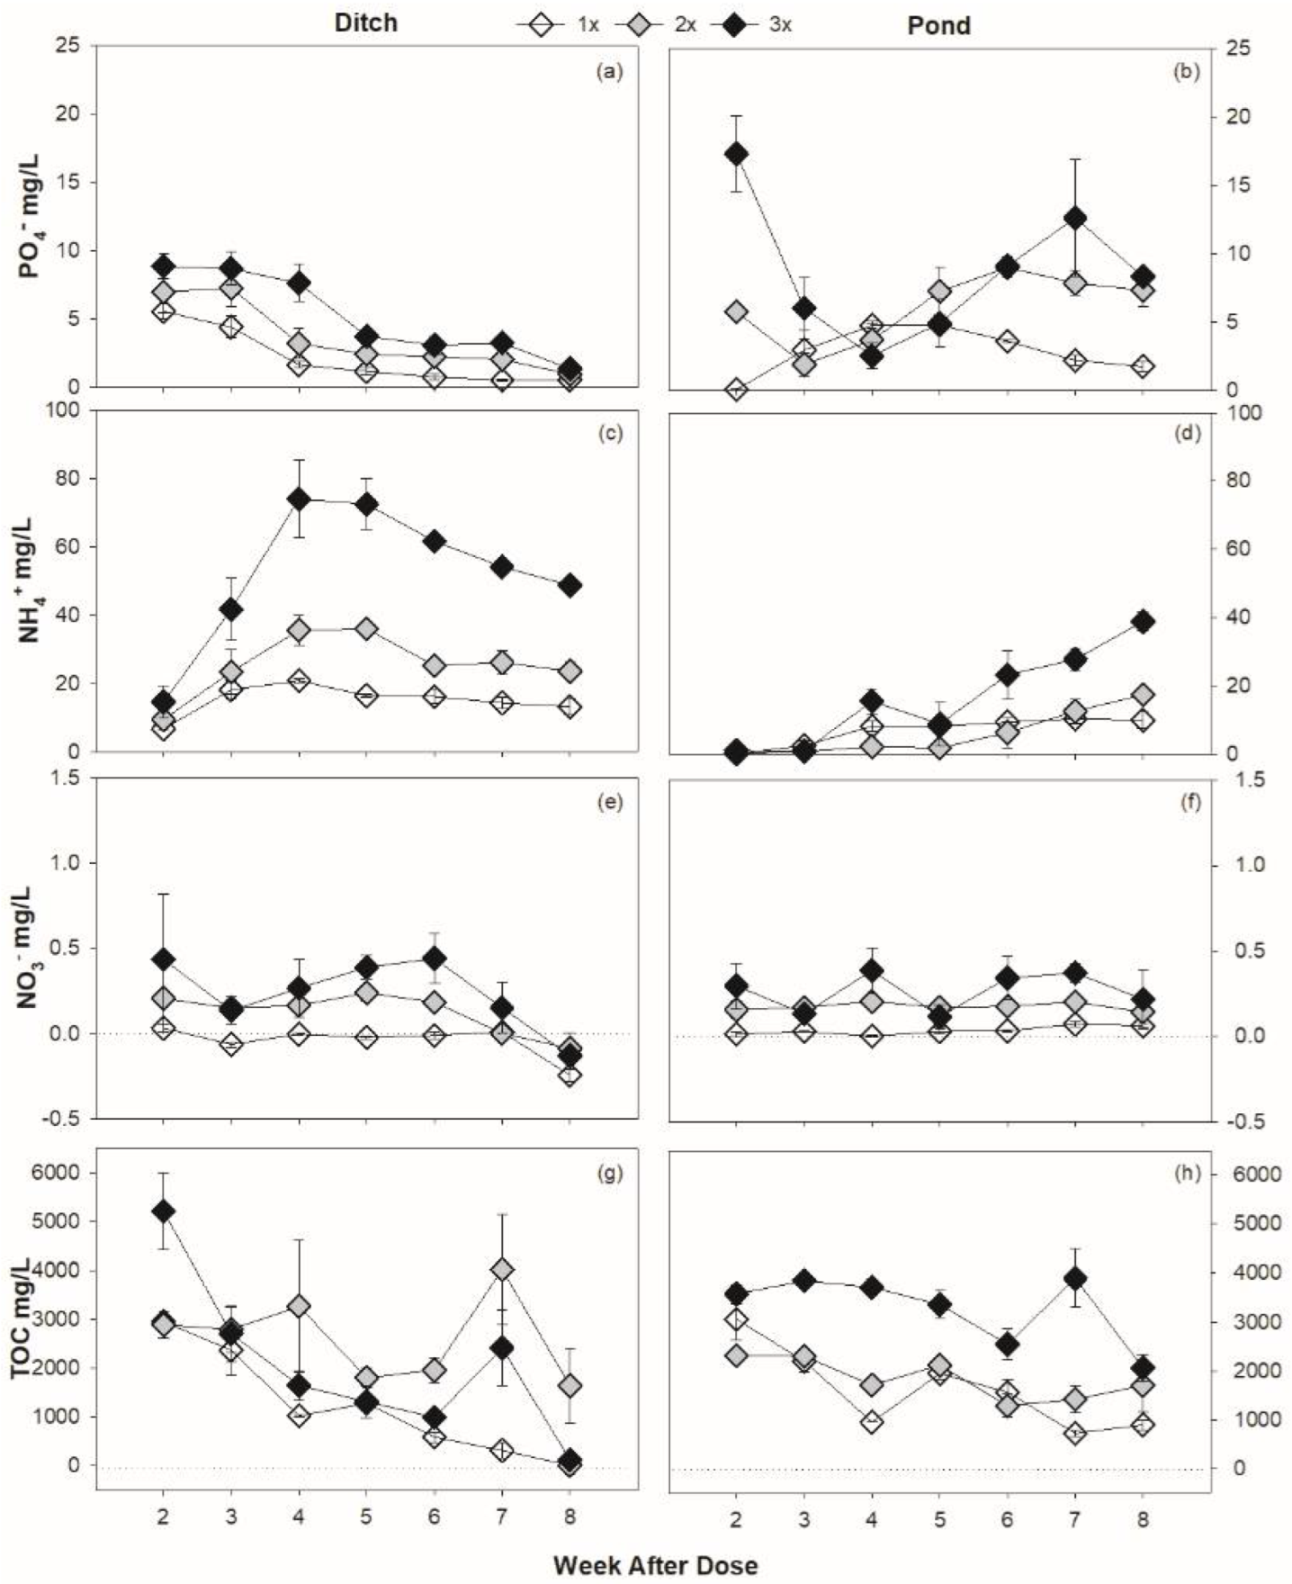
3.2. Roundup Serves as Nutrient Source

Across both habitats and all treatments, phosphate and ammonium concentrations increased with the addition of Roundup (Table 1). However, the pattern of phosphate (F1,16 = 14.54, p < 0.01) and ammonium (F1,16 = 236.45, p < 0.01) was different between the ditch and pond (Figure 4a–d). Nutrient concentrations typically significantly decreased over time following the addition of Roundup (Table 2). Phosphate concentrations increased initially with the addition of Roundup, and higher amounts of Roundup resulted in higher concentrations of phosphate, but these elevated levels decreased by the fourth week. Roundup additions resulted in a maximum average of 7.15 mg/L above control in the ditch and 7.70 mg/L above control in the pond, both during the second week of incubation. Ammonium followed a similar trend as phosphate, reaching an average maximum of 43.52 mg/L in the ditch during the second week and 22.18 mg/L in the pond over control, but not until the final week of incubation. Nitrate concentrations were consistently low and never exhibited a peak throughout the incubation period. Nitrate concentrations were also not different between habitats (F1,16 = 1.53, p = 0.23).
Differences between habitats were further made clear by overall temporal patterns. Both phosphate (F6,96 = 15.82, p < 0.01) and ammonium (F6,96 = 16.75, p < 0.01) exhibited very different patterns of nutrient availability through time in each habitat (Table 2). Within the ditch, clear and consistent patterns were observed for each of these nutrients. In the ditch phosphate availability peaked early in the incubation period; however, the pond did not display a consistent pattern of availability. Similarly, for ammonium, the ditch demonstrated a delay in availability and then a gradual draw-down, whereas the pond did not see ammonium increasing in availability until much later in the incubation period.

3.3. DOC Trends Vary by Habitat

Dissolved organic carbon (DOC) concentrations did not exhibit clear patterns in either the ditch or pond habitat, nor across Roundup application treatments, but generally decreased over time (Figure 4g,h). Despite the lack of clear patterns, several significant differences were found (Table 2) and DOC measurements were typically less variable than other nutrient compounds, where the average error across DOC replicates was 9% compared to 24% for phosphate and ammonium (Table 2). Generally, ditch habitat columns contained 372.9 mg/L DOC more than pond columns (F1,16 = 15.93, p = 0.001).
When examining the relationship between DOC and other nutrient compounds, several notable relationships emerge (Table 3). In ditch habitat columns, DOC exhibited a positive significant relationship with phosphate (r = 0.61, p < 0.01), driven largely by measurements from control columns and the lowest concentration of Roundup addition. Interestingly, DOC also exhibited a positive, significant relationship with phosphate in the pond columns (r = 0.57, p < 0.01); however, within each treatment the relationship was negative (Table 3). Ammonium and DOC exhibited few noteworthy relationships, especially in the ditch columns, where only the 3x treatment demonstrated a significantly negative relationship (r = −0.70, p < 0.01). There were more significant relationships in the pond columns; however, similarly to phosphate the overall trend showed an increase in DOC with increasing ammonium, while within Roundup treatments the relationship was strongly negative. DOC exhibited few relationships with nitrate. While there was a significantly positive trend in both the ditch (r = 0.30, p = 0.02) and pond (r = 0.55, p < 0.01), there were few significant relationships within each treatment.

4. Discussion

4.1. Roundup Harms Photosynthetic Microbes

This study investigated the effect of Roundup (glyphosate) concentration on microbial development and available nutrient concentrations in different wetland habitats. While many previous studies have investigated the effect of glyphosate [14,40,41], fewer have investigated effects of glyphosate in a commercially available product [32,37], which this study has done here. Overall, our findings showed that while photosynthetic microbes, such as purple sulfur bacteria, are negatively affected by the glyphosate in Roundup [22,40], other microbes experienced minimal effects by displaying the ability to ready breakdown glyphosate into useful nutrient compounds [42,43]. Differences between habitats in both microbial growth and nutrient cycling are likely due to differences in legacy anthropogenic effects and substrate properties [40].
The pond habitat was isolated and consisted of clay sediment while the ditch habitat contained largely organic matter due to road run off and other sources. Clay habitats typically reduce microbial growth due to the lack of available nutrients in the water column [44,45]. Positively charged nutrients, such as NH4+, are readily adsorbed to the clay and slow the mineralization process, reducing microbial growth [46,47]. However, between the control groups of the pond and ditch, no significant difference in microbial growth was observed through the course of the study.
The growth and composition of the microbes were also investigated with regards to glyphosate concentrations. Previous studies have established the composition of a microbial community can be either positively or negatively affected by the presence of glyphosate. The pesticide negatively affects photosynthetic microbes, such as purple sulfur bacteria, via disruption of the shikimate pathway; however, heterotrophic microbes can utilize glyphosate as a nutrient source [14,40]. This will selectively inhibit photosynthetic microbes while inducing growth in heterotrophic microbes. This trend is inconsistently observed in our results, with the delayed growth of visible microbial colonies until weeks four and seven for the highest concentration of glyphosate in the pond and ditch, respectively. Purple sulfur bacterial (PSB) growth was greatly reduced with increasing concentrations of Roundup in both habitats. However, a decrease in PSB color was only observed in the pond habitat. The increase in red color in the ditch PSB may be due to more steady nutrient availability, compared to the pond where clay sediments adsorbed nutrient ions more readily (see below). Many published studies investigating the effect of glyphosate on microbes have utilized pure glyphosate as opposed to Roundup [14]. However, the use of Roundup in this study, which could provide more realistic data on the environmental effects of the usage of glyphosate, means that other compounds contained in the Roundup solution are present and could be affecting our results.

4.2. Roundup Is a Source of Nutrients

All nutrients assessed were affected to some degree by Roundup concentration. Phosphate significantly increased in both habitats with the addition of Roundup. However, over time the phosphate eventually decreased in both habitats. This trend indicates the first stage in the mineralization of the glyphosate within Roundup, the removal of the phosphate group on the end of glyphosate via microbe metabolism [14,48]. This trend also supports the hypothesis that glyphosate can be utilized as a nutrient source. Between the pond and the ditch, a clear, temporal trend in initial phosphate increase followed by a significant decrease was observed for the ditch across all treatments. A less clear pattern was seen in the pond.
Ammonium concentrations similarly increased in both habitats after the addition of Roundup. This initial increase occurred later than phosphate, during week 4 in the ditch followed by a significant decrease over time. The trend continues to the support the mineralization of glyphosate hypothesis; the increase in ammonium within the water column comes from the metabolism of the amine group in glyphosate by the microbes, exposed after the removal of the phosphate group [40]. As was seen with the phosphate concentrations, the trend of ammonium concentrations was more chaotic in the pond.
One possible explanation for these differences in nutrient availability patterns between the pond and ditch habitat is that the microbial community within the sediments is drastically different between the two habitats. Ditch microbial assemblages are exposed to constant run off from roads and other sources, skewing the assemblage toward heterotrophic microbes regularly exposed to pesticide, salt, and other stressful chemicals. The pond, however, is an isolated, clay sediment habitat which could support a different starting culture of microbes that do not metabolize glyphosate in the same manner as the ditch microbial community. Further, charged nutrient molecules, such as ammonium and phosphate, could have been adsorbed to clay sediments as has been observed with other nutrient ions [49,50,51].

4.3. Roundup Alters Carbon Availability

Carbon is another vital source required for microbial growth. The need for liable carbon generates a close relationship between DOC concentrations and microbial growth. An initial decrease in DOC correlates with microbial growth, followed by a steady state phase where the microbial community is maintained [8]. While DOC concentrations in this study did not provide clear trends, there was an overall general decrease in DOC over time indicating microbial growth.
Carbon content exhibits close relationships with other nutrients in the water column. Mineralization of phosphorus can be driven by the need for carbon in microbial environments, leading to a positive correlation between phosphorus and DOC concentrations [52]. Within the ditch and pond habitats, an overall positive correlation was observed between phosphate and DOC concentrations, indicating that as phosphorus is utilized, so is carbon. Interestingly, when comparing DOC to phosphate concentrations for the pond control, a significant negative correlation was found. This could be a result of the habitat sediment. DOC availability is affected by the sediment of the aquatic environment, with a positive correlation to clay/silt and a negative correlation to clay [53]. Clay can interact with organic matter in the water column, thereby decreasing the DOC available to microbes [46,47]. This correlation could explain the significant negative correlation observed in the control treatment of the pond.

5. Conclusions

Many previous studies have examined the effect of glyphosate on microbial communities. However, few have tested how microbial communities react to glyphosate in its most common form of delivery, Roundup. This study has shown that glyphosate in Roundup will harm photosynthetic microbes while serving as a nutrient source for heterotrophic microbes. Additionally, the temporal analysis of these nutrient patterns reveals the preferred order of breakdown of the glyphosate molecule, even with the other components of Roundup present. These findings further support the hypothesis that while Roundup may be useful for controlling invasive and unwanted plants in wetland habitats, overuse of Roundup can act as a nutrient source and lead to further eutrophication of aquatic habitats.

Supplementary Materials

The following supporting information can be downloaded at: https://www.mdpi.com/article/10.3390/ecologies3040041/s1, Figure S1: Calibration curve used to transform spectrophotometric absorbances to DOC mg/L.

Author Contributions

All authors contributed towards experimental design, data collection and analysis, as well as manuscript writing and editing. S.P.W. and H.K.L. collected samples and performed initial data collection and analysis. S.B.W. and C.M.G.-M. performed further statistical analysis and manuscript composition. All authors contributed to proof reading and editing of manuscript. All authors have read and agreed to the published version of the manuscript.

Funding

This research received no external funding.

Institutional Review Board Statement

Not applicable.

Informed Consent Statement

Not applicable.

Acknowledgments

The authors would like to thank Daemen University for providing funding for this work through internal Think Tank development grants awarded to H.K.L. and C.M.G. S.B.W. and S.P.W. would additionally like to thank the students in Daemen University’s Environmental Toxicology course of Fall 2020 for their work in the initial collection of data: Kaitlyn Bulega, Dominic Clementi, Justin Fang, Parker Kelly, Daniela Mateo, Rachel Mathews, Amber Oczowinski, Sarah O’Shei, Andrew Thorp, and Elizabeth Vlahakis.

Conflicts of Interest

The authors declare no conflict of interest.

References

  1. Vanni, M.J. Nutrient cycling by animals in freshwater ecosystems. Annu. Rev. Ecol. Syst. 2002, 33, 341–370. [Google Scholar] [CrossRef] [Green Version]
  2. Bormann, F.H.; Likens, G.E. The Nutrient Cycles of an Ecosystem. Sci. Am. 1970, 223, 92–101. [Google Scholar] [CrossRef]
  3. Arrigo, K.R. Marine microorganisms and global nutrient cycles. Nature 2005, 437, 349–355. [Google Scholar] [CrossRef] [PubMed]
  4. Wetzel, R.G. Limnology: Lake and River Ecosystems, 3rd ed.; Academic Press: San Diego, CA, USA, 2001. [Google Scholar]
  5. Tian, J.; Ge, F.; Zhang, D.; Deng, S.; Liu, X. Roles of phosphate solubilizing microorganisms from managing soil phosphorus deficiency to mediating biogeochemical P cycle. Biology 2021, 10, 158. [Google Scholar] [CrossRef] [PubMed]
  6. Ricklefs, R.E.; Miller, G.L. Ecology, 4th ed.; W. H. Freeman and Company: New York, NY, USA, 2000. [Google Scholar]
  7. Sim, J.X.; Drigo, B.; Doolette, C.L.; Vasileiadis, S.; Karpouzas, D.G.; Lombi, E. Impact of twenty pesticides on soil carbon microbial functions and community composition. Chemosphere 2022, 307, 135820. [Google Scholar] [CrossRef] [PubMed]
  8. Wu, X.; Wu, L.; Liu, Y.; Zhang, P.; Li, Q.; Zhou, J.; Hess, N.J.; Hazen, T.C.; Yang, W.; Chakraborty, R. Microbial interactions with dissolved organic matter drive carbon dynamics and community succession. Front. Microbiol. 2018, 9, 1234. [Google Scholar] [CrossRef] [Green Version]
  9. Berggren, M.; Laudon, H.; Jansson, M. Aging of allochthonous organic carbon regulates bacterial production in unproductive boreal lakes. Limnol. Oceanogr. 2009, 54, 1333–1342. [Google Scholar] [CrossRef] [Green Version]
  10. Sillanpää, M.; Matilanien, A.; Lahtinen, T. Characterization of NOM. In Natural Organic Matter in Water, 1st ed.; IWA Publishing: London, UK, 2014. [Google Scholar]
  11. Grasset, C.; Rodriguez, C.; Delolme, C.; Marmonier, P.; Bornette, G. Can soil organic carbon fractions be used as functional indicators of wetlands? Wetlands 2017, 37, 1195–1205. [Google Scholar] [CrossRef]
  12. Babcsányi, I.; Meite, F.; Imfeld, G. Biogeochemical gradients and microbial communities in Winogradsky columns established with polluted wetland sediments. FEMS Microbiol. 2017, 93, fix089. [Google Scholar] [CrossRef]
  13. Rundell, E.A.; Banta, L.M.; Ward, D.V.; Watts, C.D.; Birren, B.; Esteban, D.J. 16S rRNA gene survey of microbial communities in Winogradsky columns. PLoS ONE 2014, 9, e104134. [Google Scholar] [CrossRef]
  14. Lu, T.; Xu, N.; Zhang, Q.; Zhang, Z.; Debognies, A.; Zhou, Z.; Sun, L.; Qian, H. Understanding the influence of glyphosate on the structure and function of freshwater microbial community in a microcosm. Environ. Pollut. 2020, 260, 114012. [Google Scholar] [CrossRef] [PubMed]
  15. Perez, G.L.; Vera, M.S.; Miranda, L.A. Effects of herbicide glyphosate and glyphosate-based formulations on aquatic ecosystems. In Herbicides and Environment, 1st ed.; Kortekamp, A., Ed.; InTech: New York, NY, USA; pp. 343–368.
  16. Sang, Y.; Mejuto, J.C.; Xiao, J.; Simal-Gandara, J. Assessment of glyphosate impact on the agrifood ecosystem. Plants 2021, 10, 405. [Google Scholar] [CrossRef] [PubMed]
  17. Helander, M.; Saloniemi, I.; Saikkonen, K. Glyphosate in northern ecosystems. Trends Plant Sci. 2012, 10, 569–574. [Google Scholar] [CrossRef] [PubMed]
  18. Kanissery, R.; Gairhe, B.; Kadyampakeni, D.; Batuman, O.; Alferez, F. Glyphosate: Its environmental persistence and impact on crop health and nutrition. Plants 2019, 8, 499. [Google Scholar] [CrossRef] [PubMed] [Green Version]
  19. Estok, D.; Freedman, B.; Boyle, D. Effects of the herbicides 2,4-D, glyphosate, hexazinone, and triclopyr on the growth of three species of ectomycorrhizal fungi. Bull. Environ. Contam. Toxicol. 1989, 42, 835–839. [Google Scholar] [CrossRef] [PubMed]
  20. Newman, M.M.; Hoilett, N.; Lorenz, N.; Dick, R.P.; Liles, M.R.; Ramsier, C.; Kloepper, J.W. Glyphosate effects on soil rhizosphere-associated bacterial communities. Sci. Total Environ. 2016, 543, 155–160. [Google Scholar] [CrossRef] [PubMed] [Green Version]
  21. Shehata, A.A.; Schrödl, W.; Aldin, A.A.; Hafez, H.M.; Krüger, M. The effect of glyphosate on potential pathogens and beneficial members of poultry microbiota in vitro. Curr. Microbiol. 2013, 66, 350–358. [Google Scholar] [CrossRef]
  22. Kittle, R.P.; McDermid, K.J. Glyphosate herbicide toxicity to native Hawaiian macroalgal and seagrass species. J. Appl. Phycol. 2016, 28, 2597–2604. [Google Scholar] [CrossRef]
  23. Correia, F.V.; Moreira, J.C. Effects of glyphosate and 2, 4-D on earthworms (Eisenia foetida) in laboratory tests. Bull. Environ. Contam. Toxicol. 2010, 85, 264–268. [Google Scholar] [CrossRef]
  24. Zaller, J.G.; Heigl, F.; Ruess, L.; Grabmaier, A. Glyphosate herbicide affects belowground interactions between earthworms and symbiotic mycorrhizal fungi in a model ecosystem. Sci. Rep. 2014, 4, 5634. [Google Scholar] [CrossRef]
  25. Piola, L.; Fuchs, J.; Oneto, M.L.; Basack, S.; Kesten, E.; Casabe, N. Comparative toxicity of two glyphosate-based formulations to Eisenia andrei under laboratory conditions. Chemosphere 2013, 91, 545–551. [Google Scholar] [CrossRef] [PubMed]
  26. Richard, S.; Moslemi, S.; Sipahutar, H.; Benachour, N.; Seralini, G.E. Differential effects of glyphosate and roundup on human placental cells and aromatase. Environ. Health Perspect. 2005, 113, 716. [Google Scholar] [CrossRef] [PubMed] [Green Version]
  27. Koller, V.J.; Fürhacker, M.; Nersesyan, A.; Misik, M.; Eisenbauer, M.; Knasmueller, S. Cytotoxic and DNA-damaging properties of glyphosate and Roundup in human-derived buccal epithelial cells. Arch. Toxicol. 2012, 86, 805–813. [Google Scholar] [CrossRef] [PubMed]
  28. Martini, C.N.; Gabrielli, M.; Codesido, M.M.; Del Vila, M.C. Glyphosate-based herbicides with different adjuvants are more potent inhibitors of 3T3-L1 fibroblast proliferation and differentiation to adipocytes than glyphosate alone. Comp. Clin. Path. 2016, 25, 607–613. [Google Scholar] [CrossRef]
  29. Gill, J.P.K.; Sethi, N.; Mohan, A.; Datta, S.; Girdhar, M. Glyphosate toxicity for animals. Environ. Chem. Lett. 2018, 16, 401–426. [Google Scholar] [CrossRef]
  30. Glyphosate | Ingredients Used in Pesticide Products | US EPA. Available online: https://www.epa.gov/ingredients-used-pesticide-products/glyphosate (accessed on 4 November 2020).
  31. Duke, S.O.; Powles, S.B. Glyphosate: A once-in-a-century herbicide. Pest. Manag. Sci. 2008, 64, 319–325. [Google Scholar] [CrossRef]
  32. Judd, K.E.; Francoeur, S.N. Short-term impacts of Phragmites management on nutrient budgets and plant communities in Great Lakes coastal freshwater marshes. Wetl. Ecol. Manag. 2019, 27, 55–74. [Google Scholar] [CrossRef]
  33. Native-Land. 2020. Available online: https://native-land.ca/ (accessed on 12 December 2020).
  34. Higgins, B.A.; Puglia, P.S.; Leonard, R.P.; Yaokum, T.D.; Wirtz, W.A. Soil Survey of Niagara County, New York; United States Department of Agriculture: Washington, DC, USA, 1972; p. 208. [Google Scholar]
  35. Hansen, T.E. The Winogradsky Column: An Enclosed Self Sustaining Microbial Ecosystem. Available online: https://sites.udel.edu/winogradsky/the-columns/build-a-column/ (accessed on 20 October 2020).
  36. Soil Science: Make a Winogradsky Column. Available online: https://www.scientificamerican.com/article/bring-science-home-soil-column/?gclid=Cj0KCQjwkOqZBhDNARIsAACsbfJW4W7_anh5eKgy2Awh0SIlqGM9Imcu__4jO-zXnkEuLALLnrVQjZ0aAvAxEALw_wcB (accessed on 20 October 2020).
  37. Tsui, M.T.K.; Chu, L.M. Environmental fate and non-target impact of glyphosate-based herbicide (Roundup®) in a subtropical wetland. Chemosphere 2008, 71, 439–446. [Google Scholar] [CrossRef]
  38. Baird, R.; Eaton, A.D.; Rice, E. Standard Methods for The Examination of Water and Wastewater, 21st ed.; Amer Public Health Assn: Washington, DC, USA, 2005. [Google Scholar]
  39. Albrektiene, R.; Rimeika, M.; Salieckiene, E.; Šaulys, V.; Zagorskis, A. Determination of organic matter by UV absorption in the groundwater. J. Environ. Eng. Landsc. 2012, 20, 163–167. [Google Scholar]
  40. Saxton, M.; Morrow, E.A.; Bouronniere, R.A.; Wilhelm, S.W. Glyphosate influence on phytoplankton community structure in Lake Erie. J. Great Lakes Res. 2011, 37, 683–690. [Google Scholar] [CrossRef]
  41. Bonansea, R.I.; Filippi, I.; Wunderlin, D.A.; Marino, D.J.G.; Ame, M.V. The fate of glyphosate and AMPA in a freshwater endorheic basin: An ecotoxicological risk assessment. Toxics 2018, 6, 3. [Google Scholar] [CrossRef] [PubMed]
  42. Imparato, V.; Santos, S.S.; Johansen, A.; Geisen, S. Simulation of bacteria and protists in rhizosphere of glyphosate-treated barley. Appl. Soil Ecol. 2016, 98, 47–55. [Google Scholar] [CrossRef]
  43. Matiwalage, I.N.; Rajapaksha, R.M.C.P. Toxic effects of paraquat and glyphosate on bacteria in wetland rice soil. J. Soil Sci. Soc. Sri Lanka 2008, 20, 9–16. [Google Scholar]
  44. Tahir, S.; Marschner, P. Clay addition to sandy soil-effect of clay concentration and ped size on microbial biomass and nutrient dynamics after addition of low C/N ratio residue. J. Plant Nutr. Soil Sci. 2016, 16, 864–875. [Google Scholar] [CrossRef] [Green Version]
  45. Pal, S.; Marschner, P. Influence of clay concentration, residue C/N and particle size on microbial activity and nutrient availability in clay amended sandy soil. J. Soil Sci. Plant Nutr. 2016, 16, 350–361. [Google Scholar] [CrossRef] [Green Version]
  46. Don, A.; Schulze, E.D. Controls on fluxes and export of dissolved organic carbon in grasslands with contrasting soil types. Biogeochemistry 2008, 91, 117–131. [Google Scholar] [CrossRef] [Green Version]
  47. Kaiser, K.; Zech, W. Dissolved organic matter absorption by mineral constituents of subsoil clay fractions. J. Plant Nutr. Soil Sci. 2000, 163, 531–535. [Google Scholar] [CrossRef]
  48. Ren, L.X.; Wang, P.F.; Wang, C.; Chen, J.; Hou, J.; Qian, J. Algal growth and utilization of phosphorus studied by combined mono-culture and co-culture experiments. Environ. Pollut. 2017, 220, 274–285. [Google Scholar] [CrossRef]
  49. Alshameri, A.; He, H.; Zhu, J.; Xi, Y.; Zhu, R.; Ma, L.; Tao, Q. Adsorption of ammonium by different natural clay minerals: Characterization, kinetics, and adsorption isotherms. Appl. Clay Sci. 2018, 159, 83–93. [Google Scholar] [CrossRef]
  50. Yu, W.H.; Li, N.; Tong, D.S.; Zhou, C.H.; Lin, C.W.; Xu, C.Y. Adsorption of proteins and nucleic acids on clay minerals and their interactions: A review. Appl. Clay Sci. 2013, 80, 443–452. [Google Scholar] [CrossRef]
  51. Grim, R.; Asllaway, W.; Cuthbert, F. Reaction of different clay minerals with some organic cations. J. Am. Ceram. Soc. 1947, 30, 137–142. [Google Scholar] [CrossRef]
  52. Spohn, M.; Kuzyakov, Y. Phosphorus mineralization can be driven by microbial need for carbon. Soil Biol. Biochem. 2013, 63, 69–75. [Google Scholar] [CrossRef]
  53. Wang, G.; Liu, J.; Tang, J. The long-term nutrient accumulation with respect to anthropogenic impacts in the sediments from two freshwater marshes (Xianghai Wetlands, Northeast China). Water Res. 2004, 38, 4462–4474. [Google Scholar] [CrossRef] [PubMed]
Figure 1. Sum of microbial colony development over the course of the incubation.
Ecologies 03 00041 g001
Figure 2. Visible microbial colony colors measured from the ditch habitat for each level of Roundup addition. Each axis is a proportion of 255, maximal value for each color.
Ecologies 03 00041 g002
Figure 3. Visible microbial colony colors measured from the pond habitat for each level of Roundup addition. Each axis is a proportion of 255, maximal value for each color.
Ecologies 03 00041 g003
Figure 4. Major nutrient compound concentrations (Mean ± SE) in the ditch (a,c,e,g) and pond (b,d,f,h) habitats and Roundup treatments, given as differences from mean control values for each habitat.
Ecologies 03 00041 g004
Table 1. Concentrations of each nutrient in each treatment and habitat, n = 3 (Mean ∓ SE).
Habitat
TreatmentWeekDitchPond
PO43−
mg/L
NH4+
mg/L
NO3
mg/L
DOC
mg/L
PO43−
mg/L
NH4+
mg/L
NO3
mg/L
DOC
mg/L
Control20.01 (0.005)0.91 (0.11)0.02 (0.002)501.5 (23.0)0.02 (0.001)0.06 (0.02)0.04 (0.01)304.4 (16.0)
30.03 (0.008)0.82 (0.23)0.09 (0.03)758.1 (33.5)0.01 (0.001)0.08 (0.01)0.04 (0.01)388.1 (16.6)
40.03 (0.004)1.14 (0.36)0.05 (0.02)786.3 (63.6)0.01 (0.001)0.20 (0.04)0.03 (0.01)454.1 (37.0)
50.03 (0.003)1.61 (0.31)0.04 (0.01)1100.7 (41.8)0.01 (0.001)0.26 (0.07)0.04 (0.01)411.9 (61.9)
60.03 (0.004)1.67 (0.52)0.07 (0.03)1147.4 (24.6)0.01 (0.001)0.19 (0.08)0.04 (0.01)450.4 (32.6)
70.04 (0.005)1.60 (0.66)0.16 (0.07)1309.6 (52.7)0.01 (0.001)0.13 (0.05)0.04 (0.004)500.0 (39.0)
80.10 (0.020)0.64 (0.13)0.32 (0.05)1399.3 (59.3)0.01 (0.001)0.13 (0.04)0.05 (0.01)424.4 (10.6)
1x25.58 (0.55)7.60 (0.45)0.06 (0.02)3455.6 (61.2)0.07 (0.06)0.32 (0.08)0.05 (0.01)3363.0 (431.4)
34.45 (0.79)19.01 (2.68)0.03 (0.01)3129.6 (524.7)2.96 (1.40)2.71 (1.34)0.07 (0.01)2588.9 (222.3)
41.69 (0.25)21.98 (0.63)0.05 (0.01)1811.1 (17.0)4.75 (0.18)8.48 (1.59)0.03 (0.01)1407.8 (6.2)
51.22 (0.28)18.10 (0.51)0.02 (0.01)2381.5 (91.0)4.79 (0.27)8.57 (0.54)0.07 (0.01)2360.0 (123.6)
60.80 (0.21)17.88 (2.09)0.06 (0.02)1737.0 (106.3)3.60 (0.10)9.66 (1.16)0.07 (0.01)2014.4 (261.0)
70.58 (0.10)15.93 (1.55)0.17 (0.03)1625.9 (163.8)2.20 (0.40)10.63 (1.43)0.12 (0.02)1224.4 (67.7)
80.66 (0.10)13.87 (2.40)0.08 (0.04)1411.1 (203.8)1.74 (0.37)10.21 (2.36)0.11 (0.01)1315.6 (103.3)
2x27.01 (1.51)10.40 (1.08)0.23 (0.02)3392.6 (268.5)5.75 (0.13)0.38 (0.13)0.19 (0.05)2622.2 (130.2)
37.31 (1.37)24.26 (6.52)0.24 (0.02)3551.9 (463.4)1.90 (0.85)0.91 (0.48)0.21 (0.01)2688.9 (52.5)
43.24 (1.10)36.80 (4.44)0.22 (0.04)4055.6 (1356.1)3.67 (1.40)2.55 (1.23)0.23 (0.01)2163.0 (129.9)
52.47 (0.53)37.63 (1.09)0.28 (0.05)2907.4 (198.8)7.25 (1.74)2.17 (1.56)0.21 (0.02)2528.9 (29.4)
62.27 (0.58)26.96 (1.60)0.26 (0.01)3111.1 (258.8)8.99 (0.76)6.62 (4.43)0.22 (0.03)1735.6 (235.2)
72.11 (0.45)27.79 (3.38)0.16 (0.01)5329.6 (1118.4)7.86 (0.92)12.79 (3.62)0.25 (0.03)1917.8 (277.7)
81.08 (0.18)24.27 (2.58)0.23 (0.09)3040.7 (773.0)7.33 (1.16)17.64 (2.36)0.19 (0.05)2126.7 (527.0)
3x28.90 (0.88)15.53 (4.82)0.46 (0.38)5707.4 (787.2)17.32 (2.78)1.26 (0.24)0.33 (0.13)3877.8 (192.8)
38.74 (1.21)42.54 (9.15)0.22 (0.08)3470.4 (572.5)6.01 (2.25)1.11 (0.78)0.17 (0.02)4237.0 (93.5)
47.67 (1.36)75.21 (11.32)0.32 (0.17)2437.0 (296.6)2.52 (0.95)15.79 (3.74)0.42 (0.13)4166.7 (161.1)
53.78 (0.33)74.15 (7.44)0.43 (0.07)2414.8 (326.5)4.92 (1.78)9.18 (6.27)0.16 (0.07)3774.1 (293.8)
63.14 (0.66)63.35 (0.83)0.51 (0.14)2144.4 (142.9)9.09 (0.43)23.53 (7.15)0.38 (0.13)2996.3 (309.8)
73.31 (0.26)55.75 (1.89)0.31 (0.15)3725.9 (768.2)12.62 (4.32)28.00 (3.07)0.42 (0.06)4396.3 (595.4)
81.47 (0.19)49.39 (1.69)0.19 (0.03)1522.2 (17.0)8.33 (0.45)39.08 (2.78)0.27 (0.17)2485.2 (276.4)
Table 2. Repeated measures ANOVA (F, p) results across treatment (T), habitat (H), and week (W). Significant results are indicated with an asterisk.
Comparison
THT × HWW × TW × HW × T × H
df3.161.163.166.9618.966.9618.96
PO43−
mg/L
48.58, <0.01 *14.54, 0.002 *3.31, 0.047 *9.76, <0.01 *5.87, <0.01 *15.82, <0.01 *8.26, <0.01 *
NH4+
mg/L
171.65, <0.01 *236.48, <0.01 *49.79, <0.01 *29.68, <0.01 *8.21, <0.01 *16.75, <0.01 *4.86, <0.01 *
NO3
mg/L
27.24, <0.01 *1.53, 0.230.49, 0.690.80, 0.571.13, 0.330.31, 0.930.83, 0.67
DOC
mg/L
158.07, <0.01 *15.93, 0.001 *20.17, <0.01 *9.61, <0.01 *4.87, <0.01 *1.82, 0.102.41, 0.003 *
Table 3. Pearson’s correlations (r, p) of DOC (mg/L) with other nutrient compounds in both the ditch and pond habitats. Significant relations indicated with an asterisk.
DitchPond
TreatmentPO43−
mg/L
NH4+
mg/L
NO3
mg/L
PO43−
mg/L
NH4+
mg/L
NO3
mg/L
Overall0.61, <0.01 *0.23, 0.110.30, 0.02 *0.57, <0.01 *0.30, 0.02 *0.55, <0.01 *
Control0.70, <0.01 *0.24, 0.830.63, 0.01 *−0.62, 0.01 *0.36, 0.330.01, 1.00
1x0.88, <0.01 *−0.43, 0.16−0.34, 0.38−0.36, 0.34−0.75, <0.01 *−0.36, 0.32
2x−0.02, 1.00−0.18, 1.00−0.37, 0.29−0.24, 0.90−0.61, 0.01 *−0.51, 0.06
3x0.58, 0.02 *−0.70, <0.01 *0.19, 1.000.01, 1.00−0.54, 0.03 *−0.01, 1.00
Publisher’s Note: MDPI stays neutral with regard to jurisdictional claims in published maps and institutional affiliations.

