Article

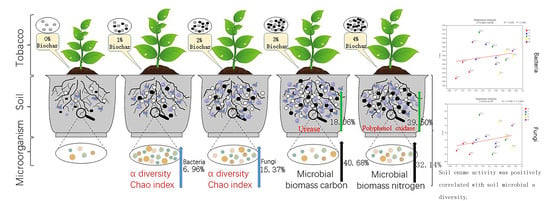
Effect of Biochar on Rhizosphere Soil Microbial Diversity and Metabolism in Tobacco-Growing Soil

1
School of Tobacco, Henan Agricultural University, Zhengzhou 450002, China
2
Henan Biochar Engineering Technology Research Center, Henan Agricultural University, Zhengzhou 450002, China
3
Henan Biochar Technology Engineering Laboratory, Zhengzhou 450002, China
*
Author to whom correspondence should be addressed.
Ecologies 2022, 3(4), 539-556; https://doi.org/10.3390/ecologies3040040
Submission received: 7 September 2022 / Revised: 3 November 2022 / Accepted: 12 November 2022 / Published: 18 November 2022

Abstract

:
In this study, four different biochar application rates and a control were set up using indoor potted tobacco, to study the effects of biochar on the microbial diversity and metabolism of tobacco-growing soil. The five treatments were as follows: control—0% biochar (w/w) + 26 g fertilizer/pot; biochar treatments—1% biochar (w/w) + 26 g fertilizer/pot, 2% biochar (w/w) + 26 g fertilizer/pot, 3% biochar (w/w) + 26 g fertilizer/pot, and 4% biochar (w/w) + 26 g fertilizer/pot. We found that biochar increases the microbial diversity of soils and simultaneously changes the microbial community structure. Under the influence of biochar, soil urease activity increased by 18%, invertase activity increased by 23.40%, polyphenol oxidase activity increased by 59.50%, and catalase activity increased by 30.92%. Biochar also significantly increased the microbial biomass carbon and nitrogen content of the soil. Soil microbial biomass nitrogen had a positive correlation on bacterial diversity, with the highest coefficient, while soil microbial biomass carbon had a positive correlation on fungal diversity, with the highest coefficient. The microbial diversity and metabolic capacity of soil are improved under the influence of biochar, and soil enzyme activity and microbial biomass carbon and nitrogen have positive impacts on soil microbial diversity.

Graphical Abstract

1. Introduction

Tobacco is widely cultivated in China. However, the problems faced by tobacco planting are the same as those faced by China’s other agricultural products, and the degradation of tobacco planting soil has become more and more serious, leading to unhealthy development of tobacco plants and serious diseases and pests. These factors have led to a great loss of tobacco farmers. In view of the serious problems existing in tobacco planting soil, an effective material and application method is needed to improve the soil, improve the growth of tobacco plants, and ensure the income of tobacco farmers.
Biochar is a material obtained by pyrolysis of crop straw, wood materials, livestock manure or other organic materials at a low temperature (300–700 °C) and low oxygen environment, and it is a carbon rich material with rich surface functional groups, high porosity, specific surface area, and strong adsorption [1]. As a new type of high carbon organic material, biochar had been favored by many research fields in recent years. Biochar, known as “black gold”, is attracting increasing attention in upcoming fields, while the relevant scientific research reports have also been increasing year by year. This is mainly due to the huge potential of biochar in soil improvement, ecological restoration, and rational utilization of waste [2].
In the past two decades, an increasing number of studies have focused on the effects and mechanisms of biochar on soil rhizosphere microorganisms. The German microbi-ologist Lorenz Hiltner defined the rhizosphere in 1904 as the soil around the root system that is affected by the growth of the root system. Some rhizosphere microorganisms are beneficial to plant growth, while others inhibit plant growth. The harmful microorganisms are related to reductions in production during continuous cropping, such as black shin disease, root rot, etc. [3]. In an agricultural ecosystem context, making full use of the biological potential of these microorganisms can reduce chemical fertilizer and pesticide input, promote plant growth, reduce environmental pollution, and achieve sustainable development. When biochar is applied to soil, the microorganisms around the biochar are directly affected. This may be caused by the abundant activated organic carbon and the micro- and macro-nutrients contained in the biochar, which can “nourish” microorganisms [4]. In addition, the oxygen-containing functional groups in biochar can adsorb cationic nutrients from soil fertilization, preventing their loss [5]. Biochar may also protect certain microorganisms from predation, improving the abundance and diversity of soil microbial species [6].
As the most active organic carbon components in the soil environment, enzymes are extremely important. Soil enzymes are not only involved in a series of biochemical processes in the soil environment, such as the decomposition of organic matter and nutrients, but are also the main driver of soil microbial metabolism [7,8]. The indicative effects of soil enzymes on soil fertility, activity, quality, and health status reflect the direction and intensity of the energy and material cycles of the soil [9]. However, the effects of biochar on soil enzyme activity differ between different types and dosages of biochar, and the effects of the same amount and type of biochar on different types of soil are also different. According to previous reports, some biochar can improve the abundance of soil microorganisms in wheat planting, which also increases the activities of catalase and urease [10]. Other biochar can increase the activity of enzymes involved in the N and P cycles in sandy or loam soils [11]. The type of biochar and the type of soil are both closely related to the effect of biochar on soil enzyme activity [12]. Biochar application to farmland can improve the physical properties of the soil, which enables the growth and reproduction of soil microorganisms, establishing a suitable living environment for crops. Kuang et al. [13] found that the microbial biomass increased with increasing biochar dosage. Applying 0.5% and 1% (biochar/soil) biochar greatly increased the soil microbial biomass C (MBC) and N (MBN) content. Bargmann et al. [14] found that, within a certain period after biochar made from beer residue and beetroot was applied to the soil, the soil microbial MBC was significantly higher than that of the control group. Tao et al. [15] found that combined application of unequal quantities of fertilizer and biochar can significantly increase soil MBC and MBN. Song et al. [16] found that the amount of biochar and level of nitrogen application had some effect on the MBC content in the soil, but their effect on soil MBN was small [17]. The study found that, in the 0–20 cm layer of the coastal saline soil of the North China Plain, the soil MBC and MBN after treatment with biochar and organic fertilizer were higher than those of the control [18].
In recent years, there have been many studies on the effects of biochar on soil microorganisms and enzymes. Wang et al. [19] studied the effects of wheat straw biochar on enzyme activities in tobacco fields. Piotr et al. [20] studied the effects of different types of biochar on soil enzyme activities. Niemi et al. [21] studied the effect of biochar on soil enzymes in bare grassland. Eren et al. [2] studied the effects of biochar on ligninolytic fungi and enzyme activities in soil. However, there have been few reports on the effects of different amounts of biochar on soil microbial diversity and enzyme activity. To explore the impact of biochar on the soil microbial diversity and microbial activity of tobacco-growing soil, this study used a pot experiment to apply different amounts of biochar to tobacco-growing soil to analyze soil microbial alpha (α) and beta diversity, as well as soil enzyme activity, MBC, and MBN. We provide a theoretical basis for biochar application to improve tobacco-growing soil and the sustainable development of tobacco farmland.

2. Materials and Methods

2.1. Materials

An indoor pot experiment was carried out in the Modern Tobacco Science and Technology Park of Henan Agricultural University, Xuchang City, Henan Province. In the large field of the Science and Technology Park, five bulk soil samples (0–20 cm soil layer) were randomly selected from an area of approximately 335 m2. The soil was mixed, and the samples were naturally air-dried in the shade at room temperature. Then, the soil was passed through a 2-mm sieve before use. The basic information of the 0–20 cm soil layer was as follows: soil type, cinnamon; organic matter content, 1.02%; pH, 6.4; EC, 2.6 mS/cm; total nitrogen, 0.713 g kg−1; total carbon, 7.772 g kg−1; total sulfur, 0.627 mg kg−1; pH, 6.5; available nitrogen, 0.098 g kg−1; available phosphorus, 0.026 g kg−1; and available potassium, 0.207 g kg−1. The continuous flow carbonization method described by Nielsen et al. [22] was used to produce biochar from peanut shells (Wang et al. [23] thought that the biochar made from peanut shells had a better effect on soil improvement). Briefly, the pyrolysis temperature was increased to 450 °C at a rate of 26 °C min−1 and held for 30 min. The basic physical and chemical properties of the obtained biochar were as follows: specific surface area, 16.72 m2 g−1; pH 8.6; conductivity, 2.3 ds m−1; TN, 7.9 g kg−1; total carbon, 773 g kg−1; total potassium, 4.1 g kg−1; total phosphorus, 2.3 g kg−1; and total sulfur, 0.39 g kg−1. The tested tobacco variety was ‘Zhongyan 100’ (CF965, a flue-cured tobacco variety).

2.2. Experimental Design

Approximately 20 kg of dry sieved soil (soil that passed through a 2-mm sieve) was placed into each pot (n = 15, diameter 0.45 m × height 0.40 m. Each pot holds 25 kg of soil). The experimental design included five experimental treatments: the control treatment [0% biochar (w/w) + 26 g fertilizer/pot (T0)] and four biochar treatments [1% biochar (w/w) + 26 g fertilizer/pot (T1); 2% biochar (w/w) + 26 g fertilizer/pot (T2); 3% biochar (w/w) + 26 g fertilizer/pot (T3); and 4% biochar (w/w) +26 g fertilizer/pot (T4)]. The weight of biochar applied per plant of each treatment was as follows: 0.00 kg biochar/pot (T0); 0.25 kg biochar/pot (T1); 0.5 kg biochar/pot (T2); 0.75 kg biochar/pot (T3); 1.00 kg biochar/pot (T4). Under normal circumstances, 15,000 tobacco plants are planted per hectare of tobacco field, so the amount of biochar used in the pot experiment was converted into the amount used in tobacco farmland: 0.00 kg biochar/hm2 (T0); 3750 kg biochar/hm2 (T1); 7500 kg biochar/hm2 (T2); 11,250 kg biochar/hm2 (T3); 15,000 kg biochar/hm2 (T4). Fertilizer ratio: m(K2SO4):m[Ca(H2PO4)2]:m(NH4NO3) =2:1:1, which is consistent with tobacco fertilization recommendations [24]. The biochar and fertilizer were fully mixed with the soil in the pot. Note that the volume differences caused by the addition of biochar and fertilizer to the soil were negligible. Each treatment was repeated three times, and each repetition included 15 pots. The biochar and fertilizer were applied 4 days before transplanting, and one tobacco seedling was transplanted into each pot. The distance between the pots in the greenhouse was 0.30 m, and the experimental layout was a random block design. During transplanting, 1000 mL of water was added per pot. The pots were then watered with 200 mL every 5 days. Forty days after transplanting, the watering frequency was increased to every 3 days. After sampling, the unsampled tobacco plants continued to grow until they died naturally. The dead tobacco plants (including the roots) were then removed from the soil. During this process, little soil was lost from the pot. The pots were watered with 50 mL every week until tobacco was planted again the following year.

2.3. Measurement and Analysis

2.3.1. Sampling Methods

Soil Samples for Rhizosphere Microorganisms

Sixty days after tobacco transplantation, three uniformly growing and representative tobacco plants were selected from each treatment. The tobacco roots were carefully removed from the pot, the soil attached to the root system gently shaken off, and a brush applied to the lateral roots. The soil around the root system was gently brushed off, to collect the soil within 2 mm of the root surface (rhizosphere soil). The rhizosphere soil sample was then passed through a 2-mm sieve. Ten grams of rhizosphere soil was taken from each plant, placed in a 10-mL centrifuge tube wrapped in aluminum foil, and stored in liquid nitrogen for later use.

Soil Physical and Chemical Indicators

Two soil samples, each 500 g, were collected from the pots after the rhizosphere soil samples had been collected. One sample was naturally air-dried in a cool environment and the other was sealed and stored at 4 °C. Soil enzyme activity was measured using an enzyme activity kit produced, and the soil MBC and MBN were measured using the chloroform fumigation–potassium sulfate method [25]. The Elementar Vario MAX CN analyzer was used to measure the total organic carbon (TOC) and TN content of the biochar, using the Dumas combustion method.

2.3.2. Measurement Methods

Soil Bacterial DNA Extraction and PCR Amplification

When extracting the total DNA of the soil microorganisms following the instructions of the EZNA® soil DNA kit (Omega Bio-tek, Norcross, GA, USA), 1% agarose gel electrophoresis was used to detect the DNA extraction quality. Purity and concentration were determined using a NanoDrop2000 system. Then, 806R (5′-GGACTACHVGGGTWTCTAAT-3′) and 338F (5′-ACTCCTACGGGAGGCAGCAG-3′) were used to perform PCR amplification on the 16SrRNA V3–V4 variable region, while SSU0817F 5′-TTAGCATGGAATAATRRAATAGGA- 3′ and 1196R 5′-TCTGGACCTGGTGAGTTTCC-3′ were used for amplification of the 18SrRNA V5–V7 variable region. The amplification procedure was as follows: 95 °C pre-denaturation for 3 min; 27 cycles of 95 °C denaturation for 30 s, annealing at 55 °C for 30 s, and extension at 72 °C for 30 s; 72 °C stable extension for 10 min, and finally storage at 4 °C (PCR instrument: ABI Gene Amp® Type 9700). The PCR reaction system consisted of 5 × Trans Start Fast Pfu buffer 4 μL, 2.5 mM dNTPs 2 μL, downstream primer (5 µM) 0.8 μL, upstream primer (5 µM) 0.8 μL, Trans Start Fast Pfu DNA polymerase 0.4 μL, template DNA 10 ng, and supplement to 20 μL. Three replicates were used for each experiment.

Illumina Miseq Sequencing of Soil Microorganisms

After mixing the PCR products from the same samples, a 2% agarose gel was used to recover the PCR products. An Axy Prep DNAGel Extraction Kit (Axygen Biosciences, Union City, CA, USA) was used to purify the recovered products, which were then detected by 2% agarose gel electrophoresis. A Quantus™ Fluorometer (Promega, Madison, WI, USA) was used to detect and quantify the recovered products. We used the NEXTFLEX Rapid DNA-Seq Kit to build the library as follows: (1) the linker was added; (2) magnetic beads were used to screen and remove the self-linked fragments of the linker, (3) PCR amplification was used to enrich the library template; and (4) the magnetic beads were recovered to obtain the final library. Sequencing was performed using the Illumina MiSeq PE300 platform (Shanghai Meiji Biomedical Technology Co., Ltd., Shanghai, China).

Soil Microbial Data Processing

We used the original sequence of the Trimmomatic software for quality control and FLASH software for splicing.
(1) Bases with tail quality values less than 20 were filtered out and a 50-bp window set. If the average quality value in the window was less than 20, the bases were removed from the beginning of the window. Filtered reads of less than 50-bp after quality control were removed, as were reads containing N bases.
(2) The paired reads were merged into a sequence according to the overlap relationships between PE reads, while the minimum overlap length was 10 bp.
(3) The maximum allowable mismatch ratio in the overlap region of the spliced sequence was 0.2, and the unmatched sequence was screened.
(4) The samples were differentiated according to the barcodes and primers at the beginning and end of the sequence, and the sequence direction was adjusted. The allowed number of mismatches in the barcode was zero, and the maximum number of primer mismatches was 2.
UPARSE software (version 7.1, http://drive5.com/uparse/, accessed on 25 May 2021) was used to perform OTU clustering of sequences based on 97% similarity, and to eliminate chimeras. The RDP Classifier (http://rdp.cme.msu.edu/, accessed on 28 May 2021) was used to classify and annotate each sequence and compare it to the Silva database (SSU132) with a comparison threshold of 70%. The statistics of the bacterial and fungal samples are shown in Table 1 and Table 2.

2.3.3. Data Analysis Methods

Chao index: This index uses the chao1 algorithm to estimate the number of OTUs contained in the sample. The calculation formula used in this analysis is as follows:
S chao 1 = S obs n 1 ( n 1 1 ) 2 ( n 2 + 1 )
where Schao1 = estimated number of OTUs; Sobs = observed number of OTUs; n1 = number of OTUs containing only one sequence (“singletons”); n2 = number of OTUs containing only two sequences (“doubletons”).
ACE index: an index used to estimate the number of OTUs in a community. The calculation formula used in this analysis is as follows:
S A C E = { S abund + S r a r e C A C E + n 1 C A C E γ ^ 2 A C E ,   f o r   γ ^ A C E < 0.80 S abund + S r a r e C A C E + n 1 C A C E γ ˜ 2 A C E ,   f o r   γ ^ A C E 0.80
N r a r e = i = 1 a b u n d in i
C A C E = 1 n 1 N r a r e
γ ^ 2 A C E = max [ S r a r e C A C E i = 1 a b u n d i ( i 1 ) n i N r a r e ( N r a r e 1 ) 1 , 0 ]
γ ˜ 2 A C E = max [ γ ^ 2 A C E { 1 + N r a r e ( 1 C A C E ) i = 1 a b u n d i ( i 1 ) n i N r a r e ( N r a r e C A C E ) } , 0 ]
ni = the number of OTUs containing i sequences; Small = the number of OTUs containing “abund” or less than “abund;” Sabund = the number of OTUs with more than “abund” sequences; abund = the threshold of “advantage” OTUs. The default is 10.
Shannon index: One of the indices used to estimate the diversity of microorganisms in a sample. The calculation formula used in this analysis is as follows:
H s h a n n o n = i = 1 S o b s n i N l n n i N
where, Sobs is the number of OTUs actually observed, ni is the number of sequences contained in the i-th OTU, and N is the total number of sequences.
The coverage index refers to the coverage rate of each sample library. The higher the value, the higher the probability that each sample sequence will be detected, and the lower the probability of it not being detected. The calculation formula used in this analysis is as follows:
C = 1 n 1 N
where n2 = the number of OTUs containing only one sequence and N = the total number of sequences in the sample.
Histograms and line charts were drawn in Excel 2013. One-way ANOVA was used to analyze the different treatments using SPSS 20.0. One-way ANOVA and Duncan’s method were used to compare the differences between the different treatments. Mothur (v.1.30.1, http://www.mothur.org/wiki/Schloss_SOP#Alpha_diversity, accessed on 15 June 2021) software was used for index analysis, and the OTU similarity level used for index evaluation was 97% (0.97).

3. Results and Analysis

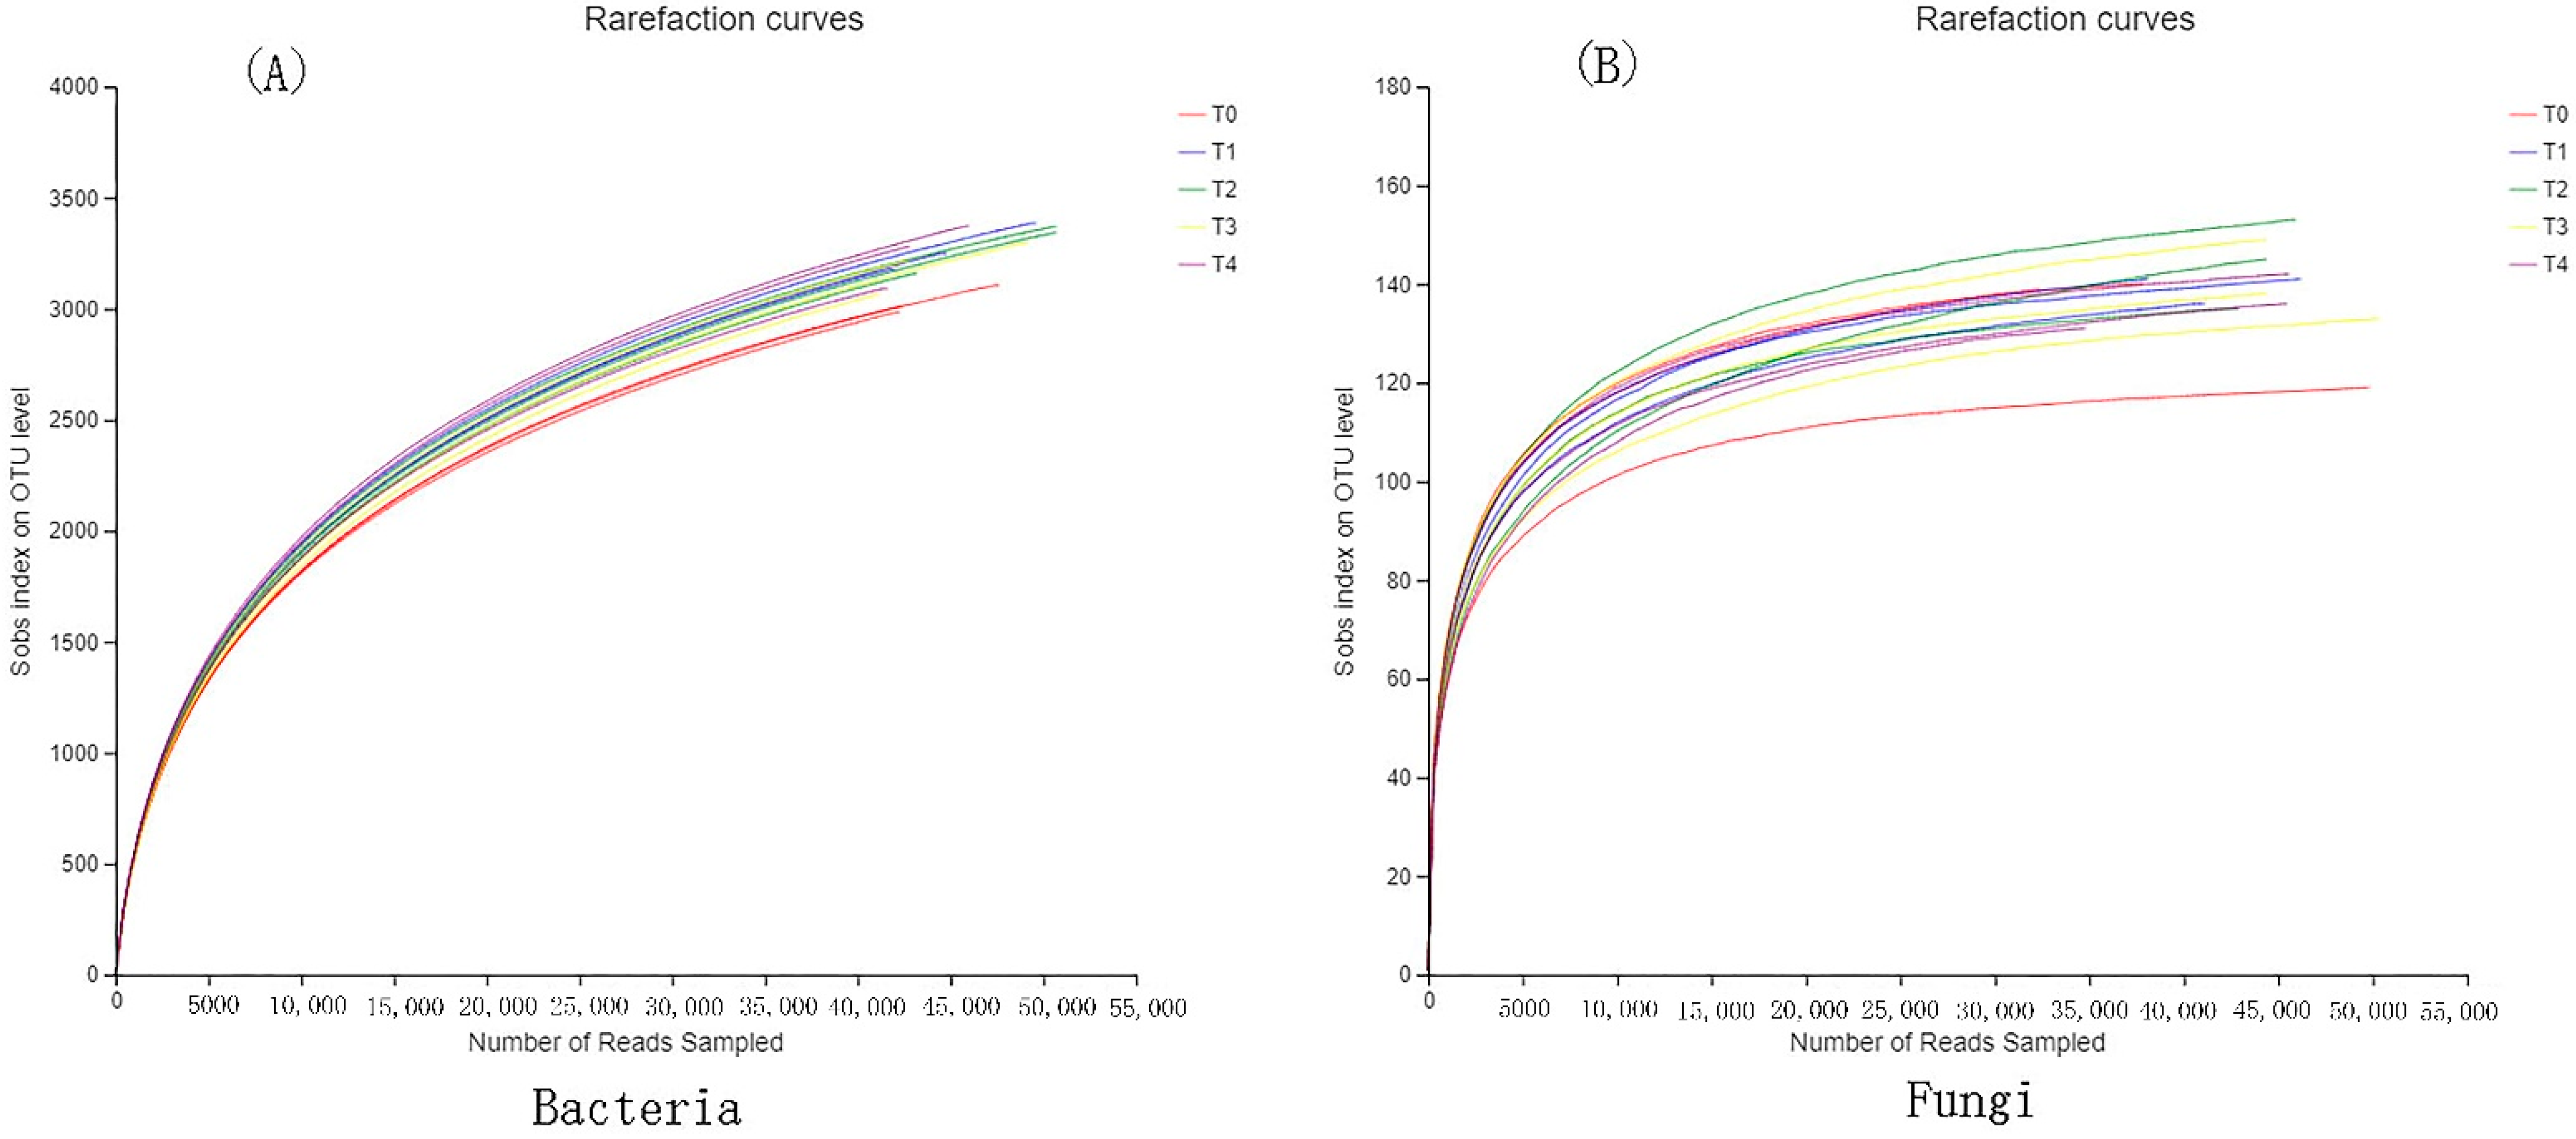
3.1. Species Assessment of Bacteria and Fungi

The dilution curves of bacteria and fungi tended to be flat (Figure 1); the coverage of bacteria reached 98.12% and the coverage of fungi reached 99.97% (Figure 1). These results indicate that the detection rate of the soil sample microbial community was close to saturation, and the current sequencing volume can cover most of the species in the sample.

3.2. Alpha Diversity of Bacteria and Fungi

T1, T2, T3, and T4 were the treatment groups, and T0 was the control group (Table 3). The soil bacterial diversity Chao index values of the treatment groups were significantly higher than that of the control group. The T1, T2, T3, and T4 values were 69.61%, 63.42%, 58.18%, and 64.32% higher than the T0 value, respectively. The fungal diversity Chao index values of the treatment groups were also significantly higher than that of the control group. The T1, T2, T3, and T4 values were 13.51%, 15.37%, 8.29%, and 7.13% higher than the T0 value, respectively. The bacterial diversity ACE indices of T1, T2, T3, and T4 were all significantly higher than that of T0 (by 7.58%, 7.55%, 6.17%, and 7.33%, respectively). The fungal diversity ACE index of T2 was significantly higher than that of T0 (by 12.79%). There was no significant difference in bacterial Shannon for each treatment, and this index was the highest in T4; fungal Shannon values in T3 and T4 were higher than that of T0 (by 3.65%, 3.32%). The bacterial diversity coverage indices of T0 and T2 were significantly higher than those of T3 and T4, while the fungal diversity coverage indices of the different treatments were not significantly different (Table 3).

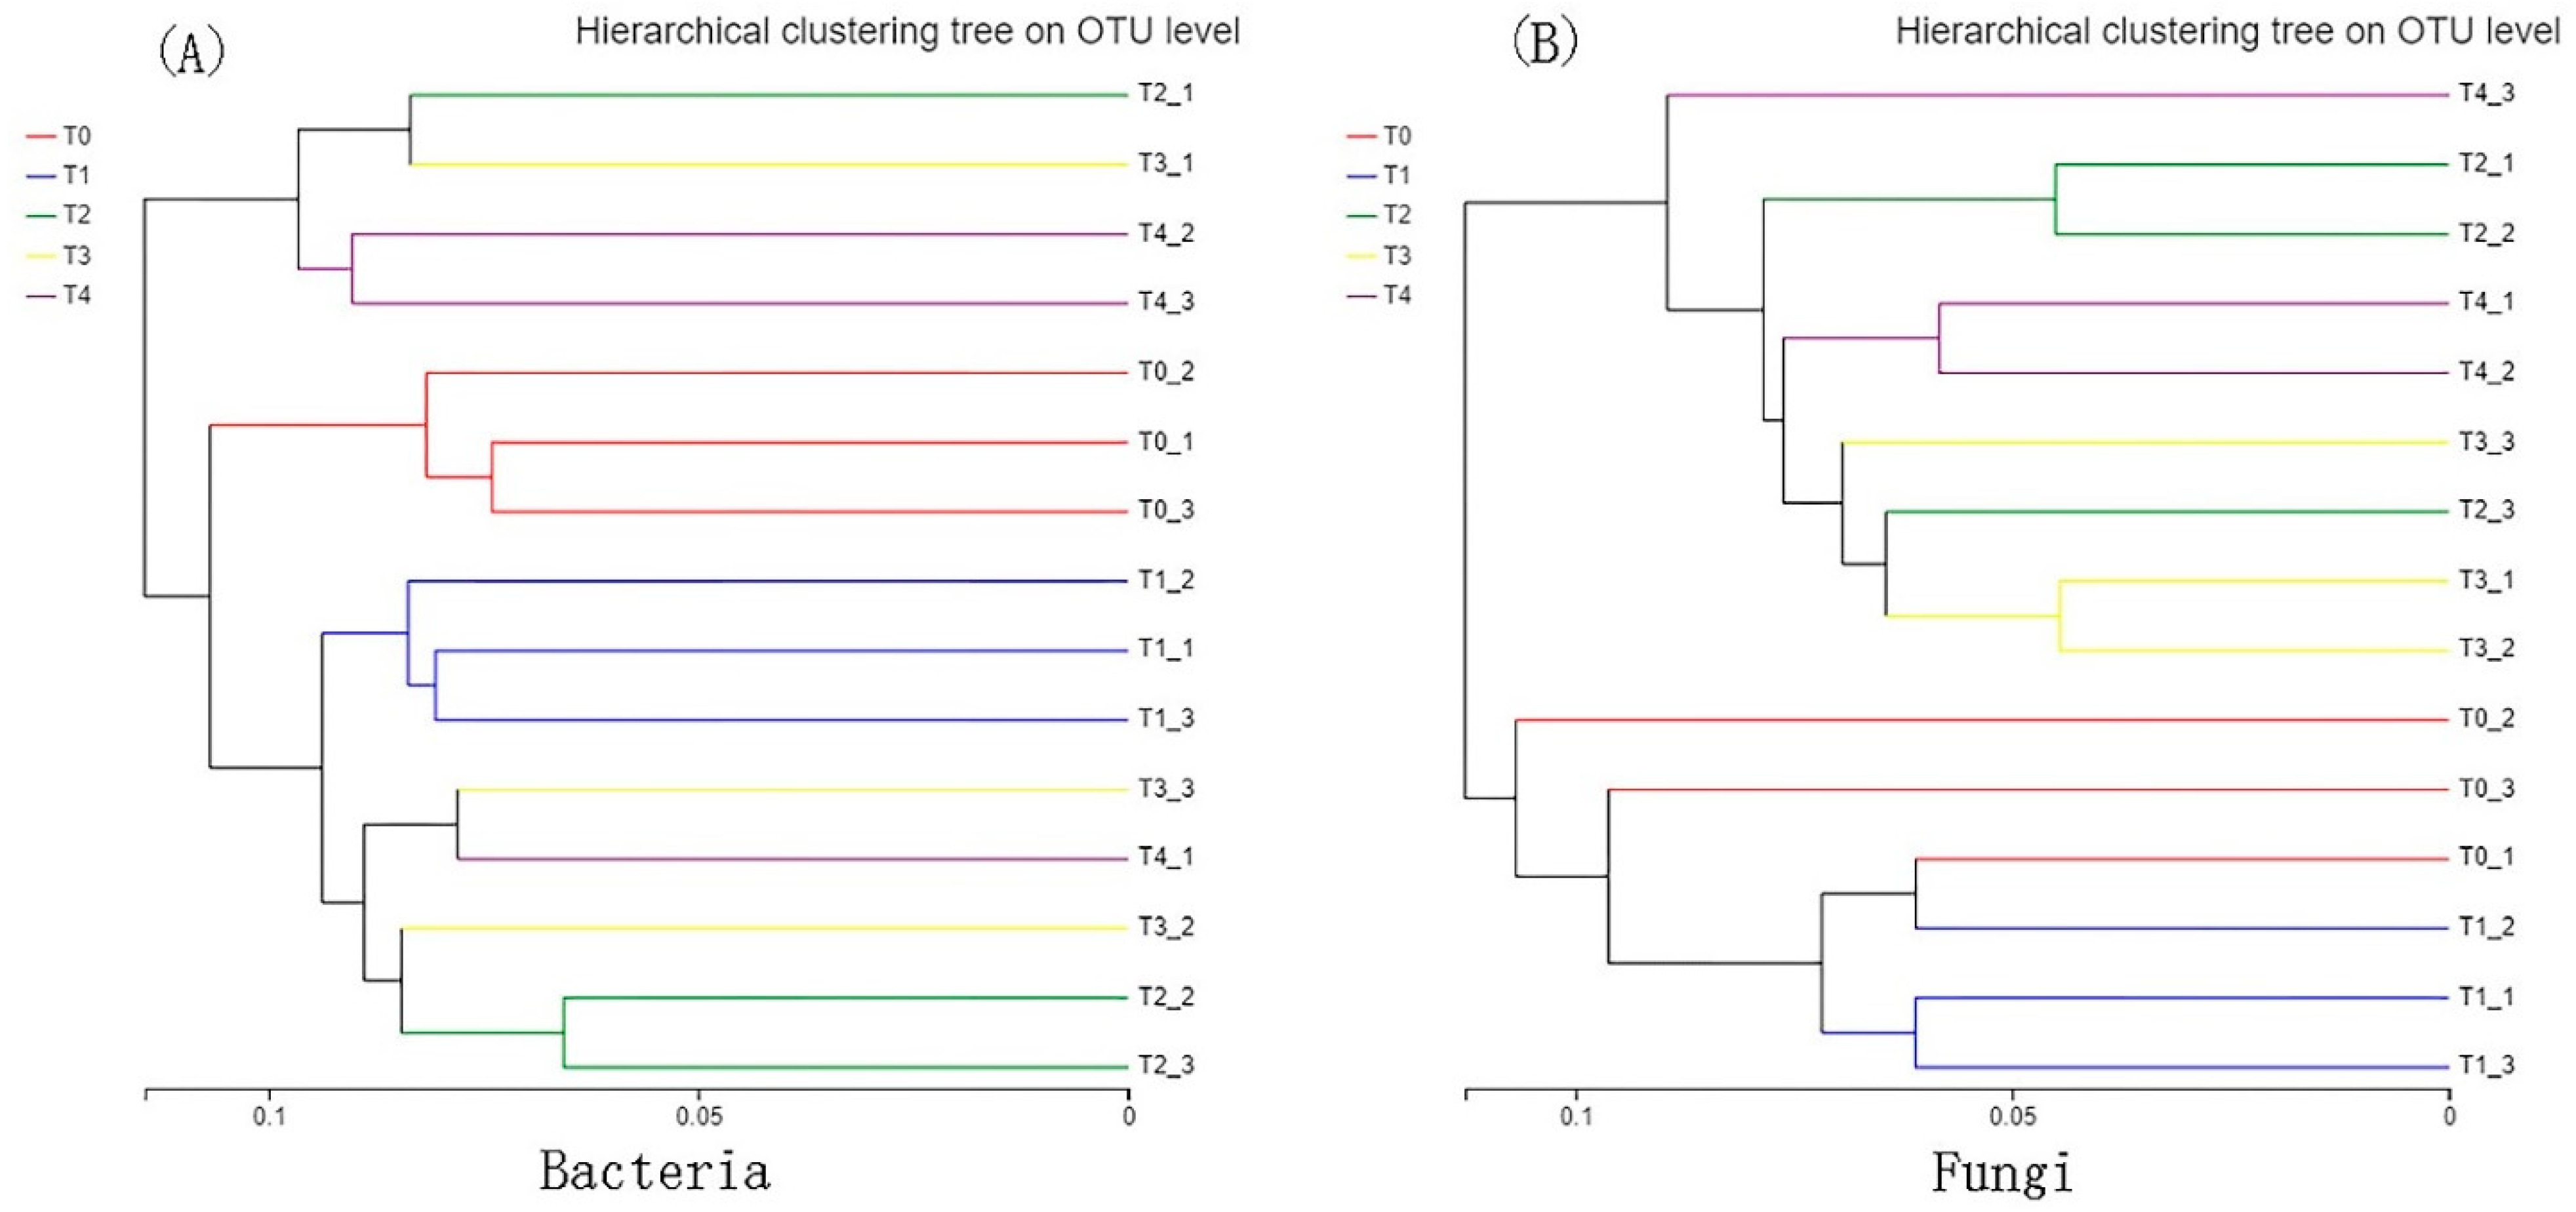
3.3. Beta Diversity of Bacteria and Fungi

Sample-level cluster analysis was performed on the community distance matrices of the bacteria (Figure 2A) and fungi (Figure 2B). The results of sample hierarchical clustering show that the samples can be divided into four significantly different groups according to their bacteria, indicating that the bacterial community compositions of the treatment groups and the control were significantly different (Figure 2A). According to the fungi, the samples could be divided into three significantly different groups, indicating that the fungal community compositions of the treatment groups and the control group were significantly different (Figure 2B).

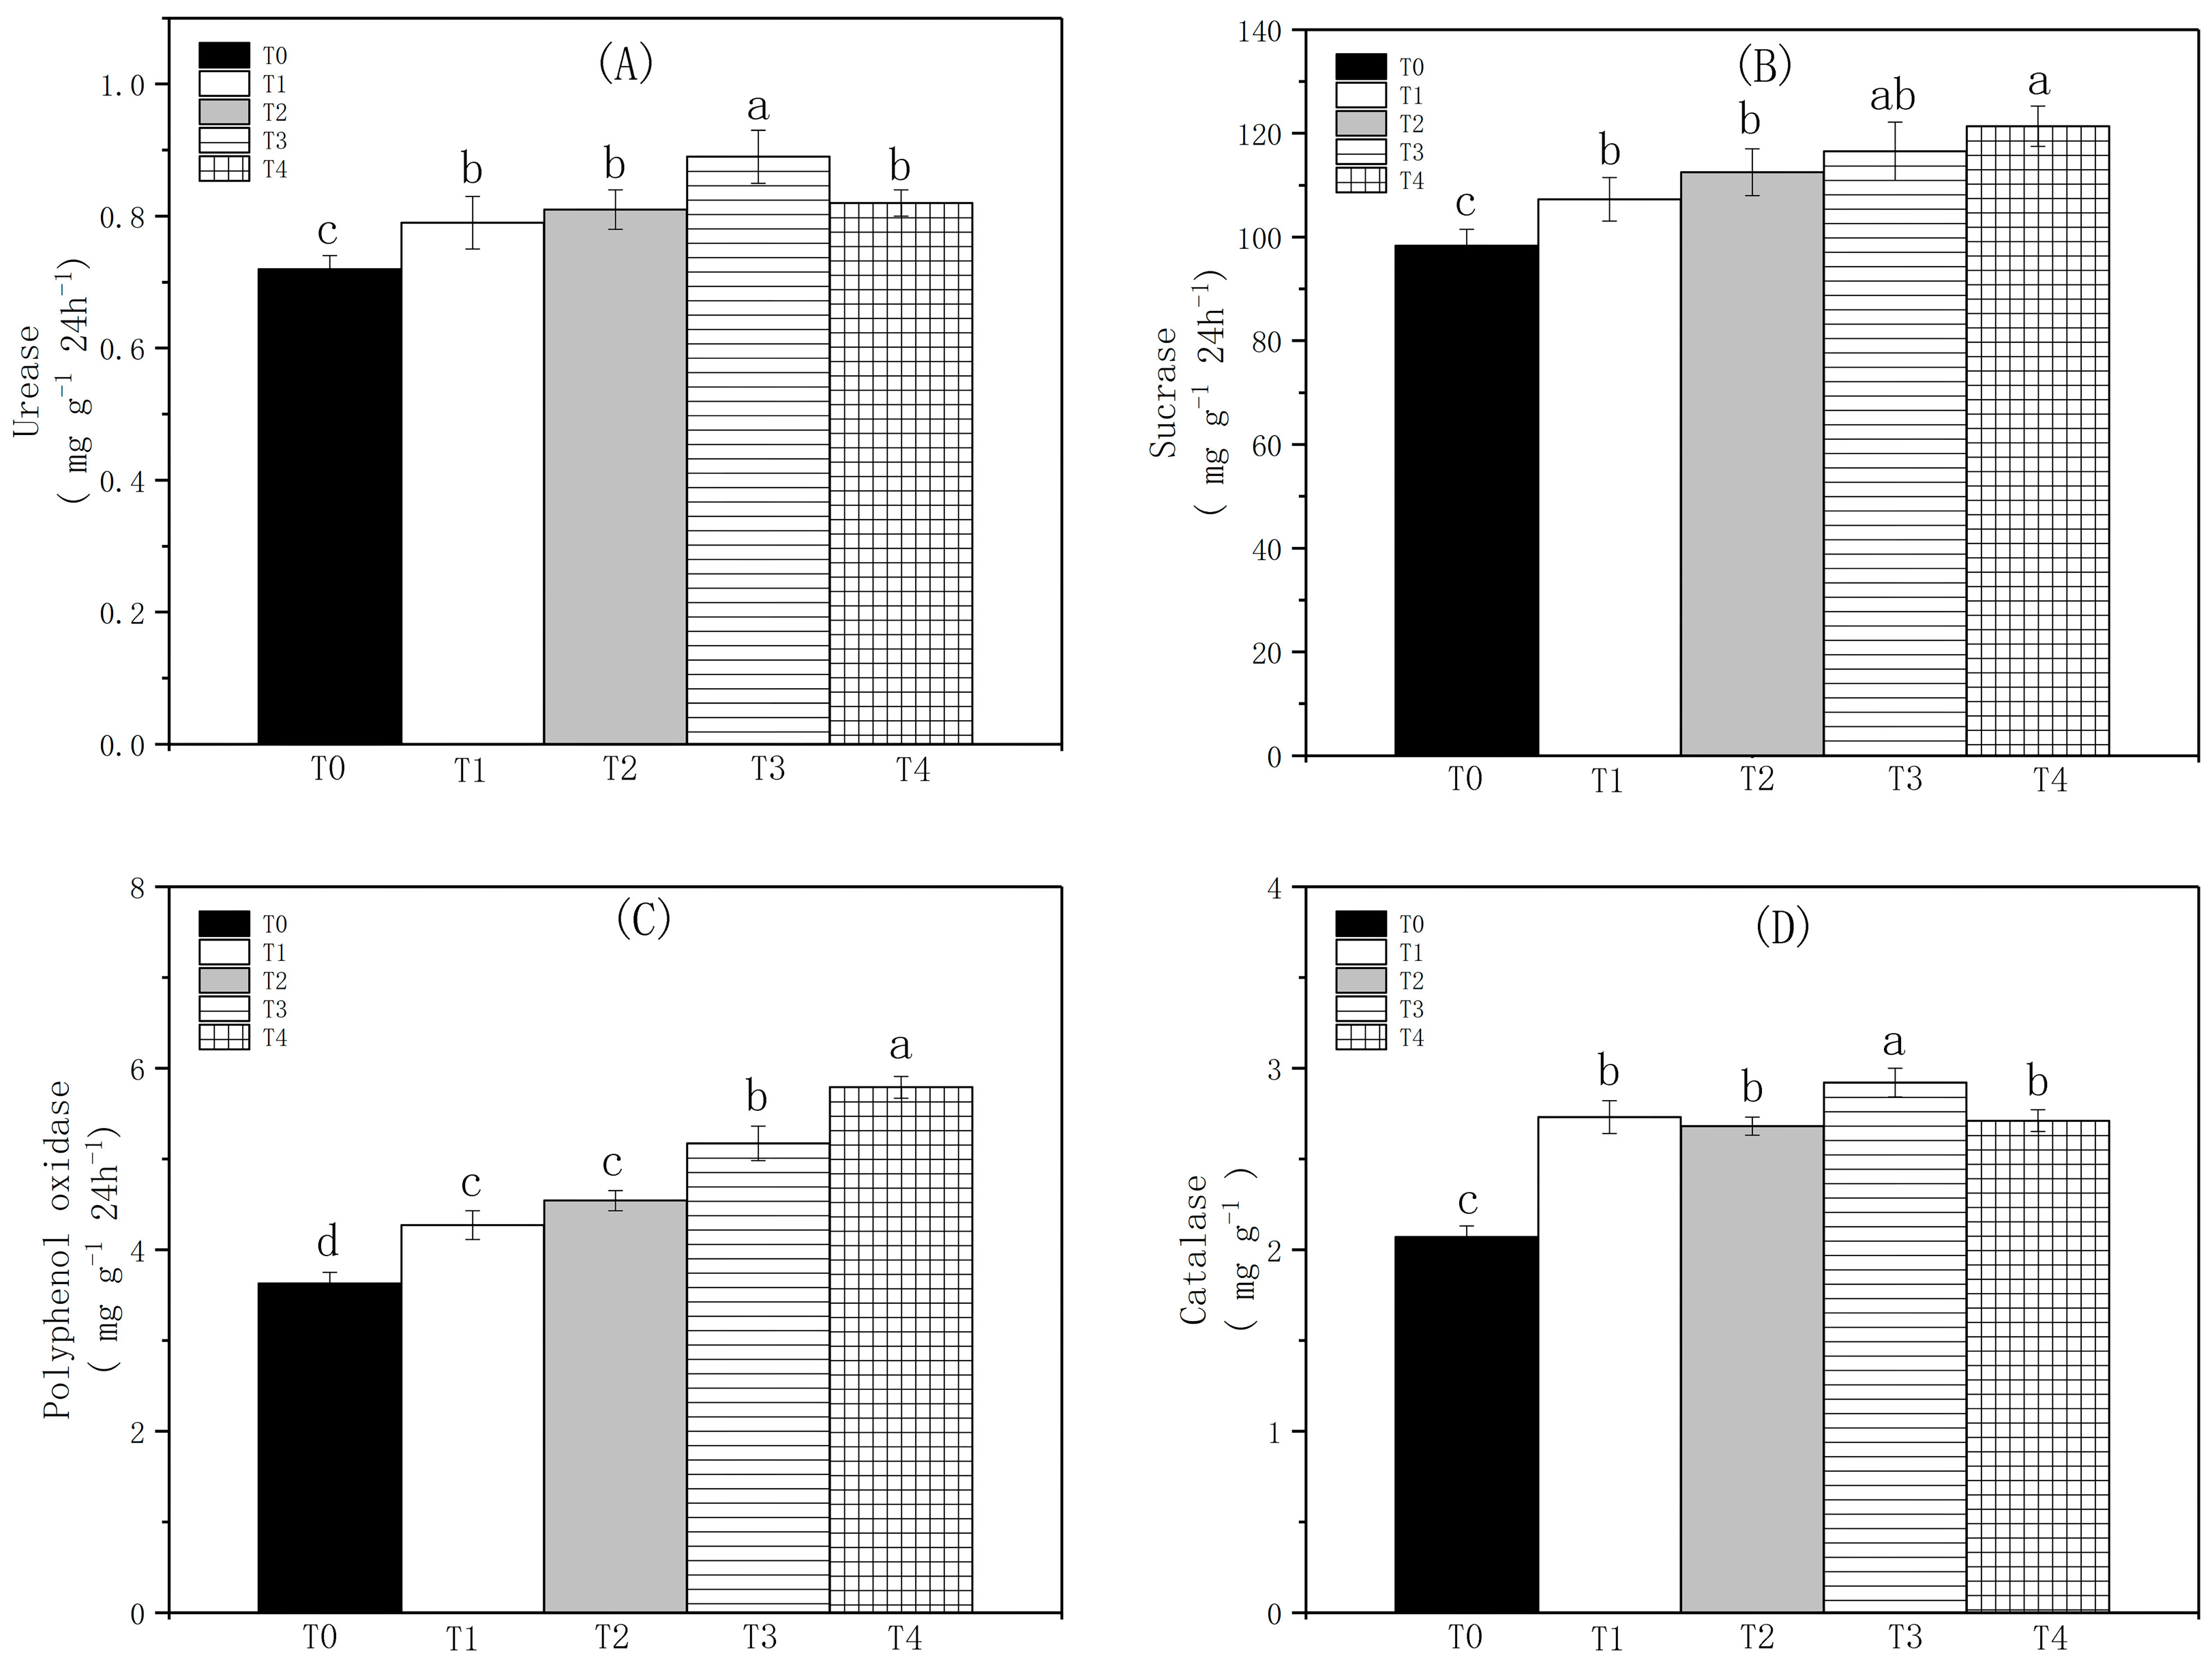
3.4. The Impact of Biochar on Soil Enzyme Activity

Biochar improved the activities of invertase, urease, polyphenol oxidase, and catalase. With increasing biochar, the soil urease activity showed a trend of first increasing and then decreasing. The treatment group values were significantly higher than that of the control group, and the differences were significant. T3 showed the highest urease activity (18.06% higher than that of T0) (Figure 3A). The invertase activity values of the treatment groups were higher than that of the control group, and the differences were significant. As the amount of biochar increased, the soil invertase activity showed a trend of first increasing and then decreasing. The invertase activity in T4 was 23.40% higher than that in T0 (Figure 3B). The change rule of soil polyphenol oxidase activity was similar to that of invertase, with T4 59.50% higher than T0 (Figure 3C). The catalase activity values in the treatment groups were higher than that in the control group, and the difference was significant. The catalase activity of the T3 treatment was the highest, 30.92% higher than that of T0 (Figure 3D).

3.5. The Impact of Biochar on Soil Microbial Biomass Carbon and Microbial Biomass Nitrogen

Biochar can significantly increase the content of MBC and MBN in the soil. Although the soil TOC and TN content also increased with biochar input, MBC/TOC and MBN/TN increased with biochar input (Table 4). The soil MBC, MBN, MBC/TOC, and MBN/TN all showed trends of first increasing and then decreasing with increasing biochar amount. The MBC values of T3 and T4 were significantly higher than those of the other treatments; they were 40.90% and 38.69% higher than those of T0, respectively. The MBN values of T2 and T3 were significantly higher than those of the other treatments; they were 42.66% and 32.14% higher than those of T0, respectively. The MBC/TOC of T3 was the highest, significantly higher than those of the other treatments, while the MBN/TN of T2 was the highest, also significantly higher than those of the other treatments (Table 4).

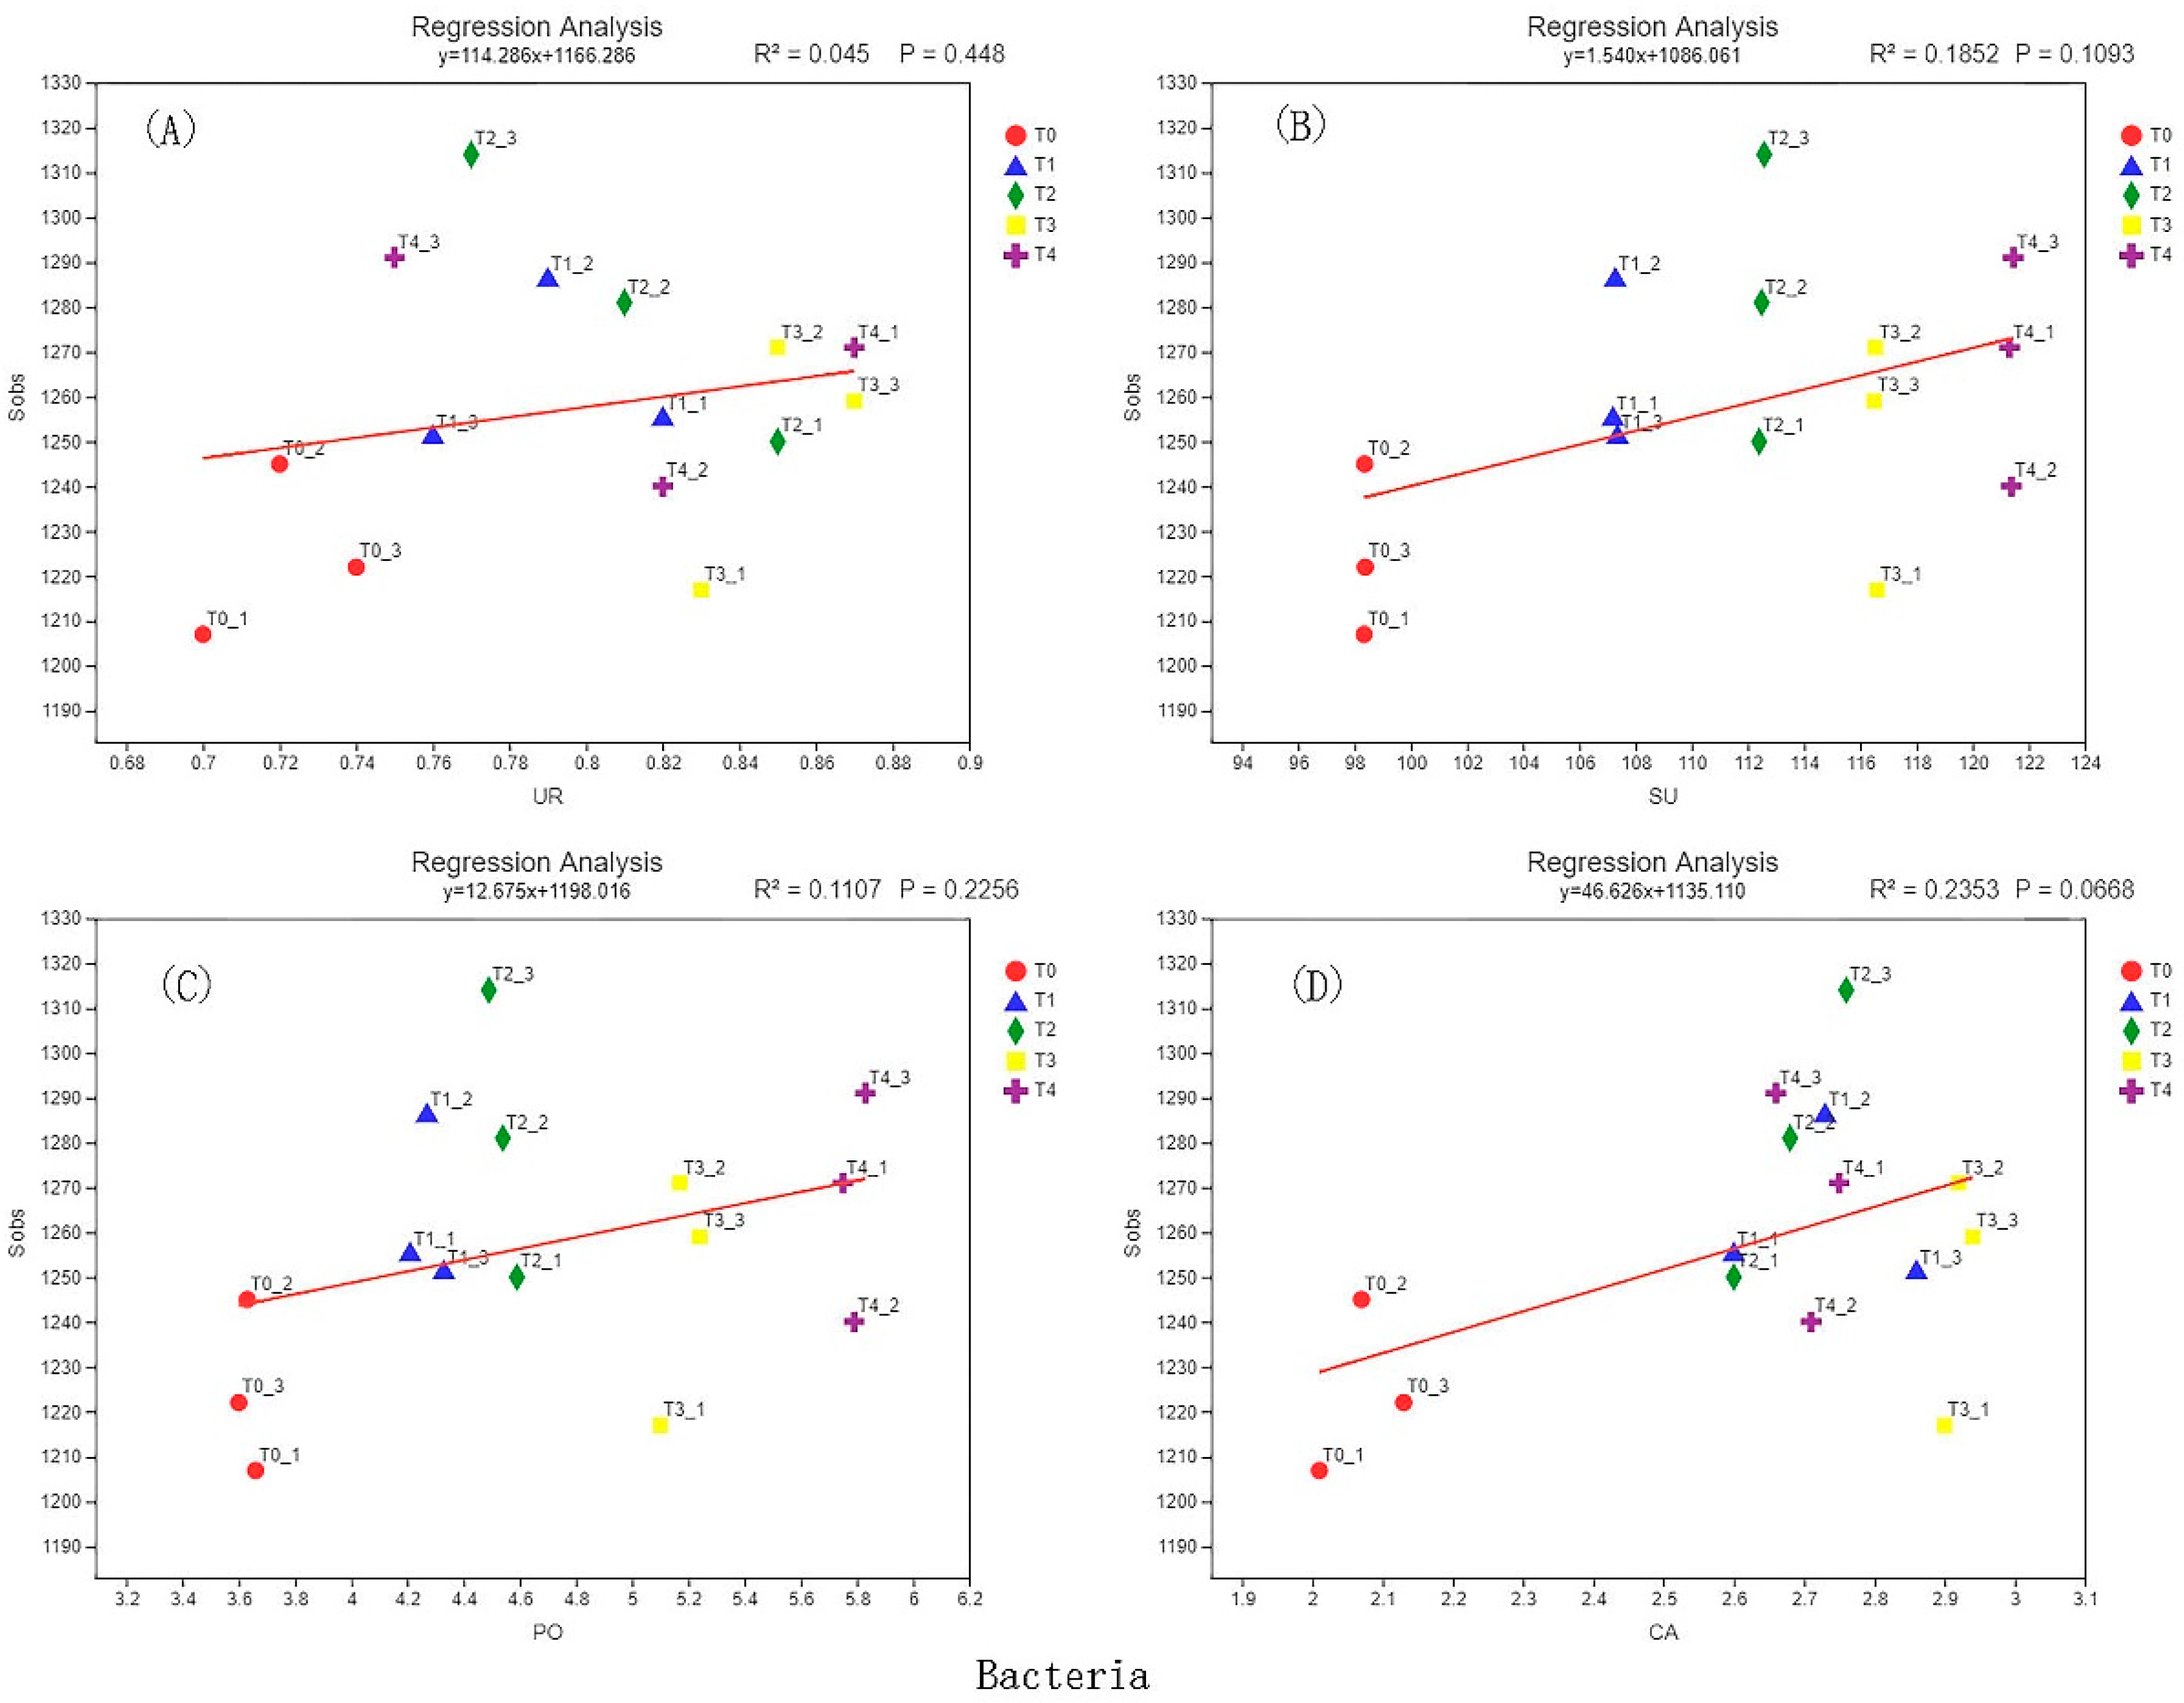
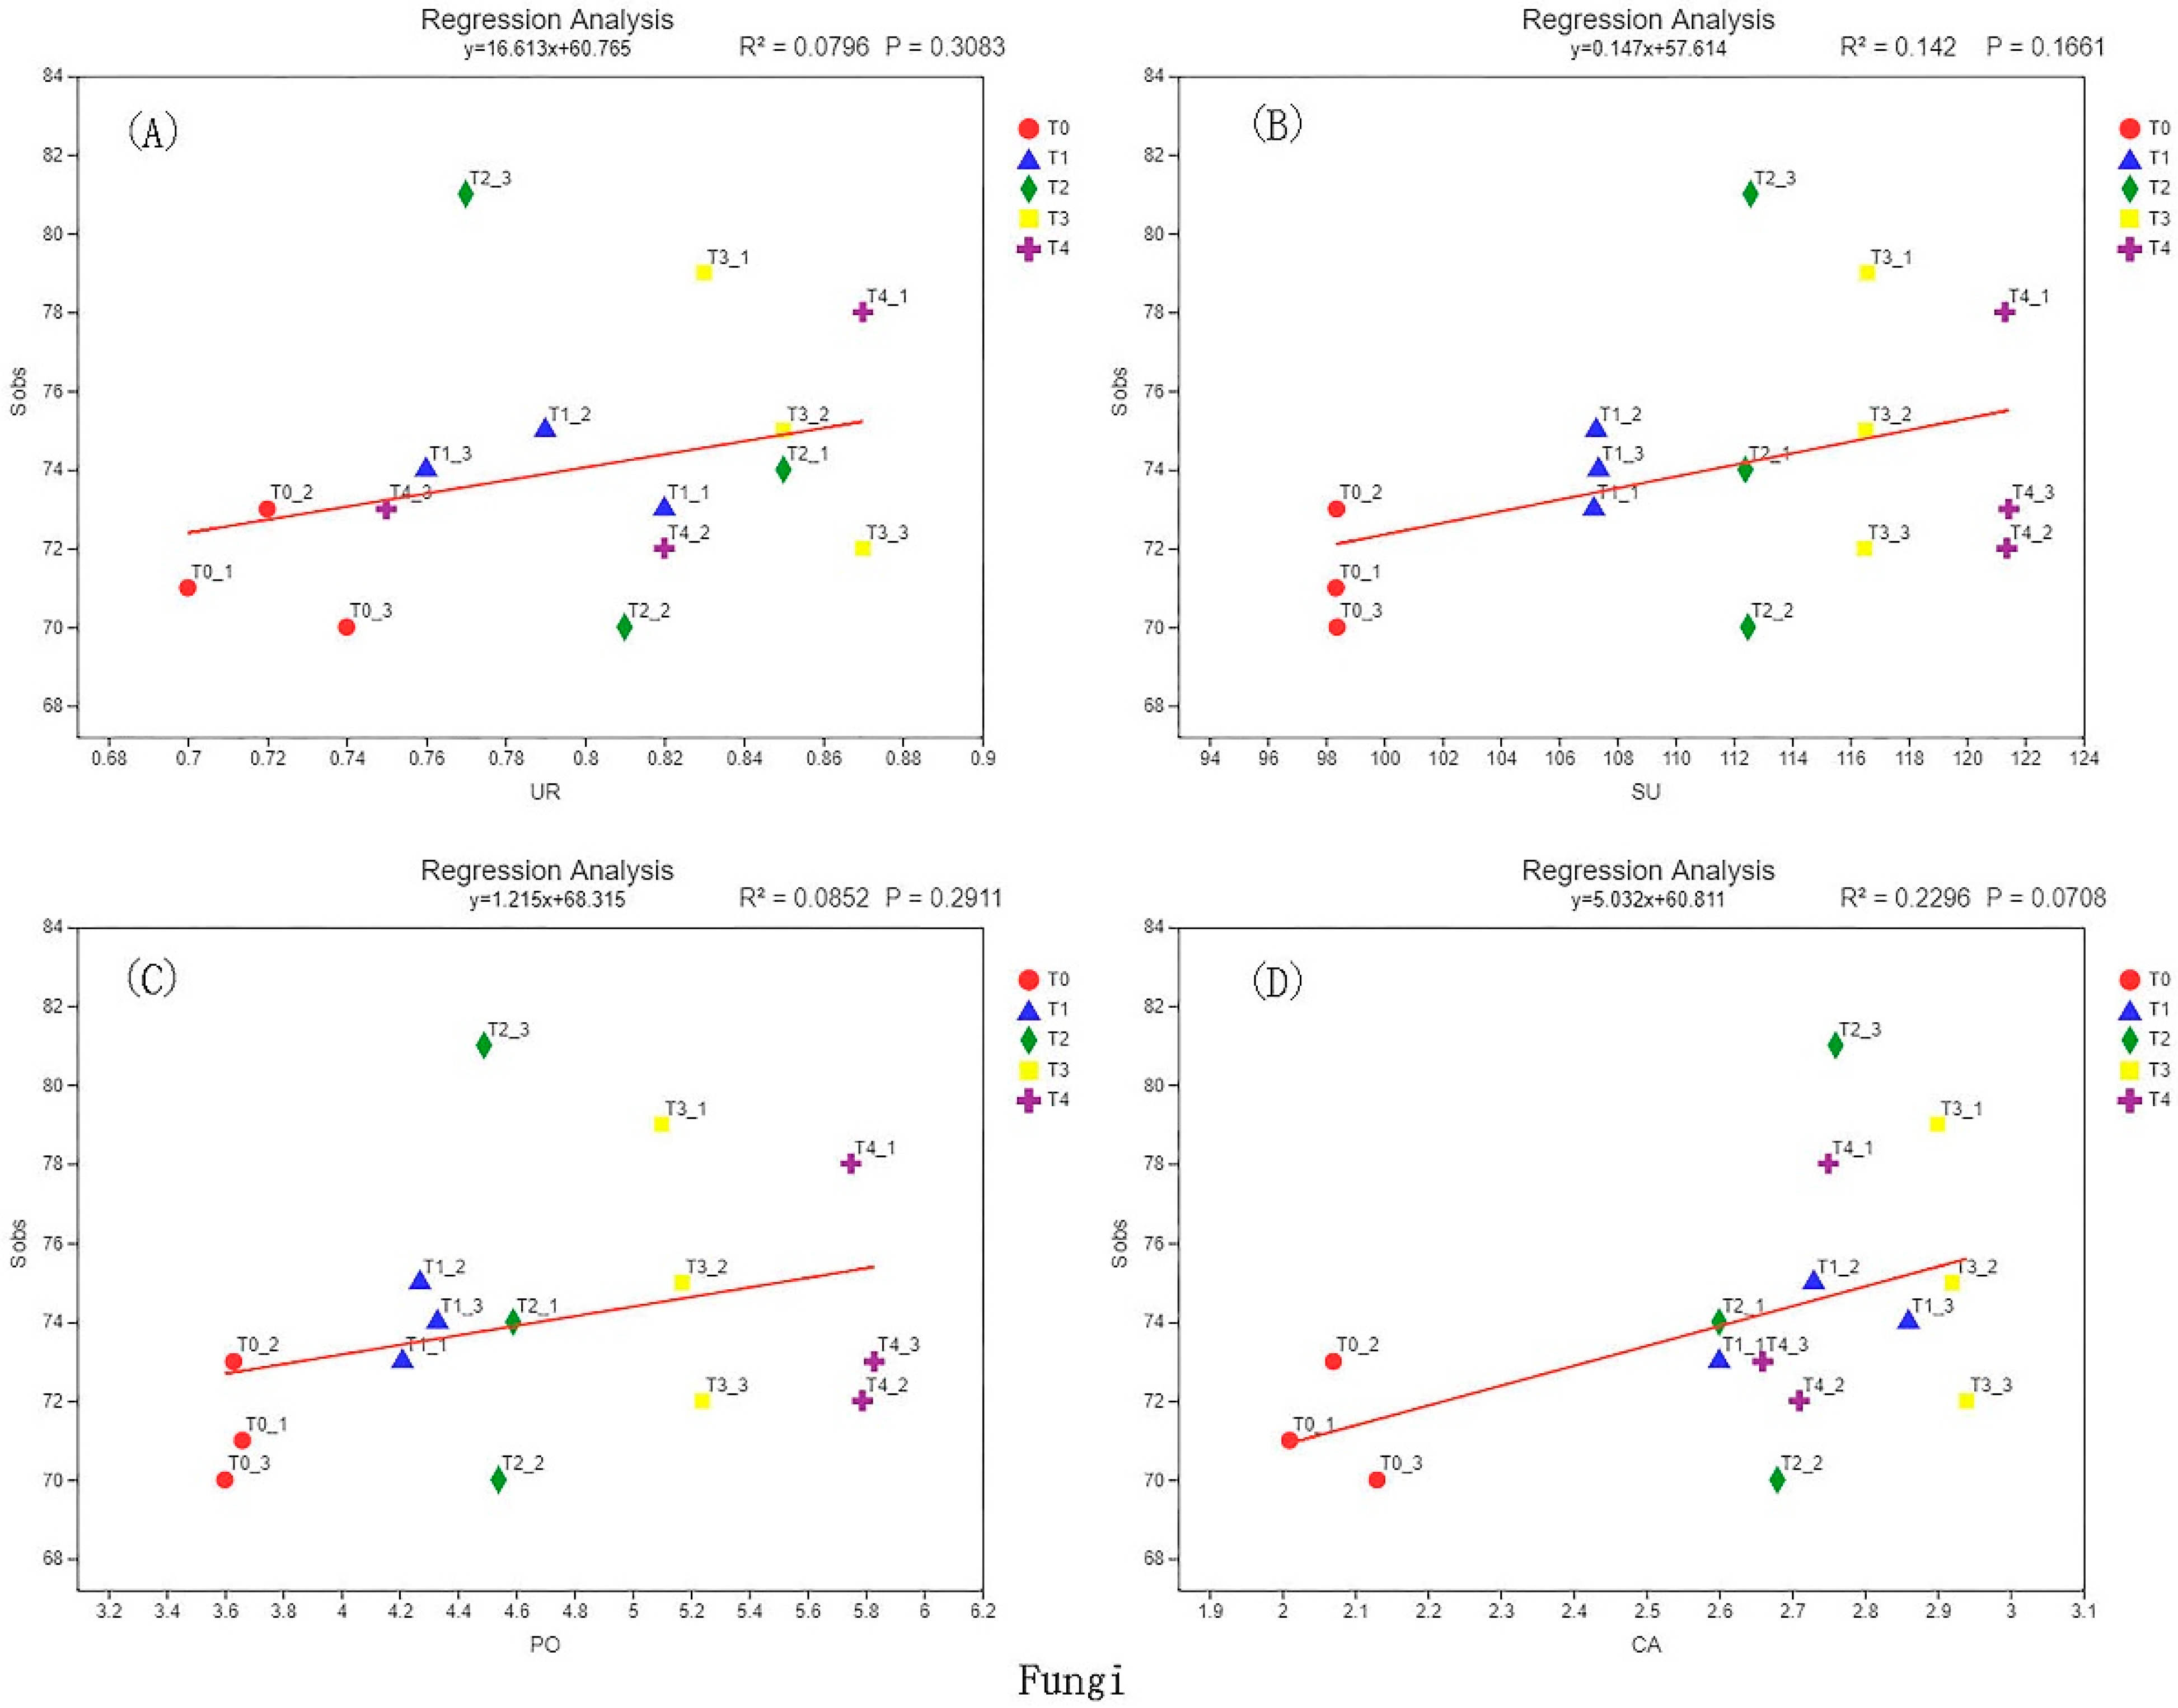
3.6. Correlation Analysis of Soil Enzyme Activity and Microbial Diversity

Soil urease, invertase, polyphenol oxidase, and catalase were positively correlated with soil microbial diversity (Figure 4 and Figure 5). The correlation coefficients (R2) between catalase and the diversities of bacteria and fungi were the highest, with scores of 0.2353 and 0.2296, respectively; the second highest R2 values were for invertase, 0.1852 and 0.142, respectively. The correlation coefficients for the relationships between urease and the soil bacteria and fungi were 0.045 and 0.0796, respectively; while those for polyphenol oxidase were 0.1107 and 0.0852, respectively (Figure 4 and Figure 5).

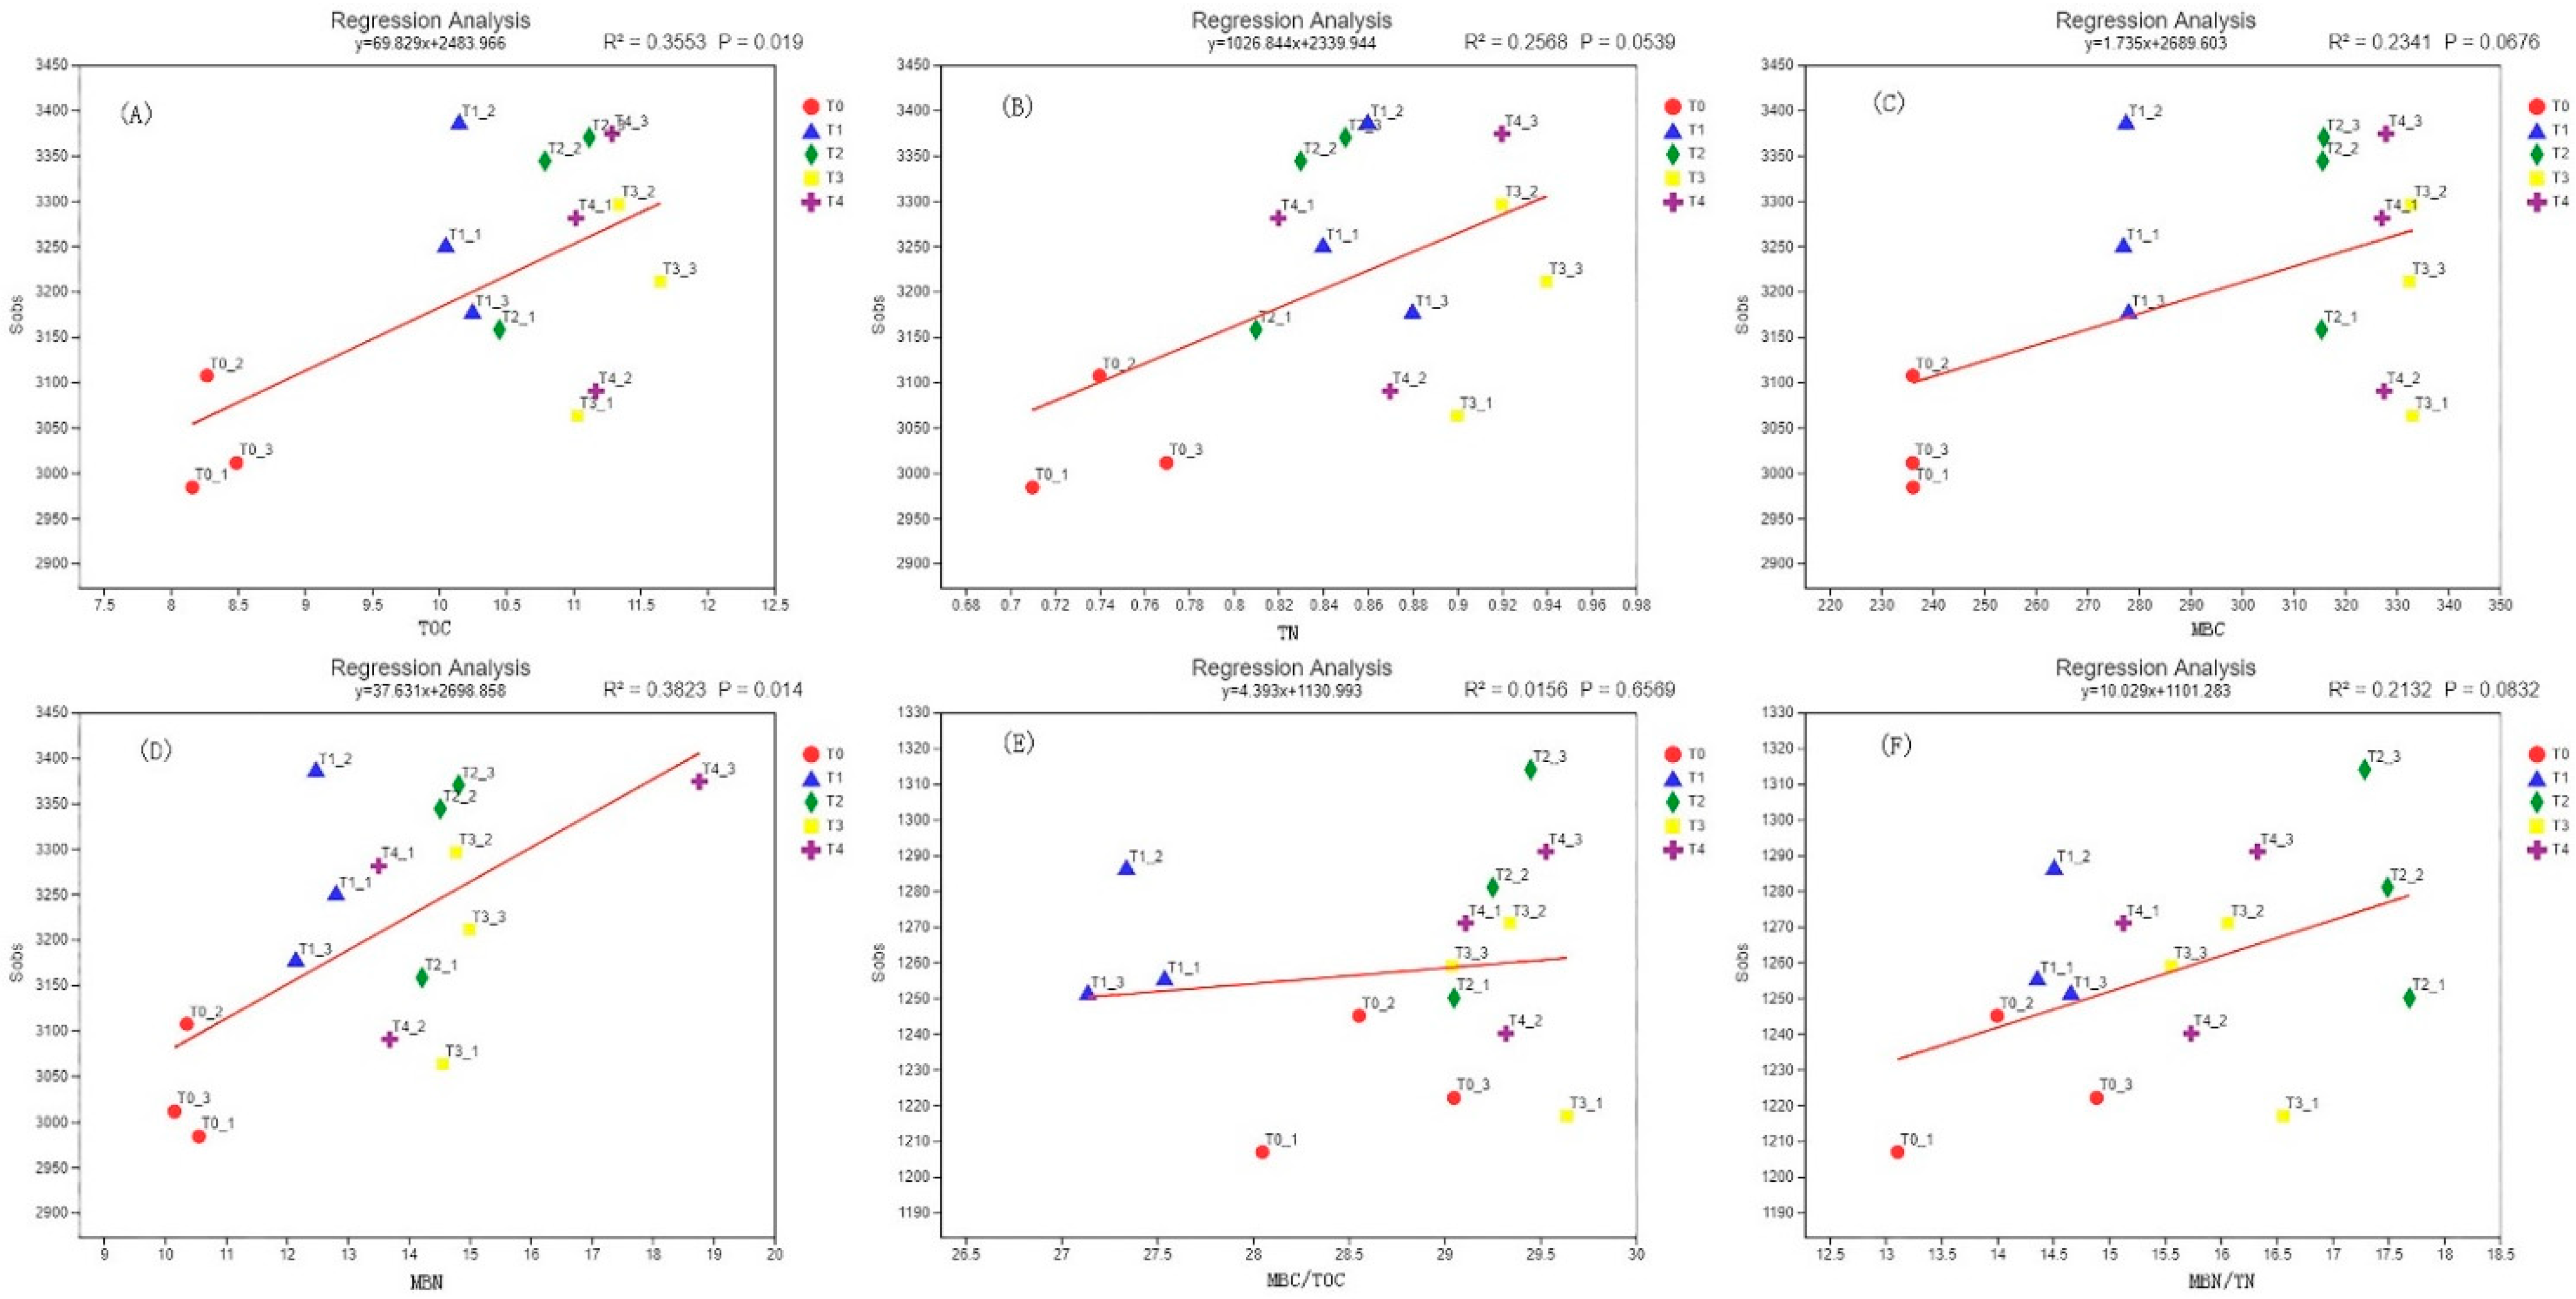
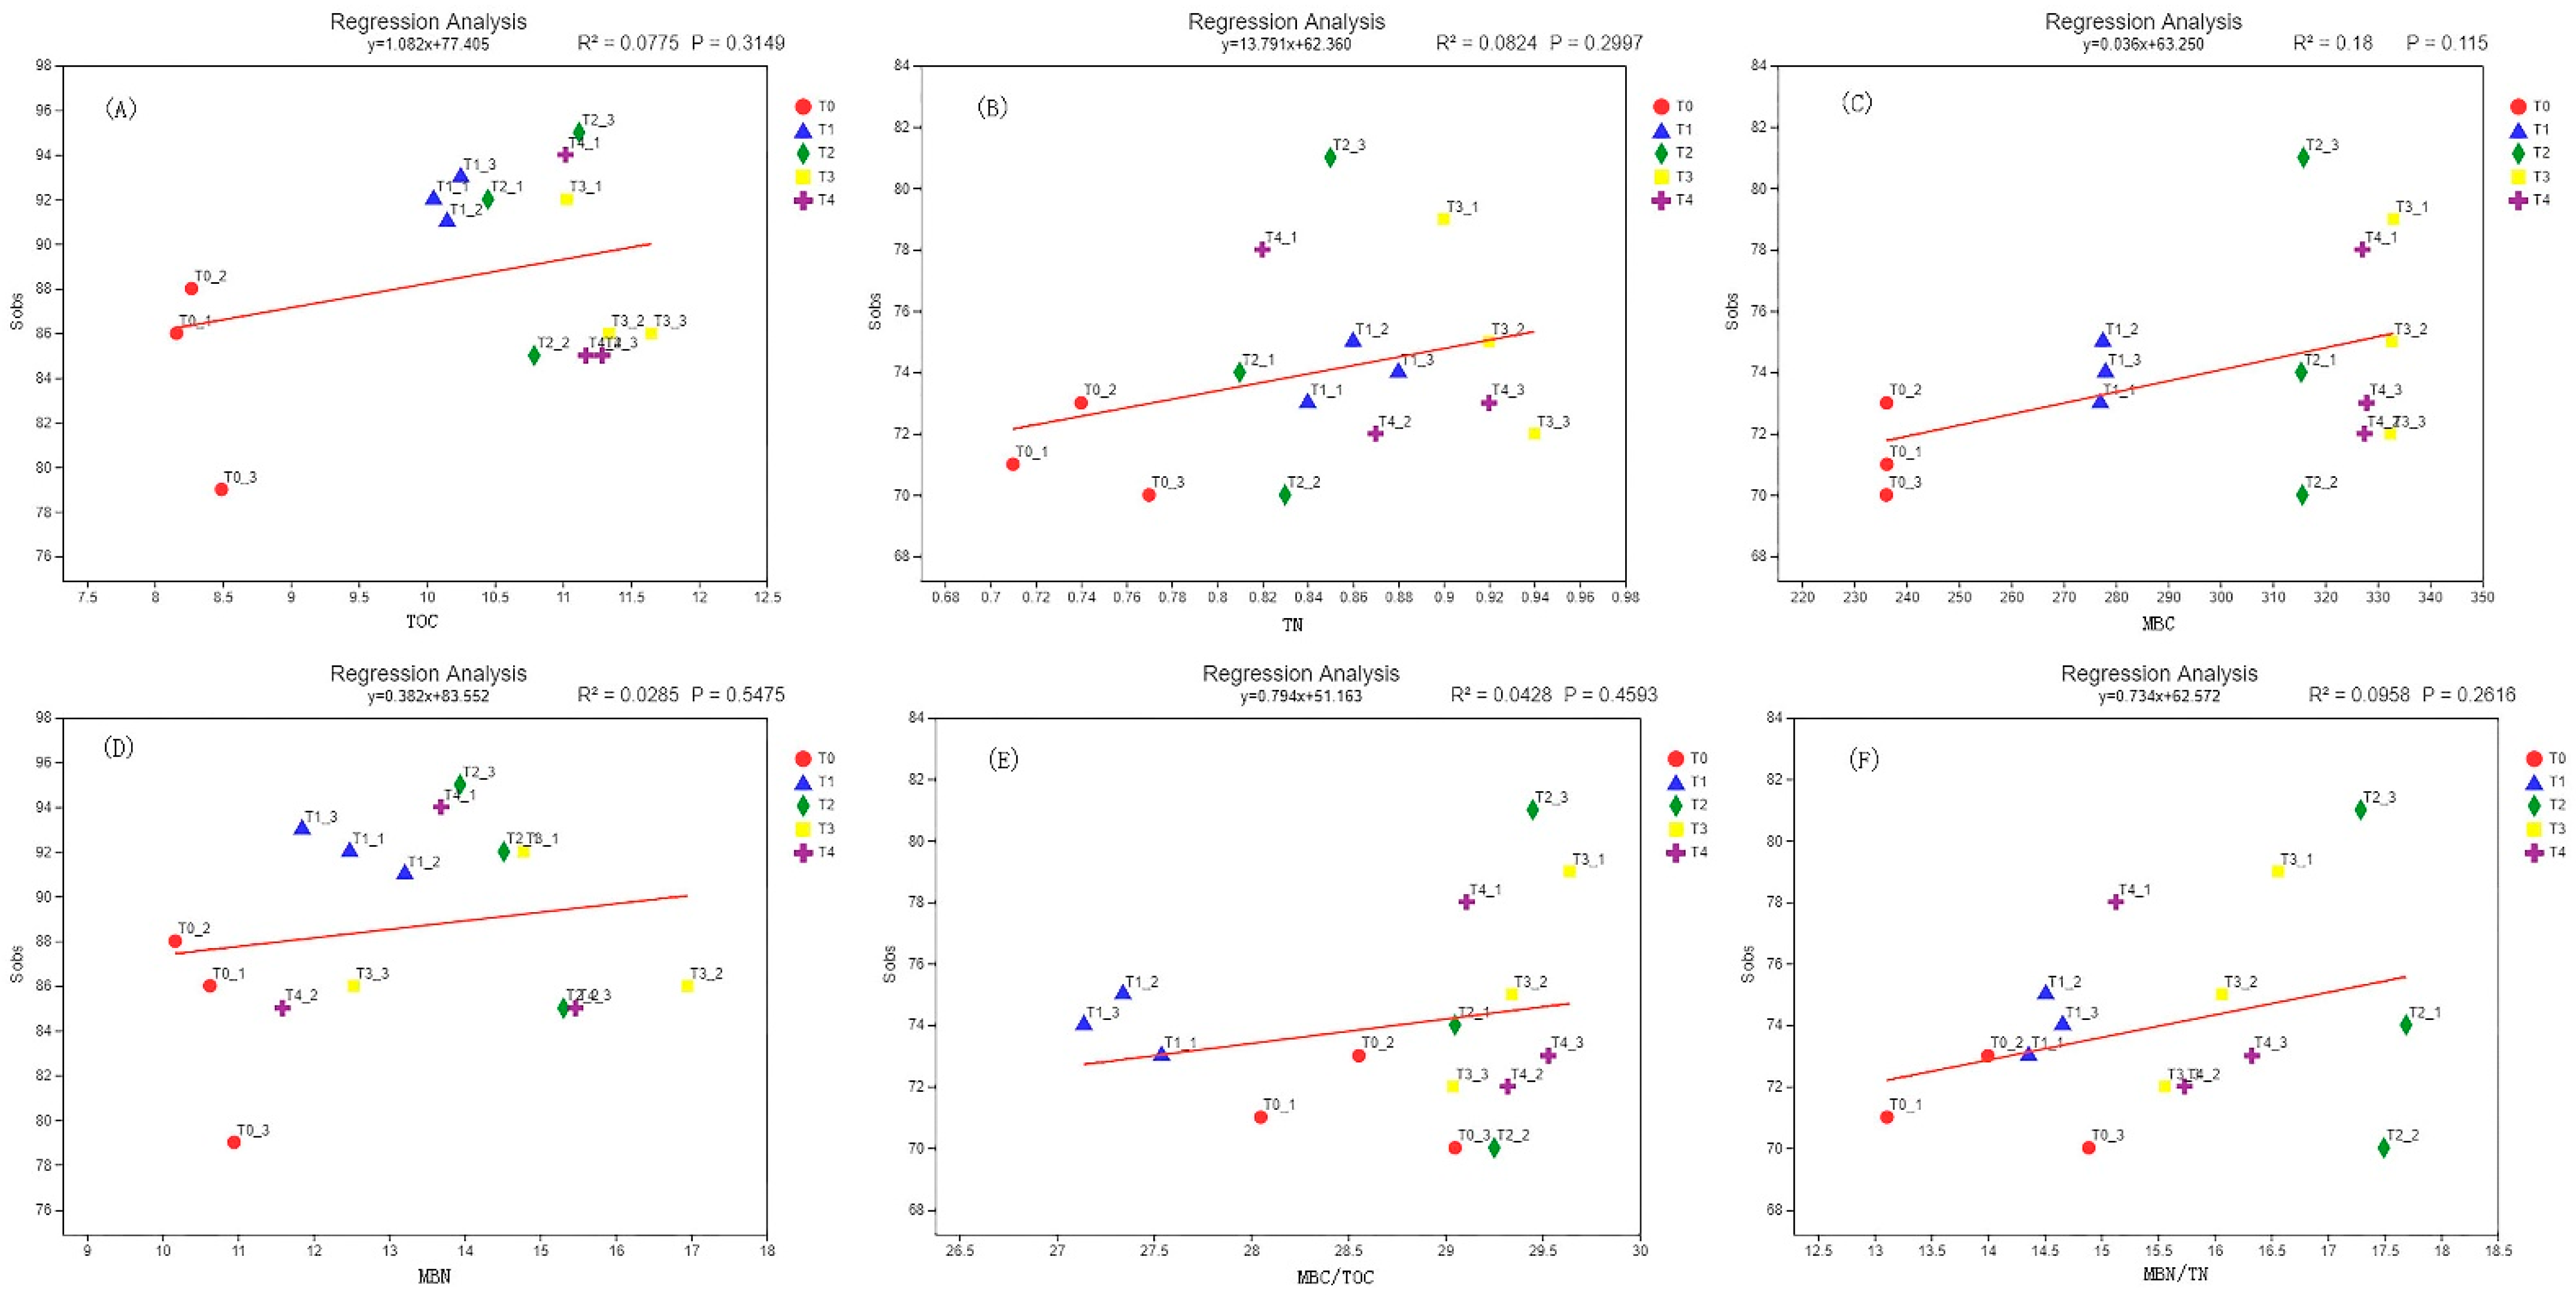
3.7. Correlation Analysis of Soil Microbial Biomass Carbon and Nitrogen and Microbial Diversity

Soil MBC, MBN, TOC, TN, MBC/TOC, and MBN/TN had positive effects on soil microbial diversity (Figure 6 and Figure 7). The coefficient of influence (R2) of MBN on bacterial diversity was the highest, 0.3553; the second highest was that of TOC, 0.3553. The coefficients of influence of TN, MBC, MBC/TOC, and MBN/TN on soil bacteria were 0.2568, 0.2341, 0.0156, and 0.2132, respectively (Figure 6). MBC, MBN, TOC, TN, MBC/TOC, and MBN/TN also had positive impacts on soil fungal diversity, but overall, the above indicators had a lower impact on soil fungal diversity than on soil bacterial diversity (Figure 6). The coefficient of influence of MBC on fungal diversity was the highest, 0.18; the second highest was that of MBN/TN, 0.0958. The coefficients of influence of TOC, TN, MBN, and MBC/TOC on soil fungi (R2) were 0.0775, 0.0824, 0.0285, and 0.0428, respectively (Figure 7).

4. Discussion

4.1. The Impact of Biochar on Soil Microbial Diversity

4.1.1. Bacterial Alpha Diversity (α-Diversity)

The α-diversity of soil bacteria refers to the abundance of bacteria in a local area or in the same habitat. It generally includes the Shannon index, Chao index, and ACE index. The results of this study show that biochar promotes an increase in soil bacterial α-diversity. The Shannon and Chao index values of the bacteria in T1 and T2 were significantly different from those in the control group, while the ACE index of T3 showed a highly significant difference from the control (Table 3). It is possible that, as biochar was imported into the soil, the physical and chemical properties of the soil changed, especially the soil carbon and nitrogen levels and the physical structure. This would lead to changes in soil bacterial abundance. An increase in the soil TOC content can increase the abundance of bacterial species in the soil, as organic carbon is the most important source of soil bacterial nutrition [26]. Therefore, with the increase in TOC content, the diversity index increased accordingly. This may also be related to the symbiotic relationship between soil rhizosphere microorganisms and plant roots [27]; biochar can stimulate plant roots to secrete more metabolites, and these root exudates can promote vigorous bacterial growth and reproduction, and enhance bacterial metabolism. In this study, the treatment with 1% (w/w) of biochar had a significant promotion effect on bacterial α-diversity. Although the amount of biochar used in other treatments was higher, bacterial α-diversity decreased. This may be because 1% (w/w) of biochar is more suitable for the improvement of bacterial α-diversity. Excessive biomass will cause more drastic changes in soil physical and chemical properties, which is not conducive to the improvement of bacteria α-diversity.

4.1.2. Bacterial Beta Diversity

This study showed that the bacterial species compositions of each treatment were significantly different, while the differences in the soil bacterial species within the biochar treatments were not obvious, and their similarity with the control was low (Figure 1). It is possible that biochar changes the soil environment and nutritional status and promotes the development of bacterial communities in a specific direction. Changes in the soil environment and its nutritional status are mainly caused by changes in organic carbon, moisture, and gas permeability [28,29]. Biochar can cause changes in all these indicators, subsequently changing the soil environment and guiding the bacterial population to develop in a certain direction. This was also confirmed by the fact that the different biochar treatments led to different changes in their soil bacterial population structures. However, different amounts of biochar have different effects on the composition of bacterial species, indicating that the appropriate amount of biochar has more obvious effects on the change of bacterial species composition. In this study, the treatment of 2% (w/w) biochar had a significant effect on improving bacterial species compositions. This may be because when the biochar reaches the most appropriate concentration of soil microorganisms, the excess biochar will affect the physical and chemical properties of the soil, especially the pH of the soil which will change greatly [28], resulting in a certain limit to the growth of soil microorganisms.

4.1.3. Fungal Alpha Diversity

In the study of fungal α-diversity in soil community ecology, the analysis of the microbial diversity in a single sample can reflect changes in the abundance of soil microbial communities, including the analysis of different types of diversity indices [29]. Soil microbial α-diversity is the microbial diversity in a uniform habitat in a local area; therefore, it is also called the microbial diversity within the habitat. The results of this study show that biochar improved the α-diversity index of soil fungi. The fungal α-diversity index first increased and then decreased with increasing biochar. Among the treatments, T2 and T3 had significant impacts on the soil fungal α-diversity (Table 3). This may be because the structural characteristics of the biochar changed the soil environment, providing a good habitat and nutrient source for the growth and reproduction of soil fungi [30]. Alternatively, increased levels of soil organic carbon can also change the physical structure of the soil, which can create good conditions for the improvement of soil fungal diversity. As the amount of biochar increased, soil fungal α-diversity did not show a continuous increasing trend but reached a maximum within a certain range. This may be because the biochar environment is more suitable for the growth and development of fungi at a certain concentration. The extent to which the physical and chemical properties of soil are affected by biochar is related to the amount of biochar applied. Soil affected by large doses of biochar is not suitable for the reproduction and growth of soil fungi [31], resulting in a decrease in the diversity of soil fungi. A certain amount of biochar can significantly improve the activity of fungi, but a large amount has an inhibitory effect. The reason for this is similar to bacteria. Excess biochar will aggravate change of the soil physical and chemical properties, and excessive change of soil physical and chemical properties is not conducive to the growth of soil fungi. Han’s research results are consistent with this view [32].

4.1.4. Fungal Beta Diversity

The species composition of soil fungi is an ordered collection of different microorganisms that are simultaneously related to each other, under specific time and space conditions, in a habitat with obvious characteristics. Its basic characteristics include structure (such as predator relationships), community environment, boundary features, and distribution range [33]. In this study, soil fungal community structure changed significantly after biochar application. Compared with the control, the soil fungal communities of the biochar treatments changed in a specific direction. Soil fungal community structure also showed large differences between the treatment groups, depending on the amount of biochar applied (Figure 2). This may be because the ecological conditions and soil types of the soils in the different treatments were similar, and these conditions promoted the same dominant fungal species in the different treatments. These changes affect the growth and development of soil fungi, resulting in changes in fungal community structure [34]. There were also significant differences in the soil fungal community structure between the different biochar treatments. This may be because different amounts of biochar affect soil physical and chemical properties differently. The growth and reproduction of fungi are greatly affected by these changes in the soil environment [1], leading to significant differences in the diversity and community structure of the soil fungi.

4.2. The Effect of Biochar on Soil Enzyme Activity

Soil enzyme activity is an important reference index for soil microbial activity, biochemical reaction capacity, soil nutrient cycling, and material metabolism. The activities of soil enzymes are extremely sensitive to environmental changes and can reflect changes in soil quality under various conditions [35]. Biochar can cause changes in soil physical and chemical properties through its own physical and chemical properties. It therefore has important impacts on soil enzyme activities [36]. Under the influence of biochar, enzyme activities related to the utilization of phosphorus and nitrogen in the soil can be significantly increased. Jones et al. [34] showed that the continuous application of 50 t ha−1 biochar to the soil significantly increased denitrification enzyme activity. Lehmann et al. believe that biochar can increase the activity of most soil enzymes involved in N mineralization [36]. Urease is a key regulator of the nitrogen cycle in the soil. It is mainly involved in promoting the hydrolysis of urea and is an important reference indicator that reflects soil nitrogen mineralization ability and nitrogen level. Catalase, an oxidoreductase, is an important participant in the decomposition of hydrogen peroxide in the soil. Sucrase is mainly used to hydrolyze sucrose in the soil and convert it into fructose or glucose to facilitate its absorption by plants and soil microorganisms [36]. Polyphenol oxidase is also an oxidoreductase. It is mainly derived from plant residues, root exudates, and soil microorganisms, and is an important participant in soil aromatic compound cycling [1]. Biochar increases soil organic carbon and active organic carbon, both of which are key indicators that affect soil enzyme activity. Therefore, the activities of soil invertase, soil urease, polyphenol oxidase, and catalase vary. These enzyme activities were all improved by biochar application, which is consistent with the results of Huang et al. [37]. This may be because soil enzyme activity is closely related to soil respiration intensity, microbial community structure characteristics, and organic matter content. After biochar application, the above indicators affect changes in soil enzyme activity. The level and coordination of the mineral element content in the soil are key factors that influence plant growth and development, especially plant leaf respiration and photosynthesis. It is the energy carrier and material basis for plant carbon assimilation and metabolism [38].

4.3. The Effect of Biochar on Soil Microbial Biomass Carbon and Microbial Biomass Nitrogen

Soil MBC and MBN are the most active components of soil organic carbon and nitrogen. Generally, MBC refers to a carbon component with a volume of 5 × 10³ μo3 [39]. MBC and MBN represent the nutrients in the soil that are easily used by plants and microorganisms and are the driving force for carbon and nitrogen mineralization. Moreover, MBC, MBN, and the absorption and circulation of nutrients such as nitrogen, phosphorus, potassium, sulfur, magnesium, and iron in the soil are closely related. Although MBC only accounts for approximately 1% of soil TOC and MBN about 2% of soil TN, they can reflect the activity, abundance, and metabolic intensity of soil microorganisms. In addition, MBC and MBN directly participate in soil metabolism. They represent essential turnover material for effective nutrients in the soil and occupy important positions in the cyclic transformation of soil materials. Therefore, MBC and MBN are of great significance in plant growth and metabolism, and soil fertility maintenance [40]. The results of this study show that biochar effectively increases the content of MBC in the soil, and this effect increases with increasing biochar input. Biochar is loose and porous, providing excellent living conditions for the growth of microorganisms [41]. In addition, the surface structure and carbon content of biochar promotes soil microorganism growth. Biochar can retain water and reduce nutrient leaching by adsorbing cations and anions [42], which indirectly improves microbial nutrient utilization, leading to an increase in MBC and MBN. Previous research [41], has shown that, owing to its chemical stability, biochar application can increase the level of soil MBC, and as the amount of biochar in the soil increases, soil MBC and MBN also increase. However, other studies have shown that biochar has an inhibitory effect on MBC and MBN after being applied to the soil, and it is hypothesized that this phenomenon may be caused by the adsorption of certain carbon and nitrogen compounds by the biochar, as well as its compounding with biochar. This limits the availability of substrates for microbial growth and ultimately leads to a decrease in soil MBC and MBN content [42]. This difference may exist because biochar stimulates the metabolism and reproduction of soil microorganisms [39]. When the microbial community abundance and metabolic intensity of the soil were strong, soil MBC and MBN increased accordingly. In a prosperous period of tobacco transplantation, most of the physiological indicators of tobacco plants reached their maximum values [43], and the temperature and rainfall also increased, promoting the vigorous metabolism of soil microorganisms. The material conversion rate accelerated, the net MBC and MBN in the soil increased, and the influence of biochar on soil MBC and MBN also reached a maximum.

4.4. The Relationship between Soil Microbial Diversity and Microbial Biomass Carbon and Nitrogen

“Soil enzymes” is the general term for specialized protein compounds with biocatalytic abilities that exist in soil. They are the products of microbial activity and are extremely small but effective soil components. Various biochemical processes of soil microorganisms are realized by the enzymes they produce. Therefore, the activity of soil enzymes can be used as an indicator of the intensity of soil biochemical processes and to evaluate soil fertility [44]. Soil MBC refers to the sum of the carbon in living and dead microorganisms with a volume of <5000 μm3 in the soil. Soil microbial biomass refers to the total biomass in the soil with a volume of less than 5 × 103 μm3 and is the most active component of soil organic matter. Between these two, MBC is the more important component. MBC is an easy-to-use nutrient pool in the soil, and the driving force for the decomposition of organic matter and the mineralization of N. It is closely related to the nutrient cycles of C, N, P, and S in the soil. As a component of soil activated carbon, although MBC only accounts for 1–4% of total soil organic carbon, it can not only reflect small changes in total soil carbon, but it also directly participates in the soil. Biochemical transformation is from a reservoir of effective plant nutrients in the soil and can promote the effectiveness of soil nutrients. Therefore, it plays an important role in soil fertility and plant nutrition. Soil enzyme activity and MBC and MBN are important indicators of the metabolic capacity of soil microorganisms. This study shows that soil enzyme activity is positively correlated with soil bacterial and fungal diversity, and that soil microbial carbon and nitrogen are positively correlated with soil microbial diversity. This may be because soil enzymes are mainly produced by soil microorganisms, and they have a strong correlation.; thus, soil enzyme activity and microbial diversity have a mutually promoting relationship [45]. Soil MBC and MBN are present in microorganisms and metabolites while soil MBC and MBN content is an important reference index for soil microbial metabolism. Moreover, when the intensity of soil microbial metabolism increases, the MBC and MBN content of the soil also increases.

5. Conclusions

This study aimed to study the effects of biochar on the metabolic capacity of tobacco rhizosphere microbial diversity. Biochar increased the diversity of soil bacteria and fungi, and the soil community structure also changed under the influence of biochar. Soil enzyme activity, MBC, and MBN also increased with increasing biochar input. In terms of the effect of biochar on the metabolism of tobacco-growing soil microbial diversity, treatment with 3% biochar was the most effective. Soil enzyme activity is positively related to microbial diversity, and the greatest correlation was found between catalase and invertase and bacterial diversity. There is a strong positive correlation between soil MBC and MBN and soil microbial diversity, and the correlation between soil MBN and bacterial diversity was the strongest; the correlation between soil MBC and fungal diversity is the largest. Biochar plays an important role in improving soil microbial diversity and facilitating microbial metabolism. Thus, our results provide guidance regarding the impressive benefits of biochar application to agricultural soils.

Author Contributions

Conceptualization: H.W. and H.S.; Methodology: H.W. and G.L.; Data collection: Y.Z., H.S. and H.W.; Formal analysis: R.Z. and H.W.; Supervision: Y.Z. and H.S.; Funding acquisition: H.S.; Writing—original draft preparation: H.W.; Writing—review and editing: H.S. All authors have read and agreed to the published version of the manuscript.

Funding

This research was funded by the study on the mechanism and control technology of organic carbon based on carbon and nitrogen balance in tobacco field soil, China (110201902004), and study on improving tobacco leaf quality in Henan Production Area based on soil remediation technology, China (2021410000340260), and study on the improvement of ripening resistance and matching baking technology of upper leaves in Nanyang tobacco-growing area, China (2020411300270065).

Data Availability Statement

Not applicable.

Conflicts of Interest

The authors declare no conflict of interest. The funders had no role in the design, execution, and report of the study.

References

  1. Graber, E.R.; Meller, H.Y.; Kolton, M. Biocharimpact on development and productivity of pepper and tomato grown in fertigated soilless media. Plant Soil 2010, 337, 481–496. [Google Scholar] [CrossRef]
  2. Schloss, P.D.; Westcott, S.L.; Ryabin, T.; Hall, J.R.; Hartmann, M.; Hollister, E.B.; Lesniewski, R.A.; Oakley, B.B.; Parks, D.H.; Robinson, C.J.; et al. Introducing Mothur: Open-source, platform-independent, community-supported software for describing and comparing microbial communities. Appl. Environ. Microbiol. 2009, 75, 7537–7541. [Google Scholar] [CrossRef] [Green Version]
  3. Palansooriya, K.N.; Wong, J.T.F.; Hashimoto, Y.; Huang, L.; Rinklebe, J.; Chang, S.X.; Bolan, N.; Wang, H.; Ok, Y.S. Response of microbial communities to biochar-amended soils: A critical review. Biochar 2019, 1, 3–22. [Google Scholar] [CrossRef] [Green Version]
  4. Bandara, T.; Franks, A.; Xu, J.; Bolan, N.; Wang, H.; Tang, C. Chemical and biological immobilization mechanisms of potentially toxic elements in biochar-amended soils. Crit. Rev. Environ. Sci. Technol. 2020, 50, 903–978. [Google Scholar] [CrossRef]
  5. Li, J.; Wang, S.L.; Zhang, J.; Zheng, L.; Chen, D.; Wu, Z.; Shaheen, S.M.; Rinklebe, J.; Ok, Y.S.; Wang, H.; et al. Coconut-fiber biochar reduced the bioavailability of lead but increased its translocation rate in rice plants: Elucidation of immobilization mechanisms and significance of iron plaque barrier on roots using spectroscopic techniques. J. Hazard. Mater. 2020, 389, 122117. [Google Scholar] [CrossRef]
  6. Wei, J.; Tu, C.; Yuan, G.; Zhou, Y.; Wang, H.; Lu, J. Limited Cu(II) binding to biochar DOM: Evidence from C K-edge NEXAFS and EEM-PARAFAC combined with two-dimensional correlation analysis. Sci. Total Environ. 2020, 701, 134919. [Google Scholar] [CrossRef] [PubMed]
  7. Chen, H.; Yang, X.; Wang, H.; Sarkar, B.; Shaheen, S.M.; Gielen, G.; Bolan, N.; Guo, J.; Che, L.; Sun, H.; et al. Animal carcass- and wood-derived biochars improved nutrient bioavailability, enzyme activity, and plant growth in metal-phthalic acid ester co-contaminated soils: A trial for reclamation and improvement of degraded soils. J. Environ. Manag. 2020, 261, 110246. [Google Scholar] [CrossRef] [PubMed]
  8. Hu, W.; Ran, J.; Dong, L.; Du, Q.; Ji, M.; Yao, S.; Sun, Y.; Gong, C.; Hou, Q.; Gong, H.; et al. Aridity-driven shift in biodiversity-soil multifunctionality relationships. Nat. Commun. 2021, 12, 5350. [Google Scholar] [CrossRef]
  9. Hu, W.; Hou, Q.; Delgado-Baquerizo, M.; Stegen, J.C.; Du, Q.; Dong, L.; Ji, M.; Sun, Y.; Yao, S.; Gong, H.; et al. Continental-scale niche differentiation of dominant topsoil archaea in drylands. Environ. Microbio 2022, 24, 5483–5497. [Google Scholar] [CrossRef]
  10. Díaz, L.M.; Nicolás, E.; López, M.R.; Galera, L.; Garrido, I.; Fenoll, J.; Bastida, F. Combined ozonation and solarization for the removal of pesticides from soil: Combined ozonation and solarization for the removal of pesticides from soil: Effects on soil microbial communities. Sci. Total Environ. 2020, 758, 143950. [Google Scholar] [CrossRef]
  11. Van, Z.L.; Kimber, S.; Morris, S.; Chan, K.; Downie, A.; Rust, J.; Joseph, S.; Cowie, A. Effects of biochar from slow pyrolysis of papermill waste on agronomic performance and soil fertility. Plant Soil 2010, 327, 235–246. [Google Scholar]
  12. IUSS Working Group WRB. World Reference Base for Soil 40 Resources. International Soil Classification System for Naming Soils and Creating Legends for Soil Maps, 3rd ed.; FAO: Rome, Italy, 2014. [Google Scholar]
  13. Ward, M.W.; Owens, C.W.; Rennie, M.J. Nitrogen estimation in biological samples by use of chemiluminescence. Clin. Chem. 1980, 26, 1336–1339. [Google Scholar] [CrossRef] [PubMed]
  14. Viswanathan, P.; Sriram, V.; Yogeeswaran, G. Sensitive spectrophotometric assay for 3-hydroxy-substituted flavonoids, based on their binding with molybdenum, antimony, or bismuth. J. Agric. Food Chem. 2000, 48, 2802–2806. [Google Scholar] [CrossRef] [PubMed]
  15. Tan, S.C.; Khor, E.; Tan, T.K.; Wong, S.M. The degree of deacetylation of chitosan: Advocating the first derivative UV-spectrophotometry method of determination. Talanta 1998, 45, 713–719. [Google Scholar] [CrossRef]
  16. Nielsen, S.; Joseph, S.; Ye, J.; Chia, C.; Munroe, P.; van Zwieten, L.; Thomas, T. Cropseason and residual effects of sequentially applied mineral enhanced biochar and N fertiliser on crop yield, soil chemistry and microbial communities. Agric. Ecosyst. Environ. 2018, 255, 52–61. [Google Scholar] [CrossRef]
  17. Lu, Y.; Yu, M.J.; Lu, X.; Tang, C.; Liu, X.M.; Brookes Philip, C.; Xu, J.M. Combined application of biochar and nitrogen fertilizer benefits nitrogen retention in the rhizosphere of soybean by increasing microbial biomass but not altering microbial community structure. Sci. Total Environ. 2018, 640–641, 1221–1230. [Google Scholar]
  18. Ma, Q.; Wen, Y.; Wang, D.; Sun, X.; Hill, P.W.; Macdonald, A.; Chadwick, D.R.; Wu, L.; Jones, D.L. Farmyard manure applications stimulate soil carbon and nitrogen cycling by boosting microbial biomass rather than changing its community composition. Soil Biol. Biochem. 2020, 144, 107760. [Google Scholar] [CrossRef]
  19. Zhao, M.; Cai, K.; Sun, Y.H. Carbon, nitrogen mineralization and effcets on yield and quality of tomato in greenhouse of biochar made by sludge. Chin. Agric. Sci. Bull. 2014, 30, 215–220. [Google Scholar]
  20. Tian, D.; Gao, M.; Huang, R.; Lu, S.; Xu, C. Response of soil respiration and heterotrophic respiration to returning of straw and biochar in rape-maize rotation systems. Acta Sci. Circumst 2017, 38, 2988–2999. [Google Scholar]
  21. Wang, H.; Ren, T.; Yang, H.; Feng, Y.; Feng, H.; Liu, G.; Yin, Q.; Shi, H. Research and Application of Biochar in Soil CO2 Emission, Fertility, and Microorganisms: A Sustainable Solution to Solve China’s Agricultural Straw Burning Problem. Sustainability 2020, 12, 1922. [Google Scholar] [CrossRef] [Green Version]
  22. Birk, J.J.; Steiner, C.; Teixiera, W.C. Microbial Response to charcoal amendments and fertilization of a highly weathered tropical soil. In Amazonian Dark Earths: Wim Sombroek’s Vision; Woods, W.I., Teixeira, W.G., Lehmann, J., Eds.; Springer: Berlin/Heidelberg, Germany, 2009; Volume 45, pp. 309–324. [Google Scholar]
  23. Wang, L.; Ok, Y.S.; Tsang, D.C.W.; Alessi, D.S.; Rinklebe, J.; Wang, H.; Mašek, O.; Hou, R.; O’Connor, D.; Hou, D. New Trends in Biochar Pyrolysis and Modification Strategies: Feedstock, Pyrolysis Conditions, Sustainability Concerns and Implications for Soil Amendment. Soil Use Manag. 2020, 36, 358–386. [Google Scholar] [CrossRef] [Green Version]
  24. Wang, C.G.; Chen, Z.; Yin, H.; Guo, W.; Cao, Y.; Wang, G.J.; Sun, B.; Yan, X.F.; Li, J.D.; Zhao, T.H.; et al. The Responses of Forest Fine Root Biomass/Necromass Ratio to Environmental Factors Depend on Mycorrhizal Type and Latitudinal Region. J. Geophys. Res. Biogeosci. 2018, 123, 1769–1788. [Google Scholar] [CrossRef] [Green Version]
  25. Mooshammer, M.; Wanek, W.; Zechmeister-Boltenstern, S.; Richter, A. Stoichiometric imbalances between terrestrial decomposer communities and their resources: Mechanisms and implications of microbial adaptations to their resources. Front. Microbiol. 2014, 5, 22. [Google Scholar] [CrossRef] [PubMed] [Green Version]
  26. Liang, F.; Li, G.T.; Lin, Q.M.; Zhao, X.R. Crop Yield and Soil Properties in the First 3 Years After Biochar Application to a Calcareous Soil. J. Integr. Agric. 2014, 13, 525–532. [Google Scholar] [CrossRef]
  27. Pariyar, P.; Kumari, K.; Jain, M.K.; Jadhao, P.S. Evaluation of change in biochar properties derived from different feedstock and pyrolysis temperature for environmental and agricultural application. Sci. Total Environ. 2020, 713, 136433. [Google Scholar] [CrossRef]
  28. Fidel, R.B.; Laird, D.A.; Spokas, K.A. Sorption of ammonium and nitrate to biochars is electrostatic and pH-dependent. Sci. Rep. 2018, 8, 17627. [Google Scholar] [CrossRef] [Green Version]
  29. Ihara, H.; Kumagai, A.; Hori, T.; Nanba, K.; Aoyagi, T.; Takasaki, M.; Katayama, Y. Direct comparison of bacterial communities in soils contaminated with different levels of radioactive cesium from the first Fukushima nuclear power plant accident. Sci. Total Environ. 2021, 756, 143844. [Google Scholar] [CrossRef]
  30. Joseph, T.; Kehinde, O.; Tolulope, G.; Zhao, H.Y. Effect of biochar on soil structure and storage of soil organic carbon and nitrogen in the aggregate fractions of an Albic soil. Arch. Agron. Soil Sci. 2020, 66, 1–12. [Google Scholar] [CrossRef]
  31. Durenkamp, M.; Luo, Y.; Brookes, P.C. Impact of black carbon addition to soil on the determination of soil microbial biomass by fumigation extraction. Soil Biol. Biochem. 2010, 42, 2026–2029. [Google Scholar] [CrossRef]
  32. Han, G.; Meng, J.; Cao, T.; Liu, Z.; Chen, W. Effects of biochar on spinach rhizosphere microorganisms and soil physical and chemical properties. J. Shenyang Agric. Univ. 2012, 43, 515–520. [Google Scholar]
  33. Fisk, M.; Santangelo, S.; Minick, K. Carbon mineralization is promoted by phosphorus and reduced by nitrogen addition in the organic horizon of northern hardwood forests. Soil Biol. Biochem. 2015, 81, 212–218. [Google Scholar] [CrossRef]
  34. Zhou, Z.H.; Wang, C.K.; Zhang, Q.Z. The effect of land use change on soil carbon, nitrogen, and phosphorus contents and their stoichiometry in temperate sapling stands in northeastern China. Acta Ecol. Sin. 2015, 35, 6694–6702. [Google Scholar]
  35. Huang, J.; Zhang, Q.Z.; Zhang, D.J. Research advances in effects of biochar application on agroecosystem. Chin. J. Agrometeorol. 2012, 33, 232–239. [Google Scholar]
  36. Zhou, X.; Wu, S.B.; Wang, R.G.; Wu, H.M. Nitrogen removal in response to the varying C/N ratios in subsurface flow constructed wetland microcosms with biochar addition. Environ. Sci. Pollut. Res. 2019, 26, 3382–3391. [Google Scholar] [CrossRef] [PubMed]
  37. Buchkowski, R.W.; Shaw, A.N.; Sihi, D.; Smith, G.R.; Keiser, A.D. Constraining Carbon and Nutrient Flows in Soil with Ecological Stoichiometry. Front. Ecol. Evol. 2019, 7, 382. [Google Scholar] [CrossRef] [Green Version]
  38. Cheng, J.; Li, S.Q.; Geng, Y.J.; Miao, Y.C.; Ding, Y.; Liu, S.W.; Zou, J.W. Differential responses of soil N2O to biochar depend on the predominant microbial pathway. Appl. Soil Ecol. 2020, 145, 103348. [Google Scholar]
  39. Rondon, M.A.; Lehmann, J.; Ramírez, J. Biological nitrogen fixation by common beans (Phaseolus vulgaris L.) increases with bio-char additions. Biol. Fertil. Soils 2007, 43, 699–708. [Google Scholar] [CrossRef]
  40. Li, X.; Zhang, H.; Wu, M. Effect of methamidophos on soil fungi community in microcosms by plate count, DGGE and clone library analysis. J. Environ. Sci. China 2008, 20, 619–625. [Google Scholar] [CrossRef]
  41. Yamato, M.; Okimori, Y.; Wibowo, I.F. Effects of the application of charred bark of Acacia mangium on the yield of maize, cowpea and peanut, and soil chemical properties in South Sumatra, Indonesia. Soil Sci. Plant Nutr. 2006, 52, 489–495. [Google Scholar] [CrossRef]
  42. Grossman, J.M.; O’neill, B.E.; Tsai, S.M. Amazonian anthrosols support similar microbial communities that differ distinctly from those extant in adjacent, unmodified soils of the same mineralogy. Microb. Ecol. 2010, 60, 192–205. [Google Scholar] [CrossRef]
  43. Grunwald, D.; Kaiser, M.; Junker, S.; Marhan, S.; Piepho, H.-P.; Poll, C.; Bamminger, C.; Ludwig, B. Influence of elevated soil temperature and biochar application on organic matter associated with aggregate-size and density fractions in an arable soil. Agric. Ecosyst. Environ. 2017, 241, 79–87. [Google Scholar] [CrossRef]
  44. Singh, B.P.; Hatton, B.J.; Singh, B.; Cowie, A.L.; Kathuria, A. Influence of bio-charson nitrous oxide emission and nitrogen learning learning for bio-charson nitrous ossion and nitrogen learning jiaocontrasting sol. J. Environ. Qual. 2010, 39, 1224–1235. [Google Scholar] [CrossRef] [PubMed]
  45. Zhang, X.; Zhang, Q.W.; Liu, X.R. Effects of biochar on the key soil nitrogen transformation processes in agricultural soil. Chin. Agrometeorol. 2015, 36, 709–716. [Google Scholar]
Figure 1. Dilution curve analysis of each processed sample (OTU level).
Ecologies 03 00040 g001
Figure 2. Hierarchical cluster analysis among different treatments. The lengths between branches represent the distances between the samples, and different groups are presented in different colors; when the stacked column chart is displayed, the composition of the dominant species in each sample is displayed on the right side of the clustering tree; the stacked column chart is not displayed by default. (A) Hierarchical cluster analysis of bacteria, (B) Hierarchical cluster analysis of bacteria.
Ecologies 03 00040 g002
Figure 3. The effect of different amounts of biochar on soil enzyme activity. (A) Urease; (B) sucrase; (C) polyphenol oxidase; (D) catalase. Different lowercase letters indicate significant differences between treatments (p < 0.05).
Ecologies 03 00040 g003
Figure 4. Regression analysis of bacterial ranking. The X-axis is the environmental factor, the Y-axis is the α-diversity ranking axis, and R2 is the coefficient of determination, which represents the proportion of variation explained by the regression line. The larger the R2 value, which indicates that the environmental factor shows differences in the community composition or α-diversity of the sample on the ranking axis, the higher is the degree of explanation of the difference in the diversity index. (A) The environmental factor is urease (UR); (B) the environmental factor is sucrase (SU); (C) the environmental factor is polyphenol oxidase (PO); (D) the environmental factor is catalase (CA).
Ecologies 03 00040 g004
Figure 5. Regression analysis of fungal ordination. (A) The environmental factor is urease (UR); (B) the environmental factor is sucrase (SU); (C) the environmental factor is polyphenol oxidase (PO); (D) the environmental factor is catalase (CA).
Ecologies 03 00040 g005
Figure 6. Regression analysis of bacterial ranking. The X-axis is the environmental factor, the Y-axis is the α-diversity ranking axis, R2 is the coefficient of determination, which represents the proportion of variation explained by the regression line. The larger the R2, which indicates that the environmental factor shows differences in the community composition or α-diversity of the sample on the ranking axis, the higher is the degree of explanation of the difference in the diversity index. (A) The environmental factor is total organic carbon (TOC); (B) the environmental factor is microbial biomass carbon (MBC); (C) the environmental factor is TN (total nitrogen); (D) the environmental factor is microbial biomass nitrogen (MBN). (E) the environmental factor is MBC/TOC. (F) the environmental factor is MBN/TN.
Ecologies 03 00040 g006
Figure 7. Regression analysis of fungal ordination. (A) The environmental factor is total organic carbon (TOC); (B) the environmental factor is microbial biomass carbon (MBC); (C) the environmental factor is TN (total nitrogen); (D) the environmental factor is microbial biomass nitrogen (MBN). (E) the environmental factor is MBC/TOC. (F) the environmental factor is MBN/TN.
Ecologies 03 00040 g007
Table 1. Statistics of bacterial sample data.
SampleSequence Number/PieceBase Number/bpAverage Length/bpMinimum Sequence
Length/bp
Longest Sequence
Length/bp
T4_162,75626,173,971417.08230521
T3_370,42929,342,325416.62203510
T4_372,50430,244,323417.14215496
T3_174,75231,109,636416.17225486
T0_162,99826,240,464416.53214469
T0_363,40326,412,256416.58208486
T0_272,66330,259,304416.43232469
T2_371,01029,592,302416.73214507
T2_269,74729,083,027416.98208461
T2_166,27627,600,565416.45203465
T3_273,12730,444,850416.33216466
T4_271,09029,636,375416.89234466
T1_167,91928,328,289417.09235469
T1_274,38130,995,232416.71202494
T1_368,86028,675,557416.43203499
Table 2. Statistics of fungal sample data.
SampleSequence Number/PieceBase Number/bpAverage Length/bpMinimum Sequence
Length/bp
Longest Sequence
Length/bp
T4_150,21719,151,231381.37299424
T3_356,77821,652,473381.35371431
T4_337,39914,264,267381.41372388
T3_149,45318,857,698381.33256397
T0_140,79515,557,905381.37257424
T0_352,79120,143,900381.58371431
T0_235,10413,391,715381.49371430
T2_350,25719,161,969381.28254425
T2_246,80417,848,691381.35254410
T2_147,63518,166,809381.38254409
T3_249,13818,744,568381.47254424
T4_250,09919,109,284381.43254408
T1_140,63115,503,840381.58254427
T1_243,67216,660,443381.49254411
T1_349,95119,059,580381.57261431
Table 3. Analysis of diversity indices among different treatments. The data are means ± standard deviation. Different lowercase letters in the same row indicate significant differences between treatments (p < 0.05).
Diversity IndexTreatmentBacteriaFungi
ChaoT03860.20 ± 636.4 b137.24 ± 10.59 c
T14128.91 ± 329.5 a155.78 ± 37.4 a
T24105.01 ± 311.8 a158.33 ± 21.9 a
T34084.85 ± 562.7 a148.62 ± 45.1 b
T44108.54 ± 219.7 a147.03 ± 36.2 b
ACET03841.91 ± 672.6 c138.56 ± 37.5 b
T14133.20 ± 233.5 a147.46 ± 25.1 b
T24132.00 ± 492.7 a156.28 ± 42.9 a
T34079.00 ± 433.8 b147.74 ± 14.8 b
T44123.70 ± 294.6 a143.88 ± 25.6 b
ShannonT06.64 ± 0.7 a3.01 ± 0.5 b
T16.71 ± 1.5 a2.96 ± 0.3 b
T26.70 ± 0.9 a3.08 ± 0.5 ab
T36.59 ± 3.6 a3.11 ± 0.7 a
T46.76 ± 2.1 a3.12 ± 0.6 a
CoverageT00.9805 ± 0.05 a0.9997 ± 0.04 a
T10.9795 ± 0.31 ab0.9997 ± 0.02 a
T20.9812 ± 0.27 a0.9996 ± 0.06 a
T30.9789 ± 0.07 b0.9997 ± 0.04 a
T40.9787 ± 0.05 b0.9997 ± 0.05 a
Table 4. The impact of biochar on soil microbial biomass carbon (MBC), microbial biomass nitrogen (MBN), total organic carbon (TOC), and total nitrogen (TN). Different letters in the same column indicate significant differences between treatments (p < 0.05).
TreatmentMBC
(mg kg−1)
MBN
(mg kg−1)
TOC
(g kg−1)
TN
(g kg−1)
MBC/TOCMBN/TN
T0236.15 ± 28.4 d10.36 ± 1.5 d8.27 ± 2.8 c0.74 ± 0.31 c28.56 ± 6.7 b14.00 ± 2.4 c
T1277.51 ± 79.5 c12.48 ± 4.8 c10.15 ± 4.1 b0.86 ± 0.15 b27.34 ± 5.2 c14.51 ± 5.2 c
T2315.63 ± 73.6 b14.52 ± 6.9 a10.79 ± 3.5 b0.83 ± 0.24 b29.25 ± 2.8 a17.49 ± 1.9 a
T3332.74 ± 35.9 a14.78 ± 7.3 a11.34 ± 1.4 a0.92 ± 0.33 a29.34 ± 3.7 a16.07 ± 3.6 b
T4327.52 ± 44.8 a13.69 ± 2.5 b11.17 ± 2.7 ab0.87 ± 0.18 b29.32 ± 5.2 a15.74 ± 1.7 b
Publisher’s Note: MDPI stays neutral with regard to jurisdictional claims in published maps and institutional affiliations.

