
Exploring the Dynamics of Holo-Shikimate Kinase through Molecular Mechanics

High Performance Computing Center North (HPC2N), Umeå University, S-90187 Umeå, Sweden
Biophysica 2023, 3(3), 463-475; https://doi.org/10.3390/biophysica3030030
Submission received: 12 June 2023
/
Revised: 30 June 2023
/
Accepted: 18 July 2023
/
Published: 21 July 2023
(This article belongs to the Collection Feature Papers in Biophysics)
Abstract
:Understanding the connection between local and global dynamics can provide valuable insights into enzymatic function and may contribute to the development of novel strategies for enzyme modulation. In this work, we investigated the dynamics at both the global and local (active site) levels of Shikimate Kinase (SK) through microsecond time-scale molecular dynamics (MD) simulations of the holoenzyme in the product state. Our focus was on the wild-type (WT) enzyme and two mutants (R116A and R116K) which are known for their reduced catalytic activity. Through exploring the dynamics of these variants, we gained insights into the role of residue R116 and its contribution to overall SK dynamics. We argue that the connection between local and global dynamics can be attributed to local frustration near the mutated residue which perturbs the global protein dynamics.
1. Introduction
Shikimate-3-phosphate (S3P) is a vital compound involved in the metabolism of pathogenic microorganisms which cause diseases such as tuberculosis and gastric ulcers [1,2,3,4]. Its production relies on the following chemical reaction, which is driven by the Shikimate Kinase (SK) enzyme:
Here, the terminal phosphoryl group of ATP is shuttled to shikimic acid (SKM) in the presence of one Mg2+ ion to produce ADP and S3P. Given the significant role of SK in the functioning of these microorganisms, it represents a promising target for the development of new drugs to inactivate them [1]. To achieve this long-term goal, one needs a comprehensive picture of the entire energy landscape of this enzyme [5,6], more specifically, studies of the enzyme in the absence of substrates (apoenzyme) and in the presence of them (holoenzyme) are required.
However, unlike other kinases such as Adenylate Kinase (AdK) (see, for instance, Refs. [7,8,9,10,11,12,13,14,15,16]) a comprehensive understanding of the energy landscape of SK, with both computational and experimental studies, is currently lacking. Previously, the region of the landscape corresponding to the catalytic reaction in SK was scrutinised [17,18] as well as the region corresponding to the apoenzyme together with relevant mutants [19]. We argue that besides clarifying the performance of SK, a deeper understanding of this enzyme can help to potentially generalise the extensive knowledge already available for other enzymes including AdK.
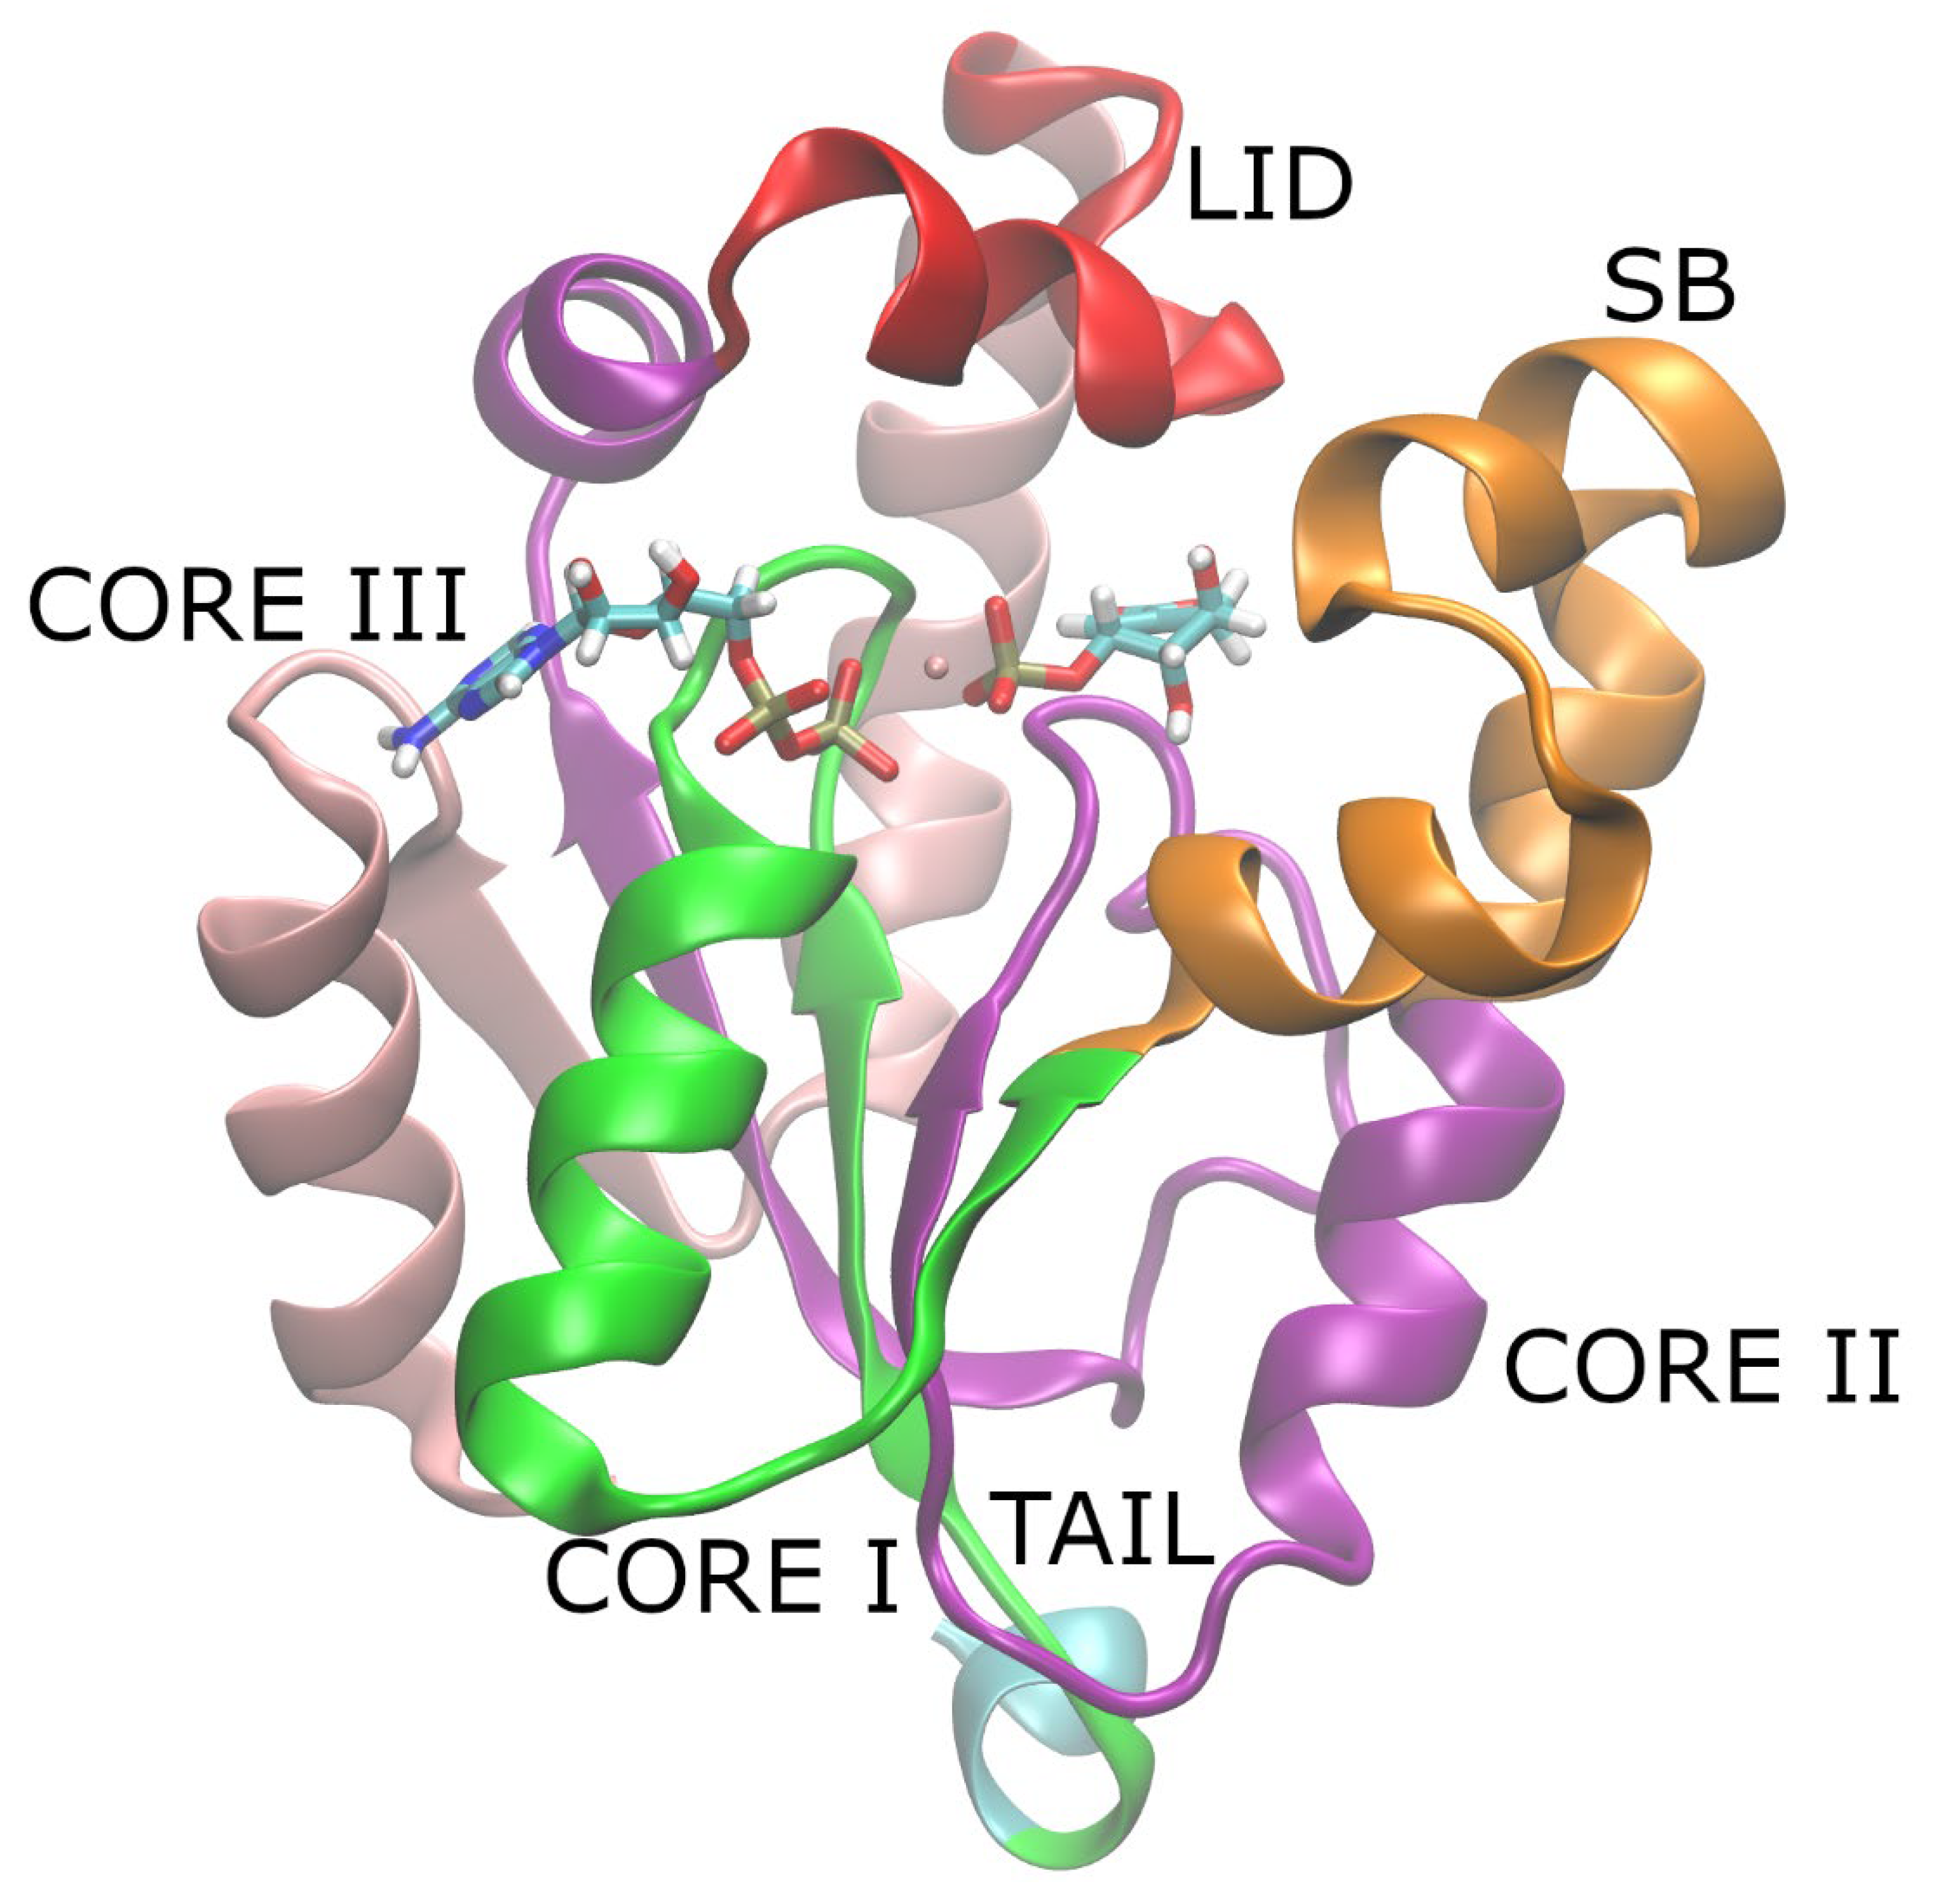
SK has two flexible regions called LID (residues 109–123) and SBD (residues 32–60) domains which exhibited opening and closing motions in the apoenzyme in a previous study [19], and they were also observed in the holoenzyme based on experimental structural data and molecular dynamics (MD) simulations in the ns time-scale [1,20,21]. The connectors of these two domains are the three regions of the stiffer CORE domain, namely the CORE I (residues 1–31), CORE II (residues 61–108), and CORE III (residue 124–162) regions. These domains together with the substrates, the Mg2+ ion, and the flexible tail of the enzyme can be seen in Figure 1.
In our previous work where we studied the dynamics of SK in the absence of substrates, we observed that mutations at the level of residue 116 (Arg) perturbed the overall dynamics of the enzyme [19]. Understanding how these perturbations are produced and their effects in catalysis is important not only for SK but for any other enzyme as protein dynamics is intimately linked to function [22]. For instance, as it is mentioned in this reference, it is known that currently one cannot predict enzyme functions based purely on static data of experimentally resolved structures.
Enzyme dynamics, both local (at the active site level) and global, play a critical role in facilitating enzymatic reactions and in determining the overall catalytic performance. Mutational studies provide a powerful tool to investigate the functional significance of specific residues within an enzyme. In this study, we focus on the Arg116 residue in SK due to its reported impact on catalytic efficiency upon mutation to either Ala or Lys [23]. In addition to this, it has been suggested that this residue is involved in expelling products from the active site [1]. Through comparing the dynamical behaviour of the WT enzyme with the Arg116 mutants, we aim to shed light on the underlying molecular mechanisms that contribute to the observed decrease in catalytic performance.
Here, we aim to expand the current understanding of Shikimate Kinase (SK) through conducting microsecond time-scale molecular dynamics (MD) simulations of the holoenzyme in the product state. We focus on three variants of the enzyme: the wild-type (WT) enzyme and two mutants (R116A and R116K) with significantly reduced catalytic activity.
In this work, the connection between local and global dynamics of the SK enzyme, is facilitated by using the concept of frustration [24]. Frustration arises from the observation that certain interactions in complex systems are not readily satisfied. It reflects the inherent challenge of achieving simultaneous optimization of multiple competing factors or constraints. In the context of enzymes’ functioning, it has been found that catalytic sites are usually highly frustrated [25]. In addition to this, frustration of the substrate–product interactions plays a crucial role in modulating the overall behaviour of the system and influencing functional outcomes such as the facilitation of the rate-determining step [14,16].
2. Materials and Methods
2.1. Simulation Setup
The crystallographic structure of Helicobacter pylori SK was used in our simulations (PDB ID: 3MUF, at 2.3 Å resolution) [23], which was also used in previous studies [17,18,19,26]. An initial set of coordinates for the protein chain, substrates (with phosphoryl groups fully deprotonated at the product state), ions, and water molecules was obtained from the CHARMM-GUI [27] online server. The Mg2+ ion was added manually. Force field parameters for atoms were obtained from the CHARMM-36 force field [28,29,30]. In the present simulations, the missing tail of the protein was included. All molecular components were assembled with the CHARMM (v. 45b1) built-in tools [31]. As in our previous study for the apoenzyme, we considered three variants of the SK, i.e., the wild type (WT) and the mutants R116A and R116K. The protein chains and substrates were padded with a 20 Å buffer, which included TIP3P waters [32] as well as Na+ and Cl− ions (at 150 mM concentration), producing a cubic-shaped box.
An initial minimization procedure consisting of 50,000 steps was performed with the NAMD package (v. 2.14) [33] using harmonic constraints with a force constant of 1 kcal/(mol Å2) applied on the heavy atoms of the protein, the substrates and the Mg2+ ion. This procedure was followed by an equilibration phase in the NVT ensemble, keeping the harmonic constraints active, with the Langevin method at 303.15 K and using a time step of 2 fs. Then, the constraints were removed and a 600 ns simulation in the NPT ensemble was conducted using the Langevin piston thermostat [34] with a piston period of 50 fs, a piston decay of 25 fs, and a target pressure of 1 bar.
The final set of coordinates together with the NAMD force field parameters and topology files were converted to the equivalent GROMACS input files with the assistance of the ParmEd tool [35]. Similar values for the parameters of the particle mesh Ewald (PME) method [36,37], the van der Waals and LINCS algorithm [38,39] were used as in our previous study [19] with the GROMACS simulation package (v. 2021) [40,41,42,43,44,45,46]. The production runs were carried out in the NPT ensemble during ~4 μs for each variant, using a 2 fs time step. The Parrinello–Rahman method [47] regulated the pressure with a coupling constant and compressibility of 5 ps and 4.51 × 10⁻⁵ bar−1, respectively, at atmospheric pressure. As for the temperature, it was regulated with the Nosé-Hoover thermostat.
2.2. Analysis
For the root mean square deviation (RMSD), root mean square fluctuation (RMSF), and the principal component analysis [48] (PCA), C, O, N, and Cα atoms were considered. To obtain better statistics, three independent MD trajectories were employed for the calculation of the average RMSD values and standard deviation bars. The RMSD and RMSF values were computed with the VMD [49] built-in tools. The PCA was performed with the built-in tools of GROMACS. Trajectory frames were saved at intervals of 5000 steps. The first five residues of the protein chain, which displayed high fluctuations, were not considered in the analysis.
Regarding the Neural Relational Inference analysis [50,51], the model was trained during 600 epochs, achieving a mean square error (MSE) in the testing set of 0.068, 0.062, and 0.057 for the WT, R116A, and R116K cases, respectively. A default number of time steps per sample (50) was used.
The frustration analysis was performed with the standalone version of the FrustratometeR package [52,53] where the configurational model was selected with an electrostatic constant of 4.15. Also, a 5 Å cut-off was used for computations of interactions around the selected residue number 116. Here, frames saved every 0.002 μs were employed.
3. Results and Discussion
The global dynamics of SK was monitored through the RMSD, RMSF, PC, and NRI analysis while the local dynamics at the active site was investigated with the assistance of the frustration analysis. Our findings are summarised in the following sections: Section 3.1, Section 3.2, Section 3.3 and Section 3.4.
3.1. RMSD and RMSF Analysis
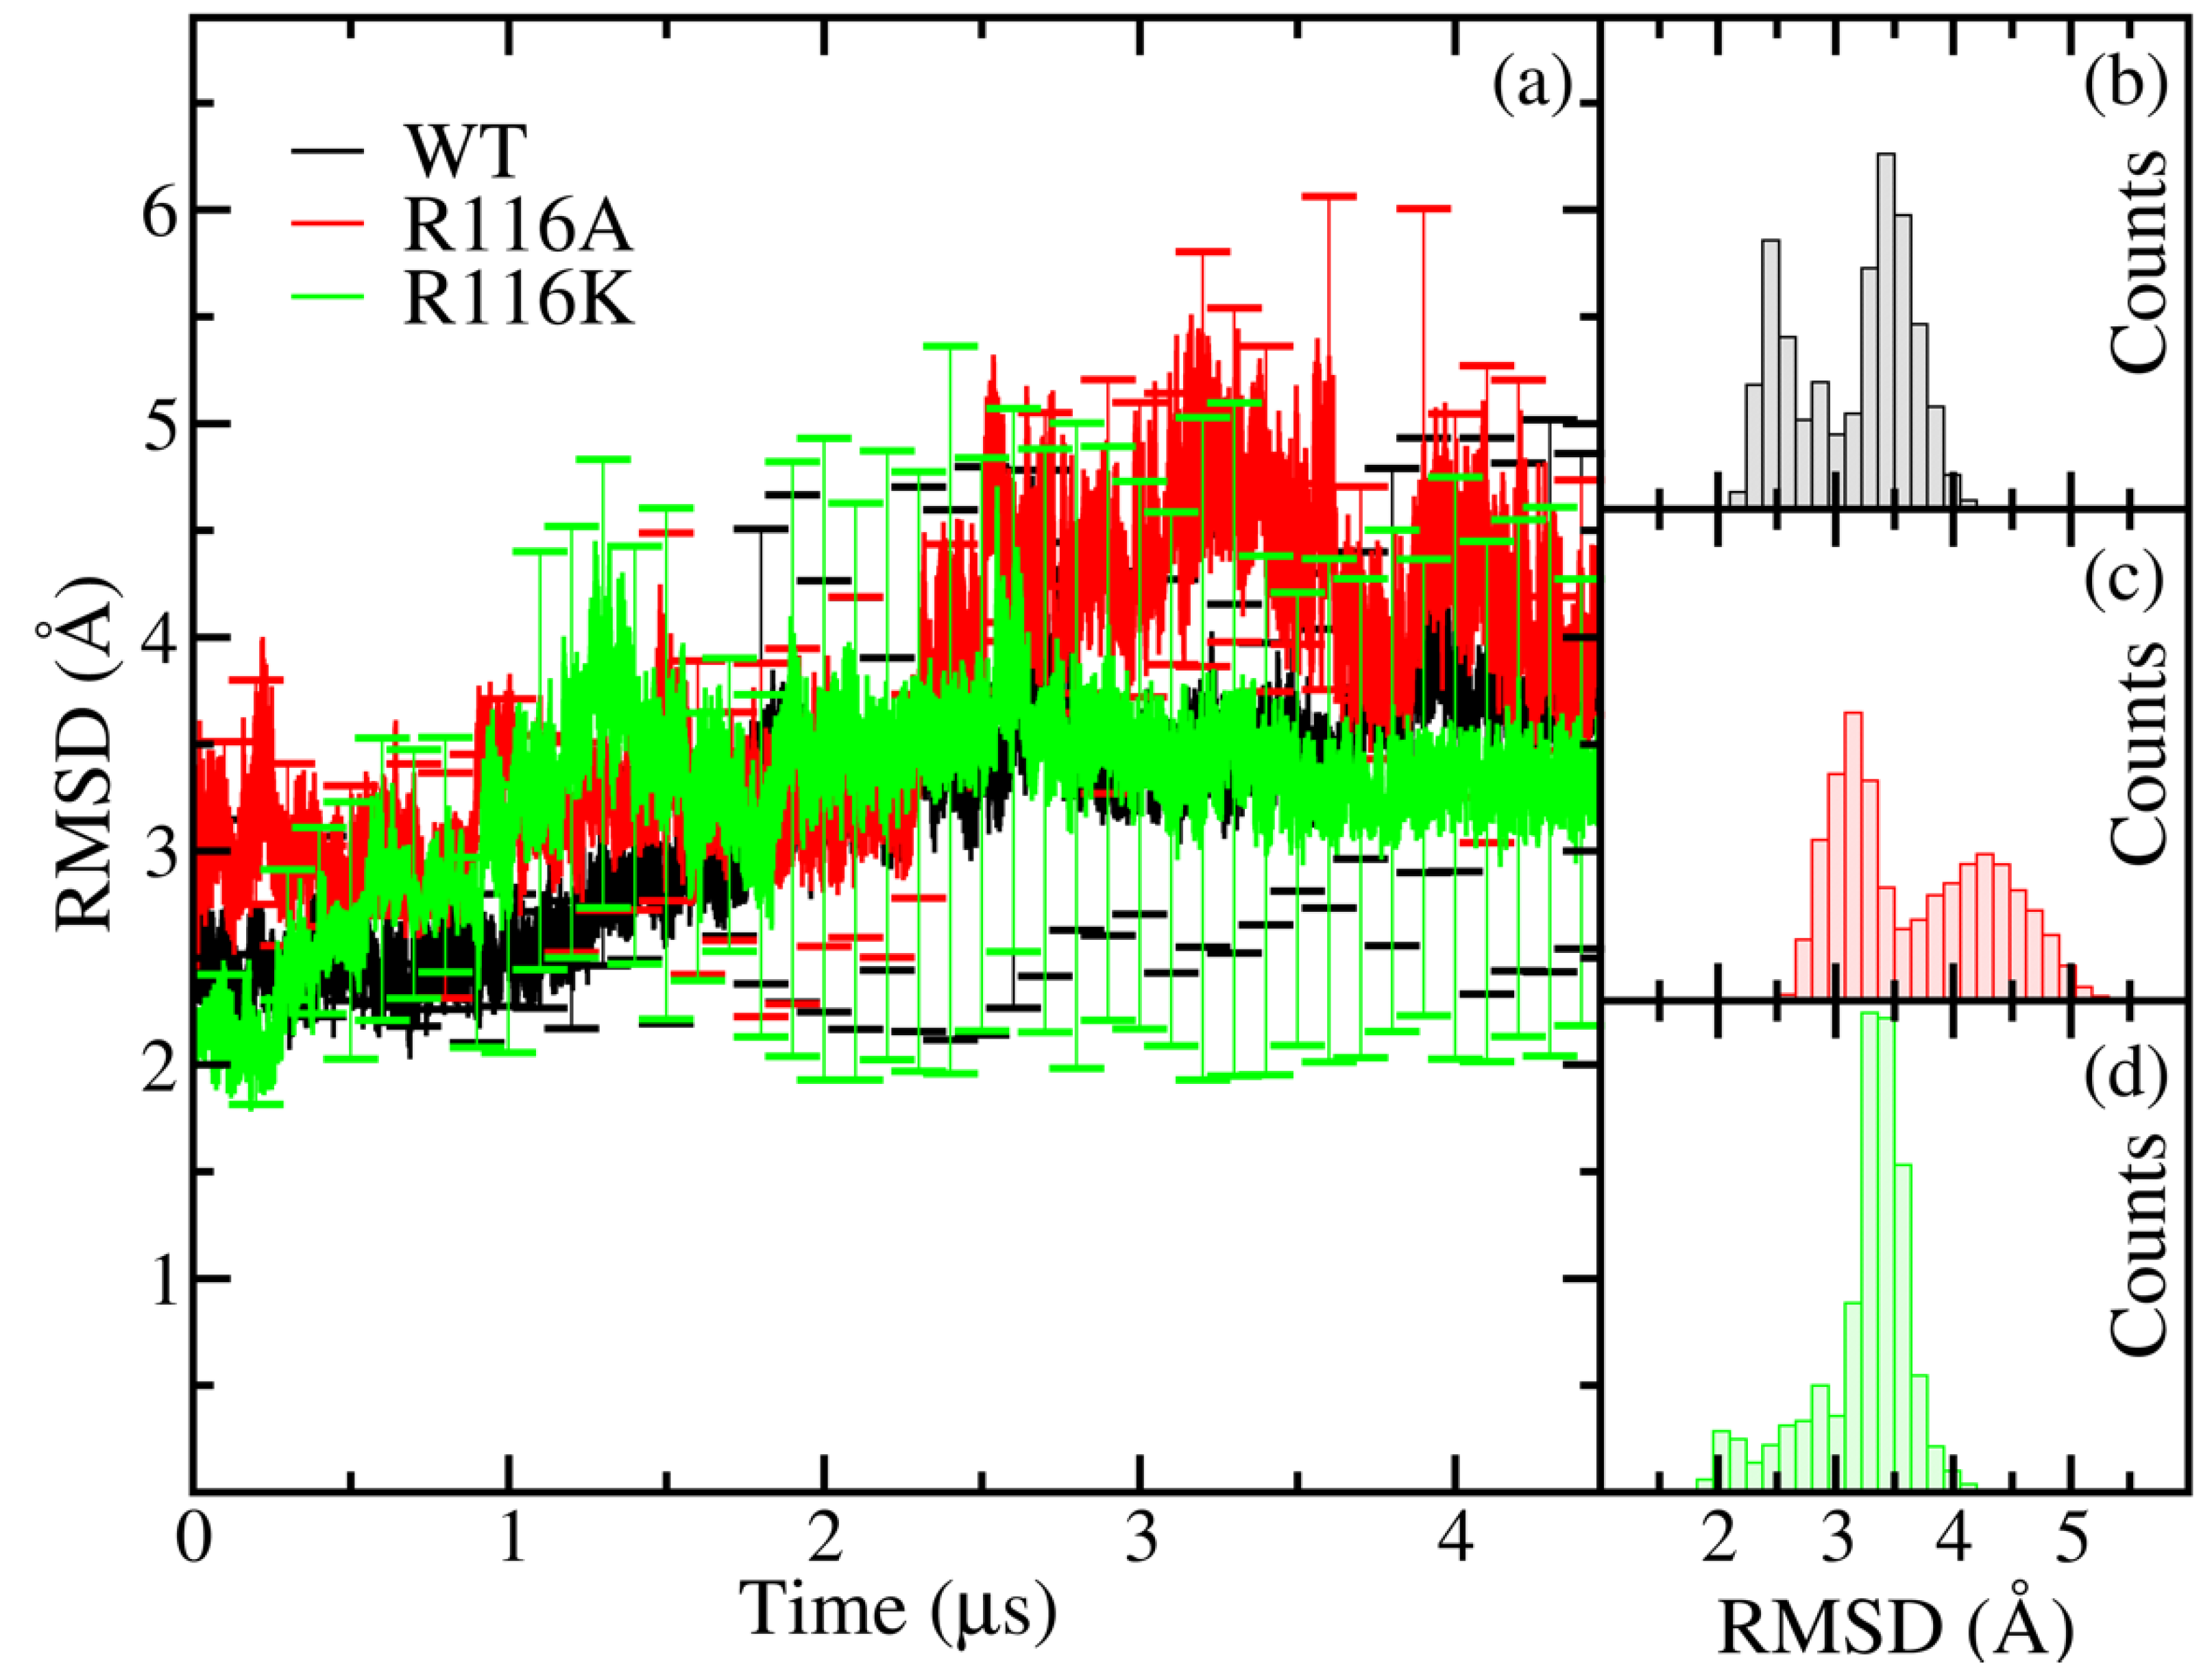
The average RMSD curve of the WT variant shows higher stability than that of the mutants R116A and R116K during the first 1 μs of the simulation (see Figure 2a). After that, the protein structures became more open, which can be associated with the product release step, but even in this case, the WT structure was more stable than those of the mutants, as revealed by the average RMSD values and standard deviation bars. The distribution of the RMSD values, displayed in Figure 2b, shows a bimodal behaviour for the WT variant. This behaviour, together with the standard deviation bars, tell us that the protein can explore different conformations between both open and closed states while it is bound to the substrates. In contrast to this, the WT apoenzyme exhibited a unimodal distribution skewed towards open states [19].
In the case of R116A, the distribution is also bimodal (see Figure 2c) but it is shifted towards higher values of the RMSD, suggesting a highly perturbed structure. Regarding R116K, the explored RMSD range is similar to that of the WT variant, but the distribution is unimodal; this can be seen in Figure 2d. The behaviour of the distributions in the mutant variants suggests that the dynamics of the WT holoenzyme is modified upon mutations, especially in the R116A variant.
We monitored the dynamics of the different regions for the protein structure of the three variants through the RMSF values in Figure 3. The largest RMSF values for the WT variant, in the present holo form, were observed in similar regions to a previous study for the apo structure, i.e., the LID, SBD, and the 310 feature in the CORE II domains [19], which acts as an energetic counterweight [8].
The R116A mutation destabilises the initial holo structure drastically. Regarding R116K variant, the fluctuations were of the same order of magnitude than those of the WT case. The main differences were in the fluctuations of the SB domain, which were quenched, but those in the LID domain increased for this mutant.
3.2. Principal Component Analysis (PCA)
A PCA was performed on the WT enzyme, revealing the presence of two distinct clusters along the PC1 axis in a relatively compact space region, representing the open and closed conformations which are separated by the dashed (orange) line in Figure 4a. In contrast, the mutant R116A displayed a broader range of conformational states, indicating destabilisation compared to the apoenzyme [19] (see Figure 4b). Conversely, the mutant R116K showed a reversed stabilising effect with respect to the apoenzyme structure (Figure 4c).
Figure 4d illustrates the contribution of each residue to the eigenvector with the highest variance. Notably, similar regions, including the SB, 310, and LID regions, made significant contributions in all three variants. However, in the mutants, the LID emerged as the major contributor, while in the WT, it was the region around the 310 helix. This region also encompasses the P-loop, which is responsible for maintaining the proper positioning of the β-phosphoryl group [21].
The projection of the WT case trajectory onto the first eigenvector in Figure 5 reveals the involvement of the SB and LID domains, which were the major players in the first principal component in the apoenzyme state, in the opening and closing motion. However, in the present case, additional key contributors to this principal component included the P-loop (GFMGSGKSS), the Walker B motif (VISTGG) [20], and the 310 helix (GIVMH). This suggests that these elements play significant roles in shaping the observed conformational changes and dynamics of the enzyme.
3.3. Neural Relational Inference Analysis (NRI)
Higher-order interaction networks were investigated using the Neural Relational Inference (NRI) analysis [50,51], which employs a graph neural network trained with an encoder-decoder architecture that learns the latent space of molecular dynamics (MD) trajectory data and captures long-range interactions. By using this analysis we obtained the distribution of learned edges between residues in the main regions which can be visualised in Figure 6a–c for the WT and the mutants R116A and R116K, respectively. In Figure 6d–f, the contributions from individual residues are aggregated into per-domain probabilities.
One can notice that in the case of the WT variant, in Figure 6a, the SB and LID domains exhibit the highest level of activity receiving contributions from all other domains. The CORE III domain also displays interactions from other domains to a lesser extent. This observation is further supported by the domain interaction map shown in Figure 6d for the WT case. A more pictorial representation of these results is achieved through directed graphs in Figure S1, where the connection patterns among the protein regions are shown.
In the R116A mutant, the interactions with the SB domain are weakened, whereas the interactions with the LID domain are strengthened, as depicted in Figure 6b,e. The corresponding directed graph for this mutant can be seen in Figure S1b. Regarding the R116K mutant, the interdomain interactions of both the SB and LID domains are mostly weakened, and the CORE III domain emerges as the most interactive domain. Notably, the interdomain interaction between CORE III and SB domains, observed in the WT case, is also present in the R116K mutant, as illustrated in Figure 6c,f and also Figure S1c.
3.4. Frustration Analysis
As we have already seen, both the apo and holoenzymes undergo alterations in their dynamics compared to the WT enzyme upon mutations. This phenomenon can be attributed to significant changes occurring in the local environment surrounding the mutated residue. To investigate the local environment of R116, we performed local frustration analysis. Frustration is a concept that arises when certain interactions in the protein interfere with one another, leading to conflicts [54]. In this way, a local minimally frustrated structure indicates a state where most of the local interactions are well-satisfied, while a highly frustrated structure indicates a state where most of the local interactions are in conflict. Between these extremes lies a neutrally frustrated structure, which represents an intermediate state. In more physical terms, minimally frustrated regions exhibit well-defined structures while highly frustrated regions tend to be more flexible [55].
Our analysis revealed a notable degree of minimal frustration within the local environment of R116 for the WT case, this can be seen in Figure 7a. This feature is more relevant in the time range below 1 μs (indicated by the vertical dashed line), during which the substrates maintain a well-positioned orientation in the binding pocket. However, beyond this timeframe, the local environment exhibits increased flexibility. Conversely, R116A exhibits a substantial degree of frustration within its local environment as shown in Figure 7b. Remarkably, even though the structure of R116K fluctuates in a manner similar to the WT case, as indicated by the RMSF results in Figure 3, its local environment exhibits a higher degree of frustration than in the WT case (see Figure 7c). Thus, we argue that a locally frustrated region, in the mutants’ case, results in different local dynamical motions that disrupt the coordination of the global dynamical motions of the WT protein structure (Figure S1). These findings emphasise the influential role played by the local environment in governing the global dynamics of the enzyme and suggest that the evolutionary process has finely tuned the local environment of SK to optimise its functionality. Also, because disruption of interaction networks upon mutations has been observed in other enzymes, such as AdK [15], we argue that local frustration can be a general phenomenon in enzymes.
The different local and global dynamics of the mutants can induce different “chewing” motions on the substrates (including reactant, transition, and product states) than in the WT case, which can in turn contribute to their reduced catalytic activity. For instance, in the present study, we found that SK opens faster in the mutants than in the WT, which affects the product release step. Remarkably, a faster opening event upon mutations was recently observed in AdK [15]. In addition to this, the “chewing” motions in the mutants can create non-optimal orientations for residues during catalysis.
4. Conclusions
Our analysis of the RMSD curves and RMSF profiles revealed distinct dynamics and structural differences between the wild-type (WT) Shikimate Kinase (SK) variant and the R116A and R116K mutants. The WT variant exhibited higher stability throughout the whole simulation compared to the mutants. The distribution of RMSD values indicated a bimodal behaviour in the WT variant, suggesting transitions between open and closed states. In the case of the R116A mutant, the bimodal distribution was shifted towards higher RMSD values. As for the R116K mutant, the distribution was unimodal and skewed towards open states. These findings indicate that the dynamics of the WT holoenzyme are modified when site mutations are introduced, particularly in the R116A variant.
Furthermore, our principal component analysis (PCA) revealed clusters corresponding to open and closed conformations in the WT enzyme in a narrow conformational space, while the mutants displayed broader conformational spaces. The analysis of the per-residue contributions to the largest variance eigenvector showed that similar regions are involved in the dynamics of all variants, including the SB, 310, and LID regions. However, the major contributions differed, with the mutants primarily influenced by the LID region and the WT variant influenced by the region around the 310 helix, including the P-loop.
Additionally, our study employed NRI analysis to investigate higher-order interaction networks. The WT variant demonstrated extensive interactions, with the SB and LID domains being the most active and receiving contributions from other domains. In contrast, the R116A mutation weakened SB interactions while strengthening LID interactions. The R116K mutation disrupted interdomain interactions, with the CORE III domain becoming the most interactive region.
Lastly, our analysis of the local environment around residue R116 using frustration analysis revealed that the WT variant exhibited a high degree of minimal frustration, indicating well-satisfied local interactions optimised via evolution. In contrast, the R116A and R116K variants displayed high levels of frustration, suggesting conflicts among local interactions. We argue that these local conflicts, in the mutants’ case, disrupt crucial contacts around the mutational site (located at the LID domain), resulting in different local dynamics, and that this, in turn, causes the difference in the global enzyme dynamics with respect to the WT case. This highlights the significant role of the local environment in modulating enzyme dynamics and further emphasises the importance of considering both local and global factors in understanding enzymatic behaviour.
In conclusion, our analysis of the dynamics and interactions in the WT and mutant variants of SK provides insights into the structural and functional consequences of specific mutations. These findings contribute to a deeper understanding of the interplay between residue dynamics, conformational transitions, and higher-order interactions in SK. We found that the choreography of these interactions is disrupted for the mutants considered in this study. The knowledge gained from it can facilitate the design of novel strategies for modulating enzyme activity and guide future investigations aimed at optimising enzymatic performance for various applications. For instance, our study suggests that one needs to consider the dynamics of the enzyme as a major player in enzyme tuning and design.
Supplementary Materials
The following supporting information can be downloaded at: https://www.mdpi.com/article/10.3390/biophysica3030030/s1, Figure S1: Directed graphs obtained from a 0.6 probability threshold with the Neural Relational Inference (NRI) method for the WT, R116A, and R116K variants in (a–c), respectively.
Funding
This research received no external funding.
Acknowledgments
This research was conducted using the resources of High Performance Computing Center North (HPC2N). NAMD was developed by the Theoretical and Computational Biophysics Group in the Beckman Institute for Advanced Science and Technology at the University of Illinois at Urbana-Champaign (http://www.ks.uiuc.edu/Research/namd/, accessed date 1 January 2021).
Conflicts of Interest
The authors declare no conflict of interest.
References
- Blanco, B.; Prado, V.; Lence, E.; Otero, J.M.; Garcia-Doval, C.; van Raaij, M.J.; Llamas-Saiz, A.L.; Lamb, H.; Hawkins, A.R.; González-Bello, C. Mycobacterium tuberculosis Shikimate Kinase Inhibitors: Design and Simulation Studies of the Catalytic Turnover. J. Am. Chem. Soc. 2013, 135, 12366–12376. [Google Scholar] [CrossRef] [PubMed]
- Coracini, J.D.; de Azevedo, W.F. Shikimate Kinase, a Protein Target for Drug Design. Curr. Med. Chem. 2014, 21, 592–604. [Google Scholar] [CrossRef] [PubMed]
- Grillo, I.B.; Bachega, J.F.R.; Timmers, L.F.S.M.; Caceres, R.A.; de Souza, O.N.; Field, M.J.; Rocha, G.B. Theoretical Characterization of the Shikimate 5-Dehydrogenase Reaction from Mycobacterium tuberculosis by Hybrid QC/MM Simulations and Quantum Chemical Descriptors. J. Mol. Model. 2020, 26, 297. [Google Scholar] [CrossRef] [PubMed]
- Nunes, J.E.S.; Duque, M.A.; de Freitas, T.F.; Galina, L.; Timmers, L.F.S.M.; Bizarro, C.V.; Machado, P.; Basso, L.A.; Ducati, R.G. Mycobacterium tuberculosis Shikimate Pathway Enzymes as Targets for the Rational Design of Anti-Tuberculosis Drugs. Molecules 2020, 25, 1259. [Google Scholar] [CrossRef] [Green Version]
- Villali, J.; Kern, D. Choreographing an Enzyme’s Dance. Curr. Opin. Chem. Biol. 2010, 14, 636–643. [Google Scholar] [CrossRef] [Green Version]
- Kern, D. From Structure to Mechanism: Skiing the Energy Landscape. Nat. Methods 2021, 18, 435–436. [Google Scholar] [CrossRef]
- Wolf-Watz, M.; Thai, V.; Henzler-Wildman, K.; Hadjipavlou, G.; Eisenmesser, E.Z.; Kern, D. Linkage between Dynamics and Catalysis in a Thermophilic-Mesophilic Enzyme Pair. Nat. Struct. Mol. Biol. 2004, 11, 945–949. [Google Scholar] [CrossRef]
- Bae, E.; Phillips, G.N. Roles of Static and Dynamic Domains in Stability and Catalysis of Adenylate Kinase. Proc. Natl. Acad. Sci. USA 2006, 103, 2132–2137. [Google Scholar] [CrossRef]
- Henzler-Wildman, K.A.; Lei, M.; Thai, V.; Kerns, S.J.; Karplus, M.; Kern, D. A Hierarchy of Timescales in Protein Dynamics Is Linked to Enzyme Catalysis. Nature 2007, 450, 913–916. [Google Scholar] [CrossRef]
- Hanson, J.A.; Duderstadt, K.; Watkins, L.P.; Bhattacharyya, S.; Brokaw, J.; Chu, J.-W.; Yang, H. Illuminating the Mechanistic Roles of Enzyme Conformational Dynamics. Proc. Natl. Acad. Sci. USA 2007, 104, 18055–18060. [Google Scholar] [CrossRef]
- Henzler-Wildman, K.A.; Thai, V.; Lei, M.; Ott, M.; Wolf-Watz, M.; Fenn, T.; Pozharski, E.; Wilson, M.A.; Petsko, G.A.; Karplus, M.; et al. Intrinsic Motions along an Enzymatic Reaction Trajectory. Nature 2007, 450, 838–844. [Google Scholar] [CrossRef] [PubMed]
- Agafonov, R.; Kerns, J.; Phung, L.; Kern, D. Energy Landscape of Adenylate Kinase: Phosphoryl Transfer and Conformational Transitions. Biophys. J. 2011, 100, 17A–18A. [Google Scholar] [CrossRef] [Green Version]
- Kerns, S.J.; Agafonov, R.V.; Cho, Y.-J.; Pontiggia, F.; Otten, R.; Pachov, D.V.; Kutter, S.; Phung, L.A.; Murphy, P.N.; Thai, V.; et al. The Energy Landscape of Adenylate Kinase during Catalysis. Nat. Struct. Mol. Biol. 2015, 22, 124–131. [Google Scholar] [CrossRef] [PubMed]
- Kong, J.; Li, J.; Lu, J.; Li, W.; Wang, W. Role of Substrate-Product Frustration on Enzyme Functional Dynamics. Phys. Rev. E 2019, 100, 052409. [Google Scholar] [CrossRef] [PubMed]
- Dulko-Smith, B.; Ojeda-May, P.; Ådén, J.; Wolf-Watz, M.; Nam, K. Mechanistic Basis for a Connection between the Catalytic Step and Slow Opening Dynamics of Adenylate Kinase. J. Chem. Inf. Model. 2023, 63, 1556–1569. [Google Scholar] [CrossRef]
- Li, W.; Wang, J.; Zhang, J.; Takada, S.; Wang, W. Overcoming the Bottleneck of the Enzymatic Cycle by Steric Frustration. Phys. Rev. Lett. 2019, 122, 238102. [Google Scholar] [CrossRef]
- Yao, J.; Wang, X.; Luo, H.; Gu, P. Understanding the Catalytic Mechanism and the Nature of the Transition State of an Attractive Drug-Target Enzyme (Shikimate Kinase) by Quantum Mechanical/Molecular Mechanical (QM/MM) Studies. Chem. Eur. J. 2017, 23, 16380–16387. [Google Scholar] [CrossRef]
- Ojeda-May, P. Exploring the Mechanism of Shikimate Kinase through Quantum Mechanical and Molecular Mechanical (QM/MM) Methods. Biophysica 2021, 1, 334–343. [Google Scholar] [CrossRef]
- Ojeda-May, P. Exploring the Dynamics of Shikimate Kinase through Molecular Mechanics. Biophysica 2022, 2, 194–202. [Google Scholar] [CrossRef]
- Gu, Y.; Reshetnikova, L.; Li, Y.; Wu, Y.; Yan, H.; Singh, S.; Ji, X. Crystal Structure of Shikimate Kinase from Mycobacterium tuberculosis Reveals the Dynamic Role of the LID Domain in Catalysis. J. Mol. Biol. 2002, 319, 779–789. [Google Scholar] [CrossRef]
- Hartmann, M.D.; Bourenkov, G.P.; Oberschall, A.; Strizhov, N.; Bartunik, H.D. Mechanism of Phosphoryl Transfer Catalyzed by Shikimate Kinase from Mycobacterium tuberculosis. J. Mol. Biol. 2006, 364, 411–423. [Google Scholar] [CrossRef] [PubMed]
- Nam, K.; Wolf-Watz, M. Protein Dynamics: The Future Is Bright and Complicated! Struct. Dyn. 2023, 10, 014301. [Google Scholar] [CrossRef] [PubMed]
- Cheng, W.-C.; Chen, Y.-F.; Wang, H.-J.; Hsu, K.-C.; Lin, S.-C.; Chen, T.-J.; Yang, J.-M.; Wang, W.-C. Structures of Helicobacter pylori Shikimate Kinase Reveal a Selective Inhibitor-Induced-Fit Mechanism. PLoS ONE 2012, 7, e33481. [Google Scholar] [CrossRef] [PubMed] [Green Version]
- Ferreiro, D.U.; Komives, E.A.; Wolynes, P.G. Frustration in Biomolecules. Q. Rev. Biophys. 2014, 47, 285–363. [Google Scholar] [CrossRef] [PubMed] [Green Version]
- Freiberger, M.I.; Guzovsky, A.B.; Wolynes, P.G.; Parra, R.G.; Ferreiro, D.U. Local Frustration around Enzyme Active Sites. Proc. Natl. Acad. Sci. USA 2019, 116, 4037–4043. [Google Scholar] [CrossRef] [Green Version]
- Prado, V.; Lence, E.; Vallejo, J.A.; Beceiro, A.; Thompson, P.; Hawkins, A.R.; González-Bello, C. Study of the Phosphoryl-Transfer Mechanism of Shikimate Kinase by NMR Spectroscopy. Chem. Eur. J. 2016, 22, 2758–2768. [Google Scholar] [CrossRef]
- Jo, S.; Kim, T.; Iyer, V.G.; Im, W. CHARMM-GUI: A Web-Based Graphical User Interface for CHARMM. J. Comput. Chem. 2008, 29, 1859–1865. [Google Scholar] [CrossRef]
- Best, R.B.; Zhu, X.; Shim, J.; Lopes, P.E.M.; Mittal, J.; Feig, M.; MacKerell, A.D. Optimization of the Additive CHARMM All-Atom Protein Force Field Targeting Improved Sampling of the Backbone ϕ, ψ and Side-Chain Χ1 and Χ2 Dihedral Angles. J. Chem. Theory Comput. 2012, 8, 3257–3273. [Google Scholar] [CrossRef] [Green Version]
- Mackerell, A.D.; Feig, M.; Brooks, C.L. Extending the Treatment of Backbone Energetics in Protein Force Fields: Limitations of Gas-Phase Quantum Mechanics in Reproducing Protein Conformational Distributions in Molecular Dynamics Simulations. J. Comput. Chem. 2004, 25, 1400–1415. [Google Scholar] [CrossRef]
- Foloppe, N.; MacKerell, A.D., Jr. All-Atom Empirical Force Field for Nucleic Acids: I. Parameter Optimization Based on Small Molecule and Condensed Phase Macromolecular Target Data. J. Comput. Chem. 2000, 21, 86–104. [Google Scholar] [CrossRef]
- Brooks, B.R.; Brooks, C.L., III; MacKerell, A.D., Jr.; Nilsson, L.; Petrella, R.J.; Roux, B.; Won, Y.; Archontis, G.; Bartels, C.; Boresch, S.; et al. CHARMM: The Biomolecular Simulation Program. J. Comput. Chem. 2009, 30, 1545–1614. [Google Scholar] [CrossRef] [PubMed] [Green Version]
- Jorgensen, W.L.; Chandrasekhar, J.; Madura, J.D.; Impey, R.W.; Klein, M.L. Comparison of Simple Potential Functions for Simulating Liquid Water. J. Chem. Phys. 1983, 79, 926–935. [Google Scholar] [CrossRef]
- Phillips, J.C.; Hardy, D.J.; Maia, J.D.C.; Stone, J.E.; Ribeiro, J.V.; Bernardi, R.C.; Buch, R.; Fiorin, G.; Hénin, J.; Jiang, W.; et al. Scalable Molecular Dynamics on CPU and GPU Architectures with NAMD. J. Chem. Phys. 2020, 153, 044130. [Google Scholar] [CrossRef] [PubMed]
- Martyna, G.J.; Tobias, D.J.; Klein, M.L. Constant Pressure Molecular Dynamics Algorithms. J. Chem. Phys. 1994, 101, 4177–4189. [Google Scholar] [CrossRef] [Green Version]
- Shirts, M.R.; Klein, C.; Swails, J.M.; Yin, J.; Gilson, M.K.; Mobley, D.L.; Case, D.A.; Zhong, E.D. Lessons Learned from Comparing Molecular Dynamics Engines on the SAMPL5 Dataset. J. Comput. Aided Mol. Des. 2017, 31, 147–161. [Google Scholar] [CrossRef] [PubMed] [Green Version]
- Essmann, U.; Perera, L.; Berkowitz, M.L.; Darden, T.; Lee, H.; Pedersen, L.G. A Smooth Particle Mesh Ewald Method. J. Chem. Phys. 1995, 103, 8577–8593. [Google Scholar] [CrossRef] [Green Version]
- Darden, T.; York, D.; Pedersen, L. Particle Mesh Ewald: An N⋅log(N) Method for Ewald Sums in Large Systems. J. Chem. Phys. 1993, 98, 10089–10092. [Google Scholar] [CrossRef] [Green Version]
- Hess, B.; Bekker, H.; Berendsen, H.J.C.; Fraaije, J.G.E.M. LINCS: A Linear Constraint Solver for Molecular Simulations. J. Comput. Chem. 1997, 18, 1463–1472. [Google Scholar] [CrossRef]
- Hess, B. P-LINCS: A Parallel Linear Constraint Solver for Molecular Simulation. J. Chem. Theory Comput. 2008, 4, 116–122. [Google Scholar] [CrossRef]
- Hess, B.; Kutzner, C.; van der Spoel, D.; Lindahl, E. GROMACS 4: Algorithms for Highly Efficient, Load-Balanced, and Scalable Molecular Simulation. J. Chem. Theory Comput. 2008, 4, 435–447. [Google Scholar] [CrossRef] [Green Version]
- Pronk, S.; Páll, S.; Schulz, R.; Larsson, P.; Bjelkmar, P.; Apostolov, R.; Shirts, M.R.; Smith, J.C.; Kasson, P.M.; van der Spoel, D.; et al. GROMACS 4.5: A High-Throughput and Highly Parallel Open Source Molecular Simulation Toolkit. Bioinformatics 2013, 29, 845–854. [Google Scholar] [CrossRef] [PubMed] [Green Version]
- Abraham, M.J.; Murtola, T.; Schulz, R.; Páll, S.; Smith, J.C.; Hess, B.; Lindahl, E. GROMACS: High Performance Molecular Simulations through Multi-Level Parallelism from Laptops to Supercomputers. SoftwareX 2015, 1, 19–25. [Google Scholar] [CrossRef] [Green Version]
- Páll, S.; Abraham, M.J.; Kutzner, C.; Hess, B.; Lindahl, E. Tackling Exascale Software Challenges in Molecular Dynamics Simulations with GROMACS. In Solving Software Challenges for Exascale; Markidis, S., Laure, E., Eds.; Springer: Cham, Switzerland, 2014; pp. 3–27. [Google Scholar]
- Van Der Spoel, D.; Lindahl, E.; Hess, B.; Groenhof, G.; Mark, A.E.; Berendsen, H.J.C. GROMACS: Fast, Flexible, and Free. J. Comput. Chem. 2005, 26, 1701–1718. [Google Scholar] [CrossRef] [PubMed]
- Lindahl, E.; Hess, B.; van der Spoel, D. GROMACS 3.0: A Package for Molecular Simulation and Trajectory Analysis. Mol. Model. Annu. 2001, 7, 306–317. [Google Scholar] [CrossRef]
- Berendsen, H.J.C.; van der Spoel, D.; van Drunen, R. GROMACS: A Message-Passing Parallel Molecular Dynamics Implementation. Comput. Phys. Commun. 1995, 91, 43–56. [Google Scholar] [CrossRef]
- Nosé, S.; Klein, M.L. Constant Pressure Molecular Dynamics for Molecular Systems. Mol. Phys. 1983, 50, 1055–1076. [Google Scholar] [CrossRef]
- Pearson, K. LIII. On Lines and Planes of Closest Fit to Systems of Points in Space. Philos. Mag. Ser. 6 1901, 2, 559–572. [Google Scholar] [CrossRef] [Green Version]
- Humphrey, W.; Dalke, A.; Schulten, K. VMD: Visual Molecular Dynamics. J. Mol. Graph. 1996, 14, 33–38. [Google Scholar] [CrossRef]
- Kipf, T.; Fetaya, E.; Wang, K.-C.; Welling, M.; Zemel, R. Neural Relational Inference for Interacting Systems. In Proceedings of the 35th International Conference on Machine Learning, Stockholm, Sweden, 10–15 July 2018. [Google Scholar]
- Zhu, J.; Wang, J.; Han, W.; Xu, D. Neural Relational Inference to Learn Long-Range Allosteric Interactions in Proteins from Molecular Dynamics Simulations. Nat. Commun. 2022, 13, 1661. [Google Scholar] [CrossRef]
- Parra, R.G.; Schafer, N.P.; Radusky, L.G.; Tsai, M.-Y.; Guzovsky, A.B.; Wolynes, P.G.; Ferreiro, D.U. Protein Frustratometer 2: A Tool to Localize Energetic Frustration in Protein Molecules, Now with Electrostatics. Nucleic Acids Res. 2016, 44, W356–W360. [Google Scholar] [CrossRef]
- Rausch, A.O.; Freiberger, M.I.; Leonetti, C.O.; Luna, D.M.; Radusky, L.G.; Wolynes, P.G.; Ferreiro, D.U.; Parra, R.G. FrustratometeR: An R-Package to Compute Local Frustration in Protein Structures, Point Mutants and MD Simulations. Bioinformatics 2021, 37, 3038–3040. [Google Scholar] [CrossRef] [PubMed]
- Ferreiro, D.U.; Hegler, J.A.; Komives, E.A.; Wolynes, P.G. Localizing Frustration in Native Proteins and Protein Assemblies. Proc. Natl. Acad. Sci. USA 2007, 104, 19819–19824. [Google Scholar] [CrossRef] [PubMed]
- Stelzl, L.S.; Mavridou, D.A.; Saridakis, E.; Gonzalez, D.; Baldwin, A.J.; Ferguson, S.J.; Sansom, M.S.; Redfield, C. Local Frustration Determines Loop Opening during the Catalytic Cycle of an Oxidoreductase. eLife 2020, 9, e54661. [Google Scholar] [CrossRef] [PubMed]
Figure 1.
The domains of the Shikimate Kinase (SK) enzyme structure: the binding SB (in orange), the LID (in red), and the tail (in turquoise). The CORE domain is divided in the present work into three sections: CORE I (in green), CORE II (in purple), and CORE III (in pink). The substrates ADP, S3P, and Mg2+ ion are also depicted.

Figure 2.
(a) Average RMSD values for the WT variant and the mutants R116A and R116K. In (b–d) the histograms of counts for the average RMSD values are presented for the WT, R116A, and R116K variants, respectively.
Figure 2.
(a) Average RMSD values for the WT variant and the mutants R116A and R116K. In (b–d) the histograms of counts for the average RMSD values are presented for the WT, R116A, and R116K variants, respectively.

Figure 3.
RMSFs plots for the WT, R116A, and R116K variants. The structure of R116A is destabilised as reflected by the high RMSF values. In the case of R116K, the fluctuations were quenched in the SB domain but increased in the LID domain.
Figure 3.
RMSFs plots for the WT, R116A, and R116K variants. The structure of R116A is destabilised as reflected by the high RMSF values. In the case of R116K, the fluctuations were quenched in the SB domain but increased in the LID domain.

Figure 4.
Results of the principal component analysis: in (a–c), the MD trajectories were projected onto the first two eigenvectors for the WT, R11A, and R116K variants, respectively. The WT projected trajectory displayed two main clusters separated by the dotted orange line corresponding to the open and close conformations; see (a). The structure of R116A mutant is destabilised, as shown in (b). The R116K structure is stabilised with respect to the apoenzyme structure (c). In (d), the residues’ contributions to the first eigenvector are plotted for the three variants. Here, we see that the regions with the largest fluctuations are the LID region (in red), the SB region (in orange), and the region around the 310 helix, which is part of the CORE domain.

Figure 5.
Trajectory projected onto the first eigenvector showing the main contributing regions of the SK wild-type structure. In this holo form, other regions besides the LID and SB domains, already observed in the apo form, contribute to the first principal component, i.e., the Walker A motif (P-loop), the Walker B motif, and the 310 helix.

Figure 6.
Distribution of learned edges (a–c) for the WT, R11A, and R116K variants, respectively. In the WT case, the SB and LID domains were the most active regions, while in the R116A case, the LID domain displayed the highest level of interaction with other regions of the protein. Coordinated activity was considerably reduced in the R116K mutant (c). Aggregated contributions from residues into domain probabilities are illustrated in (d–f).

Figure 7.
Normalised density of interactions around a sphere of 5 Å of the selected residue number 116 for the three variants, i.e., the WT (a), R116A (b), and R116K (c). A dashed blue line is used to indicate the time range up to 1 μs where the substrates are well-positioned in the binding pocket of the three variants. We noticed that the WT variant exhibited mainly a minimally frustrated local environment during the whole simulation.

Disclaimer/Publisher’s Note: The statements, opinions and data contained in all publications are solely those of the individual author(s) and contributor(s) and not of MDPI and/or the editor(s). MDPI and/or the editor(s) disclaim responsibility for any injury to people or property resulting from any ideas, methods, instructions or products referred to in the content. |
© 2023 by the author. Licensee MDPI, Basel, Switzerland. This article is an open access article distributed under the terms and conditions of the Creative Commons Attribution (CC BY) license (https://creativecommons.org/licenses/by/4.0/).
Share and Cite
MDPI and ACS Style
Ojeda-May, P. Exploring the Dynamics of Holo-Shikimate Kinase through Molecular Mechanics. Biophysica 2023, 3, 463-475. https://doi.org/10.3390/biophysica3030030
AMA Style
Ojeda-May P. Exploring the Dynamics of Holo-Shikimate Kinase through Molecular Mechanics. Biophysica. 2023; 3(3):463-475. https://doi.org/10.3390/biophysica3030030
Chicago/Turabian StyleOjeda-May, Pedro. 2023. "Exploring the Dynamics of Holo-Shikimate Kinase through Molecular Mechanics" Biophysica 3, no. 3: 463-475. https://doi.org/10.3390/biophysica3030030