Article

Gated Ethidium- and Bleomycin-Loading in Phage T4 That Is Subsequently Purified Leak-Free

Department of Biochemistry and Structural Biology, The University of Texas Health Center at San Antonio, 7703 Floyd Curl Drive, San Antonio, TX 78229-3900, USA
*
Author to whom correspondence should be addressed.
Biophysica 2022, 2(4), 366-380; https://doi.org/10.3390/biophysica2040033
Submission received: 25 August 2022 / Revised: 17 October 2022 / Accepted: 19 October 2022 / Published: 26 October 2022

Abstract

:
Chemotherapy-inhibiting tumor cell evolution to drug-resistance is potentially suppressed by using a drug delivery vehicle (DDV) that has gating. Gating would be used to increase tumor-selectivity of delivery of DDV packaged drug. Tumor-selectivity increase would make possible increase in tumor-delivered drug dose, which would suppress opportunities to evolve drug resistance. Currently used DDVs do not have gating but gating is a natural feature of some bacteriophages (phages). Phage T4, which has recently been found highly persistent in murine blood, is a potential gated DDV. Thus, here, we proceed towards a T4-DDV by developing (1) improved procedure for generating high concentrations and amounts of phage T4, (2) elevated temperature-driven gate-opening and ethidium- and bleomycin-loading, and (3) purification of loaded T4 by rate zonal centrifugation. We test for loading by native agarose gel electrophoresis (AGE) with fluorescence detection. We observe loading in both phage T4 and T4 (tail-free) heads. The loaded particles have an openable, closed gate. Stored, mature T4 phages and phage heads do not release ethidium during at least a month at 4 °C and 6 days at 37 and 42 °C. Tumor-specific T4 phage delivery is projected via both the EPR effect and high T4 persistence.

1. Introduction

Metastatic cancer is responsible for ~90% of cancer deaths [1,2,3,4,5], ~10,000,000 per year worldwide [6], of which 606,520 per year occur in the United States [7] (year: 2020). The cause of treatment failures is usually evolution of cancerous cells to resistance to whatever therapy is being used. Resistance to chemotherapy can be generated via mutations in cellular components involved in either metabolism or removing foreign molecules from cells [8,9,10].
Whatever the source of drug resistance-generating tumor cell evolution, this evolution can be reduced or prevented by increasing the drug dose to tumors. An illustration of this principle is the evolution of phage T3 to resistance to the inhibition of its propagation by 0.9 M NaCl. No detectable resistant mutants (<1 in 1011) exist in a wild-type T3 preparation, even though similar preparations of a T3 amber mutant, for example, have revertants at the level of 1 in 105 to 1 in 106. On the other hand, when T3 mutants are selected by gradual, stepwise increase in NaCl concentration, one does eventually obtain T3 mutants that propagate in 0.9 M NaCl [11]. The objective is to suppress stepwise evolution of the cells of tumors.
However, the tumor-delivered amount of an anti-cancer drug is limited by drug-toxicity to healthy cells. One therapeutic response has been to encapsulate drugs in a drug delivery vehicle (DDV), which is typically a liposome, but can also be either a virus, bacterial cell or a non-biological particle [12,13,14,15,16,17]. However, previous DDVs were not gated. Thus, either drug association with the DDV was tight, usually covalent, or the DDV leaked drug when in blood [12,13,14,15,16,17], which generates toxicity. Liposomal DDVs are the primary FDA-approved DDVs [14]. However, drug leakage from liposomal DDVs has compromised their effectiveness [14,15].
Phages are viruses that infect bacteria and have no history of causing any human ailment, even when therapeutically injected into people [18,19]. They enter human cells but do not replicate there [20,21]. Mature particles of any given phage are mostly uniform in both size and structure. Capsids of the related phages, T3 and T7, have been found to be gated. The evidence points to the gate location being at a portal ring through which DNA enters the capsid during assembly and exits the capsid during infection of a host cell of Escherichia coli [22].
The following characteristics of either phages or their capsids would assist development as gated DDVs: (1) persistence in blood of 3–6 h at least, (2) possession of a gate that can be opened for drug loading outside of a patient and, then, closed during DDV storage, administration to a patient and circulation in blood, (3) preferential migration to tumors and (4) drug release either via intra-tumor DDV disruption or opening of a DDV gate. Additional properties needed are (5) inexpensive, simple preparation of DDV in large amount and (6) inexpensive, simple purification of drug loaded DDV in large amount.
In the current study, we develop characteristics (2), (5) and (6) for phage T4. Phage T4 is already known to have characteristic (1), the high persistence needed [23]. We discuss future access to characteristics (3) and (4) via paths suggested by current data.

2. Materials and Methods

2.1. Phage T4 Propagation and Initial Purification for Preparative Fractionation

Phage T4 [24] was obtained from Dr. W. B. Wood. When propagated for preparative open-gate loading, phage T4 was propagated in Petri plates. Relatively large Petri plates, 15 cm in inner diameter, were sometimes used. Each Petri plate had a 1.0 % lower layer gel of agar (Fischer Chemical, Pittsburgh, PA, USA) with the following media components per liter of water: 10 g Tryptone (Fisher Chemical, Pittsburgh, PA, USA), 5 g NaCl. Both phage and host were poured over the lower layer in the following solution kept molten at 50 °C before pouring: 0.12% Seakem Gold agarose (Lonza, Rockland, ME, USA) in 2xLB medium: 20 g/liter tryptone, 5 g/liter NaCl, 10 g/liter Bacto yeast extract (BD Biosciences, Haryana, IN, USA), all dissolved by autoclaving. The host, Escherichia coli BB/1, was added in 1 (~20 μL) drop for each 1.0 mL of molten agarose solution. The drops of host were in 2xLB medium, the host cells having been propagated in aerated 2x LB medium to 4.0 × 10⁸ cells per ml (log phase). Just before pouring the top layer (12 mL per 15 cm-diameter Petri plate) over the bottom layer, 100 μL of phage T4 (106 plaque forming units [PFU] per mL) was added per 12 mL of molten agarose solution and mixed. The molten mixture was allowed to gel at room temperature.
After inoculating Petri plates, phages were propagated by incubating the Petri plates at 30 °C for 16–19 h. Petri plates had not completely cleared at the end of the incubation. The top agarose layer was then removed, the agarose was broken into pieces with a spatula and the entire mixture was vortexed to help release phages. Chloroform was not used. Agarose and relatively large host fragments were pelleted by centrifugation at 10,000 rpm for 10 min at 4 °C in a Beckman 16.250 rotor (Indianapolis, IN, USA) (15,000× g maximum). After twice washing the pellet and adding the washes to the preparation, the phages and related particles were pelleted by centrifugation at 14,000 rpm, for 160 min at 4 °C in a Beckman 16.250 rotor (29,400× g maximum). The following buffer (0.2 P-M) was placed over the pellet for 16–20 h (often overnight): 0.2 M NaCl, 0.01 M sodium phosphate, pH 7.4, 0.001 M MgCl2. Resuspension of the phages was completed by repeated pipetting.

2.2. Phage T4 Preparation for Analytical Fractionation

Phage T4 for analytical (only) studies (i.e., Figure 6, below) was prepared as previously described [25]. The purification procedure ended with buoyant density centrifugation in a cesium chloride density gradient, followed by slow dialysis.

2.3. Fractionation by Rate Zonal Centrifugation in a Sucrose Gradient

The partially purified phages from Section 2.1 were subsequently further purified by rate zonal centrifugation in a sucrose gradient. This purification was sometimes performed for T4 phages that had been previously incubated with either ethidium or bleomycin. In the latter case, phages were separated from unloaded ethidium and bleomycin, as illustrated below.
To perform this fractionation, a linear, 11.5 mL, 10–35% linear sucrose gradient, in the following buffer, was poured in a centrifuge tube for the Beckman SW41 rotor: 0.01 M Tris-Cl, pH 7.4, 0.01 M MgSO4, 6% polyethylene glycol 3350. The polyethylene glycol stabilized phage particles. A 0.8 mL amount of the partially purified phage preparation was layered on the top of this gradient and, then, centrifuged at 25,000 rpm (77,005× g average), for 80 min, at 5 °C. The result was initially observed by illuminating the bottom of the centrifuge tube with visible, white, fluorescent light (Thermolyne LL-6515, Dubuque, IA, USA) and photographed. Fractions of the gradient were obtained by pipetting from the top. This fractionation procedure (1) avoided movement of the sucrose gradient during fractionation and, therefore, minimized the (viscosity-dependent, variable fluid movement-induced [26]) spreading of particles during fractionation, and (2) made possible collection of fractions in volumes that preserved the banding pattern observed visually, as in Figure 2, below. Fractions were stored in the dark at 4 °C.

2.4. Native Agarose Gel Electrophoresis

To obtain additional information about the contents of a sucrose gradient, each fraction was analyzed by native, horizontal, submerged agarose gel electrophoresis (AGE). The agarose gel was made of 0.4% Seakem LE agarose and was cast in and submerged beneath the following buffer (electrophoresis buffer): 0.09 M Tris-acetate, pH 8.4, 0.001 M MgCl2. A sample of a fraction of a sucrose gradient (5 μL in the case of Figure 2, below) was diluted to 30 μL in electrophoresis buffer with enough sucrose to add 5.8% sucrose to the final sucrose concentration. This mixture was layered in a sample well of the agarose gel.
After loading the sample wells of the gel, electrophoresis was performed at 1.0 V/cm, 25 ± 0.3 °C for the time indicated. Buffer was circulated, from one buffer tank to the other, through a temperature-controlled water bath, to prevent the formation of pH gradients and to help control temperature. The gel was then illuminated with a short wave ultraviolet transilluminator (Ultra-Violet Products Model TM-36) and photographed, without having been stained post-AGE. Thus, if a particle contained a fluorescent molecule, it would be visible, even though the gel was not stained post-AGE.
The molecules tested for loading are both fluorescent: ethidium, which undergoes fluorescence enhancement when bound to dsDNA [27] (emission filters used: Tiffen Orange 21; Tiffen Yellow 12, as indicated in the text), and bleomycin [28] (emission filter used: 11, Green 1). Ethidium is more sensitively detected. One of the limitations for in-gel detection of bleomycin is that the peak of bleomycin fluorescence emission is in the blue region [28], which is also the color of the dominant, background light scattering from an agarose gel. A green filter is used to detect bleomycin.
To determine the distribution of all nucleic acids after AGE, staining of an agarose gel was performed by adding a 1/250 dilution of GelStar (green peak fluorescence emission; Lonza) to the electrophoresis buffer and incubating for 2.0 h at room temperature. The GelStar-stained gel was observed while illuminated with ultraviolet radiation, as above. To increase the staining and expel packaged DNA, this initial GelStar staining was followed by incubation, for the time indicated and at room temperature, of the gel in the following solution: 0.002 M EDTA, pH 7.4 (see [29]). The expulsion of DNA increased the staining of DNA because of the loss of steric restrictions on DNA-bound stain, as previously demonstrated for ethidium in solution [30].
Gels previously stained, as described above, were sometimes subsequently stained for protein. The stain was Fast Coomassie blue.

2.5. Electron Microscopy

To further characterize band-forming particles in sucrose gradients, they were observed by electron microscopy. Negative staining with 1.5% uranyl acetate was used to prepare specimens. Details of the procedure have been previously described [31]. Negatively stained specimens were observed in a JEOL100CX electron microscope, operated at 80 kV, in the Department of Pathology at the University of Texas Health Center at San Antonio.

2.6. Loading of Ethidium and Bleomycin

Ethidium (purchased from Sigma-Aldrich, St. Louis, MO, USA) and bleomycin (purchased from Caymen Chemical, Ann Arbor, MI, USA) were loaded in phage T4 by incubation with the partially purified phage T4 preparation in Section 2.1. To this preparation was added 0.2 P-M buffer, a buffer that had previously been used in studies of the binding of dyes to packaged T4 DNA [25]. For loading of ethidium, 250 μg/mL ethidium bromide (final concentration) was also added. For loading of bleomycin, 10 mg/mL bleomycin (final concentration) was added. Loading was performed at the temperature indicated for 1.0 h, unless otherwise indicated.

3. Results

3.1. Production of Phage T4 and Initial T4 Purification

Phage T4 production was simplified by substituting in-gel propagation for the typical in-liquid culture propagation. The phage inoculation of the gel was at a level high enough to induce lysis that was extensive, but, as detected visually, was not completely confluent (plate stock; Figure 1). Then, phage T4 particles were partially purified by low- and high-speed centrifugation (Section 2.1). The preparation of partially purified particles included a mixture of T4 phage particles and T4 capsids. Incompletely packaged DNA (ipDNA) was present in some T4 capsids (ipDNA-capsids), as discussed below.
Preparations varied in the amount of phage produced. To obtain a total of 1013 plaque forming units (PFU), the total surface area of the Petri plates needed was usually 600–1400 cm2. This is equivalent to 6–15 medium-sized (110 mm inner diameter) Petri plates.

3.2. Ethidium Loading and Purification of Loaded Phage T4

To load ethidium in the partially purified phages (and phage related particles) from Section 2.1, these particles were incubated with 250 μg/mL ethidium at 54 °C for 1.0 h This procedure had been suggested by previous finding of ethidium binding to packaged T4 DNA at temperatures between 50 and 55 °C, but not lower [25].
To test for ethidium-loading and to purify whatever particles were ethidium-loaded, the loading mixture was subsequently fractionated by rate zonal centrifugation in a 10–35% linear sucrose gradient. When the centrifuge tube was subsequently illuminated from the bottom with visible, white light, the following were observed: (1) unloaded ethidium, seen as an orange band (E in Figure 2a) just below the meniscus (M in Figure 2a; B indicates the bottom of the centrifuge tube) of the sucrose gradient, and (2) two bands revealed by light scattering. The more intense of these two bands was more than half-way through the sucrose gradient (ϕ in Figure 2a); the less intense band was closer to the origin (C in Figure 2a). Fractions of the sucrose gradient, indicated by horizontal lines bracketing fraction numbers in Figure 2, had infectivity titers with a peak coinciding with the peak of ϕ band intensity (Legend to Figure 2). Thus, phages formed at least part of the ϕ band.
The particles of the C band in Figure 2a had no significant infectivity above background (not shown). As shown below, the C band was formed by capsids and ipDNA-capsids almost all without the phage tail. These particles were not expected to be infective. Both ϕ and C bands were symmetrical, a characteristic of bands formed by particles not detectably variable in sedimentation rate.
The light scattering profile in Figure 2a was the same as the light scattering profile from a control sucrose gradient (Figure 2b) that had been co-centrifuged after layering a portion of the sample of Figure 2a that had not been incubated with ethidium. However, the ϕ and C bands in Figure 2a had a slight orange tint that the control ϕ and C bands in Figure 2b did not have. The orange color became stronger, and the E band became weaker (eventually not detectable) when the number of phages centrifuged was increased (not shown). Thus, the orange tint of the ϕ and C bands in Figure 2a was from association of ethidium with ϕ- and C-band particles, as confirmed for ϕ-band particles in more detail in Section 3.4.
Nonetheless, the ϕ-band-associated titers in Figure 2a,b were comparable (Legend to Figure 2). Infectivity was mostly retained after incubation with ethidium. The fractions had been kept in the dark to avoid the photoinactivation that has been induced by reactive oxygen-generating, cationic dyes and DNA intercalators ([32,33] and included references).
However, ethidium loaded T4 did slowly lose infectivity titer over a period of weeks. Storage for three weeks resulted in a 24% titer loss in comparison to unloaded T4.

3.3. Identity of Band-Forming Particles: Electron Microscopy

The particles that formed the C band were T4 capsids that appeared empty when observed by electron microscopy of a negatively stained preparation (Figure 3a). Over 98% of these capsids had no tail. However, a few of them did have a tail (arrow in Figure 3a). Although not detected by the electron microscopy, some C band-capsids had ipDNA, as seen by agarose gel electrophoresis of DNA expelled from capsids. The ipDNA length was variable and, for the most part, less than 7% of the 170 Kb length [34] of mature T4 DNA (not shown). The presence of DNA in some C band capsids is confirmed below. The C band capsids were 90 ± 5 nm wide and 105 ± 10 nm long.
As expected, electron microscopy revealed that particles that formed the ϕ band were primarily phage T4 with elongated capsid (90 ± 5 nm wide; 115 ± 5 nm long) and 100 nm long tail (Figure 3b), within error, the same as previously observed [24,34,35]. The tail fibers were adjacent to and aligned with the tail (arrow in Figure 3b), i.e., in the retracted conformation previously described [36,37]. Occasional DNA-filled, phage-like capsids without tails were also seen.

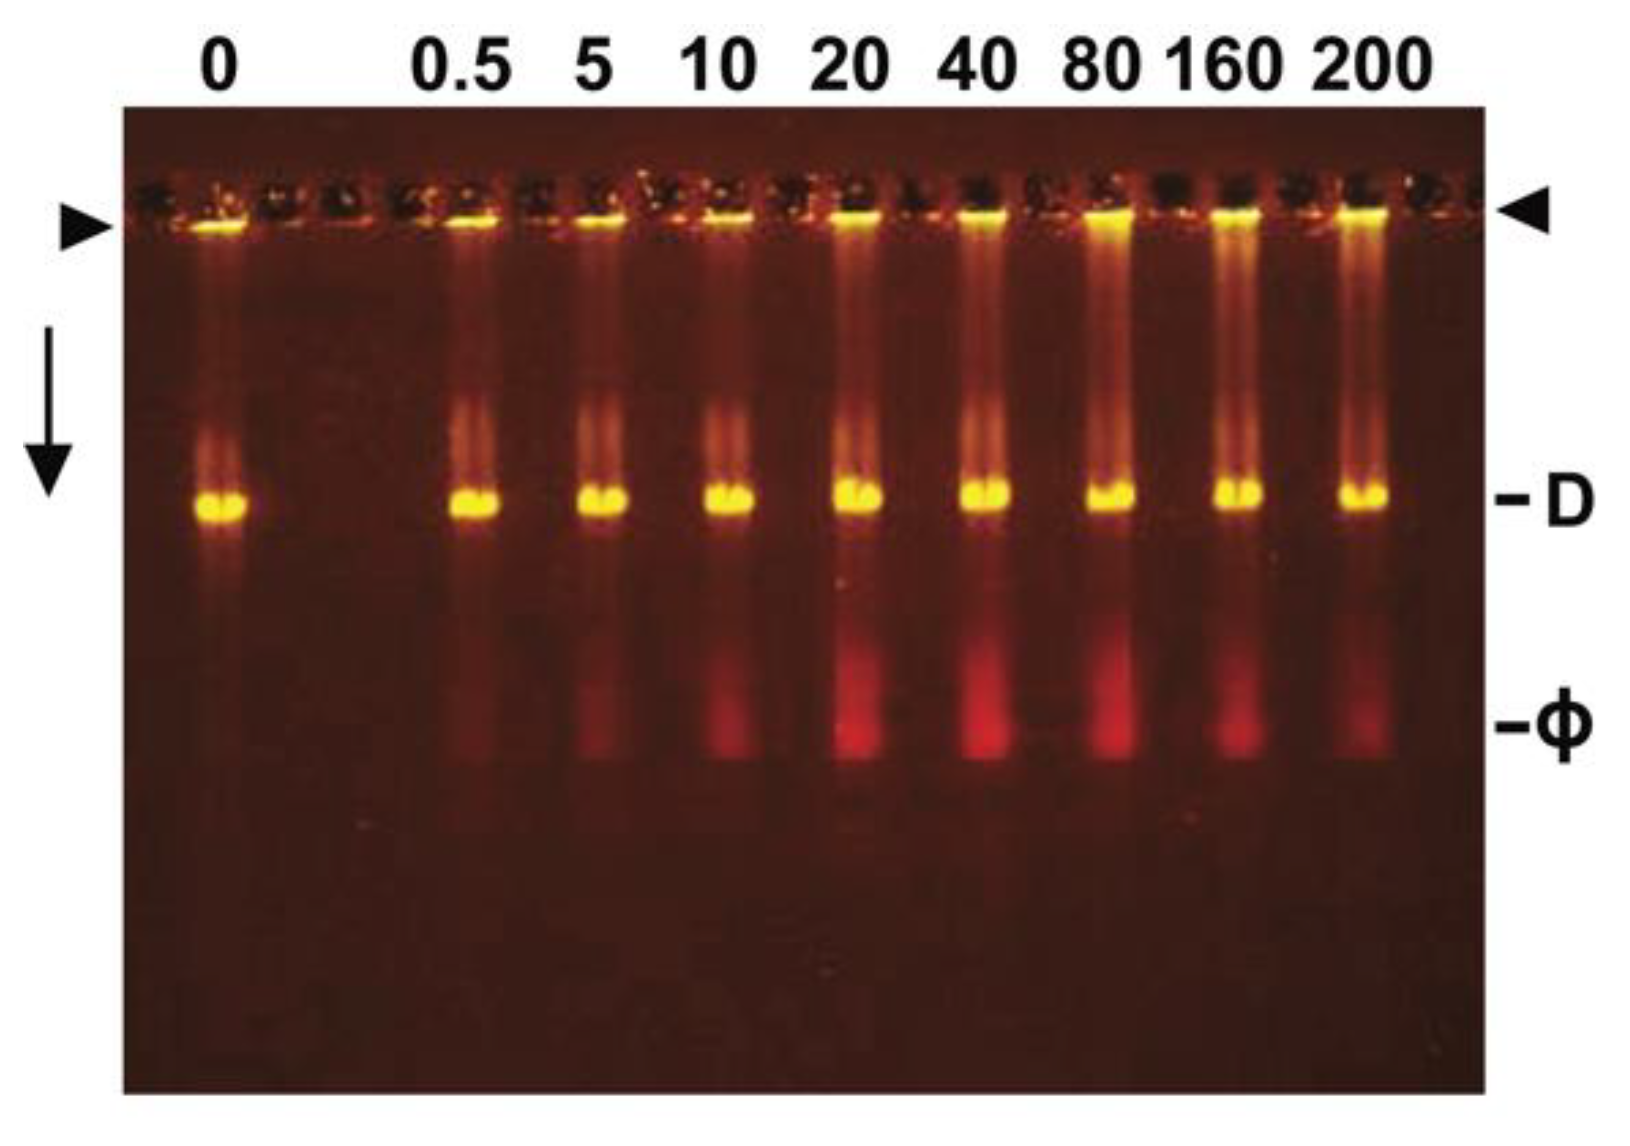
3.4. Ethidium Loading Assayed by Native Agarose Gel Electrophoresis (AGE): Stability of Loading

To perform a more complete and more detailed assay for ethidium loading, the fractions of Figure 2a were analyzed by AGE without staining of the gel. Ethidium was detected by fluorescence excited by illumination of the gel with ultraviolet light. The result (Figure 2c) was that two AGE-bands of orange fluorescence were observed for samples from the sucrose gradient’s ϕ-peak region (i.e., fractions 11 and 12 of Figure 2c). The result for the unloaded control of Figure 2b was that the gel had no detected fluorescence of any visible color (not shown). Thus, this assay directly showed the association of ethidium with (possibly the loading of ethidium in) two T4-related particles, at least one of which was the mature phage. The more origin-proximal particle after AGE (ϕ band in Figure 2c) is identified, below, to be the band formed by infective phages; the more original distal band is identified, below, to be a phage without its tail (ϕ-T band in Figure 2c). The co-sedimentation of these two particles in the sucrose gradient of Figure 2a is presumably explained by equality of the following opposing effects of tail addition: (1) decrease in sedimentation rate from increase in viscous drag and (2) increase in sedimentation rate from increase in mass.
Before the analysis by centrifugation and AGE, the loading procedure had been tested and found reproducible. This was done in three independent experiments performed by use of AGE alone, without the sucrose gradient (Section 3.7).
To further analyze the fractions of Figure 2a, the gel of Figure 2c was stained with GelStar (green peak emission; specific for nucleic acid), after the image of Figure 2c was obtained. To simultaneously observe both orange ethidium fluorescence and green GelStar fluorescence, a yellow emission filter was used. Initially, two observations were made. First, the C band-forming particles were stained green with GelStar (Figure 4b); Figure 4a has the profile before GelStar staining. In a separate experiment, the particles forming the C band also stained with ethidium, post AGE (not shown). These results confirmed the presence of ipDNA in some of the C band-forming capsids. Thus, these C band-forming capsids were assumed to have loaded with ethidium at 54 °C, but to have lost their ethidium either during or after rate zonal centrifugation in the sucrose gradient of Figure 2a. The orange tint of the C band in Figure 2a implies loss of at least some ethidium after sedimentation in the sucrose gradient. These observations implied that the two AGE identified particles forming the sucrose gradient’s ϕ band had an ethidium-release barrier (presumably a closed gate) not present in the particles of the C band.
Second, in contrast to the green fluorescing C band-particles, the ϕ and ϕ-T particles in Figure 4b (from fractions 11 and 12 of Figure 2a) retained their orange fluorescence after staining with GelStar. As shown below, green GelStar fluorescence did replace orange ethidium fluorescence when ϕ band particles were subsequently disrupted. Thus, the retention of orange fluorescence in Figure 4b was a second indication of a barrier to the entry of molecule, GelStar in this case, to the (DNA-containing) interior of the ϕ and ϕ-T particles of Figure 2c and Figure 4.
The ϕ- and ϕ-T-band-particles underwent progressive replacing of orange ethidium fluorescence with green GelStar fluorescence when the following phage-disrupting solution was substituted for electrophoresis buffer during GelStar staining: 0.002 M EDTA, pH 7.4. Figure 4c displays partial substitution after incubation at room temperature for 3 h; Figure 4d displays almost complete substitution after incubation at room temperature for 16 h. The disruption occurred because of increased pressure of the packaged DNA on the phage capsid in low ionic strength solutions with EDTA-chelated divalent cations [29,30]. As expected, ethidium-loaded ϕ and ϕ-T band-particles had protein, as indicated by staining with Coomassie blue (not shown).
Even though C band-particles differed in sedimentation rate from ϕ-T band-particles, the subsequent AGE in Figure 4 had C band particles migrating a distance within 2% of the distance migrated by the ϕ-T band-particles and the following is the interpretation. Assuming that these two particles were both phage components, the near co-migration implied that the surfaces of these two particles were similar. The reason is that the gel electrophoretic properties of a particle depend, unlike the rate of sedimentation, only on the surface of the particle [38,39], not on what is in the interior. The C band-particles were capsids without a tail by electron microscopy. Therefore, the ϕ-T band-particles were the same on the surface and had a capsid without a tail. However, they had mature-length DNA (rather than ipDNA) in the interior. The longer DNA caused the more rapid sedimentation of the ϕ-T band-particles. Phages without tails are non-infective and have been typically called heads [34,35,36,37]. We will use this terminology in subsequent text. Thus, the ϕ band of AGE was the band formed by infective phage particles. The heads and phage both had a permeability barrier that the capsids of the C band did not have.
Ethidium loading did not detectably alter the migration of either phage T4 or T4 heads during AGE. This was seen (1) by side-by-side AGE in a single gel during loading experiments in which AGE was performed without rate zonal centrifugation (Section 3.7) and (2) by separate AGE performed post- sedimentation (data not shown). Loading ethidium also did not detectably (±3%) change RE because loading ethidium did not change the rate of sedimentation in a sucrose gradient (Figure 1a,b). Thus, the absence of effect on AGE implies that ethidium loading also did not detectably (±3%) change σ.

3.5. Stability of Loading

The phages and heads that formed AGE-bands in Figure 2c and Figure 4 had remained ethidium-loaded after (1) fractionation in a sucrose gradient at 5 °C, storage for ~30 days at 4 °C and AGE for 16 h at 25°C. This result did not significantly change when the analysis of Figure 2c was re-run after 48 days of additional storage at 4 °C (not shown). In other words, no ethidium-leakage was detected during this time of storage.
Anticipated use of a drug loaded phage T4-DDV will subject phage T4 to temperatures as high as 41 °C, depending on whether a patient has a fever. Thus, we determined whether ethidium-loaded phage T4 would lose ethidium at 37 °C and 42 °C. Incubating ethidium-loaded phages, from the sucrose gradient of Figure 2a, for 6.0 h, did not cause detectable loss of ethidium fluorescence when temperature was 37 °C (Figure 2c, lane A) and, separately, 42 °C (Figure 2c, Lane B). This result was the same when the incubation time was 6 days (not shown). However, incubation at 54 °C for 6.0 days did cause complete loss of the phage-associated ethidium fluorescence (not shown). The presumed reason is opening of the same gate that was opened to load the ethidium. Migration distance during AGE did not change during these trials.

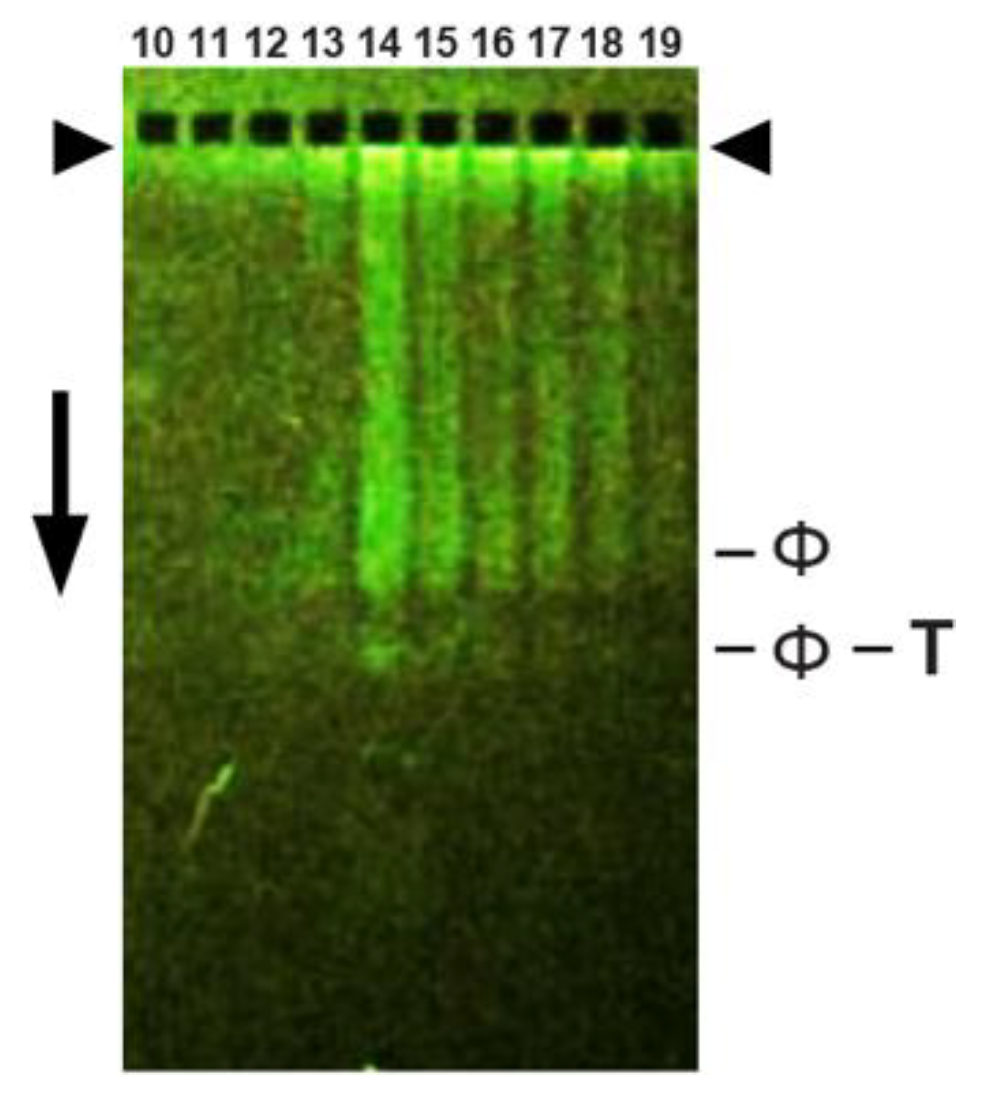
3.6. Bleomycin Loading

Having used ethidium (394 Da) as a drug proxy to test procedure, we next tested the loading of the anti-cancer drug, bleomycin, in phage T4. Bleomycin is larger (1416 Da) and should both load and leak with more difficulty. Unfortunately, bleomycin fluorescence is also weaker than ethidium fluorescence and has a blue emission peak. Blue is the dominant color of the background light scattering of an agarose gel. Initial tests revealed that bleomycin was best detected in-agarose gel by use of a green emission filter. In any case, bleomycin was much harder to detect in-gel than either ethidium or GelStar (details for GelStar [22]). Thus, we used a more concentrated preparation of phage T4. We loaded at 58 °C.
The AGE profile of a sucrose gradient, after bleomycin loading at 58 °C, is shown in Figure 5. Both a ϕ band and a ϕ-T (phage head) band are observed. The bands are broader than they are in Figure 2c because of a higher concentration of sample in the sucrose gradient. The infectivity profile near the ϕ-band of the sucrose gradient is in the Legend to Figure 5. No significant loss in titer is observed when these titers are compared to the titers of a control sedimentation of a sample that had not been incubated with bleomycin.
Via bleomycin standards pipetted into the gel (see [22]), we found the concentration of loaded bleomycin to be 450 μg/mL (volume = ~1 mL) in the peak fraction of Figure 5. The recommended dose of DDV-free bleomycin depends on the tumor, but is typically [40,41] 10–20 units/m2, corresponding to ~10–20 mg/m2. An average 25-g mouse has surface area of 0.0079 m2 [42]. Thus, the recommended dose per 25 g mouse is 79–158 μg. In this experiment, we have T4-loaded enough bleomycin for 5–10 murine therapy attempts.

3.7. Loading Details; Analytical AGE without the Sucrose Gradient

To advance phage-DDV loading in the future, an analytical loading assay should be more efficient than the preparative, centrifugation-based assay presented above. Indeed, before development of this preparative assay, AGE was performed without centrifugation. The phages had been previously purified by procedure that ended in buoyant density centrifugation in a cesium chloride density gradient (Section 2.2). Figure 6 shows the AGE/fluorescence-observed ethidium loading vs. ethidium concentration. The ethidium concentration (μg/mL) is at the top of a lane in Figure 6. This gel was stained, after AGE, with GelStar.
The AGE profile had two major bands. The more origin-proximal, green (i.e., GelStar fluorescing), sharper band (D in Figure 6) was formed by T4 DNA that had been expelled from phage particles before AGE. The second, more origin-distal, orange (i.e., ethidium fluorescing), broader band (ϕ in Figure 6) was formed by T4 phage particles with a closed gate that blocked GelStar entry. The band formed by heads was not present because heads have a lower density than phages during the buoyant density centrifugation that purified the T4 phages. The identity is not known for the particles forming weak bands origin proximal to the DNA band.
The fluorescence of the ϕ band in Figure 1 increased as ethidium concentration increased from 0 μg/mL to 40 μg/mL and then decreased at higher ethidium concentrations. The decrease is expected because of self-quenching, previously observed with DNA-bound GelStar [22] and ethidium [43]. Self-quenching of DNA-bound ethidium fluorescence is caused by ethidium not bound to DNA [43].
The rate of phage T4 migration was the same at all ethidium concentrations in Figure 6. This, together with the non-ethidium-alteration of sedimentation rate in Figure 2, confirms the above conclusion that binding of ethidium does not alter (±3%) either the σ or the size of phage T4.
The result of Figure 6 was seen in two other similar trials. That is to say, the loading is reproducible, having also been seen in Figure 2 by centrifugation-based procedure performed with a phage T4 preparation of different type.

4. Discussion

4.1. Advantages of the Preparative and Analytical Procedures Used Here

In-gel propagation, as used here, has the following advantages for preparing a phage T4-DDV, especially when scaled to industrial dimension. First, the equipment and procedure are simple and inexpensive (relative to in-liquid culture) and are relatively immune to phage contamination of the host, pre-infection. The key determinant of phage amount produced, per area of Petri plate, is the density of plaques (Figure 1). Second, the absence of liquid culture eliminates the possibility of phage contamination of the laboratory via aerosols generated during propagation. Mechanical aeration is not used. Third, the labor involved is significantly less than it is for a liquid culture. After starting incubation of plates, no attention from an investigator is needed until harvesting. Fourth, at least in our hands, the yield per volume of medium used is higher in-gel. Fifth, plate harvesting is automatable, for industrial upscaling.
In the current study, phage purification by rate zonal centrifugation was used, instead of the often used [11,39,44,45] buoyant density centrifugation in a cesium chloride density gradient. The reasons are the following. (1) When phage T4 particles are in concentrated cesium chloride solutions, some of them are osmotic shock-inactivated during rapid dilution into less concentrated solutions. Thus, subsequent analysis must be done after slow, stepwise dilution, which is resource consuming and may still result in low-level inactivation. (2) Rate zonal centrifugation, but not buoyant density centrifugation, separates ethidium- and bleomycin-loaded phages from the unloaded compound. This is critically important for use of phage T4 as a DDV.
Osmotic shock is not a problem with T4 diluted from a sucrose gradient, apparently because, like ethidium, sucrose does not enter T4 at the temperatures used to handle phages in a sucrose gradient. The polyethylene glycol in the sucrose gradients used here provides further stabilization [46]. The closed T4 gate does leave an opening large enough for osmotic shock-generating permeation of NaCl and CsCl [47,48]. However, the occurrence of osmotic shock implies that outward permeation of NaCl and CsCl ions is relatively slow, so that inward permeation of water has time to generate pressure that causes osmotic shock [47,48]. Screening for additional phages with T4-like loading can be rapidly done by testing for osmotic shock-induced loss of titer during rapid dilution from concentrated to dilute solution of NaCl.
Fortunately, phage T4 can be loaded when only partially purified, before being further purified by rate zonal sedimentation. This is a major advantage relative to loading after the final phage purification, in that the final phage purification and the separation of phage from unloaded compound is done in one, rather than two steps. Given that phage-co-sedimenting heads are also loaded, removing them from therapeutic preparations is possibly counter-productive. However, if needed, they can be removed by buoyant density centrifugation in a cesium chloride density gradient, a procedure that fractionates by DNA/protein ratio [11,39,44].

4.2. Gating of Phage T4: DDV Potential

The following observations indicate that, after 54 °C-loading of ethidium, phage T4 permeability was reduced to undetectable levels by temperature lowering. (1) Ethidium remained associated with phage T4 particles (and with the accompanying phage heads) through the rate zonal centrifugation in a sucrose gradient and the subsequent storage for over a month. This phenomenon was not caused by ethidium binding to DNA, a conclusion drawn from the non-retention of ethidium in Figure 2c by the ipDNA-capsids of the C band in Figure 2a. (2) GelStar staining of ethidium-loaded T4 phage and heads did not occur until DNA was expelled. In summary, the 54 °C-opened gate was closed by lowering of the temperature.
For optimal use as a DDV, closed gate-phage T4 should not release loaded drugs when circulating in blood. The following observation made here projects that T4-DDVs will have this property. Ethidium was not released by incubation at temperatures in, and above, the range of possible body temperatures for a live human (37 °C and 42 °C). However, as expected, ethidium was released by incubation at 54 °C, a temperature of open gate. The two compounds used here vary from 394 Da (ethidium) to 1416 Da (bleomycin) in molecular weight. Presumably, compounds with intermediate molecular weights will be similarly loadable/sealable in phage T4.
The drug non-release aspect is one of three key characteristics for an effective, gated DDV. High persistence in blood is the second and this aspect is already known to be a characteristic of phage T4 in mice [23]. The third is selective migration to tumors (tumor-homing), already known to occur for phage T3 [23] and possibly caused by high porosity of tumor blood vessels and low tumor lymphatic activity (EPR effect [49]). Phage T4 has a head with dimensions that are close to the size range optimal for the EPR effect (100–200 nm [49]). Thus, EPR effect-generated selectivity of T4 migration to tumors is expected. Tumor-homing works, together with high persistence, to generate tumor selectivity of drug delivery. For example, if a phage is infinitely persistent in a healthy organism, then even a weak EPR effect will cause tumor selectivity of 100% because the tumors are the only places that the phage ever enters from blood.
Assuming T4-DDV accumulation in tumors, the next objective is selective in-tumor drug release. We do not yet have data for how well either ethidium or bleomycin is released from phage T4 in a tumor. Whatever the release rate, the assumption is that it can be increased either via genetics or via physical modification. An example of the latter is loading T4 with something (possibly drug at very high concentration) that destabilizes T4. An example of the former is genetically selecting for T4 mutants preferentially stable at alkaline pH and screening for those mutants that disrupt preferentially at the lower pH (typically 6.5–7.1 [50,51]) of tumors. This (1) is an area for creative exploration in the future and (2) illustrates a major advantage of using of a DDV that has its own genome and that replicates rapidly.
In summary, the ethidium/bleomycin-loading and the post-loading purification developed here begin the process of using phage T4 to improve DDV effectiveness for metastatic cancer. Future success is projected via the high persistence of phage T4 and the EPR effect. The major projected limitation is the patient’s development of adaptive immunity to phage T4. We do not yet know whether adaptive immunity avoiding T4 mutants can be obtained. Assuming that they cannot be obtained, the response is to use a T4-DDV only in the period before adaptive immunity becomes a problem, which is at least 5 days based on current data [52]. After this period, the DDV would be changed to an immunologically non-cross-reactive phage. The overall strategy would, therefore, involve the isolation and screening of many new phages.

5. Conclusions

Although development of tumor-targeting DDVs is a field that has the potential to cure metastatic cancer, multiple efforts in this area have had only limited success. A, and perhaps the key limitation is the (apparently complete) current non-existence of any DDV that has gating. Gating makes possible drug loading and unloading only when appropriate for therapy. Our work here takes the first and biophysically oriented steps toward the development of the needed gating competent DDV. Phage T4 can be open gate loaded and then kept in a completely closed gate state with ethidium (394 Da), bleomycin (1416 Da) and presumably compounds of intermediate size. Remarkably, T4 retains its infectivity when loaded with bleomycin, which implies that therapeutic T4 can be tracked in animal models by its infectivity and at sensitivity of 10,000 particles or better. In a closed gate state, prolonged, non-toxic circulation in non-tumor blood vessels is expected because of the previous finding [23] that T4 is highly persistent (~6 h) in murine blood. The next step is to track phage T4 in a tumor-bearing mouse to see how strong the EPR effect is when this high persistence makes tumors the dominant place that a DDV can go. The projection is that a final step will be developing tumor-specific unloading either by gate opening or by phage disruption. An advantage for achieving this last, relatively difficult objective is that a T4 DDV has its own genome and can be modified by directed evolution in favored ways and with natural systems engineering. DDV use of T4 might be complemented by use of either antigen display [53] on T4 or protein/DNA delivery by T4 [54], which are both currently experiencing success [53,54], presumably promoted by high persistence.

Author Contributions

The following are author contributions: Conceptualization, P.S.; methodology, P.S. and E.T.W.; validation, P.S.; formal analysis, P.S.; investigation, P.S. and E.T.W.; resources, P.S.; data curation, P.S. and E.T.W.; writing—original draft preparation, P.S.; writing, review and editing, P.S. and E.T.W.; visualization, P.S. and E.T.W.; supervision, P.S.; project administration, P.S.; funding acquisition, P.S. All authors have read and agreed to the published version of the manuscript.

Funding

This research was funded by the Morrison Trust, grant number 2021.

Data Availability Statement

Not applicable.

Acknowledgments

We thank Barbara Hunter for assistance with the electron microscopy.

Conflicts of Interest

The authors declare no conflict of interest. The funder had no role in the design of the study; in the collection, analyses, or interpretation of data; in the writing of the manuscript; or in the decision to publish the results.

References

  1. Park, G.T.; Choi, K.C. Advanced new strategies for metastatic cancer treatment by therapeutic stem cells and oncolytic virotherapy. Oncotarget 2016, 7, 58684–58695. [Google Scholar] [CrossRef] [Green Version]
  2. Leaf, C. The Truth in Small Doses; Simon and Schuster: New York, NY, USA, 2014. [Google Scholar]
  3. Bergamo, A.; Sava, G. Chemical and molecular approach to tumor metastases. Int. J. Mol. Sci. 2018, 19, 843. [Google Scholar] [CrossRef] [Green Version]
  4. Mamdouhi, T.; Twomey, J.D.; McSweeney, K.M.; Zhang, B. Fugitives on the run: Circulating tumor cells (CTCs) in metastatic disease. Cancer Metastasis Rev. 2019, 38, 297–305. [Google Scholar] [CrossRef] [Green Version]
  5. Lambert, A.W.; Pattabiraman, D.R.; Weinberg, R.A. Emerging biological principles of metastasis. Cell 2017, 168, 670–691. [Google Scholar] [CrossRef] [Green Version]
  6. World Health Organization. Cancer. Available online: https://www.who.int/news-room/fact-sheets/detail/cancer (accessed on 4 July 2022).
  7. National Cancer Institute, US. Understanding Cancer. Available online: https://www.cancer.gov/about-cancer/understanding/statistics (accessed on 4 July 2022).
  8. Mansoori, B.; Mohammadi, A.; Davudian, S.; Shirjang, S.; Baradaran, B. The different mechanisms of cancer drug resistance: A brief review. Adv. Pharm. Bull. 2017, 7, 339–348. [Google Scholar] [CrossRef]
  9. Nikolaou, M.; Pavlopoulou, A.; Georgakilas, A.G.; Kyrodimos, E. The challenge of drug resistance in cancer treat-ment: A current overview. Clin. Exp. Metastasis 2018, 35, 309–318. [Google Scholar] [CrossRef]
  10. Beyaz, H.; Uludag, H.; Kavaz, D.; Rizaner, N. Mechanisms of drug resistance and use of nanoparticle delivery to overcome resistance in breast cancers. Adv. Exp. Med. Biol. 2021, 1347, 163–181. [Google Scholar] [CrossRef]
  11. Serwer, P.; Wright, E.T.; Liu, Z.; Jiang, W. Length quantization of DNA partially expelled from heads of a bacterio-phage T3 mutant. Virology 2014, 456–457, 157–170. [Google Scholar] [CrossRef] [Green Version]
  12. Unsoy, G.; Gunduz, U. Smart drug-delivery systems in cancer therapy. Curr. Drug Targets 2018, 19, 202–212. [Google Scholar] [CrossRef]
  13. Shen, H.; Aggarwal, N.; Wun, K.S.; Lee, Y.S.; Hwang, I.Y.; Chang, M.W. Engineered microbial systems for advanced drug delivery. Adv. Drug Deliv. Rev. 2022, 187, 114364. [Google Scholar] [CrossRef]
  14. Liu, P.; Chen, G.; Zhang, J. A review of liposomes as a drug delivery system: Current status of approved products, regulatory environments, and future perspectives. Molecules 2022, 27, 1372. [Google Scholar] [CrossRef]
  15. Anchordoquoy, T.J.; Barenholz, Y.; Boraschi, D.; Chorny, M.; Decuzzi, P.; Dobrovolskaia, M.A.; Farhangrazi, Z.S.; Farrell, D.; Gabizon, A.; Ghandehari, H.; et al. Mechanisms and barriers in cancer nanomedicine: Ad-dressing challenges, looking for solutions. ACS Nano 2017, 11, 12–18. [Google Scholar] [CrossRef] [Green Version]
  16. Barenholz, Y. Doxil®—The first FDA-approved nano-drug: Lessons learned. J. Control Release 2012, 160, 117–134. [Google Scholar] [CrossRef]
  17. Silverman, L.; Barenholz, B. In vitro experiments showing enhanced release of doxorubicin from Doxil® in the presence of ammonia may explain drug release at tumor site. Nanomed. Nanotechnol. Biol. Med. 2015, 11, 1841–1850. [Google Scholar] [CrossRef]
  18. Hatfull, G.F.; Dedrick, R.M.; Schooley, R.T. Phage therapy for antibiotic-resistant bacterial infections. Annu. Rev. Med. 2022, 73, 197–211. [Google Scholar] [CrossRef]
  19. São-José, C.; Costa, A.R.; Melo, L.D.R. Editorial: Bacteriophages and their lytic enzymes as alternative antibacterial therapies in the age of antibiotic resistance. Front. Microbiol. 2022, 13, 884176. [Google Scholar] [CrossRef]
  20. Górski, A.; Borysowski, J.; Miȩdzybrodzki, R. Bacteriophage interactions with epithelial cells: Therapeutic implica-tions. Front. Microbiol. 2021, 11, 631161. [Google Scholar] [CrossRef]
  21. Zaczek, M.; Górski, A.; Szkaradzinska, A.; Lusiak-Szelachowska, M.; Weber-Dabrowska, B. Phage penetration of eukaryotic cells: Practical implications. Future Virol. 2020, 11, 745–760. [Google Scholar] [CrossRef]
  22. Serwer, P.; Wright, E.T.; Gonzales, C.B. Phage capsids as gated, long-persistence, uniform drug delivery vehicles. In Current and Future Aspects of Nanomedicine [Internet]; Khalil, I.A.H., Ed.; IntechOpen: London, UK, 2020; Available online: https://www.intechopen.com/chapters/70945 (accessed on 4 July 2022). [CrossRef]
  23. Serwer, P.; Wright, E.T.; De La Chapa, J.; Gonzales, C.B. Basics for improved use of phages for therapy. Antibiotics 2021, 10, 723. [Google Scholar] [CrossRef]
  24. Wood, W.B.; Revel, H.R. The genome of bacteriophage T4. Bacteriol. Rev. 1976, 40, 847–868. [Google Scholar] [CrossRef]
  25. Griess, G.A.; Khan, S.A.; Serwer, P. Variation of the permeability of bacteriophage T4: Analysis by use of a protein-specific probe for the T4 interior. Biopolymers 1991, 31, 11–21. [Google Scholar] [CrossRef] [PubMed]
  26. Bull, H.B. Introduction to Physical Biochemistry, 2nd ed.; F.A. Davis Company: Philadelphia, PA, USA, 1971; Chapter 10. [Google Scholar]
  27. LePecq, J.B.; Paoletti, C. A fluorescent complex between ethidium bromide and nucleic acids. Physical-chemical characterization. J. Mol. Biol. 1967, 27, 87–106. [Google Scholar] [CrossRef]
  28. Motlagh, N.S.; Parvin, P.; Ghasemi, F.; Atyabi, F. Fluorescence properties of several chemotherapy drugs: Doxorubi-cin, paclitaxel and bleomycin. Biomed. Opt. Express 2016, 7, 2400–2406. [Google Scholar] [CrossRef] [PubMed] [Green Version]
  29. Parkinson, J.S.; Huskey, R.J. Deletion mutants of bacteriophage lambda. I. Isolation and initial characterization. J. Mol. Biol. 1971, 56, 369–384. [Google Scholar] [CrossRef]
  30. Griess, G.A.; Serwer, P.; Horowitz, P.M. Binding of ethidium to bacteriophage T7 and T7 deletion mutants. Biopolymers 1985, 24, 1635–1646. [Google Scholar] [CrossRef]
  31. Serwer, P.; Wright, E.T. ATP-driven contraction of phage T3 capsids with DNA incompletely packaged in vivo. Viruses 2017, 9, 119. [Google Scholar] [CrossRef] [Green Version]
  32. Wiehe, A.; O’Brien, J.M.; Senge, M.O. Trends and targets in antiviral phototherapy. Photochem. Photobiol. Sci. 2019, 18, 2565–2612. [Google Scholar] [CrossRef]
  33. Bartolomeu, M.; Oliveira, C.; Pereira, C.; Neves, M.G.P.M.S.; Faustino, M.A.F.; Almeida, A. Antimicrobial photody-namic approach in the inactivation of viruses in wastewater: Influence of alternative adjuvants. Antibiotics 2021, 10, 767. [Google Scholar] [CrossRef]
  34. Miller, E.S.; Kutter, E.; Mosig, G.; Arisaka, F.; Kunisawa, T.; Rüge, W. Bacteriophage T4 genome. Microbiol. Mol. Biol. Rev. 2003, 67, 86–156. [Google Scholar] [CrossRef]
  35. Kuhn, A.; Thomas, J.A. The beauty of bacteriophage T4 research: Lindsay W. Black and the T4 head assembly. Viruses 2022, 14, 700. [Google Scholar] [CrossRef]
  36. Wood, W.B.; Conley, M.P. Attachment of tail fibers in bacteriophage T4 assembly: Role of the phage whiskers. J. Mol. Biol. 1979, 127, 15–29. [Google Scholar] [CrossRef]
  37. Hyman, P.; van Raaij, M. Bacteriophage T4 long tail fiber domains. Biophys. Rev. 2018, 10, 463–471. [Google Scholar] [CrossRef] [PubMed] [Green Version]
  38. Abraham, H.A.; Gorin, M.H.; Ponder, E. Electrophoresis and the chemistry of cell surfaces. Cold Spring Harb. Symp. Quant. Biol. 1940, 8, 72–79. [Google Scholar] [CrossRef]
  39. Bachrach, U.; Friedmann, A. Practical procedures for the purification of bacterial viruses. Appl. Microbiol. 1971, 22, 706–715. [Google Scholar] [CrossRef]
  40. Medscape. Bleomycin (Rx). Available online: https://reference.medscape.com/drug/bleomycin-342113 (accessed on 8 September 2022).
  41. Drugs.com. Bleomycin Dosage. Available online: https://www.drugs.com/dosage/bleomycin.html (accessed on 8 September 2022).
  42. Dawson, N.J. The surface-area/body-weight relationship in mice. Aust. J. Biol. Sci. 1967, 20, 687–690. [Google Scholar] [CrossRef]
  43. Heller, D.P.; Greenstock, C.L. Fluorescence lifetime analysis of DNA intercalated ethidium bromide and quenching by free dye. Biophys. Chem. 1994, 50, 305–312. [Google Scholar] [CrossRef]
  44. Nasukawa, T.; Uchiyama, J.; Taharaguchi, S.; Ota, S.; Ujihara, T.; Matsuzaki, S.; Murakami, H.; Mizukami, K.; SSakaguchi, M. Virus purification by CsCl density gradient using general centrifugation. Arch. Virol. 2017, 162, 3523–3528. [Google Scholar] [CrossRef]
  45. Liu, D.; Van Belleghem, J.D.; de Vries, C.R.; Burgener, E.; Chen, Q.; Manasherob, R.; Aronson, J.R.; Amanatullah, D.F.; Tamma, P.D.; Suh, G.A. The safety and toxicity of phage therapy: A review of animal and clinical studies. Viruses 2021, 13, 1268. [Google Scholar] [CrossRef]
  46. Serwer, P.; Masker, W.E.; Allen, J.L. Stability and in vitro DNA packaging of bacteriophages: Effects of dextrans, sugars, and polyols. J. Virol. 1983, 45, 665–671. [Google Scholar] [CrossRef]
  47. Leibo, S.P.; Kellenberger, E.; Kellenberger-van der Kamp, C.; Frey, T.G.; Steinberg, C.M. Gene 24-controlled osmotic shock resistance in bacteriophage T4: Probable multiple gene functions. J. Virol. 1979, 30, 327–338. [Google Scholar] [CrossRef] [Green Version]
  48. Leibo, S.P.; Mazur, P. Effect of osmotic shock and low salt concentration on survival and density of bacteriophages T4B and T4Bo1. Biophys. J. 1966, 6, 747–772. [Google Scholar] [CrossRef] [Green Version]
  49. Longmire, M.; Choyke, P.L.; Kobayashi, H. Clearance properties of nano-sized particles and molecules as imaging agents: Considerations and caveats. Nanomedicine 2008, 3, 703–717. [Google Scholar] [CrossRef] [Green Version]
  50. Webb, B.A.; Chimenti, M.; Jacobson, M.P.; Barber, D.L. Dysregulated pH: A perfect storm for cancer progression. Nat. Rev. Cancer 2011, 11, 671–677. [Google Scholar] [CrossRef] [PubMed]
  51. Zhao, T.; Huang, G.; Li, Y.; Yang, S.; Ramezani, S.; Lin, Z.; Wang, Y.; Ma, X.; Zeng, Z.; Luo, M.; et al. A transistor-like pH nanoprobe for tumour detec-tion and image-guided surgery. Nat. Biomed. Eng. 2016, 1, 0006. [Google Scholar] [CrossRef] [PubMed] [Green Version]
  52. Hodyra-Stefaniak, K.; Miernikiewicz, P.; Drapała, J.; Drab, M.; Jończyk-Matysiak, E.; Lecion, D.; Kaźmierczak, Z.; Beta, W.; Majewska, J.; Harhala, M.; et al. Mammalian host-versus-phage immune response determines phage fate in vivo. Sci. Rep. 2015, 5, 14802. [Google Scholar] [CrossRef] [Green Version]
  53. Zhu, J.; Ananthaswamy, N.; Jain, S.; Batra, H.; Tang, W.C.; Lewry, D.A.; Richards, M.L.; David, S.A.; Kilgore, P.B.; Sha, J.; et al. A universal bacteriophage T4 nanoparticle platform to design multiplex SARS-CoV-2 vaccine candidates by CRISPR engineering. Sci. Adv. 2021, 7, eabh1547. [Google Scholar] [CrossRef]
  54. Zhu, J.; Tao, P.; Mahalingam, M.; Sha, J.; Kilgore, P.; Chopra, A.K.; Rao, V. A prokaryotic-eukaryotic hybrid viral vector for delivery of large cargos of genes and proteins into human cells. Sci. Adv. 2019, 5, eaax0064. [Google Scholar] [CrossRef]
Figure 1. A (contrast-enhanced) conventional photographic image, with illumination from the bottom, of a 4 × 6 cm portion of a Petri plate used for preparative propagation of phage T4 in-gel (plate stock). Propagation was for 17 h. The light regions (plaques) are completely clear to the eye.
Biophysica 02 00033 g001
Figure 2. Post-ethidium-loading fractionation and assay of phage T4 by rate zonal centrifugation in a sucrose gradient. (a) a sucrose gradient after ethidium-loading; (b) a control sucrose gradient without ethidium loading; (c) AGE for 16.0 hr. of fractions from panel (a), without staining of the gel [lane numbers are the fraction numbers in (a)]. Lanes A and B have fraction 11 of (a) after incubation for 6 h at 37 °C and 42 °C, respectively. Arrowheads indicate the origins; the arrow indicates the direction of electrophoresis. The titers of gradient fractions were the following (fraction number, followed by titer × 107 PFU/mL: (a) 7, 0.49; 8, 0.60; 9, 0.42; 10, 7.1; 11, 292; 12, 167; 13, 5.8; 14, 4.5; 15, 3.6. (b) 7, 2.3; 8, 3.8; 9, 4.1; 10, 181; 11, 601; 12, 442; 13, 169; 14, 99; 15, 105.
Biophysica 02 00033 g002
Figure 3. Transmission electron microscopy of negatively stained, unloaded particles that form (a) the C band and (b) the ϕ band after rate zonal centrifugation in a sucrose gradient. The arrow in (a) indicates a rare capsid with a tail. The arrow in (b) indicates a retracted tail fiber next to a tail.
Biophysica 02 00033 g003
Figure 4. Post-AGE GelStar staining. After the orange-filtered image of Figure 2c was recorded, the same gel was stained with GelStar. Images were recorded with a yellow filter (a) before staining with GelStar, (b) 2 h after staining with GelStar in electrophoresis buffer, (c) 3 h after continuing the GelStar staining in 0.002 M EDTA, pH 7.4 and (d) 16 h after further continuing the staining in panel (c). The arrowheads indicate the origins of electrophoresis; the arrow indicates the direction of electrophoresis.
Biophysica 02 00033 g004
Figure 5. Bleomycin-loading of phage T4, assayed by rate zonal centrifugation, followed by AGE. AGE for 15.5 h is shown of the fractions of the sucrose gradient. A preparation more concentrated than in Figure 2 was used. Fluorescence was imaged with the green emission filter. The contrast was digitally enhanced. The arrowheads indicate the origins of electrophoresis; the arrow indicates the direction of electrophoresis. The titers of gradient fractions were the following (fraction number, followed by titer × 1010 PFU/mL: 7, 0.023; 8, 0.015; 9, 0.021; 10, 0.035; 11, 0.030; 12, 0.017; 13, 9.0; 14, 150; 15, 77.6; 16, 54.3; 17, 43.3; 18, 34.7.
Biophysica 02 00033 g005
Figure 6. AGE of loading without the sucrose gradient. AGE for 17.0 h is shown after loading of phage T4 (0.29 μg packaged DNA) performed at 55 °C for 15 min at the ethidium concentration (μg/mL) indicated at the top of a lane. The arrow indicates the direction of electrophoresis. The arrowheads indicate the origins of electrophoresis. Fluorescence was imaged with the yellow emission filter.
Biophysica 02 00033 g006
Publisher’s Note: MDPI stays neutral with regard to jurisdictional claims in published maps and institutional affiliations.

