1. Introduction
Investigation of the interaction between drugs, usually small organic molecules, and cell membranes is a major priority of biomedical chemistry due to the high rate of drug design and acute demand to create new drug delivery systems with improved biopharmaceutical properties [
1]. The typical drug target is protein, and if this target is membrane-embedded (almost 60% of all targets according to [
2]), then the lipid matrix plays a significant role in drug activity and selectivity. These non-specific interactions are an important factor of drug action as they are unavoidable since absorption and even therapeutic action depend on them.
The partition coefficient K
p is one of the most important parameters on which the nature of drug interaction with the lipid bilayer depends, also helping to predict the passive diffusion of drug molecules through biomembranes [
3]. However, drug–liposome interaction depends not only on the K
p of the drug but also on its functional groups, such as hydrogen bonding sites and its polar surface area [
4]. Both electrostatic and hydrophobic interactions between drugs and the lipid bilayer as well as biological membranes are crucial in predicting drug absorption and the effectiveness of therapy [
5].
Despite significant progress in studying the interaction of membranes with drugs [
6,
7], the question of the mechanism of this interaction and identification of the functional groups involved in it often remains open. Computer simulations provide valuable information about the possible variants of this interaction [
7], but experimental confirmation is also required. It is this knowledge that can influence the design of new active molecules and the prediction of their therapeutic activity and side effects.
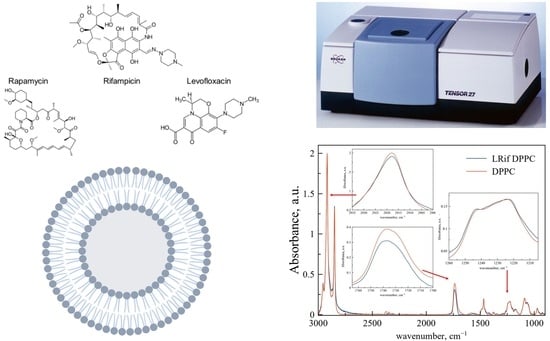
In this work, we consider the interaction with the bilayer of three drugs: water-soluble levofloxacin, fat-soluble rapamycin and amphiphilic rifampicin. Rifampicin, like levofloxacin, contains a heterocycle that is potentially capable of interacting with the polar part of the bilayer. On the other hand, rifampicin, like rapamycin, has a complex network of unsaturated bonds, as well as carbonyl and hydroxyl groups.
As the main method for studying the mechanism of interaction between drugs and the lipid bilayer, we have chosen ATR-FTIR spectroscopy as the technique providing a wide range of information on the microenvironment of functional groups in mixed samples [
8,
9,
10]. Differential scanning calorimetry (DSC) has been chosen as a complementary method to investigate the interactions of levofloxacin with the bilayer [
4].
Liposomes of dipalmitoylphosphatidylcholine (DPPC) 100% and DPPC:cardiolipin (CL) 80:20 (weight%) were chosen here as model membranes to identify affinity for the hydrophobic and hydrophilic parts of the bilayer. Charged liposomes are of a great interest to researchers as formation of electrostatic and hydrogen bonds is able to significantly influence the method of interaction with drugs. Recently, Rita Cortesi with colleagues has demonstrated that liposomes with charged surfactant are the most suitable drug delivery system for novel synthetic biofilm inhibitors [
11]. In [
12], charged liposomes are considered as prospective delivery system of HelixComplex snail mucus for topical delivery, which is used to prevent wound formation and possesses some other biological roles. On the other hand, charged liposomes are able to form non-covalent complexes with polymers, which opens the exciting perspective of surface engineering. For example, complexes of anionic liposomes with polyplexes are useful for gene delivery [
13].
Here, we set to the task of studying the process of interaction with the lipid membrane of three drugs, in the structure of which there are common fragments.
Levofloxacin (Lev) is a small organic molecule of the fluoroquinolone class, soluble in water with logP −0.029 [
14] and is actively used in the treatment of many infectious diseases [
15].
Rapamycin (Rapa), also known as sirolimus, is an immunosuppressant, an mTOR inhibitor [
16] and synthesized in the bacterium
Streptomyces hygroscopicus as an antifungal agent. The log P of Rapa is around 5.8, no ionizable functional groups within the pH range of 1–10 are available and water solubility is very poor (2.6 µg/mL) [
17]. Recently, the antitumor activity of rapamycin has been discovered [
18], and its activity in the treatment of certain autoimmune diseases has also been shown [
19].
Rifampicin (Rif) is one of the most important drugs in the treatment of tuberculosis [
20]. It inhibits the DNA-dependent RNA polymerase of Mycobacterium tuberculosis, but resistance to it develops rapidly [
21]. Rifampicin is soluble in water (2.5 mg/mL), possesses log p 1.086 and is partially ionized at the neutral pH, being ca. 40% in the anionic form with 4.96 ± 0.7 [
5,
22].
Comparing structures of these molecules (
Figure 1) one can discover similar moieties: for Lev and Rif it is heterocycle and for Rapa and Rif it is a complex network of unsaturated bonds and carbonyl and carboxyl groups. Thus, the question is will similar moieties influence the membrane in a similar way for different drugs?
To find out the answer, we have compared the interaction of these drugs with a model liposomal membrane consisting of DPPC and DPPC:CL 80:20 (weight%). DPPC liposomes at room temperature are in a gel-like state [
23] and are considered as neutral liposomes due to phosphate groups shielded by choline moiety. DPPC:CL liposomes, like DPPC ones, are in a gel-like state [
24], but possess clear anionic charge on the surface. This difference will be useful to discover the role of the heterocycle of Lev and Rif in the drug interaction with a membrane. On the other hand, an ordered gel-like membrane is a relevant system for detecting the interaction of large molecules of Rapa and Rif with the depth of the bilayer.
Thus, in this work, we investigate the mechanism of interaction of three drugs: levofloxacin, rifampicin and rapamycin with neutral and anionic liposomes. We considered levofloxacin as a small molecule with ionogenic groups, rapamycin is a hydrophobic molecule without ionogenic groups and rifampicin has structural elements similar to both levofloxacin and rapamycin.
2. Materials and Methods
2.1. Materials
Levofloxacin, rapamycin and rifampicin were obtained from Sigma-Aldrich (St. Louis, MO, USA); DPPC, cardiolipin were obtained from Avanti Polar Lipids (Alabaster, AL, USA). Sodium phosphate buffer tablets for solution preparation were obtained from Pan-Eco (Moscow, Russia). CHCl3 was obtained from Reakhim (Moscow, Russia).
2.2. Liposomal Forms of Drug Preparation
Liposomal Rif (LRif), Rapa (LRapa) and Lev (LLev) in neutral gel-like DPPC and anionic gel-like DPPC:CL liposomes were obtained by a passive loading technique. Briefly, a solution of lipids in chloroform was taken in the desired ratio (DPPC or DPPC:CL 80:20 weight%). CHCl3 solvent was carefully removed on a vacuum rotary evaporator at a temperature not exceeding 55 °C. The lipid film was dispersed with 0.02 M sodium phosphate buffer solution, pH 7.4, containing levofloxacin or rifampicin (4 mg/mL and 2.5 mg/mL, correspondingly). The resulting suspension was treated with ultrasound (22 kHz) for 600 s (2 × 300 s) in continuous mode with constant cooling on a 4710 “Cole-Parmer Instrument” disperser (Vernon Hills, IL, USA). Free drug was separated by dialysis against sodium phosphate buffered saline (Serwa MW cut-off 3500) for 2 h, followed by determination of the drug encapsulation efficacy into the vesicles.
For Rapa, we modified the loading procedure and added Rapa chloroform solution to the lipid’s solution, then evaporated CHCl3 and added an extra stage: sonication in a US bath for 5 or 10 min for better embedding of the drug. Briefly, lipid solution in chloroform was injected with a solution of rapamycin in chloroform of 0.5 mg/mL, then CHCl3 solvent was carefully removed on a vacuum rotary evaporator, and the lipid film was dispersed with 0.02 M sodium phosphate buffer pH 7.4. Free rapamycin was separated by gel filtration followed by determination of the efficiency of incorporation of rapamycin by the method of reverse phase high-performance liquid chromatography with a Knauer C18 column (4.6 × 150 mm) (Berlin, Germany). The mobile phase contained acetonitrile and ammonium acetate buffer (pH 5.8) in a volume ratio of 70:30 with a flow rate of 1.5 mL/min. The sample volume was 150 µL, the product was detected by absorption in the UV region of 278 nm.
2.3. DLS Measurements
Determination of the size and zeta-potential of vesicles was carried out using a Zetasizer Nano S Malvern (Malvern, England, UK) (4 mW He–Ne laser, 633 nm) in a thermostatted cell at 22 °C. The Malvern software was used.
2.4. UV–Vis Spectroscopy
UV spectra of levofloxacin and rifampicin were recorded on an AmerSharm Biosciences UltraSpec 2100 pro UV–visible spectrometer (Amersham, UK) in the range from 200 to 400 nm in a 1 mL quartz cuvette from Hellma Analytics (Müllheim, Germany).
2.5. ATR-FTIR Spectroscopy
The spectra were recorded using a Tensor 27 IR Fourier spectrometer (Bruker, Germany) equipped with an MCT detector cooled with liquid nitrogen and a thermostat (Huber, Offenburg, Germany). The measurements were carried out in a BioATR II thermostatted cell (Bruker, Germany) using a single reflection ZnSe element at 22 °C and continuous purging of the system with dry air using a compressor (JUN-AIR, Redditch, UK). An aliquot (50 µL) of the corresponding solution was applied to the internal reflection element, the spectrum was recorded three times in the range from 4000 to 950 cm−1 with a resolution of 1 cm−1; 70-fold scanning and averaging were performed. The background was registered in the same way and was automatically subtracted by the program. The spectra were analyzed using the Opus 7.0 software, Bruker. When recording the ATR-FTIR spectra of liposomes loaded with drug, a solution of drug in equal concentration was used as a background solution. For phase transition studies, the temperature was controlled with a Huber thermostat in the range from 20 °C up to 55 °C. For each temperature background, spectra were recorded.
2.6. Differential Adiabatic Scanning Calorimetry
Phase transitions in liposomes were registered with a DASM-4 differential adiabatic scanning microcalorimeter (Design Bureau for Biological Instruments, Pushchino, Russia). Heating rate was 1 °C/min in the range 12–55 °C. The concentration of liposomes was 5 mg/mL, 20 mM PBS, pH 7.4.
2.7. Encapsulation Efficacy and Drug–Lipid Mass Ratio Calculation
Encapsulation efficacy of rifampicin (λ = 470 nm) and levofloxacin (λ = 295 nm) was calculated with a material balance according to the formula:
For rapamycin, the formula was the same except for the following: instead
, we have used
, calculated from HPLC (
Section 2.2).
Drug–lipid mass ratio for all drugs was calculated according to the following formula:
3. Results
3.1. Characterization of Liposomal Forms of Drugs
We have obtained liposomal Rif (LRif), Rapa (LRapa) and Lev (LLev) in neutral gel-like DPPC and anionic gel-like DPPC:CL liposomes and characterized them with encapsulation efficacy (EE, % by means of UV–Vis) and size and ζ-potential (
Table 1).
For LRif and LLev, no significant changes in Dh (hydrodynamic diameter) and ζ-potential were found in comparison with control vesicles of both compositions. LRapa samples possessed smaller Dh than other samples, probably because of the extra stage of sonication.
When it comes to encapsulation efficacy, for all samples, no significant differences between DPPC and DPPC:CL liposomes were observed. On the other hand, for LRapa, the prolonged sonication stage undoubtably provided a higher value of EE (
Table 1).
We have already published a detailed study of the interaction between Lev and liposomal membranes [
25]. Here, we are interested in comparison data on the mechanism of interaction between drugs and membranes for LLev, LRapa and LRif. One of the most informative methods to study it is ATR-FTIR spectroscopy, providing a wide range of information on the microenvironment of lipid functional groups [
8,
26].
3.2. Mechanism of Interaction between Rifampicin and Liposomal Membrane as Revealed by ATR-FTIR Spectroscopy
On the typical ATR-FTIR spectrum of liposomes, a few bands are the most informative, providing valuable data on the microenvironment of functional groups; changes in the position, shape and intensities could be analyzed to disclose the main binding sites and evaluate key points of the nature of interaction.
Intensive bands of asymmetric and symmetric valence oscillations of methylene groups ν
as(CH
2) at 2917–2925 cm
−1 and ν
s(CH
2) at 2850–2852 cm
−1 are sensitive to changes in lipid packing in bilayer [
27]. Bands of carbonyl groups ν(CO) at 1720–1750 cm
−1 and phosphate groups ν
as(PO
2−) at 1220–1260 cm
−1 are usually multicomponent: high-frequency components correspond to lower-hydration groups, and low frequency to high hydration [
28]. Both of these bands are sensitive to the interaction of the membrane with polar ligands [
29,
30]
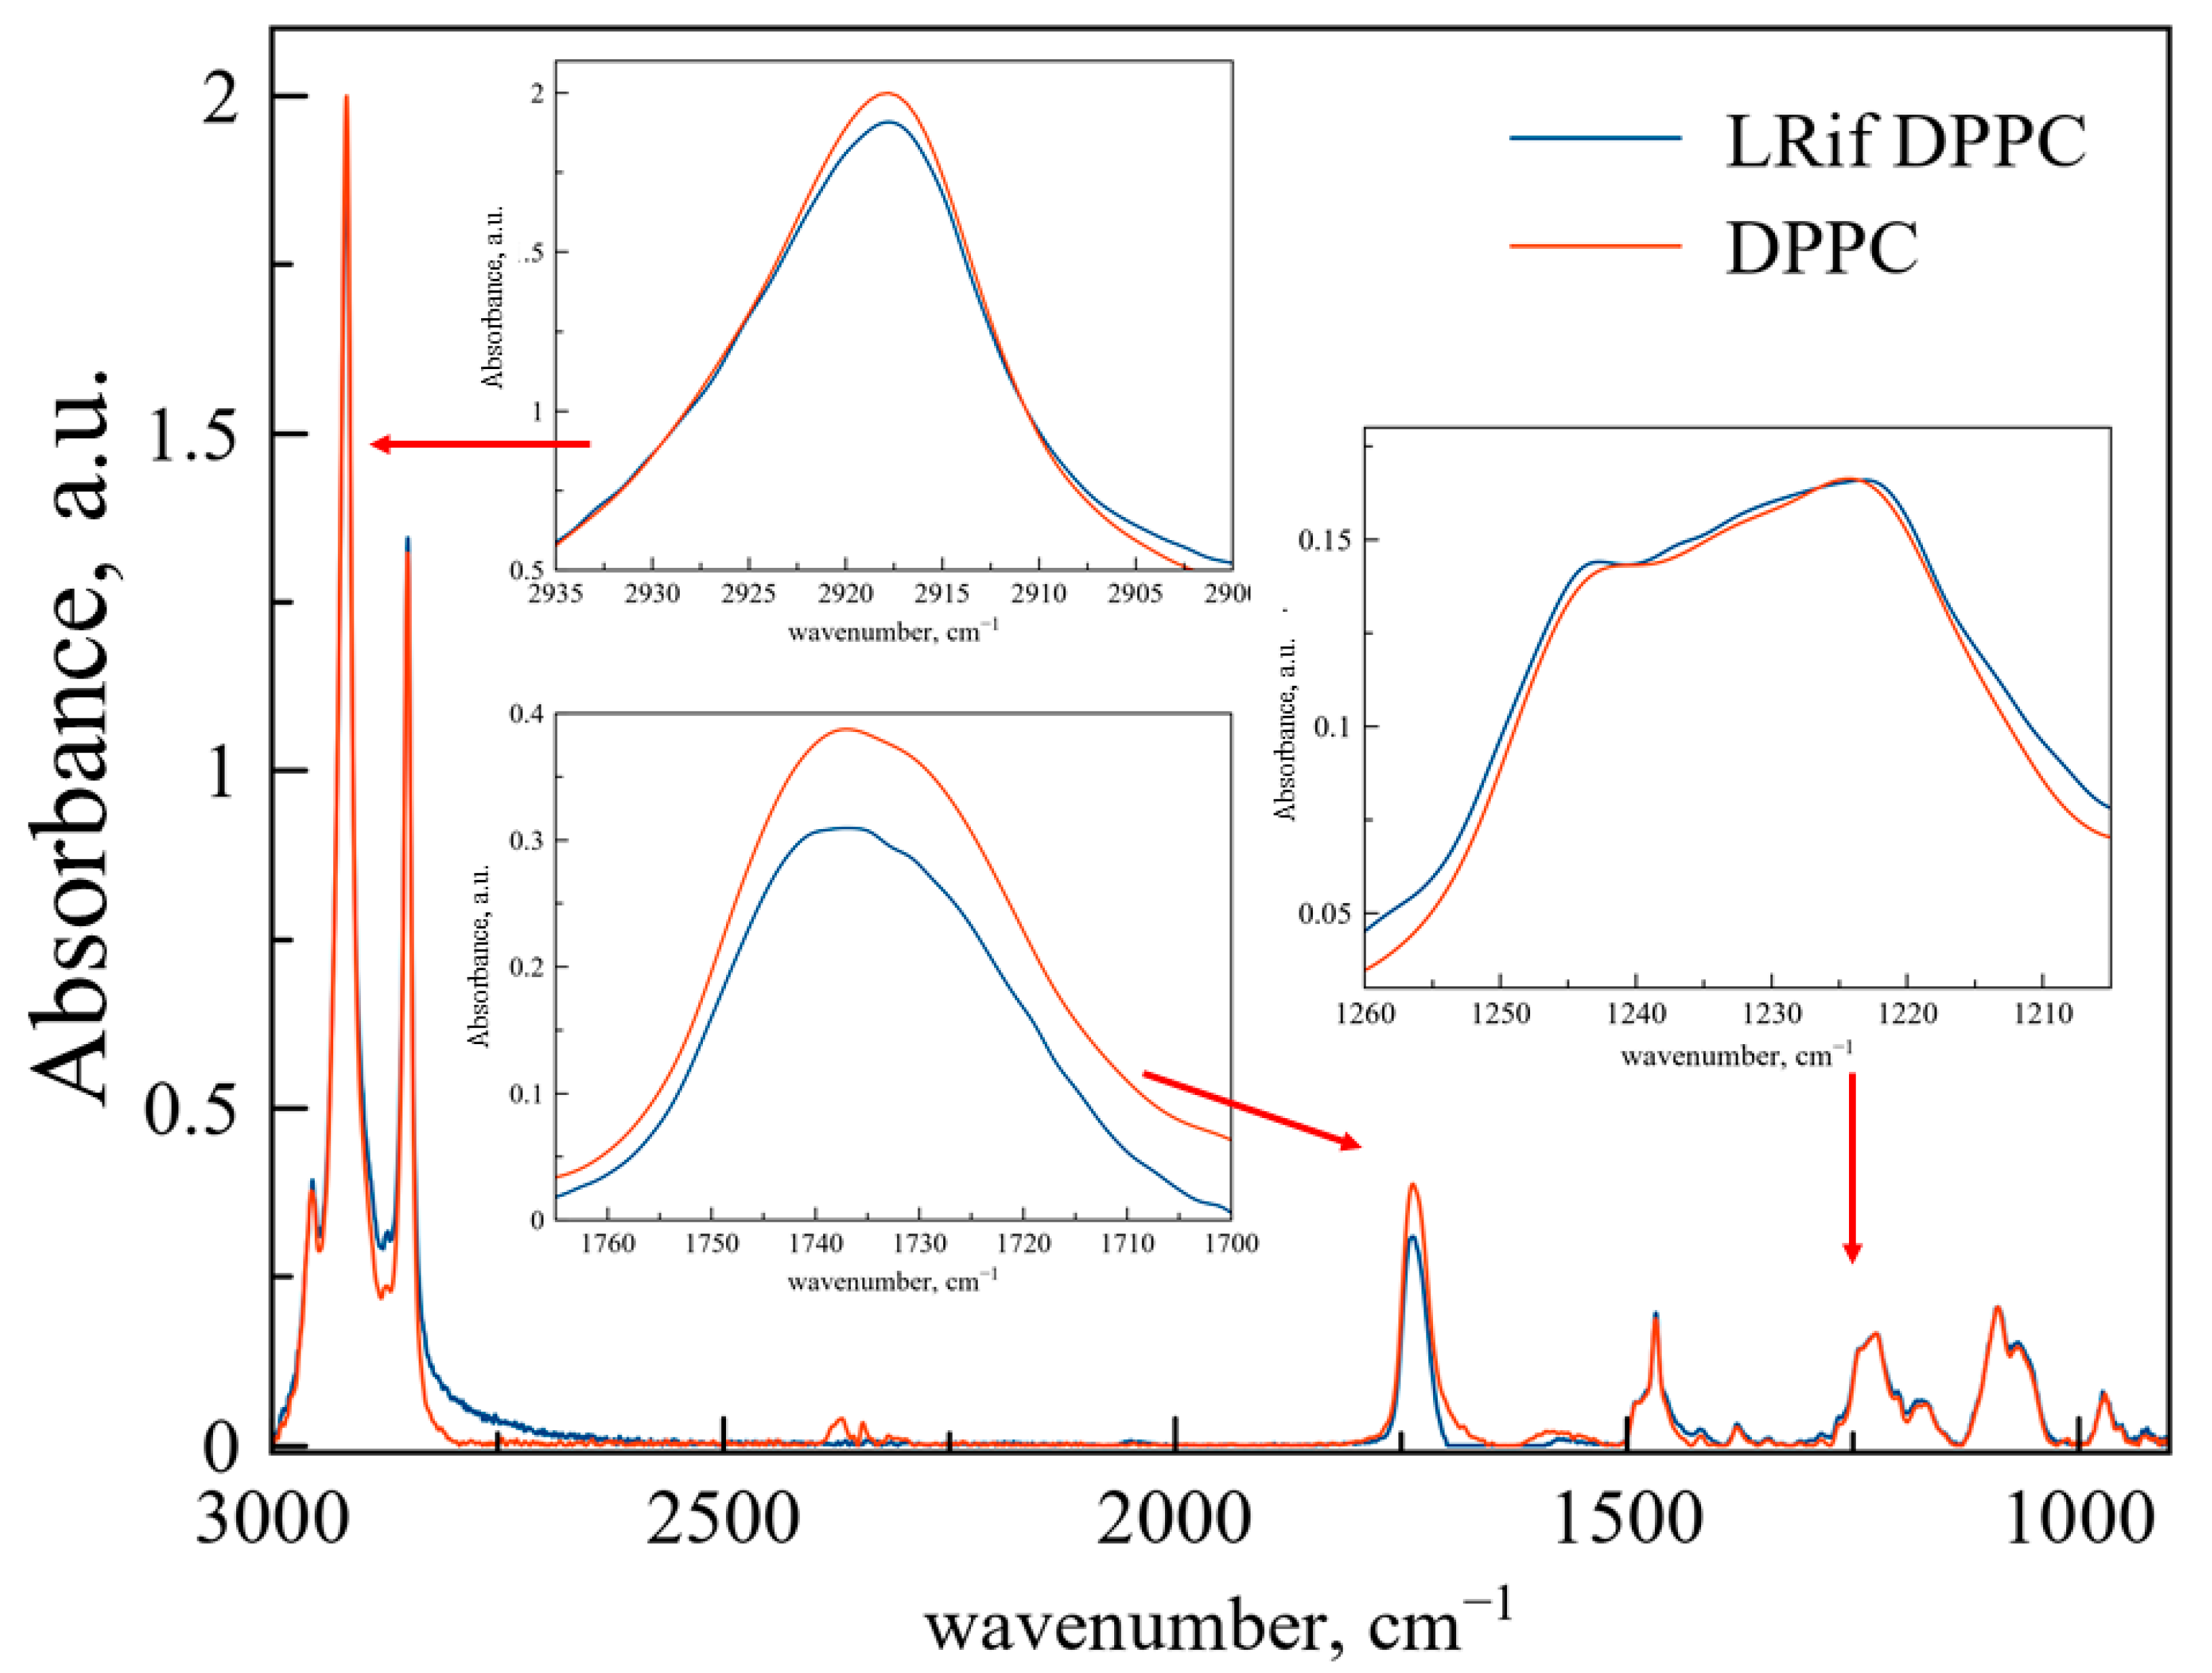
Figure 2 represents ATR-FTIR spectra of DPPC liposomes (red line) and DPPC-based LRif (blue line). In the insets, the main bands are scaled up for better representation and peak positions are presented in
Table 2. According to the shape and positions of these bands, we propose no significant changes in the microenvironment of CH
2 groups, indicating no penetration of Rif into bilayer depth. Only slight changes are detected for phosphate groups, indicating very small or even the absence of electrostatic interactions of polar head groups of lipids and Rif [
28]. For ν(CO), we have detected the manifestation of a 1730 cm
−1 shoulder, indicating small perturbation of this area of the bilayer in the presence of Rif [
29] and the formation of a new population of medium-hydrated carbonyl groups. To sum up, interaction of Rif with the DPPC membrane is weak and does not lead to any significant changes in the bilayer at room temperature.
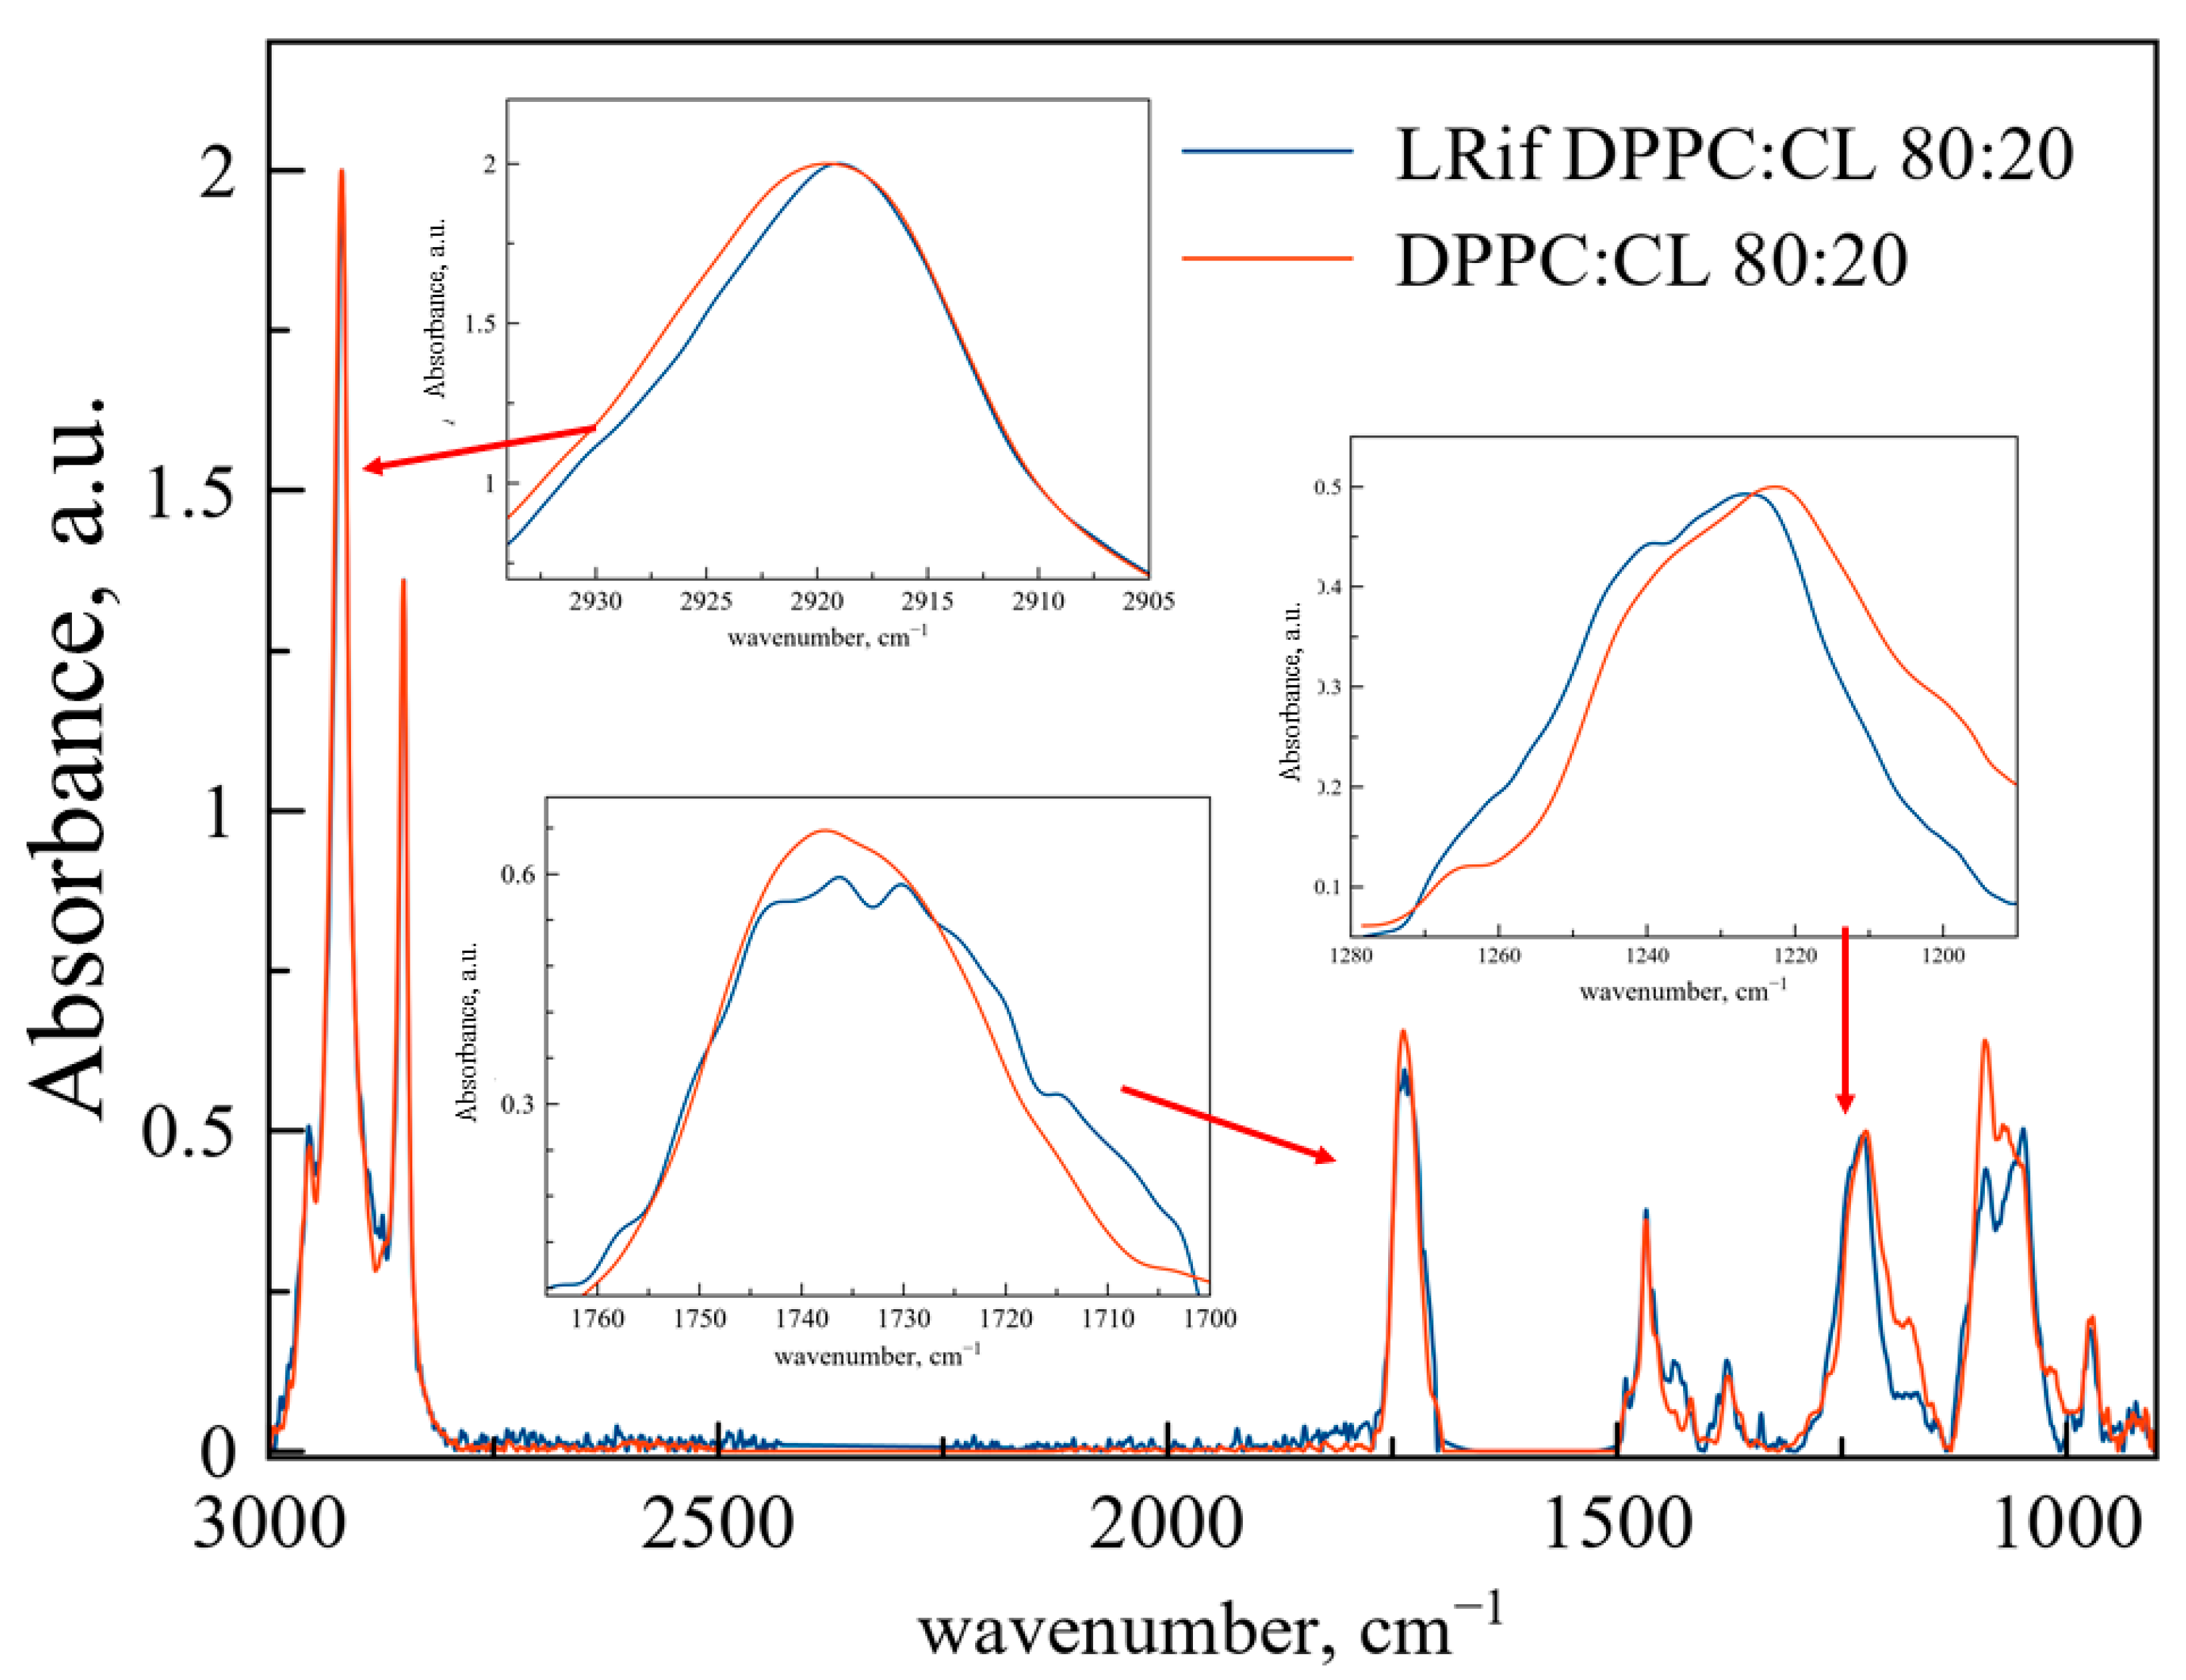
On the contrary, interaction between Rif and DPPC:CL liposomes is more dynamic (
Figure 3). Changes in the area of ν
as(CH
2) are very slight and mainly represented by the broadening of the band, indicating the formation of a subpopulation of acyl chains with higher mobility, probably because of bilayer perturbation. In the area of ν(CO) and ν
as(PO
2−), changes are more clear. The ν
as(PO
2−) band shifts to the high-frequency area, indicating less hydration [
28]. These changes are typical for hydrogen bond formation, probably between the heterocycle or secondary amine of Rif and phosphate groups of cardiolipin. Formation of the band shoulder at 1240 cm
−1 is typical for low-hydration phosphate groups bounded with cationic ligands, e.g., polyelectrolytes [
31] and drugs [
32].
The absorption band of the carbonyl group splits into several pronounced components. This phenomenon is usually observed for the interaction of the included substance with only a part of the membrane, for example, with the cardiolipin-rich domain [
31]. Some of the carbonyl groups interact with cationic site of Rif, while another part remains unbounded, thus the peak splits. Previously, we observed a similar effect earlier for moxifloxacin [
32], a fluoroquinolone, which also contains a heterocycle.
Thus, at room temperature Rif interacts with mixed anionic liposomes mainly by formation of hydrogen bonds between polar groups of lipids and the heterocycle or secondary amine of the drug. Obtained data are in good agreement with previously published results from fluorescent spectroscopy [
33]. Indeed, Rif is able to bury in the membrane and interacts with the bilayer, forming electrostatic and hydrophobic interactions.
3.3. Mechanism of Interaction between Rapamycin and Liposomal Membrane as Revealed by ATR-FTIR Spectroscopy
As for rifampicin, rapamycin possesses a network of unsaturated bonds and several hydroxyl and carbonyl groups, however, Rapa is much more lipophilic and has no heterocycle or amino groups. Thus, formation of hydrogen bonds between Rapa and the anionic polar head of lipids is less probable. What kind of force, then, promotes drug incorporation into the bilayer?
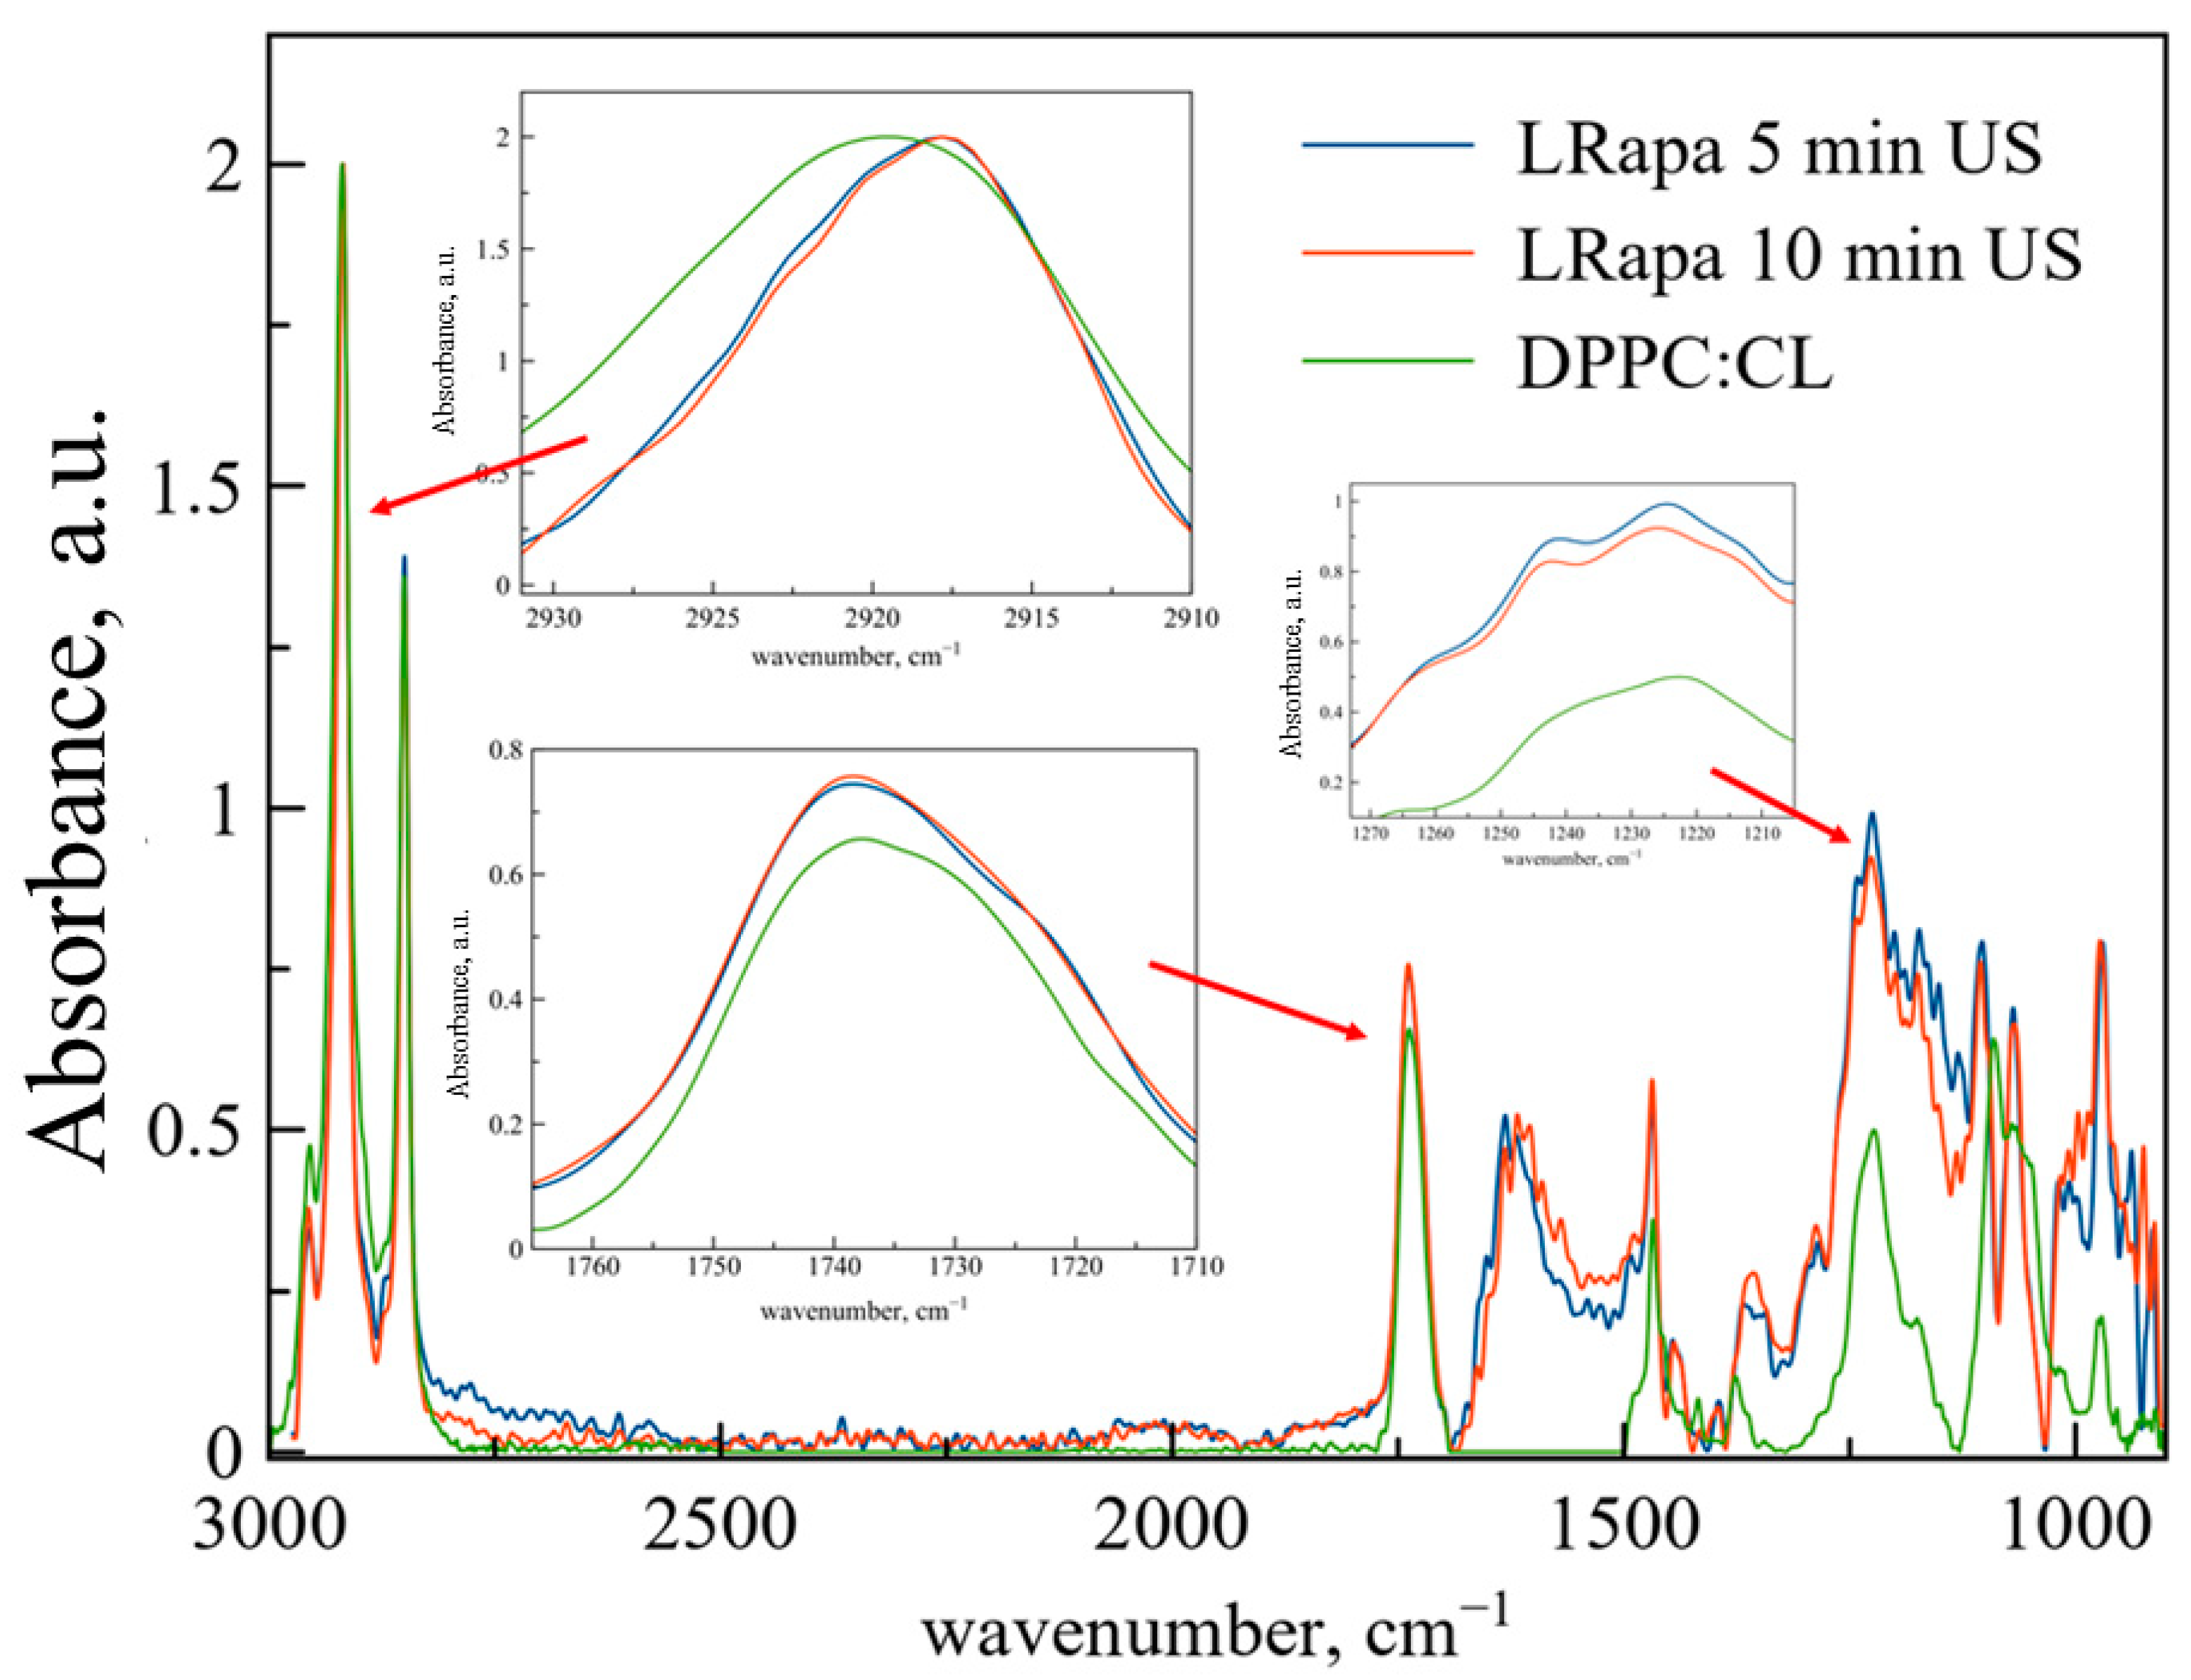
According to the data of ATR-FTIR spectroscopy (
Figure 4,
Table 3), although 10 min of sonication provides higher EE than 5 min, from the spectral point of view, LRapa structure does not depend on the duration of sonication. The most pronounced changes are detected for the area of the ν
as(CH
2) band. Rapa incorporation into the bilayer leads to significant changes in bilayer indicating the disturbance of membrane in its depth and decreasing the mobility of acyl chains. This phenomenon was observed previously for rough polymers able to penetrate into the membrane bilayer through membranes defects [
31]. Clear and uniform changes here are caused by strong effects of bilayer perturbance along with slight changes observed for Rif. Thus, despite the similar moieties in structure, Rif and Rapa interact with the hydrophobic area of the liposome in a different way.
We have observed an unexpected phenomenon: when Rapa is embedded into the bilayer, both ν
as(CH
2) and ν
as(PO
2−) undergo shifts while the ν(CO) band remains unchanged. The major part of the published data on the interaction of Rapa with bilayers indicates that the drug interacts with the hydrophobic area of the membrane [
18,
34,
35], however, such a big molecule is also able to disturb the hydrophilic area by causing relocation of individual lipid molecules. Thus, due to the analysis of spectral data, it was possible for the first time to detect a perturbation in the polar part of liposomes when rapamycin was included.
3.4. Role of Molecular Structure of Drug in the Interaction with Bilayer
Previously, we have disclosed the mechanism of interaction between Lev and DPPC:CL and DPPC liposomes; levofloxacin enters the microenvironment of the phosphate groups, displacing water, and does not move deep into the hydrophobic part of the bilayer [
25].
Here, Rif interacts with membrane in a similar way, binding mainly with the polar area of the bilayer. However, careful analysis of the spectra showed that there is a clear difference between Rif and Lev for mixed anionic DPPC:CL liposomes. Lev binds predominantly to the phosphate group, which is reflected in the spectra by the manifestation of not only the 1240 cm
−1 shoulder, but also the 1265 cm
−1 shoulder, corresponding to a low-hydration state [
25]. At the same time, the absorption band of the carbonyl group did not undergo significant changes: the appearance of the shoulder at 1723 cm
−1 indicated a slight redistribution of water molecules in the subpolar layer of the membrane. On the contrary, for rifampicin, we found a milder interaction with the phosphate group: only the 1240 cm
−1 shoulder appears. However, for the carbonyl group, we observe redistribution of carbonyl groups according to degrees of hydration: a shoulder at 1742 cm
−1 corresponding to low-hydration groups was clearly distinguished. Such changes in the spectra are associated with the disruption of the hydration shell in the presence of cationic ligands and indicate the formation of non-covalent complexes [
27].
It is interesting to compare how rifampicin and rapamycin interact with the depth of the bilayer. These are large molecules with a network of unsaturated bonds, which makes them likely to be buried in the non-polar part of the membrane. However, at room temperature, rifampicin did not show affinity for the hydrophobic part of the DPPC bilayer and very slight affinity to DPPC:CL, while rapamycin predominantly interacts with it. In order to find out whether rifampicin is able to penetrate into the thickness of the bilayer during the phase transition, we investigated this process and compared thermograms for liposomal forms of rifampicin and levofloxacin.
3.5. Influence of Drug Encapsulation on the Phase Transition of Liposomes in the Example of Levofloxacin and Rapamycin
The phase state is one of the most important parameters affecting the properties of liposomes as a drug delivery container [
36]. Here, we applied ATR-FTIR spectroscopy and DSC to study the main Lβ–Lα phase transition of the liposomal membrane. In several experiments, we have found that LRapa liposomes undergo destruction during phase transition, probably because of high EE, thus, in this section, we compare Lev and Rif in terms of influence on the phase transition of lipid bilayer.
It is well known that the position of the band of ν
as(CH
2) on the ATR-FTIR spectrum of liposomes depends on the mobility of acyl chains: when the lipid bilayer becomes more disordered, the peak shifts towards higher wavenumbers [
27,
30,
32].
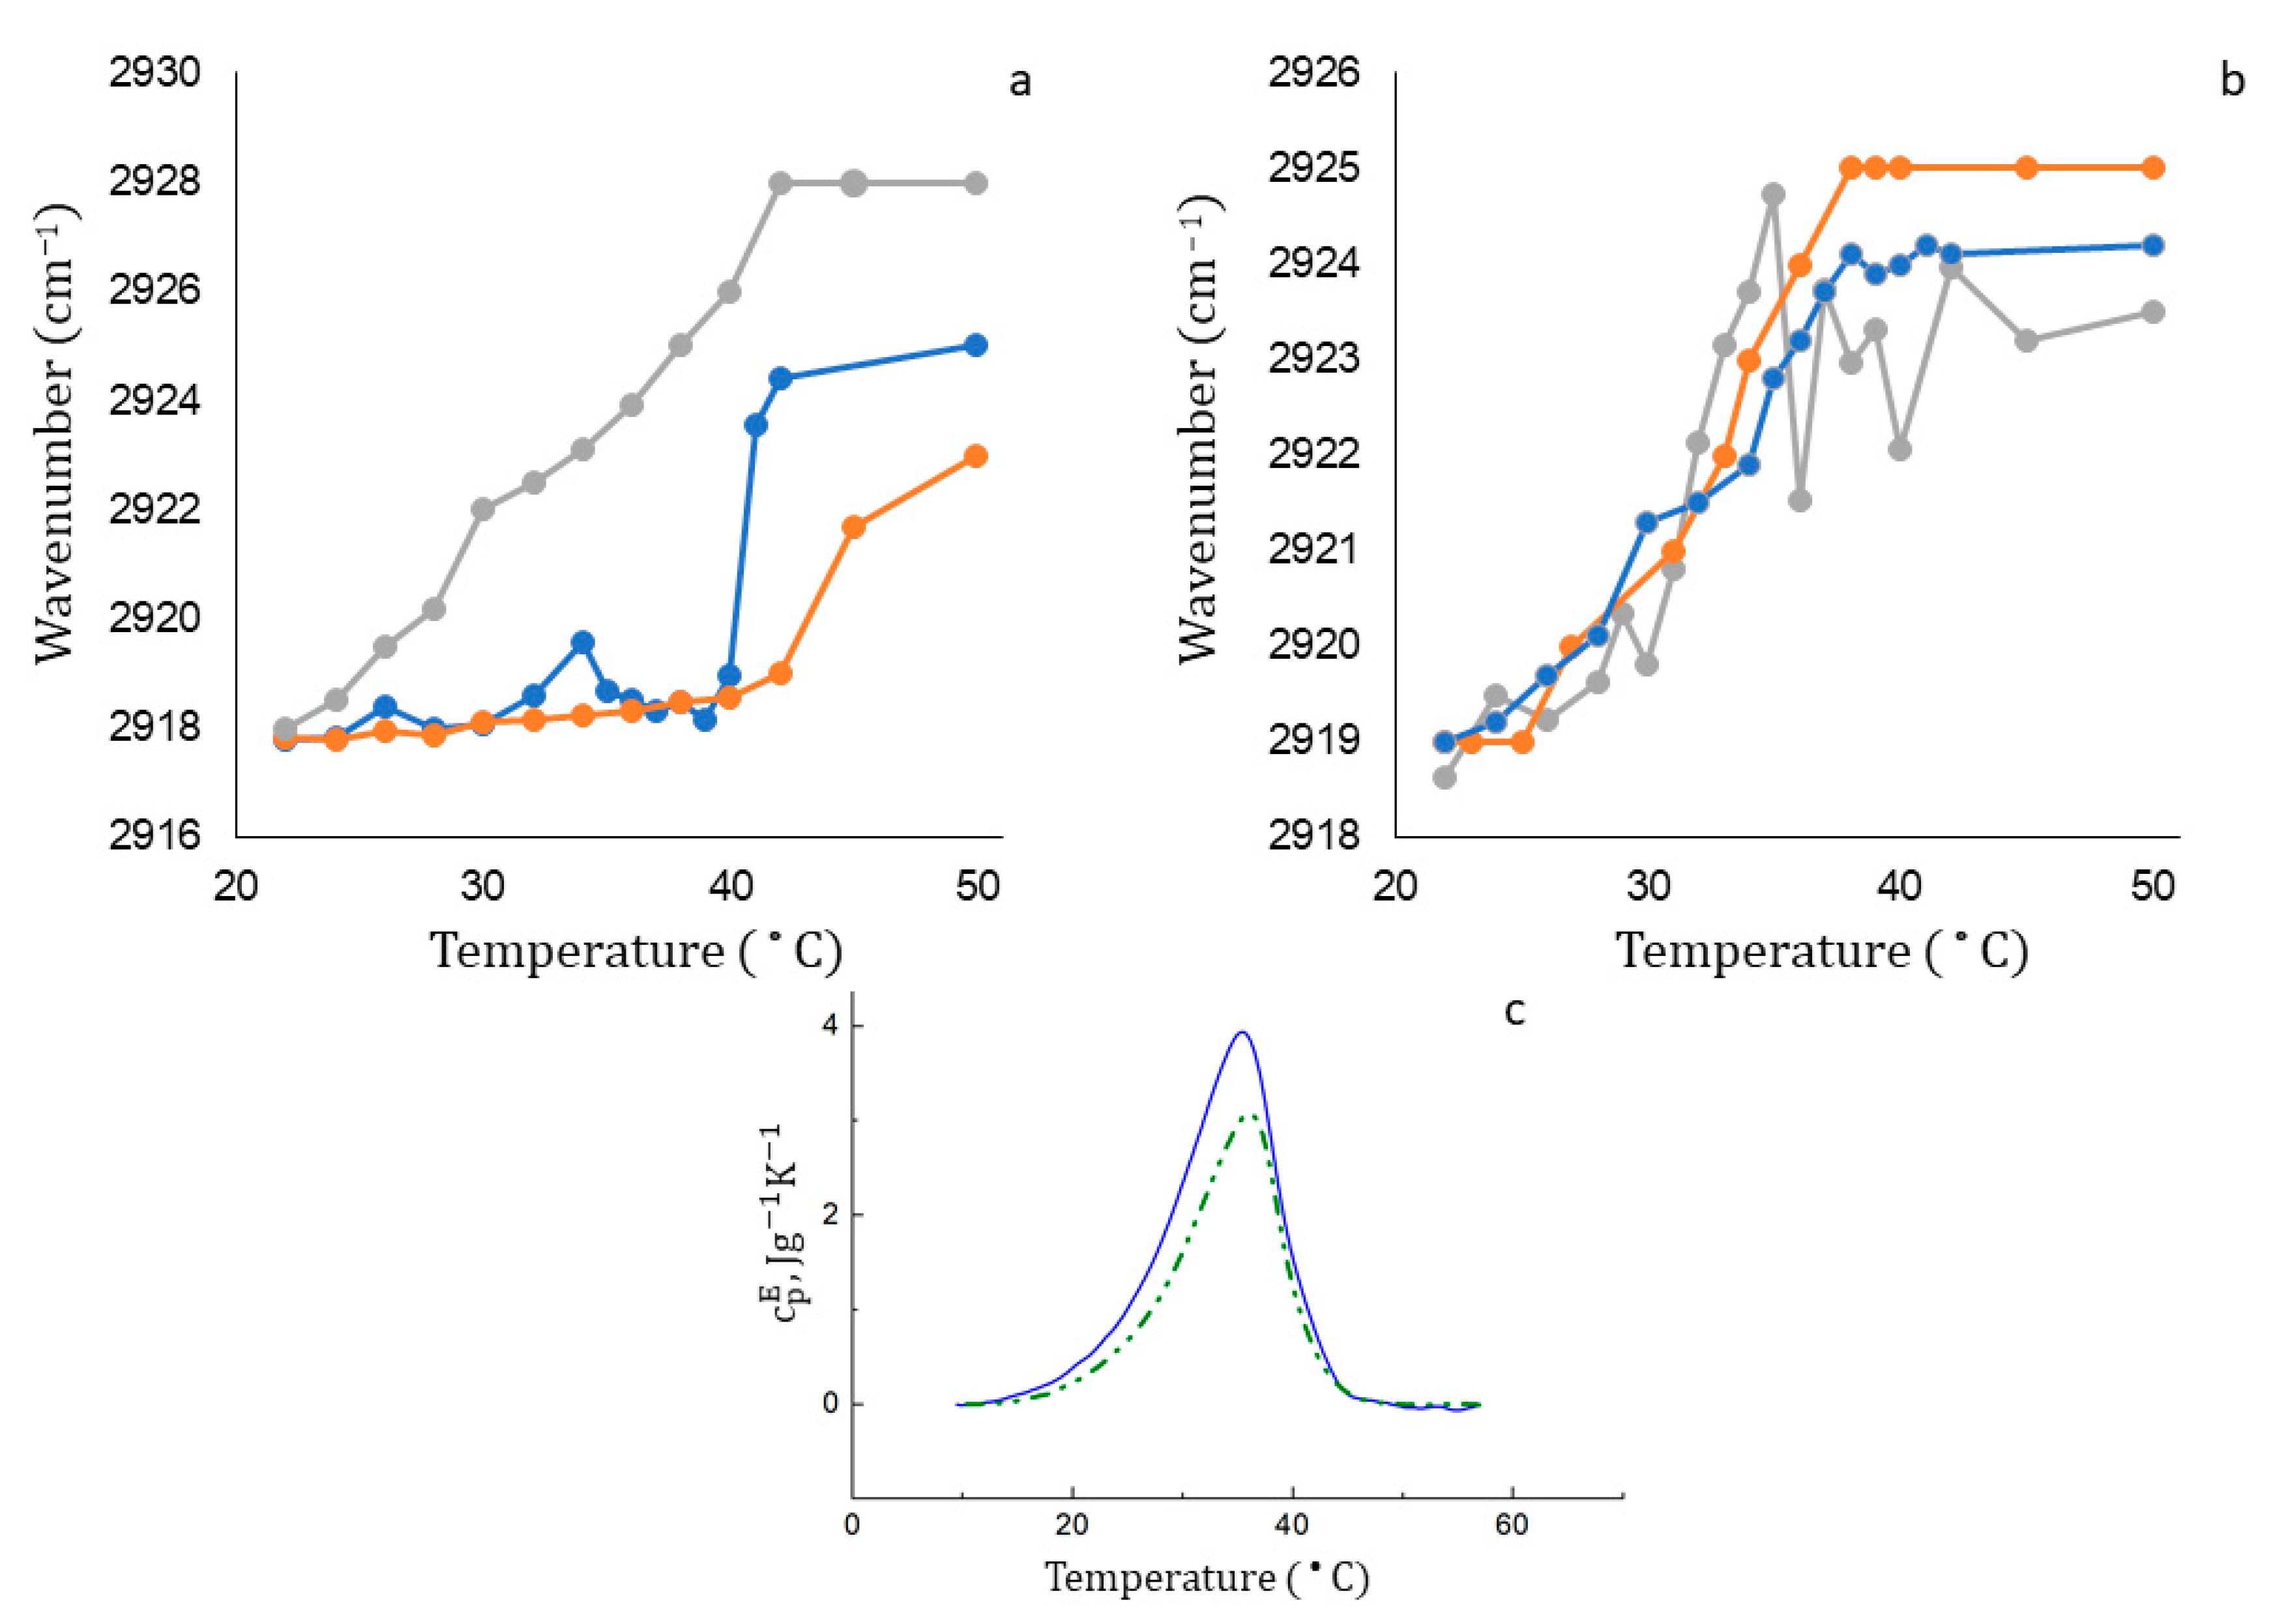
For a gel-like bilayer, e.g., DPPC:CL, ν
as(CH
2) is localized in the region of 2917–2920 cm
−1, and for a fluid membrane, this value easily reaches 2925 cm
−1 and more. For DPPC liposomes, the phase transition occurs in a narrow temperature range from 40 to 44 °C, which is consistent with the literature data (
Figure 5a, ginger line).
When DPPC liposomes are loaded with Lev (
Figure 5a, gray line) or Rif (
Figure 5a, blue line), the phase transition significantly accelerates. It is interesting to note that levofloxacin dramatically accelerates the phase transition, shifting the phase transition temperature from 42 to 38 °C, while rifampicin at the initial stage of heating causes only small perturbations in the bilayer, and a noticeable acceleration effect is observed only at temperatures above 40 degrees. This is a very unexpected result, because at room temperature both molecules interact with DPPC liposomes in a uniform way. The interaction is concentrated at the lipid–water interface, and the main binding sites are the carbonyl and phosphate groups of lipids. What could be the reason for such a different behavior of active molecules in a bilayer during a phase transition? We assume that this effect is associated with different lipophilicity of the preparations. Probably, the much more lipophilic rifampicin enters the thickness of the bilayer and only slightly affects the phase transition at the initial stage. Indirectly, this rearrangement is indicated by a small but reproducible peak on the thermogram at a temperature of about 33 °C. Lev, on the contrary, having no affinity for the hydrophobic part of the bilayer, when heated, is probably released from liposomes, thereby contributing to the disordering of the membrane.
The phase transition for DPPC:CL 80:20 liposomes (
Figure 5b, ginger line) differs from the one for the DPPC bilayer: the main transition occurs in the range of 35–37 °C and a shoulder at 27–30 °C is observed, reflecting the coexistence of two types of mixed phases with different DPPC:CL ratios [
37]. The melting of domains consisting only of electrically neutral DPPCs (at T = 41 °C) is absent in the thermogram, since at 40 °C the phase transition in this binary system has already been completed.
The curves of thermograms in the case of anionic liposomes loaded with rifampicin and levofloxacin are much closer to the control one. For rifampicin, only a slight deceleration of the phase transition is observed at temperatures above 38 °C: the curve reaches a plateau with a lower wavenumber, which indicates a lower mobility of hydrophobic chains. It is possible that the incomplete release of rifampicin is accompanied by its partial anchoring in the bilayer, which is reflected by reduced membrane fluidity. Levofloxacin contributes to more disorder in the membrane compared to Rif: in the active phase transition interval, from 30 °C to 40 °C, we observed reproducible oscillations in the position of the absorption band, which may be due to the interaction of Lev with the two main domains of the bilayer. Hydrophobic interactions with acyl chains increase mobility by disturbing the order of the bilayer. At the same time, electrostatic interactions of Lev with CL allow the formation of complexes with phosphate and carbonyl groups in the polar part of liposomes.
Do these perturbations significantly affect the thermodynamic parameters of the membrane phase transition? We have studied the process by means of DSC (
Figure 5c,
Table 4). The phase transition in the DPPC:CL liposomes is characterized by a rather broad peak with a maximum at 36.4 °C. The peak slightly shifts by 0.4 °C when the drug is turned on, which means that the phase transition temperature remains the same. Moreover, the phase transition range decreases insignificantly and the enthalpy of the phase transition decreases.
When heated from 22 °C to 30 °C, the mobility of the acyl chains increases, which makes the bilayer more fluid. More phosphate and carbonyl groups are opened for interaction with Lev. The active penetration of drug into the subpolar region of the bilayer causes a “freezing” of the mobility of hydrophobic tails, which is expressed in a decrease in the integral fraction of highly mobile chains. Thus, despite a common heterocycle moiety, Lev and Rif interact with the bilayer in a different way, especially when it comes to the physiological temperature.
4. Conclusions
In this work, we investigated the nature of the interaction of small organic drug molecules with lipid membranes of various compositions. For rifampicin and levofloxacin, the main binding sites were phosphate and carbonyl groups of lipids, and in the case of anionic liposomes containing cardiolipin-rich and cardiolipin-poor domains, we found a slight penetration of rifampicin into the hydrophobic part of the bilayer. For rapamycin, experimental confirmation of the localization of the molecule in the region of fatty acid chains was obtained, and perturbation in the region of phosphate groups was demonstrated for the first time.
The process of phase transition of liposomal forms of rifampicin and levofloxacin was studied. The key role of lipid composition has been discovered: DPPC liposomes accelerate the phase transition when loaded with a drug. On the contrary, DPPC CL liposomes are less susceptible to changes in the phase transition rate, however, due to the presence of domains, bilayer perturbations are observed in the process, especially pronounced for the liposomal form of levofloxacin. Changes during the phase transition were also confirmed using the DSC method.
The data obtained can be useful for a deeper understanding of the mechanisms of interaction between drugs and lipid bilayers and open up new prospects for the design of drugs, considering their effect on cell membranes.

 ,
, 


