1. Introduction
An object exhibiting self-similar structures at different length scales is known as a fractal. Several systems in nature are fractal, including biological tissue samples from different organs [
1,
2,
3,
4,
5]. Biological tissues have spatial heterogeneity in their mass density distribution and are a self-similar structure. This self-similar structure can be analyzed and expressed in terms of fractal dimension. The fractal dimension of an object is a number quantifying how similar the structure remains with changes in length scale and is related to the structural porosity of the tissue samples. It is now known that the fractal dimension of tissue changes with the progress of cancer [
6,
7,
8,
9,
10]. A tissue’s fractal dimension will change throughout the course of cancer progression due to the increased production and rearrangement of intracellular structures such as DNA, RNA, lipids, heterochromatin, and the extracellular matrix, which causes an increase in the mass density and rearrangement of the tissue. Because cancer progression changes a tissue’s fractal dimension, a quantitative diagnostic test can be developed based on these changes [
11,
12]. Therefore, a physics-based quantitative approach that detects structural change with the progression of carcinogenesis, in particular changes in the fractal dimension, at the earliest possible point as well as the time progression of carcinogenesis may be a potential parameter for characterization of the progress of cancer. Although several reports are measuring fractal dimensions for cancer detection, they are mainly individual cancer cases and the topic requires more exploration [
6,
10].
According to the WHO, millions of people are dying from cancer each year. Therefore, accurate detection of early stages of cancer, as well as different stages of cancer progression, is necessary for preventing this widescale mortality [
13]. Cancer arises in people due to changes in the DNA replication processes that occur during cell reproduction due to random processes. This may be due to the influence of carcinogenic chemicals, radiation exposure, or many other factors. Cancerous cells tend to reproduce themselves more rapidly than normal cells, causing a massive buildup of abnormal cells known as a tumor. These tumors inhibit the normal bodily functions of the organs they reside in and then can spread through the bloodstream or immune network to several vital organs such as the lungs, brain, liver, etc., resulting in a potentially fatal outcome if left to grow unchecked. Currently, most cancer tests rely on a pathologist qualitatively studying a cell/tissue from a biopsy tissue/cell sample for minute structural differences or they rely on chemical methods involving exceedingly expensive and time-consuming dyes and stains [
14,
15]. Both of these methods are inefficient and potentially inaccurate due to potential bias for the staining chemical and the reliance on the observational abilities of the pathologist. Due to the high potential for human error in eye detection in conventional techniques, a more easy, quantitative, physics-based test is necessary to help detect cancer and its stage characterization.
To test the usefulness of the potential of the fractal method for cancer detection and its stage characterization, as well as to explore its universal approach of applying this method to different cancers, tissue microarray (TMA) samples from common cancer types, pancreatic, breast, colon, and prostate, were utilized. TMA samples are a method of commercially available clinical sample observation that is increasingly growing in popularity, especially for research purposes, that avoids the complicated process of collecting tissue directly from patients in hospitals. TMA consists of a glass slide containing multiple cores of consistent paraffin embedded tissue samples from the same bodily region of several human subjects of control and with varying stages of cancer. In our case, each core consists of a circular sample of tissue that is 1.5 mm in diameter and 5 μm in thickness embedded in paraffin wax to increase the sample’s shelf-life. Each slide can contain up to a hundred cores, greatly increasing the speed and high-throughput analysis at which multiple tissue samples can be processed and analyzed [
16,
17]. For the purpose of the present experiment, four different cancer TMA slides containing only 24 cores each of different cases were used. The following four cancer types were studied using TMA samples: pancreatic, breast, colon, and prostate. Pancreatic cancer was chosen due to its lethality; it is estimated that 48,220 people will die from this disease in the United States in 2021. Its mortality is due in large part to the organ’s location being difficult to reach, and because it does not display any prominent chemical changes or symptoms until the hard-to-treat late stages. Another cancer that was studied was breast cancer due to its prevalence. In 2021, it is estimated that over 281,550 women in the United States will be diagnosed with breast cancer, which is characterized by a diverse range of potential causes including radiation exposure, consumption of alcohol, and age at which a first pregnancy occurs [
18,
19]. Colon and prostate cancer, both of which have been linked to high consumption of red meat, also exhibit high rates of mortality and diagnosis rates, so they too were studied using the fractal dimension technique [
18,
20,
21]. It is estimated that, in 2021, these four cancers will be responsible for the deaths of almost 180,000 people within the United States alone [
18]. Due to either their prevalence, lethality, or combination of the two, pancreatic, breast, colon, and prostate cancers were analyzed using this quantitative method, which has the potential to become a new diagnosis method.
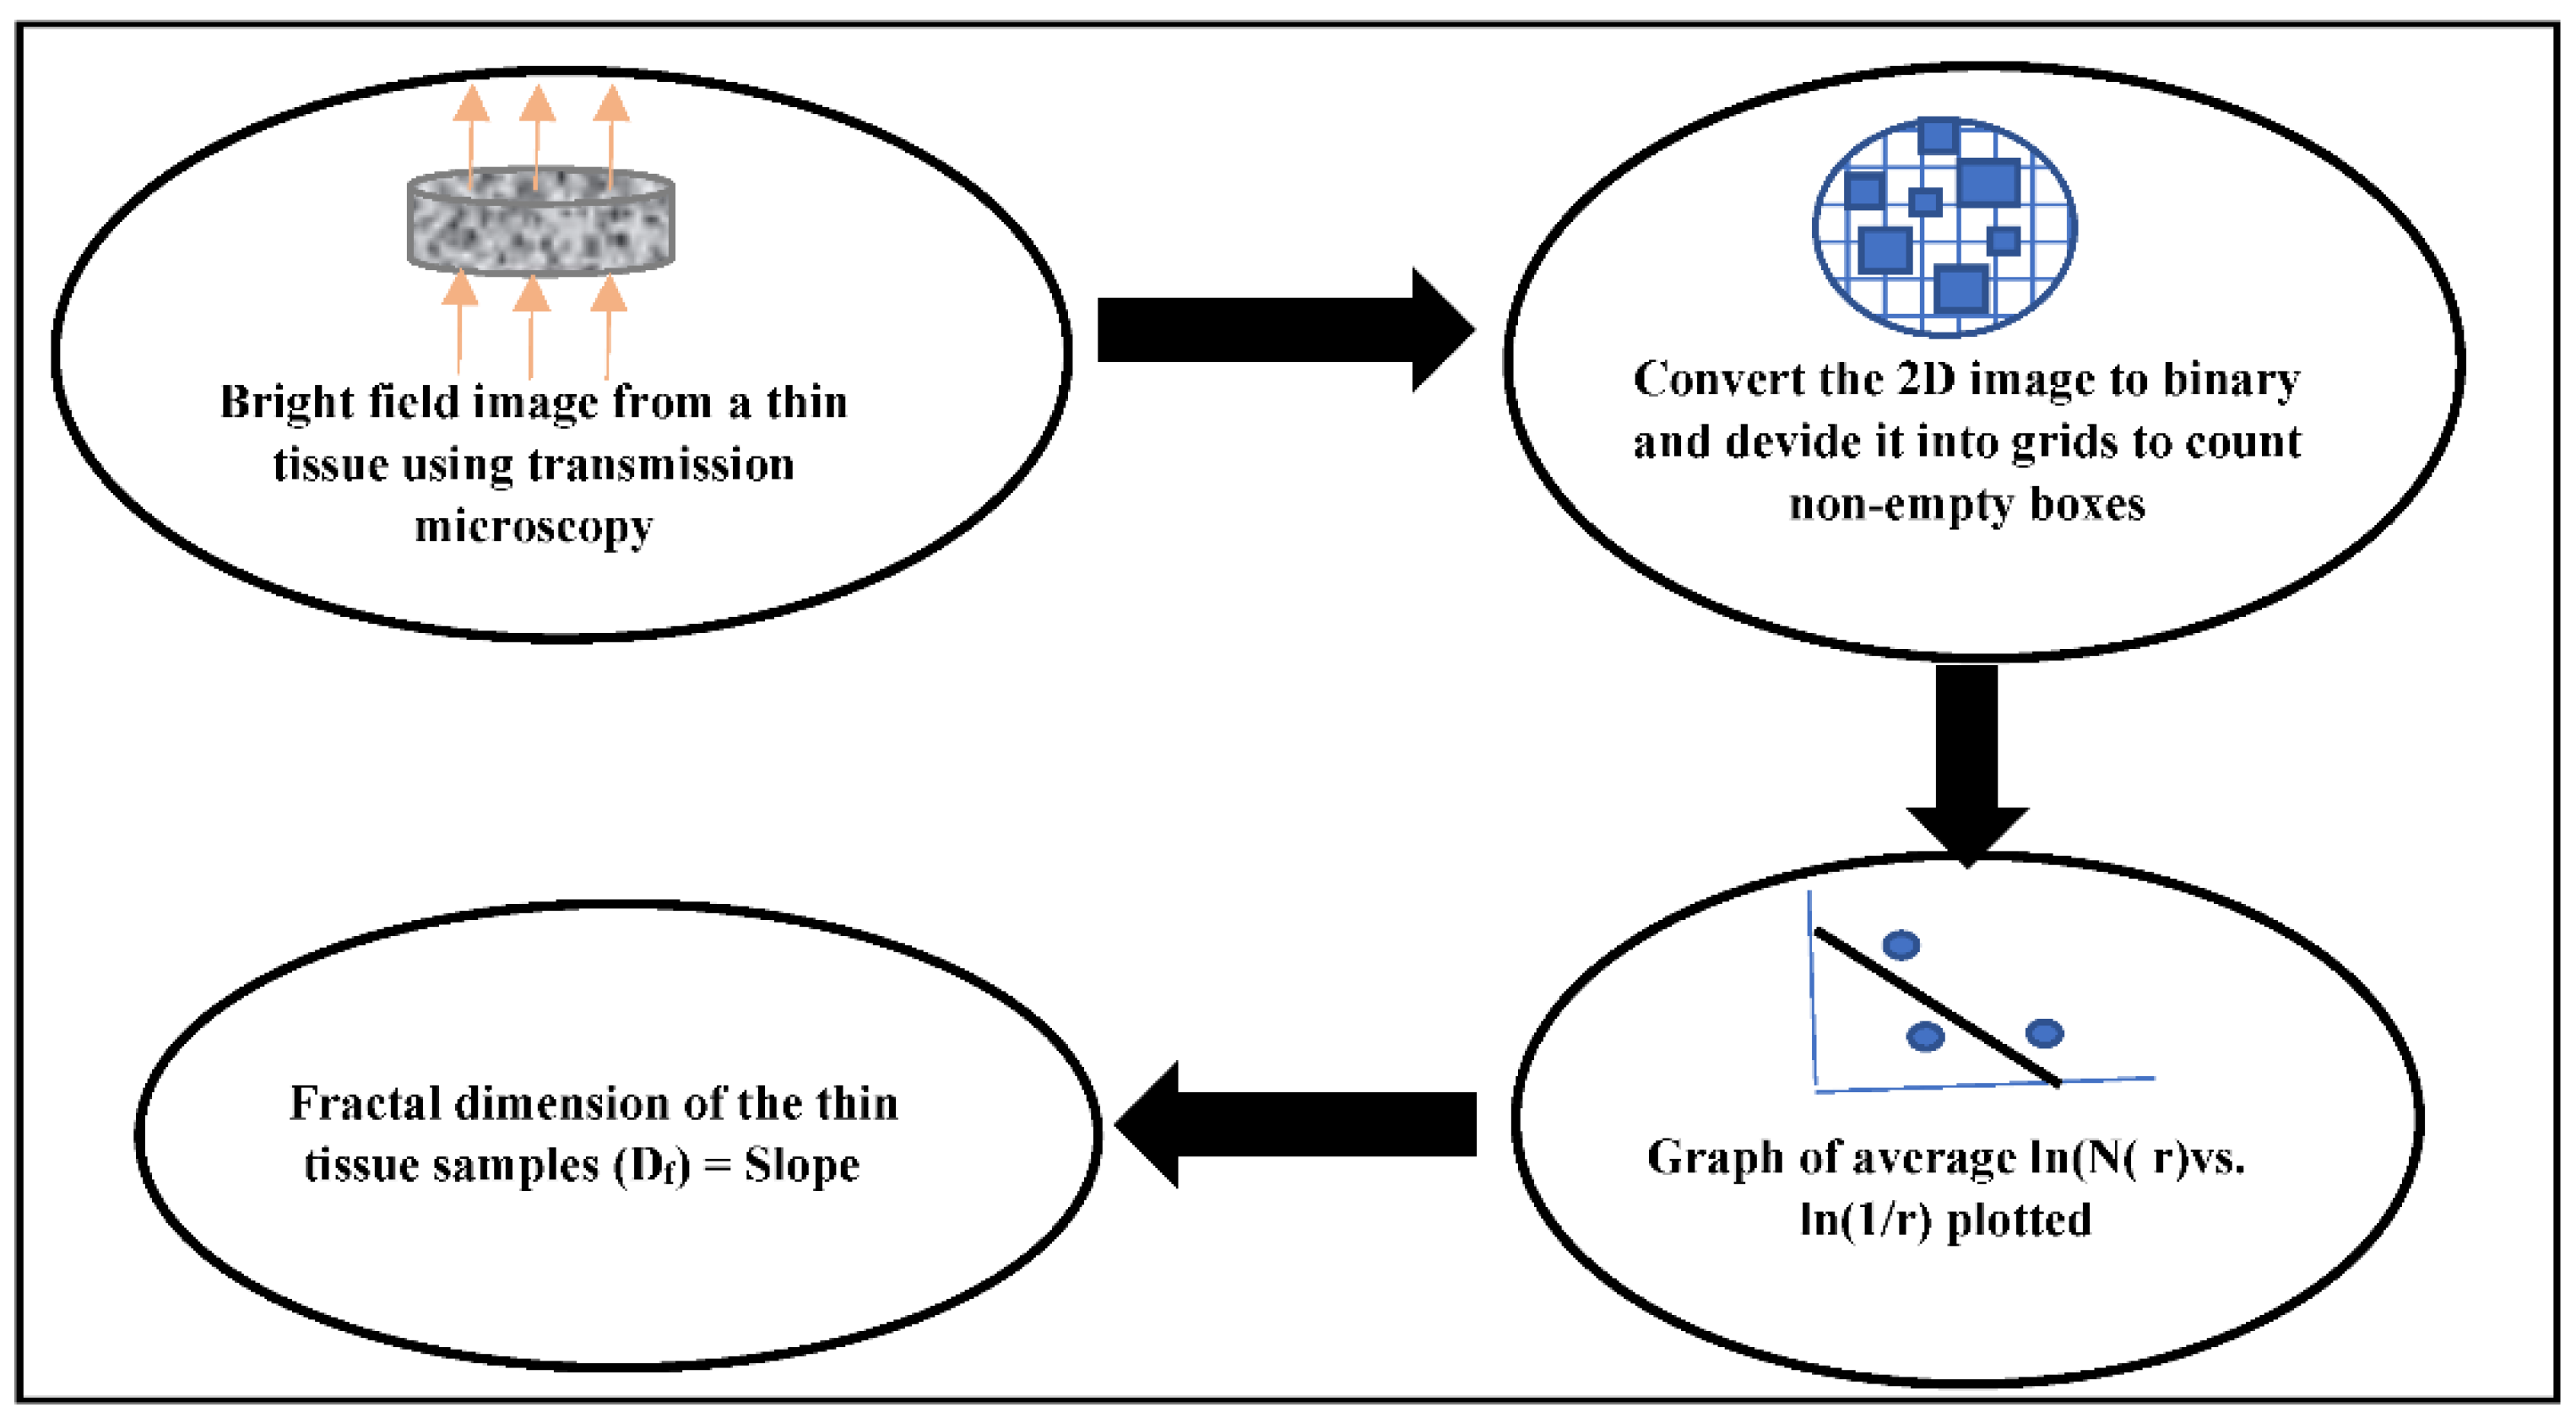
The key concepts explored in this paper are as follows: (1) the mass density structure of the tissue is fractal, which is self-similar in all length scales and has a fractal dimension. (2) The progress of cancer is associated with more mass density accumulation in the tissue and in turn leads to changes in the fractal dimension of the tissue. (3) The refractive index of tissue is proportional to its mass density; therefore, change in the tissue due to cancer progression can be probed by the optics. (4) In this study, we quantify the different stages of cancer in tissue by calculating the fractal dimension of this cancerous tissue by probing the tissue structure by a bright field transmission microscope. A flow chart for the steps are shown in
Figure 1.
3. Results
After collecting microscopic images of each sample, they are converted into binary images in
Image J. Following that, the fractal dimension analysis tool in
Image J is used to calculate the fractal dimension of each cancer stage of TMA samples, which are then graphed for comparison. As seen in the graphs, the fractal dimension for the pancreatic, breast, colon, and prostate cancer samples increases with the progression of cancer through the different stages. This increase in fractal dimension is because the presence of cancer results in a higher cell replication rate [
28]. The rate of cancerous cell replication is greater than that of normal cells due to genetic mutations. These genetic mutations also cause the cancerous cells to spread to other regions of the body at a higher rate than the normal cells [
29]. As the cells reproduce at a faster rate, the mass density of the affected tissue area increases. Since the fractal dimension of a tissue sample is dependent on this mass density, it will increase as the mass density increases due to the progression of cancer.
3.1. Pancreatic Cancer
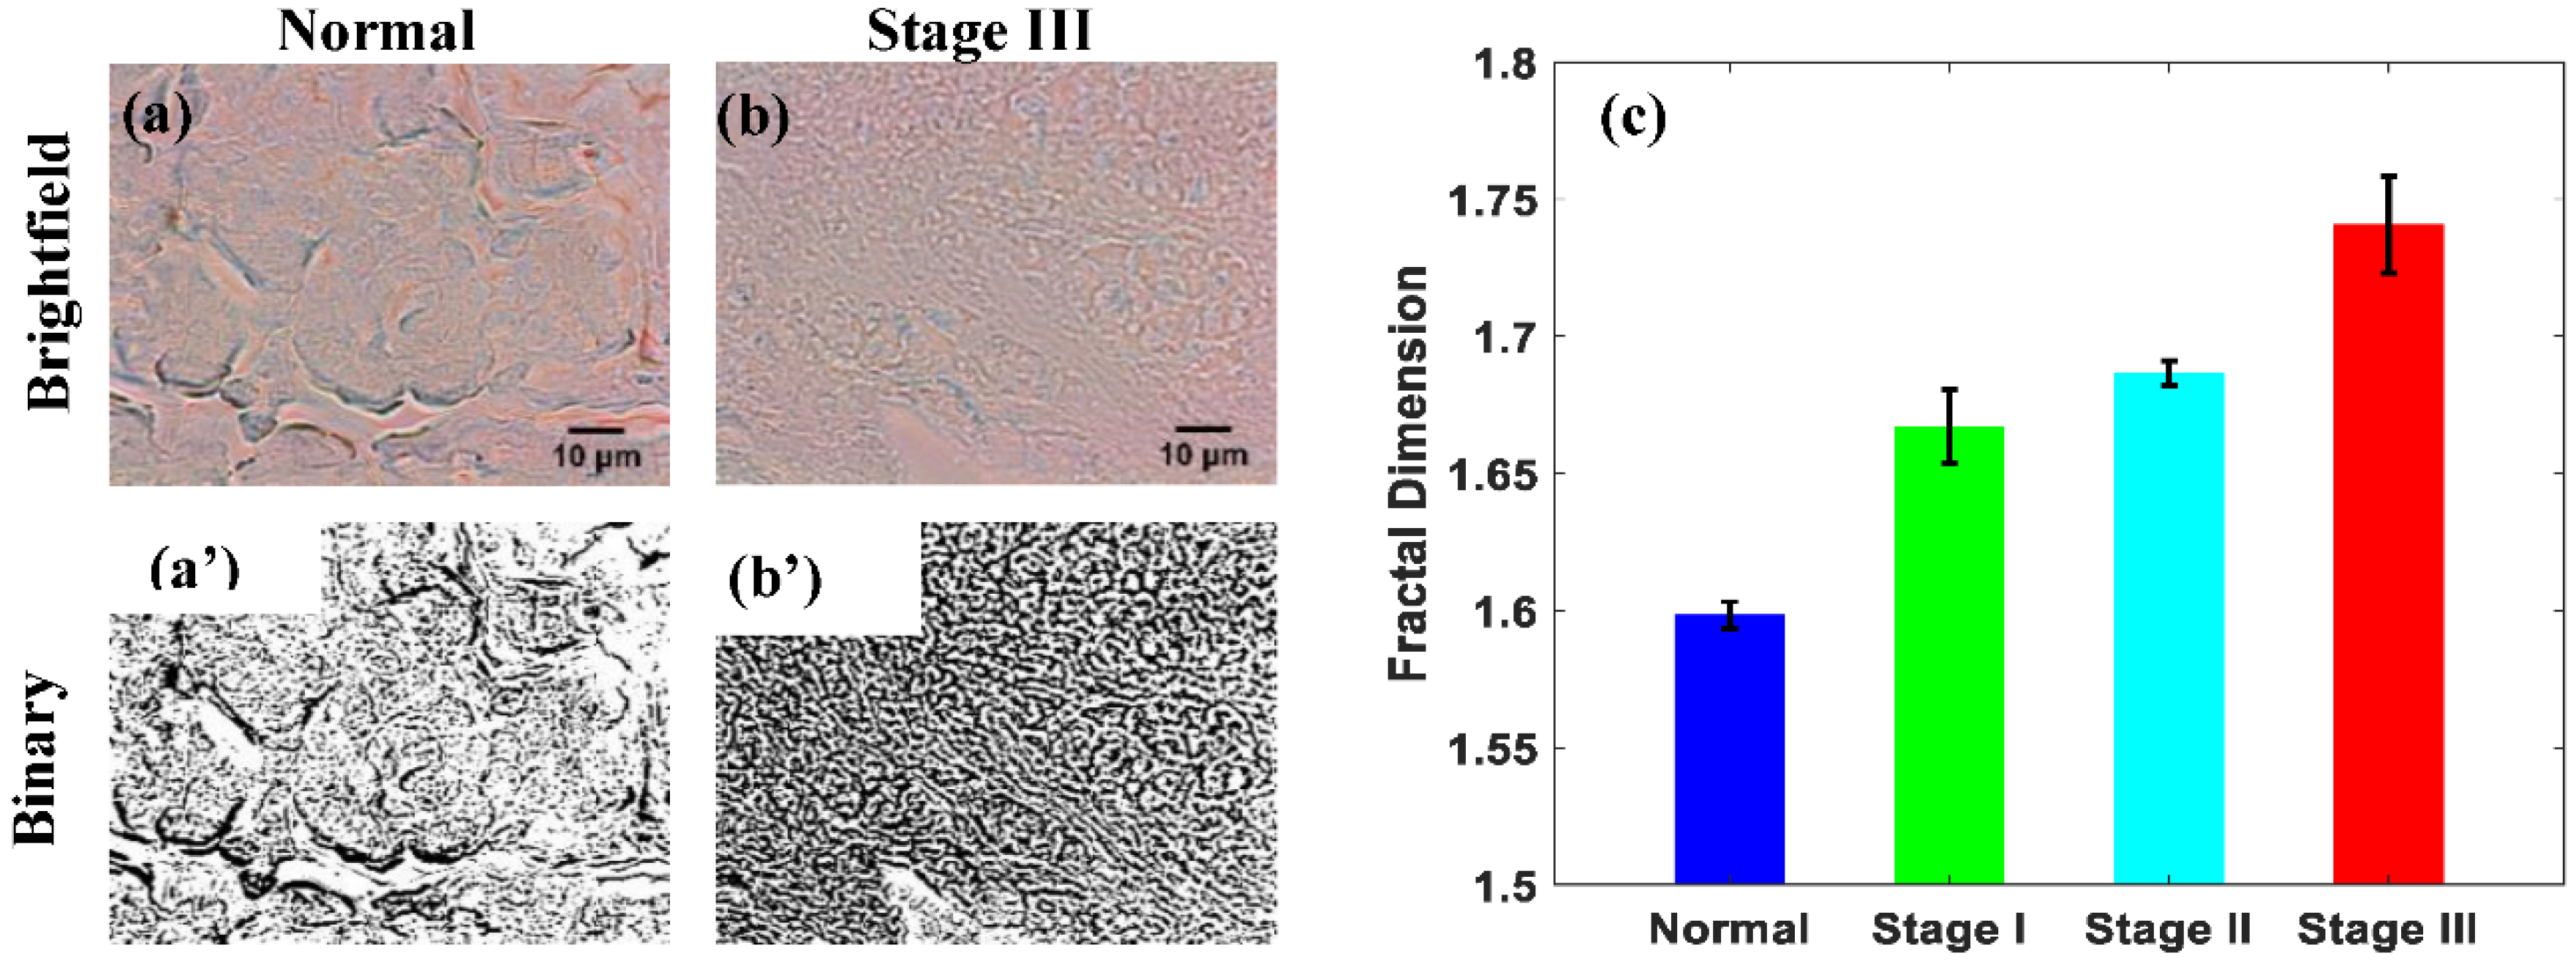
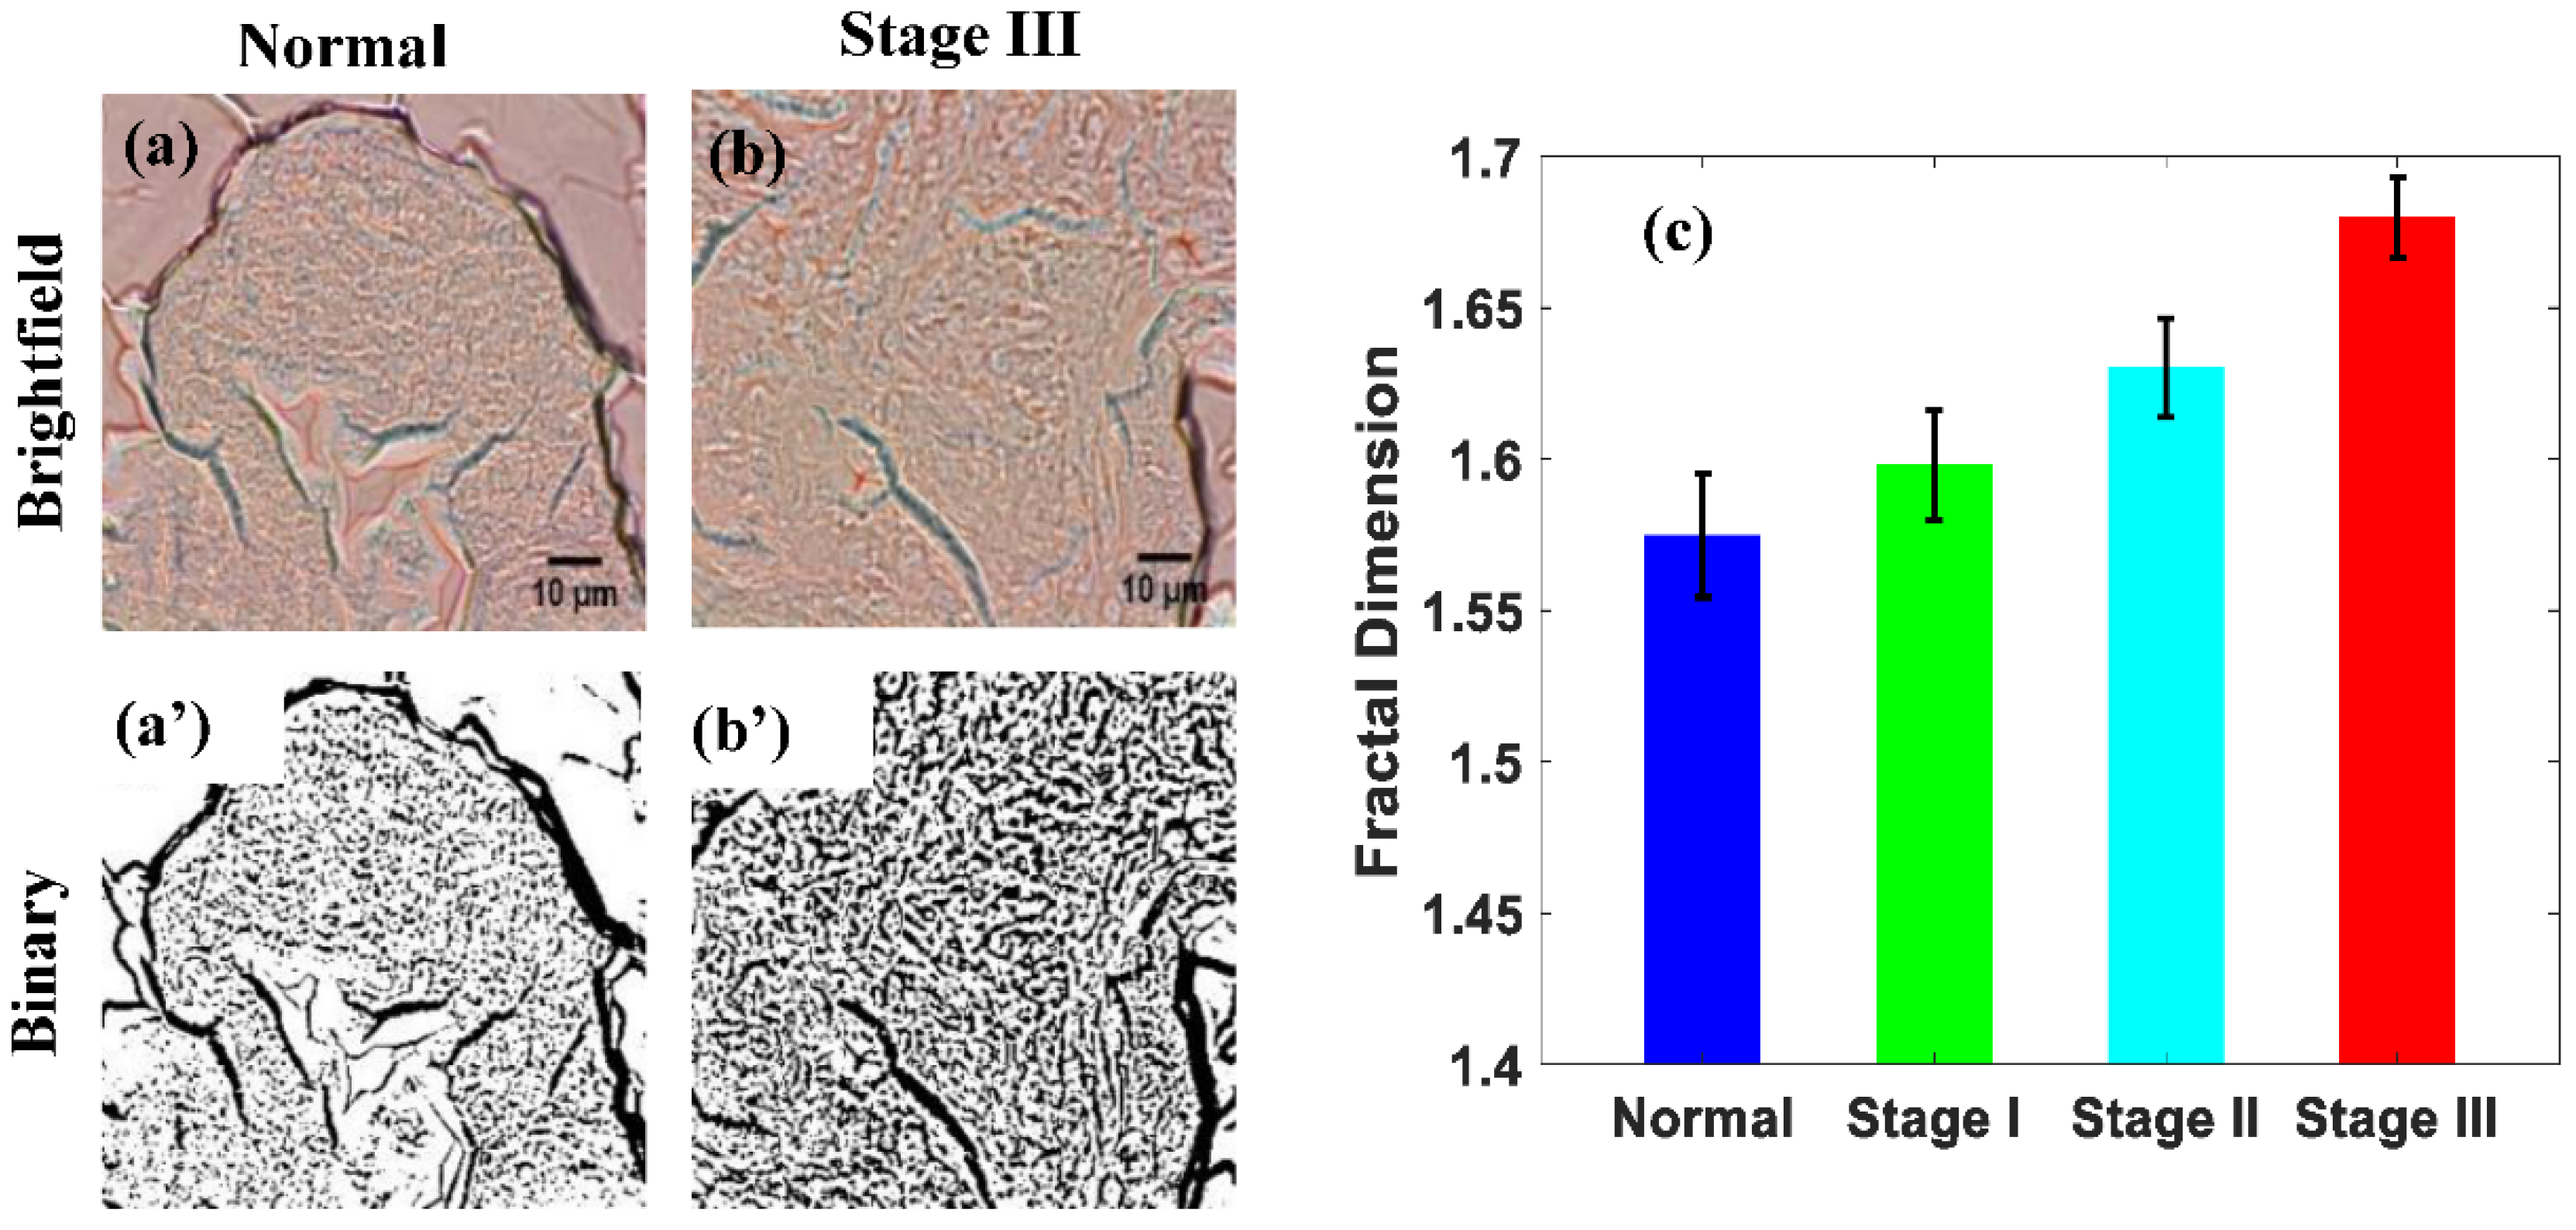
Figure 2a,b show the brightfield images of normal and stage III pancreatic tissue from a TMA sample, respectively.
Figure 2a’,b’ show the binary versions of each brightfield images. These binary images display the increased mass density distribution, which results from the progression of cancer. As seen in
Figure 2c, the normal pancreatic tissue sample had the lowest fractal dimension, while the different stages of cancer possess increasing fractal dimensions. The actual fractal dimensions for each sample are calculated to be 1.5984 for the normal, 1.6673 for stage I, 1.6866 for stage II, and 1.7407 for stage III. The percent difference between the normal and stage I sample is 4%, between normal and stage II is 6%, and between normal and stage III is 9%. This percentage increment in the logarithm scale of the fractal dimension with the increase in the stage of cancer is highly significant. These results suggest that the fractal dimension of a pancreatic tissue TMA sample increases with the progression of cancer. This is a logical outcome, as cancer is known to cause cell replication to increase, which then causes the density, and therefore the self-similarity, of cells within the tissue to increase as mentioned earlier. This results in variation to the transmission intensities from the sample, which increases the fractal dimension. Since the fractal dimension is a measure of the self-similarity of a sample, the fractal dimension of pancreatic tissue will increase with the progress of cancer. Similar results have also been observed in several other studies [
30].
3.2. Breast Cancer
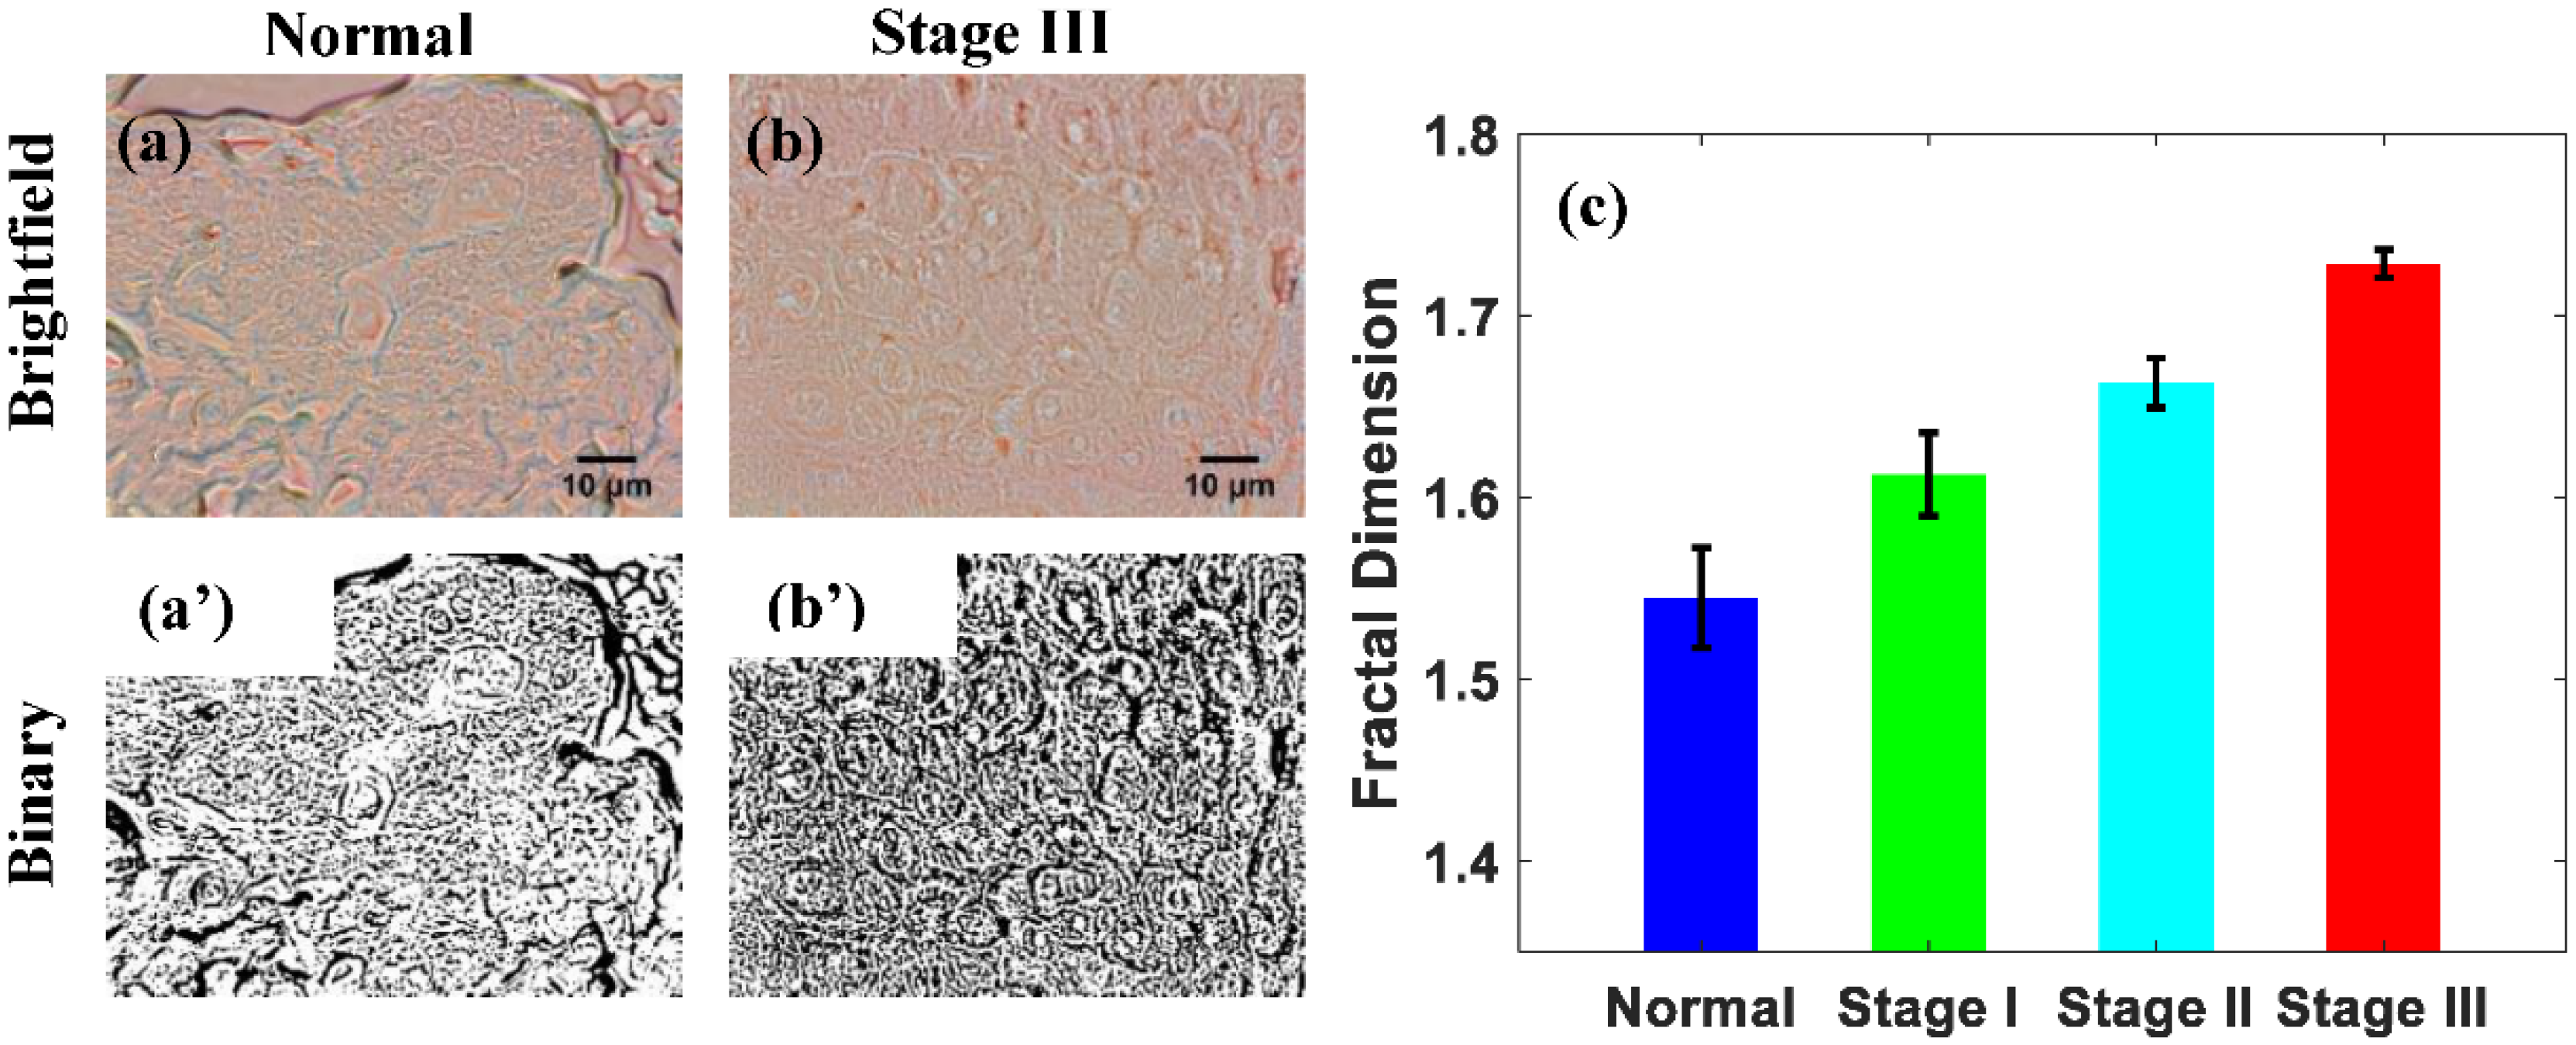
The brightfield images from a normal and stage III breast cancer TMA tissue core are shown in
Figure 3a,b, respectively. Their binary analogs are shown in
Figure 3a’,b’, with
Figure 3b’ showing an increased density. The greater density demonstrates how the progression of cancer results in an increased mass density distribution. As shown in
Figure 3c, the normal breast tissue sample has the lowest fractal dimension, while the different stages of cancer had fractal dimensions increasing with the progression of cancer. The actual fractal dimensions of the breast tissue samples are 1.5448 for the normal, 1.6126 for stage I, 1.6631 for stage II, and 1.7284 for stage III cancer. For the normal, and stage I tissue samples, the percent difference between the two is 4%, while the percent difference between the normal and stage II and the normal and stage III are 7% and 12%, respectively. These results suggest that the fractal dimension of a breast TMA sample increases with the progression of cancer. Cancer is known to cause an increase in the replication rate of cells, which therefore causes an increase in the tissue’s mass density distribution. These results make sense because the fractal dimension of a tissue sample is a measure of its mass density distribution. Similar results to these have also been observed in other studies [
30].
3.3. Colon Cancer
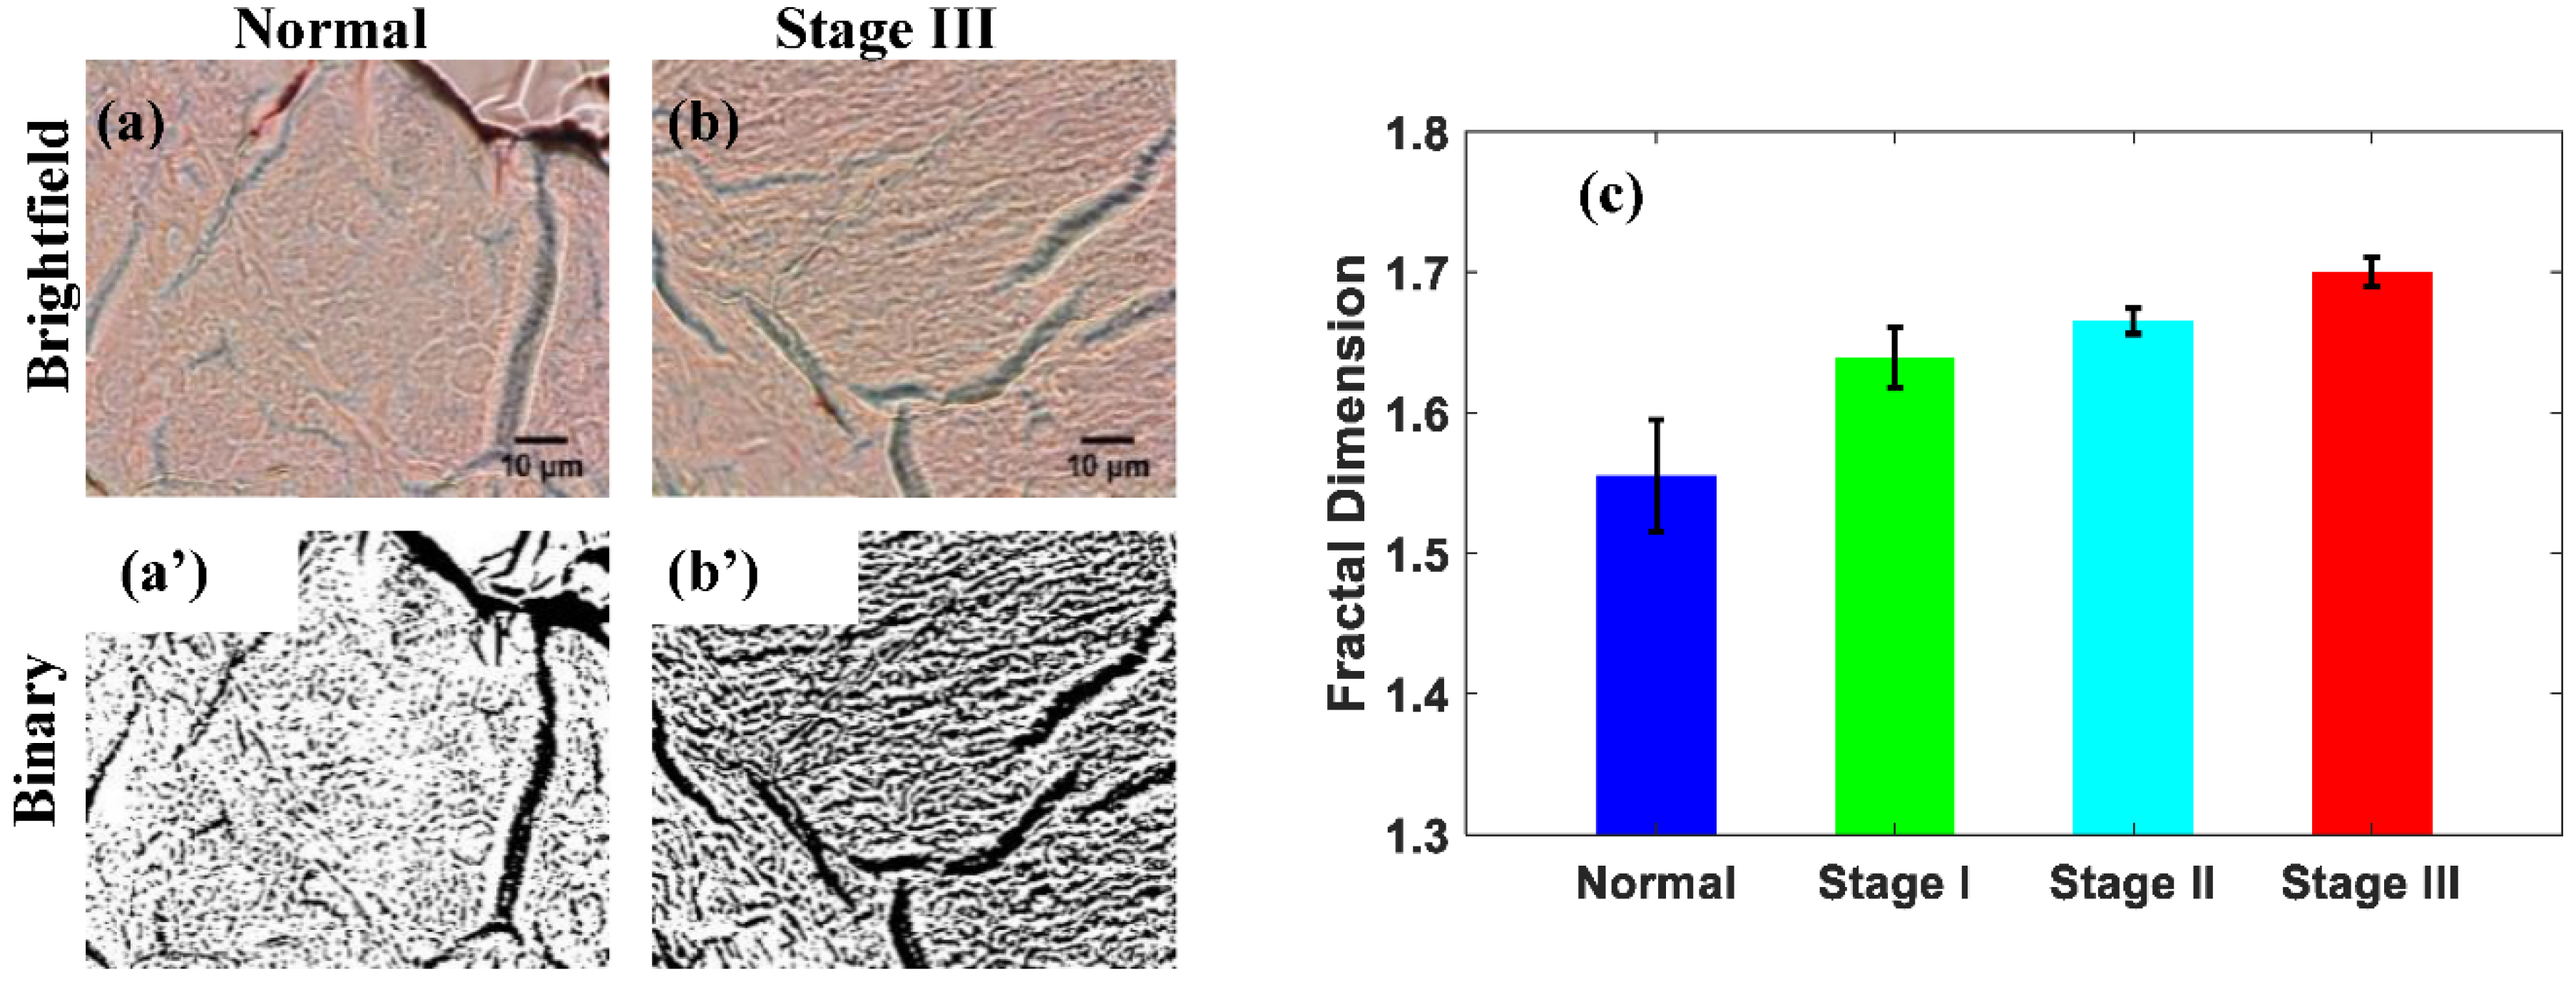
Normal and stage III cores of the colon TMA slide’s brightfield images are shown in
Figure 4a,b. Their corresponding binary images are pictured in
Figure 4a’,b’ and show how the mass density distribution of a tissue sample increases throughout the progression of cancer. As can be seen in
Figure 4c, the normal colon tissue sample possesses the lowest fractal dimension, while the fractal dimensions for each stage of cancer increase with its progression. The actual fractal dimension values for each sample are 1.5551 for the normal, 1.6393 for stage I, 1.6652 for stage II, and 1.7004 for stage III. When the normal tissue sample is compared with stage I, stage II, and stage III samples, the percent differences are found to be 5%, 7%, and 9%, respectively. These results suggest that the fractal dimension of a colon TMA sample increases with the progression of cancer. Like other tissue samples, the presence of colon cancer causes the replication rate of the affected cells to increase, resulting in an increased mass density distribution. The fractal dimension of the tissue sample will increase due to this, so the results gathered from this study make sense. Similar results have also been observed in other studies [
18].
3.4. Prostate Cancer
Representative brightfield images of a normal and stage III core are presented in
Figure 5a,b, respectively.
Figure 5a’,b’ are the binary versions of the brightfield images obtained through the
Image J software. They clearly show that the mass density distribution within tissue increases with the progression of cancer. As seen in
Figure 5c, the normal prostate tissue possesses the lowest fractal dimension, while the fractal dimensions for each stage of cancer increase with its progression. The actual fractal dimension values for each sample are 1.5737 for the normal, 1.5981 for stage I, 1.6302 for stage II, and 1.6798 for stage III. The percent difference between the normal and stage I samples is 2%, normal and stage II samples is 4%, and the difference between the normal and stage III is 7%. These results suggest that the fractal dimension of a prostate TMA sample increases with the progression of cancer. The mass density distribution of a tissue sample increases due to the increased cell replication caused by the presence of cancer, supporting the results obtained [
25,
31,
32].
4. Discussions
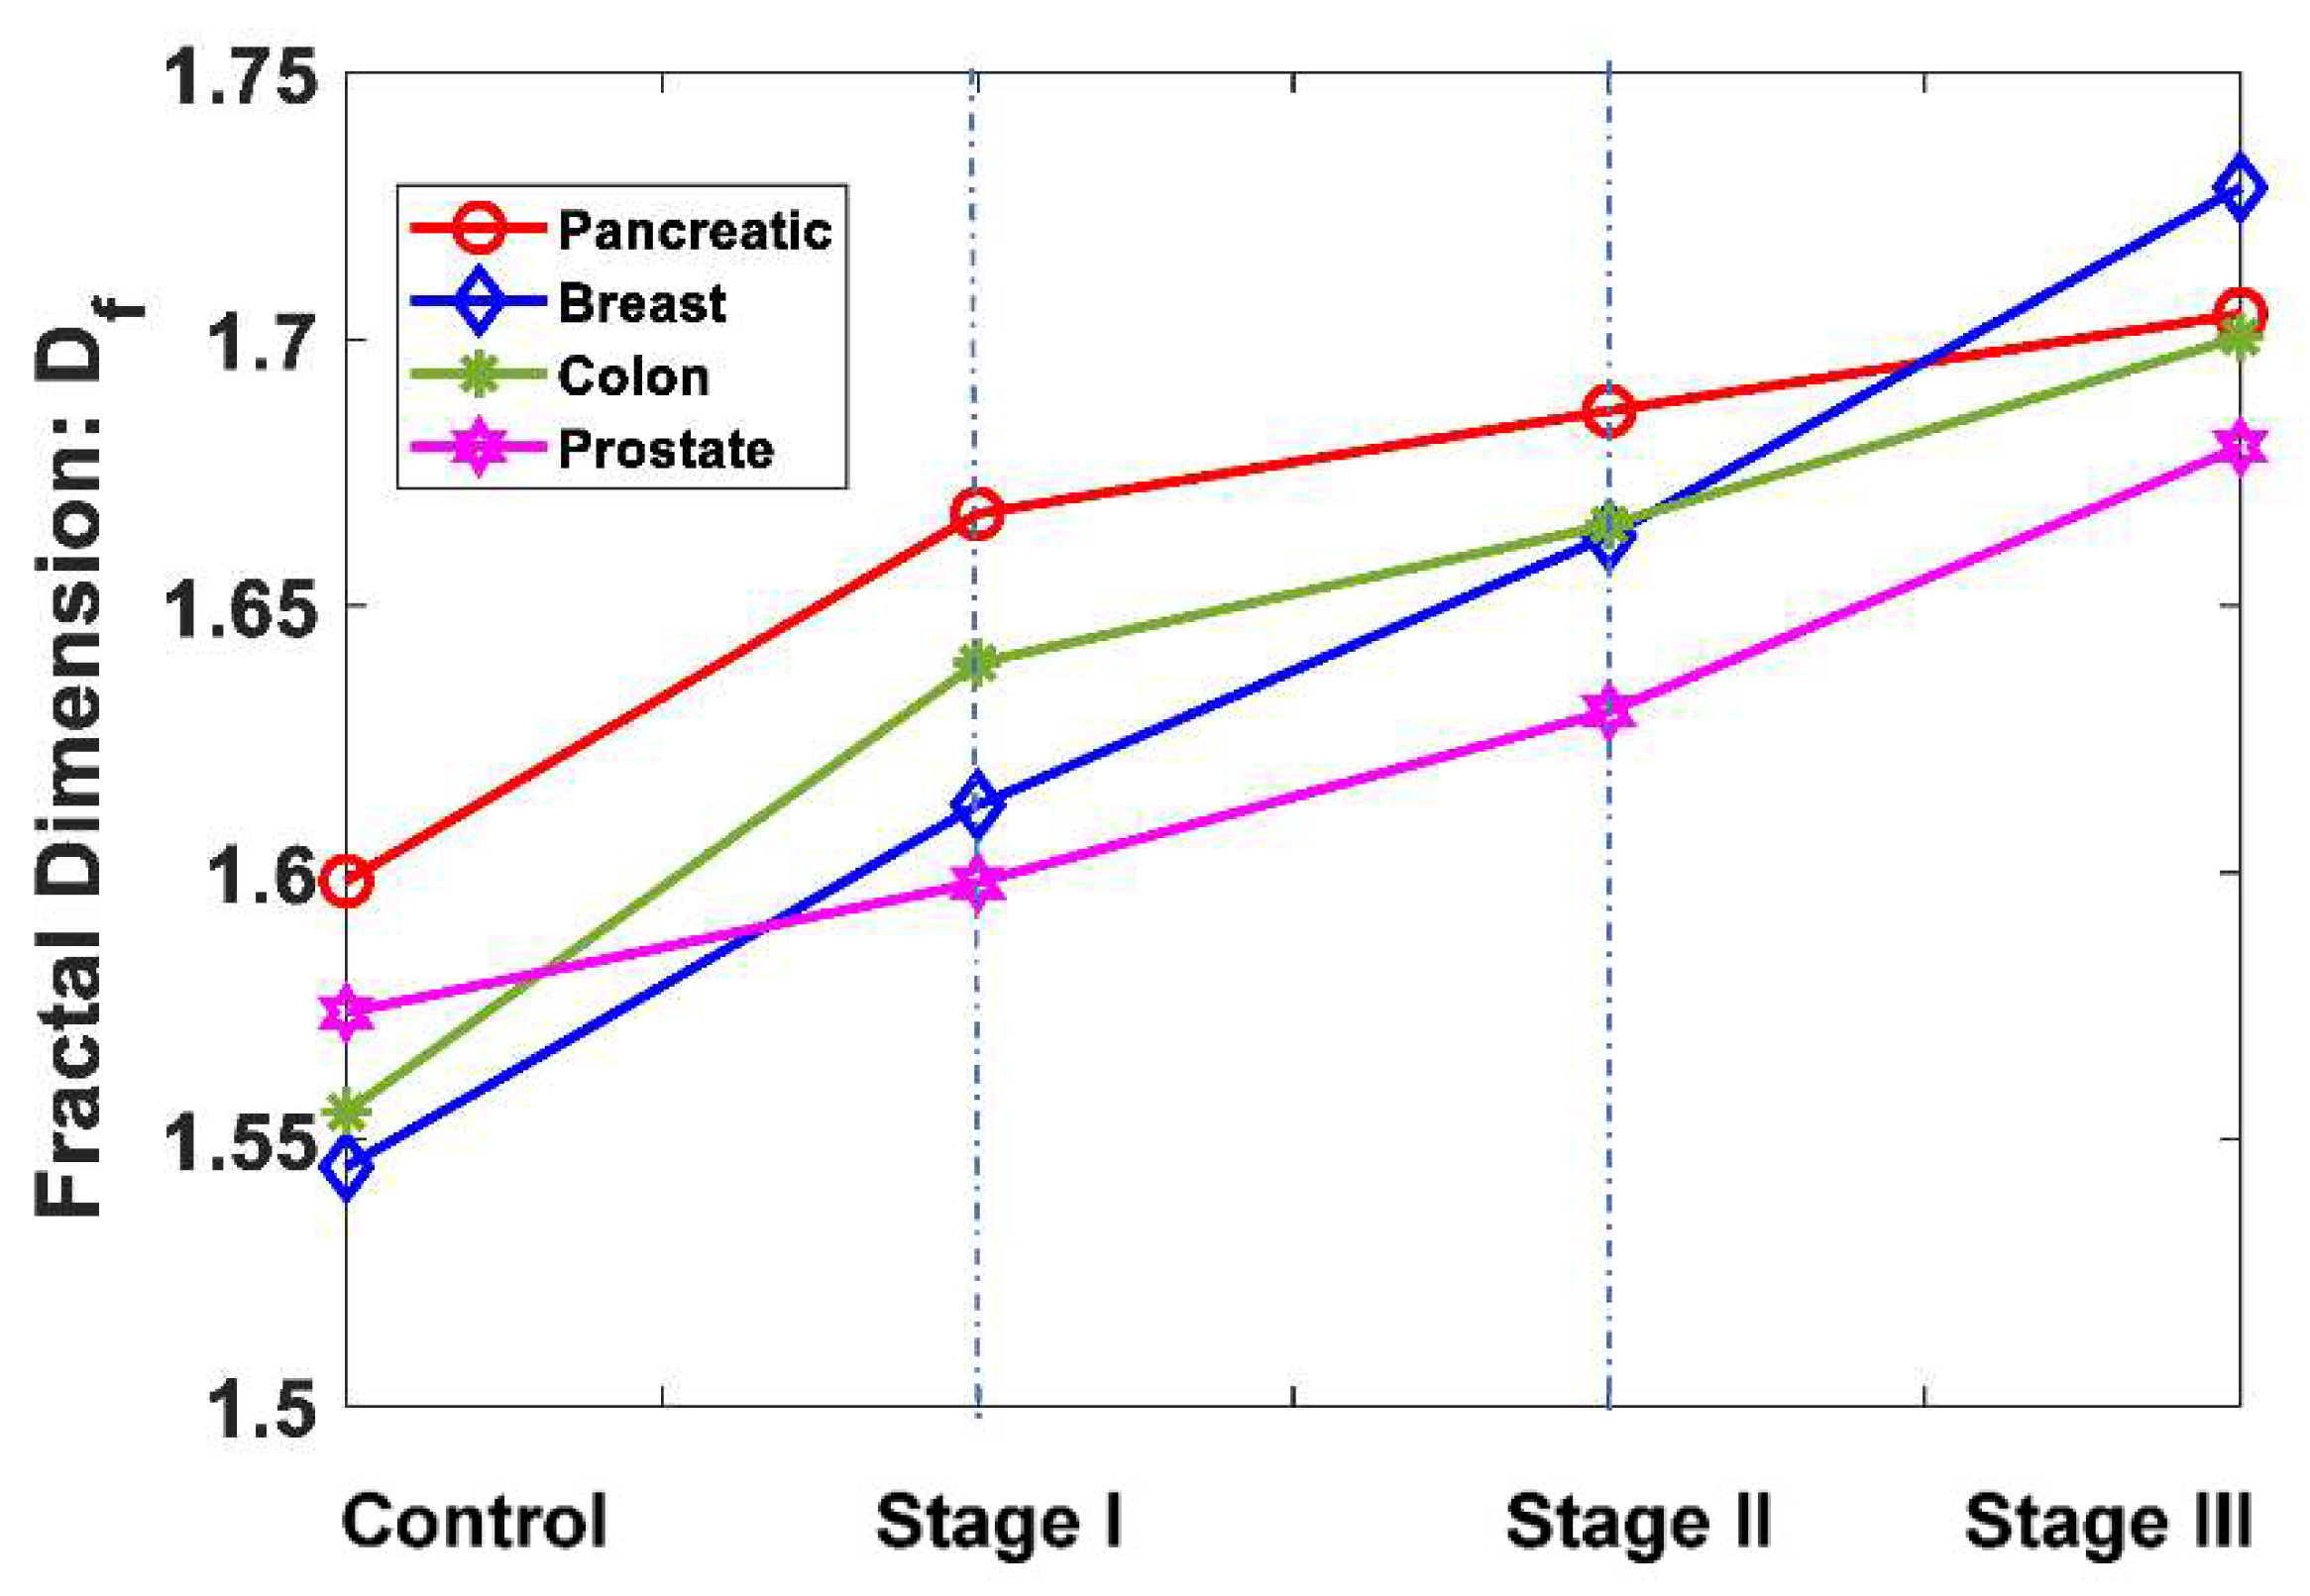
In this section, we compare the variation of different stages of cancer with respect to the normal for the four main cancer cases considered here: pancreatic, breast, colon, and prostate. The actual value of the fractal dimensions of the tissue with the increase in cancer stages has presented the by the
Table 1 for better clarification. Also, the average values of fractal dimension of the different stages of different cancer are graphically represented in
Figure 6, which concludes the universalities of fractal dimension with the increase in cancer stages.
From the above data, the universal nature of the fractal dimension increasing with the progress of cancer is seen; that is, there is an increase in the fractal dimension from normal to Stage I to Stage II to Stage III. However, the paths have slight differences for different types of cancers. Hypothetically, when there will be no space left for filling as in a very advanced stage of the cancers, all cancer types will have a fractal dimension of two (for the 2D tissue samples) and will meet at the same point.
It can be pointed out here that, recently, there have been several studies of cells and tissues where the fractal dimension calculations have been explored using lab-developed quantitative phase microscopies, where mass structures can be detected, and fractal dimensions can be calculated. However, the present paper addresses the most basic bright-field transmission optical microscopy for fractal dimension calculation, which is available to most biomedical laboratories or hospitals. A combination of bright field transmission microscopy and quantitative phase microscopy may provide more accurate fractal dimensions or more accurate stages of cancer detection that need to be explored [
33,
34,
35,
36].
5. Conclusions
In this paper, we explored the possibility of creating a standardized, physics-based cancer diagnosis test capable of accurate detection of cancer in both early and late stages based on the fractal dimension analysis of paraffin embedded TMA samples. This was undertaken by optical transmission microscopic imaging of TMA samples of different stages of pancreatic, breast, colon, and prostate cancer and calculating their fractal dimensions. Intensity distribution from a thin tissue sample using transmission bright field microscopy is directly related to the mass density distribution of the tissue, and the fractal dimensions are calculated. The results show that in all the four types of cancer cases studied here, the mean fractal dimension of a tissue sample increased as cancer progresses through the different stages, with slightly different paths. The fractal dimension increases due to the increase in the mass density and filling of the tissue porosity structure with the progress of cancer. These results support that the histogram of the grayscale average represents the degree of tissue disorganization, which reduces with the progression of carcinogenesis. Therefore, the normal of each cancer tissue has a minuscule gray scale, while the higher stages of each cancer have a higher grayscale or fractal dimension due to more accumulation of mass density, such as due to the higher accumulation of DNA mass, etc. Here, we were able to distinguish the different stages of pancreatic, breast, colon, and prostate cancer cases via computer-aided/automated quantitative approach of the fractal dimension detection of commercially available TMA samples using optical transmission imaging. This result shows that there is definite potential for the creation of a physics-based, standardized, automated, and quantitative cancer diagnosis approach, which is free of some of the issues plaguing the current cancer diagnosis methods that are based on the eye estimation of pathologists. Lastly, a physics-based easy, prompt, cost-effective, and accurate quantitative cancer diagnosis method can also be compiled into a database with the possibility for the creation of a shared database accessible to every physician. By compiling the fractal dimensions that are calculated by doctors all over the country, a master list can be created that gives the range of the average fractal dimension for each type and stage of cancer and helps to distinguish the early stages of cancer. This master list would become increasingly more accurate as more data is entered and be further improved based on this structural change detection method of fractal dimension for early cancer and its progression of different stages. We have to note here that, because the fractal dimension changes logarithmically with the filling, this makes fractal dimension change slow but it is still a powerful parameter for characterization of the progression of cancer and its different stages.


