
Setup Time Reduction of an Automotive Parts Assembly Line Using Lean Tools and Quality Tools

Abstract
:1. Introduction
- Overproduction: It occurs when the offer (quantity of products manufactured) is higher than the demand by customers. Overproduction leads to waste like production costs for goods that are not in demand, time, space used for storage, and transportation costs;
- Waiting: It is when an operation is stopped waiting for the conclusion of the previous ones. It also occurs when operators wait for a machine to finish its job, wait for orders, or wait for tools;
- Transportation: It happens when materials and tools are moved from one site to another, with no need. This type of activity does not add value to the final product and generates costs;
- Over-processing: This occurs when offering products comes with more characteristics than customers’ requirements, and when there are more operations in a product fabrication than necessary;
- Motion: It occurs when some equipment or people are in motion without making operations. It includes motions, such as walking, looking for tools or information, and reaching and stacking parts or tools. There should be plans in action in every workplace to eliminate unnecessary movement;
- Inventory: It occurs when an excess of stock is not used for production, including raw materials or intermediate products. It can lead to longer delivery times, obsolescence of materials, transportation and storage costs, and damaged goods;
- Defects: It happens when products do not have the characteristics required by customers. These problems result in internal quality issues and cause wasted handling, time, and effort;
- SMED: It decreases the time used to prepare the production line and equipment to produce a new product, reducing setup and changeover times, and contributing to a quick and efficient change [6,10]. Setup time is the time of preparing machines or tools, and is also the time between the previous compliance item’s part fabrication and the next compliance item part [11]. Changeover is all the activities of a production line preparation, and is the time between the previous compliance product and the next compliance product [6,11].The time spent performing the changeover is considered waste according to the Lean philosophy because changeover does not add value for the customer. Its elimination brings numerous advantages, such as stock reduction, increased production capacity, elimination of setup errors, improved quality, reduced production time, reduced production costs, and simplified use of tools [11].
- Gemba Walk: It occurs when someone goes to the shop floor to watch what is going on. It is essential to go to the local site where everything is made, watch and take notes about the process, and talk with people. By visiting the shop floor, you can find crucial information for eliminating problems such as cycle times, waiting times, stocks, and rework. It enables management to understand their employees’ daily challenges, allowing leaders to have two different points of view: the management view and the operational view [12,13,14].
- Eliminate, Rearrange, Combine, and Simplify (ERCS) Analysis: It is used to analyze the processes and consists of eliminating all the non-value-added activities, rearranging the operations made, combining operations that can be conducted together, and simplifying all the tasks as much as possible to simplify processes [15,16]. The ERCS acronym is explained below [15,16]:
- ○
- E: It is the elimination of all non-value-added activities;
- ○
- C: It is the combination of two or more operations;
- ○
- R: It is the reorganization of the processes sequence;
- ○
- S: It is the simplification of operations, becoming easier to perform.
- Standardized Work: It is a set of working instructions and sequences of all the operations that establish a uniformization of all activities performed [17,18]. This documentation defines the optimal way of carrying out tasks and leads to increased quality levels, reduced variability, reduced injuries and strain, standardized takt-time, and it can also be a starting point for continuous process improvement activities [18,19]. The main objectives of Standardized Work are individual responsibility, experiential learning, and discipline in execution [17].
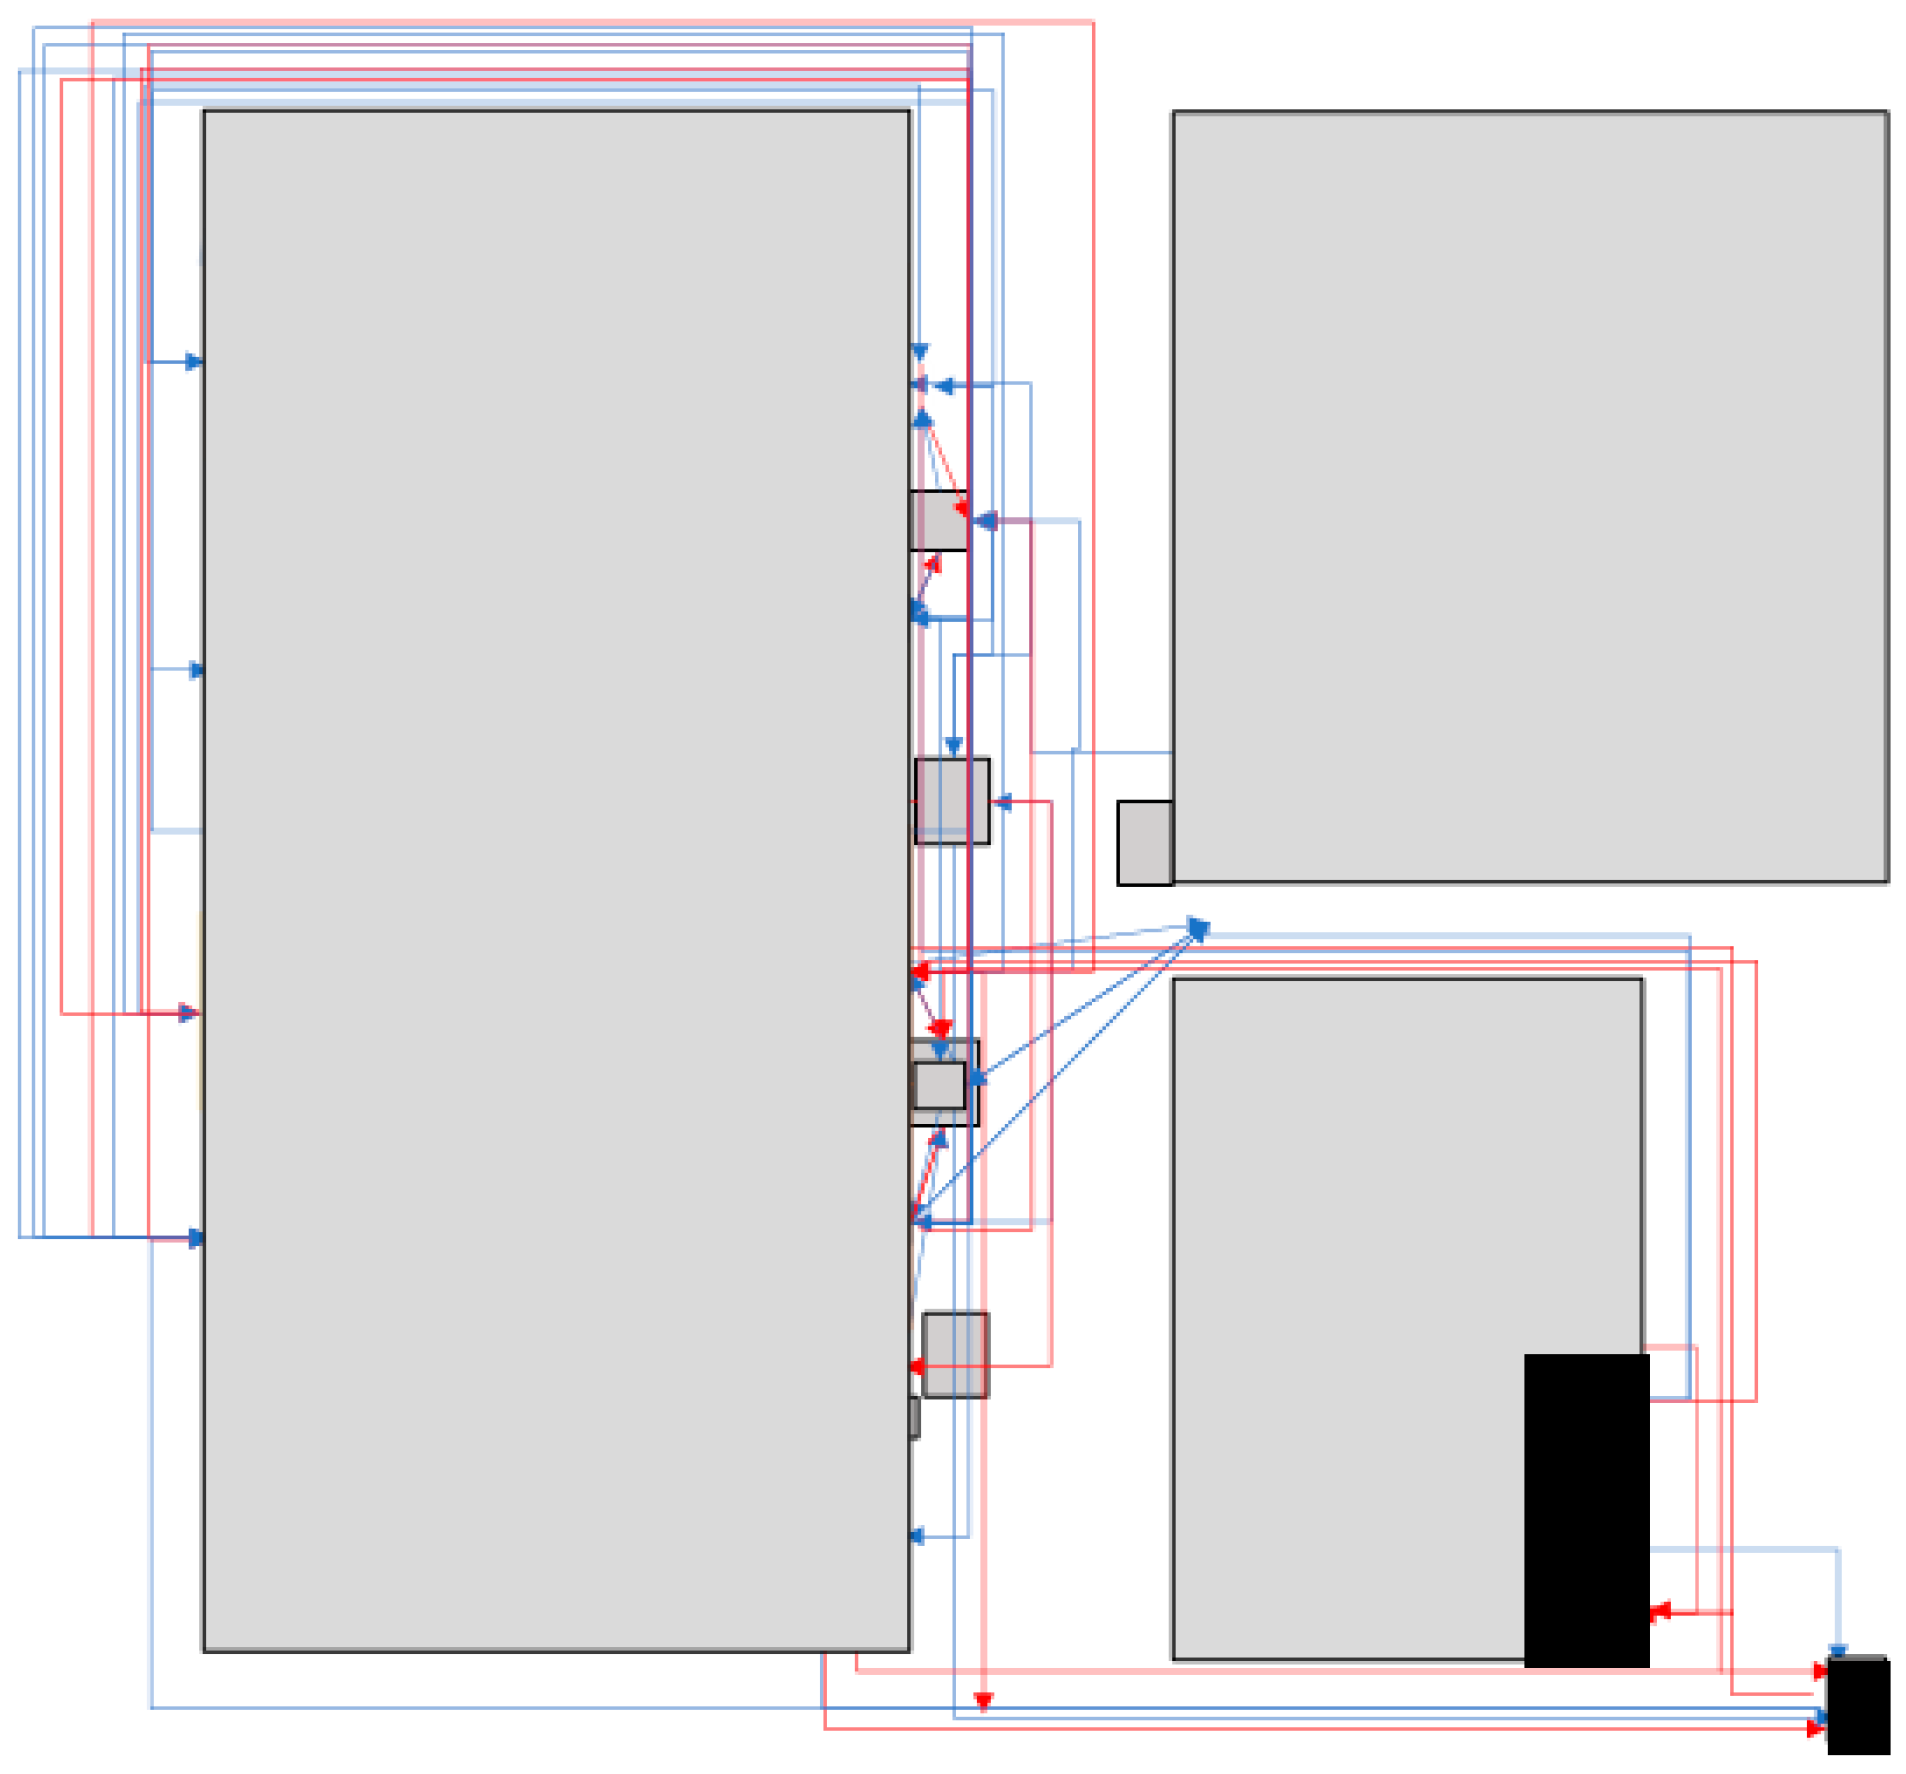
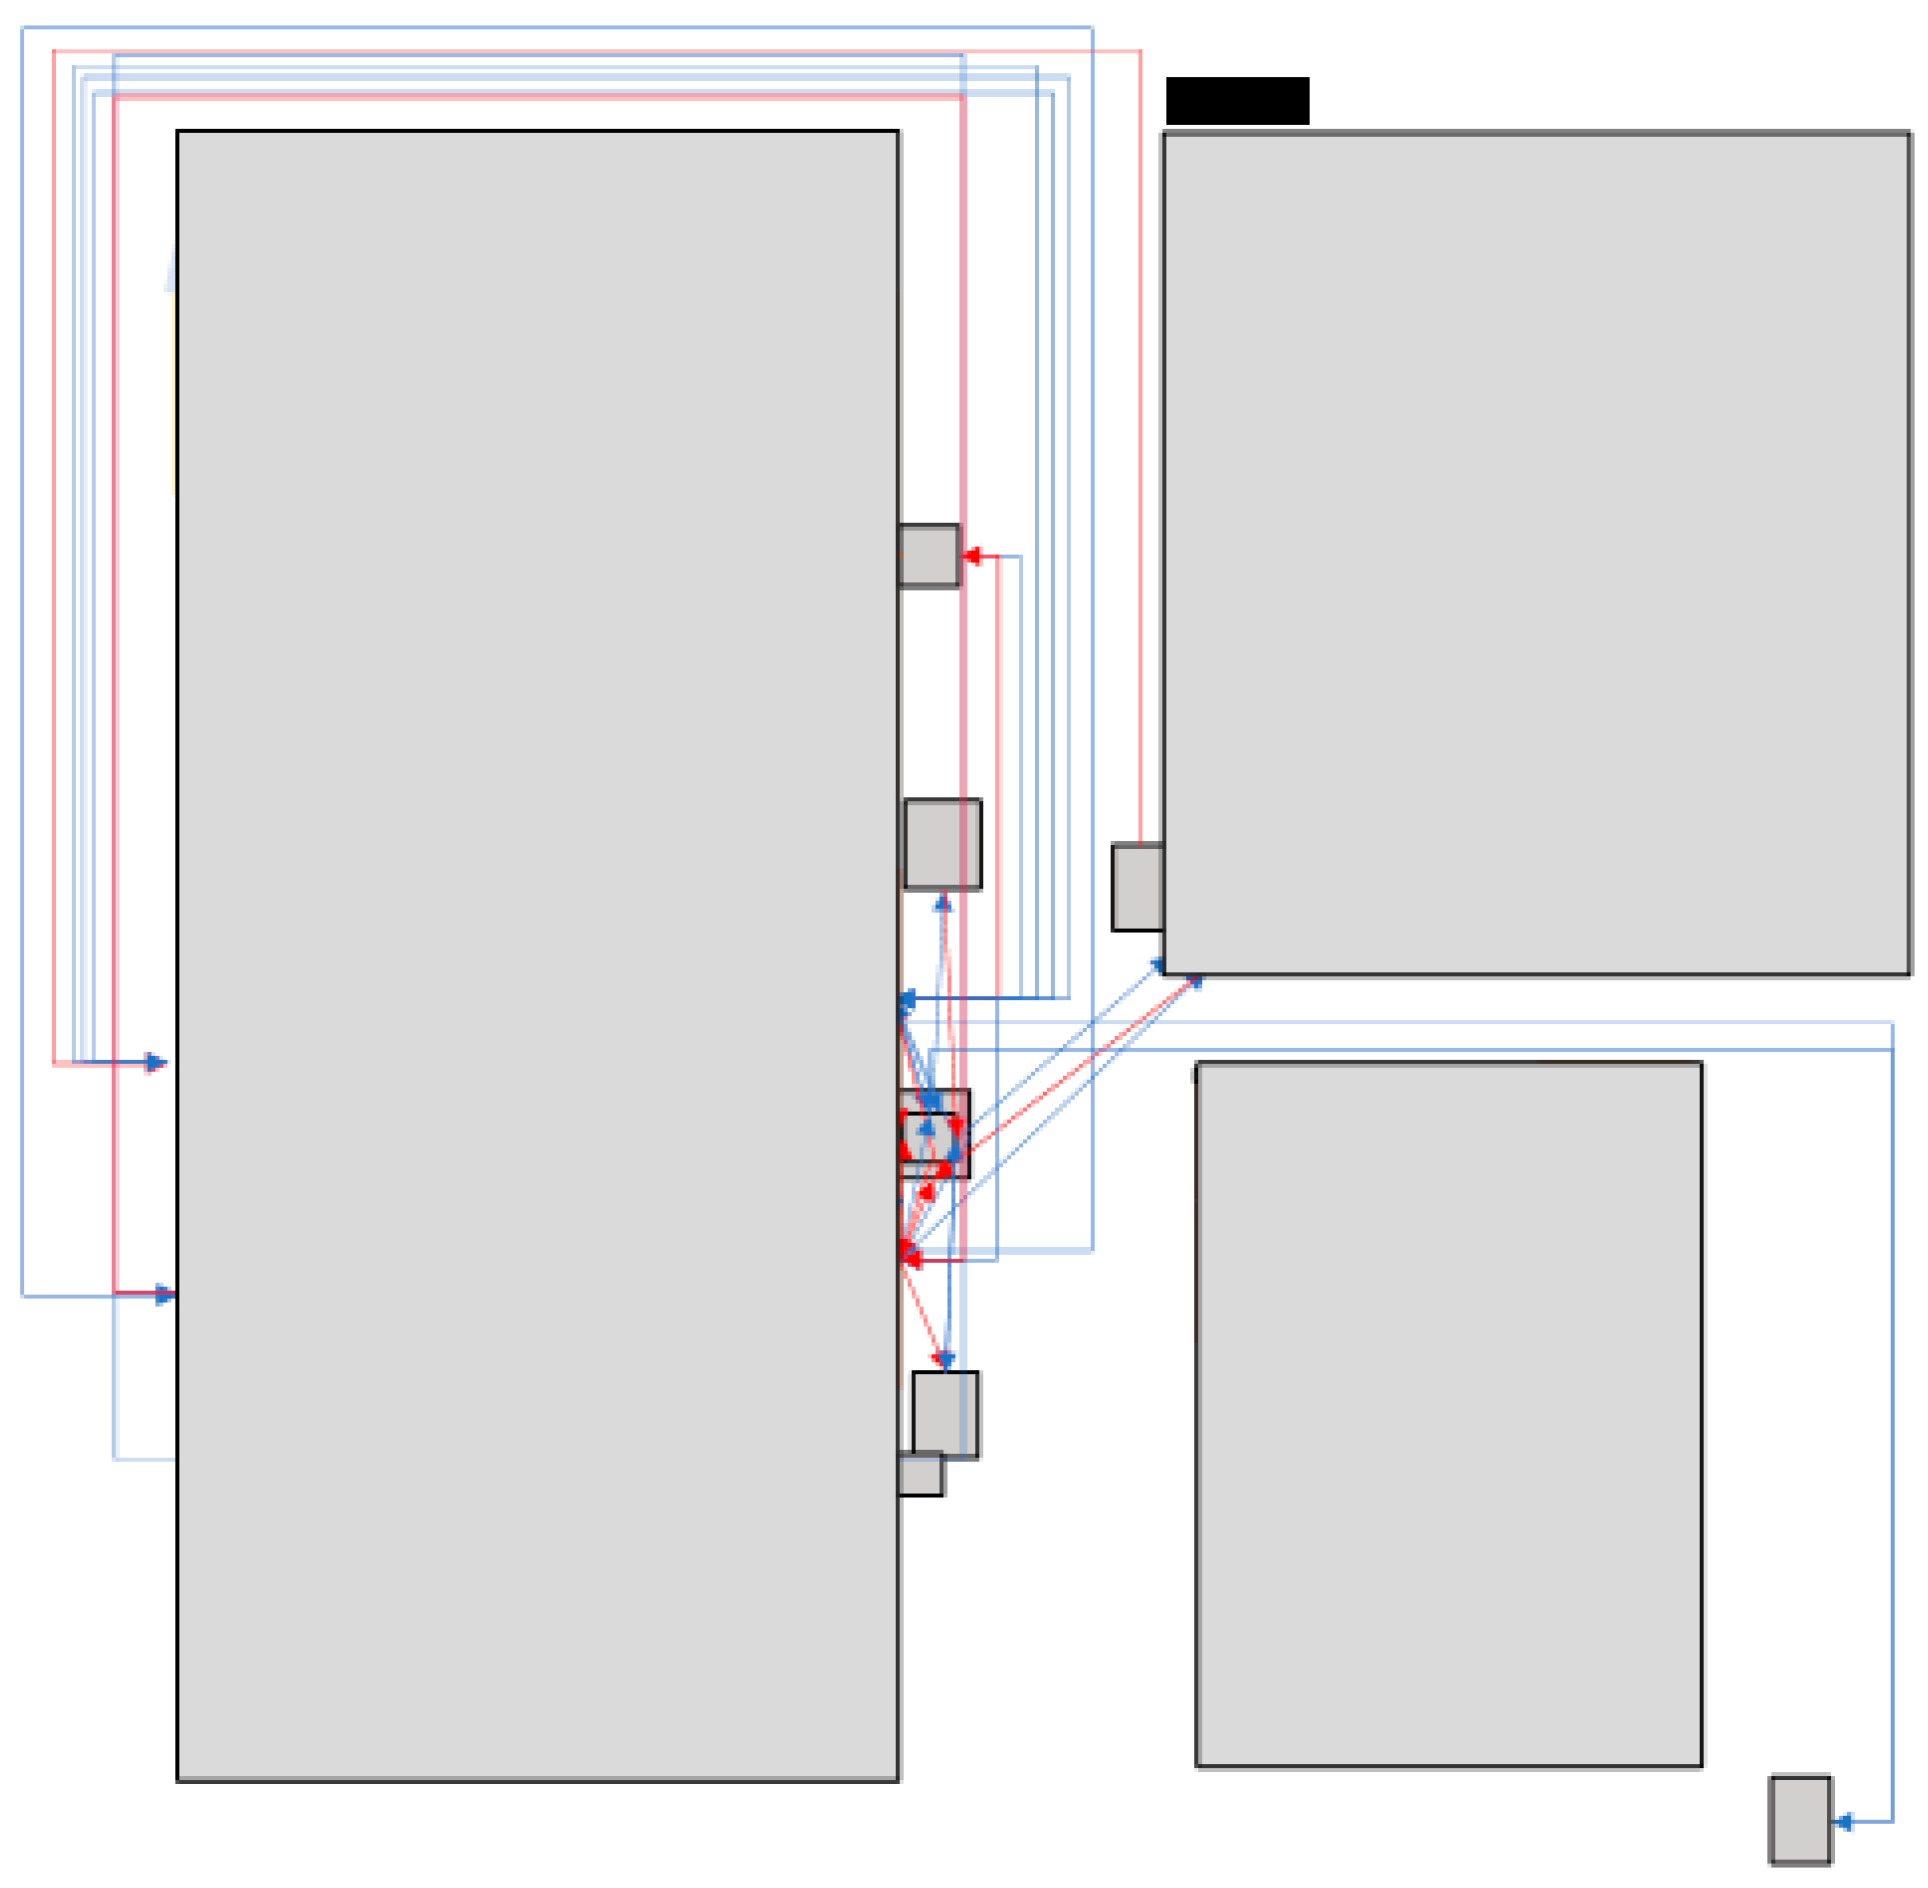
- Spaghetti Diagram: The representation of all motions in a workplace, including people motion, materials, or tools transportation [20,21]. The representation in the layout allows the identification of the process inefficiency so that unnecessary motions can be identified and eliminated, reducing or eliminating motion waste. It is also a tool used in the proposal of representations for improvement related to movements, such as reorganizing the layout or eliminating motions [20,21].
- Histogram: It is a bar chart that translates the shape of the data distribution [28].
- Control Chart: It represents the position of a sample relative to the mean [27].
- Fishbone Diagram: It shows the causes of a given problem, defining corrective actions to undertake and resources to invest [29].
- Scatter Diagram: It shows a potential relationship between some values employing a graph containing all the values [27].
- Data collection (video recording for analysis if possible);
- Classification of internal and external activities;
- Conversion of internal activities into external ones;
- Simplification of setup tasks;
- Analysis of results.
2. Materials and Methods
- Go to the shop floor to watch all the processes: Communicate with people, and do a flowchart about the process. As Gemba Walk indicates, it is important to be where everything is made. This step will help to understand the production line requirements and what needs to be changed when a new product has to be fabricated;
- Data collection by video recording: Watch the video and list all the activities and their times and draw the Spaghetti Diagram;
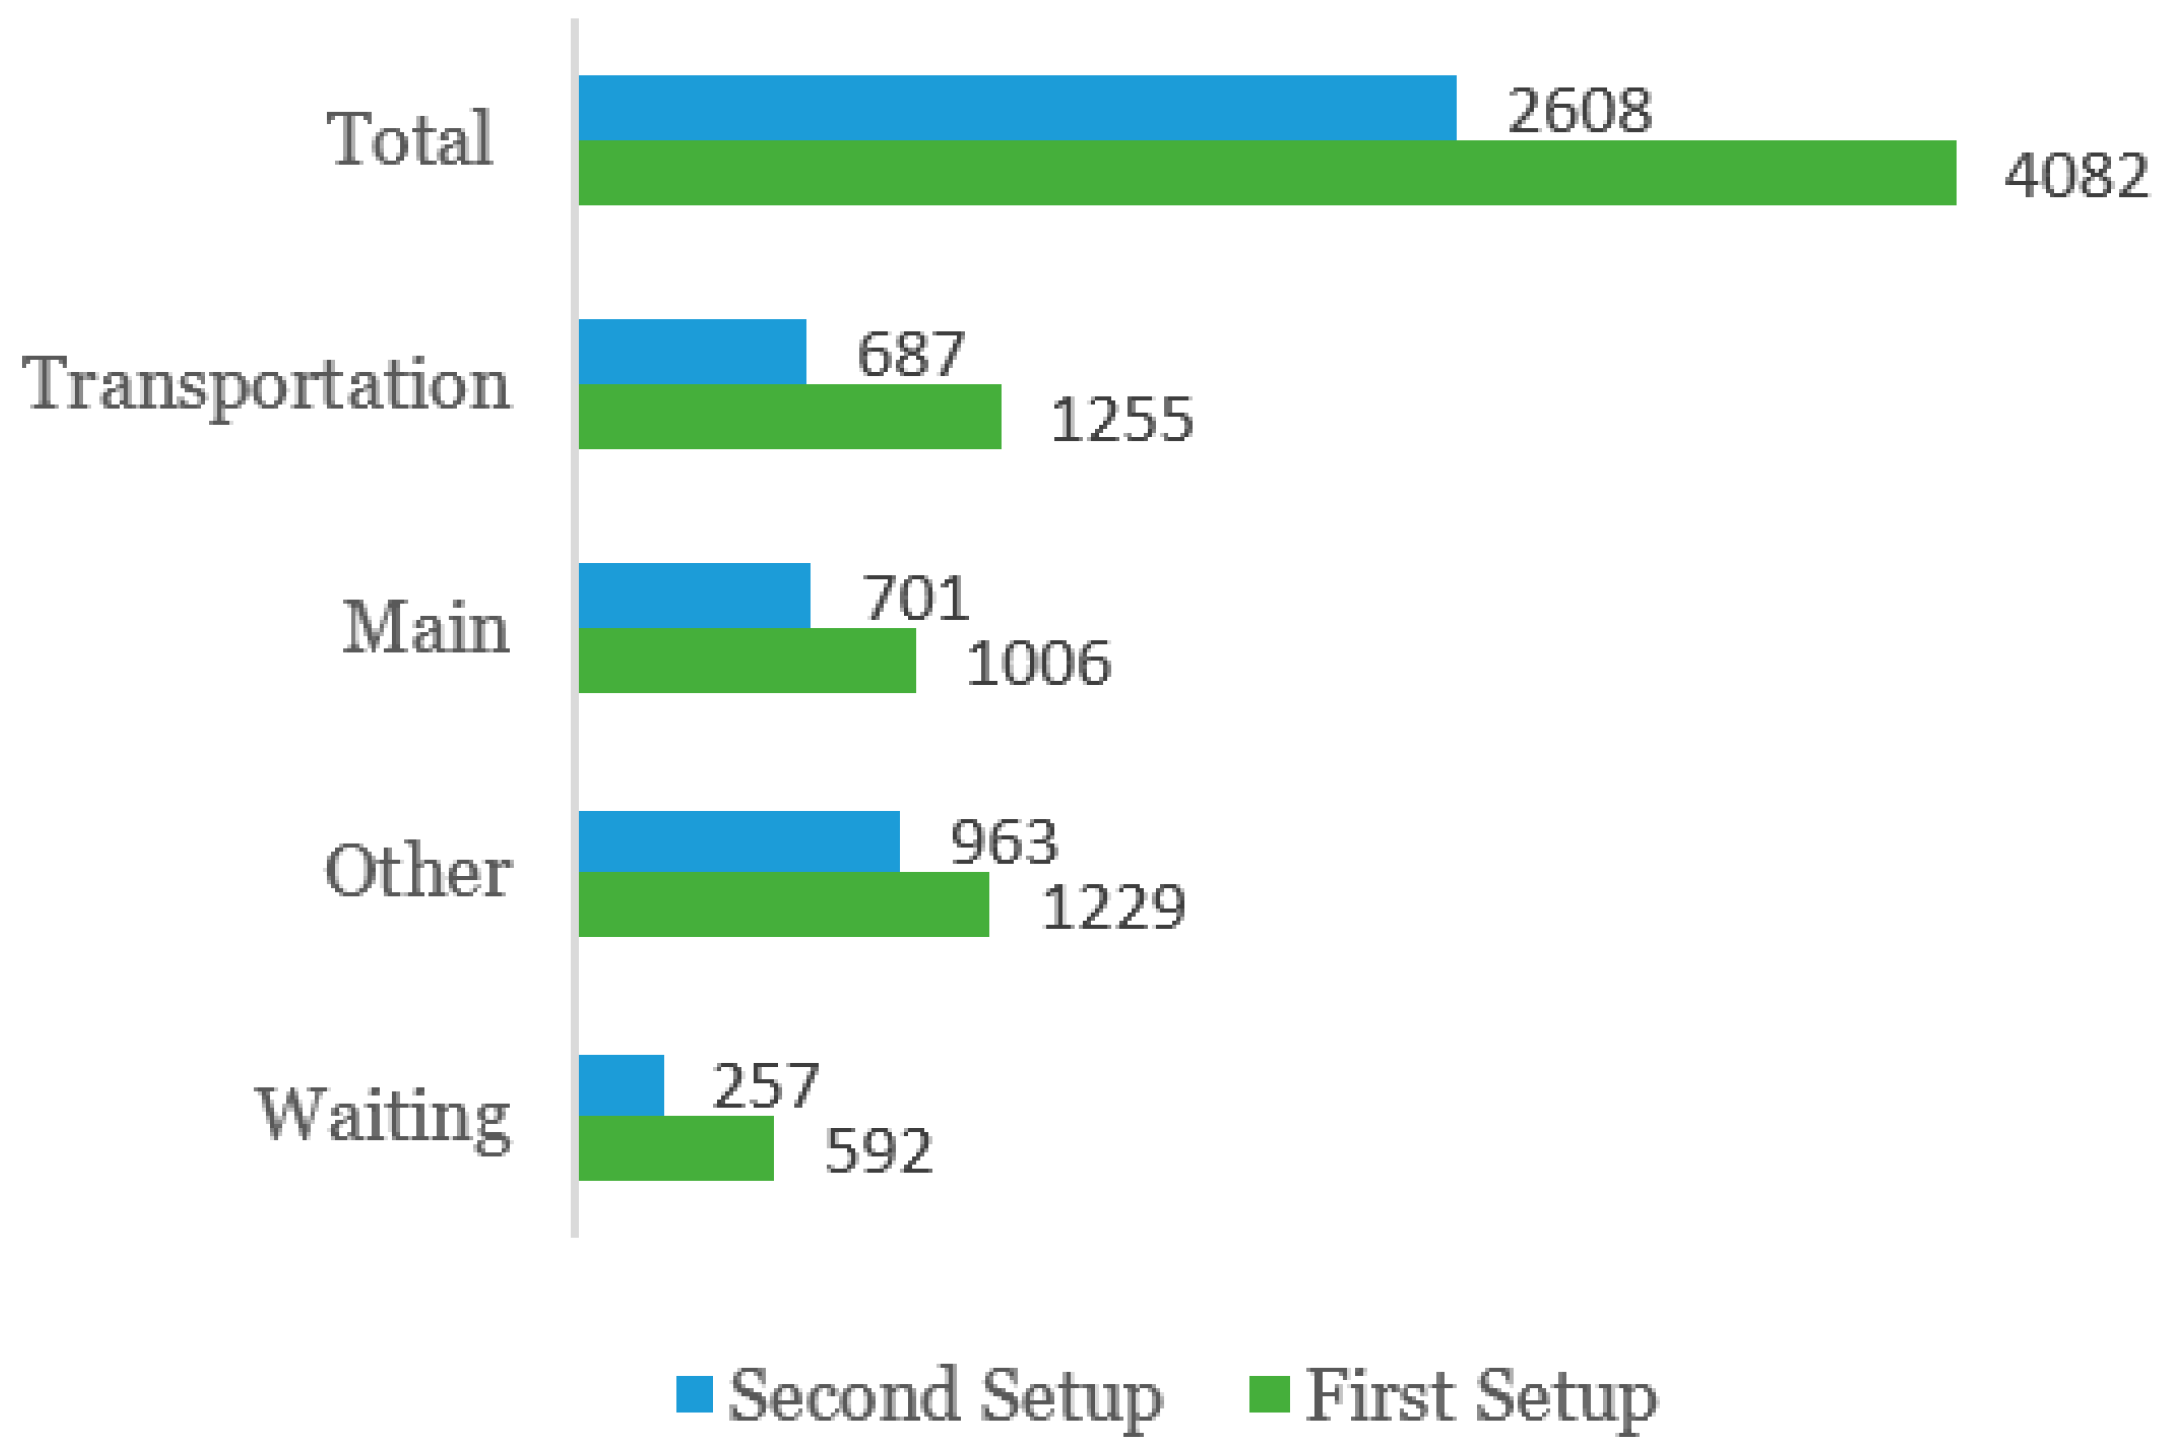
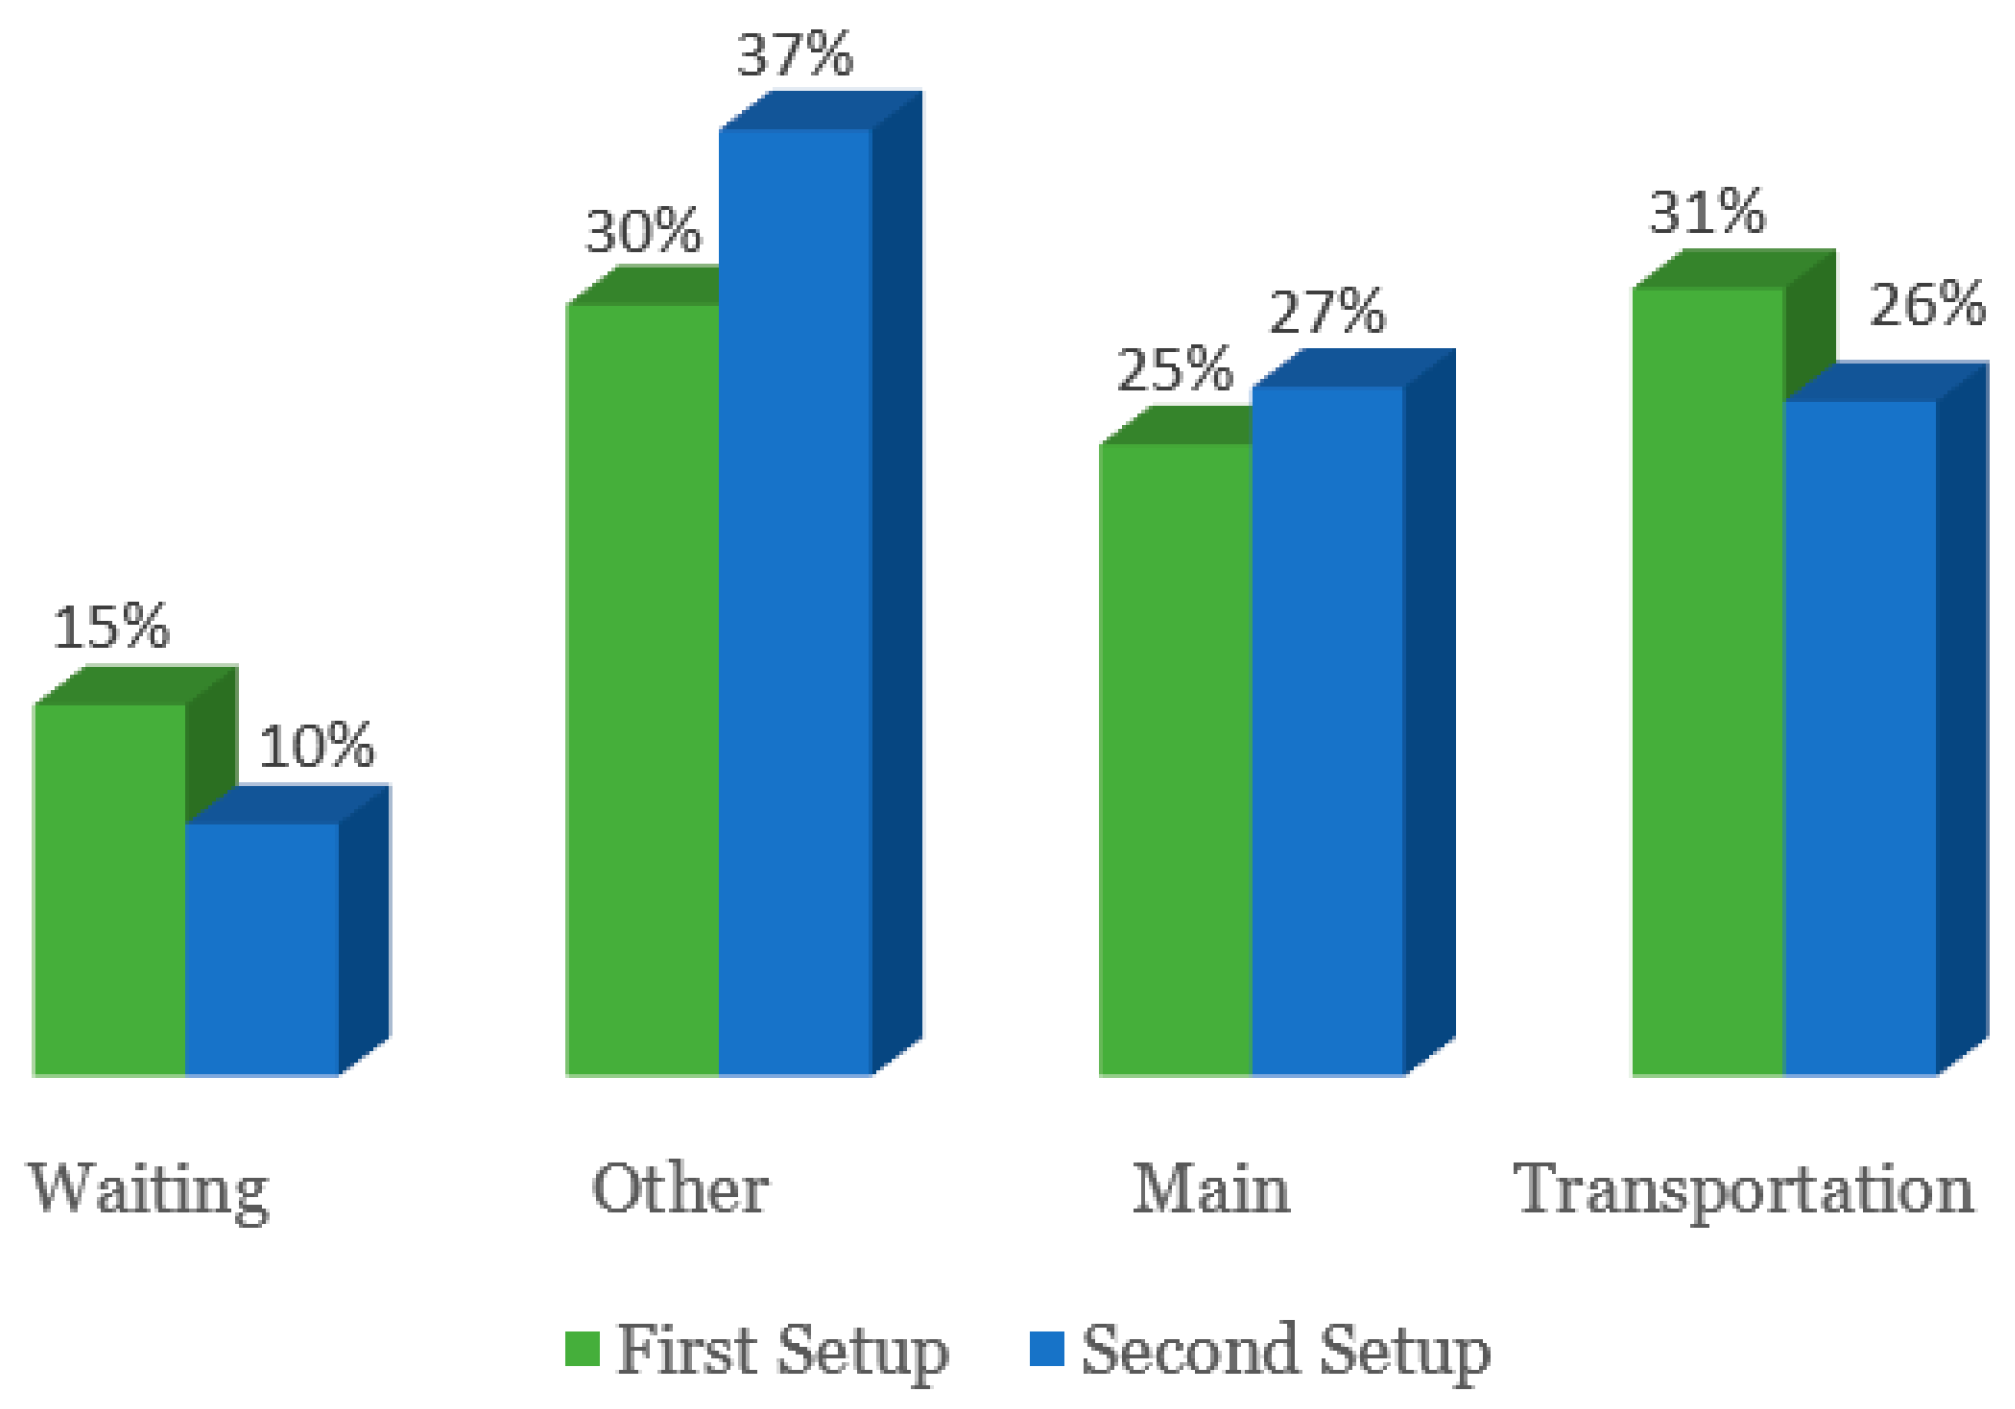
- Split the tasks mentioned into four categories: The categories are transportation, waiting, main, and other. Transportation and waiting are two of the seven wastes considered by Lean, as explained before. The main tasks are the ones where it is crucial to change the tool when it is necessary to fabricate other different products (it is screw and unscrew the screws). “Other” is a category to include all activities that do not fit with any of the categories mentioned before, such as cleaning activities or tool adjustments needed before screwing the screws. This is also applied to the four categories presented in Figures 6 and 7;
- Convert internal tasks into external and do Analysis ERCS: Convert internal tasks as much as possible to reduce the time spent in the changeover. At the same time, it is important to classify every activity into eliminate, rearrange, combine, and simplify, taking into account the explanation made before;
- Do a Pareto Chart: To observe the most critical operation;
- Define an action plan: Where every step presented before has to be considered as well as all the perceptions felt while the setup was being performed. In this case, it was noticed that the worker did not know where the materials used to change the tool were and there were a lot of motions and transports to pick up all the materials. The responsibilities of each worker were not defined and there was no transportation tools flow (racks used during the manufacturing process are in the production line, and there was no space to move the tools). Therefore, the action plan must include: a list of tasks for the worker, a changeover trolley/rack with all the necessary materials to perform the setup, and a reorganization of the production line before setup starts.
- Repeat the setup and collect new data: Repeat steps 2, 3, 4.
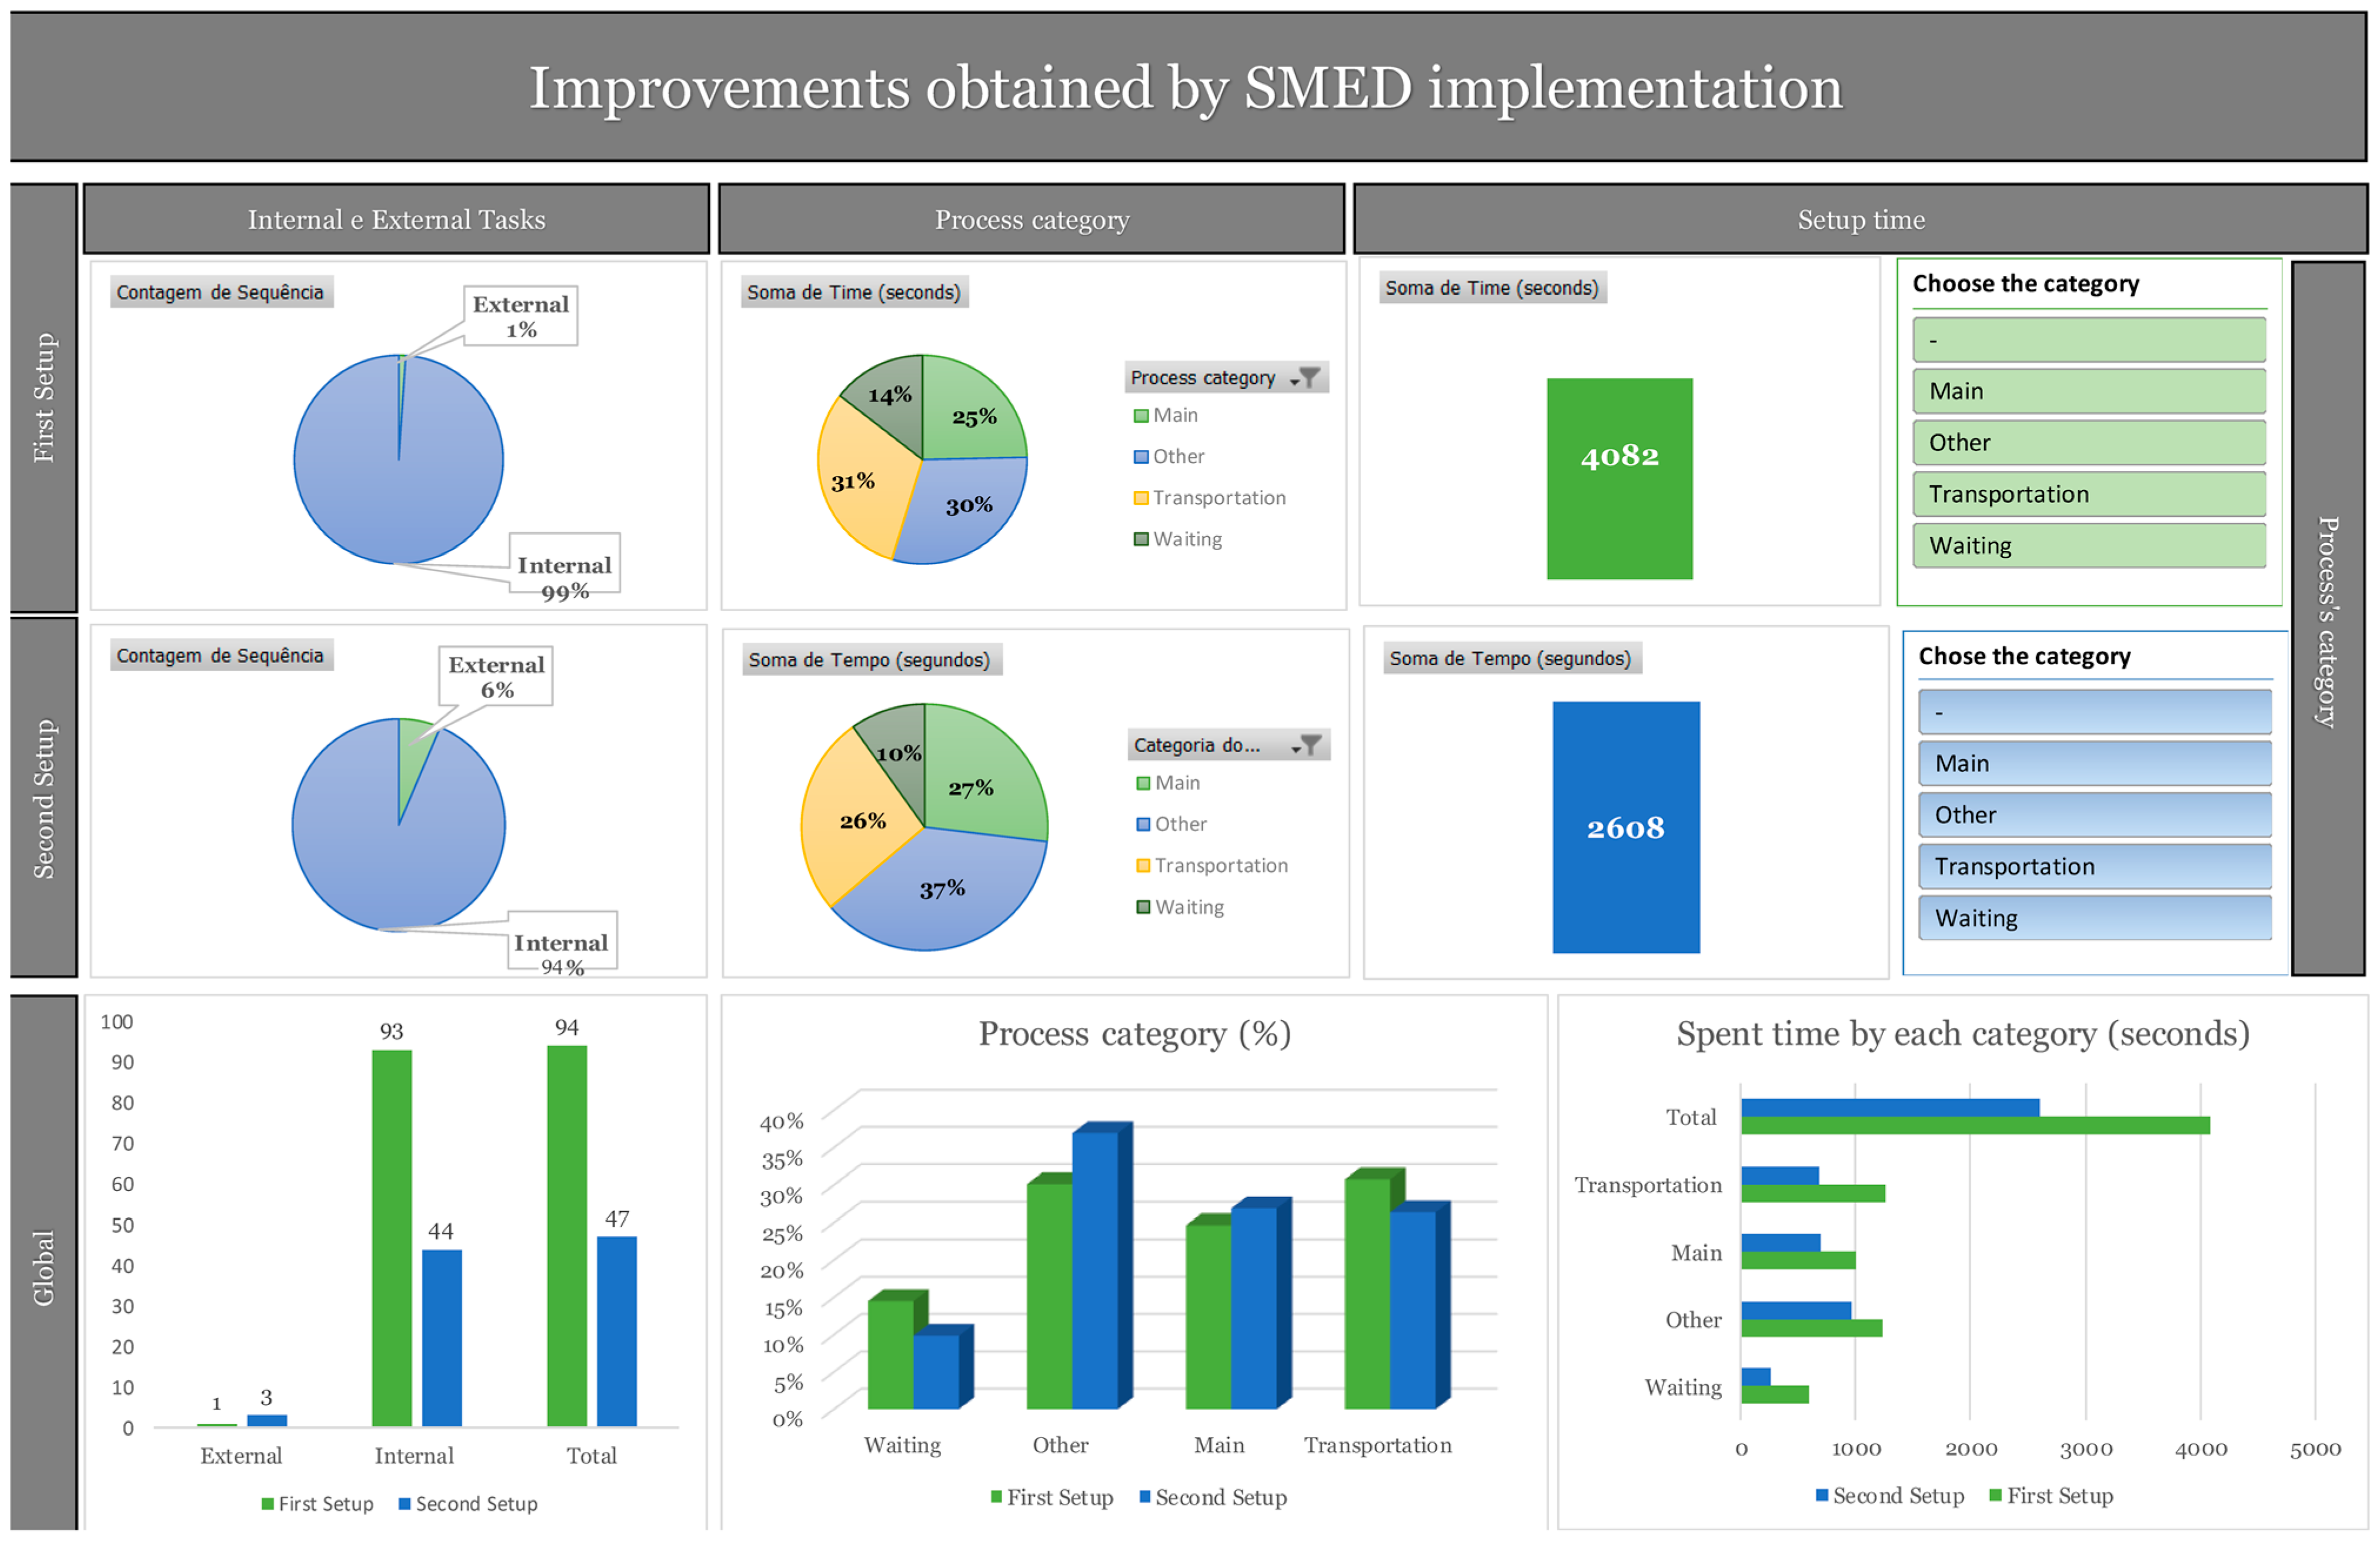
- Analysis of the results. In this step, a dashboard was made to have a better and easier understanding of all the improvements made. This dashboard is shown in Appendix A.
3. Results
3.1. Spaghetti Diagram
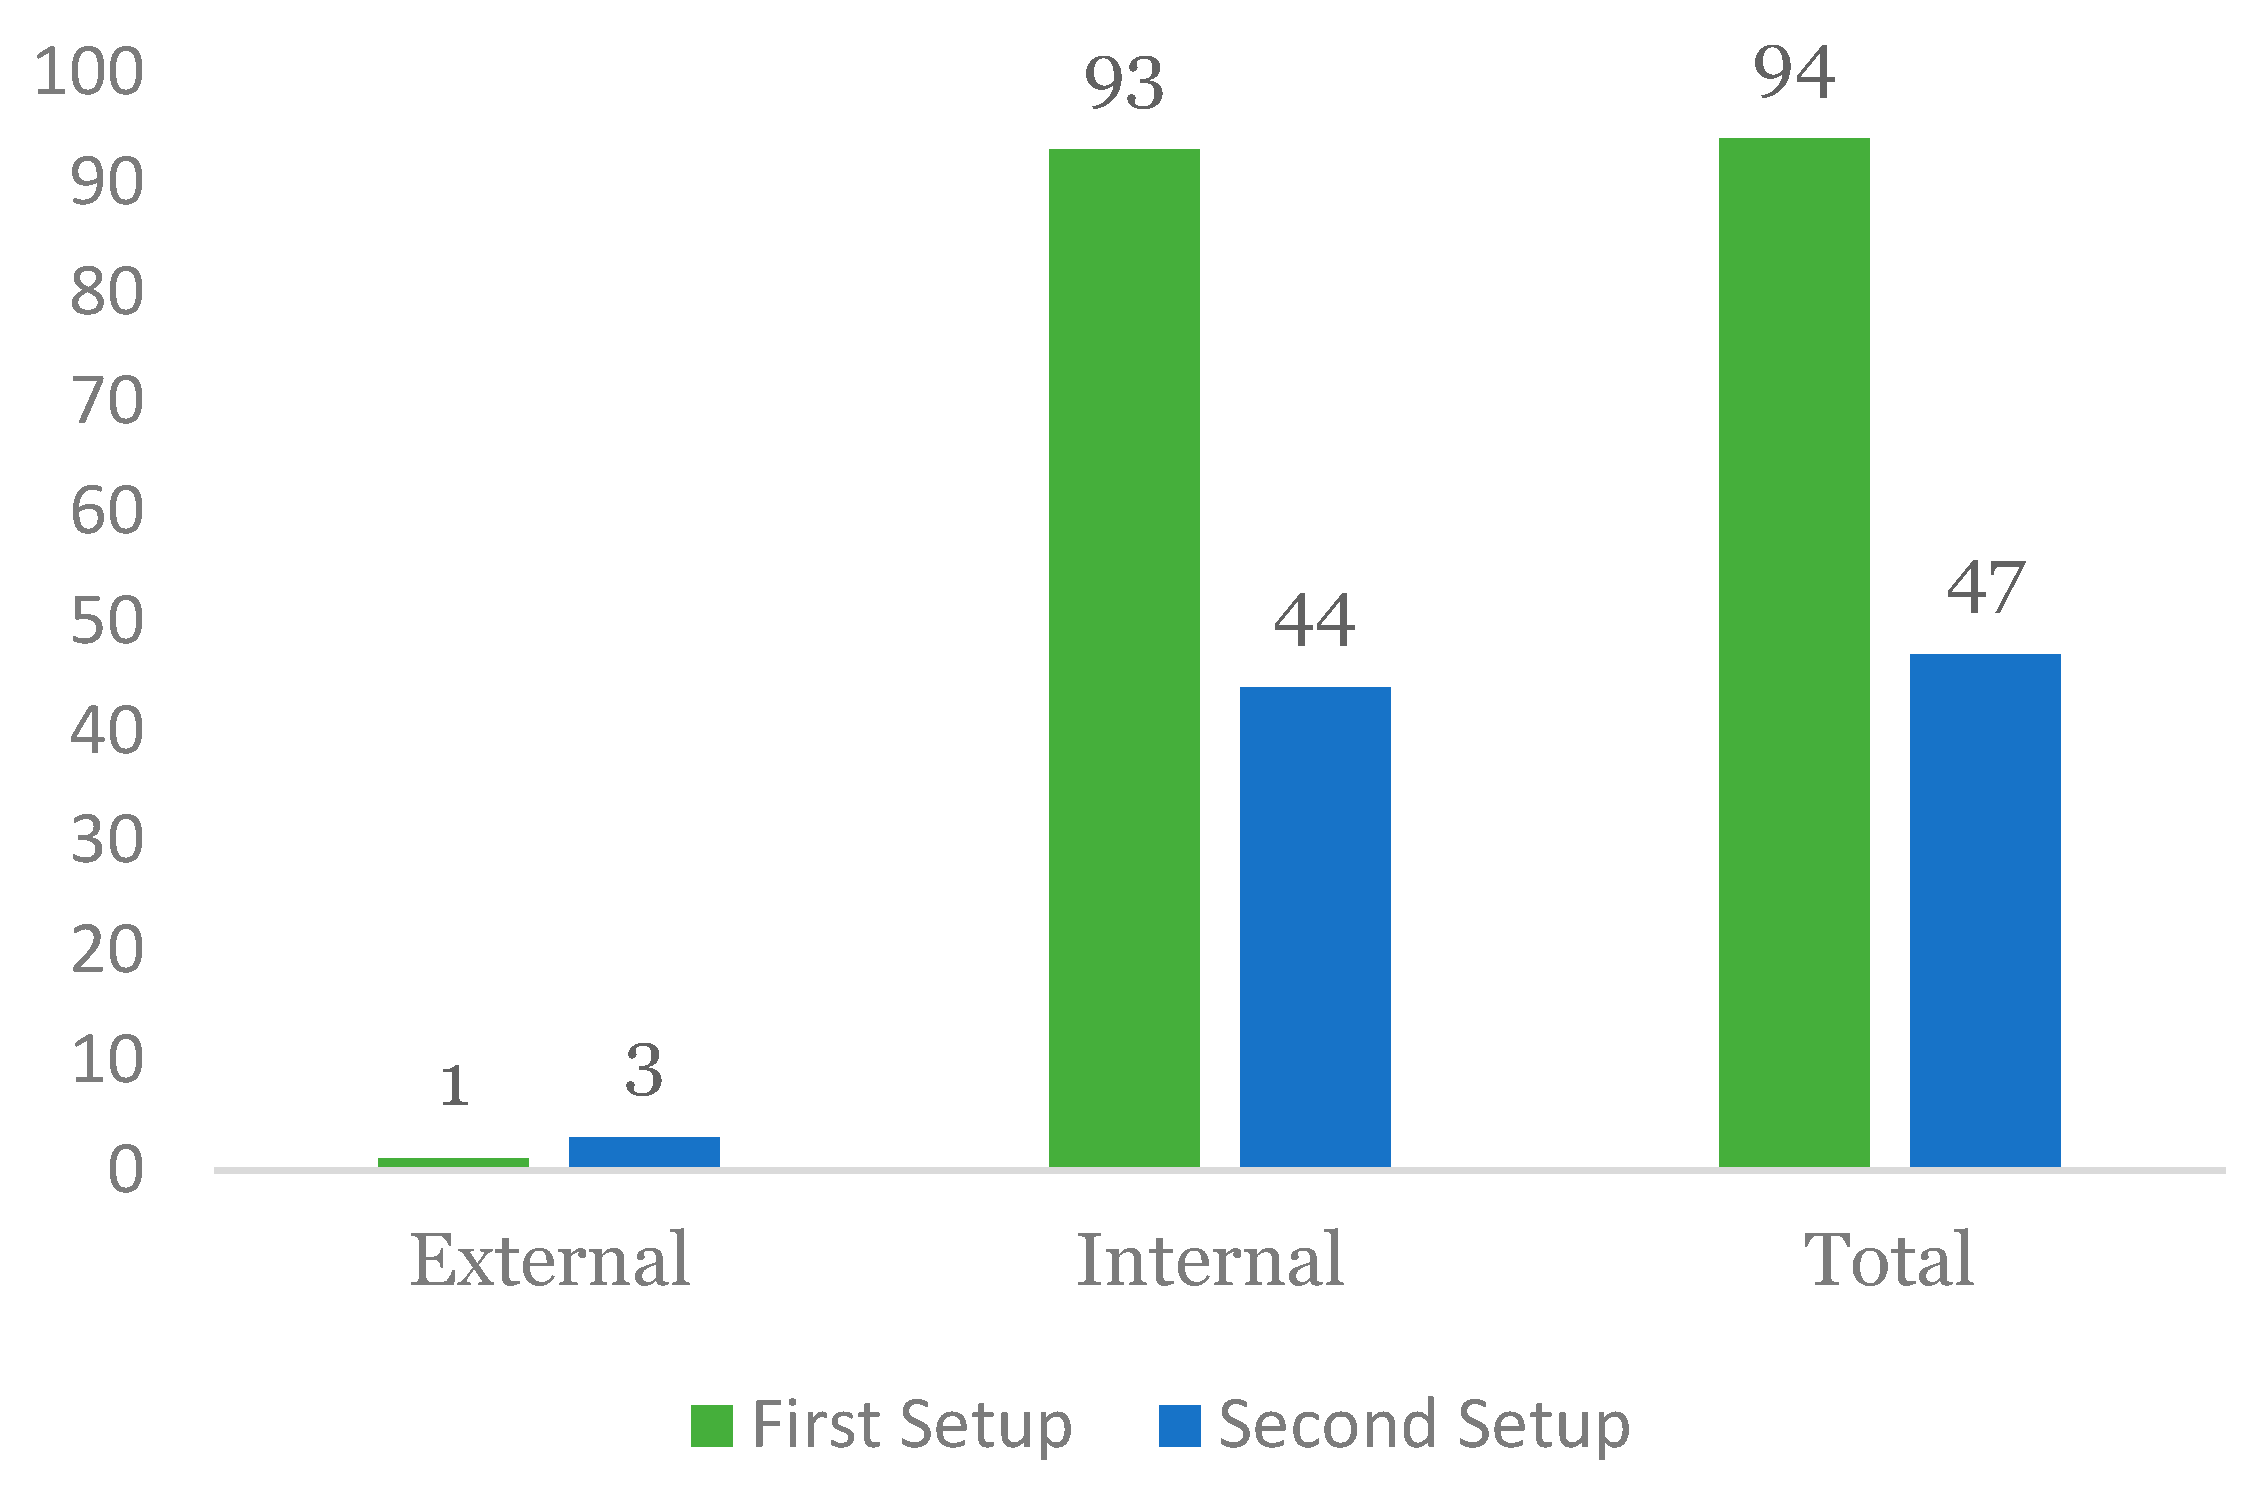
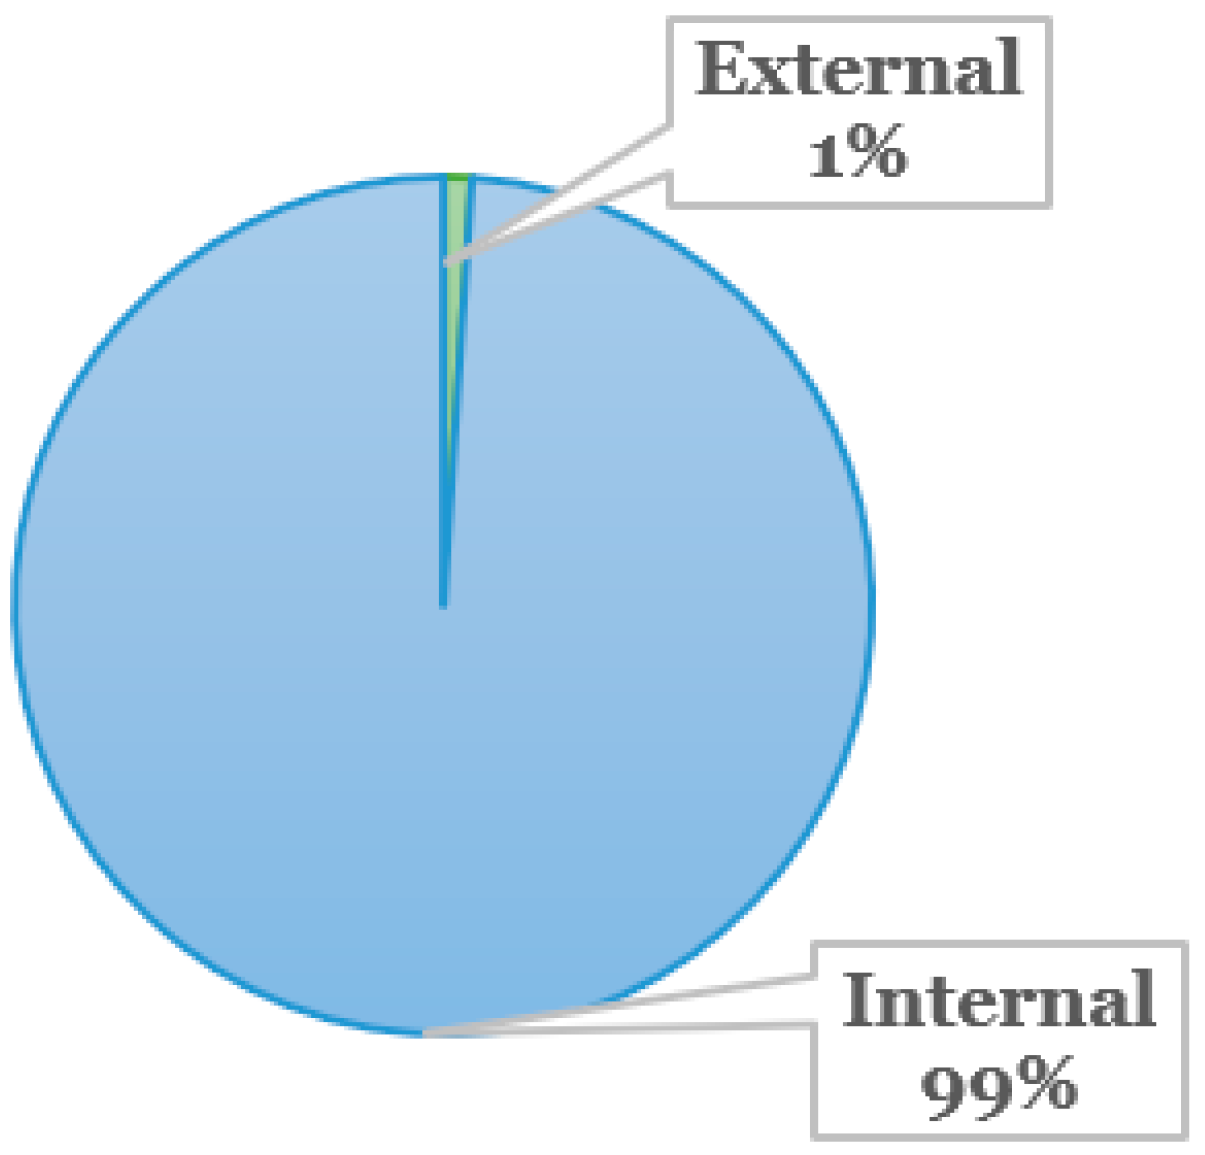
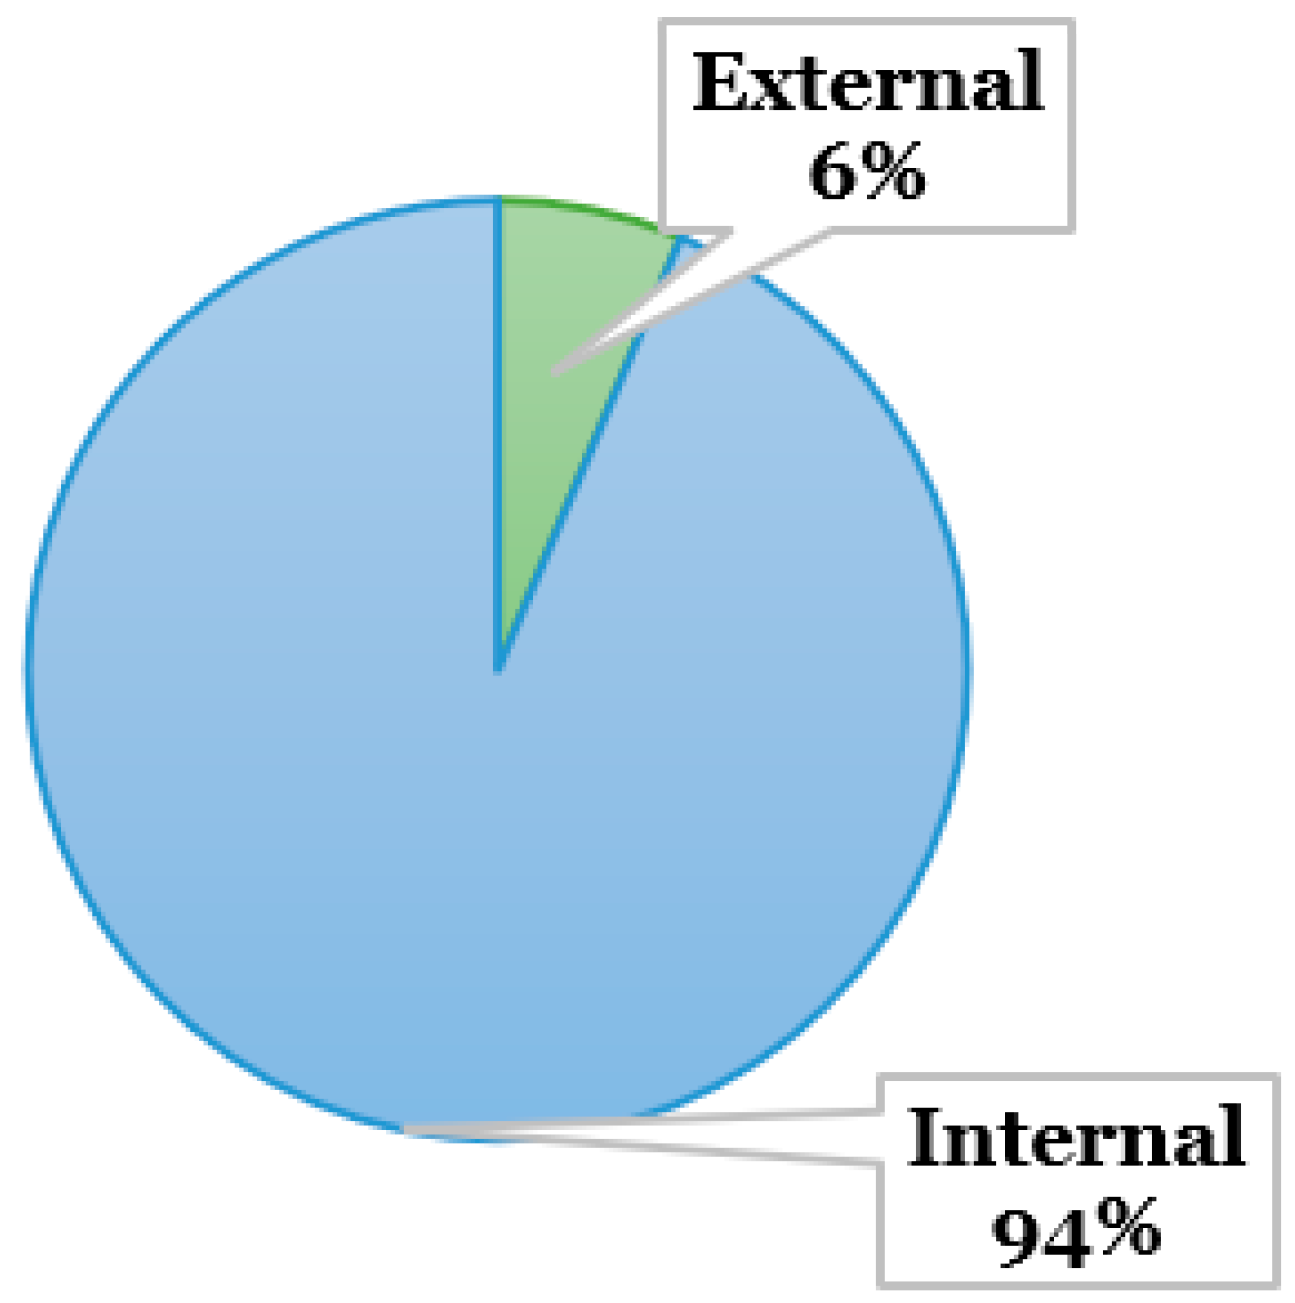
3.2. Internal vs. External Activities
3.3. Process Category and Setup Time
3.4. Standardized Work with Takt-Time
4. Discussion
5. Conclusions
Author Contributions
Funding
Institutional Review Board Statement
Informed Consent Statement
Data Availability Statement
Acknowledgments
Conflicts of Interest
Appendix A

References
- Pinto, G.F.L.; Silva, F.J.G.; Campilho, R.D.S.G.; Casais, R.B.; Fernandes, A.J.; Baptista, A. Continuous improvement in maintenance: A case study in the automotive industry involving Lean tools. Procedia Manuf. 2019, 38, 1582–1591. [Google Scholar] [CrossRef]
- Rosa, C.; Silva, F.J.G.; Ferreira, L.P.; Pereira, T.; Gouveia, R. Establishing Standard Methodologies to Improve the Production Rate of Assembly Lines Used for Low Added-Value Products. Procedia Manuf. 2018, 17, 555–562. [Google Scholar] [CrossRef]
- Tiwari, K.V.; Sharma, S.K. The Impact of Productivity Improvement Approach Using Lean Tools in an Automotive Industry. Process Integr. Optim. Sustain. 2022, 6, 1117–1131. [Google Scholar] [CrossRef]
- Toki, G.F.I.; Ahmed, T.; Hossain, M.E.; Alave, R.K.K.; Faruk, M.O.; Mia, R.; Islam, S.R. Single Minute Exchange of Die (SMED): A sustainable and well-timed approach for Bangladeshi garments industry. Clean. Eng. Technol. 2023, 12, 100592. [Google Scholar] [CrossRef]
- Godina, R.; Pimentel, C.; Silva, F.J.G.; Matias, J.C.O. A Structural Literature Review of the Single Minute Exchange of Die: The Latest Trends. Procedia Manuf. 2018, 17, 783–790. [Google Scholar] [CrossRef]
- Ghobadian, A.; Talavera, I.; Bhattacharya, A.; Kumar, V.; Garza-Reyes, J.A.; O’Regan, N. Examining legitimatization of additive manufacturing in the interplay between innovation, lean manufacturing and sustainability. Int. J. Prod. Econ. 2020, 219, 457–468. [Google Scholar] [CrossRef]
- Velmurugan, V.; Karthik, S.; Thanikaikarasan, S. Investigation and implementation of new methods in machine tool production using lean manufacturing system. Mater. Today Proc. 2020, 33, 3080–3084. [Google Scholar] [CrossRef]
- Kumar, N.; Hasan, S.S.; Srivastava, K.; Akhtar, R.; Yadav, R.K.; Choubey, V.K. Lean manufacturing techniques and its implementation: A review. Mater. Today Proc. 2022, 64, 1188–1192. [Google Scholar] [CrossRef]
- Liker, J.K. The Toyota Way: 14 Management Principles from the World’s Greatest Manufacture; McGraw-Hill: New York, NY, USA, 2004. [Google Scholar]
- Karam, A.A.; Liviu, M.; Cristina, V.; Radu, H. The contribution of lean manufacturing tools to changeover time decrease in the pharmaceutical industry. A SMED project. Procedia Manuf. 2018, 22, 886–892. [Google Scholar] [CrossRef]
- Sugarindra, M.; Ikhwan, M.; Suryoputro, M.R. Single Minute Exchange of Dies as the Solution on Setup Processes Optimization by Decreasing Changeover Time, A Case Study in Automotive Part Industry. IOP Conf. Ser. Mater. Sci. Eng. 2019, 598, 012026. [Google Scholar] [CrossRef]
- Hoefsmit, P.C.; Schretlen, S.; Does, R.J.M.M.; Verouden, N.J.; Zandbergen, H.R. Quality and process improvement of the multidisciplinary Heart Team meeting using Lean Six Sigma. BMJ Open Qual. 2023, 12, e002050. [Google Scholar] [CrossRef] [PubMed]
- Taggart, M.; Willis, C.; Hanahoe, J. Not seeing the wood for the trees—A gemba walk through a timber framed housing development. In Proceedings of the 27th Annual Conference of the International Group for Lean Construction (IGLC), Dublin, Ireland, 3–5 July 2019. [Google Scholar]
- Reynders, P.; Kumar, M.; Found, P. ‘Lean on me’: An integrative literature review on the middle management role in lean. Total Qual. Manag. Bus. Excell. 2022, 33, 318–354. [Google Scholar] [CrossRef]
- Saravanan, R.; Srinivasa Rao, M.S.; Sunkara, N.; Malyadri, T. Six sigma’s ECRS technique to down cost and time of manufacturing-An experimental investigation. AIP Conf. Proc. 2020, 2283, 020070. [Google Scholar] [CrossRef]
- Waiyanet, P.; Khongkaew, P.; Bunvachcharapai, S. Implementation of validate invoice and packing list document process by Microsoft Access a case study of ABC logistics company. In Proceedings of the 2018 5th International Conference on Business and Industrial Research: Smart Technology for Next Generation of Information, Engineering, Business and Social Science, ICBIR, Bangkok, Thailand, 17–18 May 2018. [Google Scholar] [CrossRef]
- Frédéric, R.; Florian, M.; Laurent, J.; Forget, P.; Pellerin, R.; Samir, L. Lean 4.0: Typology of scenarios and case studies to characterize Industry 4.0 autonomy model. IFAC-PapersOnLine 2022, 55, 2073–2078. [Google Scholar] [CrossRef]
- Marinelli, M.; Ali Deshmukh, A.; Janardhanan, M.; Nielsen, I. Lean manufacturing and industry 4.0 combinative application: Practices and perceived benefits. IFAC-PapersOnLine 2021, 54, 288–293. [Google Scholar] [CrossRef]
- Palmqvist, A.; Vikingsson, E.; Li, D.; Fast-Berglund, Å.; Lund, N. Concepts for digitalization of assembly instructions for short takt times. Procedia CIRP 2021, 97, 154–159. [Google Scholar] [CrossRef]
- Balaji, M.; Dinesh, S.N.; Raja, S.; Subbiah, R.; Manoj Kumar, P. Lead time reduction and process enhancement for a low volume product. Mater. Today Proc. 2022, 62, 1722–1728. [Google Scholar] [CrossRef]
- Guzel, D.; Asiabi, A.S. Increasing Productivity of Furniture Factory with Lean Manufacturing Techniques (Case Study). Tehnicki Glasnik. 2022, 16, 82–92. [Google Scholar] [CrossRef]
- Djekic, I.; Tomasevic, I. Tools in Improving Quality Assurance and Food Control. In Food Control and Biosecurity; Academic Press: Cambridge, MA, USA, 2018; pp. 63–104. [Google Scholar] [CrossRef]
- Kharub, M.; Limon, S.; Sharma, R.K. The application of quality tools in effective implementation of HACCP: An empirical study of food and pharmaceutical industries. Int. J. Qual. Reliab. Manag. 2018, 35, 1920–1940. [Google Scholar] [CrossRef]
- Realyvásquez-Vargas, A.; Arredondo-Soto, K.C.; Carrillo-Gutiérrez, T.; Ravelo, G. Applying the Plan-Do-Check-Act (PDCA) cycle to reduce the defects in the manufacturing industry. A case study. Appl. Sci. 2018, 8, 2181. [Google Scholar] [CrossRef]
- Solanki, A.B.; Sonigra, S.S.; Vajpayee, V. Implementation of quality tools and effective strategies to boost production market standards for forged crankshafts: A case study of forging industry. Mater. Today Proc. 2021, 47, 5970–5976. [Google Scholar] [CrossRef]
- Silva, F.L.; Fushita, Â.T.; Cunha-Santino, M.B.; Bianchini, I. Adopting basic quality tools and landscape analysis for applied limnology: An approach for freshwater reservoir management. Sustain. Water Resour. Manag. 2022, 8, 65. [Google Scholar] [CrossRef]
- Barsalou, M. Determining which of the classic seven quality tools are in the quality practitioner’s RCA tool kit. Cogent Eng. 2023, 10, 2199516. [Google Scholar] [CrossRef]
- Siraj, I.; Bharti, P.S. Embedding Quality in Extrusion-Based Additive Manufacturing Technologies. J. Mater. Eng. Perform. 2022, 31, 5100–5117. [Google Scholar] [CrossRef]
- Leone, F.; Viviani, F.; Grech, E.; Villa, R. Wire sweep phenomenon overview by Ishikawa diagram. In Proceedings of the 24th Electronics Packaging Technology Conference, EPTC, Singapore, 7–9 December 2022. [Google Scholar] [CrossRef]
- Sahin, R.; Kologlu, A. A Case Study on Reducing Setup Time Using SMED on a Turning Line. Gazi Univ. J. Sci. 2022, 35, 60–71. [Google Scholar] [CrossRef]
- Basri, A.Q.; Mohamed, N.M.Z.N.; Yasir, K.A.S.H.M.; Fazi, H.M.; Fudzin, A.F. The validation of productivity on the changeover activity at the automotive stamping press line by comparing the embedded SMED framework versus SMED approach: A witness simulation case study. IOP Conf. Ser. Mater. Sci. Eng. Inst. Phys. Publ. 2019, 469, 012005. [Google Scholar] [CrossRef]
- Martins, M.; Godina, R.; Pimentel, C.; Silva, F.J.G.; Matias, J.C.O. A Practical Study of the Application of SMED to Electron-beam Machining in Automotive Industry. Procedia Manuf. 2018, 17, 647–654. [Google Scholar] [CrossRef]
- Vieira, T.; Sá, J.C.; Lopes, M.P.; Santos, G.; Félix, M.J.; Ferreira, L.P.; Silva, F.J.G.; Pereira, M.T. Optimization of the cold profiling process through SMED. Procedia Manuf. 2019, 38, 892–899. [Google Scholar] [CrossRef]


Disclaimer/Publisher’s Note: The statements, opinions and data contained in all publications are solely those of the individual author(s) and contributor(s) and not of MDPI and/or the editor(s). MDPI and/or the editor(s) disclaim responsibility for any injury to people or property resulting from any ideas, methods, instructions or products referred to in the content. |
© 2023 by the authors. Licensee MDPI, Basel, Switzerland. This article is an open access article distributed under the terms and conditions of the Creative Commons Attribution (CC BY) license (https://creativecommons.org/licenses/by/4.0/).
Share and Cite
Oliveira, C.; Lima, T.M. Setup Time Reduction of an Automotive Parts Assembly Line Using Lean Tools and Quality Tools. Eng 2023, 4, 2352-2362. https://doi.org/10.3390/eng4030134
Oliveira C, Lima TM. Setup Time Reduction of an Automotive Parts Assembly Line Using Lean Tools and Quality Tools. Eng. 2023; 4(3):2352-2362. https://doi.org/10.3390/eng4030134
Chicago/Turabian StyleOliveira, Cátia, and Tânia M. Lima. 2023. "Setup Time Reduction of an Automotive Parts Assembly Line Using Lean Tools and Quality Tools" Eng 4, no. 3: 2352-2362. https://doi.org/10.3390/eng4030134