Article

Microsimulation Modelling and Scenario Analysis of a Congested Abu Dhabi Highway

1
Emirates Center for Mobility Research, UAE University, Abu Dhabi 999041, United Arab Emirates
2
Department of Civil & Environmental Engineering, UAE University, Abu Dhabi 999041, United Arab Emirates
*
Author to whom correspondence should be addressed.
Eng 2023, 4(3), 2003-2014; https://doi.org/10.3390/eng4030113
Submission received: 24 April 2023 / Revised: 16 June 2023 / Accepted: 15 July 2023 / Published: 17 July 2023
(This article belongs to the Special Issue Feature Papers in Eng 2023)

Abstract

:
Today’s roadways are subject to traffic congestion, the deterioration of surface-assets (often due to the overreliance on private vehicle traffic), increasing vehicle-operation and fuel costs, and pollutant emissions. In Abu Dhabi, private car traffic forms the major share on urban highways, as the infrastructure was built to a high quality and the public transport network needs expansion, resulting in traffic congestion on major highways. These issues are arguably addressable by appropriate decisions at the planning stage. Microsimulation modeling of driving behavior in Abu Dhabi is presented for empirical assessment of traffic management scenarios. This paper presents a technique for developing, calibrating, validating, and the scenario analysis of a detailed VISSIM-based microsimulation model of a 3.5 km section of a 5-lane divided highway in Abu Dhabi. Traffic-count data collected from two sources, i.e., the local transport department (year 2007) and municipality (2007 and 2015–2016) were used. Gaps in traffic-counts between ramps and the highway mainline were noted, which is a common occurrence in real-world data situations. A composite dataset for a representative week in 2015 was constructed, and the model was calibrated and validated with a 15% (<100 vehicles per hour) margin of error. Scenario analysis of a potential public bus transport service operating at 15 min headway and 40% capacity was assessed against the base case, for a 2015–2020 projected period. The results showed a significant capacity enhancement and improvement in the traffic flow. A reduction in the variation between vehicle travel times was observed for the bus-based scenario, as less bottlenecking and congestion were noted for automobiles in the mainline segments. The developed model could be used for further scenario analyses, to find optimized traffic management strategies over the highway’s lifecycle, whereas it could also be used for similar evaluations of other major roads in Abu Dhabi post-calibration.

1. Introduction

Transport policymakers are often required to implement service provision by prioritizing route design, supply–demand balance, mode-shift uncertainties, and generic passenger attitudes, while working within the confines of social, political, economic, administrative, and environmental thresholds [1,2]. Alawadi [3] noted that transparent and inclusive transport planning policy is required for multicultural and climate-sensitive cities, where different population groups need to be included within the decision-making process, particularly regarding the argument between linear and scattered development of urban designs. Traffic control-related strategies are important for achieving long-term goals, since they affect fleet-management systems and enhance urban traffic flow. For example, focusing on traffic routing conditions, eco-driving and eco-routing both aim to cut pollutant generation and energy use through traffic congestion reduction, while optimizing different aspects [4].
Other studies have argued that the car-centric urban design of cities can promote unsustainable mode choices, such as overreliance on private cars for urban mobility, instead of public transport or micro-mobility options [5]. Hence, transport agencies gauge three policymaking issues: the optimal grouping of variables predicting passenger travel patterns; the magnitude of probable temporal divergence trends; and whether this divergence in travel behavior could be directed towards a sustainably optimal option through control of variable combinations. Passenger satisfaction with the existing public transport service, alongside public-expected service quality attributes, may aid decision-makers in increasing public transport user uptake [6,7], towards the ultimate lifecycle environmental asset management goal of a low carbon city.
In Abu Dhabi, the transport infrastructure was built to the highest international standards, but it is car-centric [8], which resulted in approximately 80% of the passengers opting for private and shared car transport in most regions of Abu Dhabi [9]. The majority of the population in Abu Dhabi, similar to other Gulf Cooperation Countries (GCC), are male expatriates from South Asian and Middle Eastern countries as a full-time workforce, with a monthly income profile at an average of USD 1000 [10]. The transport plans of the Abu Dhabi transport authorities and policy-makers target shifting the mode choice of these expatriate resident population groups from private cars to more sustainable transit modes, such as public transport [11], since it may be more complicated to trigger a shift in the mobility choices of the so-called wealthier population groups, due to social status and income dynamics [12].
It is critical to project the expected benefits in terms of travel time savings, reductions in congestion, etc., that would potentially result from adoption of public transport on major highways. Microsimulation modeling can be used to understand a high-resolution per vehicle change in the traffic flow profile, but this requires proper model development for the studied region’s driving behavior [13]. Contrary to macroscopic models that use aggregated quantities to describe the traffic flow and are easier to calibrate, microscopic or microsimulation models are more complex to calibrate but give more details about the traffic flow profile once the traffic flow characteristics of a region’s car-following behavior have been properly modelled.
This research aimed to develop, calibrate, and validate a VISSIM-based microsimulation model, to reveal the car-following behavior of Abu Dhabi city, as a representative of the GCC and Middle Eastern drivers, where such models are not highly used for research and traffic management policy evaluations. However, the majority of sustainable road research in the region has focused on alternate material research [14] and traffic safety behavioral studies from a psychological response perspective [15,16], with minimal attention to actually modeling the driver behavior. The model was then applied to analyze the efficacy of extending public transport services to a major highway in the City of Abu Dhabi, using in-field data and traffic projection models, which can be used to perform scenario modeling of not only traffic management strategies, as demonstrated here, but traffic safety research when considering the impact of flow management policies on changes in aggressive driving behavior.

2. Background

Traffic congestion due to excessive private car usage by urban residents is a serious concern, in terms of the overall sustainability of road transportation systems, while also affecting the journey experience and travel times [17]. Built-up regions and open space geometries have a profound influence on the morphologies of cities, traffic mobility, and congestion, due to the topological links between such spaces, spatial identities, and the concentrations of people, goods, and services. Street metrics characterize the urban typologies and affect the flow of traffic in a city [18]. This indirectly affects the mode choice and traffic flow pattern of residents and, as such, city design should acknowledge these metrices and their eventual impact on traffic and congestion pocket formation. According to Gao et al. [19], in locations with higher traffic densities, repeated automobile deceleration–acceleration cycles result in excessive fuel consumption. Likewise, the journey time of any major expressway is dependent upon vehicle-fleet speeds, deceleration–acceleration, flow rates, and traffic densities. The traffic volume rises each year, corresponding to a sharp decline in engine speeds and vehicle velocities, as the saturation flow rate for the highway is reached, as is also evident in the transport literature [19].
Public-transport-based solutions are recognized as alleviating traffic congestion, user time delays, road deteriorations, and for reducing costs and the energy and pollutant burden in major cities [20]. Public transportation projects, in any form, are aimed at assuaging congestion from overcrowded road networks. For example, studies [21,22] have noted the adverse effect of accessibility, journey time, network coverage, and on-board crowding, etc., on public intention to use public transport. Similarly, at a rudimentary service level, public bus transport can either serve as a feeder network to the largescale BRT or LRT mobility services or act as an early proof-of-concept in a crowded metropolitan area, before the overhaul of a transit network from car-centric to more sustainable transit modes. To that end, the travel habits and mode choices of existing transit users may be directed in favor of sustainable public transit services by traffic management policies that cater better to user needs and improve their journey attributes. A study by Hensher [23] on bus operators in Australia investigated the perception of buses on the basis of service quality and performance indices, and a methodology for cost per kilometer and commuter perception of quality of service by operators was established. Lavery et al. [24] found travel satisfaction motivated passengers towards a pro-environmentalist (e.g., public bus service) approach.
As stated earlier, simulating the per vehicle change in the traffic flow profile can show immediate changes as a result of different traffic management strategies. This work argues that, in addition to this, traffic growth models can be used to project the benefits over extended periods of time, particularly when relieving daily traffic congestion is a concern. It should be noted that none of these benefits can be assessed without properly creating, calibrating, and validating a dedicated microsimulation model. Although, some macroscopic models exist for the urban planning purposes in Abu Dhabi and the GCC region at large [16,25], these are largely concerned with personal mobility or alternate vehicle type evaluations and do not model the general driving behavior of the city’s residents on a major urban road, which is required to compare different traffic management strategies at a micro level.
On a global scale, many studies have incorporated variables such as vehicle acceleration–deceleration profiles, congestion wave speed, jam densities, and free-flow speeds to create and calibrate vehicle simulation models [26]. Others [27,28] have utilized a microsimulation calibration approach to present accurate car-following driving behavior and traffic flow profile models using software such as VISSIM and AIMSUN; however, these approaches were within a limited demographic context. The case study Abu Dhabi region has a much more diverse population, with a majority of expatriates and residents from over 200 nationalities, which makes it critical to create a dedicated and well-calibrated microsimulation model for simulating its daily traffic and evaluating future traffic management strategies. It is the largest emirate, as well as the federal capital of the United Arab Emirates, with a population of over 1.8 million urban residents, a population density of 1900 person per km2, and estimated land-size of 972 km2. Approximately 85% of the population are the expatriate workforce, and while this ratio may be higher or lower in other GCC countries, the distribution is similar, with expatriates still forming the largest share of the population [29,30].
Generally, developing transit policies to achieve a mode shift in favor of public transport is a broad concept. The psychometric properties of passenger satisfaction is often complicated by various underlying and interdependent factors, such as travel bias, public transit quality attributes (journey time, transit stations, accessibility etc.), travel cost, ride quality, and service frequency [31,32]. This is covered in a separate study under the umbrella of this project. Nonetheless, that study [33] yielded interesting observations, providing a foundation for this exploration of the impact of implementing a traffic management strategy in the study region for improving public (bus service) transit ridership based on public requirements. The project deals with altering travel habits, user perception, reducing congestion, and alleviating the pressure of car traffic from major highways in the city of Abu Dhabi. The findings of this work could help towards meeting the energy consumption and pollutant decrement goals of local authorities at a micro level, while also producing real-time improvements in the journey of passengers on a case study highway.

3. Methodology

This project aimed to utilize the power of VISSIM microsimulation software for modelling traffic flow behaviors, delays, and queue formations for a case study road section located near the main modern shopping areas, business districts, and offices in the city. It begins at Sheikh Zayed Bridge (both a major bridge and a tourist attraction connecting the island of Abu Dhabi to the mainland) and winds its way around Abu Dhabi’s eastern edge, until it meets Corniche Road (a 8 km road along the Abu Dhabi beach, parks, tourist, and recreational facilities). An existing four-lane road was extended and repaired to finish the project in 2009.
The Abu Dhabi transport department and municipality originally measured traffic-counts as vehicle volumes at continuous 15 min intervals in November 2007 for both inbound and outbound traffic, considering all vehicle types (passenger cars, vans and coaches, minibuses, light, and heavy trucks). However, the data were only gathered for the traffic stations located before the HW3 and HW5 traffic stations (location is off frame in Figure 1) and lacked data for all the traffic-count stations displayed in Figure 1. Subsequent traffic-counts were gathered by the Abu Dhabi Municipality between July 2014 and July 2016 for inbound traffic but only for ADM4 (location is off frame in Figure 1), which was located right before the HW3 traffic station on the mainline freeway. Nonetheless, the traffic surveys revealed that the peak traffic periods in Abu Dhabi are
  • Morning-peak: 07:00 a.m.–08:00 a.m.
  • Afternoon-peak: 14:00 p.m.–15:00 p.m.
  • Evening-peak: 19:00–20:00
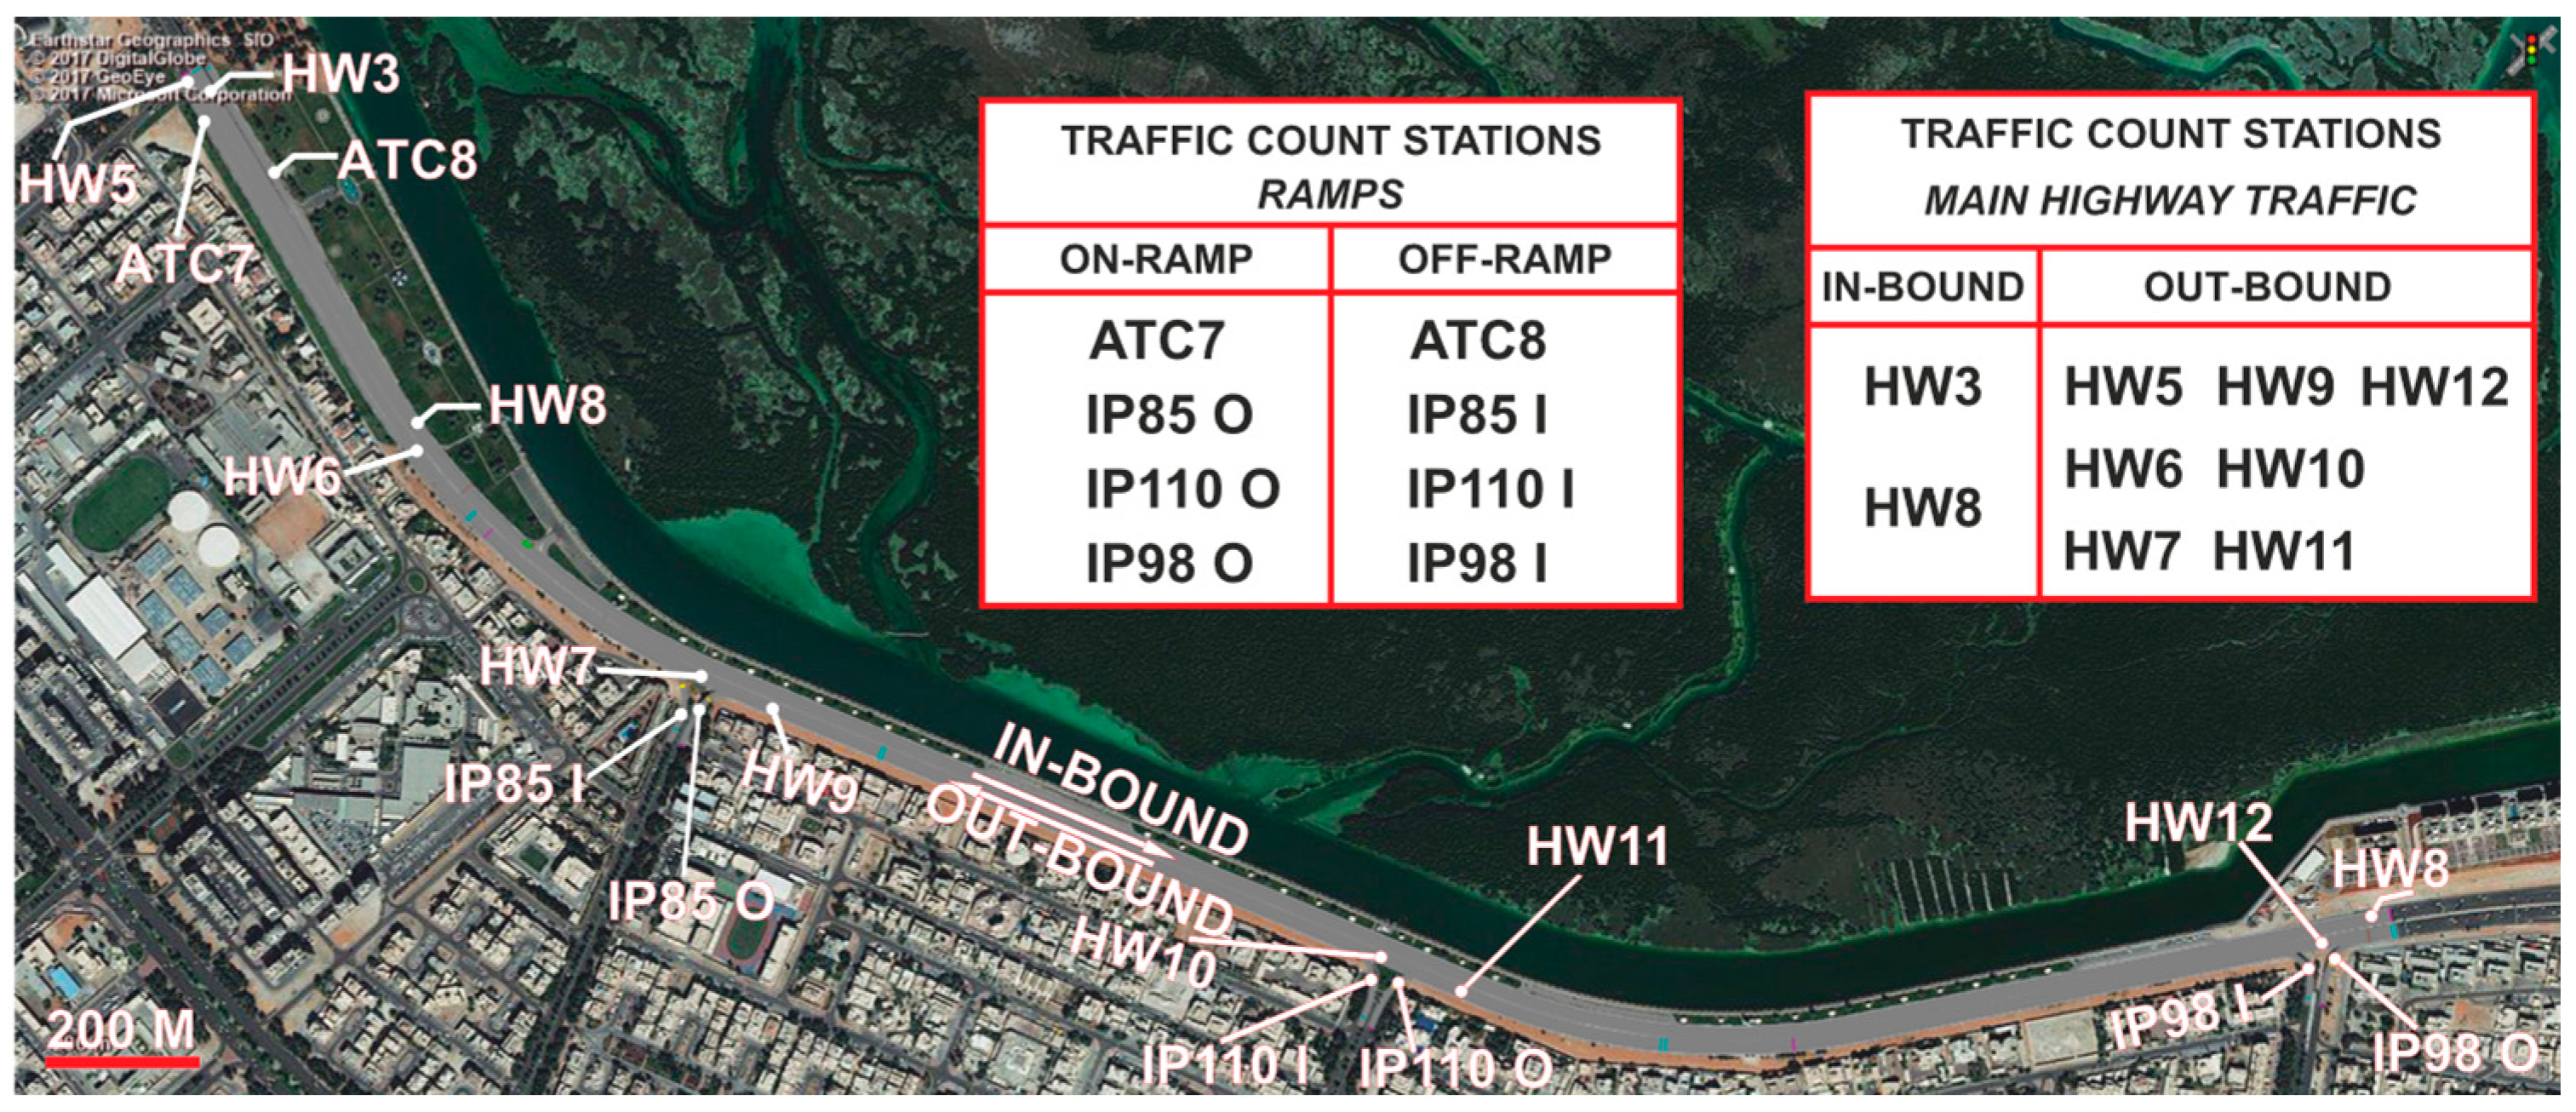
  • A median traffic-count on 27 April 2015 was also gathered by the Abu Dhabi Municipality, covering all the traffic-count stations displayed in Figure 1 for the peak 7 a.m. time. Although lacking counts for other time periods, this count created a comprehensive dataset of the traffic in- and outbounds on the case study road, as recorded by all of the traffic stations. Figure 1 illustrates the traffic-count station locations. This random distribution of traffic-count days and locations is a common occurrence in real-world data situations, as noted by Gomes et al. [34]. Therefore, the first stage was to gather 24 h traffic-counts for a representative single week (inclusive of both weekdays and weekends). An initial review of both “Year 2007” and “Years 2015–2016” traffic-counts exhibited a general agreement between the traffic flow behavior observed from both sources.
Figure 1. Case study section of Sheikh Zayed bin Sultan Street and traffic-count station locations.
Eng 04 00113 g001
This study had 2015 set as its base year, as this was the latest common traffic-count year between both inbound and outbound traffic volumes. Initially, the traffic-count for the stations HW5 and HW3 was estimated and the missing data from the Abu Dhabi Municipality for outbound traffic were estimated by separately calculating the traffic level ratios between the inbound and outbound traffic from the “Year 2007” counts for weekdays and weekends and multiplying by the inbound traffic volumes from “Year 2015”, to generate the approximate outbound traffic volumes for the traffic stations located before HW5 and HW3, as shown in Equation (1) for 2015.
ρ o ( k ) λ m b a s e y e a r o u t b o u n d t r a f f i c c o u n t = ρ i ( k ) λ m b a s e y e a r i n b o u n d t r a f f i c c o u n t × ρ o ( k ) α λ m ρ i ( k ) α λ m 2007 t r a f f i c c o u n t
where “ρo(k) λm” and “ρi(k) λm” are traffic-counts at outbound and inbound station “k” on mainline “m” for any hour “λ”, respectively. The outbound traffic volume for the peak at 7 a.m. on 27 April 2015 traffic was then used to estimate the traffic volumes for all of the traffic-counting stations displayed in Figure 1 using Equation (2) below, where “ρo(k) ƛm” is the peak 7 a.m. traffic for any traffic station “k”.
ρ o ( k ) λ m = ρ o ( k 1 ) λ m × ρ o ( k ) ƛ m ρ o ( k 1 ) ƛ m m a i n l i n e t r a f f i c ρ o ( k 1 ) λ r ¯ ¯ × ρ o ( k ) ƛ r ¯ ¯ ρ o ( k 1 ) ƛ r ¯ ¯ o f f r a m p t r a f f i c + ρ o ( k 1 ) λ r × ρ o ( k ) ƛ r ρ o ( k 1 ) ƛ r o n r a m p t r a f f i c
After the traffic volumes for all the traffic-counting stations were computed for two representative weeks (for calibration and validation), week 1 traffic data were then used to model OD matrices for the simulation of the current traffic situation in the case study area.

Developing a VISSIM Microsimulation Model

The studied 3.5 km dual-carriageway section was modelled in VISSIM with a 3.65 m single lane’s width apart from the shoulder/exit-lanes, with a 3 m width in each direction. Traffic profiles, comprising the fleet composition, vehicle types, and distribution of 2D/3D models, are based on previous literature and the provision of preliminary data by the Abu Dhabi Municipality and the Abu Dhabi Department of Transport.
The lane behavior and speed profile were developed based upon the field observations gathered by the authors on several site visits to the case study location and local laws in the City of Abu Dhabi. Minibuses, vans and coaches, and HGVs were barred from entering the two extreme-left high-speed lanes, and driving behavior was modelled as per the right-hand side driving rule. The speed profile of the different vehicles was based on the minimum and maximum on-site posted speed limits for the case study road.

4. Results and Analysis

4.1. Current Traffic Situation

Figure 2 presents the current traffic situation on the studied case study highway section. The workday commencement resulted in 7–8 a.m. workdays peaks, corresponding to morning rush hours. This is especially relevant for passenger car traffic of small- (8700 units) and regular-sized cars (7200 units). The 2–3 p.m. time window corresponds to lunch break hours, once more exhibiting a higher traffic density and spike in car traffic. Similarly, the work day end traffic of 7–8 p.m. again showed this traffic pattern.
The period from 8th to 9th May 2015 corresponds to a weekend, and thus the trend for peak hour periods was representative of a conventional non-working day. The traffic peak period trends were hence indicative of typical non-working day flow patterns; for example, the resident travel behaviors for leisure reasons may have been responsible for showing the 5–7 p.m. passenger car traffic peak. The results exhibit the predominant contribution of cars to the overall traffic situation, as well as advantage of potentially introducing a public transport service as an alternate traffic management strategy.

4.2. Calibration of the VISSIM Microsimulation Model

The model was primarily run with the default car-following and driving behavior parameters provided in the VISSIM settings, based on the Wiedemann 99 Freeway (free lane selection) model. Traffic-counts for week 1 from the representative weekday traffic dataset calculated above were utilized to provide the OD matrix. The model run results at per-hour resolution for the entire week are graphed alongside the field-based vehicle flow profiles (vehicles/hour) in Figure 3. The first simulation run resulted in several errors, with >2000 vehicles becoming lost vehicles and disappearing after waiting more than 60 s to change lanes. In general, the simulation model failed to achieve the GEH cut-off criteria of under 5 (85% cases).
As a consequence of the simulation output from the model being constructed based on default parameters differentiating from the field data, especially for the peak period traffic volumes, the driving behavior was modified and the model was run several times. Figure 4 shows the simulation results for a calibrated model constructed after several rigorous trial-and-error runs, to develop a microsimulation model replicating the field-based measurements as closely as possible. Even though the simulated traffic volumes varied from the field data for some peak hours, the variation in traffic volume was negligible and within a 15% error (<100 vehicles per hour).

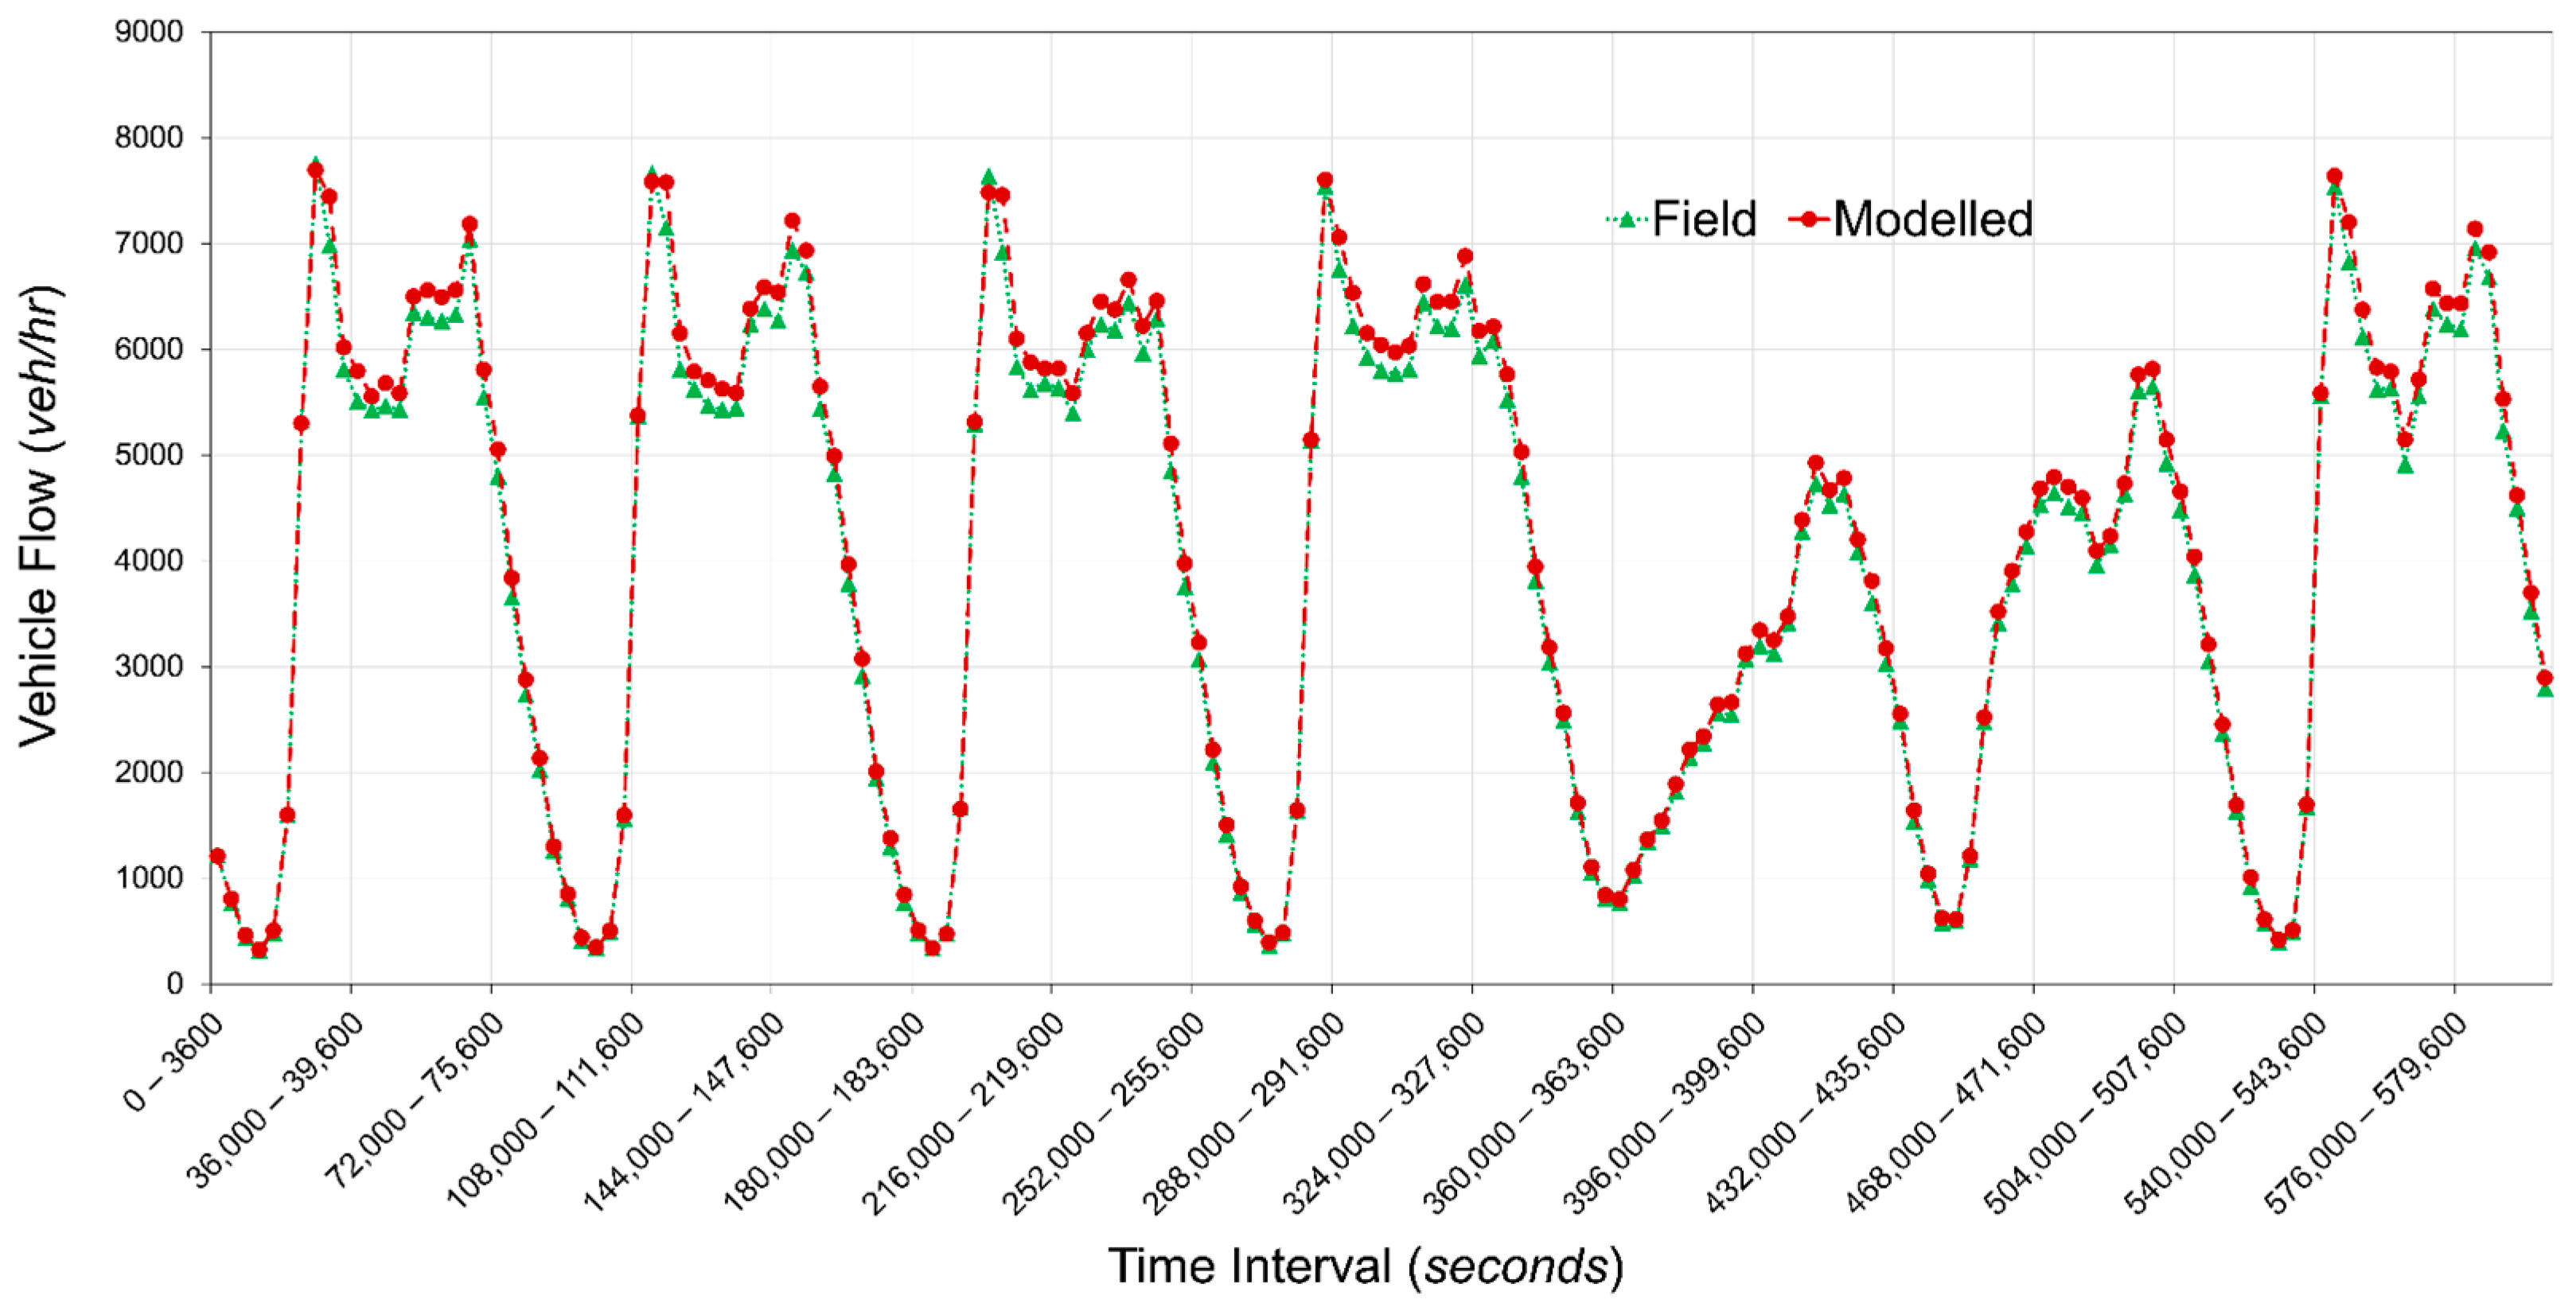
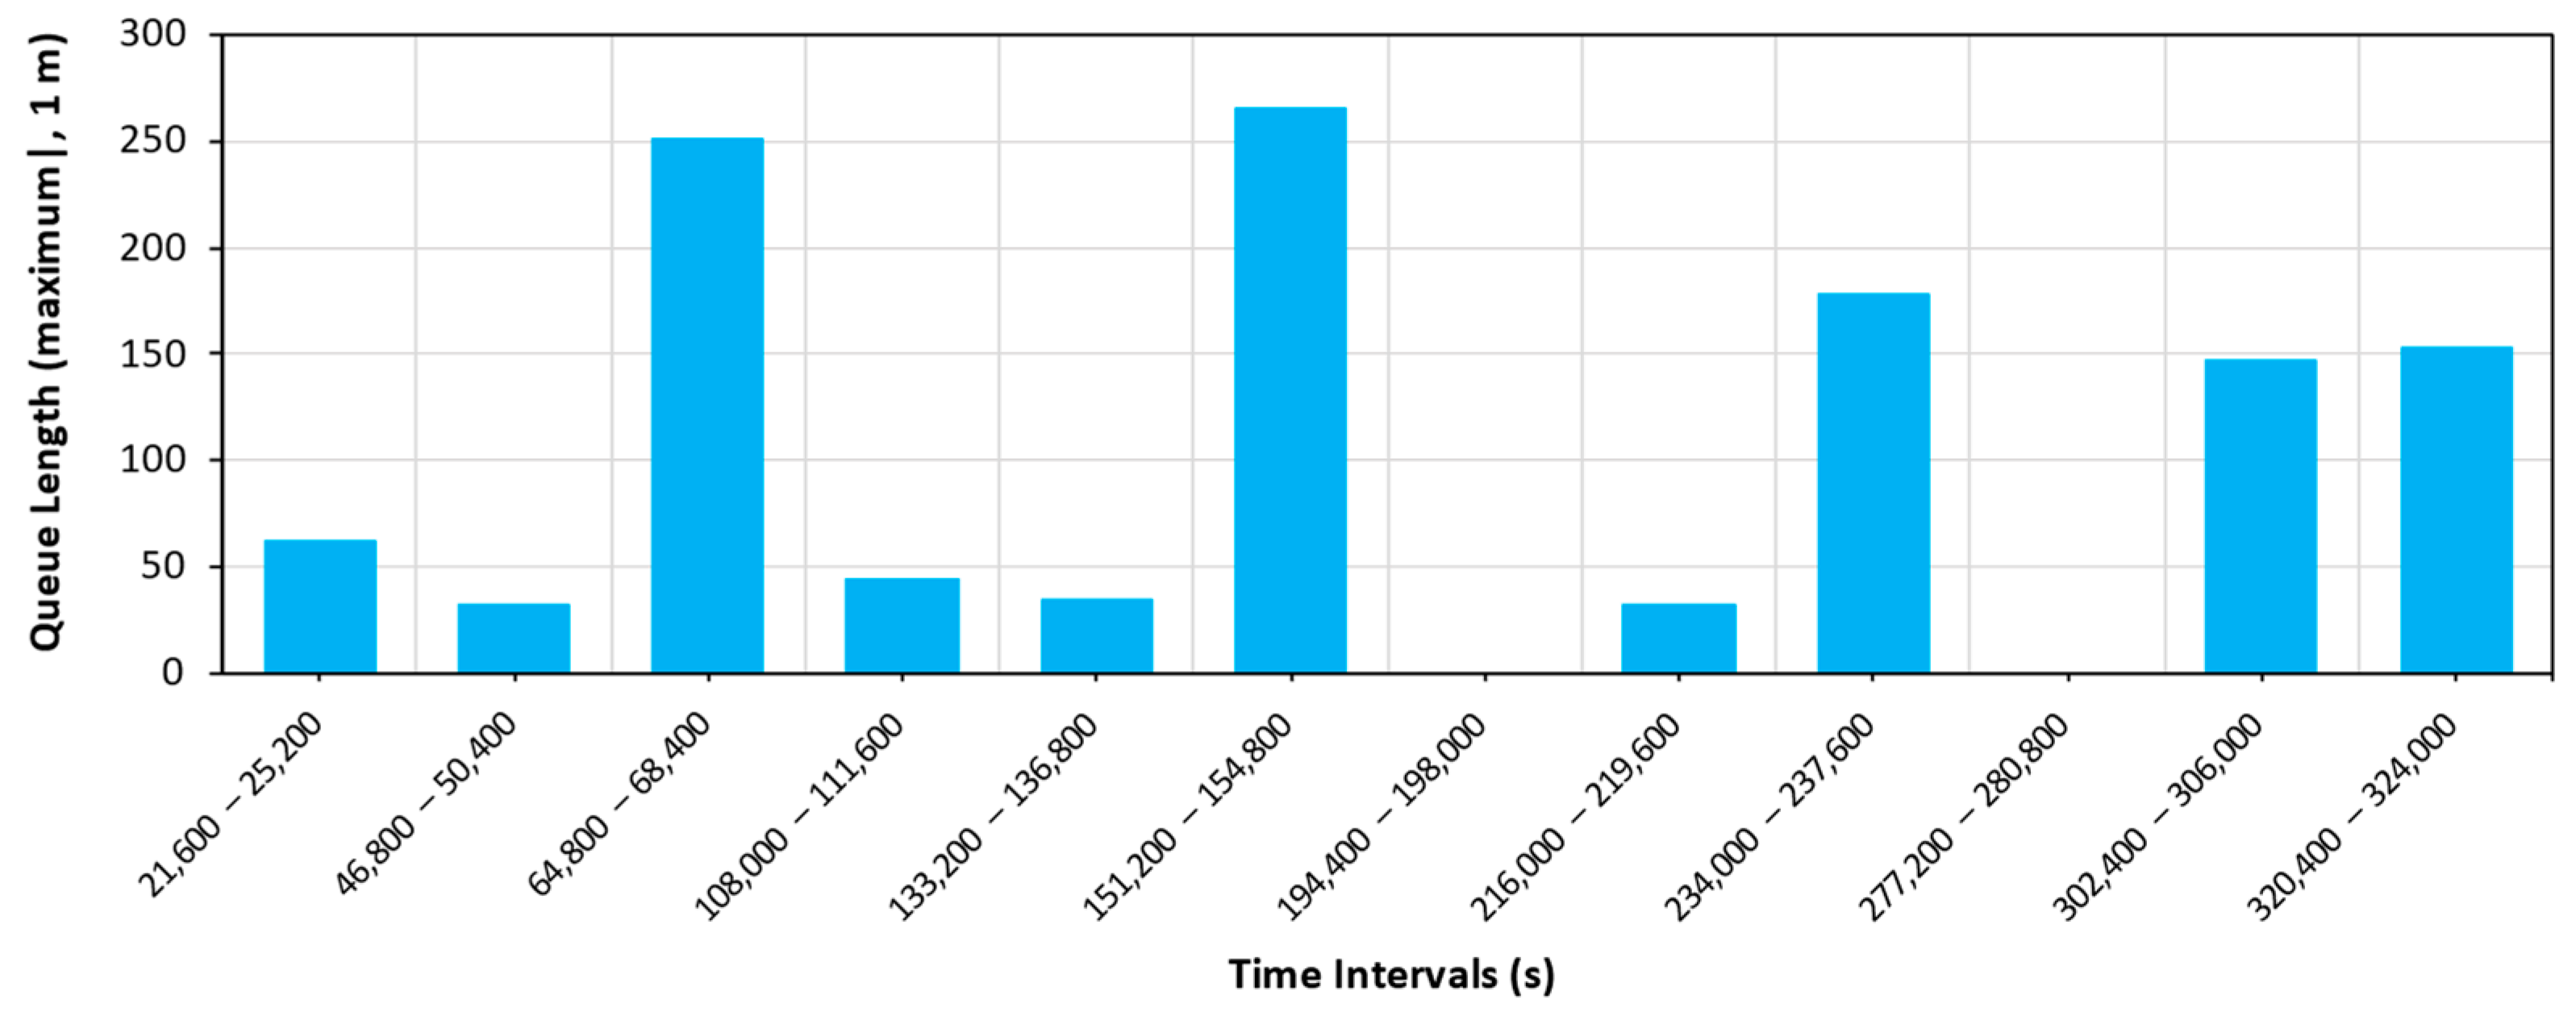
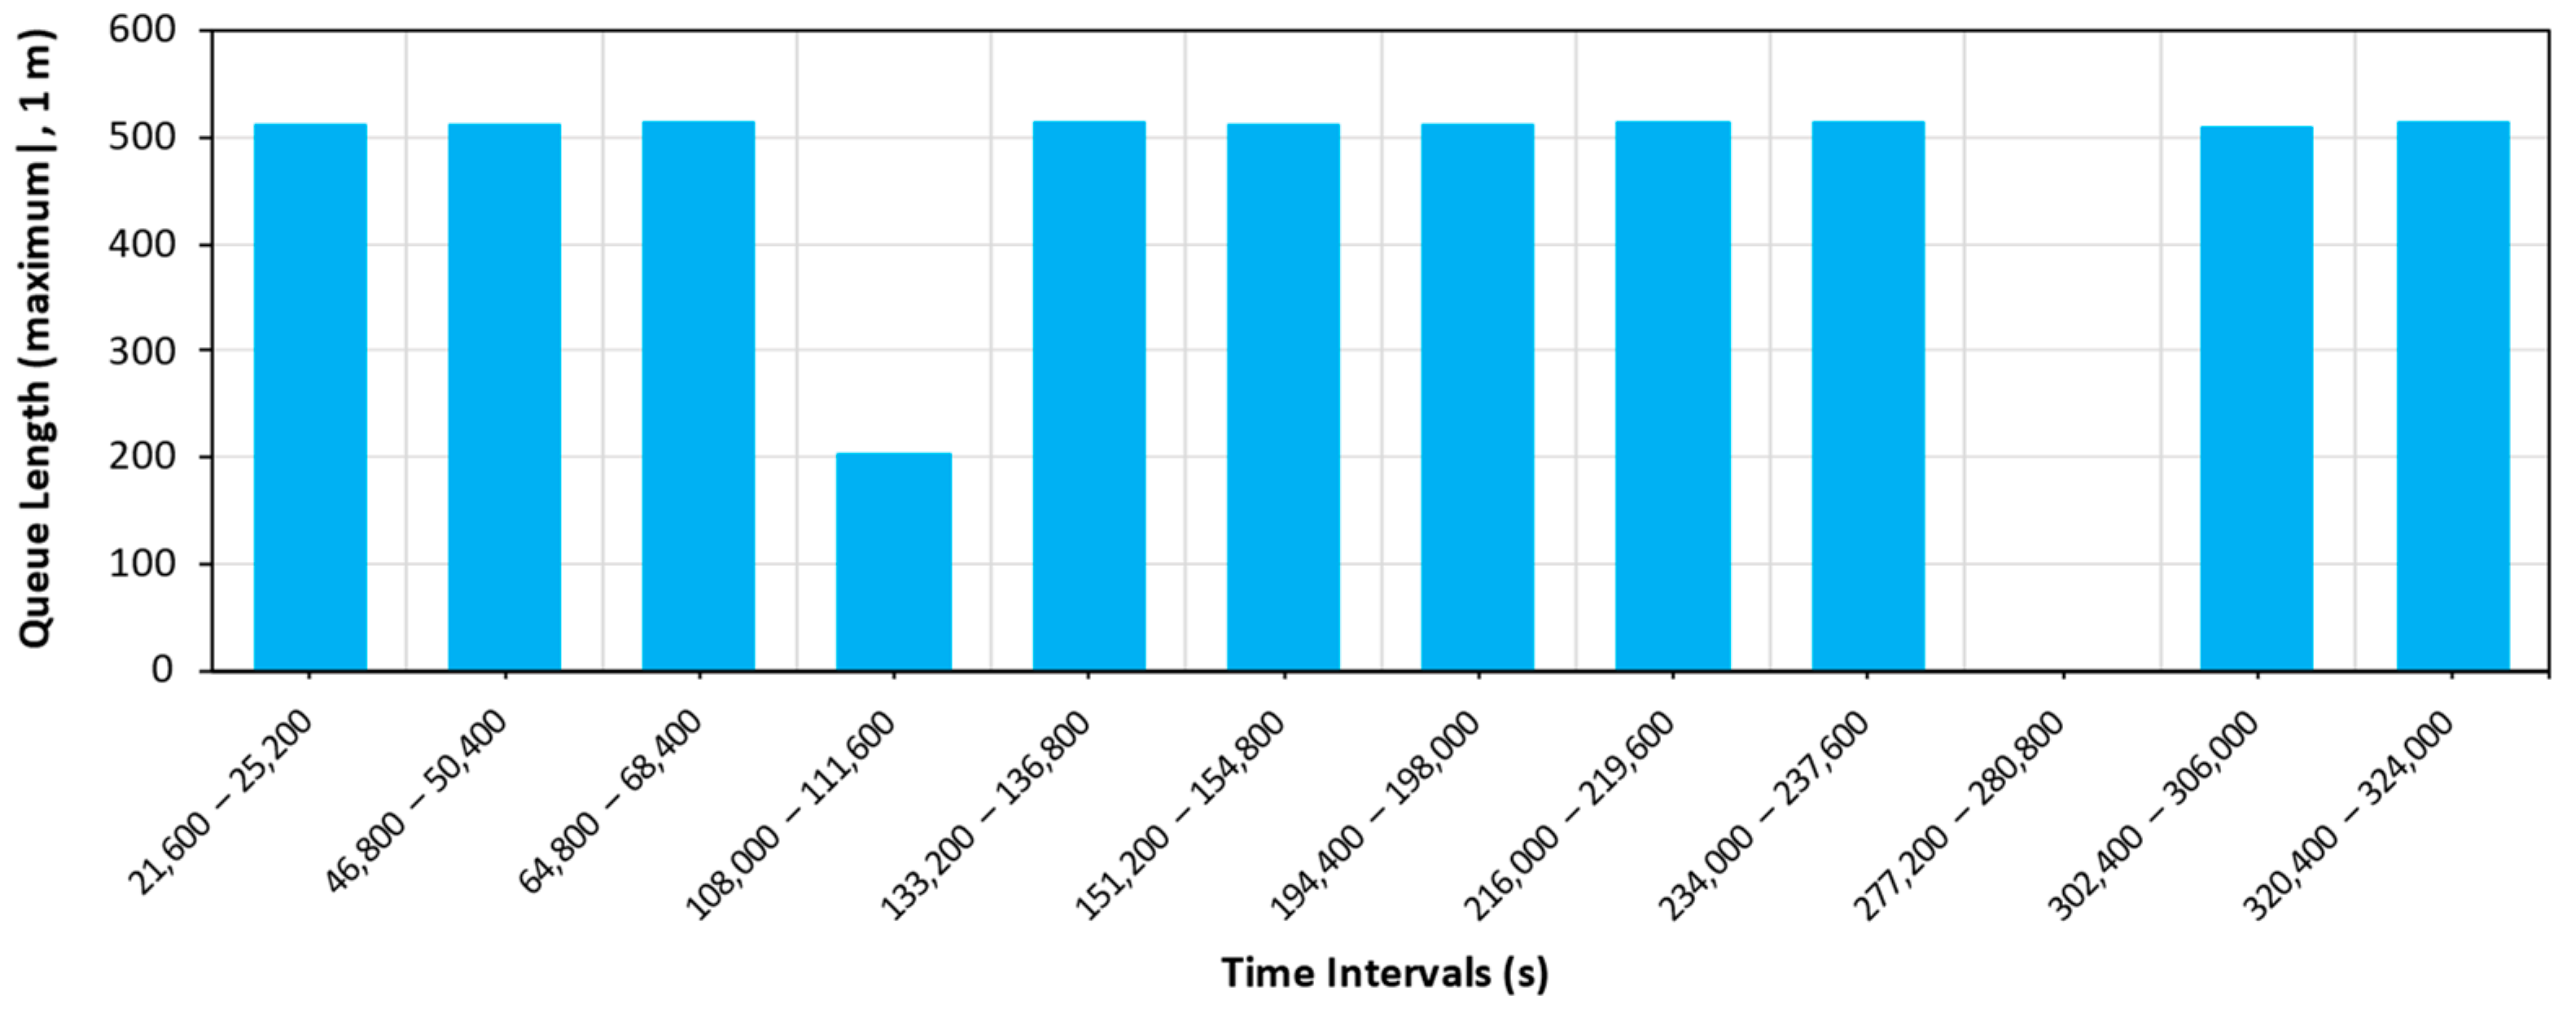
4.3. Validation of the VISSIM Microsimulation Model

The calibrated base case model was then validated using the week 2 traffic-count data applied to the constructed microsimulation model. Figure 5 illustrates the evaluation of the field-based and modelled traffic-volume profiles. It may be deduced from the results that, apart from some minor errors, the simulated traffic-counts successfully replicated the field traffic conditions, as the error was within the required bounds.

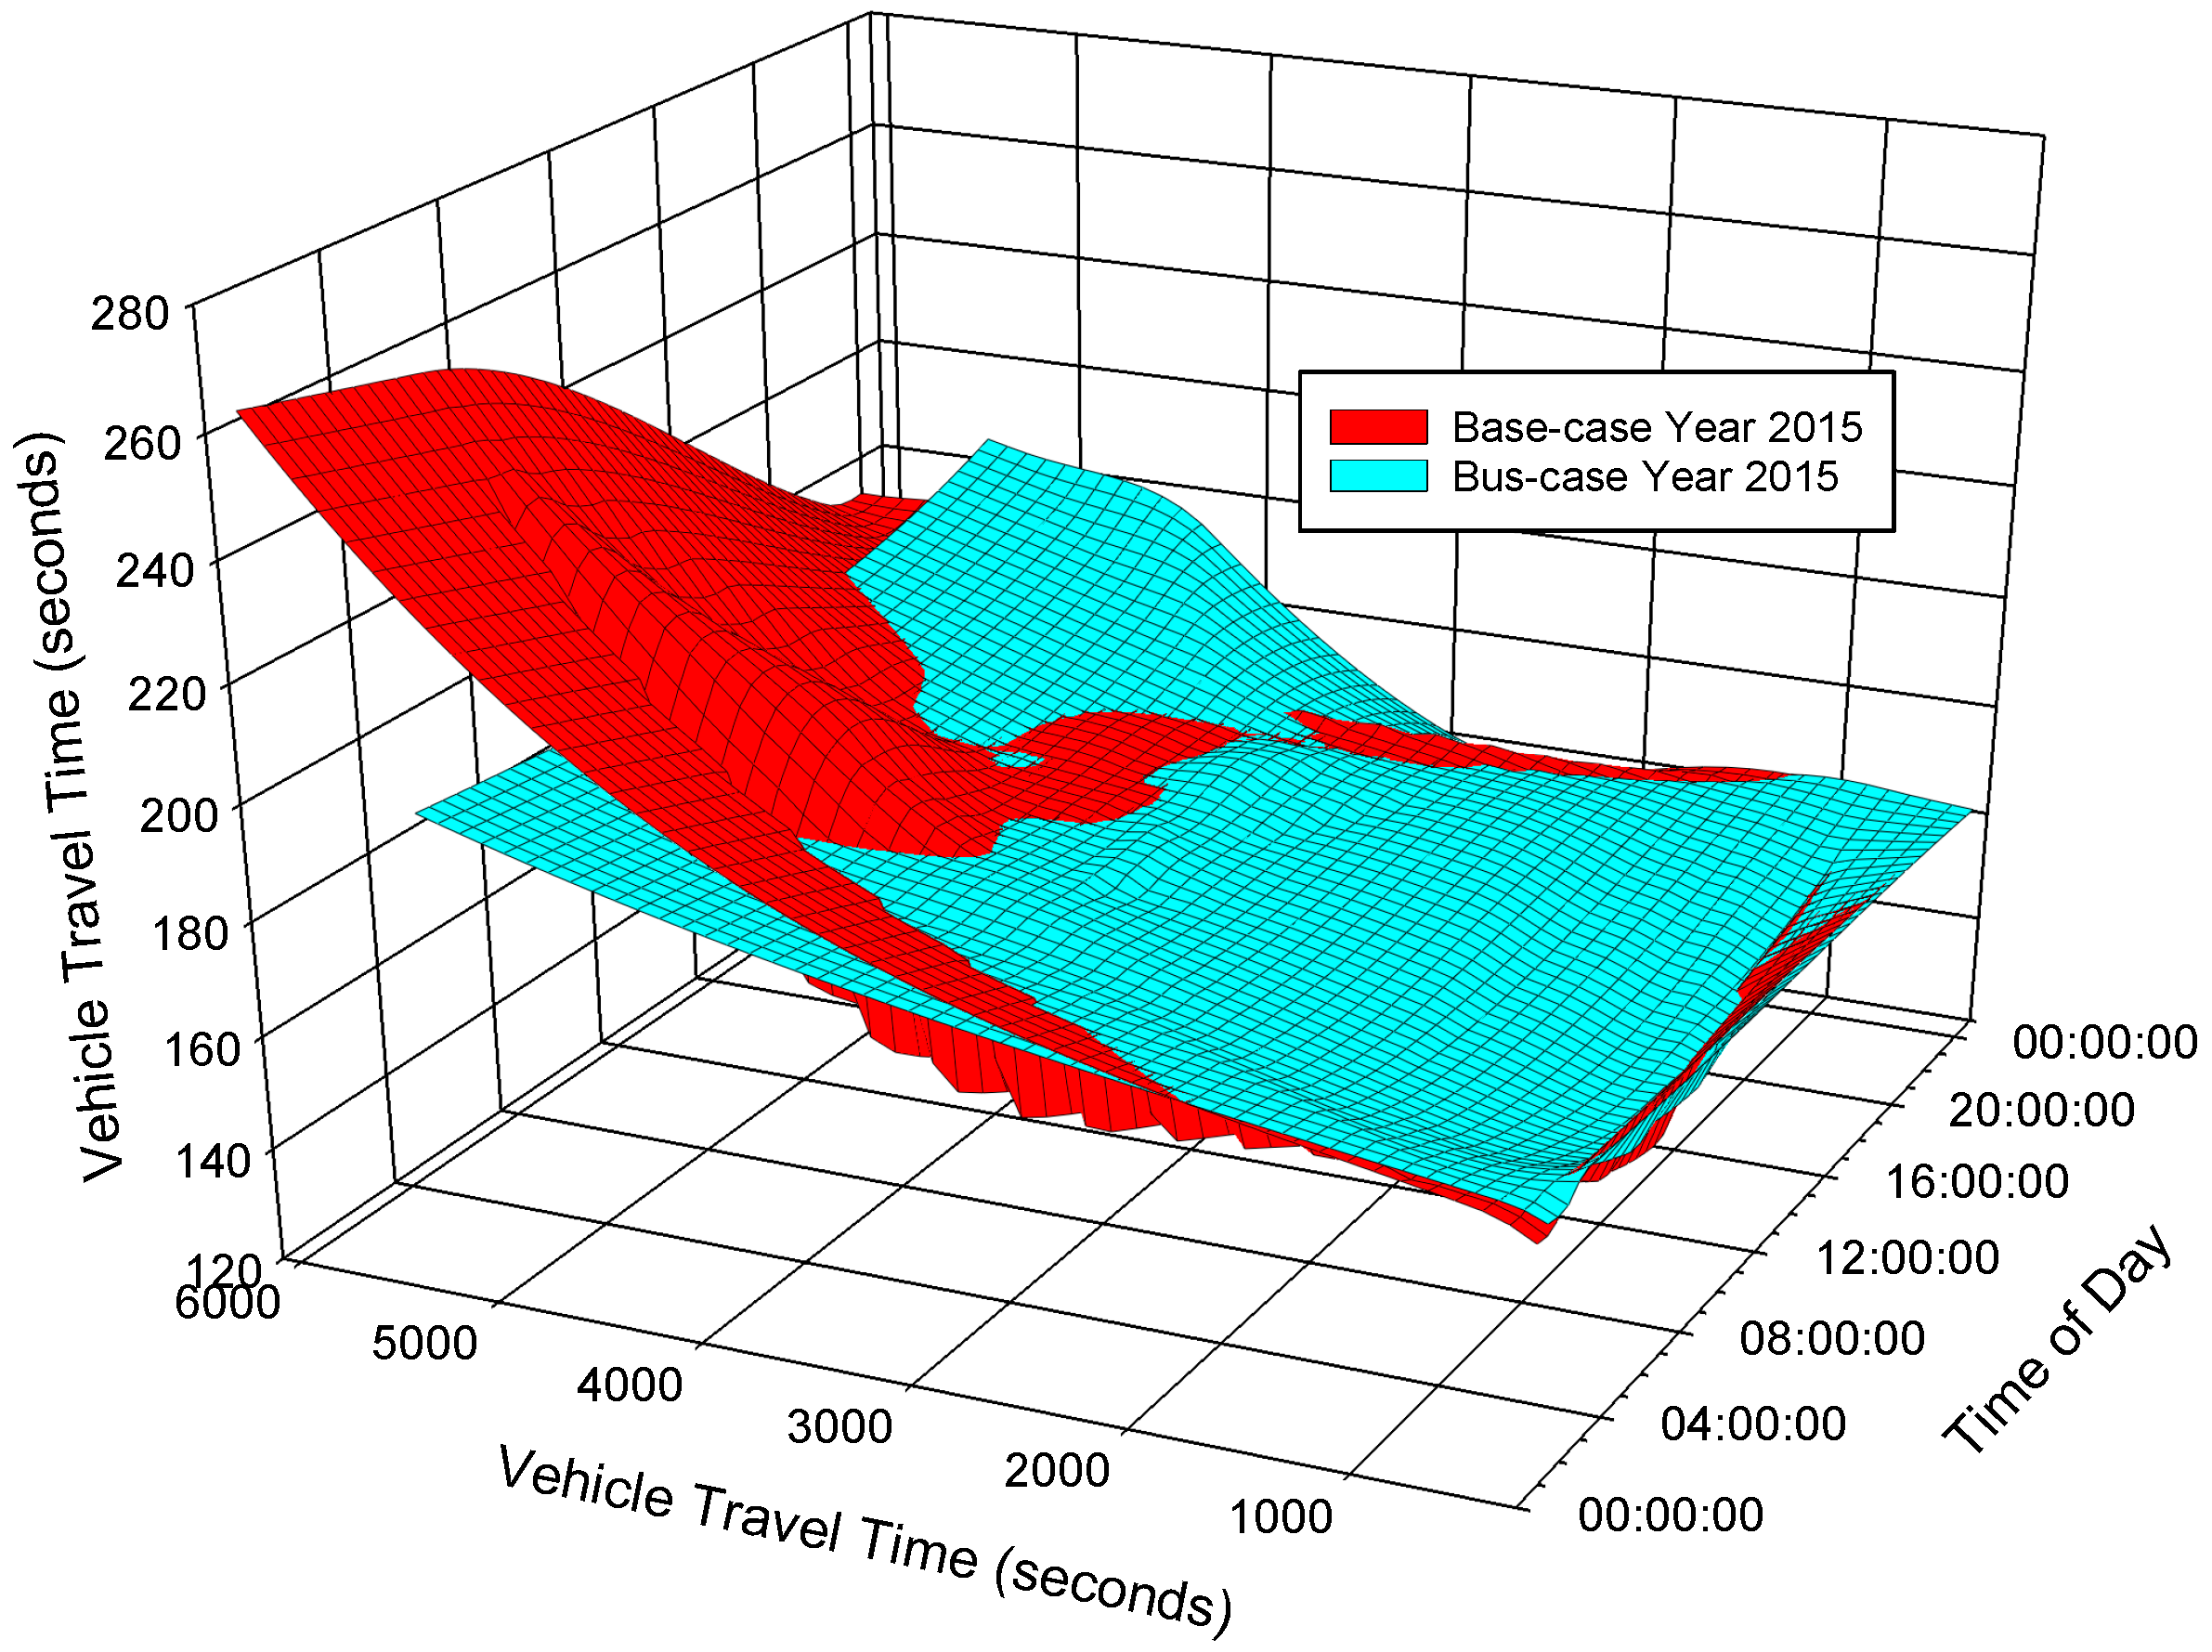
4.4. Public Transportation Scenario Analysis

According to 2015 base year measurements, the studied section serves over 9500 peak-hour vehicles in each direction. Growth in traffic and changes in vehicle driving variables were simulated here using high-resolution microsimulation models. The goal of constructing a traffic microsimulation model was to compare scenarios assessing the lifecycle impacts from implementing traffic management strategies. This was modelled and simulated for the years 2015–2020 as
  • Do nothing: The existing lane configuration, no public transport on the studied section. Utilizing secondary growth models from transport research, the traffic was assumed to increase by 6% annually.
  • Traffic Management Scenario: Assuming a hypothetical bus service operated on the studied section, mode-share switches to match the mode-share in other parts of Abu Dhabi, wherein public bus transport is currently operational (Table 1).
The simulation results for the 2015 base case confirmed the initial findings of the field observations, with regular traffic jams occurring in the peak hour traffic periods. The vehicle queue lengths were also recorded for the traffic levels across different years, as shown in Figure 6 and Figure 7. These figures show that the queue lengths experienced by vehicles travelling across the case study area increased for the same time durations. Once the traffic flow profiles had been generated for every scenario and lifecycle year from 2015 to 2020, the vehicle travel times, queue length, and vehicle flow were tabulated against the lifecycle year.
In the traffic management scenario, the current lane configuration was kept; however, public transport was provided, in the form of a 50-seater public bus operating at a 15 min headway and 40% capacity. Similarly to the base case, this model aimed to be run for a representative week every subsequent year by escalating the traffic level by 6%. The mode shift of passenger vehicles was based upon the “Surface Transport Master Plan 2009” of the Abu Dhabi Department of Transport, as described in Table 1. A total of eight bus-stops at approximately 500 m distance were created for the case study highway mainline links, with passengers permitted to board and alight from right side, and a dwell time of ±20 s was set after several subsequent runs, to find the options with the least errors, as well as to replicate the field settings given by Abu Dhabi Department of Transport.
The microsimulation for the traffic management scenario was run for the years 2015–2020. Random simulation instances were examined, to observe the traffic flow behavior of the simulated scenario, to ensure that the model flow followed real-world behavior. It should also be noted that, except for initial runs, no pedestrians were simulated, as this is beyond the current study’s scope and may require further work on VisWalk for a more accurate and realistic pedestrian simulation. Figure 8 shows a comparison of the vehicle network performance between the base case and the implemented traffic management scenario [9]. A significant disparity in the network performance was observed for the base case scenario, where public transport is not provided for the case study mainline network. In this case, the journey time experienced by vehicles escalated near peak hours (7 a.m.–8 a.m.), due to the high vehicle-volume entering the network.
The morning peak hours saw the biggest increase in journey time and vehicles volume, likely brought by commuters going to work. The travel time decreased after that, until the afternoon peak hours (2 p.m.–3 p.m.), when it tended to increase again and decline before reaching the evening peak hours (7 p.m.–8 p.m.) (as our earlier study [1,35] predicted). A reduction in the variation between the vehicle travel times was observed for the bus-based scenario, as less bottlenecking and congestions was noted for automobiles on the mainline segments, thus lessening the day-wide journey time fluctuations.

5. Conclusions and Future Work

This study aimed to present the efficiency of microsimulation models for empirically illustrating the car-following driving behavior of urban residents on a major highway, within the context of Abu Dhabi and the GCC region. For this purpose, a traffic-count dataset was gathered from local municipal and transport departments, in a series of data collection attempts for a 3.5 km 5-lane divided highway road segment from the Abu Dhabi city network experiencing a peak hour traffic of more than 9000 vehicles. Following data curation and analysis, a comprehensive daily traffic dataset for a representative week (constituting of all vehicle types) was deduced, despite the time gaps between various on- and off-ramp and mainline traffic-counting stations.
The findings suggest that proposed calibrations of the car-following variables (standstill distance, headway time, following variation, following thresholds, speed dependency of oscillation, and acceleration–deceleration parameters) of the Wiedmann 99 model were capable of accurately simulating the real-world driving behavior for the studied highway, with under 5% error noted across the different simulated periods, throughout the weekdays or weekends. The calibrated model was then used to simulate the traffic flow profile for another week, and the traffic data were compared against the actual field-collected data. It was found that the model successfully simulated a whole week’s traffic flow profile within acceptable bounds of error. The microsimulation model calibration parameters developed in this study could be used by the local authorities to evaluate and simulate the traffic management scenarios in the studied region.
The success of any transit solution in meeting a city’s traffic management goals depends on user adoptability and is gaged accordingly. Since increasing congestion on urban highways due to car traffic is a growing concern in many developing metropolitan areas and enhancing or developing public transport is a common strategy, alternatives aiming to divert passenger traffic from private vehicles to public transport should be backed by strong data assessment, to project their expected benefits. Currently, the comparison of traffic management strategies in Abu Dhabi typically involves identification and development of an initial plan to meet the need, feasibility, and economic viability of the different planning alternatives and, finally, the implementation of a selected system. The microsimulation model developed in this study is presented as a tool for investigating the long-term (2015–2020) benefits of implementing a public transport bus service on the studied highway section, in terms of the reduction in congestion, queue lengths, and journey times. The findings indicate that, if transportation is not improved, there will be significant traffic jams on the studied highway, as no public transport currently exists. The proposed bus service was found to immediately ease the traffic flow situation, by reducing queue length formation and minimizing fluctuations in the travel time between peak and off-peak hours throughout the day, and more significantly on weekdays, where the highest congestions occur.
Multiple research directions can be adopted from this observation. For example, future works could investigate the relative influence of financial and spatial constraints on travel behavior, while strictly considering mobility as a service in a consumer market. This may result in a more realistic research outcome, where vehicle routing, operational and fare policies, transport systems, and alternate on-demand services are evaluated while considering the whole transportation system and how these factors influence mobility at smaller to larger scales. User mobility, benefits to commuters and the environment, and the logical integration of the economic and environmental factors spanning the transportation system’s elements can then be balanced. Marketing the transportation infrastructure system as a compact package may also provide an added level of comparability during the decision-making process. Additionally, the performance of new technologies such as autonomous vehicles, which offer better car-following and effective platooning behavior and thereby enhance the traffic capacity of a road, could also be evaluated using microsimulation models for long-term models, instead of the short-term or daily flow projection models that are currently presented in the transport literature.

Author Contributions

Conceptualization, U.H. and H.A.; Methodology, U.H., H.A. and A.H.; Software, U.H.; Validation, U.H.; Formal analysis, U.H., H.A. and A.H.; Investigation, A.H.; Resources, H.A.; Data curation, H.A.; Writing—original draft, U.H., H.A. and A.H.; Writing—review & editing, U.H.; Supervision, U.H. and H.A.; Project administration, U.H. and H.A.; Funding acquisition, U.H. All authors have read and agreed to the published version of the manuscript.

Funding

This research project is supported by an Australian Government Research Training Program (RTP) scholarship.

Institutional Review Board Statement

Not applicable.

Informed Consent Statement

Not applicable.

Data Availability Statement

Data will be provided upon request.

Conflicts of Interest

The authors declare no conflict of interest.

References

  1. Hasan, U.; Whyte, A.; Al Jassmi, H. Public bus transport service satisfaction: Understanding its value to urban passengers towards improved uptake. Trans. Transp. Sci. 2021, 12, 25–37. [Google Scholar] [CrossRef]
  2. Kussl, S.; Wald, A. Smart Mobility and its Implications for Road Infrastructure Provision: A Systematic Literature Review. Sustainability 2023, 15, 210. [Google Scholar] [CrossRef]
  3. Alawadi, K. Rethinking Dubai’s urbanism: Generating sustainable form-based urban design strategies for an integrated neighborhood. Cities 2017, 60, 353–366. [Google Scholar] [CrossRef] [Green Version]
  4. Sheikh, M.S.; Peng, Y. A comprehensive review on traffic control modeling for obtaining sustainable objectives in a freeway traffic environment. J. Adv. Transp. 2022, 2022, 1012206. [Google Scholar] [CrossRef]
  5. Ding, C.; Wang, D.; Liu, C.; Zhang, Y.; Yang, J. Exploring the influence of built environment on travel mode choice considering the mediating effects of car ownership and travel distance. Transp. Res. Part A Policy Pract. 2017, 100, 65–80. [Google Scholar] [CrossRef]
  6. de Luca, S. Public engagement in strategic transportation planning: An analytic hierarchy process based approach. Transp. Policy 2014, 33, 110–124. [Google Scholar] [CrossRef]
  7. Currie, G.; Delbosc, A. Spiral Plot Analysis of Variation in Perceptions of Urban Public Transport Performance between International Cities. Transp. Res. Rec. J. Transp. Res. Board 2015, 2538, 54–64. [Google Scholar] [CrossRef]
  8. Qamhaieh, A.; Chakravarty, S. Drive-through cities: Cars, labor, and exaggerated automobilities in Abu Dhabi. Mobilities 2020, 15, 792–809. [Google Scholar] [CrossRef]
  9. Hasan, U.; Whyte, A.; Al-Jassmi, H. A life-cycle decision-making framework to assess the need for autonomous mobility. Transp. Res. Procedia 2019, 42, 32–43. [Google Scholar] [CrossRef]
  10. Hasan, A.; Hasan, U.; AlJassmi, H.; Whyte, A. Transit behaviour and sociodemographic interrelation: Enhancing urban public-transport solutions. Eng 2023, 4, 1144–1155. [Google Scholar] [CrossRef]
  11. Dhabi, D.A. Surface Transport Master Plan—A Vision for Connecting Abu Dhabi; Department of Transport: Abu Dhabi, United Arab Emirates, 2009; p. 171.
  12. Balsa-Barreiro, J.; Menendez, M.; Morales, A.J. Scale, context, and heterogeneity: The complexity of the social space. Sci. Rep. 2022, 12, 9037. [Google Scholar] [CrossRef] [PubMed]
  13. Mahmud, S.S.; Ferreira, L.; Hoque, S.; Tavassoli, A. Micro-simulation modelling for traffic safety: A review and potential application to heterogeneous traffic environment. IATSS Res. 2019, 43, 27–36. [Google Scholar] [CrossRef]
  14. Hasan, U. Experimental Study on Bentonite Stabilisation Using Construction Waste and Slag. Master’s Thesis, Department of Civil Engineering, Curtin University, Perth, WA, Australia, 2015; p. 181. [Google Scholar]
  15. Bener, A.; Verjee, M.; Dafeeah, E.E.; Yousafzai, M.T.; Mari, S.; Hassib, A.; Al-Khatib, H.; Choi, M.K.; Nema, N.; Özkan, T.; et al. A Cross “Ethnical” Comparison of the Driver Behaviour Questionnaire (DBQ) in an Economically Fast Developing Country: DBQ in Arab Gulf and South Asian countries. Glob. J. Health Sci. 2013, 5, 165. [Google Scholar] [CrossRef] [PubMed] [Green Version]
  16. Tulimat, M.; Obaid, O.; Obaid, L.; Hamad, K. Quantifying impacts of connected and automated vehicles on traffic operation of a diamond interchange in UAE using micro-simulation. In Proceedings of the 14th International Conference on Developments in eSystems Engineering (DeSE), Sharjah, United Arab Emirates, 7–10 December 2021. [Google Scholar]
  17. Gray, D.; Laing, R.; Docherty, I. Delivering lower carbon urban transport choices: European ambition meets the reality of institutional (mis)alignment. Environ. Plan. A Econ. Space 2016, 49, 226–242. [Google Scholar] [CrossRef] [Green Version]
  18. Hermosilla, T.; Palomar-Vázquez, J.; Balaguer-Beser, Á.; Balsa-Barreiro, J.; Ruiz, L.A. Using street based metrics to characterize urban typologies. Comput. Environ. Urban Syst. 2014, 44, 68–79. [Google Scholar] [CrossRef] [Green Version]
  19. Hasan, U.; Whyte, A.; AlJassmi, H. A microsimulation modelling approach to quantify environmental footprint of autonomous buses. Sustainability 2022, 14, 15657. [Google Scholar] [CrossRef]
  20. Abenoza, R.F.; Cats, O.; Susilo, Y.O. Travel satisfaction with public transport: Determinants, user classes, regional disparities and their evolution. Transp. Res. Part A Policy Pract. 2017, 95, 64–84. [Google Scholar] [CrossRef] [Green Version]
  21. Brons, M.; Givoni, M.; Rietveld, P. Access to railway stations and its potential in increasing rail use. Transp. Res. Part A Policy Pract. 2009, 43, 136–149. [Google Scholar] [CrossRef]
  22. Woldeamanuel, M.G.; Cyganski, R. Factors affecting travellers’s satisfaction with accessibility to public transportation. In Proceedings of the European Transport Conference 2011, Glasgow, UK, 10–12 October 2011; Association for European Transport: Warwickshire, UK, 2011. [Google Scholar]
  23. Hensher, D.A. The Relationship between Bus Contract Costs, User Perceived Service Quality and Performance Assessment. Int. J. Sustain. Transp. 2014, 8, 5–27. [Google Scholar] [CrossRef]
  24. Lavery, T.; Páez, A.; Kanaroglou, P. Driving out of choices: An investigation of transport modality in a university sample. Transp. Res. Part A Policy Pract. 2013, 57, 37–46. [Google Scholar] [CrossRef]
  25. Schweizer, J.; Danesi, A.; Rupi, F.; Traversi, E. Comparison of static vehicle flow assignment methods and microsimulations for a personal rapid transit network. J. Adv. Transp. 2012, 46, 340–350. [Google Scholar] [CrossRef]
  26. Peng, G.; Yang, S.; Zhao, H. The difference of drivers’ anticipation behaviors in a new macro model of traffic flow and numerical simulation. Phys. Lett. A 2018, 382, 2595–2597. [Google Scholar] [CrossRef]
  27. Haq, M.T.; Farid, A.; Ksaibati, K. Estimating passing sight distances for overtaking truck platoons–Calibration and validation using VISSIM. Int. J. Transp. Sci. Technol. 2022, 11, 255–267. [Google Scholar] [CrossRef]
  28. Acuto, F.; Coelho, M.C.; Fernandes, P.; Giuffrè, T.; Macioszek, E.; Granà, A. Assessing the environmental performances of urban roundabouts using the VSP methodology and AIMSUN. Energies 2022, 15, 1371. [Google Scholar] [CrossRef]
  29. Hasan, A.; Hasan, U.; Whyte, A.; Al Jassmi, H. Lifecycle analysis of recycled asphalt pavements: Case study scenario analyses of an urban highway section. CivilEng 2022, 3, 242–262. [Google Scholar] [CrossRef]
  30. SCAD. Statistical Yearbook of Abu Dhabi; Statistics Centre—Abu Dhabi (SCAD): Abu Dhabi, United Arab Emirates, 2020; p. 272.
  31. Ponte, C.; Melo, H.P.M.; Caminha, C.; Andrade, J.S.; Furtado, V. Traveling heterogeneity in public transportation. EPJ Data Sci. 2018, 7, 42. [Google Scholar] [CrossRef]
  32. Kuhnimhof, T.; Chlond, B.; von der Ruhren, S. Users of Transport Modes and Multimodal Travel Behavior Steps Toward Understanding Travelers’ Options and Choices. Transp. Res. Rec. J. Transp. Res. Board 2006, 1985, 40–48. [Google Scholar] [CrossRef]
  33. Hasan, U. Development of a Multi-Criteria Decision-Making Framework for Sustainable Road Transport Systems: Integrating Stakeholder-Cost-Environment-Energy Lifecycle Impacts. Ph.D. Thesis, School of Civil and Mechanical Engineering, Curtin University, Perth, WA, Australia, 2019. [Google Scholar]
  34. Gomes, G.; May, A.; Horowitz, R. Congested Freeway Microsimulation Model Using VISSIM. Transp. Res. Rec. J. Transp. Res. Board 2004, 1876, 71–81. [Google Scholar] [CrossRef]
  35. Hasan, U.; Whyte, A.; Al Jassmi, H. Life-cycle asset management in residential developments building on transport system critical attributes via a data-mining algorithm. Buildings 2018, 9, 1. [Google Scholar] [CrossRef] [Green Version]
Figure 2. Current daily traffic situation on the studied road (base year 2015).
Eng 04 00113 g002
Figure 3. Traffic volume profile from model run with default VISSIM driving behavior parameters.
Eng 04 00113 g003
Figure 4. Traffic volume profile from model run with calibrated VISSIM driving behavior parameters.
Eng 04 00113 g004
Figure 5. Comparison of traffic volume profile for field and modelled conditions with the calibrated VISSIM model—validation (week 2) dataset.
Eng 04 00113 g005
Figure 6. Queue length for in-bound traffic—base case year 2015.
Eng 04 00113 g006
Figure 7. Queue length for in-bound traffic—base case year 2020.
Eng 04 00113 g007
Figure 8. Comparison of vehicle network performance for the base case and traffic management scenario (public bus-case) for a representative weekday.
Eng 04 00113 g008
Table 1. Mode share of the current passenger journey profile.
Transport ModeBase CaseTraffic Management Scenario
Small cars56.5%45.2%
Regular cars43.5%34.8%
Public transport (bus)0%20%
Disclaimer/Publisher’s Note: The statements, opinions and data contained in all publications are solely those of the individual author(s) and contributor(s) and not of MDPI and/or the editor(s). MDPI and/or the editor(s) disclaim responsibility for any injury to people or property resulting from any ideas, methods, instructions or products referred to in the content.

