Article

Seismic Resilience and Design Factors of Inline Seismic Friction Dampers (ISFDs)

by
Ali Naghshineh
1,*,
Ashutosh Bagchi
1 and
Fariborz M. Tehrani
2
1
Department of Building, Civil and Environmental Engineering Concordia University, Montreal, QC H3G 1M8, Canada
2
Department of Civil & Geomatics Engineering, California State University, Fresno, CA 93740-8030, USA
*
Author to whom correspondence should be addressed.
Eng 2023, 4(3), 2015-2033; https://doi.org/10.3390/eng4030114
Submission received: 12 June 2023 / Revised: 11 July 2023 / Accepted: 14 July 2023 / Published: 18 July 2023

Abstract

:
While damping devices can provide supplemental damping to mitigate building vibration due to wind or earthquake effects, integrating them into the design is more complex. For example, the Canadian code does not provide building designs with inline friction dampers. The objective of this present article was to study the overstrength, ductility, and response modification factors of concrete frame buildings with inline friction dampers in the Canadian context. For that purpose, a set of four-, eight-, and fourteen-story ductile concrete frames with inline seismic friction dampers, designed based on the 2015 National Building Code of Canada (NBCC), was considered. The analyses included pushover analysis in determining seismic characteristics and dynamic response history analysis using twenty-five ground motion records to assess the seismic performance of the buildings equipped with inline seismic friction dampers. The methodology considered diagonal braces, including different 6 m and 8 m span lengths. The discussion covers the prescribed design values for overstrength, ductility, and response modification factors, as well as the performance assessment of the buildings. The results revealed that increasing the height of the structure and reducing the span length increases the response modification factors.

1. Introduction

Utilizing the inherent ductility of a building to prevent catastrophic failure has led to the development of seismic design codes and inelastic design response spectra. The relationship between seismic load and damage is defined by equilibrium energy, in which the total seismic inertia equals the sum of the elastic vibration energy, the cumulative inelastic strain energy, and the energy absorbed by damping. Consequently, the energy induced by structural damage equals the total seismic inertia minus the energy absorbed by damping. Simply put, the damping of and damage to a system directly affects one another. In conventional structural systems, seismic energy is dissipated through lateral load-resisting systems. However, supplemental damping is employed in modern structural systems to mitigate and limit structural damage [1,2].
Consequently, modern structures consider the actual dynamic behavior of systems, which can be categorized into isolation systems and energy dissipation devices, including passive, semi-active, active, and hybrid systems [3,4]. Friction dampers (seismic brakes) are examples of passive energy dissipation devices that dissipate energy through the friction caused by sliding two solid bodies against one another. When a structure is subjected to a major earthquake, the friction dampers attached to a typical brace dissipate a significant proportion of the energy and slip instead of yielding before yielding the primary members of a structure. Therefore, the initial cost could be significantly reduced with a high capacity for energy dissipation. There are several approaches to using friction brace frames as an energy dissipation mechanism in steel frames. Friction dampers have been used in combination with a frame to capture the global structural response with the tri-linear lateral elastic-perfect-plastic shape. These methods are based on an equivalent one degree of freedom and a multi-degree of freedom to determine the appropriate design of structural components and slip loads to reduce structural damage and control drifts [5,6,7,8]. In another instance, in an experimental setting, a full-scale Moment-Resisting Frame (MRF) system with inline friction dampers exhibited enhanced performance and resilience via decreased acceleration and increased damping. The friction-damped frame reduced acceleration by an average of 25% across different ground and artificial motions. The friction-damped frame enhanced structural damping by 6.74%, preserving strength and stiffness. The calculated story drift demonstrated a resilient system with minimal deflection.
Additionally, the MRF effectively corrected residual elongation in the inline friction dampers [9]. Some methods have been developed to capture the plastic mechanism of friction dampers [10]. Alternatively, an energy-based method has been proposed to determine the slip resistance of friction dampers in reinforced concrete structures [11].
Structural analysis under an earthquake in the elastic region can create reverse strength in the structures that surpasses their structural response. Seismic codes take advantage of the inherent capabilities of structures, including overstrength and ductility, to dissipate significant amounts of earthquake energy. The ductility factor represents the ability of a structure to dissipate energy in the inelastic range. It can be determined by dividing the maximum displacement by the displacement at the yield point, which is influenced by factors such as soil type and the fundamental period of the structure [2,12,13]. The National Building Code of Canada [14] divides the minimum earthquake lateral force by the Seismic Force-Resisting System (SFRS) reduction factor. This factor, known as the response modification factor, can be calculated by multiplying the overstrength factor (R0) by the ductility-related force modification factor (Rd). However, the 2015 National Building Code of Canada does not explicitly include the overstrength factor (R0) or the ductility-related force modification factor (Rd). In the 2015 National Building Code of Canada [14], several types of Seismic Force-Resisting Systems (SFRS) are considered for ductility, with a minimum value of 1.0 for brittle systems such as unreinforced masonry and a maximum value of 5.0 for ductile moment-resisting frames. The overstrength factor ranges from 1.0 to 1.7, signifying the level of overstrength in the SFRS [14]. For friction brace frames, limited to 10 stories in Canada, proposed values of 5.0 and 1.1 have been suggested for the ductility and overstrength factors, respectively [15]. The seismic performance of fourteen-story concrete moment-resisting frames (CMRFs) with and without friction dampers was studied. The models with integrated friction dampers showed improved performance compared to similar models without dampers. When friction dampers were integrated, the moment and shear were reduced by approximately 75%, 69%, and 56% for ductile, moderately ductile, and elastic CMRFs. This integration enhanced the building’s performance and reduced potential damage to the primary frame members.
Moreover, it offset the cost of the damping system, resulting in an average cost saving of around 11.5%. The closest equivalent system in the 2015 National Building Code of Canada (NBCC) is for ductile buckling-restrained braced frames (Rd = 4, R0 = 1.2). These factors are already conservative, primarily because the non-damage-based modification factor for Inline Seismic Friction Dampers (ISFDs) is substantially higher [16,17]. Furthermore, the system can be tested with Maximum Considered Earthquake (MCE) ground motion forces and at MCE displacement levels, contrasting with the equivalent systems that cannot avoid uncertainty in their actual behavior.
Unlike yielding steel elements, the activation load and stiffness of the friction damper are decoupled, meaning there is a wide range of energy dissipation capacities/stiffness and ductility values that can be intentionally controlled by adjusting these two design parameters. A response modification factor approach reduces this variability, enhancing performance. This benefit is significant because of a wealth of knowledge developed over several decades on using friction devices as supplemental damping devices for optimizing seismic performance [5,6,7,18,19,20]. There is a broad consensus that a well-defined optimal performance point exists for friction-damped structures, and it depends on the structural frame’s dynamic properties. Given this context, the benefits of the proposed R-factor design approach, which seems to rely on the bilinearization that eliminates (or at the very least discourages) design optimization, should be more clearly highlighted. Therefore, this paper addresses these issues by evaluating the SFRS reduction factors, including the overstrength, ductility, and response modification factors of four-, eight-, and fourteen-story ductile concrete frames with inline seismic friction dampers. The evaluation involves detailed nonlinear static analysis procedures. Additionally, the effects of building height and span length are considered. Moreover, the seismic performance of the buildings is assessed using nonlinear response history analysis.

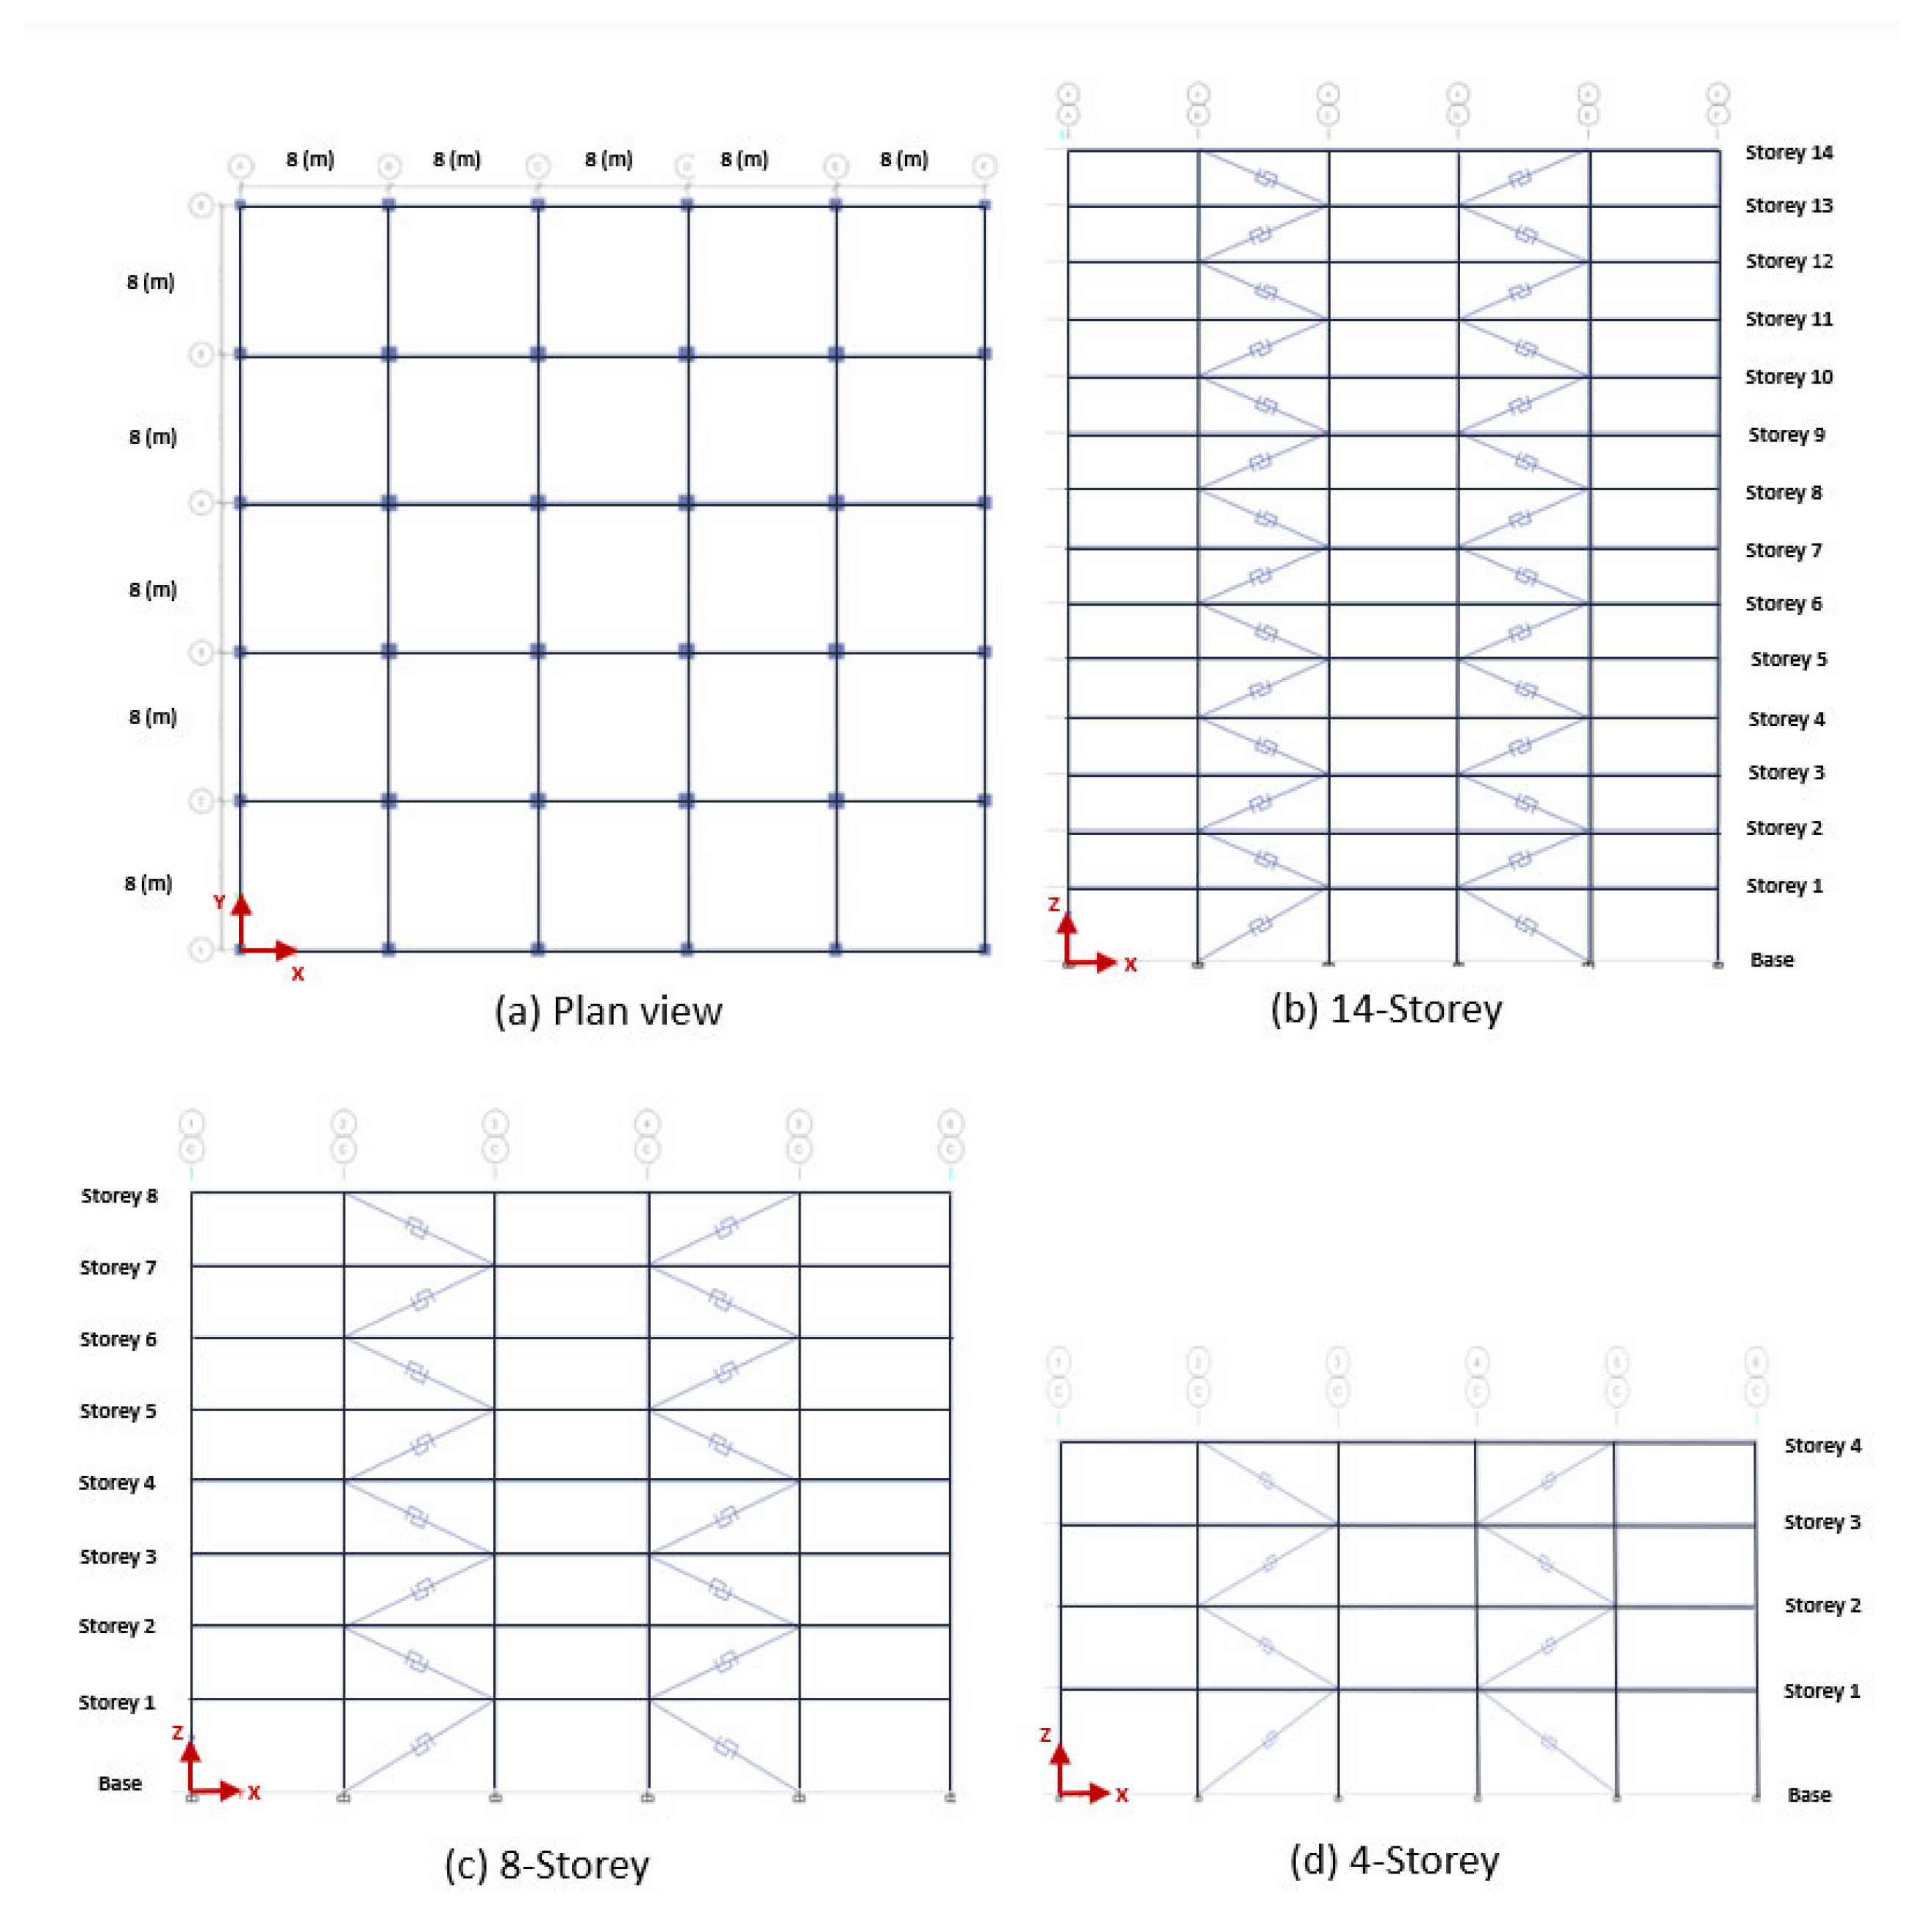
2. Design of Structural Models

In this study, the buildings are assumed to be in San Bernardino, California, with a latitude and longitude of 34.108 and −117.289, corresponding to a high seismic zone and site class “D.” Diagonal Braces with various span lengths of 6 m and 8 m are considered in each building. All three models have five bays in each direction, as demonstrated in Figure 1.
The 2015 NBCC and ETABS software (Version 16.2.1) [14,21] were utilized to design four-, eight-, and fourteen-story ductile concrete frames with inline seismic friction dampers to evaluate the overstrength, ductility, and response modification factors. When it was established that the dampers activate before yielding in the primary members of the frame subjected to the design earthquake, CSA A23.3-19 [22] was employed for detailing the concrete buildings, following the Ultimate Limit States (ULS) or strength design method [22]. For the cylindrical specimen, the assumed compressive strength at 28 days f c is 30 MPa, with a modulus of elasticity Ec of 24,500 MPa, and the unit weight of reinforced concrete is 24 KN/m3. The concrete cover for members exposed to the weather is 40 mm, while for non-exposed members, it is 30 mm. The section properties of the columns are considered 70% of the moment inertia, and for beams, it is 35% of the moment inertia. To prevent column plastic hinges, all beam-to-column joints in structural frames must satisfy the weak beam–strong column criteria, ensuring adequate shear strength in the concrete moment-resisting frame joints to withstand the maximum expected force in the adjoining brace(s). This design procedure includes determining the effective area of the joint, determining the panel-zone design shear force, and controlling the panel-zone shear stress. The assumed design live and dead loads for all models are 1.5 KN/m2 and 2.4 KN/m2, respectively, while the snow load acting on the roof is 1.64 KN/m2. The design details and the brace sections are presented in Table 1.

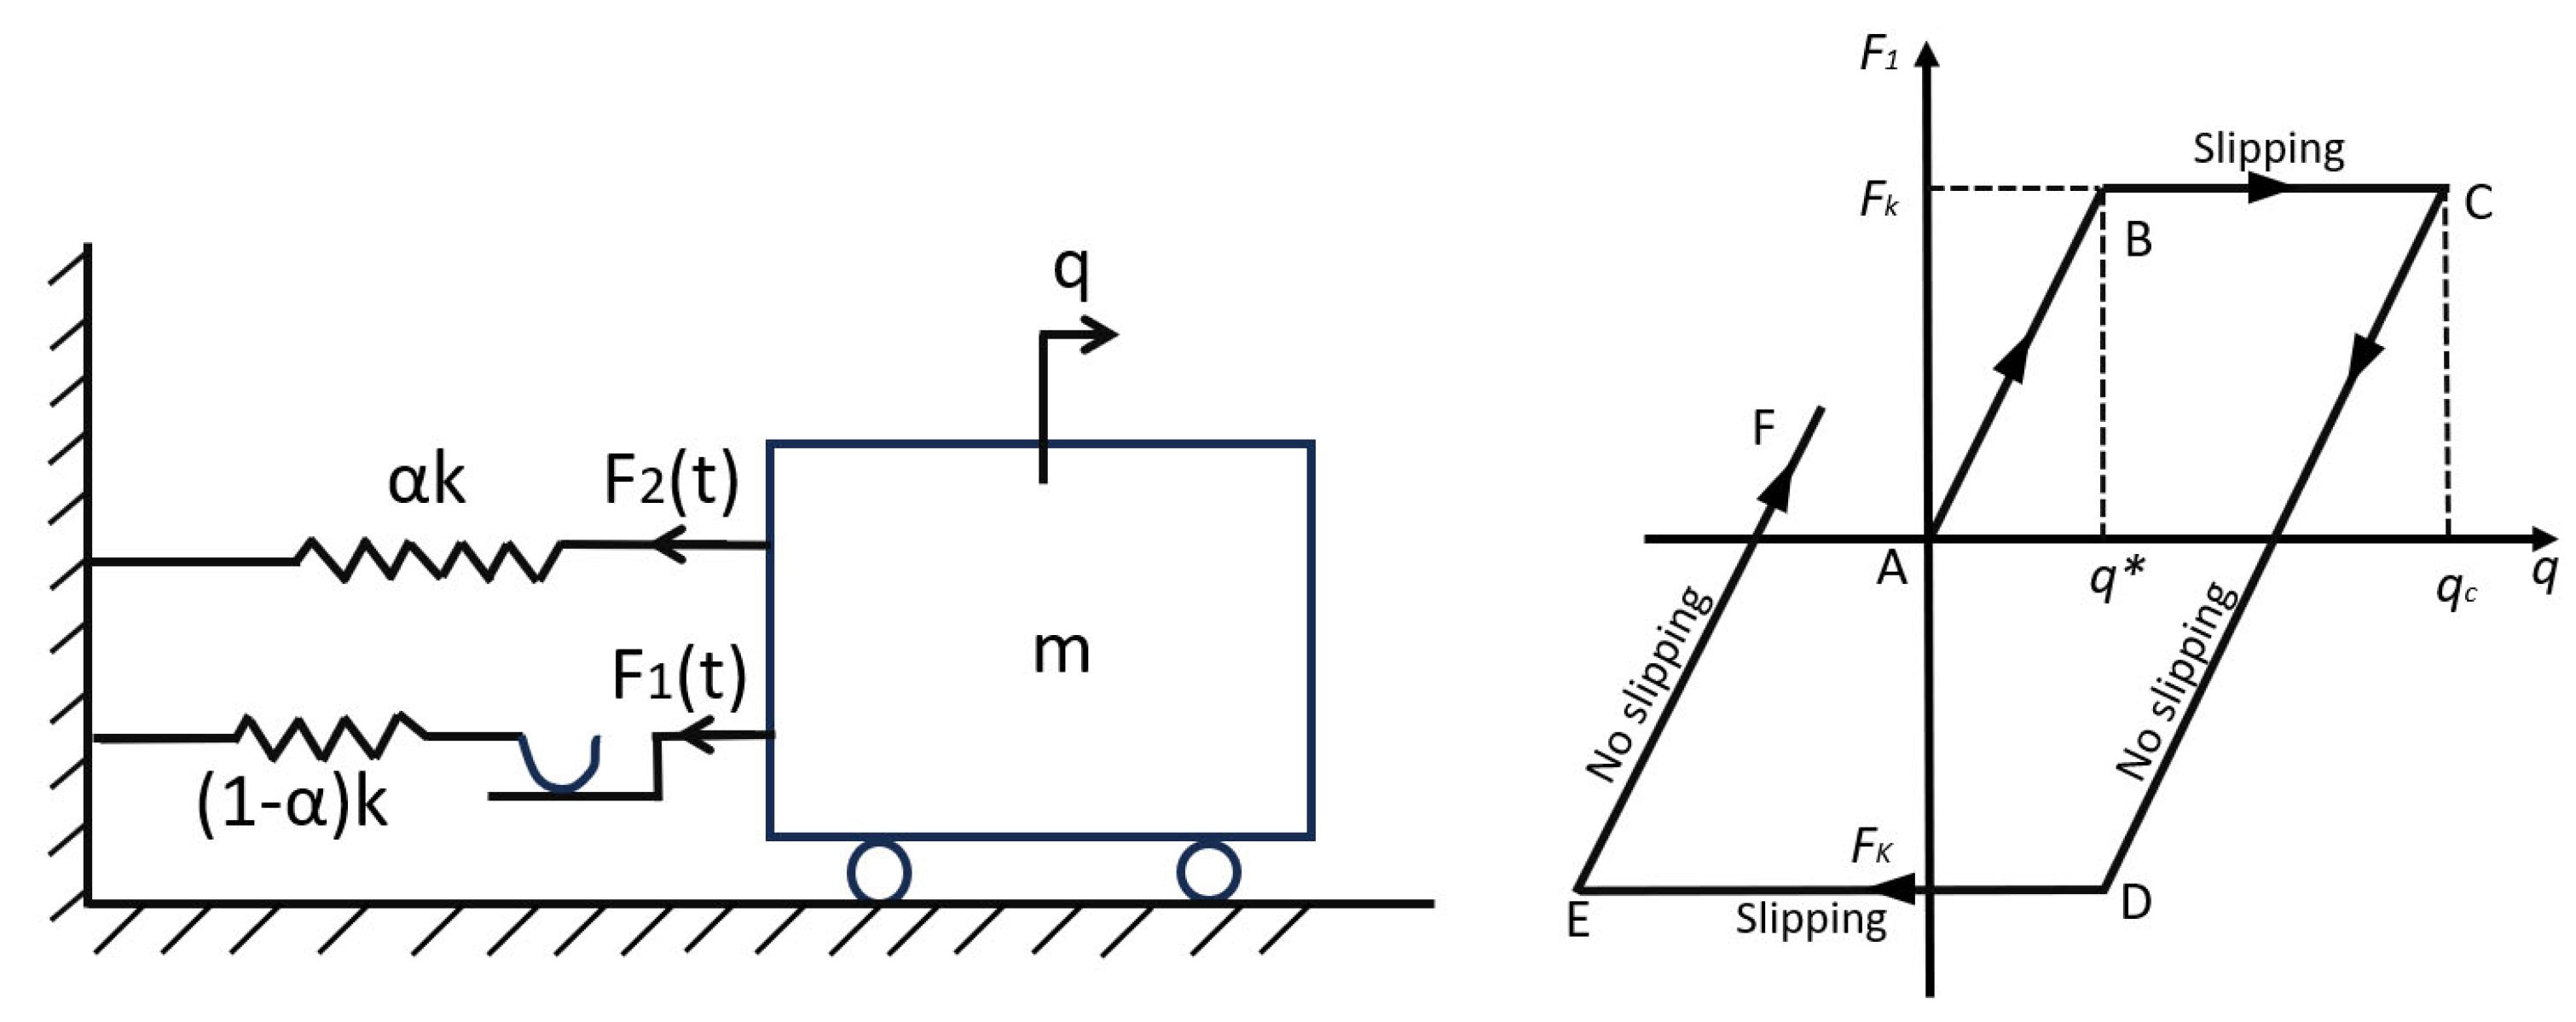
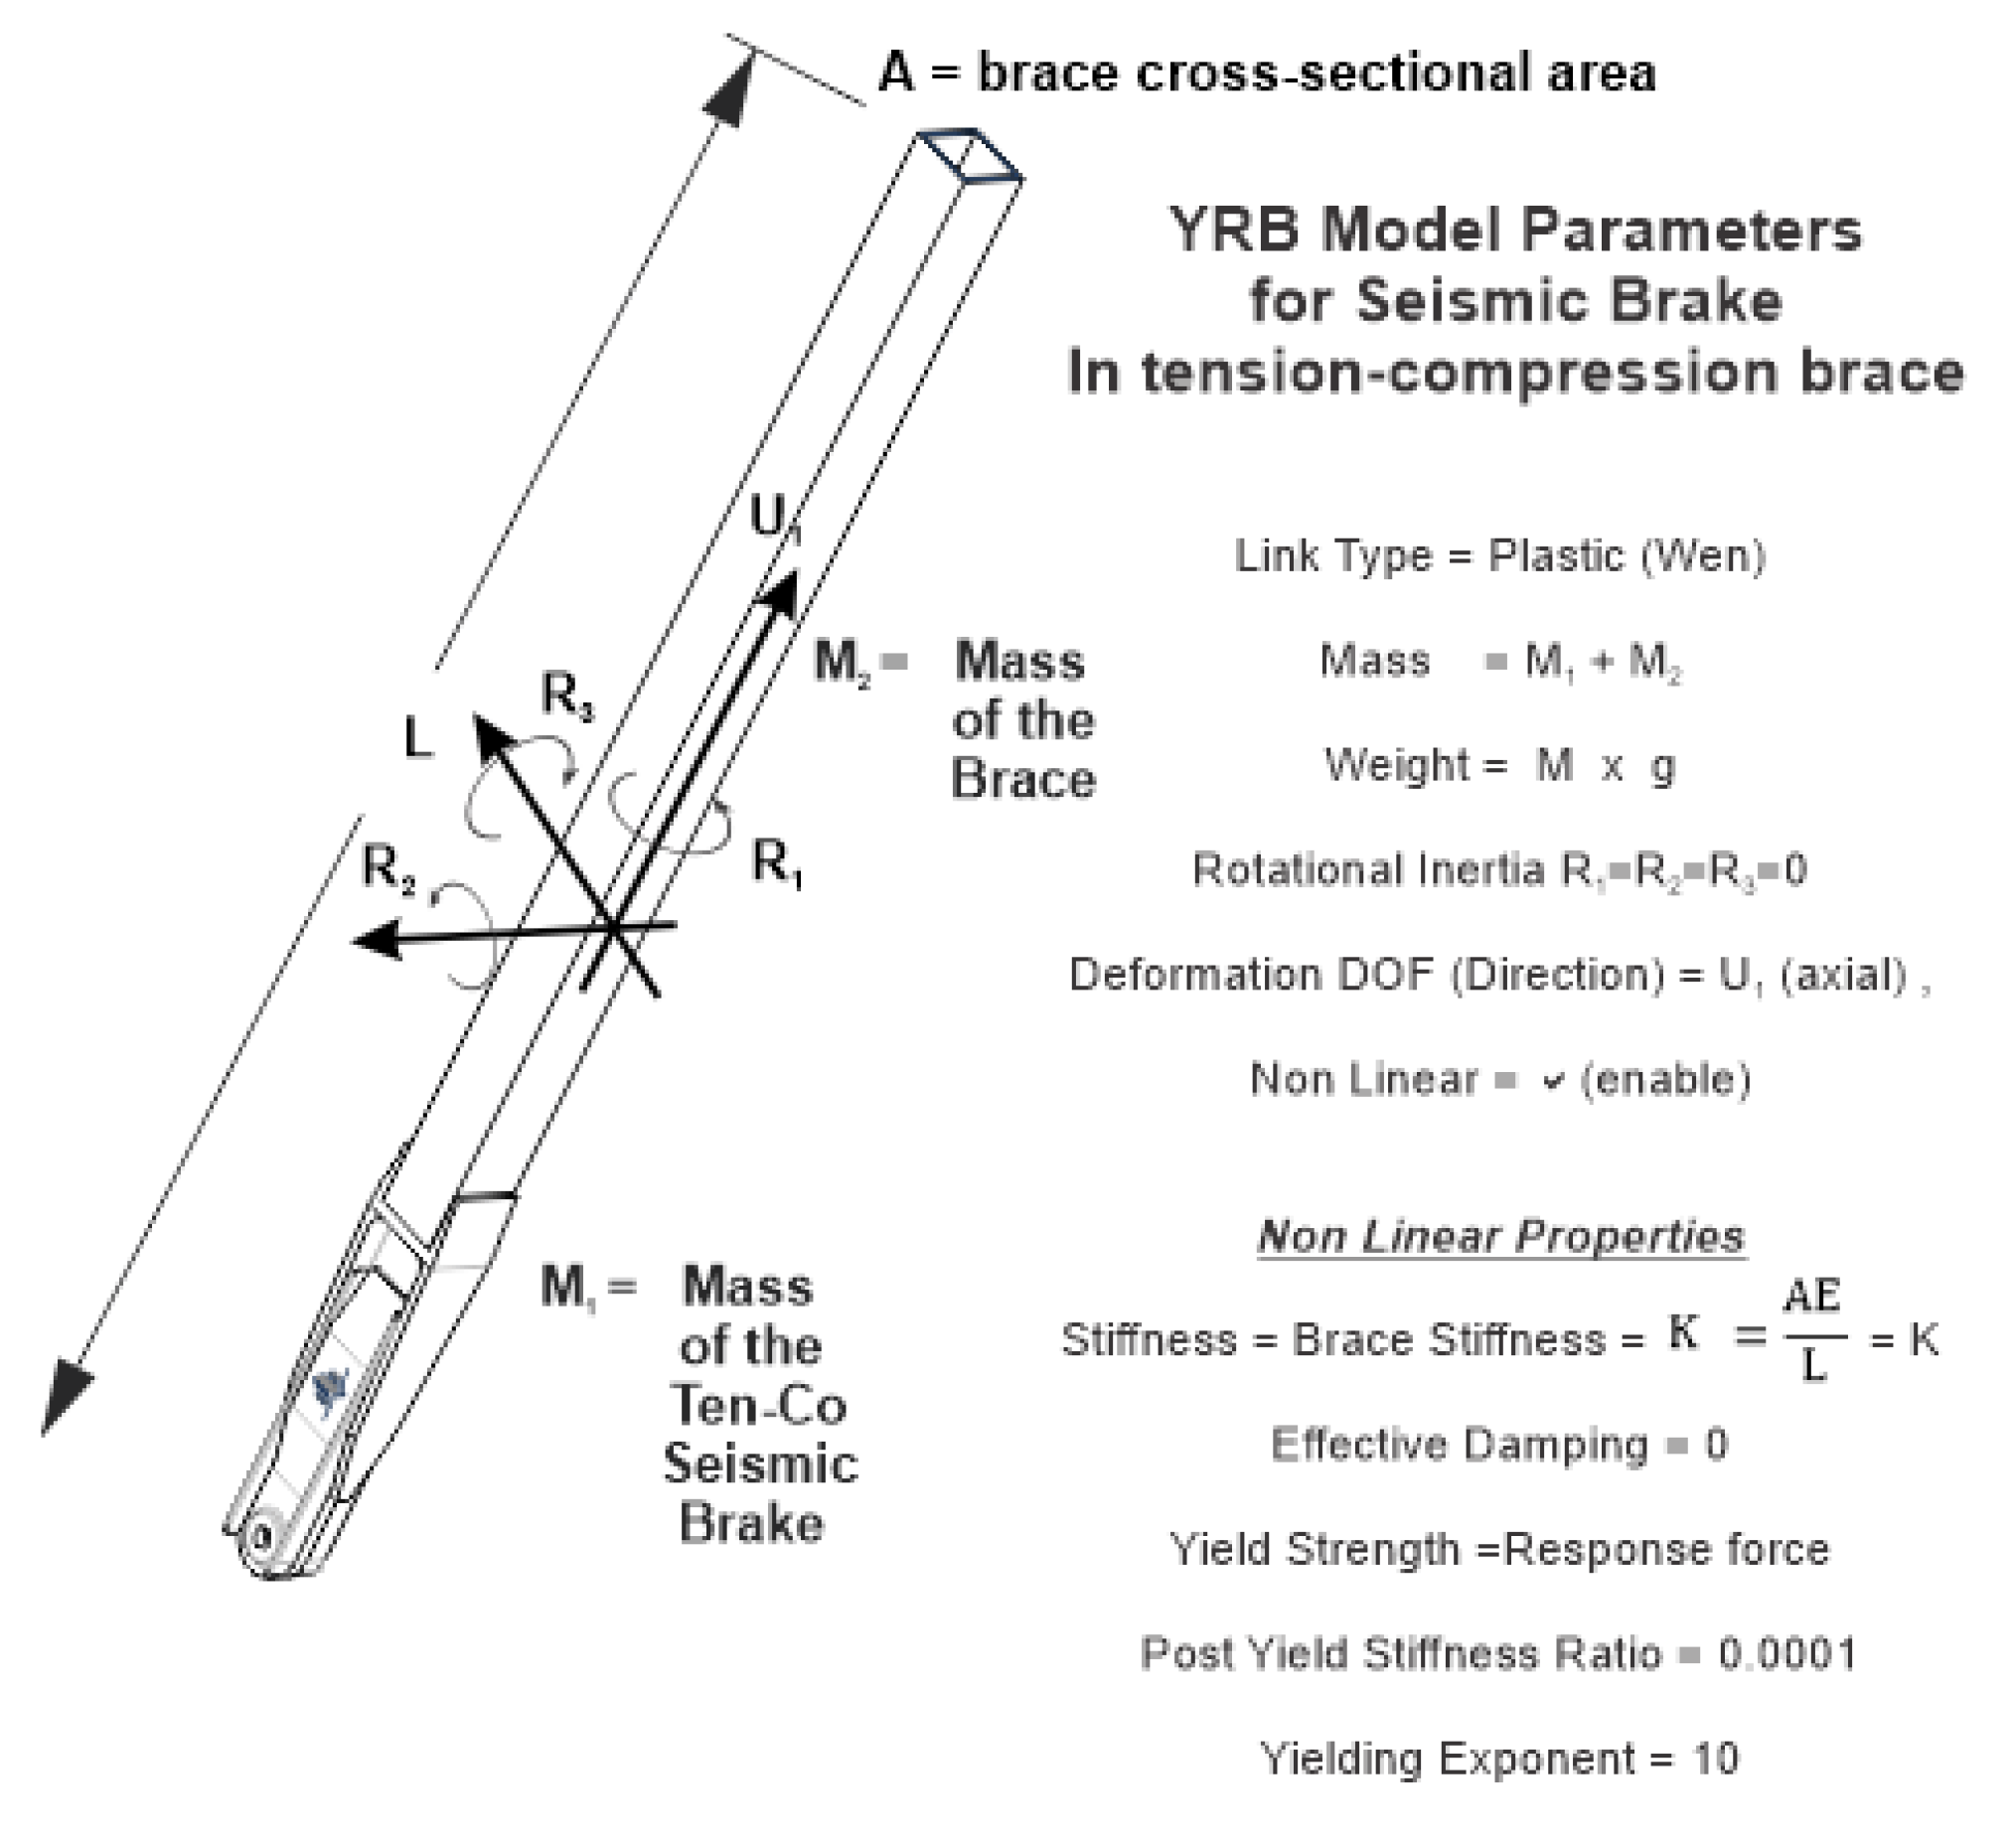
3. Design of the Inline Seismic Friction Dampers

Buildings designed and constructed following earlier codes and standards often need to meet the life safety criteria based on the current seismic criteria objectives as earthquake requirements evolved. Therefore, in high seismicity zones, and sometimes even in low to moderate seismicity regions, supplemental energy dissipation devices can be employed as part of structural design concepts for new buildings, upgrades, or retrofits of existing structures. In seismically isolated structures, these devices can provide additional dampening and are broadly categorized into two groups, displacement dependent, such as frictional sliding or metallic yielding, and velocity dependent, including viscoelastic and viscous fluid dampers. The 2015 NBCC [14] recommends supplemental energy dissipation but does not explicitly address friction dampers. It specifies that a supplemental energy dissipation system should complement the seismic force-resisting system (SFRS). The modeling of the system should consider greater ductility than that of the SFRS nonlinear hysteretic behavior, and the inherent equivalent viscous damping of the system should not exceed 2.5 percent of the critical damping, excluding the damping provided by energy dissipation devices and other structural elements. The SFRS and components of the supplemental energy dissipation system should be modeled elastically. According to ASCE 7-22, a structure with a damping system must have an SFRS that can resist 100 percent of the load path, while a structure without a damping system must have at least 75 percent of the required design strength [2,23].
Various supplemental energy dissipation devices exist, employing different mechanisms to dissipate energy. These mechanisms include yielding mild steel, viscoelastic behavior in rubber-like materials, shearing of viscous fluids, orifice flow, and sliding friction. Inline Seismic Friction Dampers are utilized in structural engineering to mitigate the impact of seismic forces on buildings and structures. They aim to absorb and dissipate the energy generated during earthquakes, reducing the structural response and minimizing damage. These dampers dissipate energy via the frictional interaction between two sliding solid components. This principle of solid friction is also observed in controlling tectonic movement and earthquake generation and in smaller-scale applications such as automotive brakes, which dissipate kinetic energy. By slipping at a predetermined load before structural yielding, friction dampers effectively dissipate a significant portion of the energy during a major earthquake event. This capability not only safeguards against extensive damage but also offers cost savings compared to the expense of new construction or retrofitting existing buildings, as it provides high levels of energy dissipation.
A clear example of attached damping, specifically Coulomb friction, can be illustrated by Equation (1). This example involves a block moving horizontally on a rough surface, where the equation states that the frictional force is directly proportional to the normal force.
F f r i c t i o n = μ k N
where μk is the dynamic friction coefficient or kinetic energy, and N is the normal force [24]. When subjected to cyclic loads, frictional damping devices waste energy via a non-elliptical hysteretic loop. A single-degree-of-freedom system consisting of a mass, spring, and friction can simulate this behavior. Figure 2 depicts an ideal Coulomb damper as a simplified depiction of this notion.
When the mass, denoted as q, experiences a displacement, and the applied force (Ft) is less than the Coulomb friction force (Fk), the system does not slip. In this scenario, the force–displacement relationship, represented by F1-q, demonstrates a linear characteristic along the AB line with a slope of (1 − α)k. However, sliding occurs when the applied force (F1) equals Fk, the displacement exceeds the critical value of q, and the force–displacement relationship follows the BC line, establishing a loop. Slipping stops when the mass reverses its motion, the applied force (Ft) falls below Fk, and the force drops down the CD line with a slope of (1 − α)k. At point D, where the displacement is qc − 2q, the compressive force equals Fk, resulting in slipping along the DE line. As the mass reaches point E, moving in the opposite direction, the force follows the EF line, and the cycle continues [24].
The dynamic friction behavior of the Inline Seismic Friction Damper (ISFD) is responsible for its characteristic hysteresis pattern observed during the slipping stage. To accurately represent the elastoplastic behavior of the damper, it is recommended to utilize the Wen model, as illustrated in Figure 3. This model is ideal for representing the dynamic friction properties of ISFDs [2,3,25].
Inline Seismic Friction Dampers (ISFDs) should be balanced to ensure structural integrity and prevent excessive design force. Excessive ISFDs deployment leads to rigidity while reducing their numbers eliminates their impact on the system. Therefore, it is crucial to have optimal shear forces on the ISFDs to minimize the demand on the frame and maximize energy dissipation. For this calibration, nonlinear response history analysis should be employed. The central concept is to conduct static analysis and estimate the approximate forces acting on an inline seismic friction damper [16,17].
The equivalent lateral static analysis was performed to calculate the base shear and stiffness of each floor and the design parameters for each damper. These values are presented in Table 2.
The slip loads are calculated using a method proposed for an equivalent single degree of freedom with idealized lateral load deformation. The ratio of the total braces’ stiffness of each floor to the total braces’ stiffness plus the story stiffness of each floor is calculated using an iterative procedure, assumed to be 0.8. Additionally, nonlinear time history analysis can be used as an iterative procedure to design the sections of braces and friction dampers [15]. Table 3 represents the equivalent static force analysis results and the slip force for all three models.

4. Modal Analysis

The Eigenvalue analysis calculates the natural modes of the system, providing the free-vibration mode shapes and frequencies. The Ritz value analysis determines modes based on specific loading conditions. Since Ritz value yields a better basis than eigenvalue analysis, especially for analyses involving superposition such as response spectrum or time-history analysis, it was utilized to determine the natural periods of the YRB framed system. Table 4 displays the fundamental period of the structure based on the modal analysis, and the results for braced frames obtained from the 2015 NBCC [14] can be determined with empirical Equation (2).
T a = 0.025 h n
where Ta(s) represents the fundamental lateral period, and hn denotes the height of the structure in the meter. Including ISFDs in the frame reduced approximately 60% to 70% compared to the bare frames in the fundamental period. Moreover, the empirical equation results are about 15 to 60% lower than those obtained by the Ritz analysis.

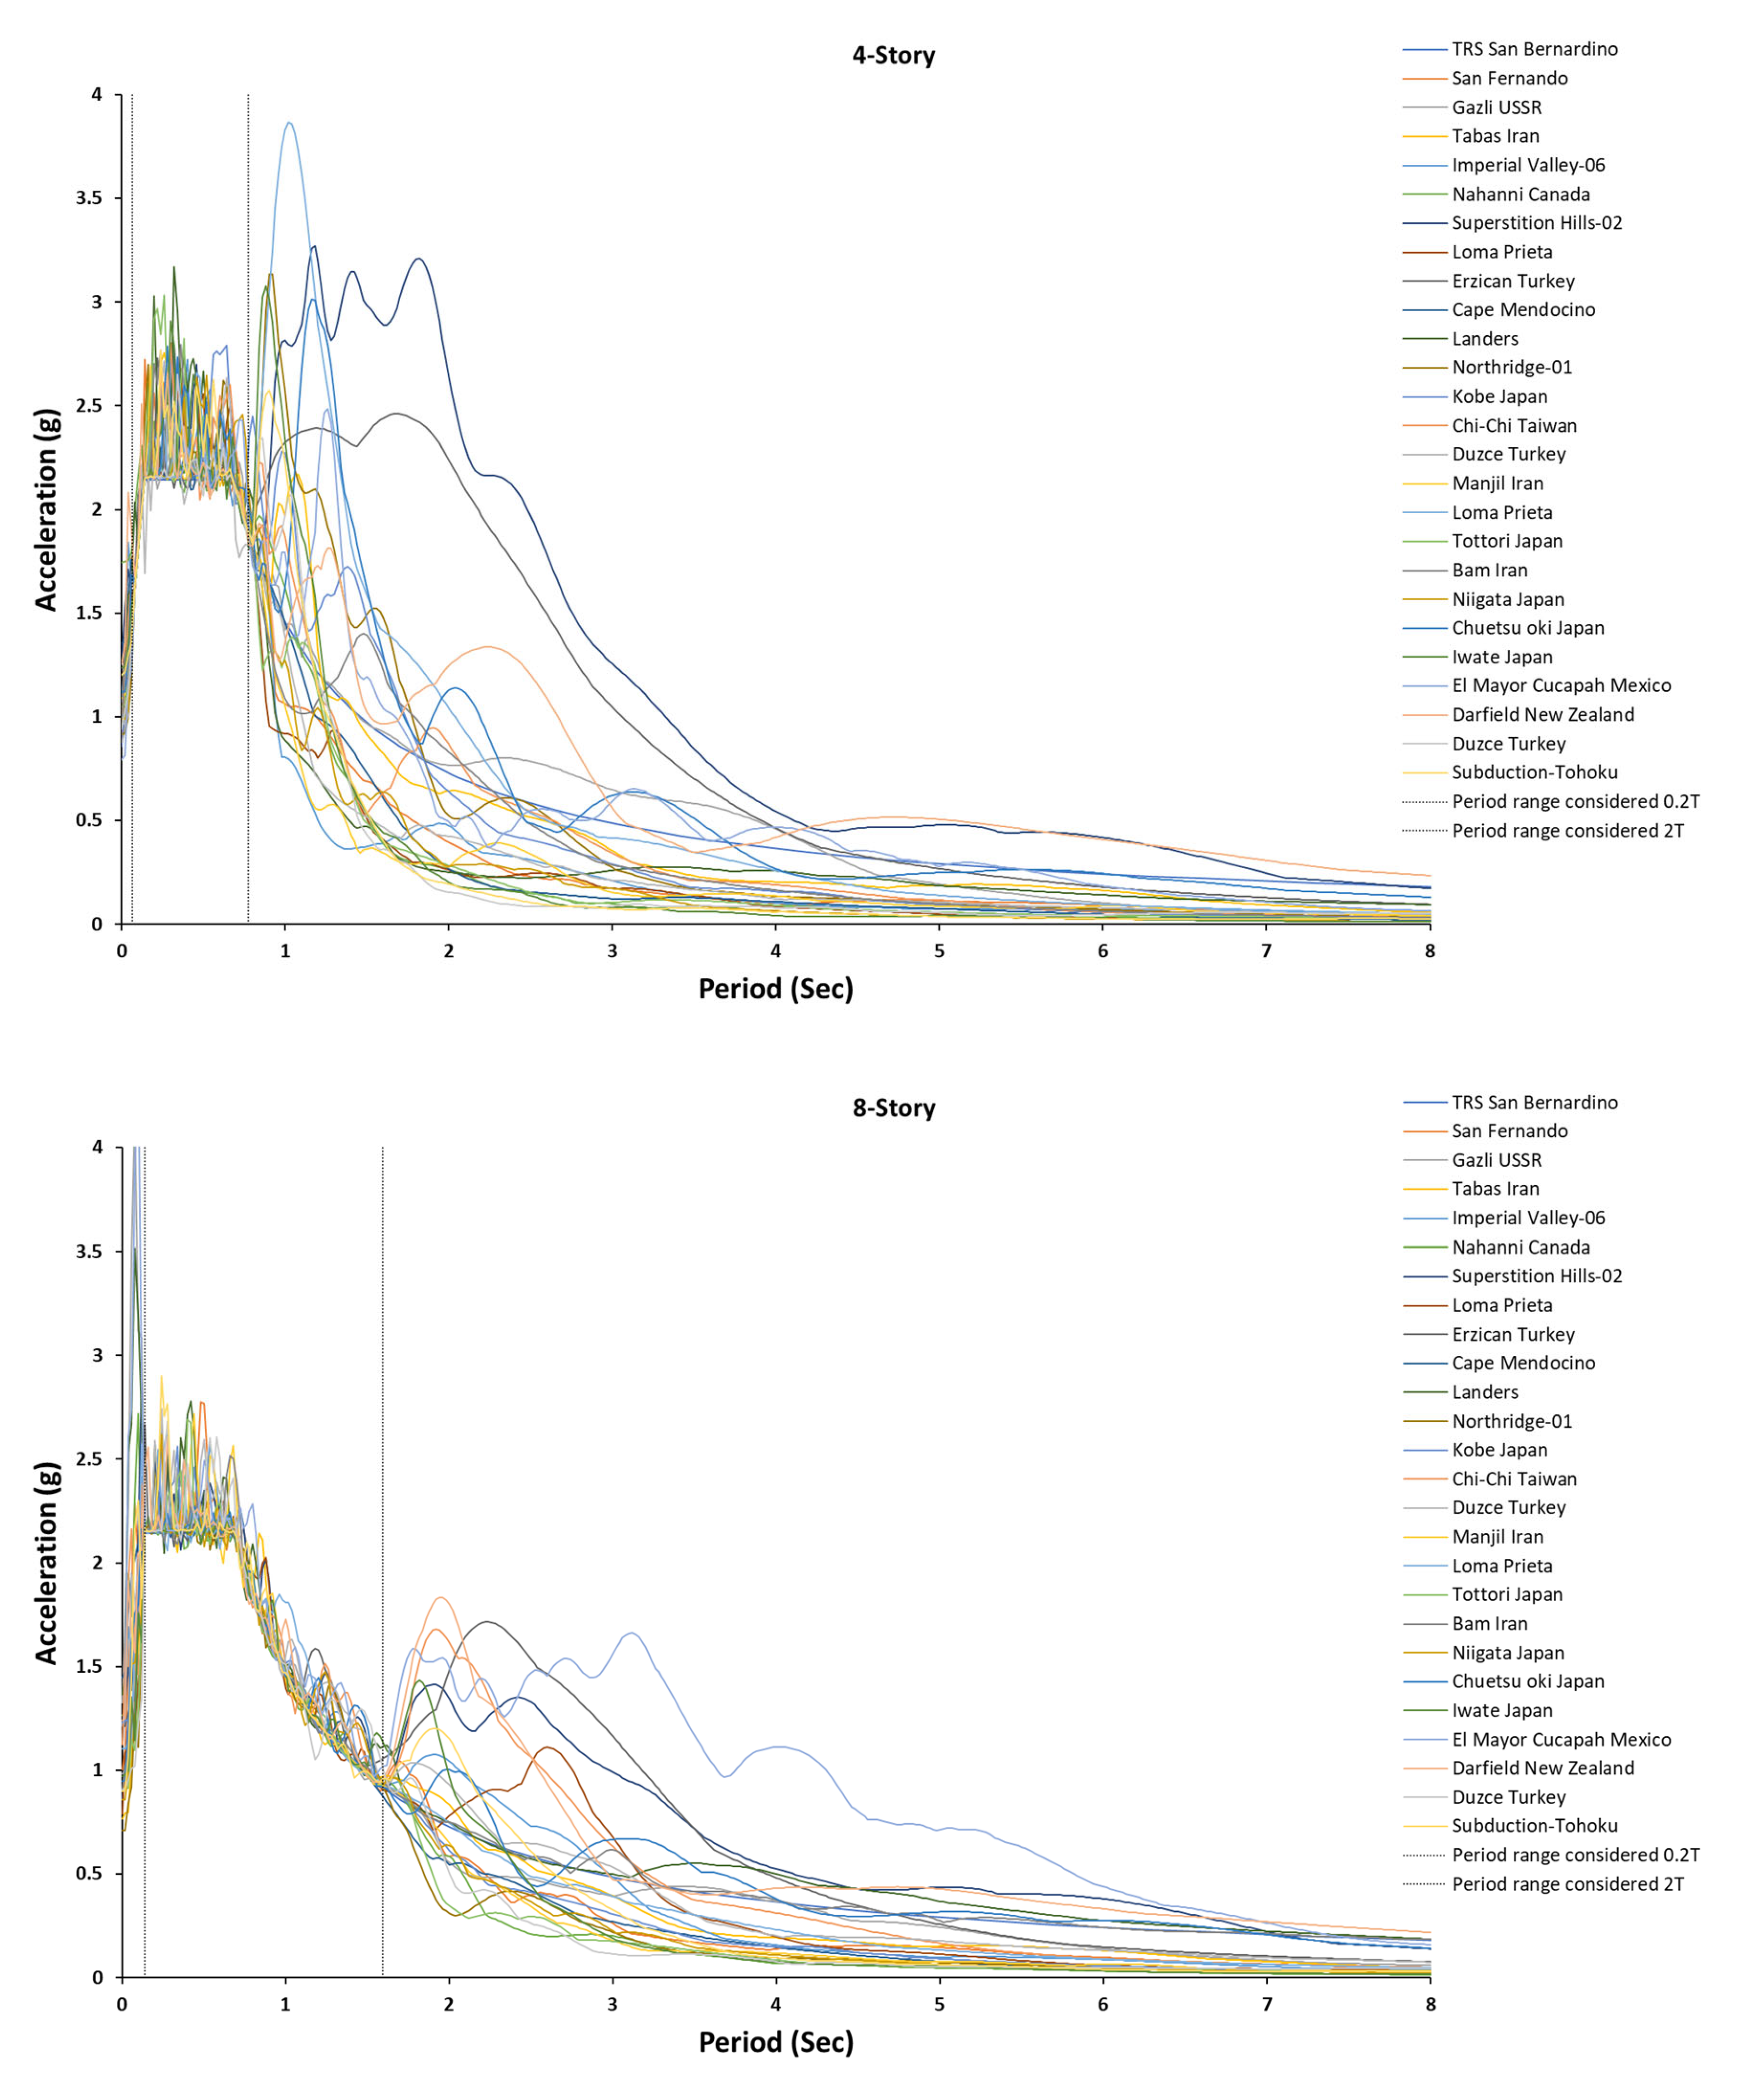
5. Response Spectrum

The buildings in this study are assumed to be in San Bernardino, California, with a trend design response spectrum like Tofino on Vancouver Island in British Columbia. A single target response spectrum was developed for the maximum considered earthquake (MCER) with 5% damping, obtained by multiplying the design response spectrum by a factor of 1.5, as presented in Figure 4. By selecting a relative location in the United States, the MCER was incorporated into the Canadian code for performance assessment of the inline friction dampers.
The spectral acceleration for a site in San Bernardino, USA, was calculated for different hazard levels, considering both the basic safety earthquakes (BSE) for new and existing building standards. An idealized relationship between base shear and displacement was established using a similar displacement approach for all the models. The analysis was continued until the frame’s maximum interstudy drift met the 2.5 percent design limit. The elastic lateral stiffness (Ki), effective lateral stiffness (Ke), effective yield strength (Vy), and target displacements were determined accordingly.

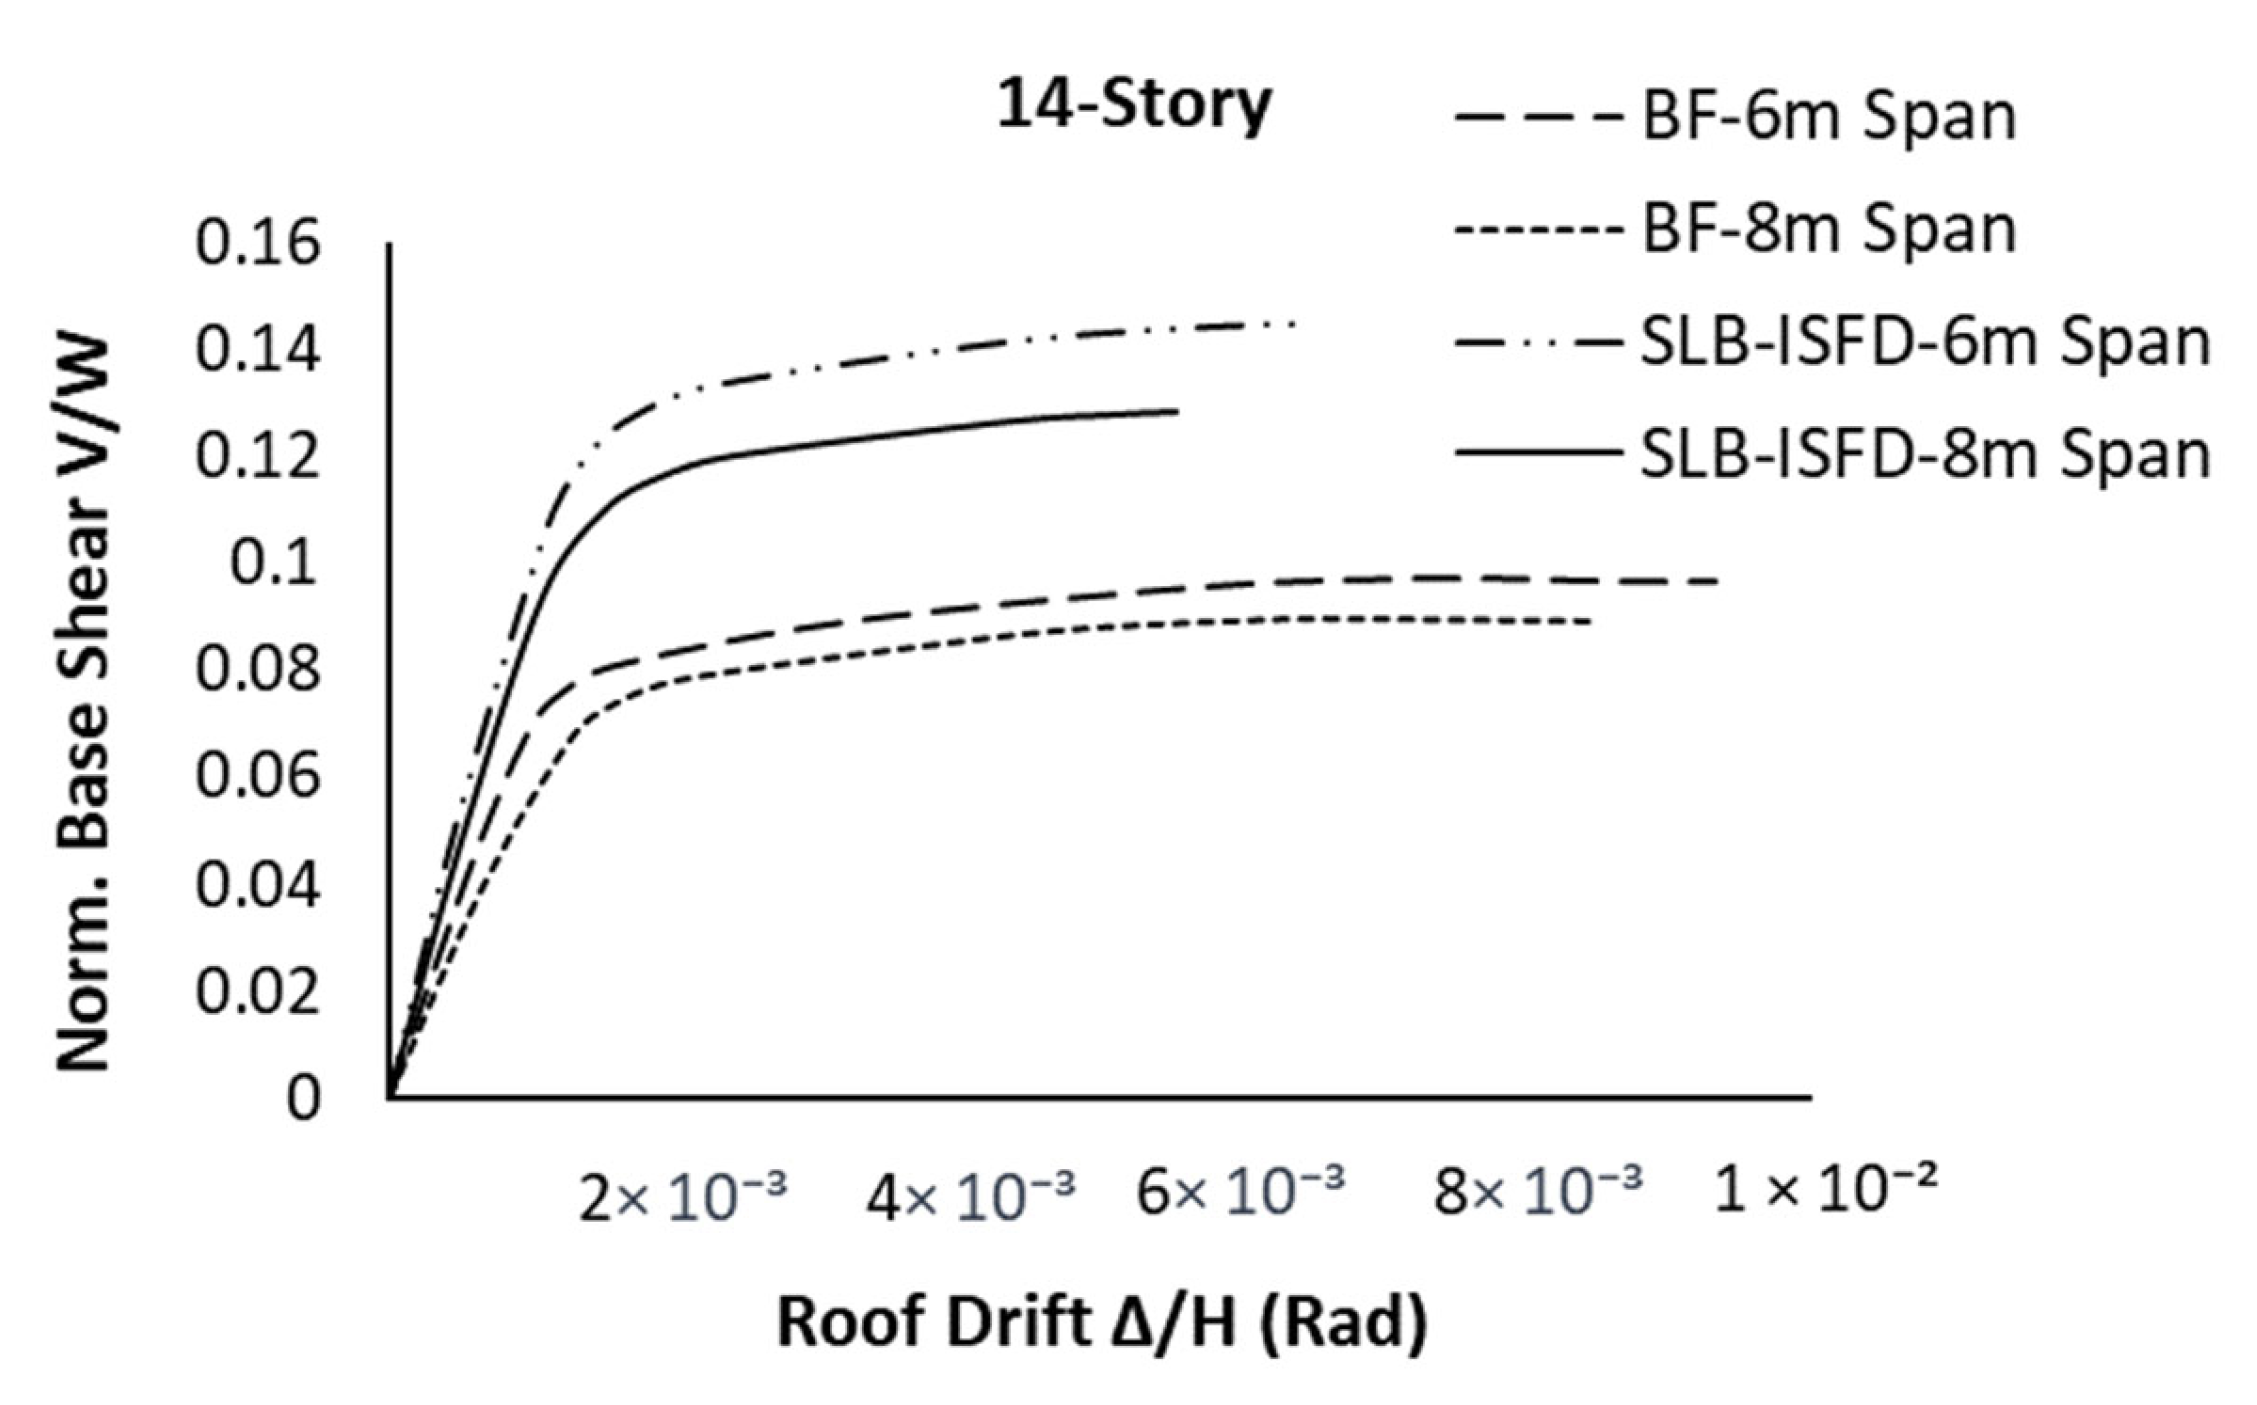
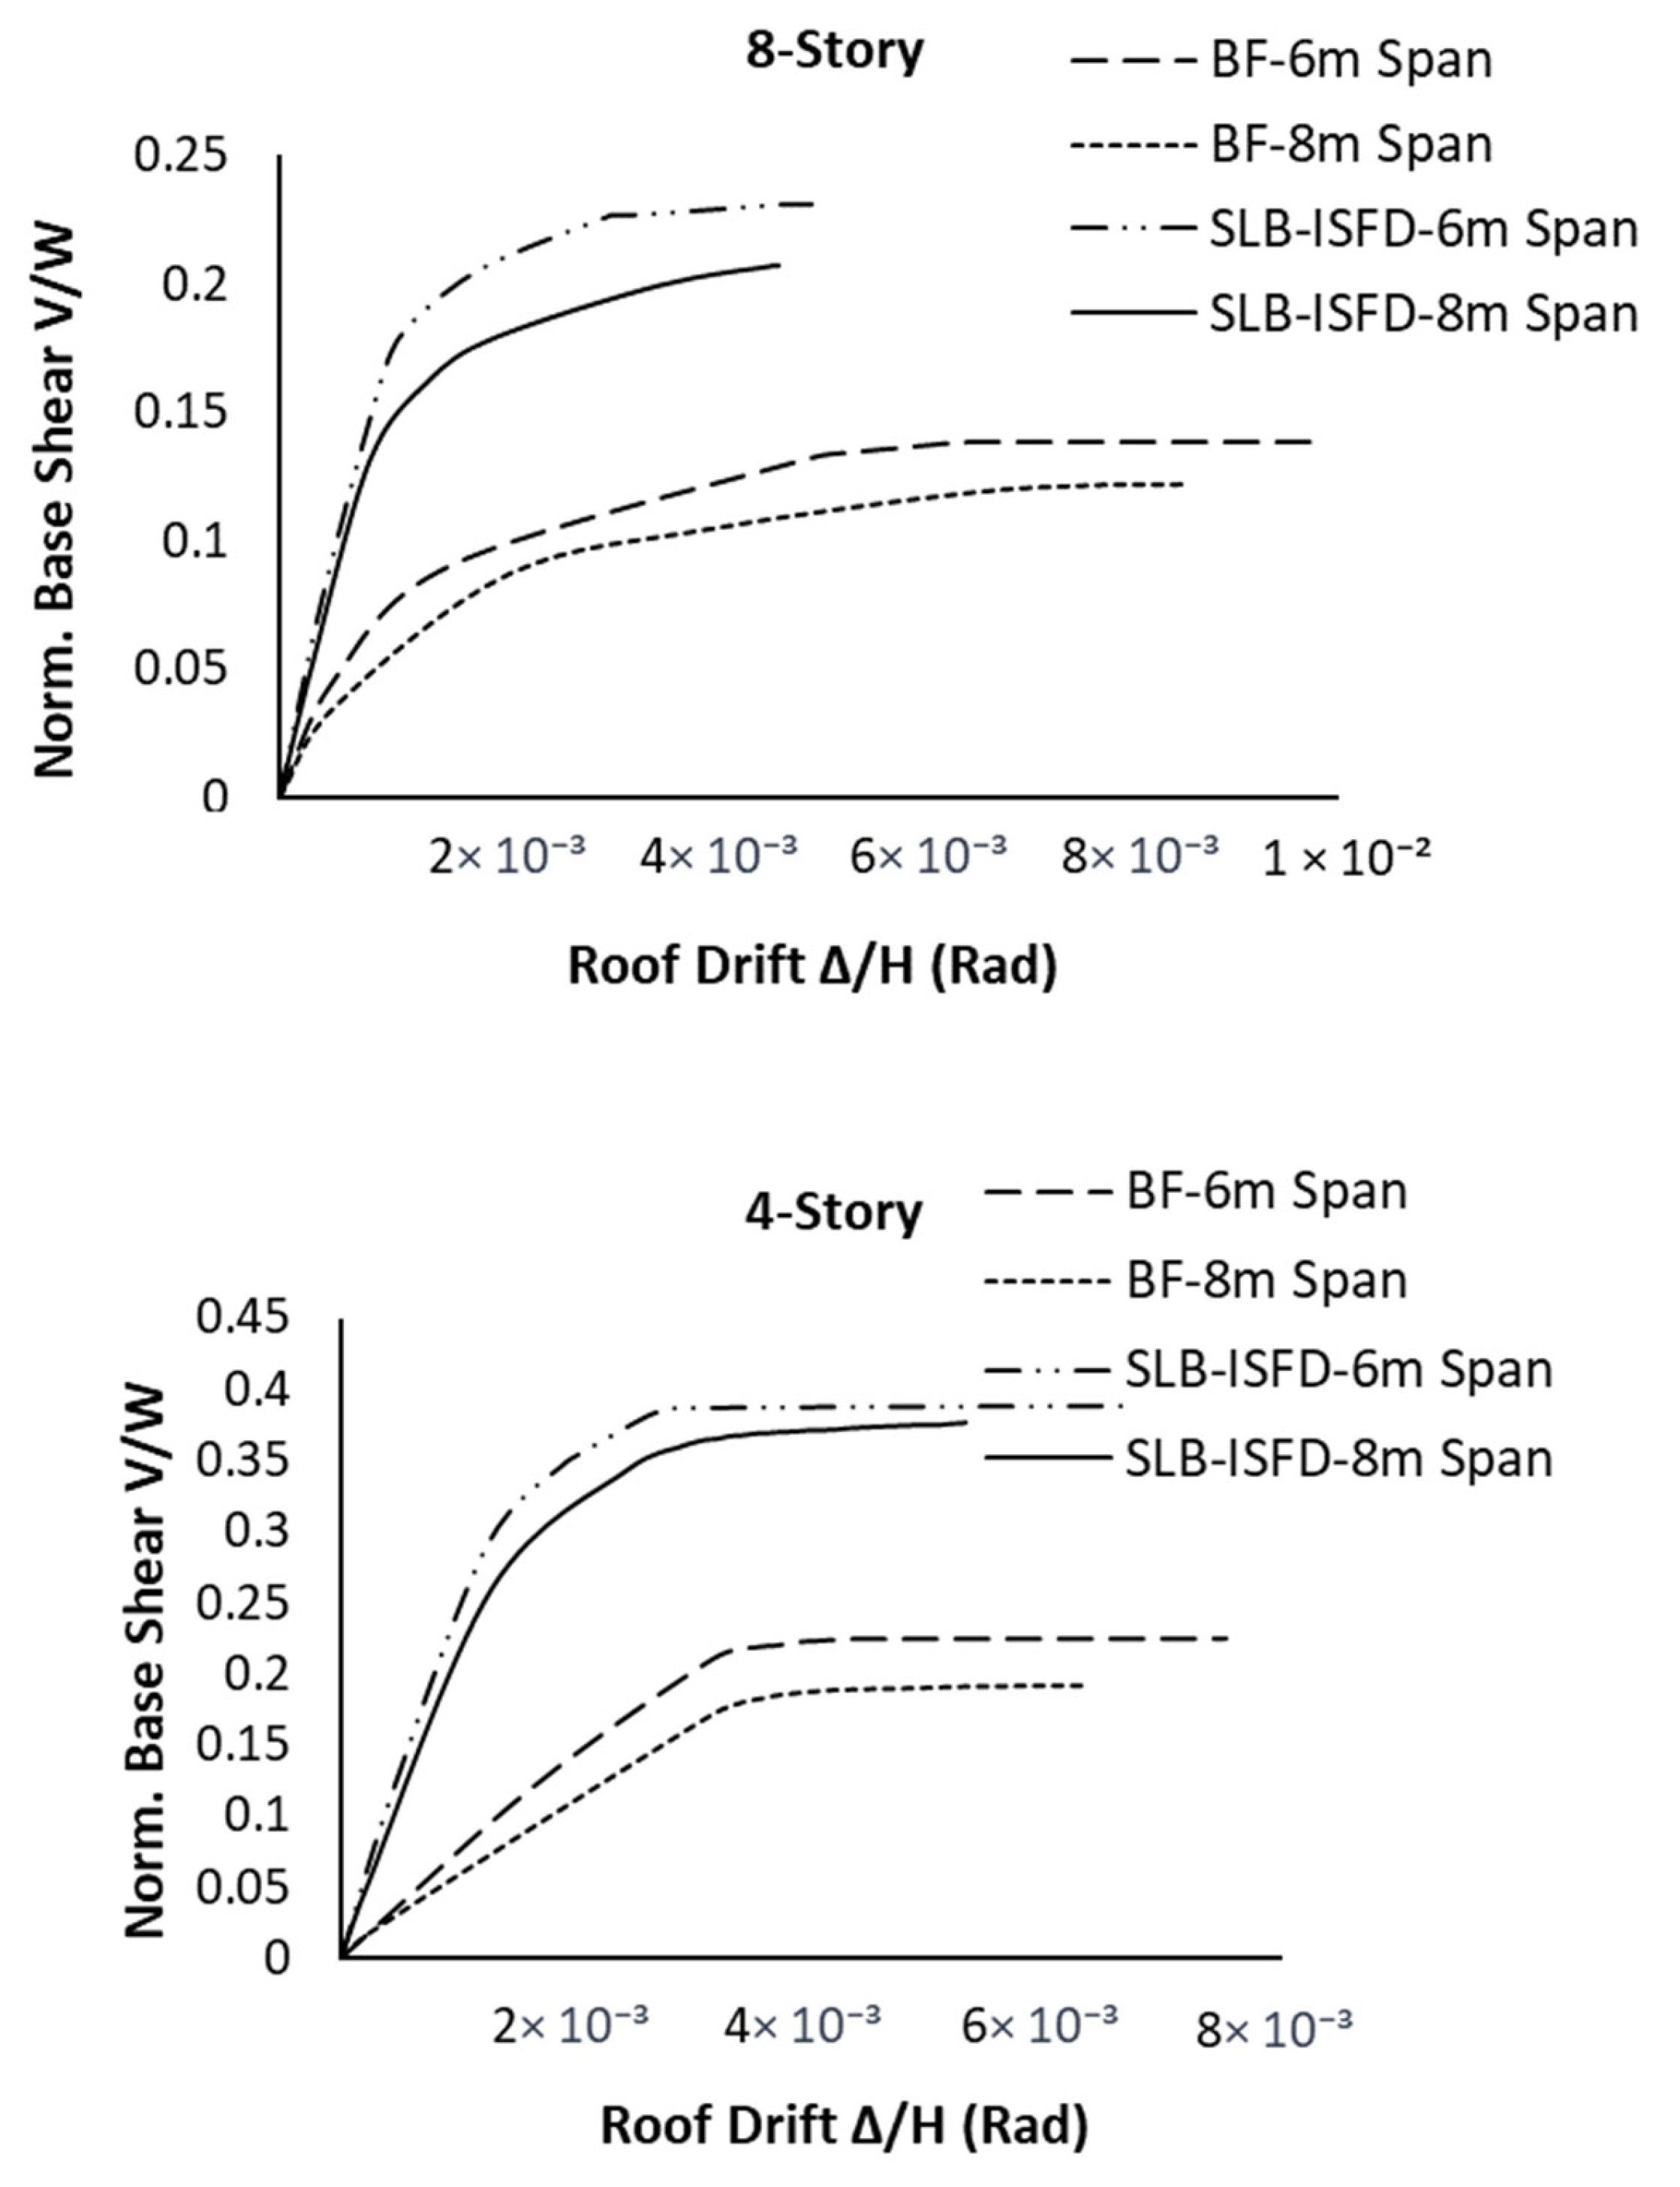
6. Nonlinear Static Analysis

Nonlinear static pushover analysis is carried out to calculate the structural strength capacities and displacement demand. This procedure involves pushing the structure under a lateral load pattern to the level of displacement expected in the design earthquake. The main goal of this analysis is to assess displacement demands in critical elements that exhibit undesirable characteristics such as strength, stiffness discontinuities, extra loads on brittle components, overall structural stability, and regions exposed to significant displacement demand, which require special detailing [27,28,29]. The consideration of global P-delta effects can be either non-iterative or iterative, depending on the mass and load case. The design employs the Fiber section “P-M2-M3” with distributed plasticity and a finite length hinge zone.
Furthermore, the columns have meshed at intermediate joints and intersecting frames to improve the accuracy of simulating local P-delta effects. The load combinations presented by the lateral loads shall be concerned with the P-Delta effect. The load combinations are based on NBCC 2015 and include factor loads for ultimate limit states of 1.0D + 1.0E + 0.5L + 0.25S. These factors represent 100% of the dead and earthquake loads, 50% of the live load, and 25% of the snow load. The local P-δ effect, which can cause a reduction in the buckling load, is automatically considered in the analysis, particularly for slender columns [21,27,29].
In this section, a nonlinear static pushover analysis was performed to calculate the overstrength and ductility factors of each structure based on the target displacement of MCER. The calculated values are tabulated in Table 5 and presented in Figure 5.
The 2015 NBCC [14] introduced the related force modification factors for different Seismic Force-Resisting Systems (SFRS), irrespective of building height, span length, and bracing configurations. In addition, these factors are not considered for friction dampers. Several relationships have been proposed to estimate the ductility factor [29,30,31,32]. In this research, the method proposed by Miranda and Bertero (1994) [32], represented by Equations (3) and (4), was used to calculate the ductility reduction factor Rµ for stiff soil. Here, µ represents ductility, T denotes the natural period of the structures, and ϕ is a function of ductility, fundamental period, and soil conditions. These results are presented in Table 6.
R μ = μ 1 φ + 1 1
ϕ = 1 + 1 10 T μ T 1 2 T e 1.5 ln T 0.6 2
The seismic reduction factors for different types of structures are depicted in Figure 6. The overstrength factors increase with decreasing span length and height of the structures, with average values of 1.85 for an 8 m span and 1.63 for a 6 m span across different building types. Among them, the four-story 6 m span presents the maximum overstrength factor of 3.06, while the fourteen-story 8 m span exhibits the minimum value of 1.41. The ductility reduction factors range from a minimum value of 2.55 for a four-story 8 m span and a maximum value of 4.43 for a fourteen-story 6 m span. Generally, the ductility factor tends to increase in higher buildings, with average values of 3.66 for an 8 m span and 4.44 for a 6 m span. The closest value of response modification factors for ISFDs can be selected as recommended by the NBCC 2015 [14] (R = 4.8), and the ASCE 7 (R = 8) for ductile buckling restrained braced frames are 4.8 and 8. The recommended response modification values are compared with those obtained with the analytical results shown in Figure 6. The highest response modification factor, equal to the prescribed value by ASCE 7 [23], is observed in the four-story building with a 6 m span, reaching 8.01. Generally, all values surpass the recommended value by the NBCC 2015 [14] (R = 4.8). These values decrease with the increasing height of the structure and the span length. Moreover, the average values of response modification factors for all three models are 6.87 and 7.29 for 8 m and 6 m span lengths, respectively.

7. Inelastic Response History Analysis

The relationship between the response of the structure and ground-motion parameters has been explored through a different set of strategies [31,33,34]. Scaling and spectral matching are two approaches for adjusting time series to be consistent with the design response spectrum. Ground motions modification includes multiplying the initial time series by the scaling factor. Then, the matched spectrum equals or exceeds the design spectrum over a specified period range. Matching the time series frequency content to be consistent with the design spectrum is Spectral matching [30,35].
This study obtained 25 different ground motion records from the Pacific Earthquake Engineering Research Center (PEER) database [36], as presented in Table 7. Including a diverse range of ground motions leads to a more comprehensive assessment of seismic performance results. The SeismoMatch 2018 [37] software was used to match the accelerograms based on the design spectrum spectrally. The results of this matching process are illustrated in Figure 7.

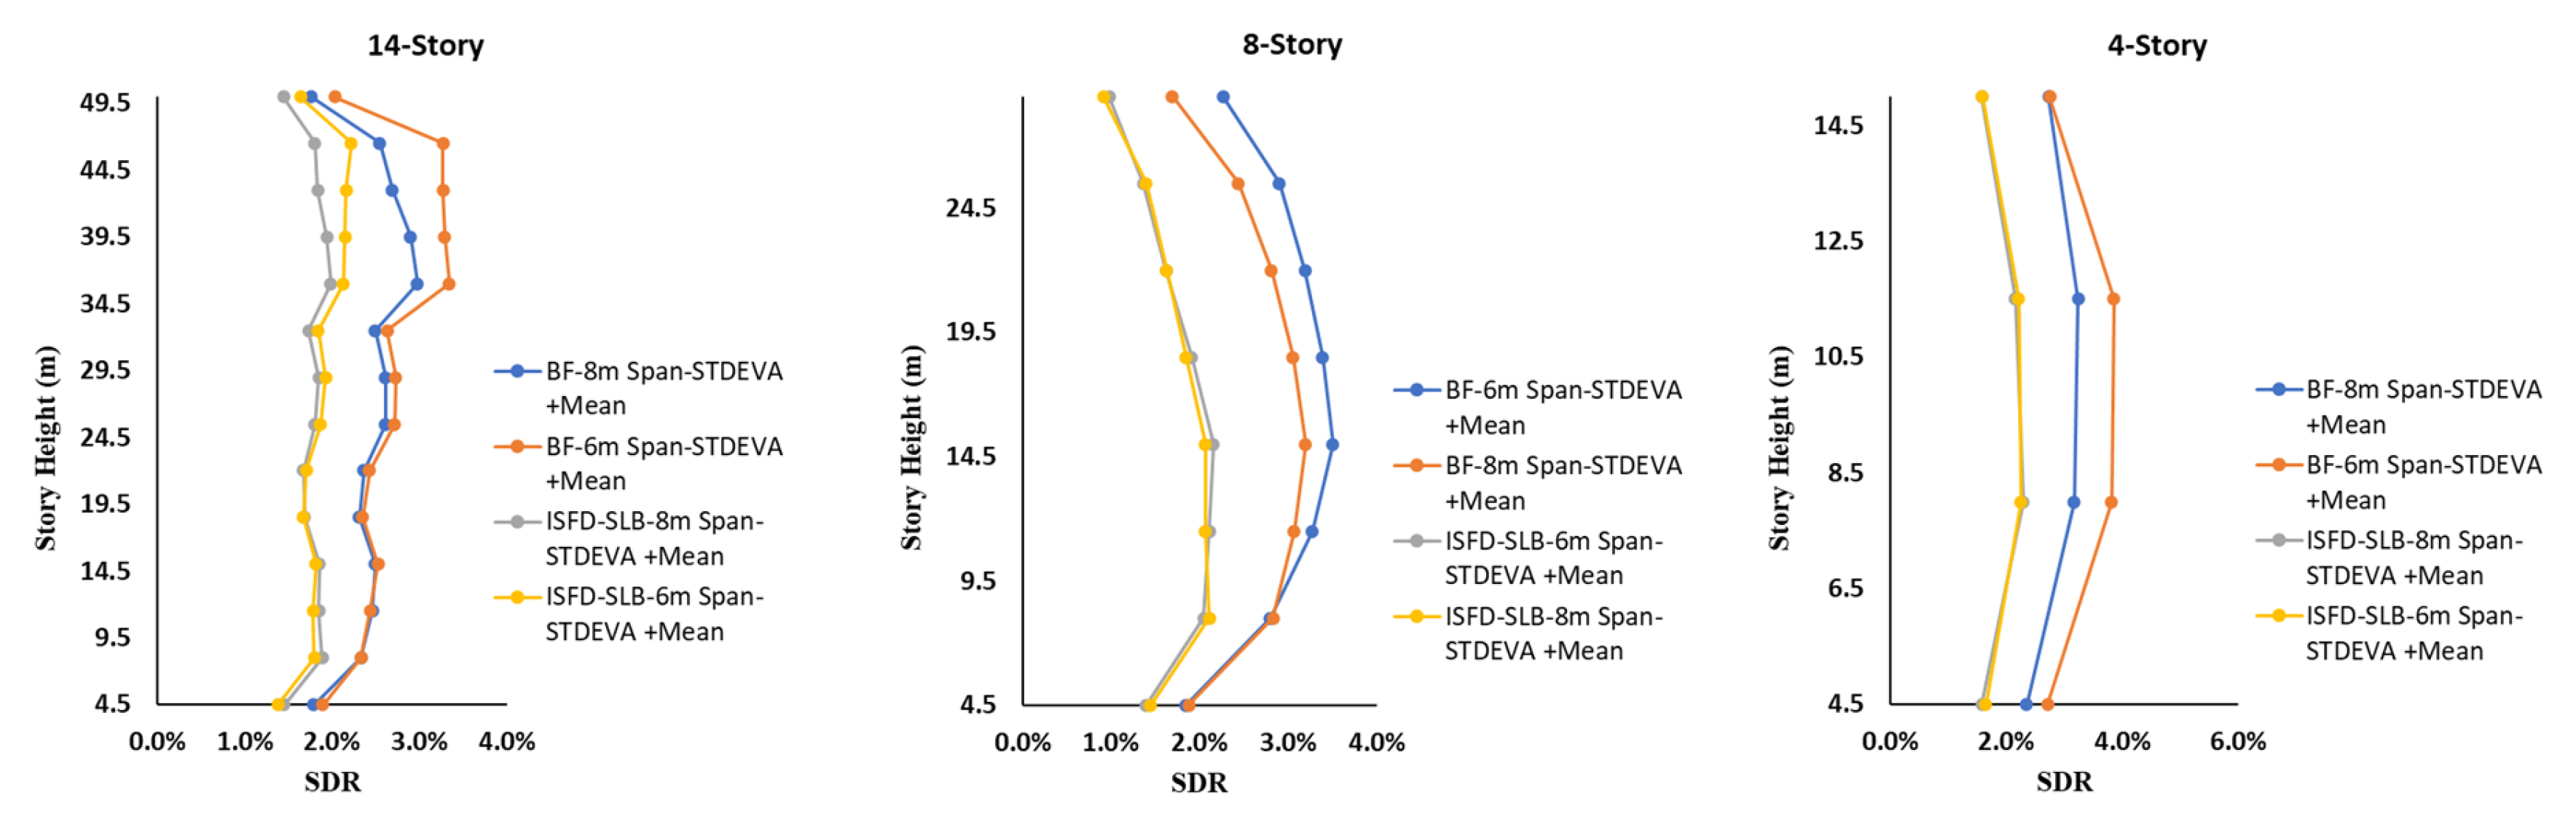
8. Inter-Story and Base Shear Demand Results

Dynamic time history analysis was performed to assess the seismic performance of the ISFDs. Figure 8 presents the mean values and the sum of standard deviations for all twelve models. The maximum mean values and the sum of standard deviation were 1.98% and 2.20% for the fourteen-story equipped with ISFDs, with 8 m and 6 m span lengths, respectively. These numbers increased to 2.90% and 3.33% for the bare frames. The eight-story buildings with ISFDs had maximum values of 2.10% and 2.15% for 8 m and 6 m spans, while the brace frames had maximum values of 3.20% and 3.50% for the same span length. The four-story structure experienced the same mean and sum of standard deviation values, with a maximum of 2.29% for ISFDs with both 8 m and 6 m span lengths. The bare frames showed values of 3.23% and 3.75% for 8 m and 6 m spans, respectively. The drift ratios were reduced by approximately 60 to 70% compared to the bare frames. These values moved to a lower level in greater span length. Moreover, the story drift ratio concentration shifted to higher levels with an increase in the height of the structures.
For the sake of brevity, only the maximum hysteresis curves of the three models are shown in Figure 9. The amount of dissipated energy in the models with an 8 m span was more significant than the 6 m span length, primarily due to the axial forces in the bracing.
The results of the nonlinear response history analysis for the base shear demands are presented in Figure 10. These values represent the maximum base shear for each ground motion. It can be observed that all these values are below the capacity of each system. Furthermore, the base shear demands are higher with longer span lengths and in taller buildings.

9. Results and Discussions

Friction dampers, like other displacement-dependent devices, exhibit amplitude-dependent damping. While the slip force remains constant, displacements might alter. However, the slip force can be adjusted depending on the required displacement. In this instance, the force–displacement ratio is not proportional, and decoupling the stiffness from the yielding point is one of its advantages in high seismic zones. This article outlines the methodology for determining overstrength, response modification, and ductility factors for various Inline Seismic Friction Dampers (ISFD) systems. Slip loads are calculated based on the lateral shear forces, shear deflection at each floor, the lateral stiffness of braces, and the lateral stiffness of existing frames and braces. The response modification factors of four- eight- and fourteen-story ductile concrete structures equipped with Inline Seismic Friction Dampers (ISFDs) of different span lengths and heights are determined using the method by Miranda and Bertero’s (1994) method [32]. For this purpose, normalized moment rotation component models are calculated for each beam and column based on ASCE 41 [38]. These component modeling parameters are applied to each structural member. The SLE, DLE, and MSE target displacement is computed according to ASCE 41 [38]. Nonlinear static analysis is then performed to assess the seismic characteristics of each system. The performance of each system is evaluated through nonlinear response history analysis, considering twenty-five different ground motions matched to the target response spectrum and the structure’s period within the range of 0.2T to 1.5 T. The key observations and conclusions are summarized as follows:
In the NBCC 2015 [14], the closest ductility and overstrength factors for an equivalent system are provided for a ductile buckling restrained braced frame. The overstrength factors ranging from 1.41 to 3.06, surpass the prescribed value (R0 = 1.2) specified in the NBCC 2015 [14]. These factors decrease with increasing height and are higher in shorter span lengths. The ductility reduction factors, however, exhibited an upward trend when the height increased. The ductility reduction factors range from 2.55 to 4.43 compared to the NBCC 2015 [14] value 4.
The response modification factor exhibits a decreasing trend as the height increases, and it is more significant for smaller span lengths. The response modification factor ranges between 5.53 and 8.01, with an average of 6.56 and an average minus standard deviation of 5.57, whereas the recommended value in the NBCC 2015 [14] for BRBF is 4.8. These results suggest that structures with a height equal to or less than 50 m adopt a response modification factor of 5.5. This factor covers approximately 95% of the cases and falls within the safe range. The slip loads are calculated based on various factors, including the brace angle, lateral shear forces, shear deflection at each floor, the lateral stiffness of the bare frame, as well as the lateral stiffness of braces and their combination. Therefore, for simplicity and a practical approach used by engineers, it is recommended that the system be modeled as a braced frame, and the axial loads in the braces should be equal to or greater than the slip load of the friction dampers. This approach ensures accurate representation and sufficient capacity for the system. The results acquired from nonlinear response history analysis, explicitly the STDEVA +Mean values, indicated a notable reduction in the story drift ratio ranging from 60% to 70% for all three models incorporating ISFDs, compared to the bare frames.
Moreover, the concentration of story drift demands was higher in taller buildings while remaining relatively consistent or decreasing as the span length decreased. The results from base shear demand indicated that increased structural height led to an elevated base shear demand. Conversely, a decrease in the span length resulted in a reduction of about 10% in the base shear demand.
The analysis of hysteresis curves demonstrated that longer span lengths exhibited higher dissipated energy than shorter span lengths. Implementing the ISFD system directly affects the reduction in the formation of the plastic hinges, resulting in an approximate 45% improvement in structural performance, which aligns with the objective of life safety or better.
There was an accompanying increase in the base shear demand as the height of the structure increased. On the other hand, a smaller span length resulted in a decrease. Notably, implementing inline friction dampers resulted in a substantial reduction in the dissipated energy, particularly in structures with larger span lengths.

10. Conclusions

This paper focuses on applying seismic reduction factors in line with the recommended R values specified in the NBCC 2015 [14]. These reduction factors can support minimizing the number of variable design parameters, enhancing structural performance. Because of this, additional work is warranted to capture such performance for friction dampers. Observations indicate that increasing the height of a structure reduces the overstrength factor while increasing the ductility factor. Shorter span lengths result in greater response modification factors; a suggested response modification factor for structures 50 m in height is 5.5. Base shear demand increases with height and decreases with span length (10% reduction). Hysteresis curve analysis demonstrates greater dissipated energy for longer spans. Nonlinear response history analysis shows a substantial reduction (60–70%) in story drift ratio when Inline Seismic Friction Dampers (ISFDs) are employed, compared to bare frames. The concentration of story drift demands is higher in taller buildings but remains consistent or decreases with shorter spans.
Further investigations are needed to comprehend and capture the performance of friction dampers fully. Additional investigations can be conducted to assess the seismic characteristics of buildings using different bracing configurations, floor heights, and bracing angles. More detailed modeling approaches for structures equipped with ISFDs shall be considered.

Author Contributions

Conceptualization, A.N., A.B. and F.M.T.; methodology, A.N., A.B. and F.M.T.; software, A.N.; validation, A.N., A.B. and F.M.T.; formal analysis, A.N.; investigation, A.N., A.B. and F.M.T.; resources, A.B. and F.M.T.; data curation, A.N.; writing—original draft preparation, A.N.; writing—review and editing, A.B. and F.M.T.; visualization, A.N., A.B. and F.M.T.; supervision, A.B. and F.M.T.; project administration, A.B. and F.M.T. All authors have read and agreed to the published version of the manuscript.

Funding

This research received no external funding.

Institutional Review Board Statement

Not applicable.

Informed Consent Statement

Not applicable.

Data Availability Statement

Not applicable.

Acknowledgments

The support of the Natural Sciences and Engineering Research Council (NSERC) and the IC-IMPACTS Research Network is gratefully acknowledged. The authors would also thank O. Galindo, Quaketech Inc., for his valuable comments and suggestions.

Conflicts of Interest

The authors declare no conflict of interest.

Glossary

R0Overstrength factor
RdDuctility-related force modification factor
Ta(s)Fundamental lateral period
hnHeight of the structure
KiElastic lateral stiffness
KeEffective lateral stiffness
VyEffective yield strength
VdDesign Strength
ϕFunction of ductility
RµDuctility reduction factor
RResponse modification factor
µDuctility
ΔmaxMaximum displacement
ΔYYield displacement
SLEService Level Event
DLEDesign Level Event
MSEMaximum Seismic Event
ISFDInline Seismic Friction Damper
NBCCNational Building Code of Canada
MRFMoment Resisting Frame
SFRSSeismic Force Resisting System
MCEMaximum Considered Earthquake
SBDSingle Diagonal Braces

References

  1. Akiyama, H. Evaluation of Fractural Mode of Failure in Steel Structures Following Kobe Lessons. J. Constr. Steel Res. 2000, 55, 211–227. [Google Scholar] [CrossRef]
  2. Naghshineh, A. Seismic Resilience and Performance Design Approach for Concrete Moment Resisting Frame Buildings Equipped with Yielding Restrained Braces. Ph.D. Thesis, Concordia University, Montreal, QC, Canada, 2021. [Google Scholar]
  3. Constantinou, M.; Soong, T.; Dargush, G. Passive Energy Dissipation Systems for Structural Design and Retrofit; MCEER Monograph No. 1; University at Buffalo: Buffalo, NY, USA, 1998; ISBN 0-9656682-1-5. [Google Scholar]
  4. Soong, T.T.; Dargush, G.F. Passive Energy Dissipation and Active Control, Boca Raton: Structural Engineering Handbook; CRC Press LLC: Boca Raton, FL, USA, 1999; pp. 1–28. [Google Scholar]
  5. Ciampi, V.; De Angelis, M.; Paolacci, F. Design of yielding or friction-based dissipative bracings for seismic protection of buildings. Eng. Struct. 1995, 17, 381–391. [Google Scholar] [CrossRef]
  6. Fu, Y.; Sherry, S. Design of friction damped structures using lateral force procedure. Earthq. Eng. Struct. Dyn. 2000, 29, 989–1010. [Google Scholar] [CrossRef]
  7. Levy, R.; Lavan, O.; Rutenberg, A. Seismic design of friction braced frames based on historical records. Earthq. Spectra 2005, 21, 761–778. [Google Scholar] [CrossRef]
  8. Nabid, N.; Hajirasouliha, I.; Petkovski, M. A Practical Method for Optimum Seismic Design of Friction Wall Dampers. Earthq. Spectra 2017, 33, 1033–1052. [Google Scholar] [CrossRef]
  9. Couch, L.; Tehrani, F.M.; Naghshineh, A.; Frazao, R. Shake Table Response of a Dual System with Inline Friction Damper. Eng. Struct. 2023, 281, 115776. [Google Scholar] [CrossRef]
  10. Montuori, R.; Nastri, E.; Piluso, V. Theory of plastic mechanism control for the seismic design of braced frames equipped with friction dampers. Mech. Res. Commun. 2014, 58, 112–123. [Google Scholar] [CrossRef]
  11. Nabid, N.; Hajirasouliha, I.; Escolano Margarit, D.; Petkovski, M. Optimum Energy Based Seismic Design of Friction Dampers in RC Structures. Structures 2020, 27, 2550–2562. [Google Scholar] [CrossRef]
  12. Alam, M.S.; Moni, M.; Tesfamariam, S. Seismic Overstrength and Ductility of Concrete Buildings Reinforced with Superelastic Shape Memory Alloy Rebar. Eng. Struct. 2012, 34, 8–20. [Google Scholar] [CrossRef]
  13. Asgarian, B.; Shokrgozar, H.R. BRBF Response Modification Factor. J. Constr. Steel Res. 2009, 65, 290–298. [Google Scholar] [CrossRef]
  14. NBCC. National Building Code of Canada; NBCC: Ottawa, ON, USA, 2015. [Google Scholar]
  15. Tirca, L.; Serban, O.; Tremblay, R.; Jiang, Y.; Chen, L. Seismic Design, Analysis and Testing of a Friction Steel Braced Frame System for Multi-Storey Buildings in Vancouver. Key Eng. Mater. 2018, 763, 1077–1086. [Google Scholar] [CrossRef]
  16. Naghshineh, A.; Kassem, A.; Pilorge, A.G.; Galindo, O.R.; Bagchi, A. Seismic Performance of Reinforced Concrete Frame Buildings Equipped with Friction Dampers. Structures Congress 2018; American Society of Civil Engineers: Fort Worth, TX, USA, 2018; pp. 94–101. [Google Scholar] [CrossRef]
  17. Galindo, O.; Frazao, R.; Pastor, C.; Coronado, G.; Gonzales, D. Supplemental Damping for the seismic retrofit of 8-storey RC Hotel building in the Mexican Pacific using Yielding Restrained Braces—Part A, Comparison of alternatives. In Proceedings of the 12th Canadian Conference on Earthquake Engineering, Quebec City, QC, Canada, 17–20 June 2019. [Google Scholar]
  18. Cherry, S.; Filiatrault, A. Seismic Response Control of Buildings Using Friction Dampers. Earthq. Spectra 1993, 9, 447–466. [Google Scholar] [CrossRef]
  19. Christopoulos, C.; Mansour, N. Performance Based Seismic Design of Structures Equipped with Hysteretic Dampers; Structural Engineering Research Report No. UTCE-05/01; University of Toronto: Toronto, ON, Canada, 2005. [Google Scholar]
  20. Guo, W.W.J.; Christopoulos, C. Performance spectra based method for the seismic design of structures equipped with passive supplemental damping systems. Earthq. Eng. Struct. Dyn. 2012, 42, 935–952. [Google Scholar] [CrossRef]
  21. CSI. Integrated Building Design Software, ETABS, CSI Analysis Reference Manual; Computers and Structures, Inc.: Berkeley, CA, USA, 2016; Available online: https://www.csiamerica.com/products/etabs (accessed on 18 December 2022).
  22. CSA A23.3-19; Design of Concrete Structures. Canadian Standards Association: Toronto, ON, Canada, 2019.
  23. ASCE/SEI 7-22; Minimum Design Loads and Associated Criteria for Buildings and Other Structures. American Society of Civil Engineers, ASCE Standard: Reston, VA, USA, 2022.
  24. Roberts, J.B.; Spanos, P.D. Random Vibration and Statistical Linearization; Courier Corporation: Chelmsford, MA, USA, 2003. [Google Scholar]
  25. Tehrani, F.M.; Nazari, M.; Naghshineh, A. Role of Seismic Isolation and Protection Devices in Enhancing Structural Resilience. In Objective Resilience: Technology; EMI ORC MOP 2020, Part III; American Society of Civil Engineers: Reston, VA, USA, 2022; Chapter 21; pp. 161–209. [Google Scholar]
  26. Quaketek—Earthquake Protection—Seismic Dampers. Available online: https://quaketek.com/ (accessed on 11 May 2023).
  27. NBC. Structural Commentaries User’s Guide 2019; National Research Council of Canada: Ottawa, ON, Canada.
  28. Lawsson, R.S.; Vance, V.; Krawinkler, H. Nonlinear static pushover analysis—Why, When, and How. Earthq. Eng. 1994, 1, 283–292. [Google Scholar]
  29. Krawinkler, H.; Seneviratna, G.D.P.K. Pros and cons of a pushover analysis of seismic performance evaluation. Eng. Struct. 1998, 20, 452–464. [Google Scholar] [CrossRef]
  30. Newmark, N.M.; Hall, W.J. Earthquake Spectra and Design; Earthquake Engineering Research Institute: Berkeley, CA, USA, 1982. [Google Scholar]
  31. Gupta, A.K. Response Spectrum Method in Seismic Analysis and Design of Structures; Blackwell Scientific Publications: Boston, MA, USA, 1990. [Google Scholar]
  32. Miranda, E.; Bertero, V.V. Evaluation of Strength Reduction Factors for Earthquake-Resistant Design. Earthq. Spectra 1994, 10, 357–379. [Google Scholar] [CrossRef]
  33. Baker, J.W. Conditional Mean Spectrum: Tool for Ground-Motion Selection. J. Struct. Eng. 2011, 137, 322–331. [Google Scholar] [CrossRef]
  34. Cordova, P.P.; Deierlein, G.G.; Mehanny, S.S.F.; Cornell, C.A. Development of a Two-Parameter Seismic Intensity Measure and Probabilistic Assessment Procedure. In Proceedings of the 2nd U.S.-Japan Workshop on Performance-Based Earthquake Engineering Methodology for Reinforced Concrete Building Structures 2000, Sapporo, Japan, 11–13 September 2000; pp. 187–206. Available online: https://apps.peer.berkeley.edu/research/peertestbeds/Cct/Cordova%20et%20al%202001.pdf (accessed on 18 September 2018).
  35. Gavin, H.P.; Dickinson, B.W. Generation of Uniform-Hazard Earthquake Ground Motions. J. Struct. Eng. 2011, 137, 423–432. [Google Scholar] [CrossRef] [Green Version]
  36. PEER Ground Motion Database—PEER Center. Available online: https://ngawest2.berkeley.edu/ (accessed on 5 May 2021).
  37. SeismoSoft. SeismoStruct-User Manual for Version 7.0, Pavia, Italy. 2014. Available online: www.seismosoft.com (accessed on 5 October 2020).
  38. ASCE/SEI 41-17; Seismic Evaluation and Retrofit of Existing Buildings. American Society of Civil Engineers: Reston, VA, USA, 2017.
Figure 1. Structural models with Single Diagonal Braces (SBD).
Eng 04 00114 g001
Figure 2. Mass-spring Coulomb damping and hysteresis loop [24].
Eng 04 00114 g002
Figure 3. Parameters of Wen model for SFD, courtesy of manufacturer (2023) [26].
Eng 04 00114 g003
Figure 4. MCER and DER.
Eng 04 00114 g004
Figure 5. Roof drift ratio versus normalized base shear (4, 8, and 14 stories).
Eng 04 00114 g005aEng 04 00114 g005b
Figure 6. Overstrength, ductility, and response modification factors for 14, 8, and 4 stories.
Eng 04 00114 g006aEng 04 00114 g006b
Figure 7. Matched accelerograms based on the target response spectrum for 14, 8, and 4 stories.
Eng 04 00114 g007aEng 04 00114 g007b
Figure 8. Mean and standard deviation values of Inter story drift ratio for 4, 8, and 14 stories.
Eng 04 00114 g008
Figure 9. Maximum hysteresis response for 4-, 8-, 14-story.
Eng 04 00114 g009
Figure 10. Base shear demands for 4, 8, and 14 stories.
Eng 04 00114 g010aEng 04 00114 g010b
Table 1. Design details for different models.
ColumnsBeamsBrace Section
Interior (Cm)Exterior (Cm)Interior (Cm)
StoryLevel6 m Span8 m Span6 m Span8 m Span6 m Span8 m Span6 m Span8 m Span
4445 × 4550 × 5040 × 4045 × 4535 × 3540 × 40W14 × 34W14 × 38
345 × 4550 × 5040 × 4045 × 4535 × 3540 × 40W14 × 48W14 × 53
250 × 5055 × 5545 × 4550 × 5040 × 4045 × 45W14 × 61W14 × 68
155 × 5560 × 6050 × 5055 × 5540 × 4045 × 45W14 × 90W14 × 99
8845 × 4550 × 5040 × 4045 × 4540 × 4045 × 45W14 × 38W14 × 43
745 × 4550 × 5040 × 4045 × 4540 × 4045 × 45W14 × 53W14 × 53
660 × 6065 × 6555 × 5560 × 6055 × 4555 × 50W14 × 61W14 × 68
560 × 6065 × 6555 × 5560 × 6055 × 4555 × 50W14 × 68W14 × 74
465 × 6570 × 7060 × 6065 × 6555 × 4555 × 50W14 × 74W14 × 82
365 × 6570 × 7060 × 6065 × 6560 × 5065 × 55W14 × 90W14 × 99
270 × 7075 × 7565 × 6570 × 7060 × 5065 × 55W14 × 90W14 × 120
170 × 7075 × 7565 × 6570 × 7060 × 5065 × 55W14 × 159W14 × 193
141450 × 5055 × 5545 × 4550 × 5045 × 4545 × 45W14 × 34W14 × 38
1350 × 5055 × 5545 × 4550 × 5045 × 4555 × 45W14 × 43W14 × 53
1255 × 5560 × 6050 × 5055 × 5545 × 4555 × 45W14 × 53W14 × 68
1155 × 5560 × 6050 × 5055 × 5555 × 4560 × 50W14 × 68W14 × 82
1055 × 5560 × 6050 × 5055 × 5555 × 4560 × 50W14 × 74W14 × 90
960 × 6070 × 7055 × 5560 × 6060 × 5065 × 55W14 × 99W14 × 120
860 × 6070 × 7055 × 5560 × 6060 × 5065 × 55W14 × 109W14 × 120
760 × 6070 × 7060 × 6065 × 6560 × 5065 × 55W14 × 109W14 × 132
670 × 7075 × 7560 × 6065 × 6560 × 5065 × 55W14 × 132W14 × 159
570 × 7075 × 7560 × 6065 × 6565 × 5565 × 55W14 × 145W14 × 176
470 × 7075 × 7560 × 6065 × 6565 × 5570 × 60W14 × 145W14 × 176
375 × 7580 × 8065 × 6570 × 7065 × 5570 × 60W14 × 159W14 × 176
275 × 7580 × 8065 × 6570 × 7065 × 5570 × 60W14 × 193W14 × 211
175 × 7585 × 8565 × 6570 × 7065 × 5570 × 60W14 × 193W14 × 233
Table 2. ISFDs design parameters for different types of structures.
Kf (KN/mm)Kd (KN/mm)Ked (KN/mm)Post Yield Stiffness RatioYielding Exponent
StoryLevel6 m Span8 m Span6 m Span8 m Span6 m Span8 m Span
441241341361461481650.000110
31821921982102082310.000110
22382622602862652960.000110
13083313533803734090.000110
881391431521561651860.000110
71961982142162312310.000110
62332432542652652960.000110
52662752903002963220.000110
42893053153333223550.000110
33353613663943924300.000110
23594613925033925220.000110
15676256507176567980.000110
14141321471441611481650.000110
131572111712301862310.000110
122092692282932312960.000110
112553142783432963550.000110
102823463073773223920.000110
93904584264994305220.000110
84044724415154735220.000110
74294994685444735730.000110
65105825576355736900.000110
55716476237066317650.000110
45676396196986317650.000110
36226856797486907650.000110
27248017918748399160.000110
16908137929337989630.000110
Table 3. Seismic analysis results, slip loads, and calculated mass per damper.
Seismic Shear
Forces (KN)
Seismic Brake
Slip Forces (KN)
Seismic Weight
(KN)
Mass per Damper
(Kg)
StoryBracingLevel6 m Span8 m Span6 m Span8 m Span6 m Span8 m Span6 m Span8 m Span
4SBD41314136414015012,87716,5238080
390194924025012,87716,523115115
263867631033012,87716,523115115
136938737039012,87716,523115115
8SBD81652168518018028,17433,9238080
7996100929029028,17433,92380115
685787338039028,17433,923115115
575376146047028,17433,923160115
461562353054028,17433,923160160
347248058059028,17433,923160160
233233962063028,17433,923160160
119019567068028,17433,923160195
14SBD141579177317019049,72365,1678080
1367078125028049,72365,167115115
1262272731036049,72365,167115115
1160070638044049,72365,167115115
1054764444051049,72365,167115115
952161650057049,72365,167160160
847055655063049,72365,167160160
741449059069049,72365,167160195
636042563073049,72365,167160195
531837867077049,72365,167160195
425830669081049,72365,167160240
319923672083049,72365,167195240
213916673085049,72365,167195240
1809578091049,72365,167195240
Note: Single Diagonal Braces (SBD).
Table 4. The fundamental period of the structures.
StoryT (sec)-Analytical ISFDT(sec)-Analytical Bare FrameTa (s)
6 m-Span8 m-Span6 m-Span8 m-Span
40.560.560.810.780.37
80.890.851.361.330.73
141.461.411.851.821.25
Table 5. Nonlinear static analysis results.
StoryBracingSpan Length (m)Yield Strength Vy (KN)Design Strength
Vd (KN)
Overstrength Factor RoMaximum Displacement
Δmax (mm)
Yield Displacement
Δy (mm)
Ductility
µ
4SBD6443621552.0595204.75
8547322212.4680223.63
8SBD6514833621.53140304.66
8593434811.71133343.92
14SBD6644849371.30255653.93
8750954281.38220643.43
SBD: Single Diagonal Braces.
Table 6. Response modification factors for 4, 8, and 14 stories.
StoryBracingSpan Length (m)Overstrength Factor (Ro)Ductility Reduction Factor (Rµ)Response Modification Factor (R)
4SBD63.062.618.01
82.322.555.93
8SBD62.203.527.74
81.912.975.64
14SBD61.474.436.52
81.413.965.53
Note: Single Diagonal Braces (SBD).
Table 7. Summary of metadata of selected records.
IDScale FactorEarthquakeYearStationMagnitudeMechanismArias Intensity (cm/s, OA)Arias Intensity (cm/s, MA)PGA
(g)
10.8489San Fernando1971Pacoima Dam6.61Reverse8.9414.061.219
21.0261Gazli USSR1976Karakyr6.8Reverse5.2811.270.701
30.7926Tabas Iran1978Tabas7.35Reverse11.8221.080.853
41.297Imperial Valley-061979Bonds Corner6.53Strike-slip3.9817.420.598
51.2494Nahanni Canada1985Site 16.76Reverse3.888.441.107
61.5274Superstition Hills-021987Parachute Test Site6.54Strike-slip3.7414.960.432
71.6425Loma Prieta1989BRAN6.93Reverse Oblique5.3517.740.456
81.5415Erzican Turkey1992Erzincan6.69Strike-slip1.529.120.386
90.9241Cape Mendocino1992Cape Mendocino7.01Strike-slip5.958.881.491
101.1584Landers1992Lucerne7.28Strike-slip6.9710.990.725
111.6054Northridge-011994Beverly Hills—14,145 Mulhol6.69Reverse3.0814.710.443
121.1671Kobe Japan1995KJMA6.9Strike-slip8.3913.320.834
131.0745Chi-Chi Taiwan1999CHY0287.62Reverse Oblique5.2913.710.636
141.2578Duzce Turkey1999Bolu7.14Strike-slip3.7214.010.739
151.384Manjil Iran1990Abbar7.37Strike-slip4.6425.290.514
161.769Loma Prieta1989Los Gatos—Lexington Dam6.93Reverse Oblique1.869.960.442
171.6839Tottori Japan2000SMNH016.61Strike-slip5.2916.400.732
181.0737Bam Iran2003Bam6.6Strike-slip8.0116.230.807
190.7526Niigata Japan2004NIG0196.63Reverse14.4914.771.166
201.7991Chuetsu oki Japan2007Joetsu Kakizakiku Kakizaki6.8Reverse1.3117.230.303
211.0158Iwate Japan2008AKTH046.9Reverse11.8116.441.343
221.7436El Mayor Cucapah Mexico2010CERRO PRIETO7.2Strike-slip2.9723.580.286
230.982Darfield New Zealand2010GDLC7Strike-slip4.4911.560.764
241.5914Duzce Turkey1999IRIGM 4967.14Strike-slip13.3616.211.031
25 Tohoku1923 7.9Subduction11.5159.710.427
Disclaimer/Publisher’s Note: The statements, opinions and data contained in all publications are solely those of the individual author(s) and contributor(s) and not of MDPI and/or the editor(s). MDPI and/or the editor(s) disclaim responsibility for any injury to people or property resulting from any ideas, methods, instructions or products referred to in the content.

