Article

Utilizing Polypropylene Fiber in Sustainable Structural Concrete Mixtures

Department of Civil Engineering and Construction, Georgia Southern University, Statesboro, GA 30460, USA
*
Author to whom correspondence should be addressed.
CivilEng 2022, 3(3), 562-572; https://doi.org/10.3390/civileng3030033
Submission received: 11 May 2022 / Revised: 21 June 2022 / Accepted: 22 June 2022 / Published: 25 June 2022
(This article belongs to the Special Issue Connections in Concrete Volume 2)

Abstract

:
Polypropylene fiber reinforced concrete (PFRC) is becoming more popular for structural purposes due to its durability, electrical resistivity, and mechanical properties. In this study, the influence of polypropylene fiber on the mechanical properties and ultrasonic pulse velocity (UPV) of fiber reinforced concrete (FRC) were determined. Six different fiber volume fractions of polypropylene were considered in the experimental investigation with varying water–cement ratios and curing conditions. Non-destructive testing methods were utilized to determine the UPV of the PFRC. Available equations in literature for predicting the RFC’s compressive strength based on UPV values were selected. However, the computed values did not show good agreement with the compressive strengths obtained from the compression testing machine. It was confirmed that polypropylene fibers alter the propagation of UPV, and as a result, the existing equations do not accurately predict the compressive strength for PFRC. Therefore, a practical equation is proposed to accurately evaluate the compressive strength of PFRC with regard to UPV.

1. Introduction

Concrete’s compressive strength is the main criterion that is used to determine whether a given concrete mixture will meet the structural requirements. Microcracks are a common defect of concrete that can directly affect the compressive strength. They start immediately after the pouring of concrete due to the loss of water for both hydration and evaporation, together with entrained and entrapped air voids [1]. Adding fibrous material to the concrete mix can control microcracking. Detailed studies on this topic can be found elsewhere [2,3,4,5,6,7].
To withstand stress redistribution in concrete structures, the fiber volume fraction is kept at a minimum. This allows a large number of fibers to cover substantial areas of fracture, and thus the structural behavior is governed by the fibrous material [8]. Fibers for concrete can be of different types, such as natural, synthetic, metallic, or organic. Synthetic fibers have gained popularity over other fibers due to their availability, reasonable price, easy processing, and better performance in adverse environments [5].
Test results from previous studies are illustrated in Table 1 [9,10,11]. It is evident that polypropylene fibers show versatile mechanical characteristics. These characteristics proved advantageous for fiber-reinforcing of concrete for improved ductility and tensile strength and reduced dead load and construction cost.
To study the structural behavior of PFRC, non-destructive test (NDT) methods were employed in this study. Currently, UPV is a popular dynamic NDT method that has potential for testing the mechanical properties of concrete for both new and existing structures. The correlation between compressive strength and UPV can be affected by several factors including the aggregate size, type, and proportion; the cement type; the w/c ratio; the concrete age and carbonated depth; and the fiber type and content [12]. The majority of the studies performed to determine the relationship between UPV and mechanical properties of concrete were based on various fiber types and not specifically on polypropylene fibers. According to the current study, while existing equations for predicting the compressive strength of FRC can be used for FRC with various fiber types, they better estimate the compressive strength for the type of fiber that they are proposed for. Equations proposed for some of the fibers types such as steel fibers show solid results as a result of several studies and the extension of available test results, but the accuracy of these equations when utilized for polypropylene fibers is not precise for structural purposes. PFRC is becoming more popular for structural purposes due to its durability, electrical resistivity, and mechanical properties, and therefore, a practical equation that can accurately predict its compressive strength based on UPV is needed.
The addition of polypropylene fibers exhibits a delay in cracking, a pseudo-ductile response, increased residual strength, and improved energy dissipation capacities in comparison to plain concrete mixtures because of the fibers’ significant shear resistance [13]. The flexural/shear response of concrete structural members is governed by the tensile response of the fibrous material, and the favorable characteristics of FRC play an important role in this. The addition of short polypropylene fibers in concrete as mass reinforcement primarily provides crack control by means of crack-bridging the tensile stress transfer capacity of the fibers across the crack surfaces [14]. Because of its beneficial cracking performance, PFRC has been shown to be a promising non-conventional reinforcement in concrete elements subjected to shear stresses and, under certain conditions, could convert brittle shear failures to ductile flexural failures [15].
This paper investigates the compressive strength of PFRC including various fiber volume fractions (Vf) and w/c ratios. Measurements were conducted at different ages of concrete. A slew of studies was conducted to narrow the research gap in determining the compressive strength of PFRC using UPV equations (experimental and analytical). To further examine the effect of fibers (polypropylene fiber specifically) on the compressive strength of concrete, the accuracy of selected empirical equations from literature for compressive strength and pulse velocity was evaluated and compared with the test results. A coefficient of variation (COV) was used to depict the accuracy of the calculated values versus the experimental values. Finally, a new practical equation is introduced for PFRC to predict the compressive strength of PFRC with regard to UPV test results. It is possible to use this equation to design PFRC mix structural members in accordance with the standard specifications of fiber-reinforced concrete.

2. Methodology and Experimental Set-Up

In the present study, 6 different fiber volume fractions and 4 water-to-cement ratios were considered for the 30 mix designs. Cylindrical specimens with the dimensions of 100 mm × 200 mm (4″ × 8″) were cast and cured according to ASTM C192 [14]. A total number of 100 specimens including control samples were finally cast. Three samples were considered from each mix proportion for the UPV test and compression test at the age of 44 days. On each specimen, UPV and compression tests were performed, and each data point was calculated from the average of 3 individual readings. While more data points are always better, the number of specimens and mix proportions were limited to the above-mentioned numbers to be able to manage the time, space, and student work hours for the duration of the research.

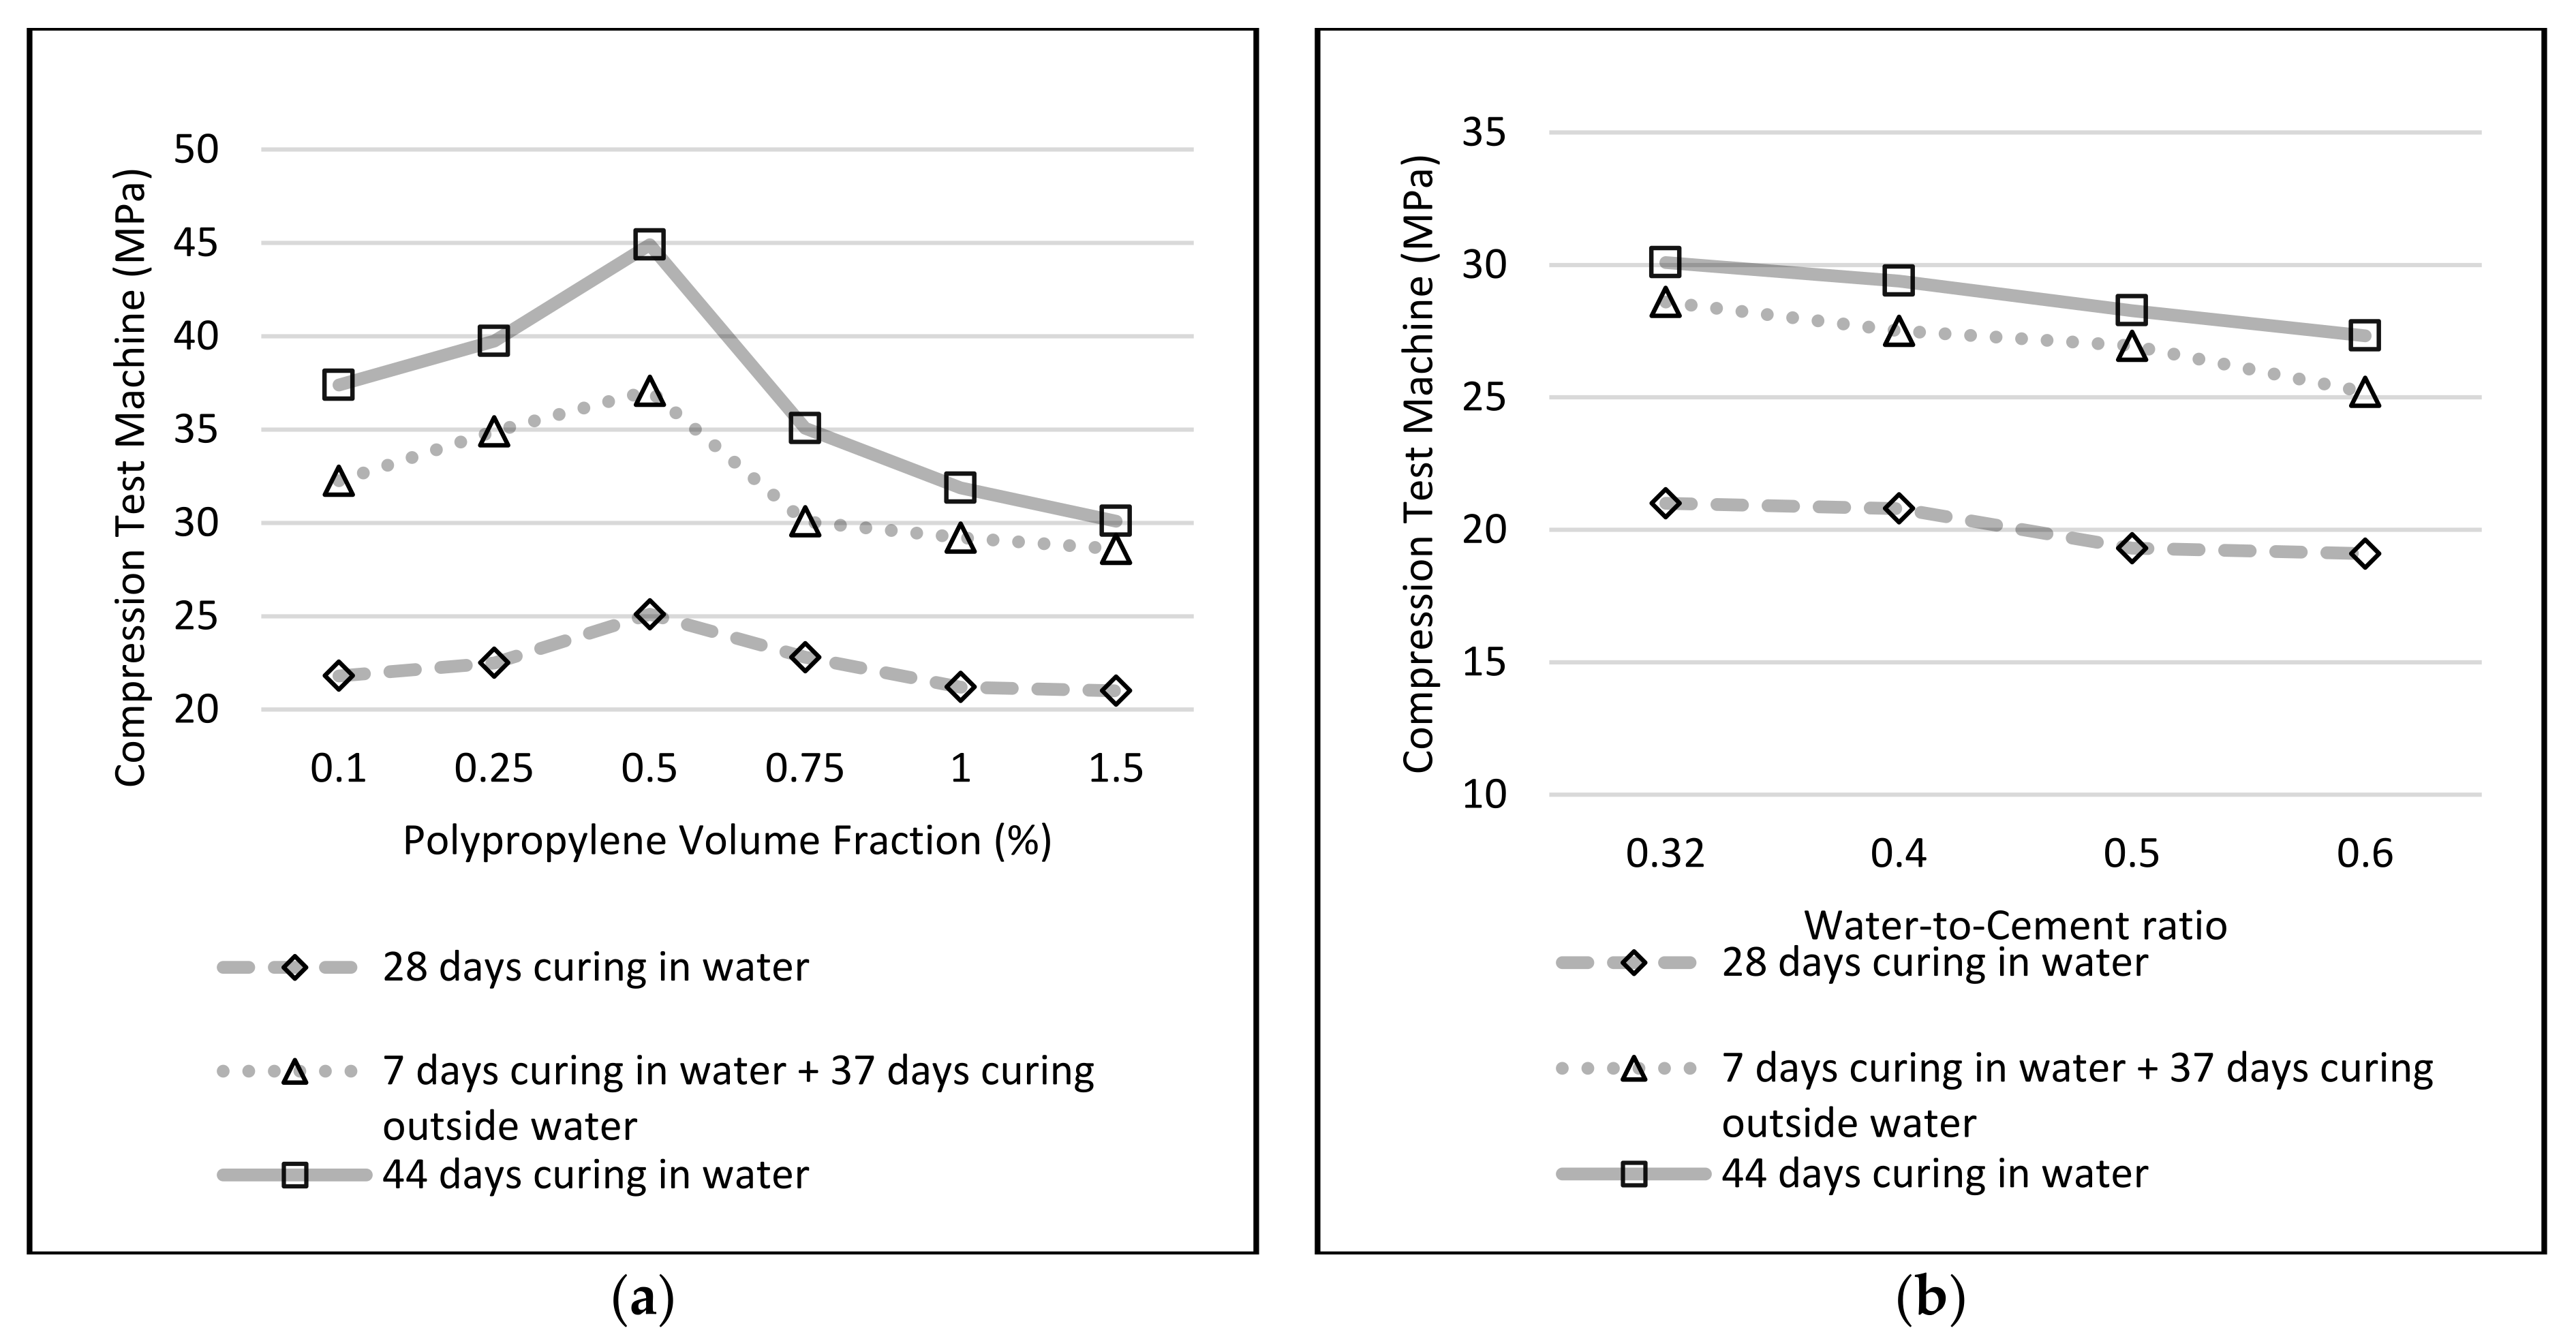
2.1. Compressive Strength Test

The macro-fibrillated polypropylene fiber named “ProCon F” was selected for the experimental study. Table 2 illustrates the main properties of the polypropylene fiber used in this study. The proportion of concrete mix was taken as 1:1.96:1.41 (C:FA:CA). Type I/II cement (C) and coarse aggregate (CA) with a maximum size of 4.7625 mm (0.1875″) were used in this study. The overall experimental set-up was divided into three sets (namely A, B, and C) of nine cylinders with six different fiber volume fractions and four varying water–cement ratios as shown in Table 3.

2.2. Direct Compressive Strength Test

To determine compressive strength values, all PFRC specimens with different fiber volume fractions were tested in a compression testing machine (CTM). Table 4 illustrates the concrete mix proportions of PFRC in accordance with ASTM C192 [16]. First, all raw materials except for the polypropylene fibers were added into a laboratory mixer and mixed thoroughly for three minutes. Second, after one minute of waiting time, two to three minutes of final mixing was performed by adding polypropylene fiber. Third, the compaction was performed using a vibrating table for the 100 × 200 (mm) cylinders. The length of the fiber was selected so that was is 2 or more times greater than the largest aggregate size in the mix [17].

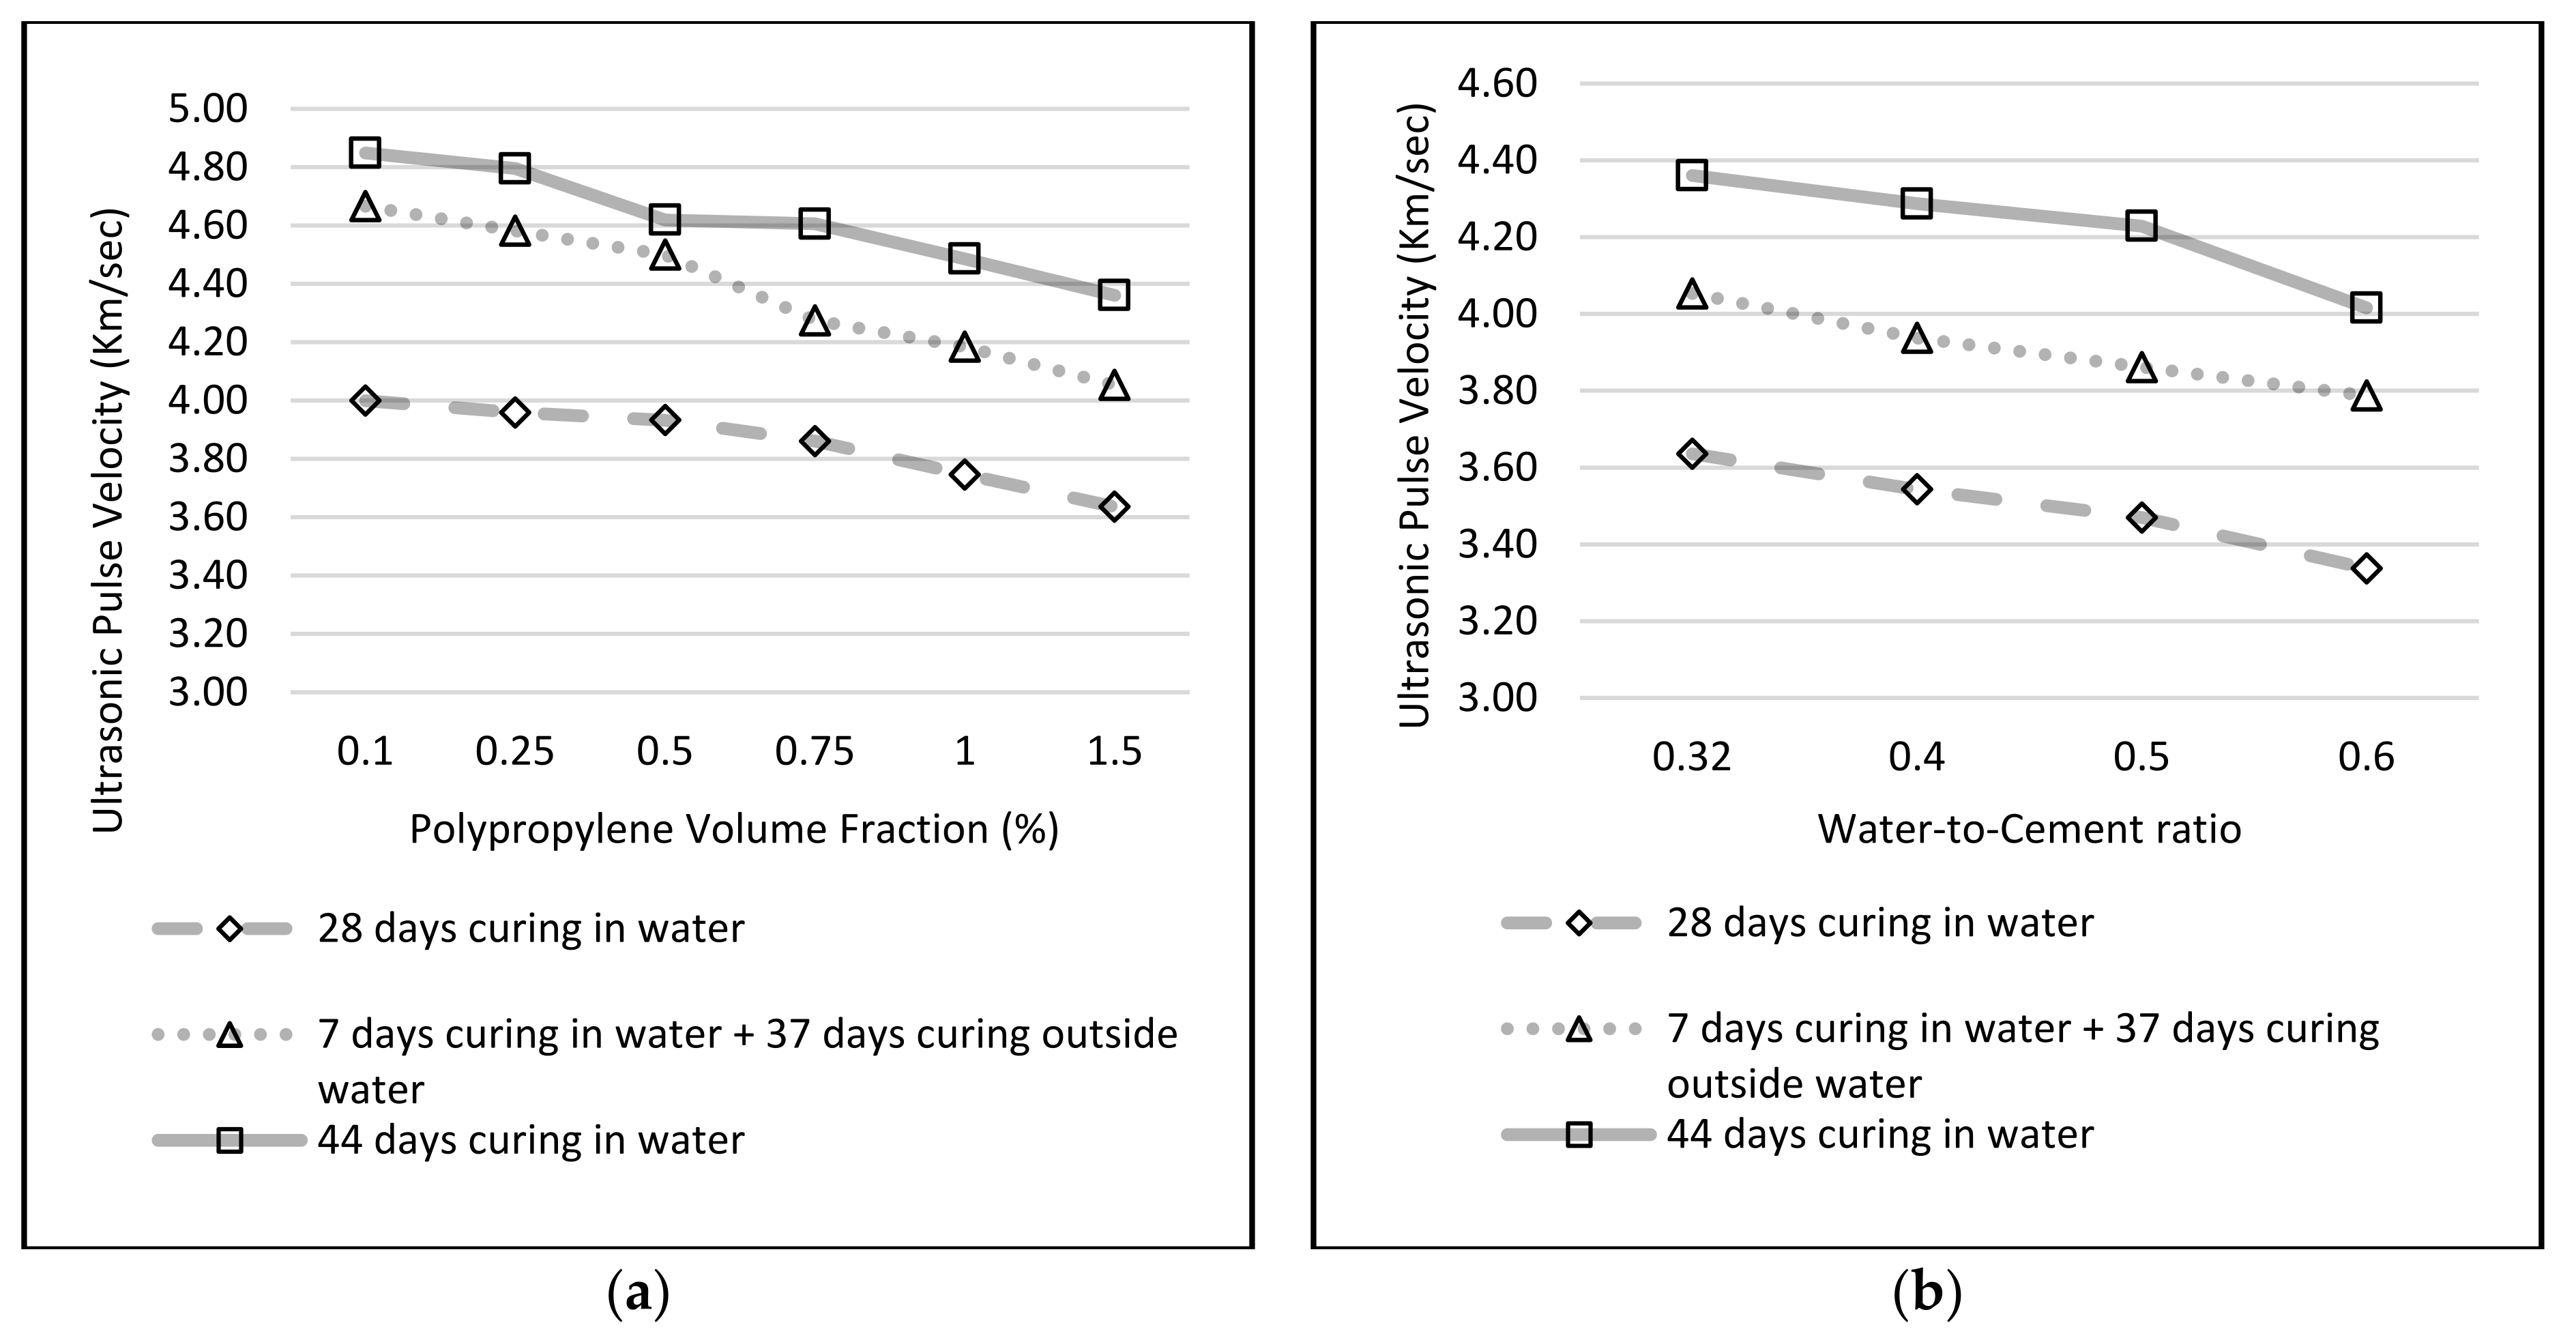
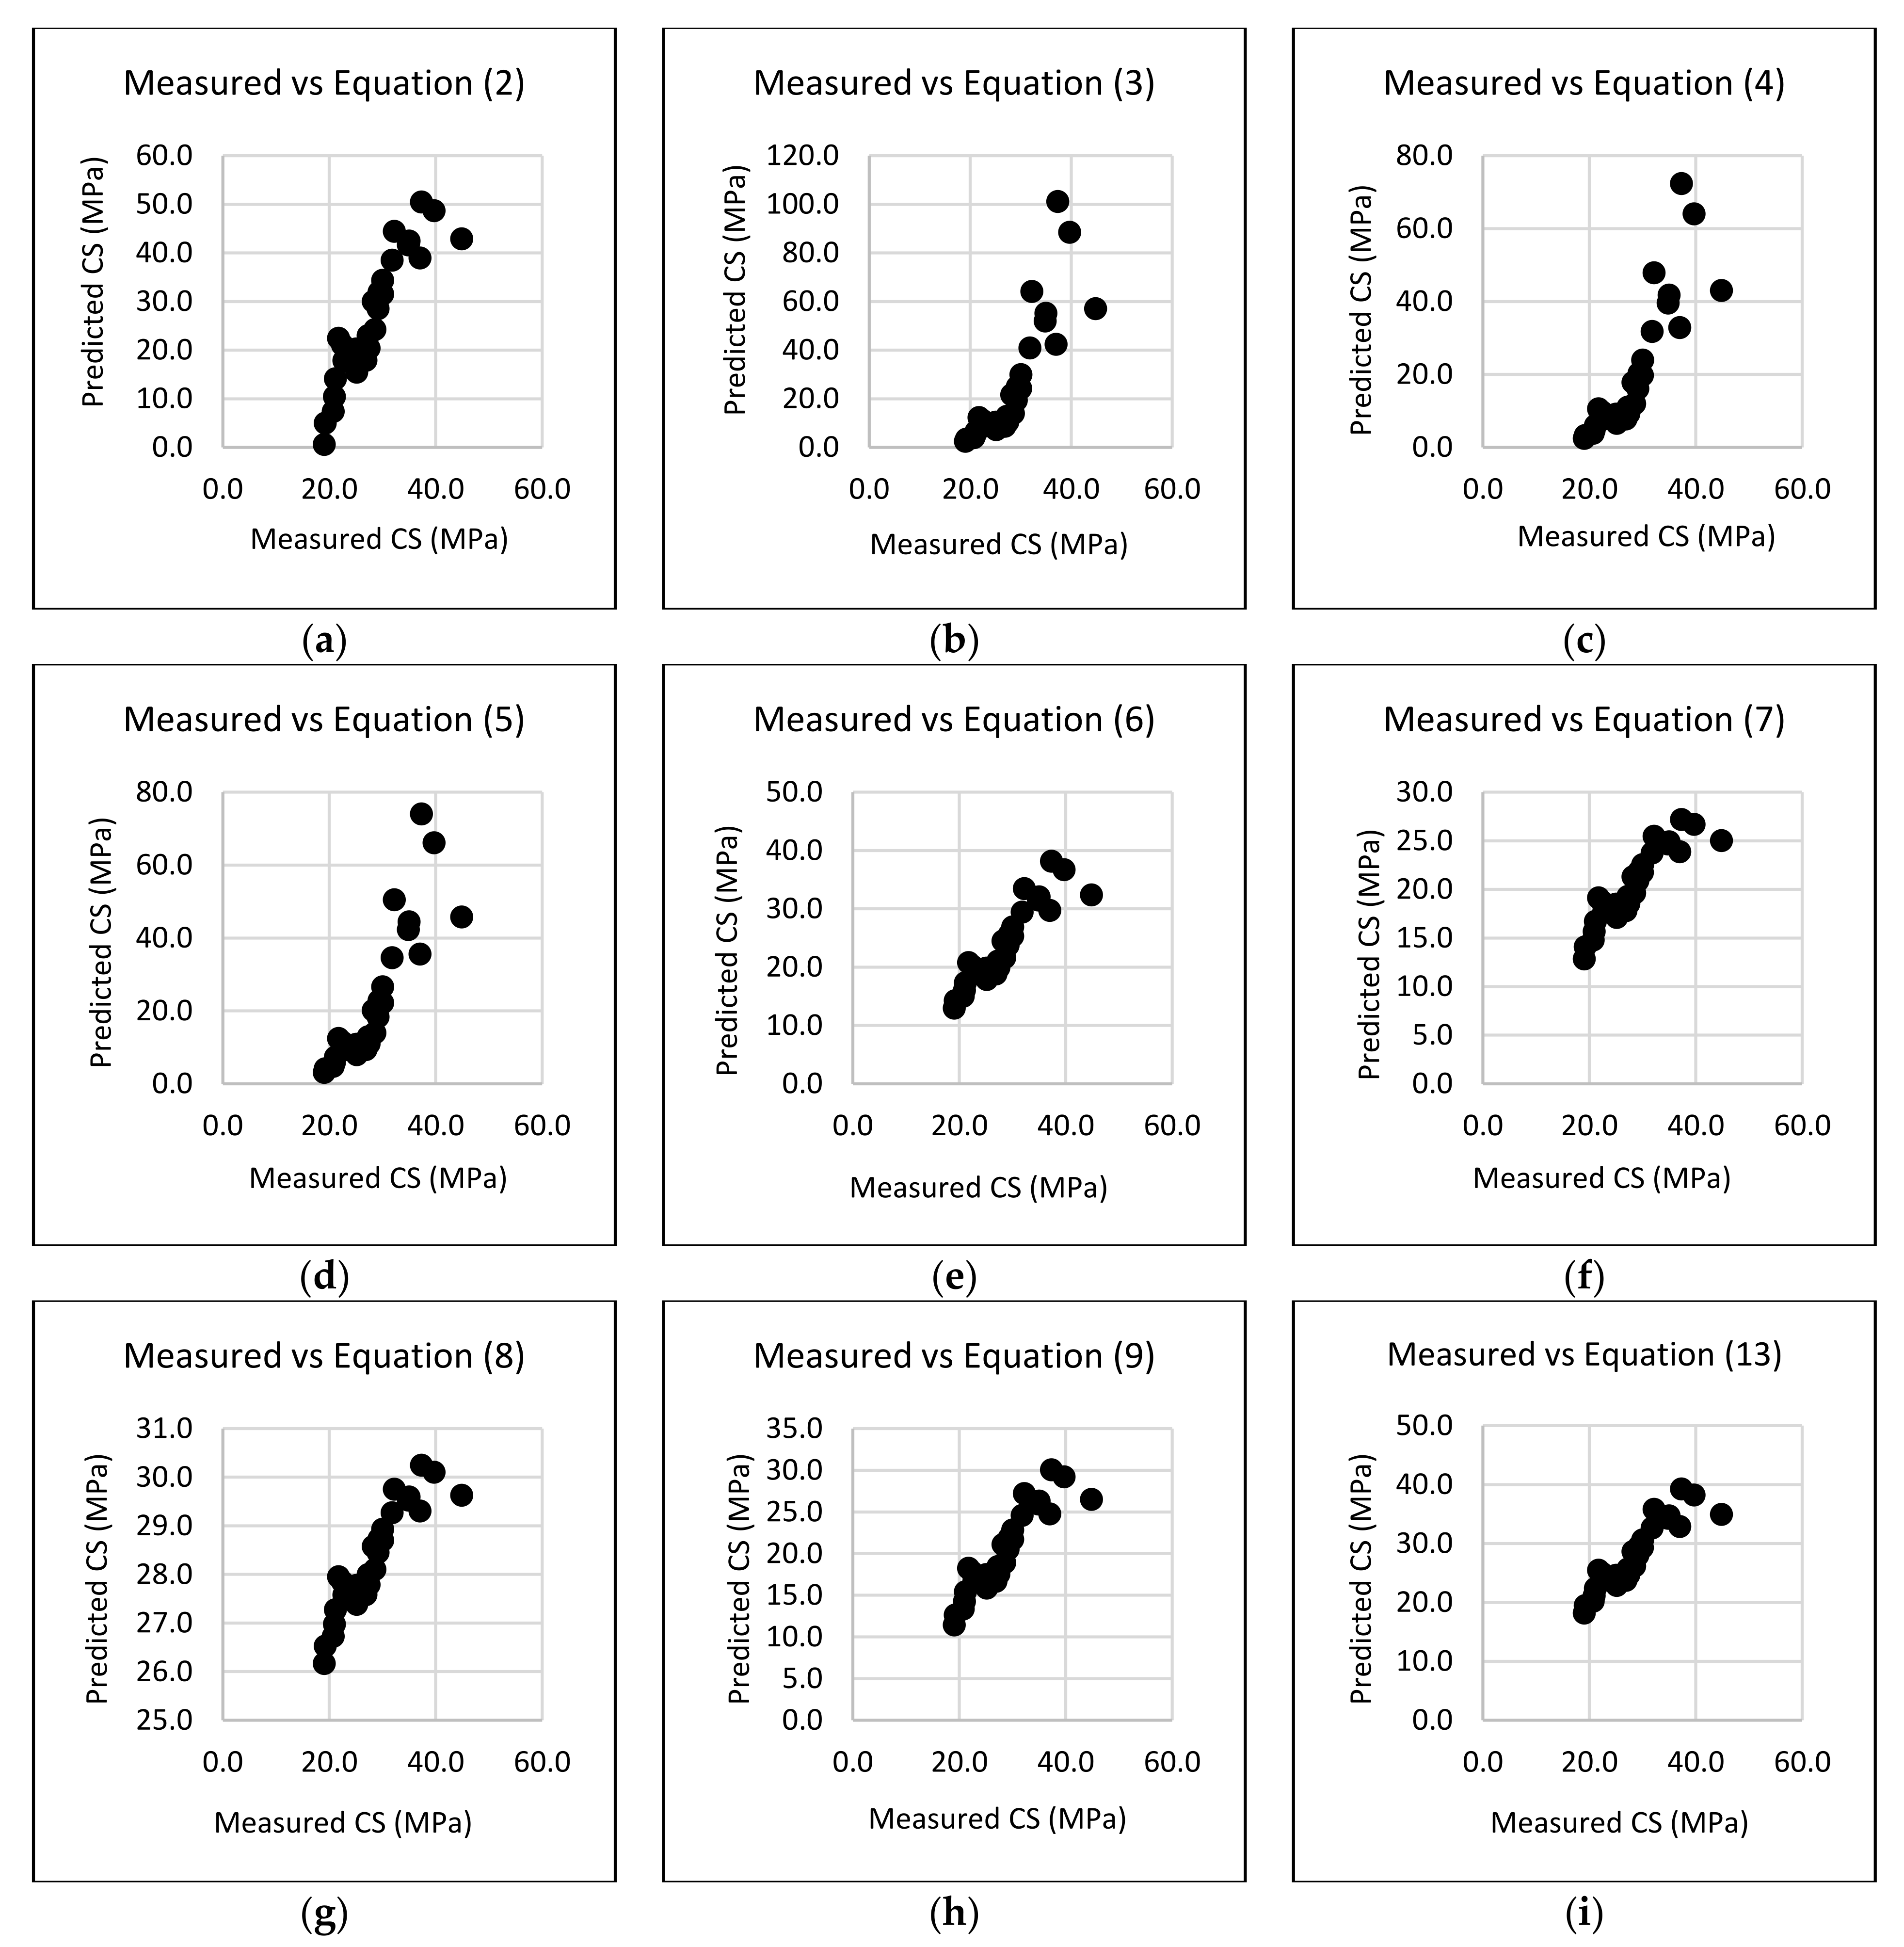
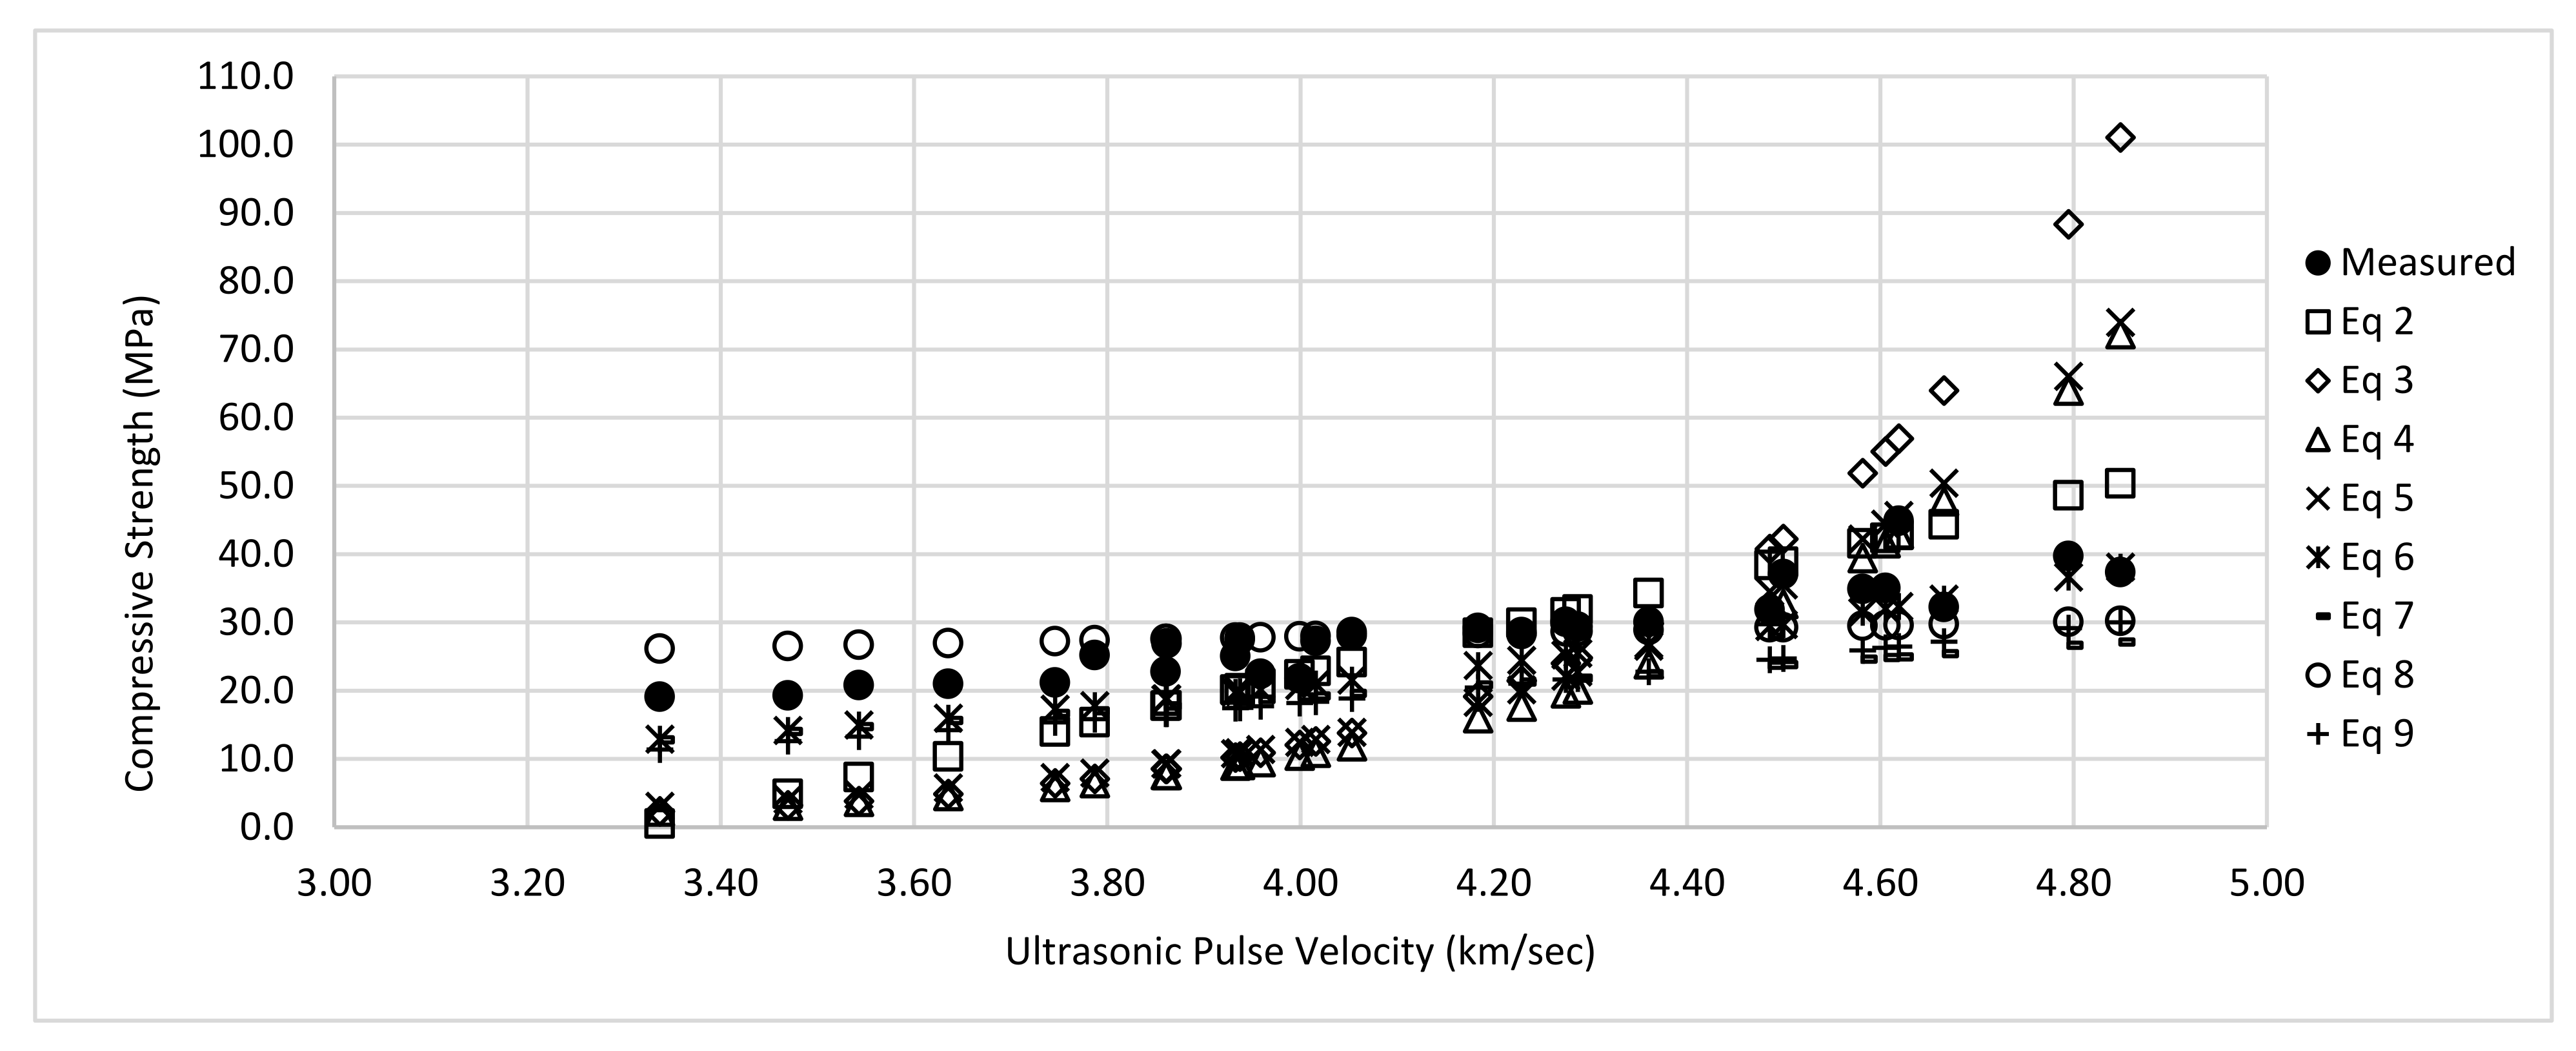
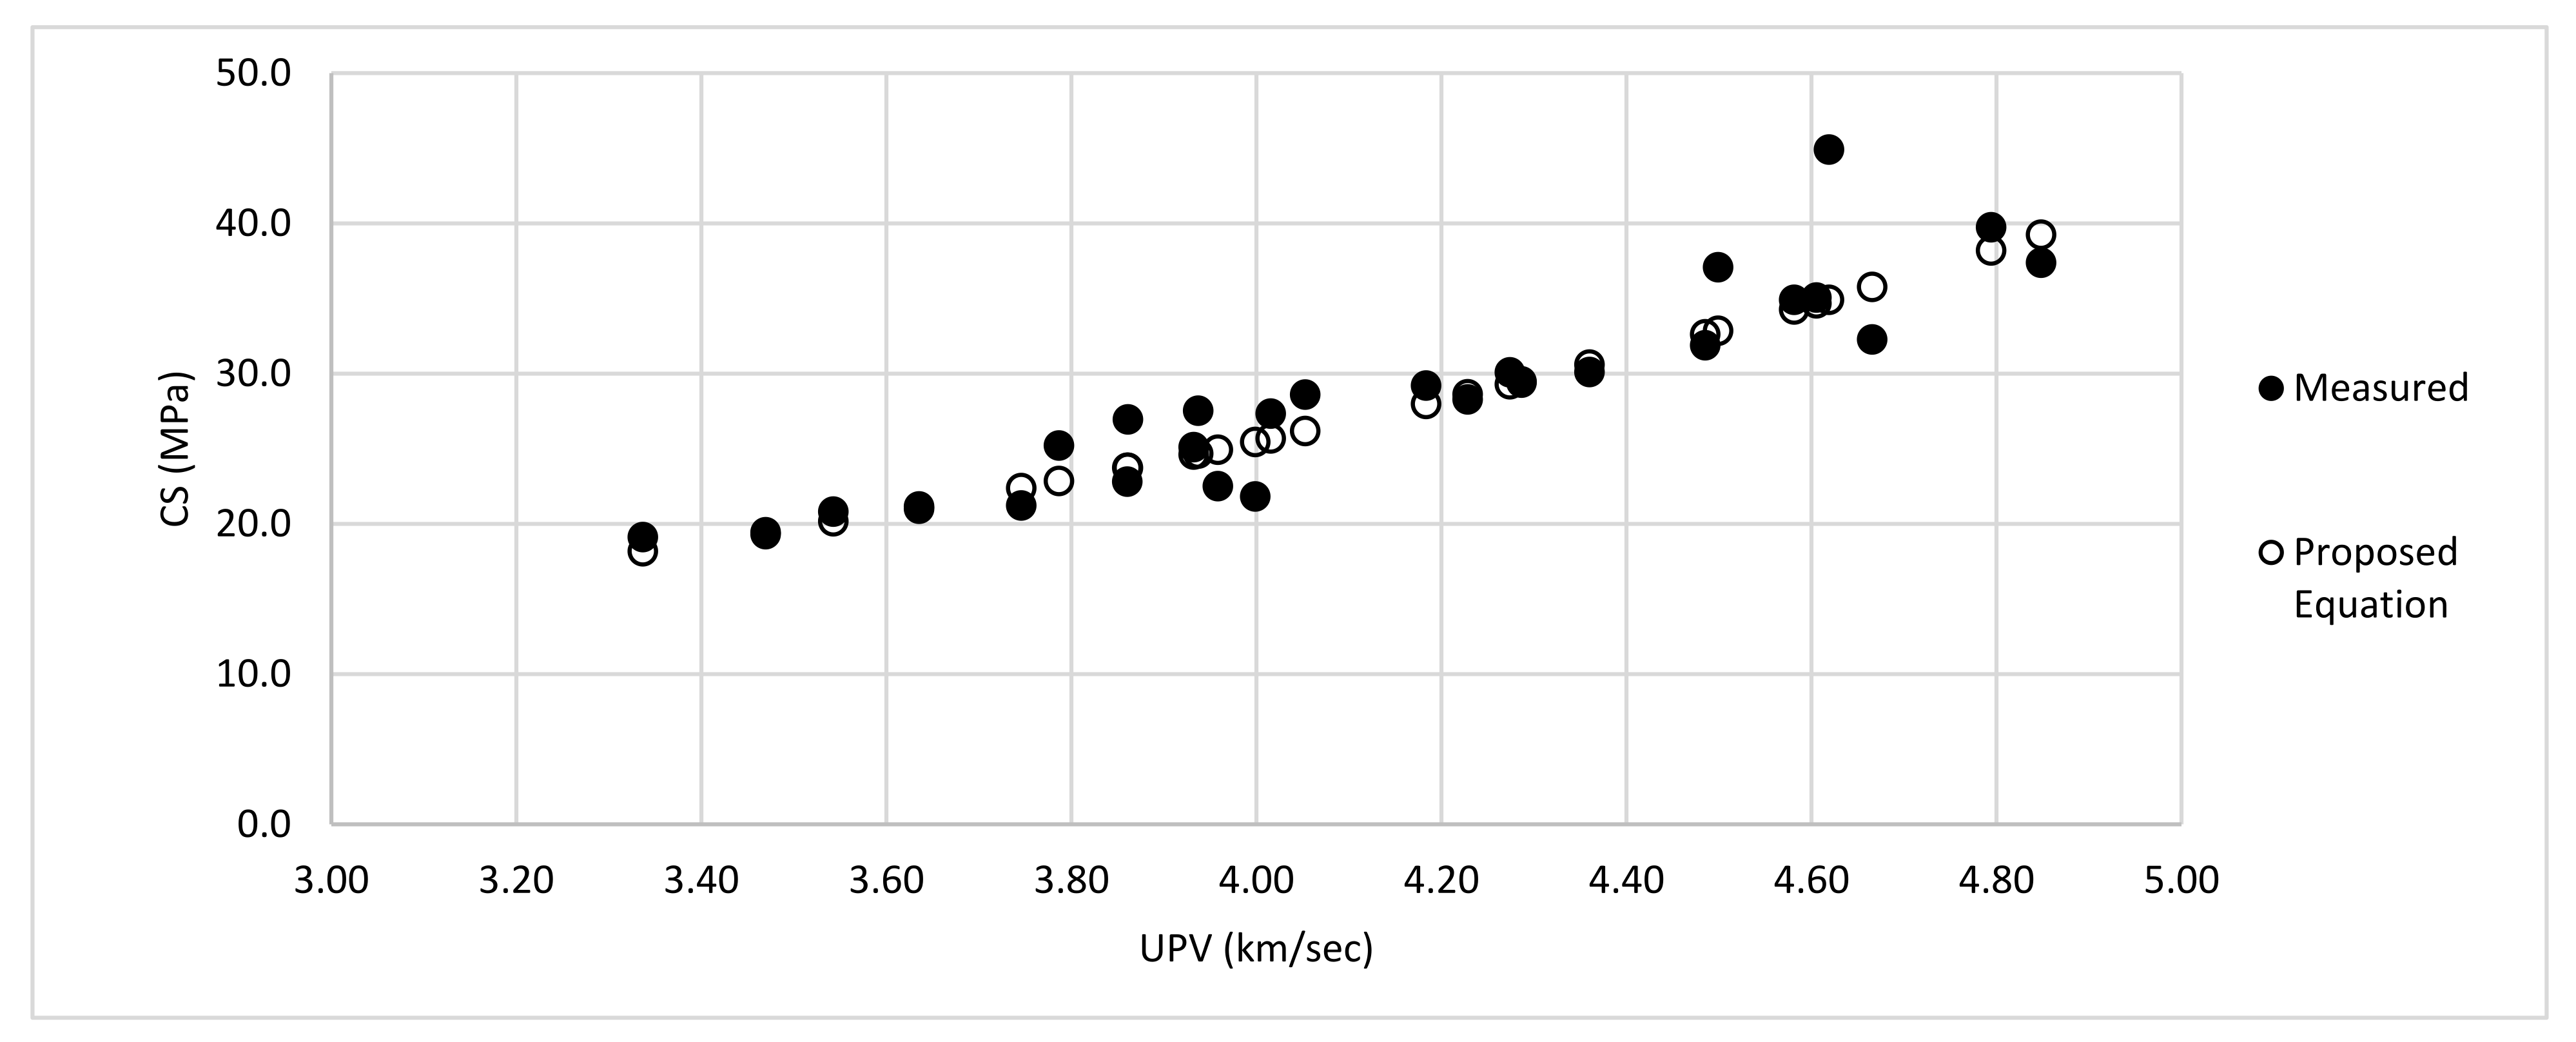
2.3. Calculated Compressive Strength Test Using the UPV Values

The Ultrasonic Thickness Gauge made by REED Instruments was used to check the quality of the PFRC elements by identifying voids, cracks, honeycombs, and compressive strength in accordance with ASTM C597 [16].
V = L / T
In this equation, the wave transit time, T, is in seconds and is measured electronically; L is the length of the specimen (in kilometers); and the pulse velocity, V, is in km/s. This test method is also applicable when determining the longitudinal stress wave pulses’ propagation velocity through the cementitious materials and for evaluating the mechanical properties.
Polypropylene fibers’ effects on the mechanical properties and specifically on the compressive strength of PFRC specimens are determined by using empirical equations based on UPV from previous studies relating compressive strength and UPV, as shown in Table 5. Here, fc is the compressive strength (in MPa), V is the pulse velocity (in km/s), CA is an acronym for coarse aggregate, and Grade M15 and Grade M20 are regular grades of reinforced concrete construction according to ASTM C597 [18]. The chosen Equations (1)–(9) are for regular grades of plain or fiber reinforced concrete with a standard curing time of 28 days. The limitation column in Table 5 contains a list of any exceptions.

2.4. The Coefficient of Variation (COV) for PFRC Specimens

The values of compressive strength obtained from the empirical equations shown in Table 5 were compared with the corresponding experimental test results from the CTM. To better evaluate the accuracy of calculated values versus the measured values, COV was used [26].
µ = i = 1 n f c i n
C O V = 1 n 1 i = 1 n f c p i f c i 2 µ
where the mean of the measured value is µ, the number of data is shown with n, compressive strength fci is measured at the i-th data point, and the predicted compressive strength fcpi is the calculated value at each i-th point.

3. Discussion of the Results

The results obtained experimentally from the UPV and the CTM tests for PFRC specimens are listed below. Table 6 provides ultrasonic and compressive strength values in terms of variable curing conditions, fiber volume fractions, Vf, and w/c ratio. According to ASTM C39, the rate of increase in concrete compressive strength is highest during the first 28 days after casting and thereafter gradually decreases. Furthermore, most concrete strength criteria are met around the age of 28 days. Because the growth in strength after 44 days was determined to be minimal, measurements were taken at 7 days, 28 days, and 44 days.
Variation in ultrasonic pulse velocity (UPV) with respect to Vf and w/c is presented in Figure 1. A decrease in UPV was observed with the increase in Vf under all curing conditions with w/c = 0.32. The value of UPV is maximum after 44 days of curing in water and when the specimen contains 0.10% polypropylene fiber, and it is minimum when the specimen contains 1.50% polypropylene fiber after 28 days of curing in water.
It can also be observed that the UPV value increases when the age increases. Moreover, UPV decreases when the w/c ratio increases under all curing conditions where the Vf = 1.50%. The highest UPV was obtained from the specimen with the w/c = 0.32 after curing for 44 days in water, and the lowest UPV was obtained from the specimen containing a 0.6 w/c ratio after 28 days of curing in water. A comparison between PFRC specimens with different curing times shows that 44 days of curing results in considerable changes in UPV.
It can be observed in Figure 2 that the compressive strength starts to decrease after a gradual increase up to 0.5% fiber volume fraction. This trend can be seen under all curing conditions while w/c is 0.32. When subjected to compression loading, fibers cross crack and transfer stress to the upper and lower surfaces of the cylinder, reducing stress concentration at the cracks and allowing the sample to continue bearing loads. Moreover, the distributions and orientations of fibers are decisive. When the sample reached ultimate load, a vertical crack in the middle space grew quickly and crossed the section, resulting in sample failure. Therefore, PFRC addition not only improved peak flexural loading but also delayed crack growth and effectively improved toughness due to the fiber preventing the crevice effect. The highest compressive strength was obtained from the specimen containing 0.50% polypropylene fiber after curing in water for 44 days. The lowest compressive strength was obtained from the specimen containing 1.50% polypropylene fiber for all curing conditions. It can also be observed that with the increase in the age of the specimen, the compressive strength increases. Moreover, while the Vf is constant, in all curing conditions, the compressive strength decreases with the increase in w/c. The largest value for the compressive strength was gained from the specimen with a w/c ratio of 0.32 after curing for 44 days, and the lowest value for compressive strength was obtained from the specimen containing a 0.6 water-to-cement ratio after curing for 28 days. At the age of 44 days, it was observed that the specimens cured all the time showed an average of 15% more compressive strength compared to specimens that were cured in water for only 7 days.
In the calculation, to take into account the size effect of PFRC specimens on compressive strength, the following equation was used:
f c y d = 0.81 f c + 0.49 f c 1 + d / 2.6
where fc represents the standard cylinder’s (150 × 300 mm) compressive strength in MPa, fcy (d) is the compressive strength of cylinders with any arbitrary dimension, and d in cm represents the arbitrary specimen’s diameter [27].
Figure 3a–h illustrate the comparison between the CTM measured values for the compressive strength and the predicted values for compressive strength of PFRC specimens implementing the existing equations in Table 5. It was observed that the equations in Table 5 were incapable of accurately estimating the compressive strength of PFRC versus UPV at the time of this analysis. This is because the polypropylene fibers in the mixture alter the propagation of pulse velocity. A new equation was developed to account for the effects of polypropylene fibers and to address the errors in the previous equations. The proposed equation for PFRC (max Vf = 1.5%) is as follows:
f c = 3.31 e 0.51 V
where f c is the CS in MPa and V is the UPV in km/s.
To better show the variability between the measured and calculated results, the COV was computed using Equation (12), and the COVs range from 9.6% to 75% as shown in Table 7. Equation (6) given by Nash’t et al. [25] for cubes showed less deviation, whereas Equation (3) exhibited more than 75% deviation.
In Figure 3, the calculated and measured values of the compressive strength show perfect correlation when the data points form a 45-degree line. Non-conservative deviations will be located above the 45-degree line, and conservative deviation data points will appear below the line. All equations depend on ultrasonic pulse velocity. Therefore, the reason for the lower accuracy of the results derived from equations found in the literature is attributed to the presence of polypropylene fibers which affect the propagation of UPV in the material. Therefore the new equation to better predict the compressive strength based on UPV was developed to account for the polypropylene fibers’ influence in concrete (Equation (13)). The comparison between compressive strengths from CTM (measured) vs. the proposed equation is also shown in Figure 3i.
Figure 4 shows that the available equations do not provide a good prediction of compressive strength for PFRC for different volume fractions and ages. This is because polypropylene fibers, curing time, and w/c ratio alter the propagation of pulse velocity, thus altering the results from the equations found in the literature. Consequently, the proposed equation was introduced to correct the errors of available equations.
Figure 5 illustrates the calculated values versus measured values for compressive strength when utilizing Equation (13) (the proposed equation), and it is proven that the COV calculated for the Equation (13) is 9.59%, which is considerably lower than those calculated from Equations (2)–(9).

4. Conclusions

An experimental program was designed and conducted to examine the compressive strength of concrete including polypropylene fiber by considering six different percentages of fiber volume fractions, four different ratios for w/c, and three curing conditions. It was observed that the PFRC compressive strength increases with the increase in the polypropylene fiber volume fraction up to 0.5% at all ages, then it decreases at higher volume fractions. Thus, the observed optimum dosage for polypropylene fiber in the current research is 0.5% volume fraction in the mixture. It was also depicted that at all ages the UPV of PFRC decreases when the fiber volume increases. The existing equations in the literature did not present an accurate prediction of compressive strength for PFRC versus UPV. This is due to polypropylene fibers’ effects in the mixture that alter the propagation of pulse velocity. Therefore, a new equation was introduced to include the effects of the presence of polypropylene fibers and therefore compensate for the deviations of existing equations. The COV of the proposed equation was proven to be less than those other investigated available equations, thus better estimating the compressive strength of PFRC when utilizing the UPV test results.

Author Contributions

Validation, S.H., D.C.; data curation, S.H., D.C.; writing—original draft preparation, S.H., D.C.; writing—review and editing, S.H., D.C. Both authors contributed to the paper, writing, data analysis and experimental works. All authors have read and agreed to the published version of the manuscript.

Funding

This research received no external funding.

Data Availability Statement

Not Applicable.

Acknowledgments

The contribution of Ehsanul Kabir for providing assistance in the preparation of the manuscript is acknowledged.

Conflicts of Interest

The authors declare no conflict of interest.

References

  1. Slate, F.O.; Hover, K.C. Microcracking in concrete. In Fracture Mechanics of Concrete: Material Characterization and Testing; Springer: Dordrecht, The Netherlands, 1984; pp. 137–159. [Google Scholar]
  2. Grzybowski, M.; Shah, S.P. Shrinkage cracking of fiber reinforced concrete. Mater. J. 1990, 87, 138–148. [Google Scholar]
  3. Ozyurt, N.; Mason, T.O.; Shah, S.P. Non-destructive monitoring of fiber orientation using AC-IS: An industrial-scale application. Cem. Concr. Res. 2006, 36, 1653–1660. [Google Scholar] [CrossRef]
  4. Raoufi, K.; Weiss, J. The role of fiber reinforcement in mitigating shrinkage cracks in concrete. In Fibrous and Composite Materials for Civil Engineering Applications; Woodhead Publishing: Sawston, UK, 2011; pp. 168–188. [Google Scholar] [CrossRef]
  5. Pakravan, H.R.; Ozbakkaloglu, T. Synthetic fibers for cementitious composites: A critical and in-depth review of recent advances. Constr. Build. Mater. 2019, 207, 491–518. [Google Scholar] [CrossRef]
  6. Archana, P.; Nayak, A.; Nayak, S.; Vaddar, H.; Magnur, D. Study of strength of polypropylene fiber reinforced concrete. Int. J. Eng. Res. Technol. (IJERT) 2017, 6, 8–11. [Google Scholar] [CrossRef]
  7. Dharan, D.; Lal, A. Study the effect of polypropylene fiber in concrete. Int. Res. J. Eng. Technol. (IRJET) 2016, 3, 616–619. Available online: https://www.irjet.net/archives/V3/i6/IRJET-V3I6115.pdf (accessed on 15 January 2019).
  8. Tiberti, G.; Minelli, F.; Plizzari, G.A.; Vecchio, F.J. Influence of concrete strength on crack development in SFRC members. Cem. Concr. Compos. 2014, 45, 176–185. [Google Scholar] [CrossRef]
  9. Kayali, O.; Haque, M.N.; Zhu, B. Some characteristics of high strength fiber reinforced lightweight aggregate concrete. Cem. Concr. Compos. 2003, 25, 207–213. [Google Scholar] [CrossRef]
  10. Pontes, M.F.; Pereira, W.M.; Pituba, J.J.D.C. Numerical analysis on displacements of steel-fiber-reinforced concrete beams. Rev. IBRACON Estrut. Mater. 2020, 13. [Google Scholar] [CrossRef]
  11. Hsie, M.; Chen, G.; Song, P. Investigating abrasion resistance of steel-polypropylene hybrid fiber-reinforced concrete using statistical experimental design. Int. J. Pavement Res. Technol. 2011, 4, 274. [Google Scholar]
  12. Lorenzi, A.; Tisbierek, F.T.; Silva, L.C.P. Ultrasonic pulse velocity análysis in concrete specimens. In Proceedings of the IV Conferencia Panamericana de END, Buenos Aires, Argentina, 22–26 October 2007. [Google Scholar]
  13. Chalioris, C.E.; Panagiotopoulos, T.A. Flexural analysis of steel fibre-reinforced concrete members. Comput. Concr. Int. J. 2018, 22, 11–25. [Google Scholar]
  14. Zeng, Y.; Zhou, X.; Tang, A.; Sun, P. Mechanical properties of chopped basalt fiber-reinforced lightweight aggregate concrete and chopped polyacrylonitrile fiber reinforced lightweight aggregate concrete. Materials 2020, 13, 1715. [Google Scholar] [CrossRef] [PubMed] [Green Version]
  15. Asteris, P.G.; Naseri, H.; Hajihassani, M.; Kharghani, M.; Chalioris, C.E. On the mechanical characteristics of fiber reinforced polymer concrete. Adv. Concr. Constr. 2021, 12, 271–282. [Google Scholar]
  16. Designation C192; Standard Practice for Making and Curing Concrete Test Specimens in the Laboratory. American Society for Testing Materials: West Conshohocken, PA, USA, 2016.
  17. Mohod, M. Performance of Polypropylene Fiber Reinforced Concrete. IOSR J. Mech. Civ. Eng. 2015, 12, 28–36. [Google Scholar] [CrossRef]
  18. Designation: C597-16; Standard Test Method for Pulse Velocity through Concrete. American Society for Testing Materials: West Conshohocken, PA, USA, 2016.
  19. Naik, T.; Malhotra, V.; Popovics, J. The Ultrasonic Pulse Velocity Method. In Handbook of Nondestructive Testing of Concrete; CRC Press: Boca Raton, FL, USA, 2004; Chapter 8. [Google Scholar]
  20. Lin, Y.; Kuo, S.-F.; Hsiao, C.; Lai, C.-P. Investigation of Pulse Velocity- Strength Relationship of hardened Concrete. ACI Mater. J. 2007, 104, 344–350. [Google Scholar] [CrossRef]
  21. Elvery, R.; Ibrahim, L. Ultrasonic assessment of concrete strength at early ages. Mag. Concr. Res. 1976, 28, 181–190. [Google Scholar] [CrossRef]
  22. Sandor, P.; Rose, J.; Popovics, J. The behavior of ultrasonic pulse in concrete. Cem. Concr. Res. 1990, 20, 259–270. [Google Scholar] [CrossRef]
  23. Nash’t, I.; A’bour, S.; Sadoon, A. Finding an unified relationship between crushing strength of concrete and non-destructive tests. In Middle East Nondestructive Testing Conference & Exhibition; Citeseer: Manama, Bahrain, 2005. [Google Scholar]
  24. Mahure, N.; Vijh, G.; Sharma, P.; Sivakumar, N.; Ratnam, M. Correlation between pulse velocity and compressive strength of concrete. Int. J. Earth Sci. Eng. 2011, 4, 6. Available online: http://ijee.in/publication/ (accessed on 10 May 2022).
  25. Kheder, G. A two-stage procedure for assessment of in situ concrete strength using combined non-destructive testing. Mater. Struct. 1999, 32, 410–417. [Google Scholar] [CrossRef]
  26. Suksawang, N.; Wtaife, S.; Alsabbagh, A. Evaluation of Elastic Modulus of Fiber Reinforced concrete. ACI Mater. J. 2018, 115, 239–249. [Google Scholar] [CrossRef] [Green Version]
  27. Benjamin, J.R.; Cornell, C.A. Probability, Statistics, and Decision for Civil Engineers; McGraw-Hill Publishing Company: New York, NY, USA, 1970. [Google Scholar]
Figure 1. UPV vs. Vf (a) and w/c (b).
Civileng 03 00033 g001
Figure 2. CTM values vs. polypropylene’s Vf (a) and w/c (b).
Civileng 03 00033 g002
Figure 3. Measured vs. predicted compressive strength (CS) of PFRC specimens. (ai): Measured vs. Equations (1)–(13).
Civileng 03 00033 g003
Figure 4. Measured compressive strength (CTM) vs. calculated compressive strength (all equations) for PFRC specimens.
Civileng 03 00033 g004
Figure 5. PFRC’s measured compressive strength (CS) vs. Equation (13) (the proposed equation).
Civileng 03 00033 g005
Table 1. Comparison between different types of synthetic fibers.
PropertiesPhysicalMechanicalApproximate Cost (USD/kg)Reference
TypesAcid/Alkali ResistanceSpecific Gravity (kg/m3)Elongation at Break (%)Modulus of Elasticity (GPa)Tensile Strength (MPa)
Polypropylene (PP)High91015–801.5–12240–9001–2.5[9]
Polyethylene (PE)High920–9604–1005–10080–6002–20[10]
Polyvinyl alcohol (PVA)High290–13006–720–42.81000–16001–15[11]
Table 2. Polypropylene fiber properties.
Specific Gravity (SG)Length (L)
(mm)
Filament Diameter (D) (mm)Tensile Strength (TS)
(MPa)
Flexural Strength (FS)
(GPa)
Corrosion ResistanceAcid/Alkali Resistance
0.9119 1.52 410 5.6 HighExcellent
Table 3. Outline of experimental set-up.
Vf
0.10%0.25%0.50%0.75%1.0%1.5%1.5%1.5%1.5%
Curing in WaterSet A
(28 days)
A-1A-2A-3A-4A-5A-6A-6A-6A-6
Set B
(7 days) *
B-1B-2B-3B-4B-VB-6B-6B-6B-6
Set C
(44 days)
C-1C-2C-3C-4C-5C-6C-6C-VIC-6
w/c ratio0.320.400.500.60
* The second set (B) of nine cylinders were cured in water for 7 days and then taken out and left dry curing for 37 more days, making a total of 44 days.
Table 4. Concrete mix of PFRC specimens.
PFRC Mix DesignationCement (C) (kg/m3)Fine Agg.
(FA)
(kg/m3)
Coarse Agg.
(CA)
(kg/m3)
Water (kg/m3)ProCon F (kg/m3)
A/B/C-I.32464.0840.5582.7148.20.96
A/B/C-II.0.32464.0840.5582.7148.22.24
A/B/C-III.32464.0840.5582.7148.24.49
A/B/C-IV.32464.0840.5582.7148.26.73
A/B/C-V.32464.0840.5582.7148.28.97
A/B/C-VI.32464.0840.5582.7148.213.46
A/B/C-VI.40464.0840.5582.7185.213.46
A/B/C-VI.50464.0840.5582.7231.513.46
A/B/C-VI.60464.0840.5582.7277.813.46
Table 5. Empirical equations for PFRC specimens.
Eq#ReferenceEquationLimitation
(2)Naik, 2004 [19] f c = 33 V 109.6 Cylindrical Specimens
(3)Lin, 2007 [20] f c = 0.00055 e 2.50 V CA = 1100 kg/m3
(4)Elvery and Ibrahim, 1976 [21] f c = 0.0012 e 2.27 V Temperature (0 °C to 60 °C)
(5)Sandor et al., 1990 [22] f c = 0.0028 e 2.1 V Age 7
(6)Nash’t et al., 2005 [23] f c = 1.19 e 0.715 V Cubes
(7)Mahure, 2011 [24] f c = 18.89 + 9.502 V Grade M15
(8)Mahure, 2011 [24] f c = 17.15 + 2.701 V Grade M20
(9)Kheder, 1999 [25] f c = 8.4 × 10 9 V × 10 3 2.5921 N/A
Table 6. Test Results; Ultrasonic pulse velocity (km/s), Compressive strength (MPa), and Compressive strength considering size effect (MPa).
Ultrasonic Pulse Velocity (km/s)
Vf
0.10%0.25%0.50%0.75%1.00%1.50%1.50%1.50%1.50%
Cu ring in WaterSet A43.963.763.062.812.712.732.692.58
(28 days)
Set B5.274.693.943.783.583.313.343.273.1
(7 days) *
Set C5.795.225.094.934.694.364.24.023.41
(44 days)
w/c 0.320.40.50.6
Compressive Strength (MPa)
Vf
0.10%0.25%0.50%0.75%1.00%1.50%1.50%1.50%1.50%
Curing in WaterSet A21.822.525.122.821.22120.819.319.1
(28 days)
Set B32.334.937.130.129.228.627.526.925.2
(7 days) *
Set C37.439.744.935.131.930.129.428.327.3
(44 days)
w/c 0.320.40.50.6
Compressive Strength Considering Size Effect (MPa)
Vf
0.10%0.25%0.50%0.75%1.00%1.50%1.50%1.50%1.50%
Curing in WaterSet A22.523.225.923.521.921.721.519.919.7
(28 days)
Set B33.33638.23130.129.528.427.826
(7 days) *
Set C38.54146.336.232.93130.329.228.2
(44 days)
w/c 0.320.40.50.6
* The second set (B) of nine cylinders were cured in water for 7 days and then taken out and left dry curing for 37 more days, making a total of 44 days.
Table 7. The coefficient of variation (COV) for PFRC specimens.
Equation (2)(3)(4)(5)(6)(7)(8)(9)Proposed Equation (13)
COV29.1%75.1%55.0%52.8%19.4%31.4%19.8%31.1%9.6%
Publisher’s Note: MDPI stays neutral with regard to jurisdictional claims in published maps and institutional affiliations.

