
Effect of Internal Moisture and Outer Relative Humidity on Concrete Carbonation
 , , and
Abstract
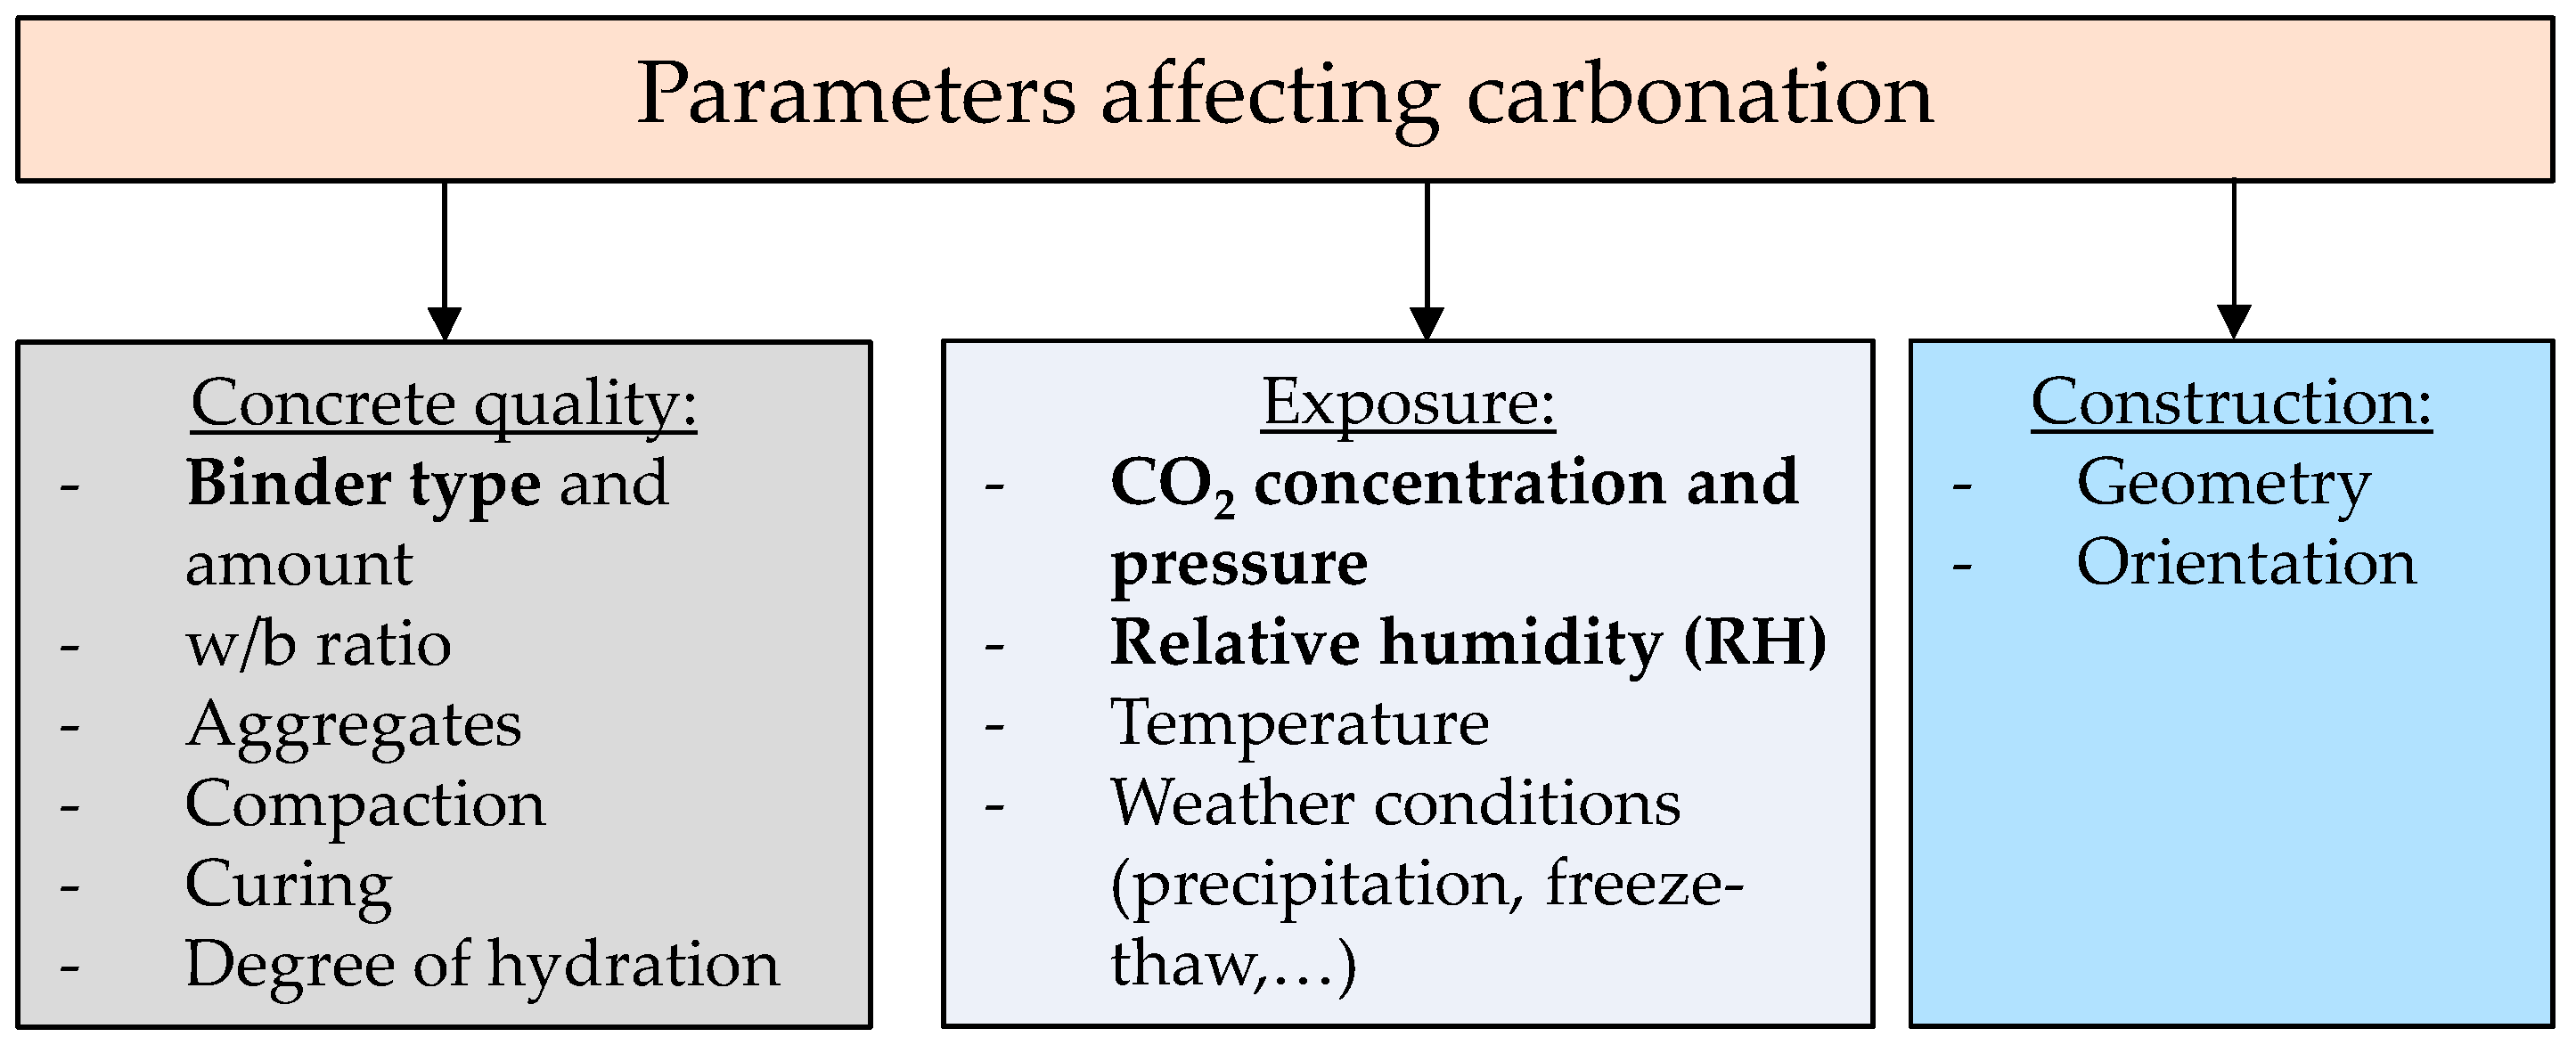
:1. Introduction
| Theoretical acceleration factor; | |
| dN, dS | Carbonation depth under natural („N”) and accelerated (“S”) conditions; |
| KN | ; |
| KS | ; |
| Natural CO2–concentration [vol.%]; | |
| Accelerated CO2–concentration [vol.%]. |
2. Materials and Methods
2.1. Materials and Pre-Storage
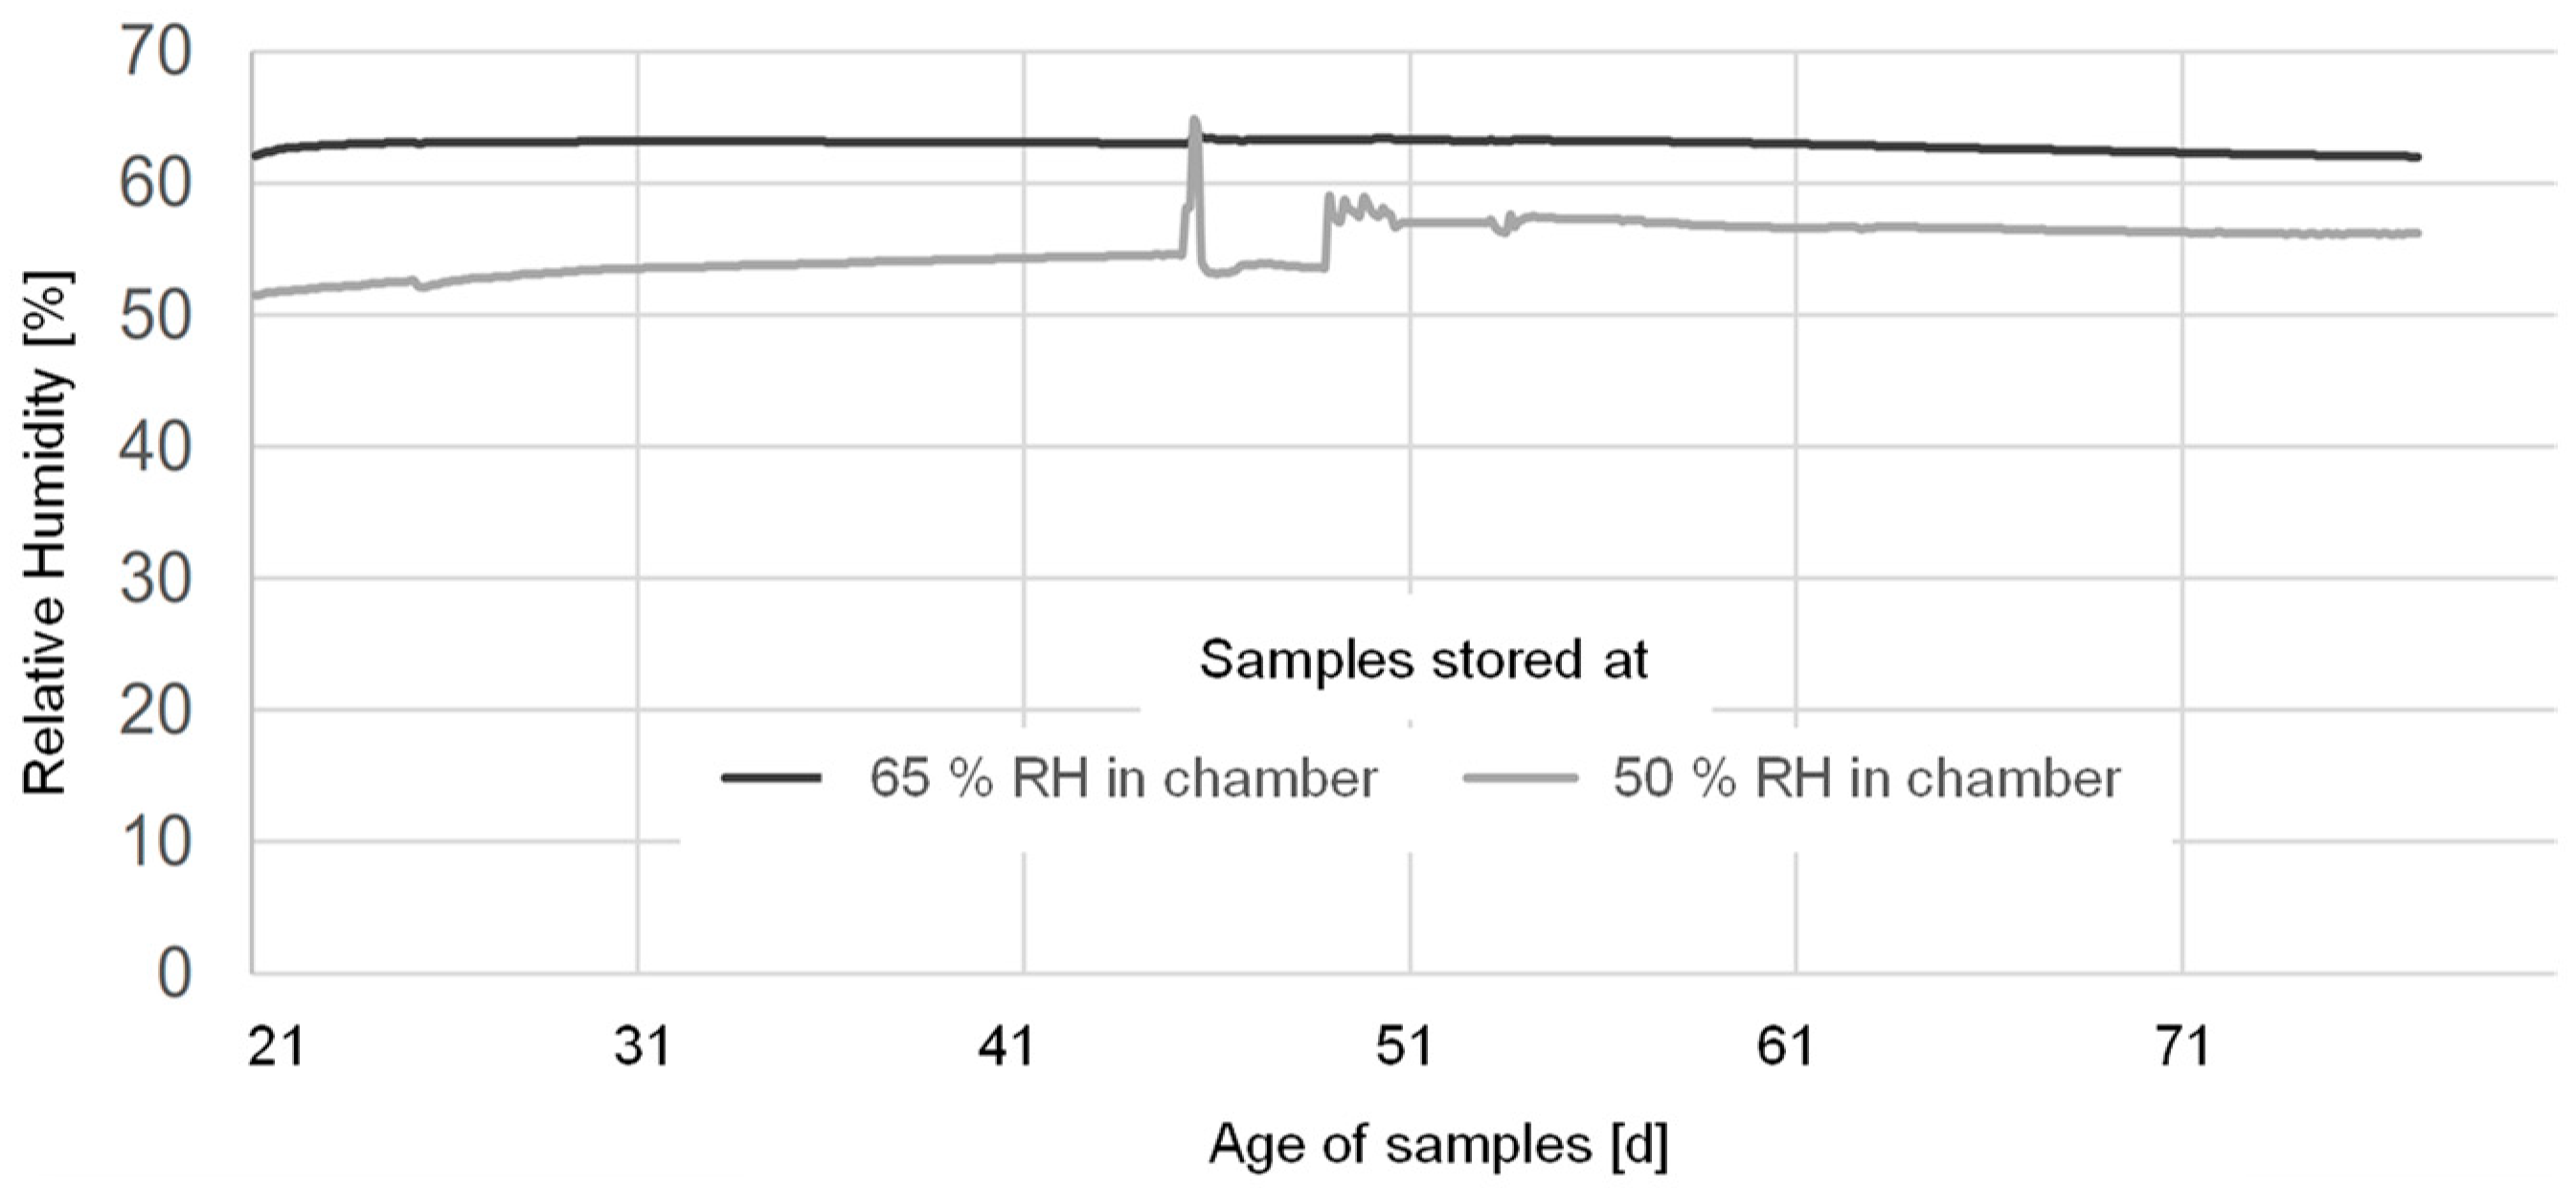
2.2. Carbonation Exposure
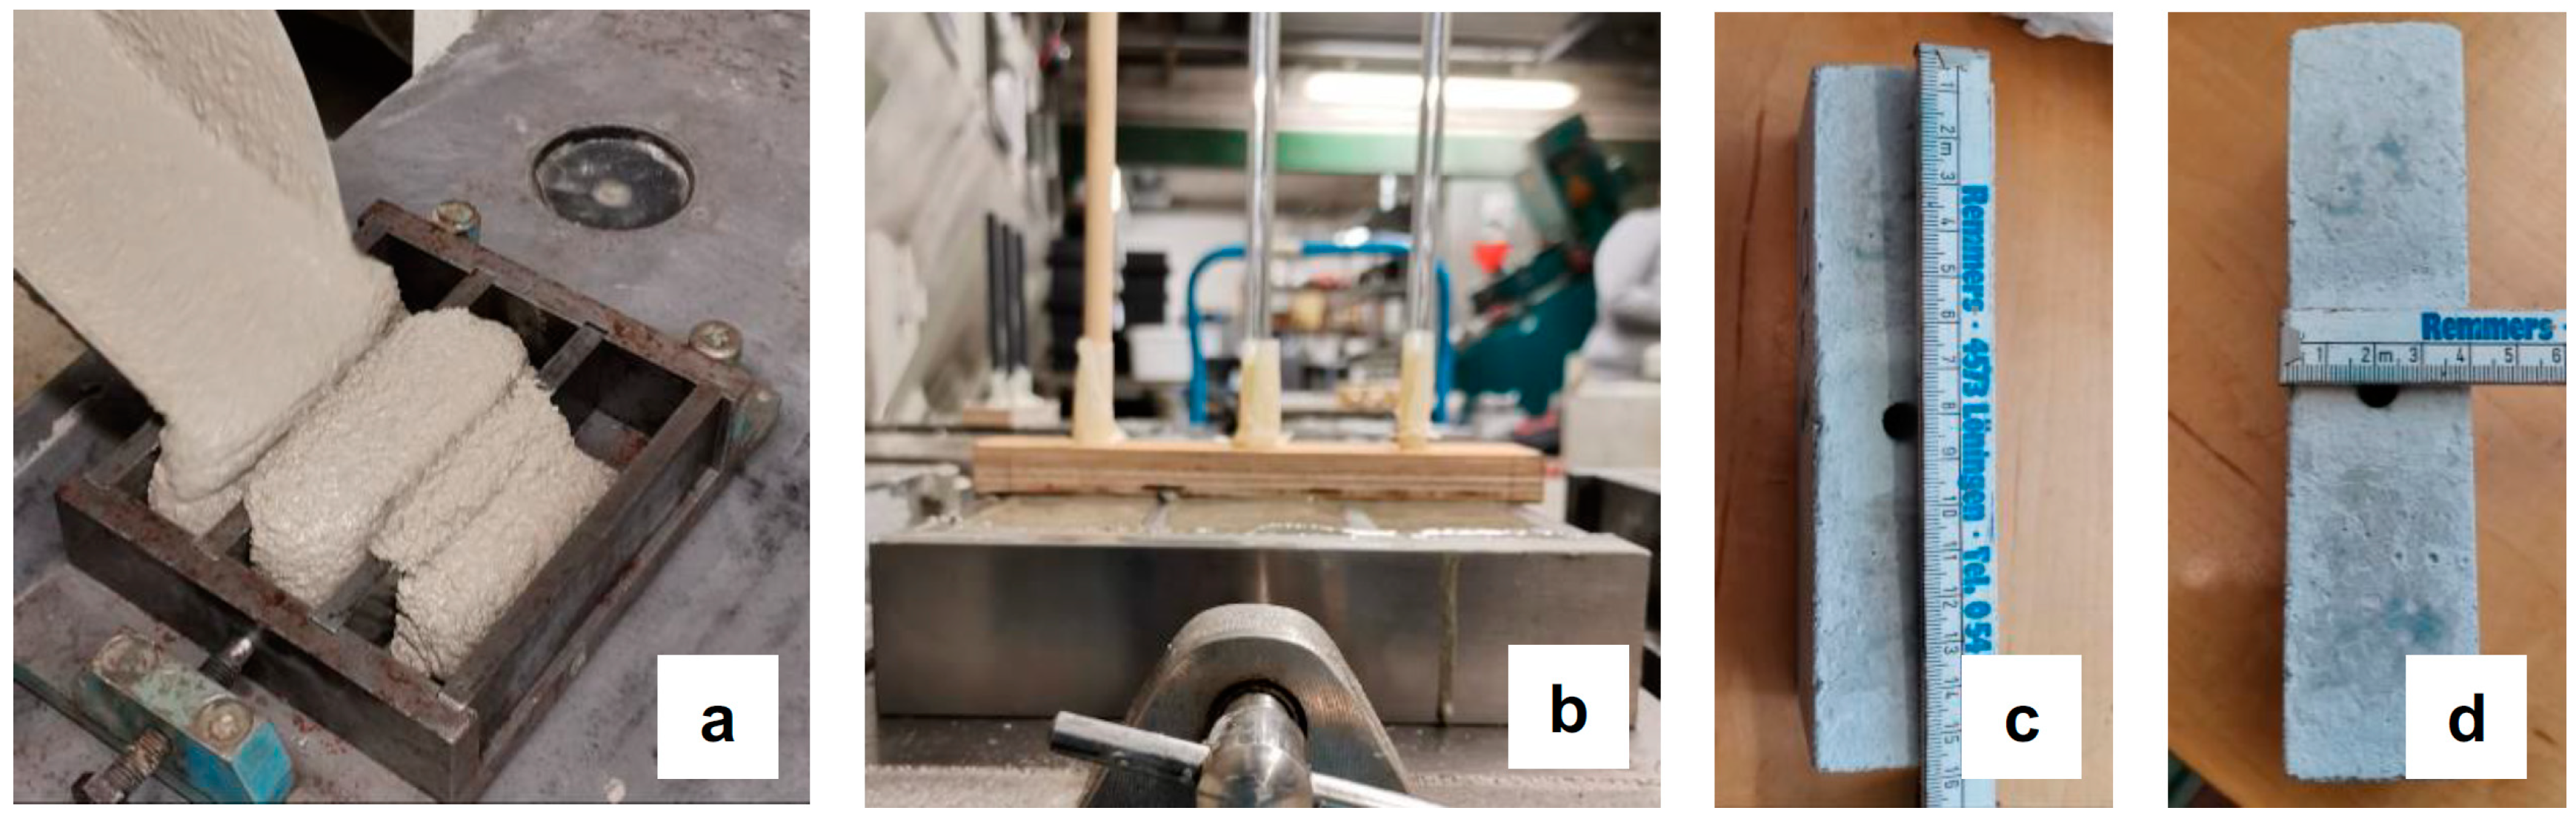
2.3. Methods
Δm: mass of sucked water in kg
A: Exposed surface (40 × 40 mm2) in m2
3. Results and Discussion
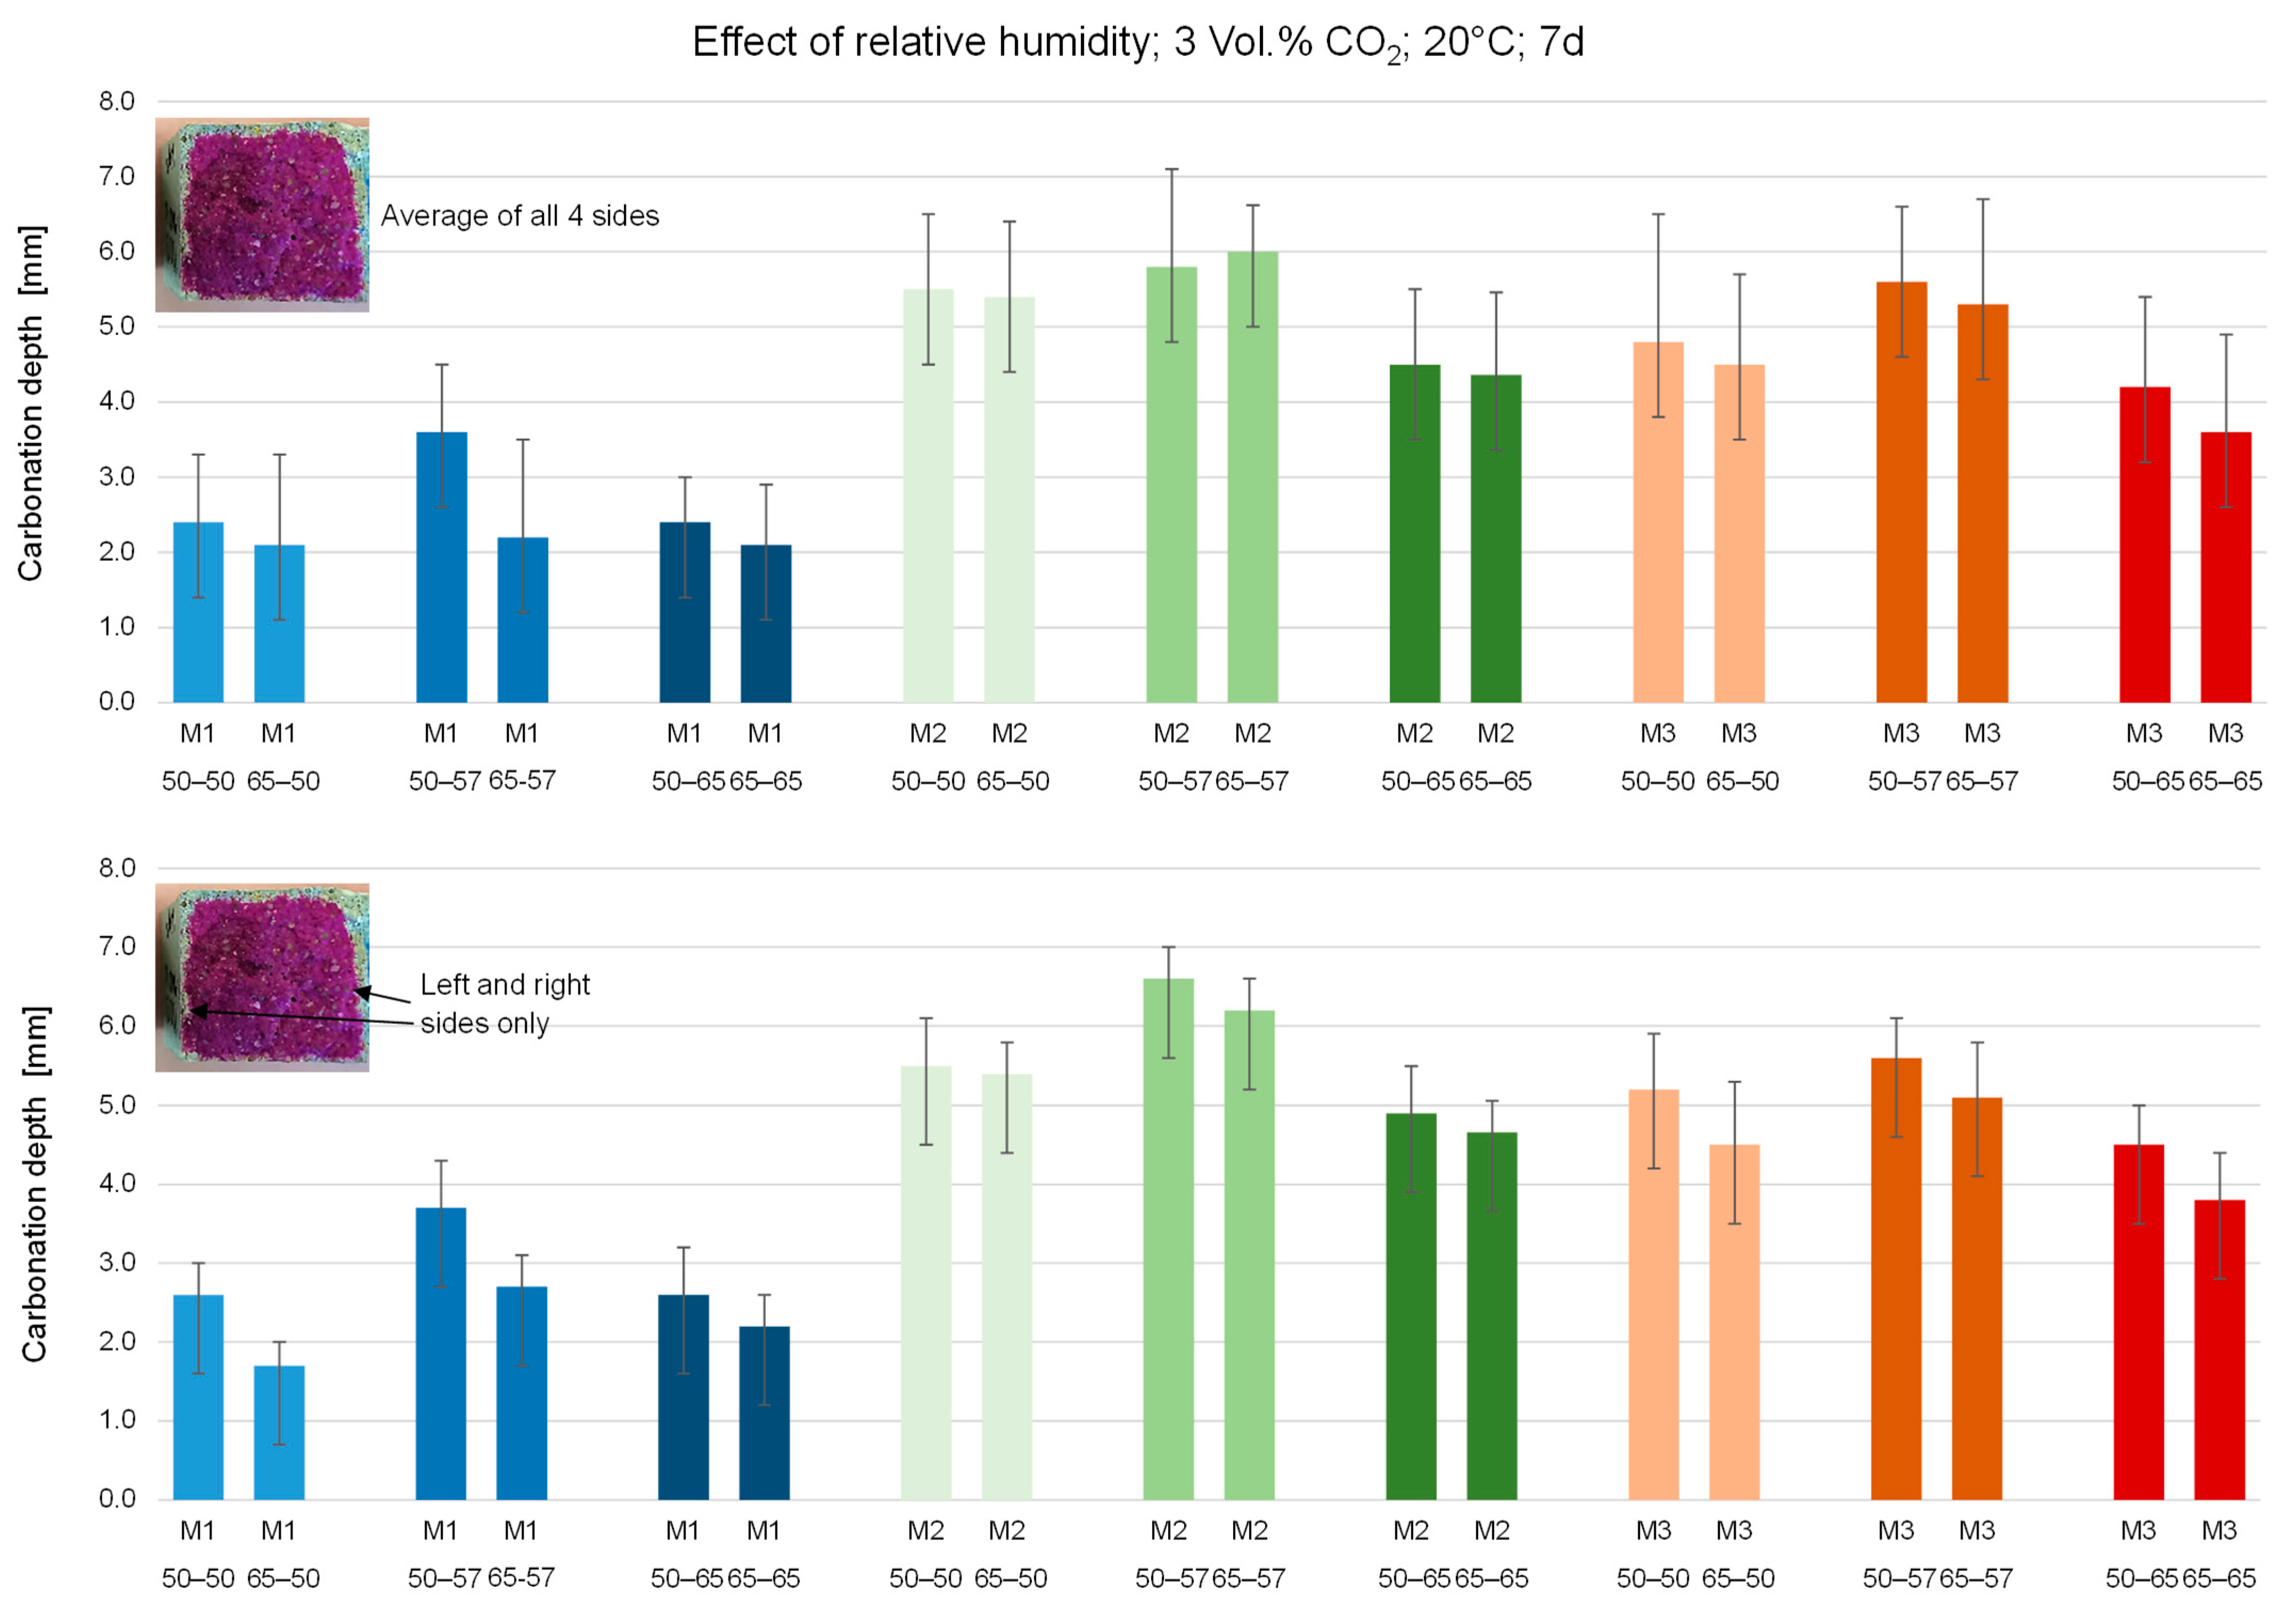
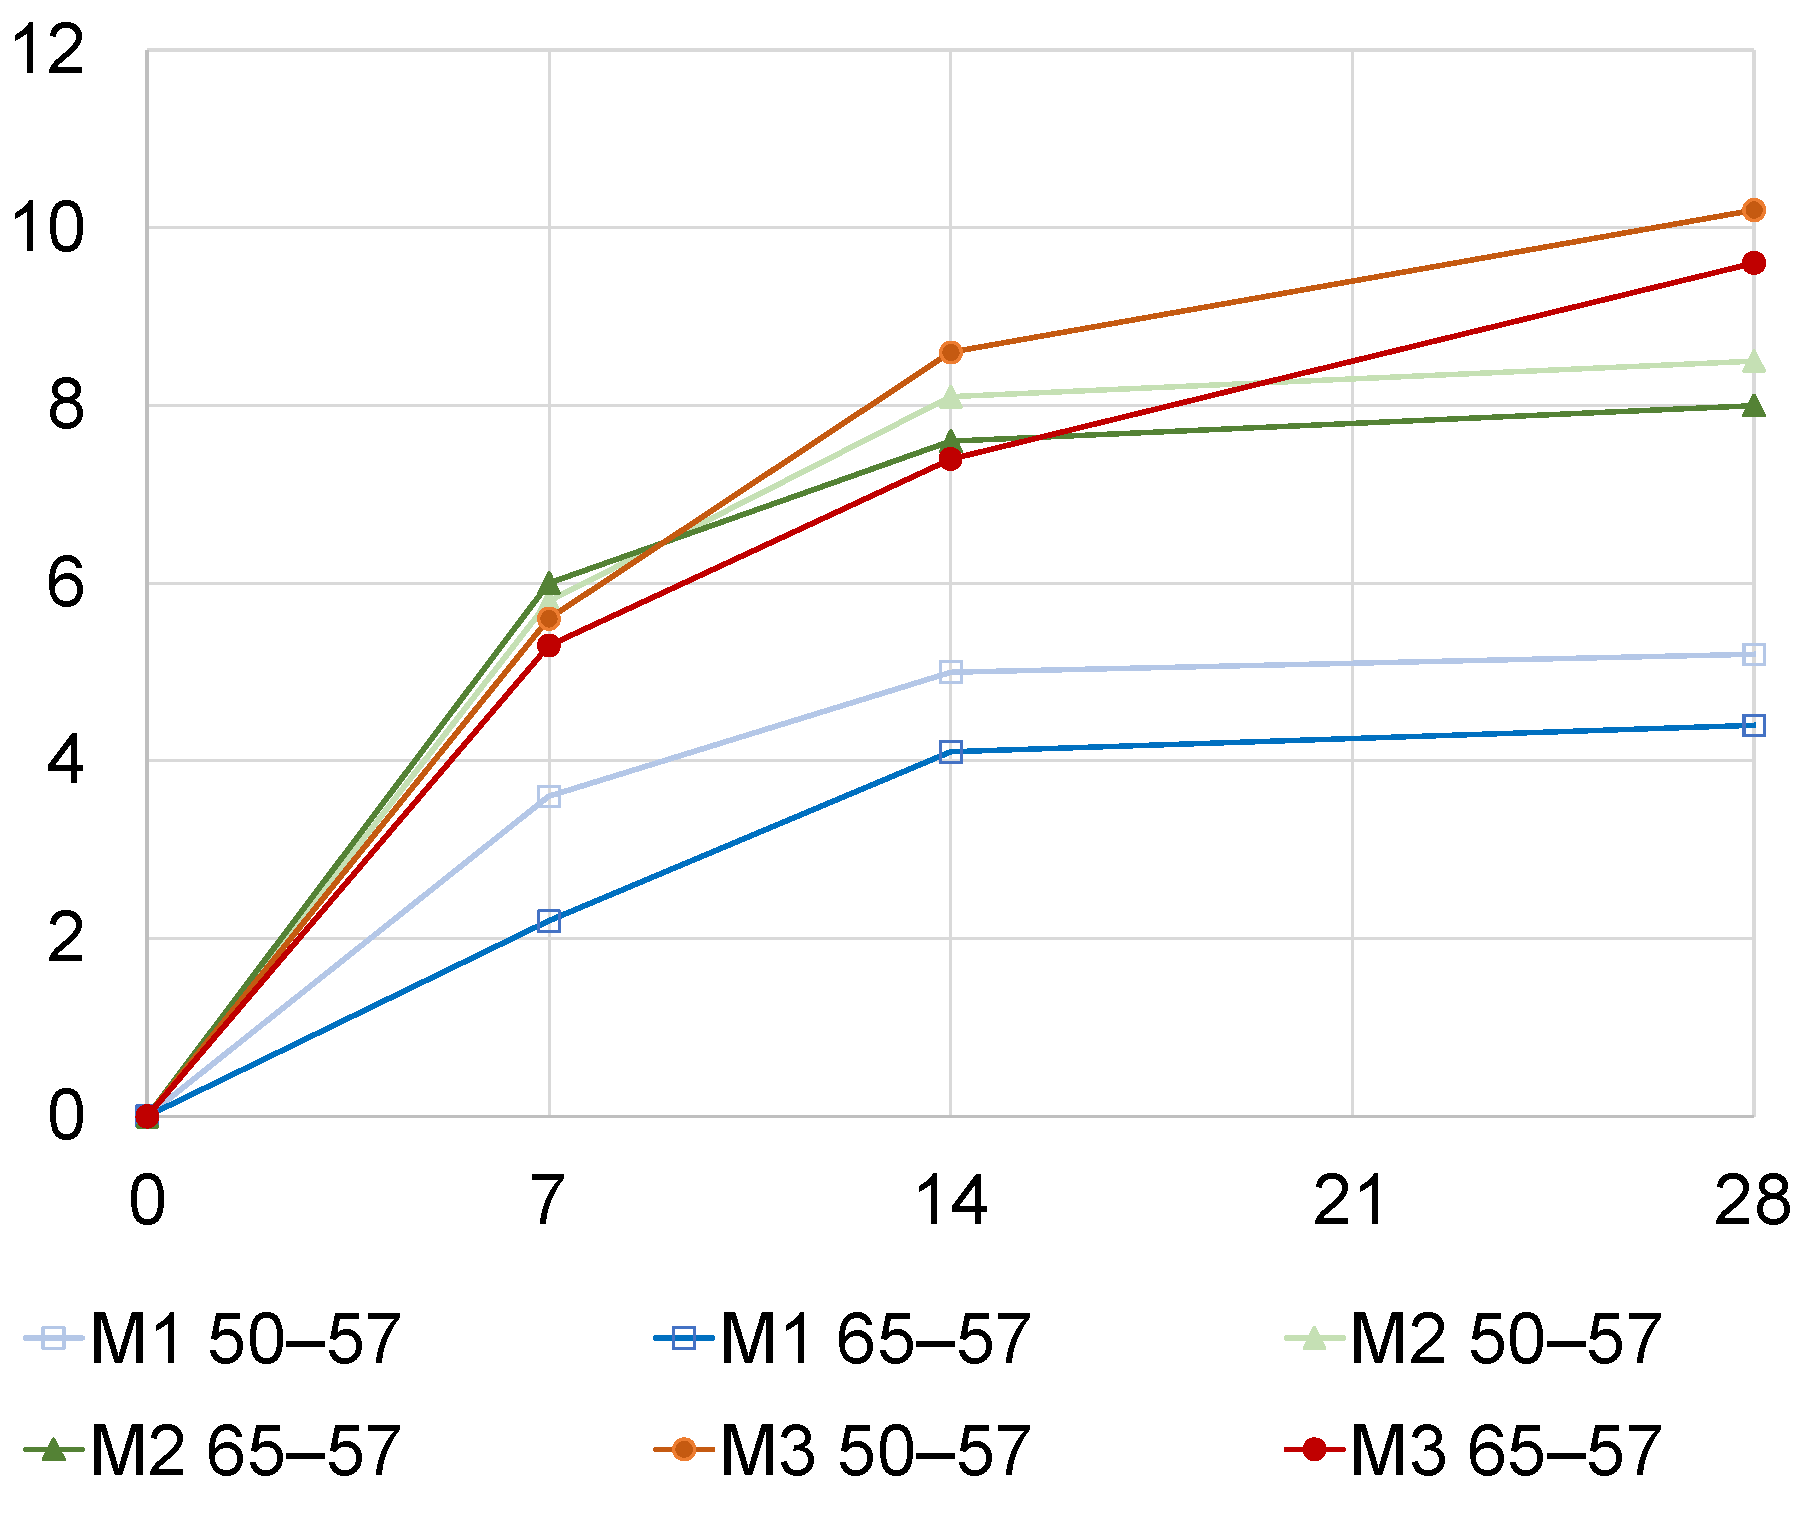
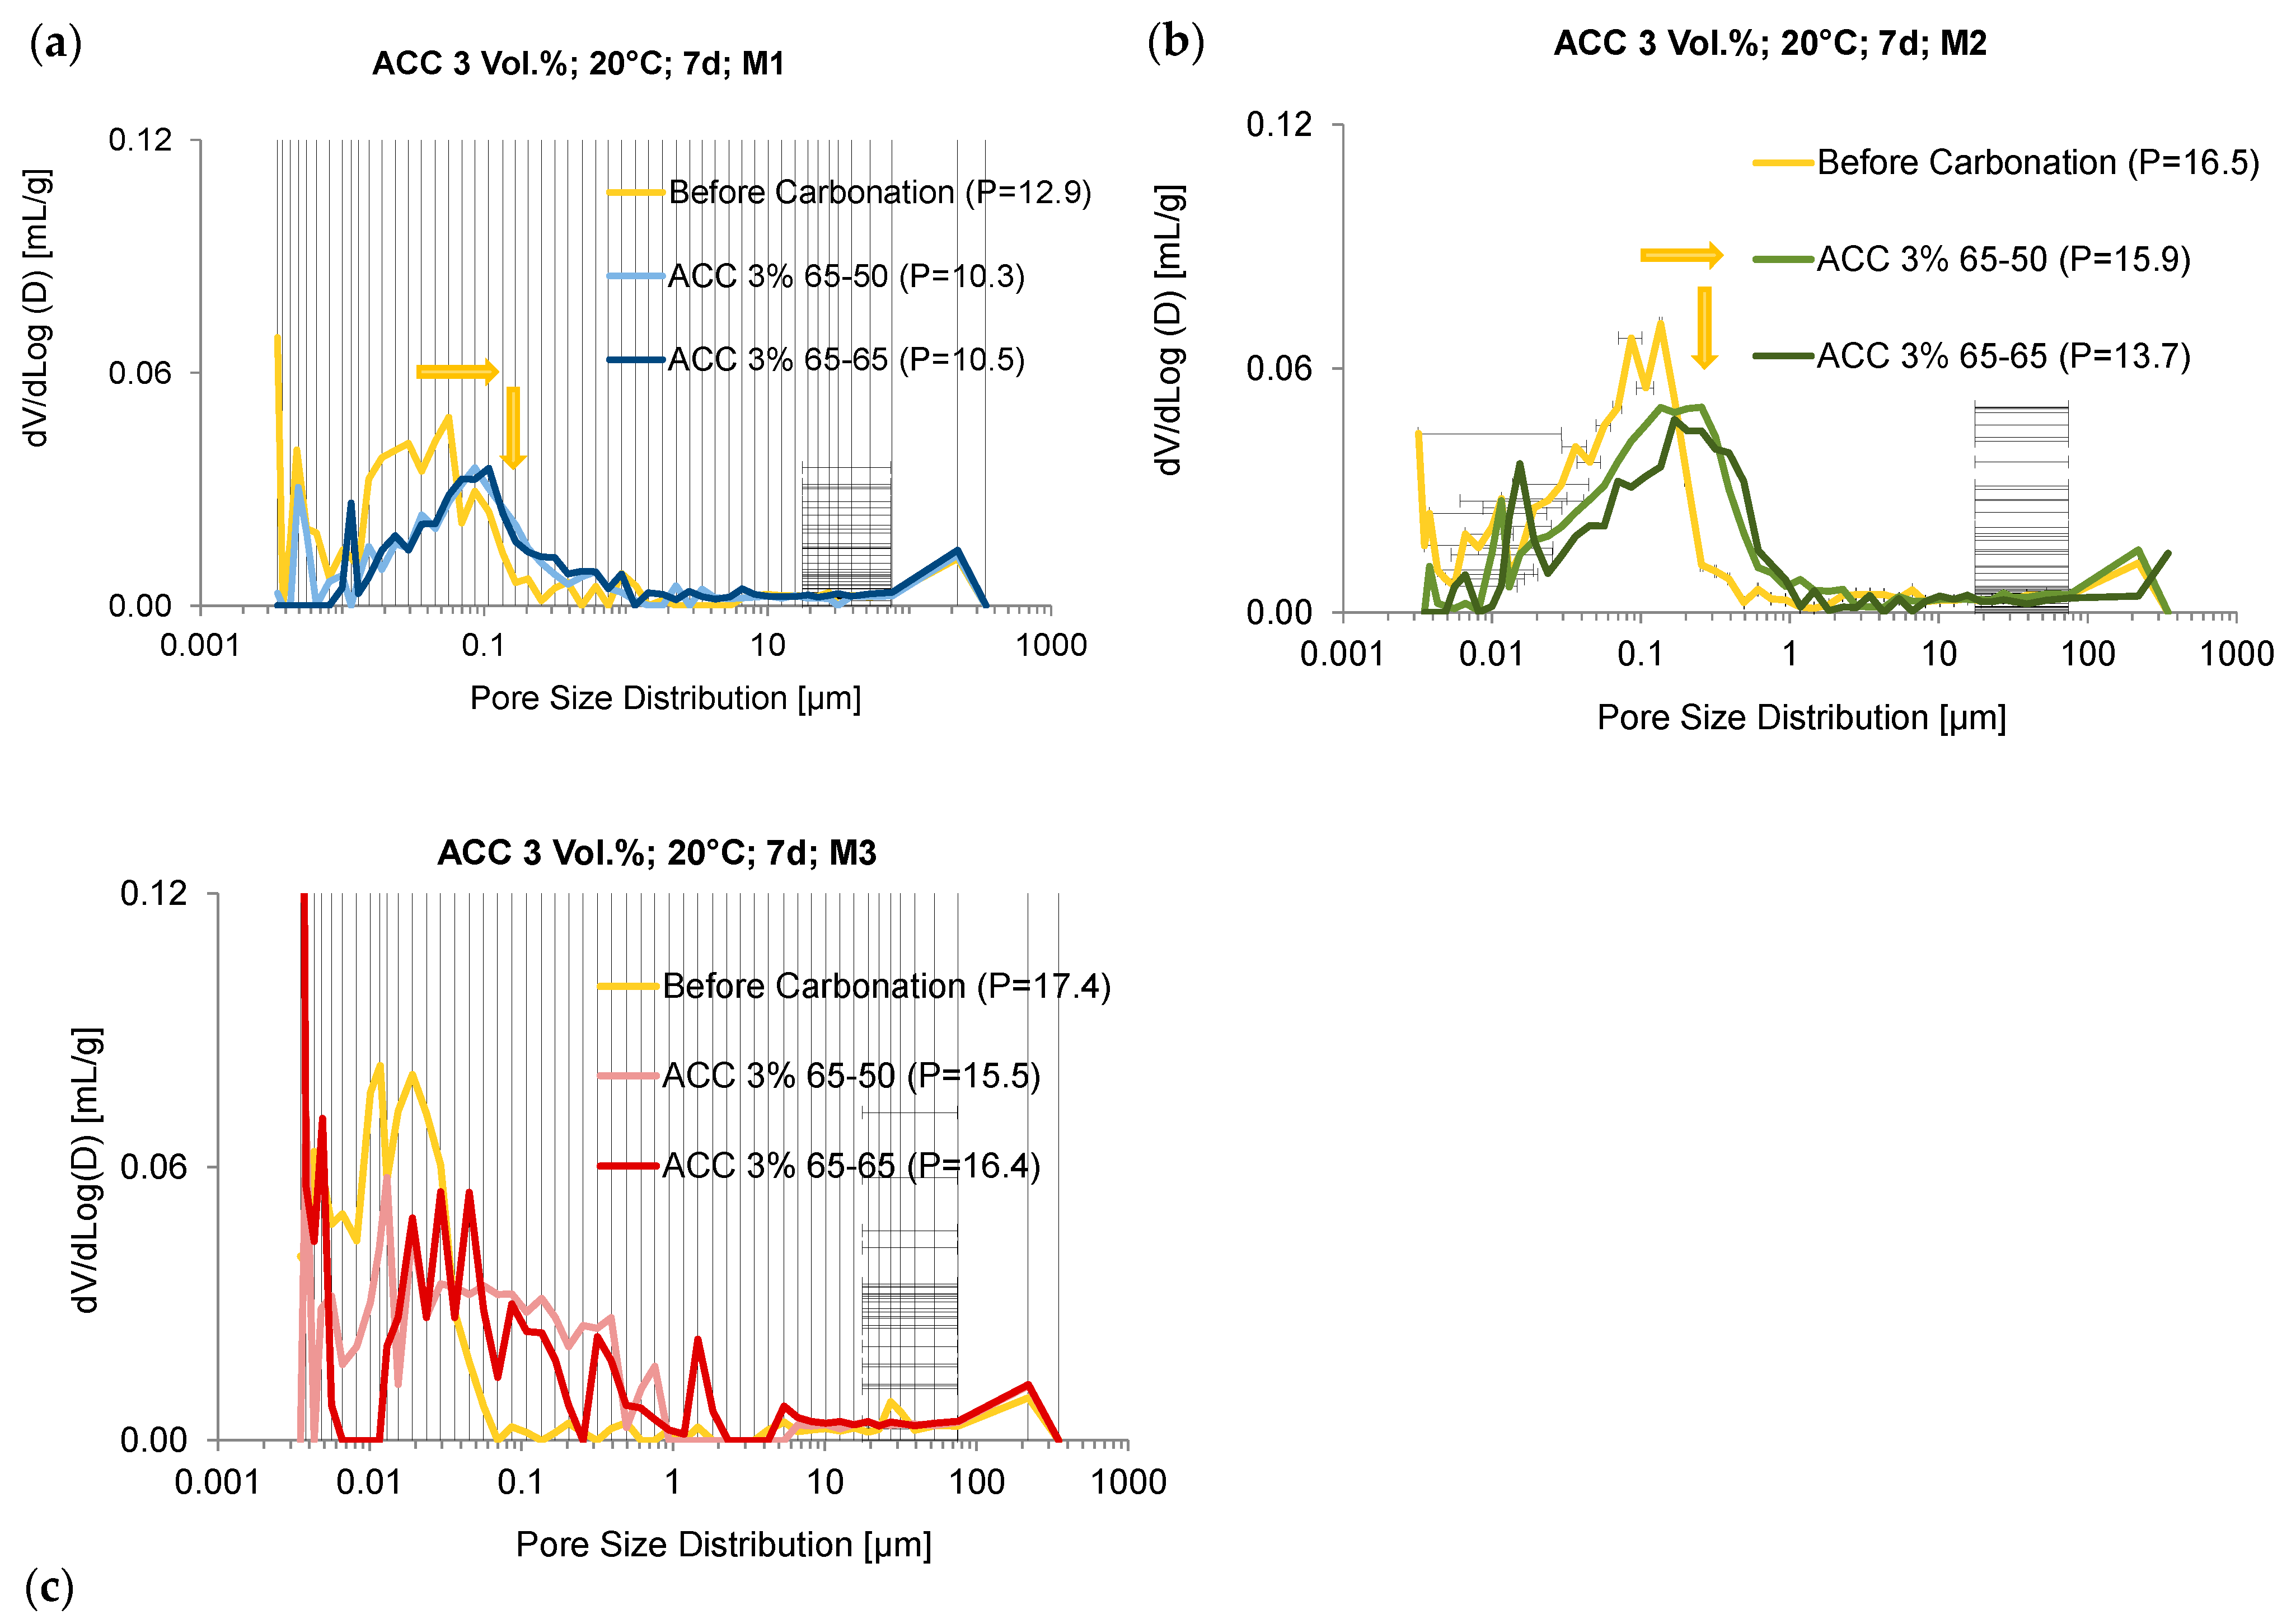
3.1. Effect of Pre-Conditioninge and RH during Accelerated Carbonation
3.2. Effect of CO2 Impact
4. Conclusions
Author Contributions
Funding
Institutional Review Board Statement
Informed Consent Statement
Data Availability Statement
Conflicts of Interest
References
- Andersson, R.; Fridh, K.; Stripple, H.; Häglund, M. Calculating CO2 uptake for existing concrete structures during and after service life. Environ. Sci. Technol. 2013, 47, 11625–11633. [Google Scholar] [CrossRef] [PubMed]
- DIN EN 12390-12:2020-04; Testing Hardened Concrete—Part 12: Determination of the Carbonation Resistance of Concrete—Accelerated Carbonation Method. German Version EN 12390-12:2020. Deutsches Institut für Normung, Beuth Verlag: Berlin, Germany, 2020.
- von Greve-Dierfeld, S.; Lothenbach, B.; Vollpracht, A.; Wu, B.; Huet, B.; Andrade, C.; Medina, C.; Thiel, C.; Gruyaert, E.; Vanoutrive, H.; et al. Understanding the carbonation of concrete with supplementary cementitious materials: A critical review by RILEM TC 281-CCC. Mater. Struct. 2020, 53, 136. [Google Scholar] [CrossRef]
- Auroy, M.; Poyet, S.; le Bescop, P.; Torrenti, J.-M.; Charpentier, T.; Moskura, M.; Bourbon, X. Comparison between natural and accelerated carbonation (3% CO2): Impact on mineralogy, microstructure, water retention and cracking. Cem. Concr. Res. 2018, 109, 64–80. [Google Scholar] [CrossRef]
- Gehlen, C. Probabilistische Lebensdauerbemessung von Stahlbetonbauwerken-Zuverlässigkeitsbetrachtungen zur Wirksamen Vermeidung von Bewehrungskorrosion. Doctoral Thesis, RWTH Aachen, Aachen, Germany, 2000. [Google Scholar]
- Hunkeler, F.; von Greve-Dierfeld, S. Karbonatisierung von Beton und Korrosionsgeschwindigkeit der Bewehrung im Karbonatisierten Beton (Carbonation of Concrete and Reinforcement Corrosion Rate in Carbonated Concrete); Research Report Published by the Swiss Federal Roads Office VSS No. 696; Federal Roads Office: Bernm Switzerland, 2019. [Google Scholar]
- Galan, I.; Andrade, C.; Castellote, M. Natural and accelerated CO2 binding kinetics in cement paste at different relative humidities. Cem. Concr. Res. 2013, 49, 21–28. [Google Scholar] [CrossRef]
- Harrison, T.A.; Jones, M.R.; Newlands, M.D.; Kandasami, S.; Khanna, G. Experience of using the prTS 12390-12 accelerated carbonation test to assess the relative performance of concrete. Mag. Concr. Res. 2012, 64, 737–747. [Google Scholar] [CrossRef]
- Phung, Q.T.; Maes, N.; Jacques, D.; Bruneel, E.; van Driessche, I.; Ye, G.; de Schutter, G. Effect of limestone fillers on micro-structure and permeability due to carbonation of cement pastes under controlled CO2 pressure conditions. Constr. Build. Mater. 2015, 82, 376–390. [Google Scholar] [CrossRef]
- Zou, D.; Liu, T.; Du, C.; Teng, J. Influence of Wind Pressure on the Carbonation of Concrete. Materials 2015, 8, 4652–4667. [Google Scholar] [CrossRef] [PubMed] [Green Version]
- Steiner, S.; Lothenbach, B.; Borgschulte, A.; Winnefeld, T.P.F. Effect of relative humidity on the carbonation rate of portlandite, calcium silicate hydrates and ettringite. In Proceedings of the Internationale Baustofftagung (Ibausil), Weimar, Germany, 12–14 September 2018. [Google Scholar]
- Steiner,, S. Carbonation of Conrete Made from Limestone-Rich Cement: CO2 Diffusivity and Alteration of Hydrate Phases. Ph.D. Thesis, Technische Universität Darmstadt, Darmstadt, Germany, 2020. [Google Scholar]
- Elsalamawy, M.; Mohamed, A.R.; Kamal, E.M. The role of relative humidity and cement type on carbonation resistance of concrete. Alex. Eng. J. 2019, 58, 1257–1264. [Google Scholar] [CrossRef]
- Papadakis, V.G. Fundamental modeling and experimental investigation of concrete carbonation. ACI Mater. J. 1991, 88, 363. [Google Scholar]
- Leemann, A.; Moro, F. Carbonation of concrete: The role of CO2 concentration, relative humidity and CO2 buffer capacity. Mat. Struct. 2017, 50, 30. [Google Scholar] [CrossRef]
- Russel, D.; Basheer,, P.M.; Rankin, G.B.; Long, A.E. Effect of relative humidity and air permeability on prediction of the rate of carbonation of concrete. Proc. Institut. Civil Eng.-Struct. Build. 2001, 146, 319–326. [Google Scholar] [CrossRef]
- de Ceukelaire, L.; van Nieuwenburg, D. Accelerated carbonation of a blast-furnace cement concrete. Cem. Concr. Res. 1993, 23, 442–452. [Google Scholar] [CrossRef]
- Atiş, C.D. Accelerated carbonation and testing of concrete made with fly ash. Constr. Build. Mater. 2003, 17, 147–152. [Google Scholar] [CrossRef]
- Rougeau, P. Les re ′Sultats D’essais Croise ′s AFREM «Essai de Carbonatation Accéléré», dans Compterendu des Journées Techniques, AFPC-AFREM Durabilité des Bétons, « Méthodes Recommandées pour la Mesure des Grandeurs Associées à la Durabilité»; CERIB: Toulouse, France, 1997. (In French) [Google Scholar]
- Soja, W.; Georget, F.; Maraghechi, H.; Scrivener, K. Evolution of microstructural changes in cement paste during environ-mental drying. Cem. Concr. Res. 2020, 134, 106093. [Google Scholar] [CrossRef]
- DIN EN 206:2017; Beton Festlegung, Eigenschaften, Herstellung und Konformität. Beuth: Berlin, Germany, 2017.
- Gehlen, C.; Thiel, C. Specification of building materials for in service durability. In Proceedings of the ICSBM 2019: 2nd International Conference of Sustainable Building Materials, Eindhoven, The Netherlands, 12–15 August 2019. [Google Scholar]
- Thiel, C.; von Einfluss, C. CO2-Druck und Feuchtegehalt auf das Porengefüge Zementgebundener Werkstoffe Während der Carbonatisierung. Ph.D. Thesis, Technische Universität München, Munich, Germany, 2023. (under review). [Google Scholar]
- DIN EN 480-5:2005-12; Zusatzmittel für Beton, Mörtel und Einpressmörtel-Prüfverfahren-Teil_5: Bestimmung der kapillaren Wasseraufnahme. Deutsche Fassung EN_480-5:2005. Deutsches Institut für Normung, Beuth Verlag: Berlin, Germany, 2005.
- Martys, N.S.; Ferraris, C.F. Capillary transport in mortars and concrete. Cem. Concr. Res. 1997, 27, 747–760. [Google Scholar] [CrossRef]
- Panesar, D.K.; Francis, J. Influence of limestone and slag on the pore structure of cement paste based on mercury intrusion porosimetry and water vapour sorption measurements. Constr. Build. Mater. 2014, 52, 52–58. [Google Scholar] [CrossRef]
- Thienel, K.C.; Schmidt-Döhl, F.; Feldrappe, V. In-Situ Tests on Existing LWAC Structures. In Proceedings of the Second International Conference on Structural Lightweight Aggregate Concrete, Kristiansand, Norway, 18–22 June 2000. [Google Scholar]
- Villain, G.; Thiery, M. Gammadensimetry: A method to determine drying and carbonation profiles in concrete. NDT E Int. 2006, 39, 328–337. [Google Scholar] [CrossRef]
- Castellote, M.; Andrade, C.; Turrillas, X.; Campo, J.; Cuello, G.J. Accelerated carbonation of cement pastes in situ monitored by neutron diffraction. Cem. Concr. Res. 2008, 38, 1365–1373. [Google Scholar] [CrossRef]
- Thiel, C.; Gehlen, C. On the determination of carbonation in cementitious materials. In Proceedings of the International Conference on Sustainable Materials Systems and Structures (SMSS2019) Durability, Monitoring and Repair of Structures, Rovinj, Croatia, 20–22 March 2019; Baričević, A., Rukavina, M.J., Damjanović, D., Guadagnini, M., Eds.; ISBN 978-2-35158-217-6. [Google Scholar]
- Martens-Menzel,, R.; Harwardt,, L.; Krauss,, J. Maßanalyse: Titrationen mit Chemischen und Physikalischen Indikationen; De Gruyter: Berlin, Germany; Boston, MA, USA, 2022. [Google Scholar]
- Vanoutrive, H.; van den Heede, P.; Alderete, N.; Andrade, C.; Bansal, T.; Camões, A.; Cizer, Ö.; de Belie, N.; Ducman, V.; Etxeberria, M.; et al. Report of RILEM TC 281-CCC: Outcomes of a round robin on the resistance to accelerated carbonation of Portland, Portland-fly ash and blast-furnace blended cements. Mater. Struct. 2022, 55, 99. [Google Scholar] [CrossRef]
- Soja, W. Carbonation of Low Carbon Binders. Ph.D. Thesis, EPFL, Lausanne, Switzerland, 2019. [Google Scholar] [CrossRef]
- Galan, I.; Glasser, F.P.; Baza, D.; Andrade, C. Assessment of the protective effect of carbonation on portlandite crystals. Cem. Concr. Res. 2015, 74, 68–77. [Google Scholar] [CrossRef]
- Steiner, S.; Lothenbach, B.; Proske, T.; Borgschulte, A.; Winnefeld, F. Effect of relative humidity on the carbonation rate of portlandite, calcium silicate hydrates and ettringite. Cem. Concr. Res. 2020, 135, 106116. [Google Scholar] [CrossRef]


| Cement Type | Cement Label | Air Content 1 | Consistency 2 | Mortar Density Fresh State/28 d | 28 d Compressive/Tensile Strength | Mixture Label |
|---|---|---|---|---|---|---|
| [-] | [vol.%] | [mm] | [kg/m3] | [MPa] | [-] | |
| OPC | CEM I 42.5 N | 1.9 | 192 | 2200/2210 | 57.6/7.7 | M1 |
| Portland Composite Cement (with limestone filler) | CEM II A-LL 42.4 N | 1.5 | 246 | 2180/2230 | 41.7/6.7 | M2 |
| Granulated blast furnace slag cement | CEM II/B 42.5 N | 1.5 | 226 | 2180/2150 | 51.4/7.2 | M3 |
| Method | Aim of Method | Preparation | Description | Reference |
|---|---|---|---|---|
| Color indicator spray test | Determination of carbonation depth | Lateral breaking of prisms, dry cleaning of dust | Spraying color indicator solution on freshly broken surfaces; 5 readings were taken per side | [2,22,23] |
| Capillary suction | Information on change in capillary porosity on the surface | Drying at 40 °C for 7 d Lateral sealing | Specimens are placed on spacers of 5 mm in demineralized water with a height of 7 ± 1 mm | [24,25] |
| Mercury intrusion porosimetry (MIP) | Determination of total porosity and pore size distribution (1.7 nm to 0.5 mm) | (Carbonated) edge zone was cut, solvent exchange method was used and samples with visually low amount of aggregates were used | Mercury is injected into the sample under increasing pressure. The total porosity is determined from the total intruded volume. The pore size distribution is determined by the amount of mercury intruded at a given pressure level | [26,27] |
| Thermo-gravimetric analysis (TGA) | Determination of chemical changes due to carbonation | Same as for MIP, the broken pieces were fine-grinded | Changes of mass are determined as a function of the heating temperature | [7,28,29] |
| Exposure | M1 50–57 | M1 65–57 | M2 50–57 | M2 65–57 | M3 50–57 | M3 65–57 |
|---|---|---|---|---|---|---|
| Before carbonation | 0.76 | 0.48 | 1.58 | 1.09 | 1.20 | 1.07 |
| 7 d ACC | 0.85 | 0.63 | 2.43 | 2.21 | 1.46 | 1.49 |
| Exposure | M1 | M2 | M3 |
|---|---|---|---|
| Before Carbonation | 0.48 | 1.09 | 1.07 |
| 7d ACC 3% CO2 and 50% RH | 0.53 | 1.76 | 1.72 |
| 7d ACC 3% CO2 and 65% RH | 0.57 | 1.84 | 1.24 |
| Mass Loss (%) | % of Hardened Cement Paste | |||||||
|---|---|---|---|---|---|---|---|---|
| <110 °C | 110–400 °C | 400–500 °C | 600–800 °C | 20–1110 °C | ||||
| Water | Ettringite, C-S-H | Portlandite | Calcite | Total Mass Loss | CH | CaCO3 | ||
| M1 | Before Carbonation | −2.7 | −3.8 | −1.7 | −1.4 | −10.2 | 7.2 | 8.2 |
| ACC 50% RH | −1.9 | −2.8 | −1.0 | −5.6 | −12.5 | 4.2 | 31.6 | |
| ACC 65% RH | −0.4 | −2.6 | −0.9 | −5.3 | −9.9 | 3.5 | 29.4 | |
| M2 | Before Carbonation | −1.2 | −3.0 | −1.4 | −2.5 | −9.2 | 5.8 | 13.9 |
| ACC 50% RH | −1.4 | −2.7 | −0.8 | −7.3 | −12.6 | 3.3 | 41.3 | |
| ACC 65% RH | −1.4 | −2.4 | −0.7 | −8.0 | −13.0 | 3.0 | 45.2 | |
| M3 | Before Carbonation | −2.0 | −2.4 | −0.6 | −1.4 | −6.5 | 2.6 | 8.0 |
| ACC 50% RH | −1.8 | −2.5 | −0.7 | −3.1 | −8.7 | 2.9 | 17.3 | |
| ACC 65% RH | −1.4 | −2.5 | −0.8 | −4.1 | −9.6 | 3.4 | 23.2 | |
| Natural Carbonation 84 d | Accelerated Carbonation 7 d, 1 vol.% CO2 | Accelerated Carbonation 7 d, 3 vol.% CO2 | Accelerated Carbonation 7 d, 3 vol.% CO2 and 2 Barg | |||||
|---|---|---|---|---|---|---|---|---|
| μ | σ | μ | σ | μ | Σ | Μ | σ | |
| M1—50–65 | 0.8 | 0.5 | 1.0 | 0.7 | 2.4 | 0.6 | - | - |
| M1—65–65 | 1.1 | 0.4 | 0.8 | 0.7 | 2.1 | 0.8 | - | - |
| M2—50–65 | 1.4 | 0.4 | 2.3 | 0.9 | 4.5 | 1.0 | 6.8 | 1.2 |
| M2—65–65 | 1.5 | 0.4 | 2.4 | 0.5 | 4.4 | 1.1 | 6.4 | 1.1 |
| M3—50–65 | 1.9 | 0.7 | 2.1 | 0.6 | 4.2 | 1.2 | - | - |
| M3—65–65 | 1.7 | 0.6 | 1.9 | 0.5 | 3.6 | 1.3 | - | - |
| Mass Loss [%] | % of Hardened Cement Paste | ||||||
|---|---|---|---|---|---|---|---|
| <110 °C | 110–400 °C | 400–500 °C | 600–800 °C | 20–1110 °C | |||
| Water | Ettringite, C-S-H | Portlandite | Calcite | Total Mass Loss | CH | CaCO3 | |
| Before Carbonation | −1.2 | −3.0 | −1.4 | −2.5 | −9.2 | 5.8 | 13.8 |
| NAC, 84 d | −1.6 | −2.4 | −0.8 | −7.3 | −12.6 | 3.2 | 41.0 |
| ACC, 7d, 1% | −1.7 | −2.6 | −0.9 | −6.4 | −12.1 | 3.7 | 36.3 |
| ACC, 7d, 3% | −1.4 | −2.4 | −0.7 | −8.0 | −13.0 | 3.0 | 45.2 |
| P_ACC, 7d, 3%, 2 barg | −1.9 | −2.4 | −0.8 | −8.4 | −14.0 | 3.1 | 47.5 |
| kNAC | Dc,is,1% | Dc,is,3% | Correction Factor 3% (NAC–ACC) | |||
|---|---|---|---|---|---|---|
| M1 50–65 | 1.67 | 1.3 | 1.3 | 1.97 | 2.4 | 1.22 |
| M1 65–65 | 2.29 | 1.8 | 1.6 | 2.71 | 2.1 | 0.77 |
| M2 50–65 | 2.92 | 2.3 | 2.3 | 3.45 | 4.5 | 1.30 |
| M2 65–65 | 3.13 | 2.5 | 2.4 | 3.70 | 4.4 | 1.20 |
| M3 50–65 | 2.92 | 2.3 | 2.6 | 3.45 | 4.2 | 1.22 |
| M3 65–65 | 2.50 | 2.0 | 2.4 | 2.96 | 3.6 | 1.22 |
Publisher’s Note: MDPI stays neutral with regard to jurisdictional claims in published maps and institutional affiliations. |
© 2022 by the authors. Licensee MDPI, Basel, Switzerland. This article is an open access article distributed under the terms and conditions of the Creative Commons Attribution (CC BY) license (https://creativecommons.org/licenses/by/4.0/).
Share and Cite
Thiel, C.; Kratzer, J.; Grimm, B.; Kränkel, T.; Gehlen, C. Effect of Internal Moisture and Outer Relative Humidity on Concrete Carbonation. CivilEng 2022, 3, 1039-1052. https://doi.org/10.3390/civileng3040058
Thiel C, Kratzer J, Grimm B, Kränkel T, Gehlen C. Effect of Internal Moisture and Outer Relative Humidity on Concrete Carbonation. CivilEng. 2022; 3(4):1039-1052. https://doi.org/10.3390/civileng3040058
Chicago/Turabian StyleThiel, Charlotte, Johanna Kratzer, Benedikt Grimm, Thomas Kränkel, and Christoph Gehlen. 2022. "Effect of Internal Moisture and Outer Relative Humidity on Concrete Carbonation" CivilEng 3, no. 4: 1039-1052. https://doi.org/10.3390/civileng3040058