

Myosteatosis as a Prognostic Marker for Postoperative Mortality in Adult Patients Undergoing Surgery in General—A Systematic Review

Abstract
:1. Introduction
2. Methods
2.1. Protocol Registration
2.2. Search Strategy
2.3. Eligible Criteria
2.4. Data Extraction and Study Interpretation
2.5. Quality Evaluation
3. Results
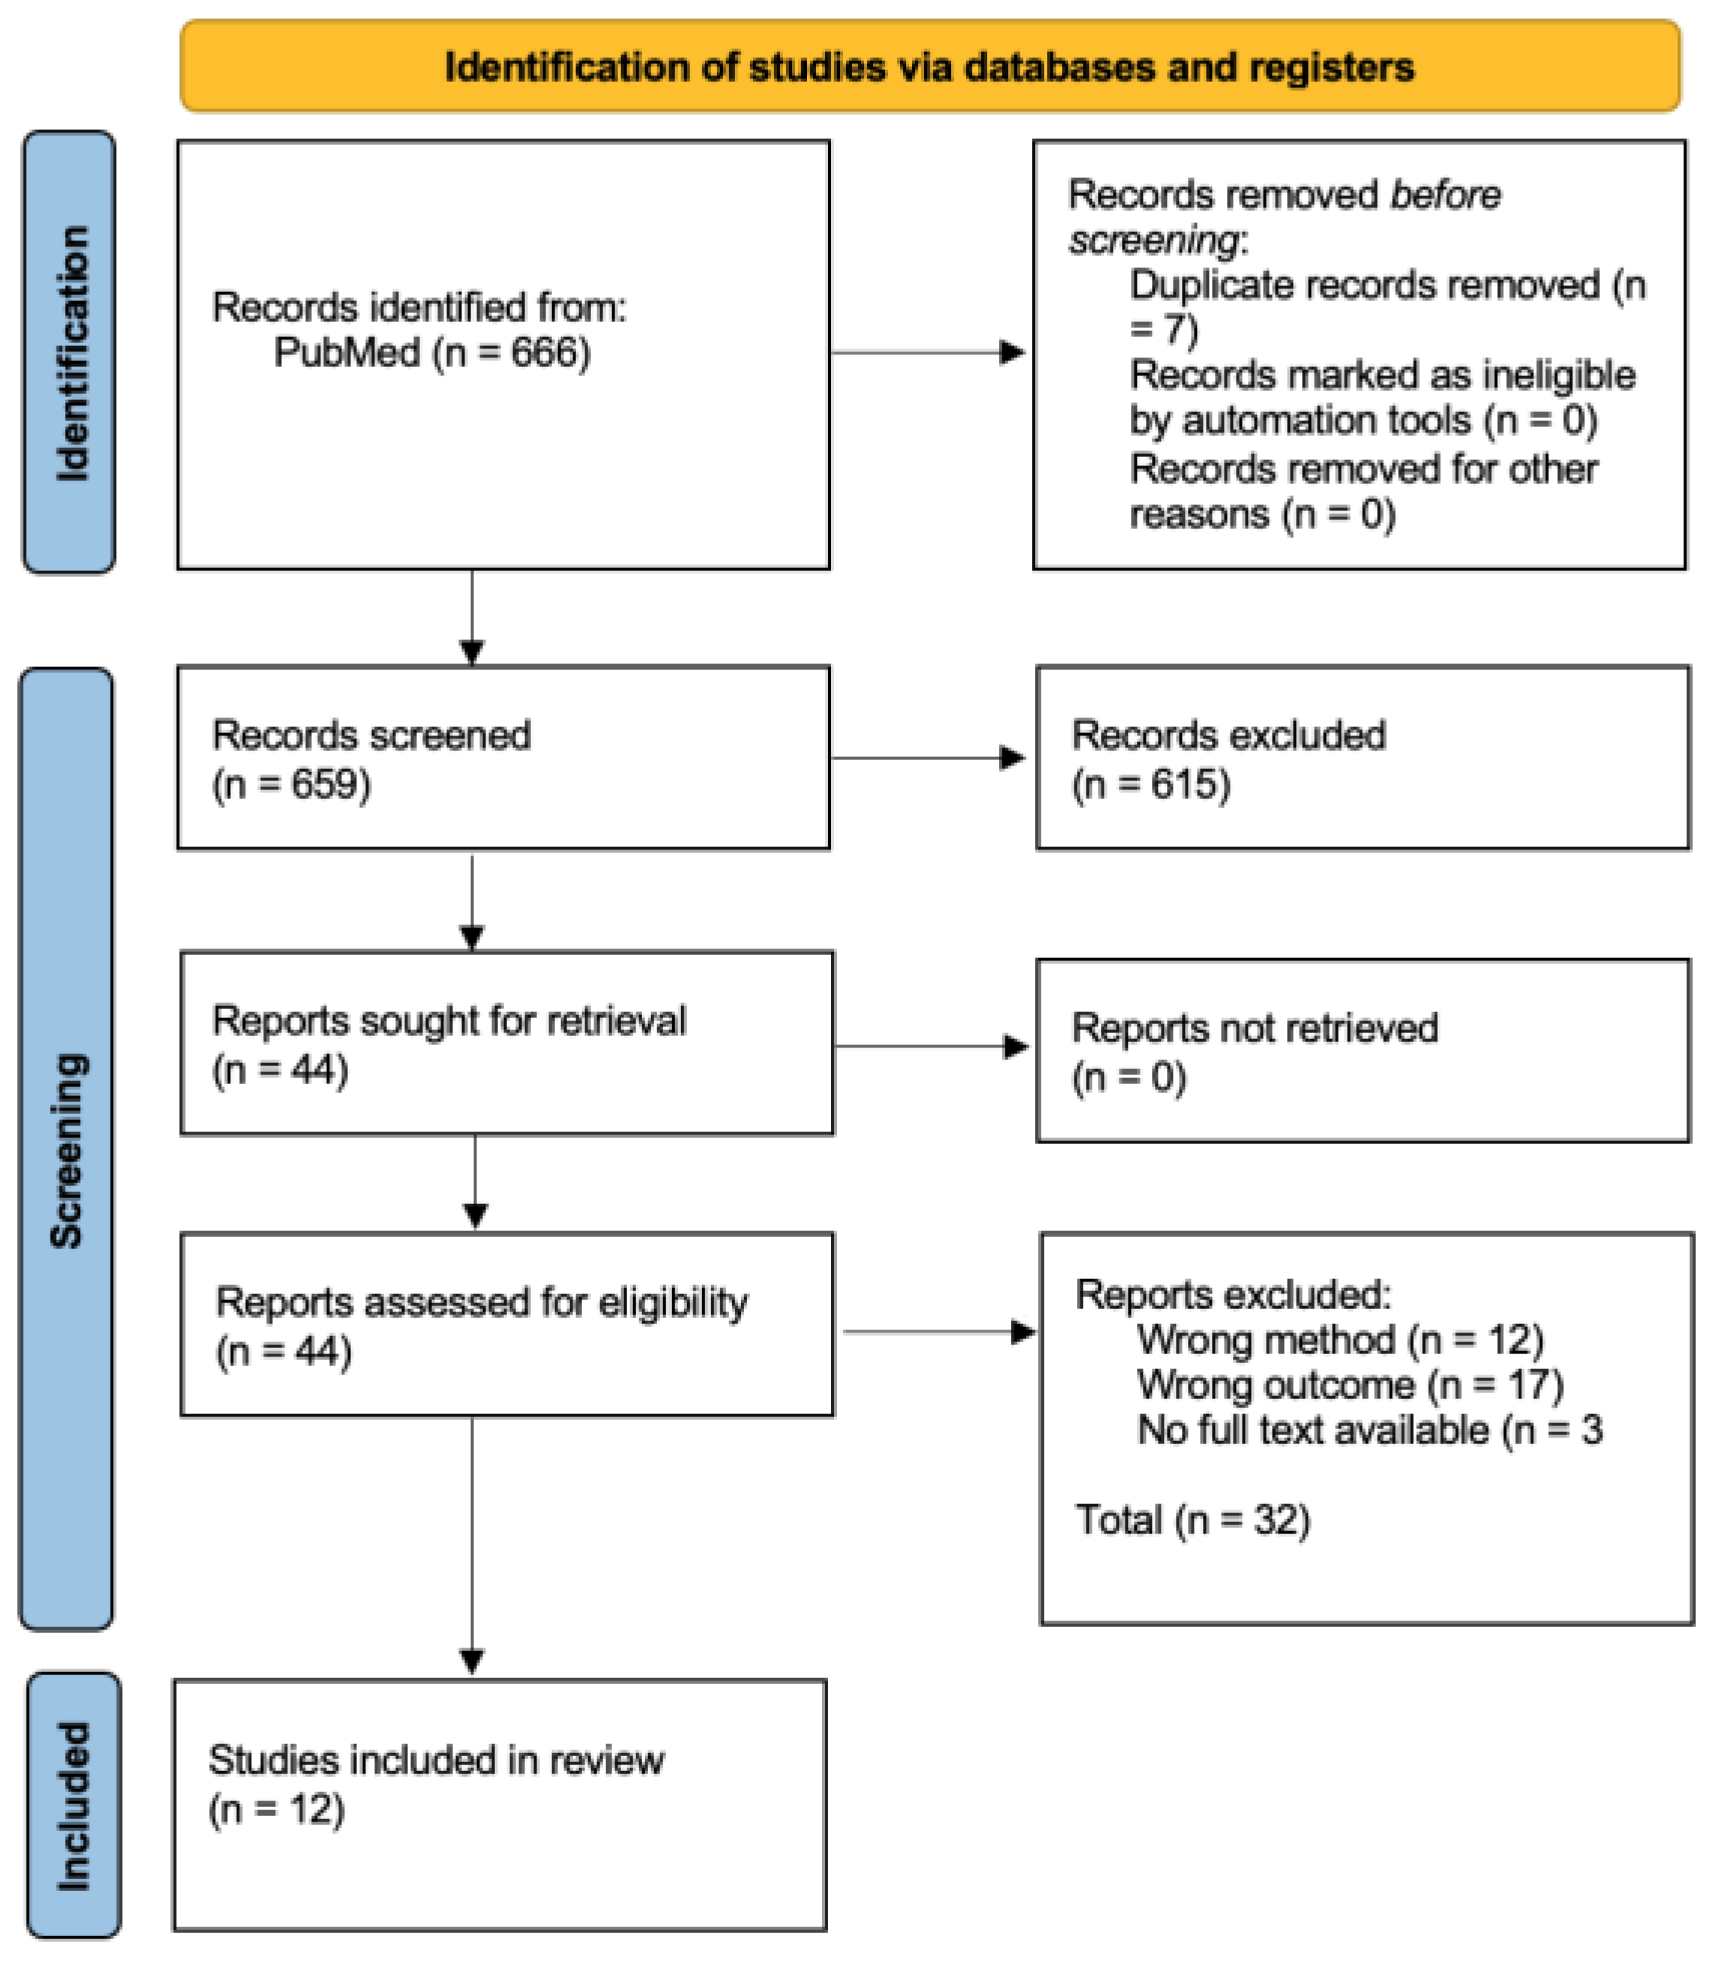
3.1. Search Results
3.2. Study Characteristics
3.3. Quality Assessment
3.4. Individual Results
3.4.1. Cardiovascular Surgery
3.4.2. Gastrointestinal Surgery
3.4.3. Urologic Surgery
4. Discussion
4.1. Summary of Results
4.1.1. Cardiovascular Surgery
4.1.2. Gastrointestinal Surgery
4.1.3. Urologic Surgery
4.2. Discussion
4.2.1. Limitations of Articles
4.2.2. Limitations Review
5. Conclusions
Author Contributions
Funding
Institutional Review Board Statement
Informed Consent Statement
Data Availability Statement
Conflicts of Interest
Appendix A

| Search | Entry Terms | Hits |
|---|---|---|
| #1 | myosteato*(tiab) | 327 results |
| #2 | intermuscular adipose tiss*(tiab) | 256 results |
| #3 | intramuscular adipose tiss*(tiab) | 322 results |
| #4 | intramyocellular lipid*(tiab) | 757 results |
| #5 | muscle fat(tiab) | 1499 results |
| #6 | fat accumulat*(tiab) | 7554 results |
| #7 | fat infiltrat*(tiab) | 1245 results |
| #8 | lipid* infiltration(tiab) | 6449 results |
| #9 | lipid infiltrat* (tiab) | 323 results |
| #10 | lipid accumulat* (tiab) | 14,908 results |
| #11 | lipid* accumulation(tiab) | 53,474 results |
| #12 | muscle ag*(tiab) | 646 results |
| #13 | myostatin(tiab) | 3277 results |
| #14 | muscle steatos*(tiab) | 18 results |
| #15 | reduced muscle radiodensit*(tiab) | 12 results |
| #16 | psoas muscle*(tiab) | 2976 results |
| #17 | low muscle attenuat*(tiab) | 19 results |
| #18 | intramuscular adiposit*(tiab) | 14 results |
| #19 | adipose tissue(MeSH Terms) | 109,024 results |
| #20 | lipids(MeSH Terms) | 1,260,023 results |
| #21 | adipocytes(MeSH Terms) | 26,152 results |
| #22 | myostatin(MeSH Terms) | 2200 results |
| #23 | psoas muscle(MeSH Terms) | 1985 results |
| #24 | psoas muscles(MeSH Terms) | 1985 results |
| #25 | #1 OR #2 OR #3 OR #4 OR #5 OR #6 OR #7 OR #8 OR #9 OR #10 OR #11 OR #12 OR #13 OR #14 OR #15 OR #16 OR #17 OR #18 OR #19 OR #20 OR #21 OR #22 OR #23 OR #24 | 1,400,834 results |
| #26 | postoperative complicat*(tiab) | 85,700 results |
| #27 | surgical outcome*(tiab) | 30,071 results |
| #28 | surgical*(tiab) | 1,189,693 results |
| #29 | mortality (tiab) | 948,429 results |
| #30 | adverse effect*(tiab) | 190,089 results |
| #31 | adverse event*(tiab) | 209,836 results |
| #32 | readmission*(tiab) | 40,448 results |
| #33 | infectious complicat*(tiab) | 14,991 results |
| #34 | postoperative morbidit*(tiab) | 13,221 results |
| #35 | postoperative period(MeSH Terms) | 61,408 results |
| #36 | postoperative periods(MeSH Terms) | 61,408 |
| #37 | postoperative complication(MeSH Terms) | 601,607 results |
| #38 | postoperative complications(MeSH Terms) | 601,607 results |
| #39 | postoperative care(MeSH Terms) | 60,743 results |
| #40 | mortality(MeSH Terms) | 421,276 results |
| #41 | #26 OR #27 OR #28 OR #29 OR #30 OR #31 OR #31 OR #32 OR #33 OR #34 OR #35 OR #36 OR #37 OR #38 OR #39 OR #40 | 2,392,845 results |
| #42 | CT*(tiab) | 415,646 results |
| #43 | Computed tomograph*(tiab) | 333,727 results |
| #44 | medical imag*(tiab) | 20,658 results |
| #45 | imag*(tiab) | 1,465,548 results |
| #46 | diagnostic imag*(tiab) | 21,172 results |
| #47 | computed tomography, x ray(MeSH Terms) | 483,482 results |
| #48 | computed tomography, xray(MeSH Terms) | 483,482 results |
| #49 | xray computed tomography(MeSH Terms) | 483,482 results |
| #50 | diagnostic imaging(MeSH Terms) | 2,874,928 |
| #51 | medical imaging(MeSH Terms) | 2,874,928 results |
| #52 | #42 OR #43 OR #44 OR #45 OR #46 OR #47 OR #48 OR #49 OR #50 OR #51 | 3,750,803 results |
| #53 | psoas muscle*(tiab) | 2976 results |
| #54 | psoas(tiab) | 6783 results |
| #55 | muscle, psoas(MeSH Terms) | 1985 results |
| #56 | psoas muscles(MeSH Terms) | 1985 results |
| #57 | #53 OR #54 OR #55 OR #56 | 7392 results |
| #58 | #25 AND #41 AND #52 AND #57 | 666 results |
Appendix B
| Author | Selection (4) | Comparability (2) | Outcome (3) | Total | |||||
|---|---|---|---|---|---|---|---|---|---|
| Representativeness of the Exposed Cohort (1) | Selection of the Non-Exposed Cohort (1) | Ascertainment of Exposure (1) | Demonstration That Outcome Was Not Present at Start of the Study (1) | Comparability of Cohorts Based on Design and/or Analyses * (2) | Assessment of Outcome (1) | Was the Follow-Up Long Enough for the Outcome to Occur (1) | Adequacy of Follow-Up (1) | ||
| Kärkkäinen (2020) [13] | 1 | 1 | 1 | 1 | 2 | 1 | 1 | 0 | 8 |
| Yamashita (2020) [14] | 1 | 1 | 1 | 1 | 2 | 1 | 1 | 0 | 8 |
| Kärkkäinen (2021) [15] | 1 | 1 | 1 | 1 | 2 | 1 | 1 | 0 | 8 |
| Lo (2018) [16] | 1 | 1 | 1 | 1 | 1 | 1 | 1 | 0 | 7 |
| Salem (2021) [17] | 1 | 1 | 1 | 1 | 2 | 1 | 1 | 0 | 8 |
| Miao (2022) [18] | 1 | 1 | 1 | 1 | 0 | 1 | 1 | 0 | 6 |
| Herrod (2019) [19] | 1 | 1 | 1 | 1 | 1 | 1 | 1 | 0 | 7 |
| Chakedis (2018) [20] | 1 | 1 | 1 | 1 | 1 | 1 | 1 | 0 | 7 |
| Wu (2022) [21] | 1 | 1 | 1 | 1 | 2 | 1 | 1 | 0 | 8 |
| Uyeda (2022) [22] | 1 | 1 | 1 | 1 | 2 | 1 | 1 | 0 | 8 |
| Buettner (2016) [23] | 1 | 1 | 1 | 1 | 2 | 1 | 1 | 0 | 8 |
| Yamashita (2020) [24] | 1 | 1 | 1 | 1 | 2 | 1 | 1 | 1 | 9 |
Appendix C
| Section/Topic | # | Checklist Item | Reported on Page # |
|---|---|---|---|
| Title | |||
| Title | 1 | Identify the report as a systematic review, meta-analysis, or both. | 1 |
| Abstract | |||
| Structured summary | 2 | Provide a structured summary including, as applicable: background; objectives; data sources; study eligibility criteria, participants, and interventions; study appraisal and synthesis methods; results; limitations; conclusions and implications of key findings; systematic review registration number. | 1 |
| Introduction | |||
| Rationale | 3 | Describe the rationale for the review in the context of what is already known. | 2 |
| Objectives | 4 | Provide an explicit statement of questions being addressed with reference to participants, interventions, comparisons, outcomes, and study design (PICOS). | 2 |
| Methods | |||
| Protocol and registration | 5 | Indicate if a review protocol exists, and if so, where it can be accessed (e.g., Web address), and, if available, provide registration information including registration number. | 2 |
| Eligibility criteria | 6 | Specify study characteristics (e.g., PICOS, length of follow-up) and report characteristics (e.g., years considered, language, publication status) used as criteria for eligibility, giving rationale. | 3 |
| Information sources | 7 | Describe all information sources (e.g., databases with dates of coverage, contact with study authors to identify additional studies) in the search and date last searched. | 2/3 |
| Search | 8 | Present full electronic search strategy for at least one database, including any limits used, such that it could be repeated. | Appendix A |
| Study selection | 9 | State the process for selecting studies (i.e., screening, eligibility, included in systematic review, and, if applicable, included in the meta-analysis). | 3 |
| Data collection process | 10 | Describe method of data extraction from reports (e.g., piloted forms, independently, in duplicate) and any processes for obtaining and confirming data from investigators. | 3 |
| Data items | 11 | List and define all variables for which data were sought (e.g., PICOS, funding sources) and any assumptions and simplifications made. | 3 and Appendix B |
| Risk of bias in individual studies | 12 | Describe methods used for assessing risk of bias of individual studies (including specification of whether this was done at the study or outcome level), and how this information is to be used in any data synthesis. | 3 |
| Summary measures | 13 | State the principal summary measures (e.g., risk ratio, difference in means). | 3 |
| Synthesis of results | 14 | Describe the methods of handling data and combining results of studies; if done, including measures of consistency (e.g., I2) for each meta-analysis. | 3 |
| Risk of bias across studies | 15 | Specify any assessment of risk of bias that may affect the cumulative evidence (e.g., publication bias, selective reporting within studies). | Not applicable |
| Additional analyses | 16 | Describe methods of additional analyses (e.g., sensitivity or subgroup analyses, meta-regression); if done, indicating which were pre-specified. | Not applicable |
| Results | |||
| Study selection | 17 | Give numbers of studies screened, assessed for eligibility, and included in the review, with reasons for exclusions at each stage, ideally with a flow diagram. | 3 |
| Study characteristics | 18 | For each study, present characteristics for which data were extracted (e.g., study size, PICOS, follow-up period) and provide the citations. | 4 |
| Risk of bias within studies | 19 | Present data on risk of bias of each study and, if available, any outcome level assessment (see item 12). | 8 |
| Results of individual studies | 20 | For all outcomes considered (benefits or harms), present, for each study: (a) simple summary of data for each intervention group; (b) effect estimates and confidence intervals, ideally with a forest plot. | 8/9 |
| Synthesis of results | 21 | Present results of each meta-analysis done, including confidence intervals and measures of consistency. | 10 |
| Risk of bias across studies | 22 | Present results of any assessment of risk of bias across studies (see Item 15). | Not applicable |
| Additional analysis | 23 | Give results of additional analyses, if done (e.g., sensitivity or subgroup analyses, meta-regression (see Item 16)). | Not applicable |
| Discussion | |||
| Summary of evidence | 24 | Summarize the main findings, including the strength of evidence for each main outcome; consider their relevance to key groups (e.g., healthcare providers, users, and policy makers). | 11 |
| Limitations | 25 | Discuss limitations at study and outcome levels (e.g., risk of bias), and at review level (e.g., incomplete retrieval of identified research, reporting bias). | 12 |
| Conclusions | 26 | Provide a general interpretation of the results in the context of other evidence, and implications for future research. | 12 |
| Funding | |||
| Funding | 27 | Describe sources of funding for the systematic review and other support (e.g., supply of data); role of funders for the systematic review. | Not applicable |
References
- Church, S.; Rogers, E.; Rockwood, K.; Theou, O. A scoping review of the Clinical Frailty Scale. BMC Geriatr. 2020, 20, 393. [Google Scholar] [CrossRef]
- Johnston, K.J.; Wen, H.; Joynt Maddox, K.E. Relationship of a Claims-Based Frailty Index to Annualized Medicare Costs: A Cohort Study. Ann. Intern. Med. 2020, 172, 533–540. [Google Scholar] [CrossRef] [PubMed]
- Huang, E.Y.-Z.; Lam, S.C. Review of frailty measurement of older people: Evaluation of the conceptualization, included domains, psychometric properties, and applicability. AGING Med. 2021, 4, 272–291. [Google Scholar] [CrossRef] [PubMed]
- Correa-De-Araujo, R.; Addison, O.; Miljkovic, I.; Goodpaster, B.H.; Bergman, B.C.; Clark, R.V.; Elena, J.W.; Esser, K.A.; Ferrucci, L.; Harris-Love, M.O.; et al. Myosteatosis in the Context of Skeletal Muscle Function Deficit: An Interdisciplinary Workshop at the National Institute on Aging. Front. Physiol. 2020, 11, 963. [Google Scholar] [CrossRef]
- Cruz-Jentoft, A.J.; Bahat, G.; Bauer, J.; Boirie, Y.; Bruyère, O.; Cederholm, T.; Cooper, C.; Landi, F.; Rolland, Y.; Sayer, A.A.; et al. Sarcopenia: Revised European consensus on definition and diagnosis. Age Ageing 2019, 48, 601. [Google Scholar] [CrossRef]
- Holt, D.Q.; Strauss, B.J.; Lau, K.K.; Moore, G.T. Body composition analysis using abdominal scans from routine clinical care in patients with crohn’s disease. Scand. J. Gastroenterol. 2016, 51, 842–847. [Google Scholar] [CrossRef]
- Broder, J.; Preston, R. Imaging the head and brain. In Diagnostic Imaging for the Emergency Physician; Elsevier: Amsterdam, The Netherlands, 2011; pp. 1–45. [Google Scholar] [CrossRef]
- Aleixo, G.F.P.; Shachar, S.S.; Nyrop, K.A.; Muss, H.B.; Malpica, L.; Williams, G.R. Myosteatosis and prognosis in cancer: Systematic review and meta-analysis. Crit. Rev. Oncol. Hematol. 2020, 145, 102839. [Google Scholar] [CrossRef]
- Alipour, O.; Lee, V.; Tejura, T.K.; Wilson, M.L.; Memel, Z.; Cho, J.; Cologne, K.; Hwang, C.; Shao, L. The assessment of sarcopenia using psoas muscle thickness per height is not predictive of post-operative complications in IBD. Scand. J. Gastroenterol. 2021, 56, 1175–1181. [Google Scholar] [CrossRef]
- Charest-Morin, R.; Street, J.; Zhang, H.; Roughead, T.; Ailon, T.; Boyd, M.; Dvorak, M.; Kwon, B.; Paquette, S.; Dea, N.; et al. Frailty and sarcopenia do not predict adverse events in an elderly population undergoing non-complex primary elective surgery for degenerative conditions of the lumbar spine. Spine J. 2018, 18, 245–254. [Google Scholar] [CrossRef] [PubMed]
- Prospero Database. Available online: https://www.crd.york.ac.uk/PROSPERO/ (accessed on 26 September 2023).
- Page, M.J.; McKenzie, J.E.; Bossuyt, P.M.; Boutron, I.; Hoffmann, T.C.; Mulrow, C.D.; Shamseer, L.; Tetzlaff, J.M.; Akl, E.A.; Brennan, S.E.; et al. The PRISMA 2020 statement: An updated guideline for reporting systematic reviews. BMJ 2021, 372, n71. [Google Scholar] [CrossRef]
- Kärkkäinen, J.M.; Tenorio, E.R.; Oksala, N.; Macedo, T.A.; Sen, I.; Mendes, B.C.; DeMartino, R.R.; Jacobs, M.J.; Mees, B. Pre-operative Psoas Muscle Size Combined with Radiodensity Predicts Mid-Term Survival and Quality of Life after Fenestrated-Branched Endovascular Aortic Repair. Eur. J. Vasc. Endovasc. Surg. 2020, 59, 31–39. [Google Scholar] [CrossRef] [PubMed]
- Yamashita, M.; Kamiya, K.; Matsunaga, A.; Kitamura, T.; Hamazaki, N.; Matsuzawa, R.; Nozaki, K.; Ichikawa, T.; Nakamura, T.; Yamamoto, S.; et al. Preoperative skeletal muscle density is associated with postoperative mortality in patients with cardiovascular disease. Interact. Cardiovasc. Thorac. Surg. 2020, 30, 515–522. [Google Scholar] [CrossRef]
- Kärkkäinen, J.M.; Oderich, G.S.; Tenorio, E.R.; Pather, K.; Oksala, N.; Macedo, T.A.; Vrtiska, T.; Mees, B.; Jacobs, M.J. Psoas muscle area and attenuation are highly predictive of complications and mortality after complex endovascular aortic repair. J. Vasc. Surg. 2021, 73, 1178–1188.e1. [Google Scholar] [CrossRef]
- Lo, W.D.; Evans, D.C.; Yoo, T. Computed Tomography-Measured Psoas Density Predicts Outcomes After Enterocutaneous Fistula Repair. JPEN J. Parenter. Enteral. Nutr. 2018, 42, 176–185. [Google Scholar] [CrossRef]
- Abu Salem, S.; Almogy, G.; Lev-Cohain, N.; Bala, M.; Cohen, N.; Issachar, O.; Pikarsky, A.J.; Yuval, J.B. Psoas Attenuation and Mortality of Elderly Patients Undergoing Nontraumatic Emergency Laparotomy. J. Surg. Res. 2021, 257, 252–259. [Google Scholar] [CrossRef]
- Miao, S.-L.; Ye, X.-N.; Lin, T.-T.; Qiu, Y.-H.; Huang, J.-Y.; Zheng, X.-W.; Chen, F.-F. The psoas muscle density as a predictor of postoperative complications and 30-day mortality for acute mesenteric ischemia patients. Abdom. Radiol. 2022, 47, 1644–1653. [Google Scholar] [CrossRef]
- Herrod, P.J.J.; Boyd-Carson, H.; Doleman, B.; Trotter, J.; Schlichtemeier, S.; Sathanapally, G.; Somerville, J.; Williams, J.P.; Lund, J.N. Quick and simple; psoas density measurement is an independent predictor of anastomotic leak and other complications after colorectal resection. Technol. Coloproctol. 2019, 23, 129–134. [Google Scholar] [CrossRef]
- Chakedis, J.; Spolverato, G.; Beal, E.W.; Woelfel, I.; Bagante, F.; Merath, K.; Sun, S.H.; Chafitz, A.; Galo, J.; Dillhoff, M.; et al. Pre-operative Sarcopenia Identifies Patients at Risk for Poor Survival After Resection of Biliary Tract Cancers. J. Gastrointest. Surg.Off. J. Soc. Surg. Aliment. Tract. 2018, 22, 1697–1708. [Google Scholar] [CrossRef] [PubMed]
- Wu, X.L.; Shen, J.; Danzeng, C.D.; Xu, X.S.; Cao, Z.X.; Jiang, W. CT psoas calculations on the prognosis prediction of emergency laparotomy: A single-center, retrospective cohort study in eastern Asian population. World J. Emerg. Surg.WJES 2022, 17, 31. [Google Scholar] [CrossRef] [PubMed]
- Uyeda, J.W.; Sodickson, A.D.; Castillo-Angeles, M.; Rangel, E.L. Psoas attenuation and cross-sectional area improve performance of traditional sarcopenia measurements in predicting one-year mortality among elderly patients undergoing emergency abdominal surgery: A pilot study of five computed tomography techniques. Abdom. Radiol. 2022, 48, 796–805. [Google Scholar] [CrossRef]
- Buettner, S.; Wagner, D.; Kim, Y.; Margonis, G.A.; Makary, M.A.; Wilson, A.; Sasaki, K.; Amini, N.; Gani, F.; Pawlik, T.M. Inclusion of Sarcopenia Outperforms the Modified Frailty Index in Predicting 1-Year Mortality among 1,326 Patients Undergoing Gastrointestinal Surgery for a Malignant Indication. J. Am. Coll. Surg. 2016, 222, 397–407.e2. [Google Scholar] [CrossRef] [PubMed]
- Yamashita, S.; Iwahashi, Y.; Miyai, H.; Iguchi, T.; Koike, H.; Nishizawa, S.; Matsumura, N.; Hagino, K.; Kikkawa, K.; Kohjimoto, Y.; et al. Myosteatosis as a novel prognostic biomarker after radical cystectomy for bladder cancer. Sci. Rep. 2020, 10, 22146. [Google Scholar] [CrossRef] [PubMed]
- Boutin, R.D.; Yao, L.; Canter, R.J.; Lenchik, L. Sarcopenia: Current Concepts and Imaging Implications. AJR Am. J. Roentgenol. 2015, 205, W255–W266. [Google Scholar] [CrossRef] [PubMed]
- Lee, J.B.; Alfonso, A.R.B.; Kantar, R.S.; Diep, G.K.; Berman, Z.P.; Ramly, E.P.; Daar, D.A.M.; Levine, J.P.; Ceradini, D.J. Modified Frailty Index Predicts Postoperative Complications following Panniculectomy in the Elderly. Plast. Reconstr. Surg.–Glob. Open 2020, 8, e2987. [Google Scholar]
- Glasheen, W.P.; Cordier, T.; Gumpina, R.; Haugh, G.; Davis, J.; Renda, A. Charlson Comorbidity Index: ICD-9 Update and ICD-10 Translation. Am. Health Drug Benefits 2019, 12, 188–197. [Google Scholar]

| Author | Study Size (M/F) | Objective | Type of Intervention | Mortality | Data Sources | Method for Determining Cut-Off Value for High and Low Psoas Muscle Density |
|---|---|---|---|---|---|---|
| Kärkkäinen (2020) [13] | 244 (172/72) | To investigate the association between psoas muscle area (PMA) and density (PMD) with survival and quality of life (QoL) after fenestrated branched endovascular aortic repair (F-BEVAR). | Fenestrated branched endovascular aortic repair (F-BEVAR) | 30-day, 90-day | Patients undergoing F-BEVAR operation between November 2013 and March 2018. | Cox regression hazard ratio models with splines for association with time-dependent mortality |
| Yamashita (2020) [14] | 1068 (679/389) | To determine the preoperative SMD cut-off using the psoas muscle and to investigate the effect on postoperative outcomes, including sarcopenia, in cardiovascular patients. | Coronary artery bypass grafting, valve, aorta, congenital, tumour/thrombus, multiple, other | 5-year | Patients who underwent cardiovascular surgery and participated in cardiac rehabilitation at least once between 1 January 2008 and 31 December 2017. | Youden index |
| Kärkkäinen (2021) [15] | 504 (371/133) | To evaluate the psoas muscle area and attenuation (radiodensity), quantified by computed tomography, together with clinical risk assessment, as predictors of outcomes after fenestrated branched endovascular aortic repair (F-BEVAR). | Fenestrated branched endovascular aortic repair (F-BEVAR) | 30-day, 3-year | Patients who had undergone elective F-BEVAR for pararenal or thoracoabdominal aortic aneurysms. | Cox regression hazard ratio models with splines for association with time-dependent mortality |
| Lo (2018) [16] | 100 (46/54) | To evaluate CT-based psoas muscle density as a prognostic marker for poor outcomes after ECF repair. | Enterocutaneous fistula repair (ECF) | 90-day, 1-year, 3-year | Patients who, between 2005 and 2015, underwent ECF repair comprising laparotomy, en bloc overlying of skin with bowel resection and anastomosis that had a CT scan of abdomen/pelvis with venous contrast within three months before operative repair. | 25th percentile (IQR1) |
| Salem (2021) [17] | 383 (122/161) | The hypothesis was that in elderly patients undergoing EL, these easily measured sarcopenia parameters are independent risk factors of mortality and poor postoperative course. | Peritonitis, hernia, obstruction, ischemia, perforation, other indication | 30-day | Patients aged >65 yr who were admitted to the emergency department and required emergency laparotomies between 2006 and 2011. | 25th percentile (IQR1) |
| Miao (2022) [18] | 88 (75/13) | To investigate the association between PMD and short-term postoperative outcomes in patients with acute mesenteric ischemia (AMI). | Revascularisation with or without resection of the mesentery | 30-day | Patients who underwent surgical intervention by revascularization with or without resection and had abdominal non-contrast CT scans before surgery. | 25th percentile (IQR1) |
| Herrod (2019) [19] | 169 (91/78) | To assess the association between radiologically defined sarcopenia measured by psoas density and postoperative outcomes in patients having a colorectal cancer resection. | Colorectal cancer resection, anterior resection, right hemicolectomy, abdominoperineal excision of rectum, extended right hemicolectomy, subtotal/pan proctocolectomy, Hartmann’s resection | 90-day, 1-year | Patients having a resection for colorectal cancer, discussed by the colorectal multi-disciplinary team in one institution in 2015. | Receiver–operator curve (ROC) |
| Chakedis (2018) [20] | 117 (52/65) | To define the impact of sarcopenia on survival among patients undergoing resection of BTC. | Laparoscopy/laparotomy, pancreaticoduodenectomy, partial hepatectomy, R hepatectomy +/1 bile duct, L hepatectomy +/- bile duct, radical cholecystectomy, extrahepatic BD resection, cholecystectomy | 30-day, 1-year | Patients who underwent exploration for BTC who had a preoperative CT scan available for review were identified between 2007 and 2016. | Log rank statistics and ROC |
| Wu (2022) [21] | 228 (138/90) | To verify the universality of the conclusion that sarcopenia affected the prognosis of emergency laparotomy in a different population setting. | Perforation repairment, appendectomy, adhesiolysis, exploratory, abdominal hernia, reduction of volvulus, drainage of abscess, small bowel resection, colon colostomy, right colectomy, left colectomy, other colorectal resection, Harmann’s, removal of foreign body, other tumour resection, gastrectomy, enterostomy, resection of Meckel’s diverticulum | 30-day | Patients who underwent emergency laparotomy from 1 September 2019 to 31 August 2021. | Not clearly defined in article |
| Uyeda (2022) [22] | 297 (127/170) | To describe five different CT methods of measuring sarcopenia and muscle quality and to determine which method has the greatest sensitivity for predicting 1-year mortality following emergency abdominal surgery in elderly patients. | Gastrointestinal resection, cholecystectomy, hernia repair, laparotomy with adhesiolysis only, appendectomy, palliative stoma for malignance, repair of perforated peptic ulcers, intestinal bypass for malignancy, mesenteric revascularization | 30-day, 60-day, 90-day, 1-year | Patients 70 years and older who underwent ‘urgent’ or ‘emergent’ laparotomy or laparoscopy for acute abdominal disease between 2006 and 2011. | 25th percentile (IQR1) |
| Buettner (2016) [23] | 1326 (730/596) | To develop a preoperative frailty-risk model combining sarcopenia with clinical parameters to predict 1-year mortality using a cohort of patients undergoing gastrointestinal cancer surgery. | Hepatectomy, pancreatectomy, colorectal resection | 1-year | Patients undergoing hepatobiliary, pancreatic, or colorectal surgery between 2011 and 2014. | Sensitivity analysis |
| Yamashita (2020) [24] | 230 (184/46) | This study aimed to evaluate the influence of myosteatosis on survival of patients after radical cystectomy (RC) for bladder cancer. | Open/laparoscopic/robotic approach, with either ileal conduit or cutaneous ureterostomy | 2-year | Patients who underwent RC for bladder cancer at our three institutions between 2009 and 2018 | Median of average total psoas density |
| Author | Selection (4) | Comparability (2) | Outcome (3) | Total (9) |
|---|---|---|---|---|
| Kärkkäinen (2020) [13] | 4 | 2 | 2 | 8 |
| Yamashita (2020) [14] | 4 | 2 | 2 | 8 |
| Kärkkäinen (2021) [15] | 4 | 2 | 2 | 8 |
| Lo (2018) [16] | 4 | 1 | 2 | 7 |
| Salem (2021) [17] | 4 | 2 | 2 | 8 |
| Miao (2022) [18] | 4 | 1 | 2 | 7 |
| Herrod (2019) [19] | 4 | 1 | 2 | 7 |
| Chakedis (2018) [20] | 4 | 1 | 2 | 7 |
| Wu (2022) [21] | 4 | 2 | 2 | 8 |
| Uyeda (2022) [22] | 4 | 2 | 2 | 8 |
| Buettner (2016) [23] | 4 | 2 | 2 | 8 |
| Yamashita (2020) [24] | 4 | 2 | 3 | 9 |
| Author | Cut-Off Point (HU) | Number of Patients | HR (CI 95%) | Likelihood Ratio | ||||||||||||
|---|---|---|---|---|---|---|---|---|---|---|---|---|---|---|---|---|
| Low | Medium | High | Total (M/F) | Low HU | Medium HU | High HU | 30 Days | 90 Days | 1 Year | 3 Years | 5 Years | p-Value | 1 Year | 3 Years | p-Value | |
| Kärkkäinen (2020) [13] | <200 * | 200–350 * | >350 * | 504 (371/133) | 33 | 181 | 290 | - | 0.994 (0.990–0.998) | - | - | - | 0.003 | - | - | - |
| Yamashita (2020) [14] | <45 | - | ≥45 | 1068 (679/389) | 551 | - | 517 | - | - | - | - | 2.42 (1.32–4.45) | 0.004 | - | - | - |
| Kärkkäinen (2021) [15] | ≤350 * | - | >350 * | 224 (172/72) | 165 | - | 79 | - | - | - | 0.998 (0.997–0.999) | - | 0.001 | - | - | - |
| Lo (2018) [16] | ≤32.6 | - | >32.6 | 100 (46/54) | 25 | - | 75 | - | - | - | - | - | - | 7.79 (1.57–38.57) | 22.37 (3.07–162.95) | 0.01/ <0.01 |
| Salem (2021) [17] | ≤35.5 | - | >35.5 | 283 (122/161) | 73 | - | 210 | 2.35 (1.16–4.76) | - | - | - | - | 0.017 | - | - | - |
| Miao (2022) [18] | ≤40.5(M) /28.4(F) | - | >40.5 (M)/28.4 (F) | 88 (75/13) | 21 | - | 67 | 10.667 (2.450–46.436) | - | - | - | - | 0.002 | - | - | - |
| Herrod (2019) [19] | ≤44.5 | - | >44.5 | 169 (91/78) | 51 | - | 118 | - | - | 1.73 (0.47–6.3) | - | - | 0.406 | - | - | - |
| Chakedis (2018) [20] | ≤38 | - | >38 | 117 (52/65) | - | - | - | - | - | - | - | 2.96 (1.21–7.21) | 0.017 | - | - | - |
| Wu (2022) [21] | ≤34.9(M)/27.8(F) | - | >34.9 (M) /27.8 (F) | 228 (138/90) | 56 | - | 171 | 2.256 (0.885–5.748) | - | - | - | - | 0.088 | - | - | - |
| Uyeda (2022) [22] | ≤23.9(M)/26.6(F) | - | >23.9 (M)/26.6(F) | 297 (127/170) | 75 | - | 222 | 2.7 (1.3–5.4) | 2.4 (1.4–4.2) | 2.1 (1.3–3.3) | - | - | 0.006/0.003/0.001 | - | - | - |
| Buettner (2016) [23] | ≤39.9(M)/38.1(F) | - | >39.9 (M)/38.1(F) | 1326 (730/596) | 398 | - | 928 | - | - | 1.98 (1.36–2.88) | - | - | <0.001 | - | - | - |
| Yamashita (2020) [24] | <44 | - | ≥44 | 230 (184/46) | 67 | - | 163 | - | - | 0.98 ** (0.95–1.00) | - | - | 0.18 | - | - | - |
| Study | Study Size | Hazard Ratio (95% CI) | Weight (%) | HR (95% CI) | ||
| Miao (2022) [18] | 88 |  | 9.82 | 10.667 (2.450–46.436) | ||
| Uyeda (2022) [22] | 297 | 33.15 | 2.7 (1.3–5.4) | |||
| Salem (2021) [17] | 283 | 31.58 | 2.35 (1.16–4.76) | |||
| Wu (2022) [21] | 228 | 25.45 | 2.256 (0.885–5.748) | |||
| Overall effect | 896 | 100 | 3.148 (1.245–9.020) | |||
| Study | Study Size | Hazard Ratio (95% CI) | Weight (%) | HR (95% CI) | |
| Uyeda (2022) [22] | 297 |  | 16.57 | 2.1 (1.3–3.3) | |
| Buettner (2016) [23] | 1326 | 74.0 | 1.98 (1.36–2.88) | ||
| Herrod (2019) [19] | 169 | 9.43 | 1.73 (0.47–6.30) | ||
| Overall effect | 1792 | 100 | 1.977 (1.266–3.254) | ||
Disclaimer/Publisher’s Note: The statements, opinions and data contained in all publications are solely those of the individual author(s) and contributor(s) and not of MDPI and/or the editor(s). MDPI and/or the editor(s) disclaim responsibility for any injury to people or property resulting from any ideas, methods, instructions or products referred to in the content. |
© 2023 by the authors. Licensee MDPI, Basel, Switzerland. This article is an open access article distributed under the terms and conditions of the Creative Commons Attribution (CC BY) license (https://creativecommons.org/licenses/by/4.0/).
Share and Cite
den Os, O.E.; Nielen, R.; Bidar, E. Myosteatosis as a Prognostic Marker for Postoperative Mortality in Adult Patients Undergoing Surgery in General—A Systematic Review. Surgeries 2023, 4, 647-664. https://doi.org/10.3390/surgeries4040062
den Os OE, Nielen R, Bidar E. Myosteatosis as a Prognostic Marker for Postoperative Mortality in Adult Patients Undergoing Surgery in General—A Systematic Review. Surgeries. 2023; 4(4):647-664. https://doi.org/10.3390/surgeries4040062
Chicago/Turabian Styleden Os, Onno Emanuel, Rosalie Nielen, and Elham Bidar. 2023. "Myosteatosis as a Prognostic Marker for Postoperative Mortality in Adult Patients Undergoing Surgery in General—A Systematic Review" Surgeries 4, no. 4: 647-664. https://doi.org/10.3390/surgeries4040062