
Exploring Spinal Cord Changes in Multiple Sclerosis Patients Using MRI
 ,
,
Abstract
:1. Introduction
2. Materials and Methods
Statistical Analysis
3. Results
4. Discussion
5. Conclusions
Author Contributions
Funding
Institutional Review Board Statement
Informed Consent Statement
Data Availability Statement
Acknowledgments
Conflicts of Interest
References
- Wildner, P.; Stasiołek, M.; Matysiak, M. Differential diagnosis of multiple sclerosis and other inflammatory CNS diseases. Mult. Scler. Relat. Disord. 2020, 37, 101452. [Google Scholar] [CrossRef]
- Dargahi, N.; Katsara, M.; Tselios, T.; Androutsou, M.E.; de Courten, M.; Matsoukas, J.; Apostolopoulos, V. Multiple Sclerosis: Immunopathology and Treatment Update. Brain Sci. 2017, 7, 78. [Google Scholar] [CrossRef]
- Antel, J.; Antel, S.; Caramanos, Z.; Arnold, D.L.; Kuhlmann, T. Primary progressive multiple sclerosis: Part of the MS disease spectrum or separate disease entity? Acta Neuropathol. 2012, 123, 627–638. [Google Scholar] [CrossRef] [PubMed]
- Tafti, D.; Ehsan, M. Multiple Sclerosis. StatPearls, 2022. WHAT IS MS? National MS Society: New York, NY, USA, 2023. [Google Scholar]
- Oh, J.; Vidal-Jordana, A.; Montalban, X. Multiple sclerosis: Clinical aspects. Curr. Opin. Neurol. 2018, 31, 752–759. [Google Scholar] [CrossRef] [PubMed]
- Oudejans, E.; Luchicchi, A.; Strijbis, E.M.M.; Geurts, J.J.G.; van Dam, A.M. Is MS affecting the CNS only? Lessons from clinic to myelin pathophysiology. Neurol. Neuroimmunol. Neuroinflammation 2020, 8, e914. [Google Scholar] [CrossRef] [PubMed]
- Traboulsee, A.L.; Li, D.K. The role of MRI in the diagnosis of multiple sclerosis. Adv. Neurol. 2006, 98, 125–146. [Google Scholar] [PubMed]
- Hemond, C.C.; Bakshi, R. Magnetic Resonance Imaging in Multiple Sclerosis. Cold Spring Harb. Perspect. Med. 2018, 8, a028969. [Google Scholar] [CrossRef] [PubMed]
- Wattjes, M.P.; Lutterbey, G.G.; Harzheim, M.; Gieseke, J.; Träber, F.; Klotz, L.; Klockgether, T.; Schild, H.H. Higher sensitivity in the detection of inflammatory brain lesions in patients with clinically isolated syndromes suggestive of multiple sclerosis using high field MRI: An intraindividual comparison of 1.5 T with 3.0 T. Eur. Radiol. 2006, 16, 2067–2073. [Google Scholar] [CrossRef] [PubMed]
- Wattjes, M.P.; Steenwijk, M.D.; Stangel, M. MRI in the Diagnosis and Monitoring of Multiple Sclerosis: An Update. Clin. Neuroradiol. 2015, 25 (Suppl. S2), 157–165. [Google Scholar] [CrossRef]
- Fillippi, M.; Preziosa, P.; Arnold, D.L.; Barkhof, F.; Harrison, D.M.; Maggi, P.; Mainero, C.; Montalban, X.; Sechi, E.; Weinshenker, B.G.; et al. Present and future of the diagnostic work-up of multiple sclerosis: The imaging perspective. J. Neurol. 2023, 270, 1286–1299. [Google Scholar] [CrossRef]
- Wattjes, M.P.; Harzheim, M.; Lutterbey, G.G.; Hojati, F.; Simon, B.; Schmidt, S.; Schild, H.H.; Barkhof, F. Does high field MRI allow an earlier diagnosis of multiple sclerosis? J. Neurol. 2008, 255, 1159–1163. [Google Scholar] [CrossRef]
- Nathoo, N.; Zeydan, B.; Neyal, N.; Chelf, C.; Okuda, D.T.; Kantarci, O.H. Do magnetic resonance imaging features differ between persons with multiple sclerosis of various races and ethnicities? Front. Neurol. 2023, 14, 1215774. [Google Scholar] [CrossRef]
- Alluqmani, M.; Roda, W.; Qqrmli, M.; Blevins, G.; Giuliani, F.; Power, C. Differential disease phenotypes and progression in relapsing-remitting multiple sclerosis: Comparative analyses of single Canadian and Saudi Arabian clinics. BMC Neurol. 2021, 21, 295. [Google Scholar] [CrossRef]
- Kaunzner, U.W.; Gauthier, S.A. MRI in the assessment and monitoring of multiple sclerosis: An update on best practice. Ther. Adv. Neurol. Disord. 2017, 10, 247–261. [Google Scholar] [CrossRef]
- Chu, R.; Tauhid, S.; Glanz, B.I.; Healy, B.C.; Kim, G.; Oommen, V.V.; Khalid, F.; Neema, M.; Bakshi, R. Whole Brain Volume Measured from 1.5T versus 3T MRI in Healthy Subjects and Patients with Multiple Sclerosis. J. Neuroimaging 2016, 26, 62–67. [Google Scholar] [CrossRef]
- Akhtar, N.; Elsetouhy, A.; Deleu, D.; Kamran, S.; AlHail, H.; Elalamy, O.; Mesraoua, B.; Sokrab, T.; Kamil, H.; Melikyan, G.; et al. Newly diagnosed multiple sclerosis in state of Qatar. Clin. Neurol. Neurosurg. 2013, 115, 1333–1337. [Google Scholar] [CrossRef]
- Al-Abdullah, M.S.; Siddiqui, A.F. Demographic and disease characteristics of multiple sclerosis in the Southwest Region of Saudi Arabia. Neurosciences 2018, 23, 320–325. [Google Scholar] [CrossRef] [PubMed]
- Heydarpour, P.; Khoshkish, S.; Abtahi, S.; Moradi-Lakeh, M.; Sahraian, M.A. Multiple sclerosis epidemiology in Middle East and North Africa: A systematic review and meta-analysis. Neuroepidemiology 2015, 44, 232–244. [Google Scholar] [CrossRef] [PubMed]
- AlJumah, M.; Bunyan, R.; Al Otaibi, H.; Al Towaijri, G.; Karim, A.; Al Malik, Y.; Kalakatawi, M.; Alrajeh, S.; Al Mejally, M.; Algahtani, H.; et al. Rising prevalence of multiple sclerosis in Saudi Arabia, a descriptive study. BMC Neurol. 2020, 20, 49. [Google Scholar] [CrossRef] [PubMed]
- Ismail, M.A.; Elsayed, N.M. Diffusion-Weighted Images and Contrast-Enhanced MRI in the Diagnosis of Different Stages of Multiple Sclerosis of the Central Nervous System. Cureus 2023, 15, e41650. [Google Scholar] [CrossRef] [PubMed]
- Wandall-Holm, M.F.; Andersen, M.A.; Buron, M.D.; Magyari, M. Aging with Multiple Sclerosis: Age-Related Factors and Socioeconomic Risks. Front. Neurol. 2022, 13, 818652. [Google Scholar] [CrossRef]
- Igra, M.S.; Paling, D.; Wattjes, M.P.; Connolly, D.J.; Hoggard, N. Multiple sclerosis update: Use of MRI for early diagnosis, disease monitoring and assessment of treatment related complications. Br. J. Radiol. 2017, 90, 20160721. [Google Scholar] [CrossRef]
- Zivadinov, R.; Bergsland, N. Cervical Spinal Cord Lesions and Atrophy versus Brain Measures in Explaining Physical Disability in Multiple Sclerosis. Rnsa 2020, 296, 616–618. [Google Scholar] [CrossRef] [PubMed]
- Kearney, H.; Miller, D.; Ciccarelli, O. Spinal cord MRI in multiple sclerosis—Diagnostic, prognostic and clinical value. Nat. Rev. Neurol. 2015, 11, 327–338. [Google Scholar] [CrossRef] [PubMed]
- Moccia, M.; Ruggieri, S.; Ianniello, A.; Toosy, A.; Pozzilli, C.; Ciccarelli, O. Advances in spinal cord imaging in multiple sclerosis. Ther. Adv. Neurol. Disord. 2019, 12, 1756286419840593. [Google Scholar] [CrossRef] [PubMed]
- Fernandez, O.; Costa-Frossard, L.; Martínez-Ginés, M.L.; Montero, P.; Prieto-González, J.M.; Ramió-Torrentà, L. Integrated Management of Multiple Sclerosis Spasticity and Associated Symptoms Using the Spasticity-Plus Syndrome Concept: Results of a Structured Specialists’ Discussion Using the Workmat® Methodology. Front. Neurol. 2021, 12, 722801. [Google Scholar] [CrossRef]
- Omid-Fard, N.; Thornhill, R.E.; Torres, C.; Almansoori, T.M.; Rush, C.A.E.; Glikstein, R. MRI Markers of Degenerative Disc Disease in Young Patients with Multiple Sclerosis. Can. Assoc. Radiol. J. 2023, 75, 136–142. [Google Scholar] [CrossRef]
- Simon, J.H.; Li, D.; Traboulsee, A.; Coyle, P.K.; Arnold, D.L.; Barkhof, F.; Frank, J.A.; Grossman, R.; Paty, D.W.; Radue, E.W.; et al. Standardized MR imaging protocol for multiple sclerosis: Consortium of MS centers consensus guidelines. Am. J. Neuroradiol. 2006, 27, 455–461. [Google Scholar] [PubMed]
- Chhugani, S.; Agarwal, N.; Sheikh, F.; Borca, F.; Spanoulis, A.; Galea, I. Cervical spinal degenerative disease in multiple sclerosis. Eur. J. Neurol. 2021, 28, 2497–2502. [Google Scholar] [CrossRef]
- Drenska, K.V.; Kaprelyan, A.G.; Tzoukeva, A.J. Simultaneous disc herniation in patients with multiple sclerosis. J. IMAB 2013, 19, 399–401. [Google Scholar] [CrossRef]
- Teraguchi, M.; Yoshimura, N.; Hashizume, H.; Muraki, S.; Yamada, H.; Minamide, A.; Oka, H.; Ishimoto, Y.; Nagata, K.; Kagotani, R.; et al. Prevalence and distribution of intervertebral disc degeneration over the entire spine in a population-based cohort: The Wakayama Spine Study. Osteoarthr. Cartil. 2014, 22, 104–110. [Google Scholar] [CrossRef] [PubMed]
- Casserly, C.; Seyman, E.E.; Alcaide-Leon, P.; Guenette, M.; Lyons, C.; Sankar, S.; Svendrovski, A.; Baral, S.; Oh, J. Spinal Cord Atrophy in Multiple Sclerosis: A Systematic Review and Meta-Analysis. J. Neuroimaging 2018, 28, 556–586. [Google Scholar] [CrossRef] [PubMed]
- Abdel-Aziz, K.; Ciccarelli, O. Quantitative MRI of the Spinal Cord; ScienceDirect: Amsterdam, The Netherlands, 2014. [Google Scholar]
- Bischof, A.; Papinutto, N.; Rajesh, A.; Kirkish, G.; Zhang, X.; Mallott, J.M.; Asteggiano, C.; Sacco, S.; Gundel, T.J.; Zhao, C.; et al. Spinal Cord Atrophy Predicts Progressive Disease in Relapsing Multiple Sclerosis. Ann. Neurol. 2022, 91, 268–281. [Google Scholar] [CrossRef] [PubMed]
- Bianco, A.; Antonacci, Y.; Liguori, M. Sex and Gender Differences in Neurodegenerative Diseases: Challenges for Therapeutic Opportunities. Int. J. Mol. Sci. 2023, 24, 6354. [Google Scholar] [CrossRef]
- Xydis, V.G.; Zikou, A.K.; Kostadima, V.; Astrakas, L.G.; Kosta, P.; Argyropoulou, M.I. The association between multiple sclerosis and spondylosis: When and why. Eur. J. Radiol. 2017, 91, 47–51. [Google Scholar] [CrossRef]
- Feasby, T.E.; Paty, D.W. Spinal cord swelling in multiple sclerosis. Can. J. Neurol. Sci. 1981, 8, 151–153. [Google Scholar] [CrossRef]
- Hagens, M.H.J.; Burggraaff, J.; Kilsdonk, I.D.; de Vos, M.L.; Cawley, N.; Sbardella, E.; Andelova, M.; Amann, M.; Lieb, J.M.; Pantano, P.; et al. Three-Tesla MRI does not improve the diagnosis of multiple sclerosis: A multicenter study. Neurology 2018, 91, e249–e257. [Google Scholar] [CrossRef]


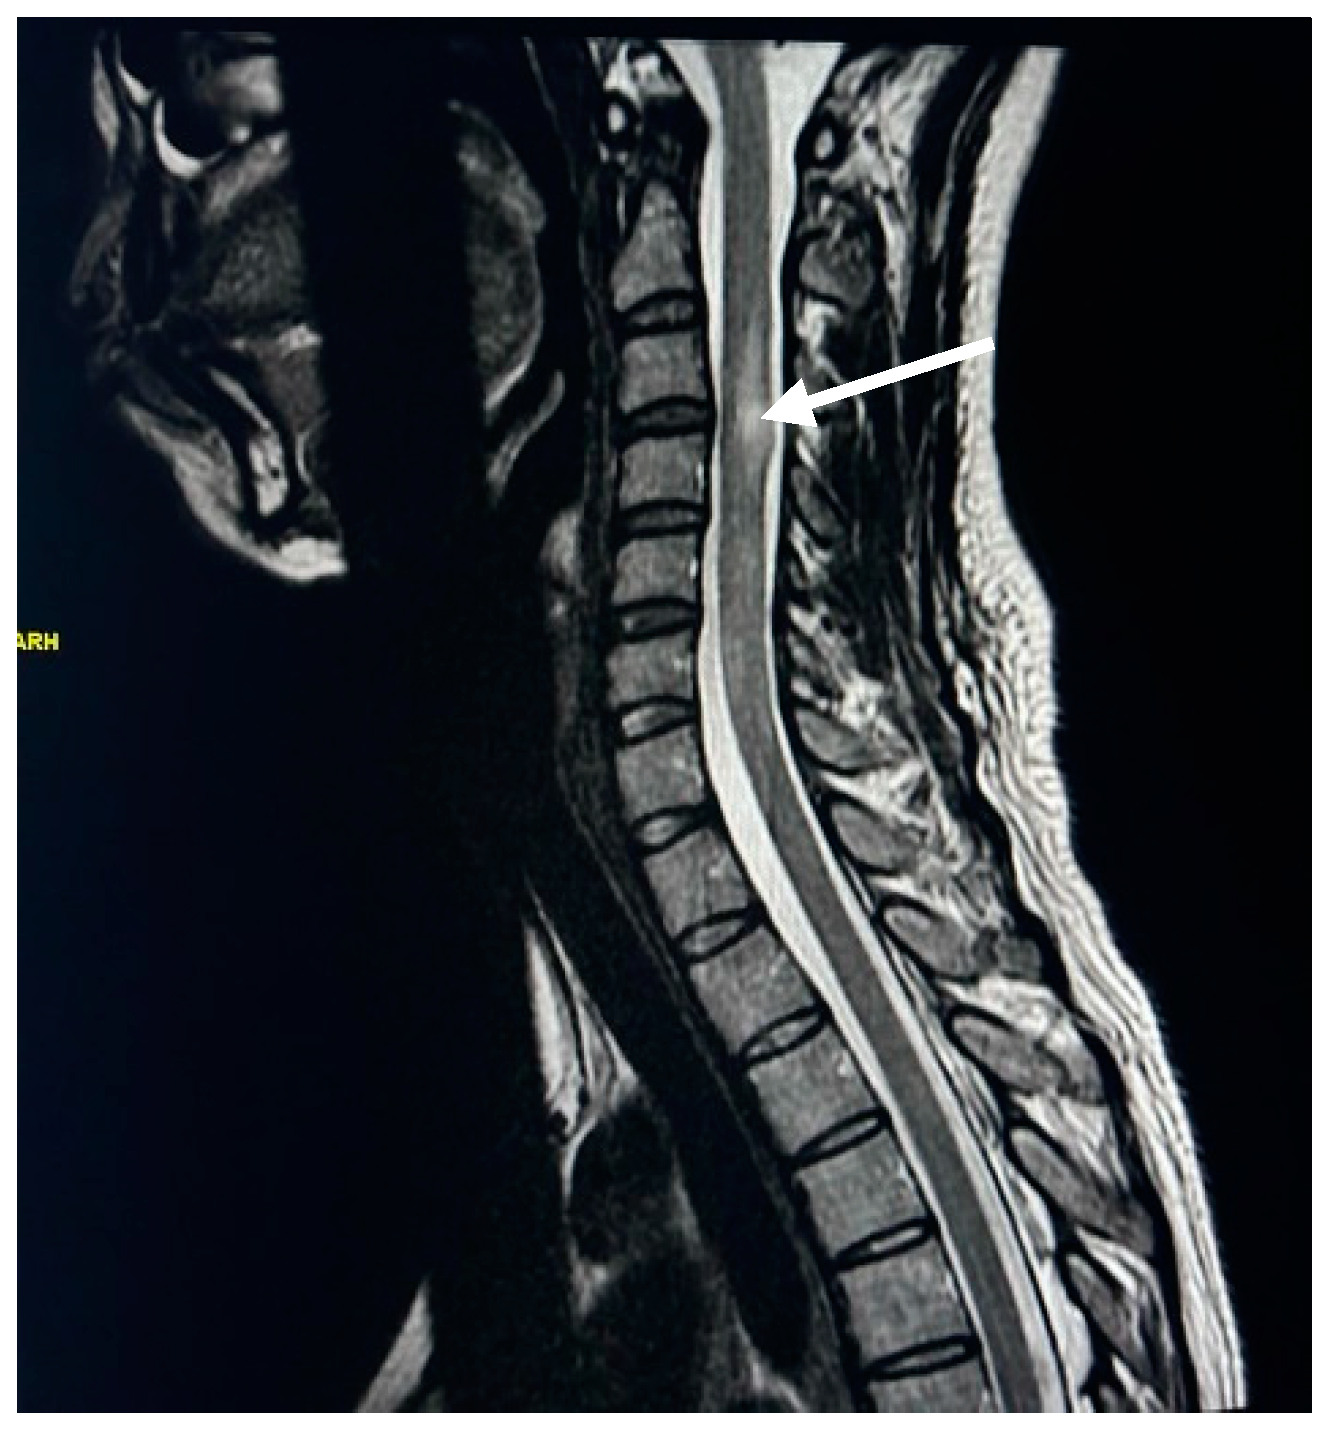
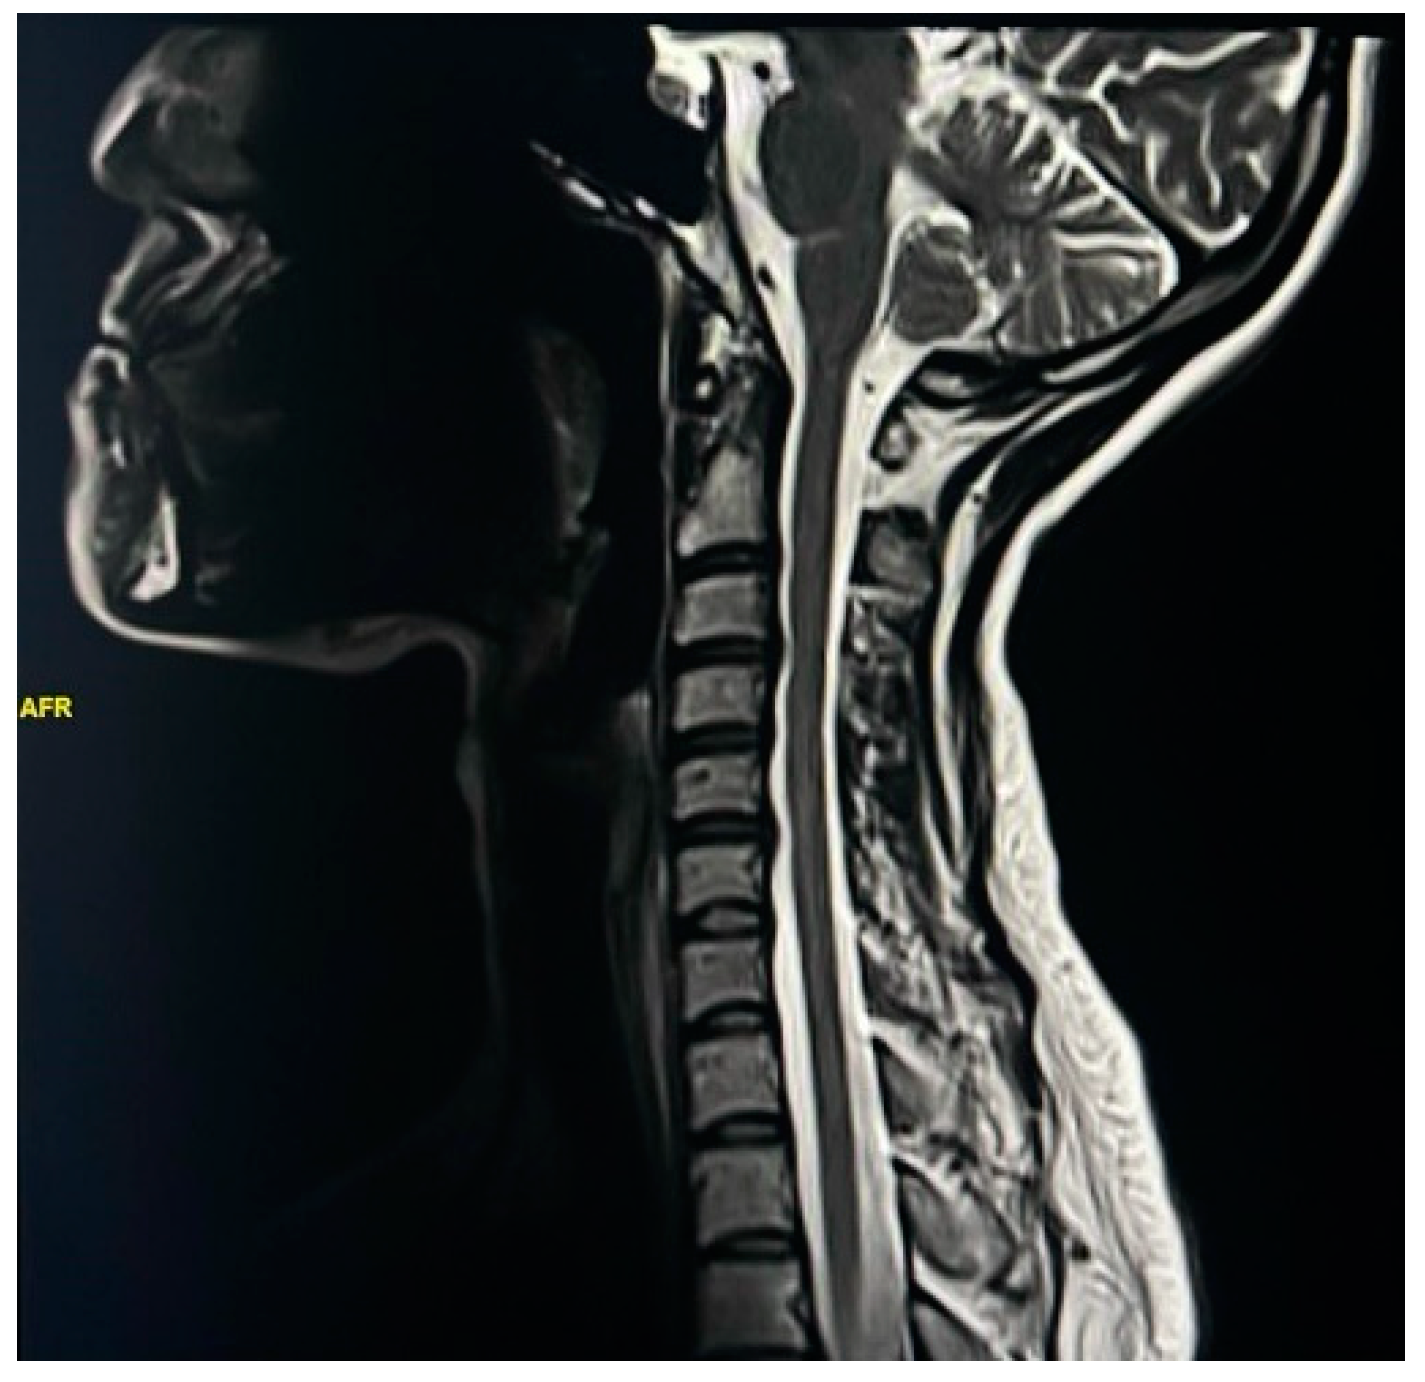
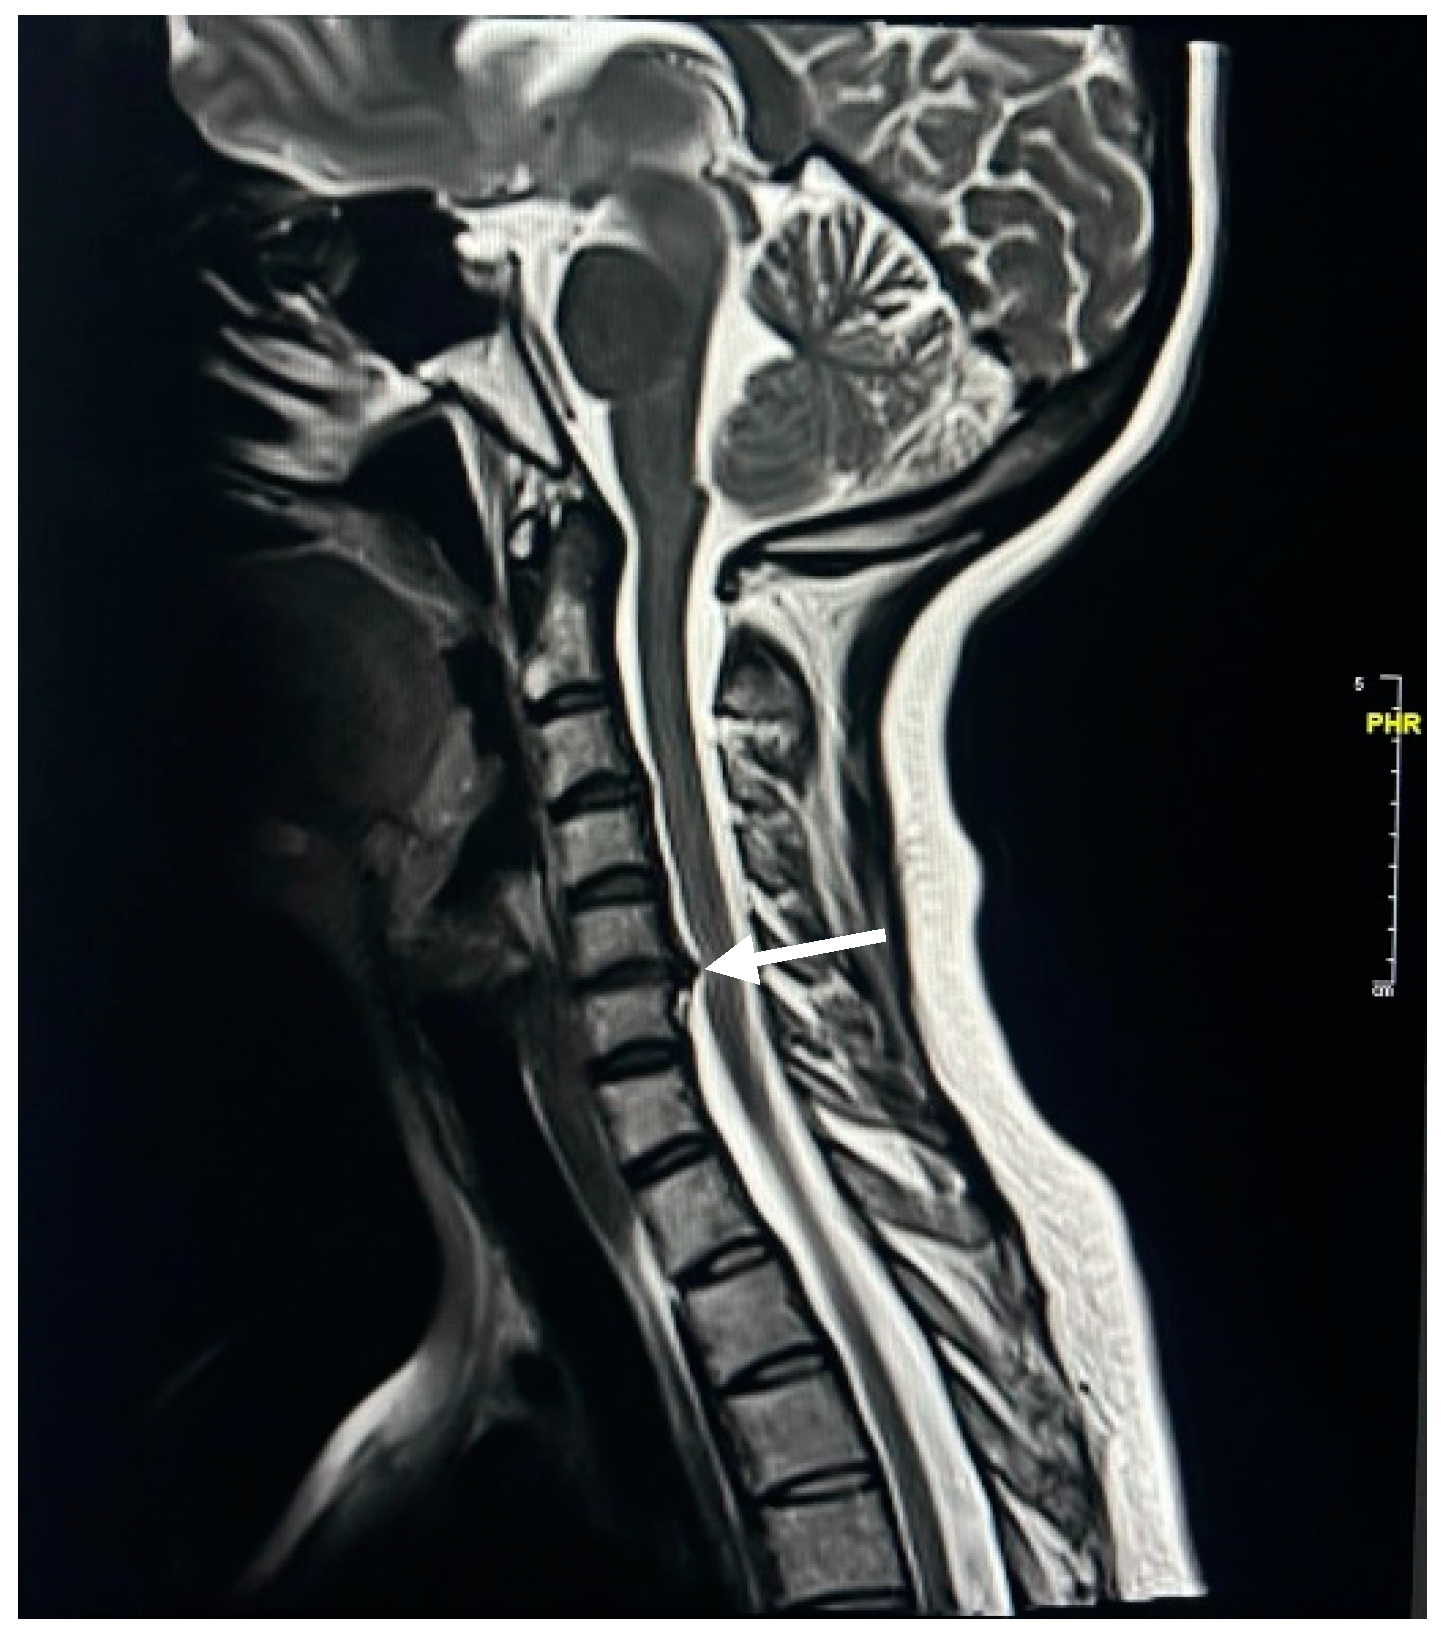
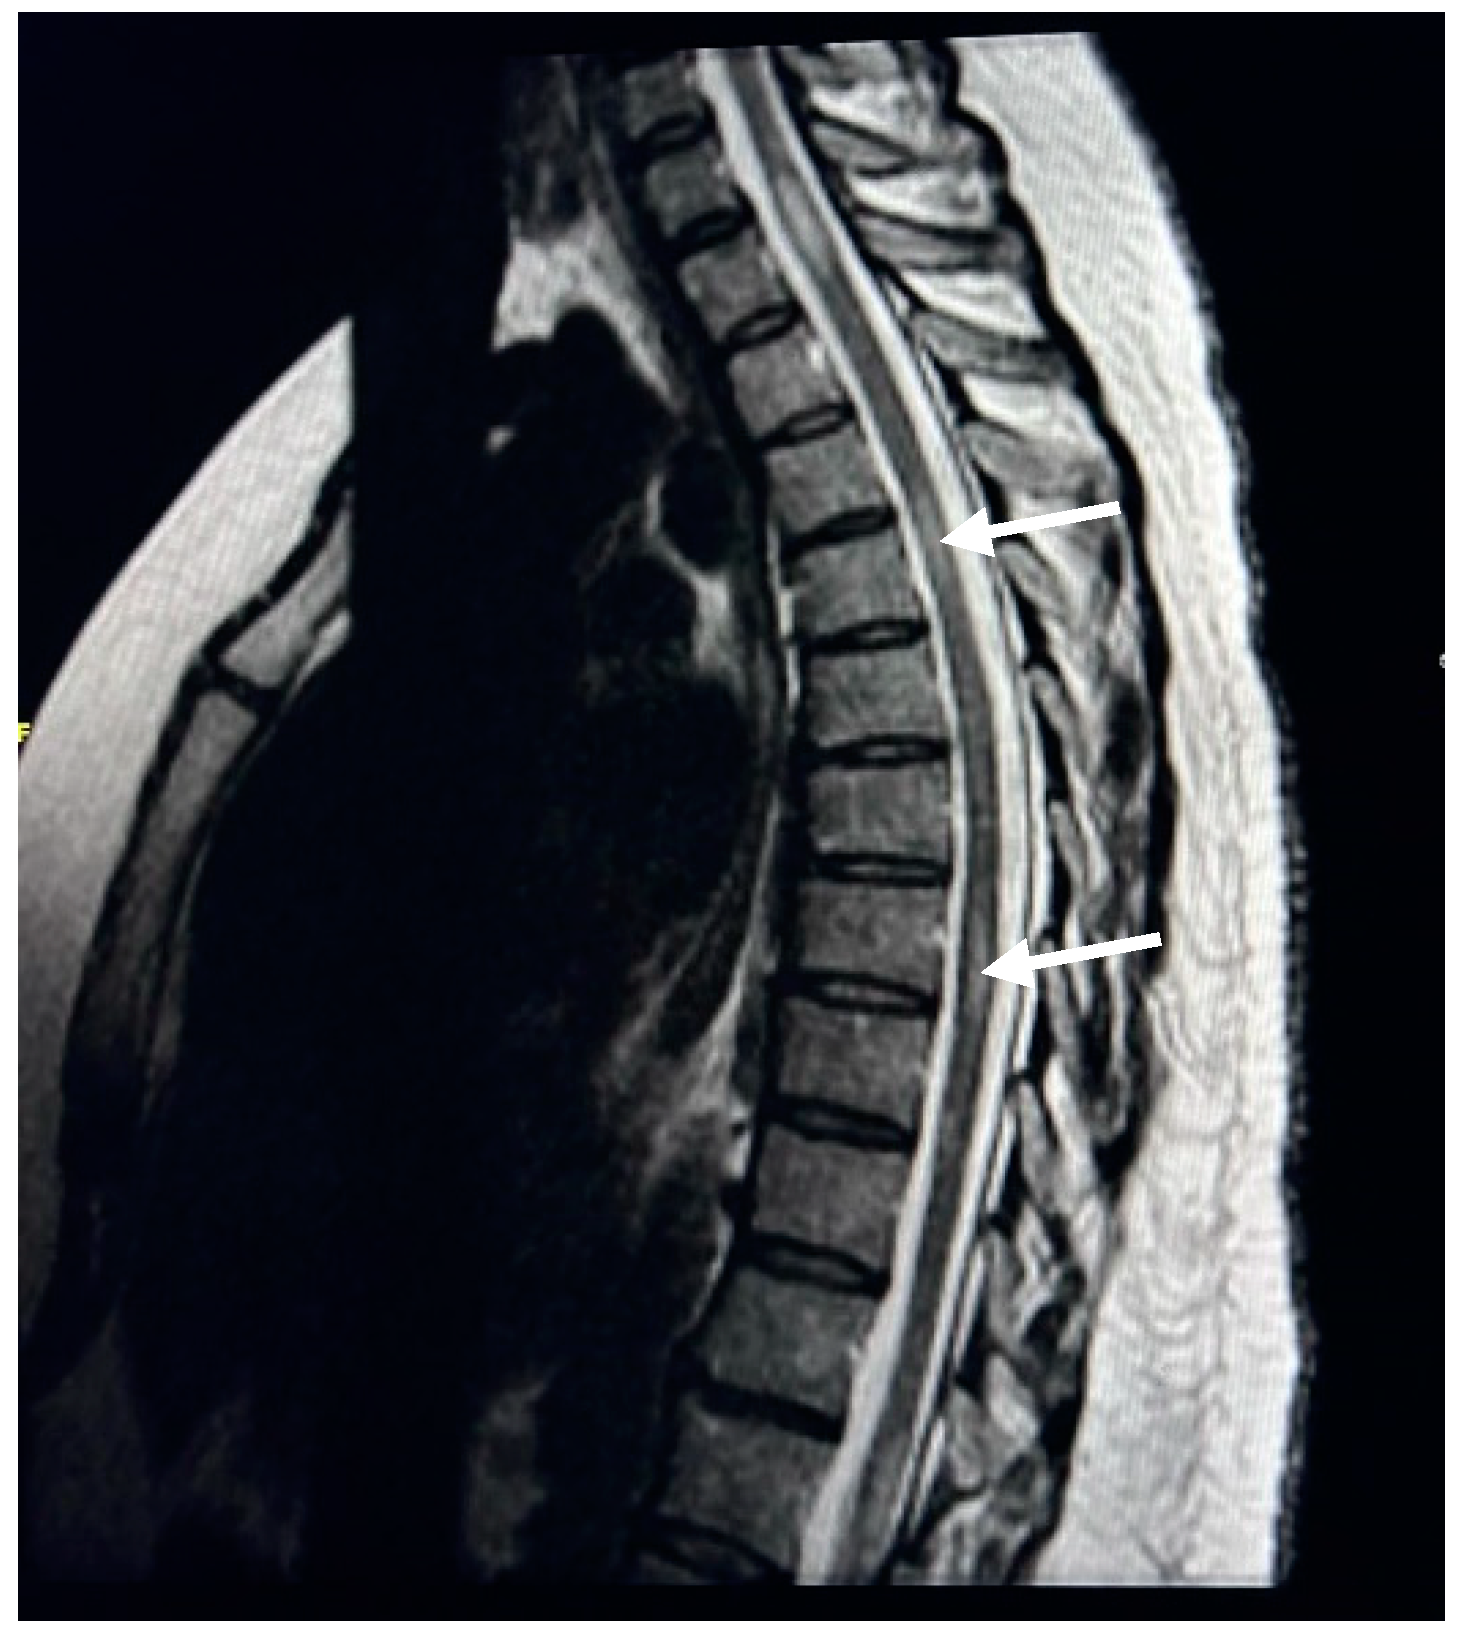
| Spinal Cord Change | Female | Male | ||
|---|---|---|---|---|
| No. | % | No. | % | |
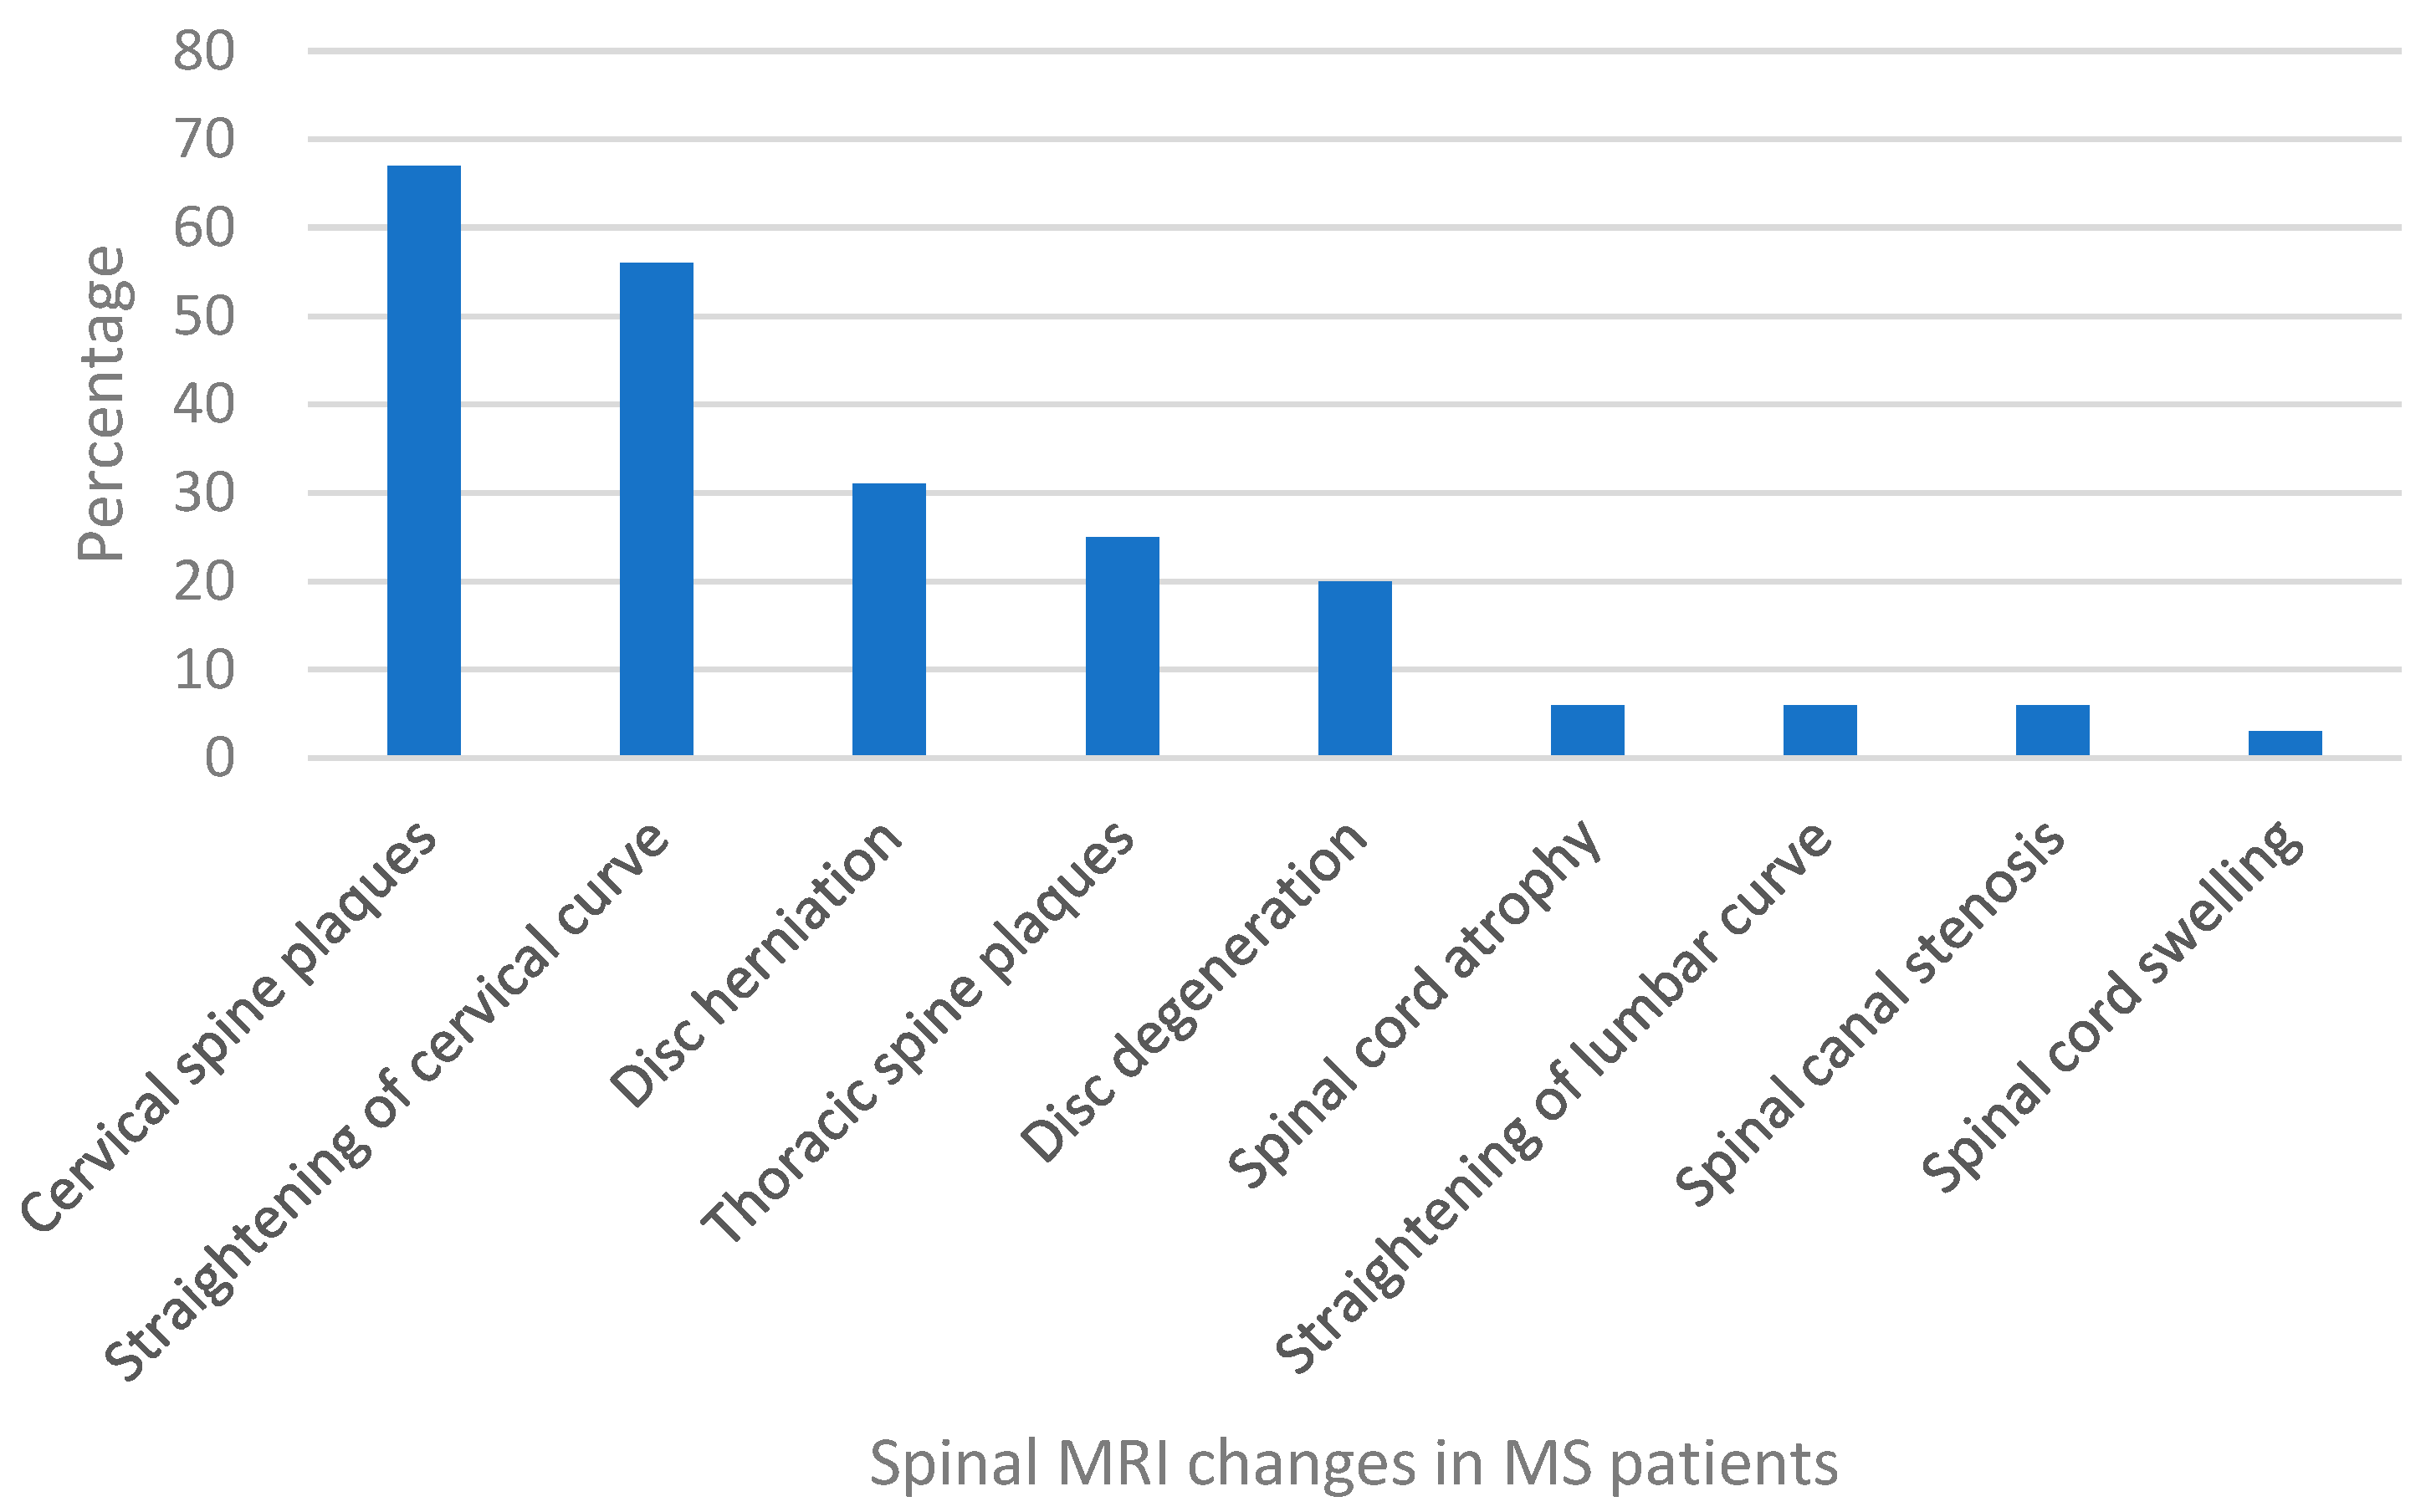
| Cervical spine plaques | 70 | 46.36 | 32.00 | 21.19 |
| Straightening of cervical curve | 67 | 44.37 | 21.00 | 13.91 |
| Disc herniation | 33 | 21.85 | 14.00 | 9.27 |
| Thoracic spine plaques | 28 | 18.54 | 10.00 | 6.62 |
| Disc degeneration | 21 | 13.91 | 9.00 | 5.96 |
| Straightening of lumbar curve | 4 | 2.65 | 5.00 | 3.31 |
| Spinal cord atrophy | 4 | 2.65 | 4.00 | 2.65 |
| Spinal canal stenosis | 3 | 1.99 | 4.00 | 2.65 |
| Spinal canal swelling | 4 | 2.65 | 1.00 | 0.66 |
| 104 | 47 | |||
| p-value | 0.0328 | |||
| Spinal Cord Change | Age Cohorts | ||||||
|---|---|---|---|---|---|---|---|
| 18–24 | 25–34 | 35–44 | 45–54 | 55–64 | Total | ||
| Cervical spine plaques | No. | 10 | 41 | 27 | 19 | 5 | 102 |
| % | 6.62 | 27.15 | 17.88 | 12.58 | 3.31 | 67.55 | |
| Straightening of cervical curve | No. | 9 | 38 | 21 | 17 | 3 | 88 |
| % | 5.96 | 25.17 | 13.91 | 11.26 | 1.99 | 58.28 | |
| Disc herniation | No. | 3 | 17 | 9 | 13 | 5 | 47 |
| % | 1.99 | 11.26 | 5.96 | 8.61 | 3.31 | 31.13 | |
| Thoracic spine plaques | No. | 2 | 18 | 9 | 6 | 3 | 38 |
| % | 1.32 | 11.92 | 5.96 | 3.97 | 1.99 | 25.17 | |
| Disc degeneration | No. | 0 | 7 | 7 | 11 | 5 | 30 |
| % | 0.00 | 4.64 | 4.64 | 7.28 | 3.31 | 19.87 | |
| Straightening of lumber curve | No. | 0 | 3 | 3 | 2 | 1 | 9 |
| % | 0.00 | 1.99 | 1.99 | 1.32 | 0.66 | 5.96 | |
| Spinal cord atrophy | No. | 1 | 2 | 2 | 1 | 2 | 8 |
| % | 0.66 | 1.32 | 1.32 | 0.66 | 1.32 | 5.30 | |
| Spinal canal stenosis | No. | 1 | 3 | 0 | 2 | 1 | 7 |
| % | 0.66 | 1.99 | 0.00 | 1.32 | 0.66 | 4.64 | |
| Spinal cord swelling | No. | 1 | 2 | 2 | 0 | 0 | 5 |
| % | 0.66 | 1.32 | 1.32 | 0.00 | 0.00 | 3.31 | |
| p-value | 0.045 | ||||||
Disclaimer/Publisher’s Note: The statements, opinions and data contained in all publications are solely those of the individual author(s) and contributor(s) and not of MDPI and/or the editor(s). MDPI and/or the editor(s) disclaim responsibility for any injury to people or property resulting from any ideas, methods, instructions or products referred to in the content. |
© 2024 by the authors. Licensee MDPI, Basel, Switzerland. This article is an open access article distributed under the terms and conditions of the Creative Commons Attribution (CC BY) license (https://creativecommons.org/licenses/by/4.0/).
Share and Cite
Alrehaili, A.A.; Faizo, N.L.; Alsulimani, B.M.; Alsulimani, R.K.; Aldwaila, D.A.; Alqarni, N.J.; Faizo, N.L. Exploring Spinal Cord Changes in Multiple Sclerosis Patients Using MRI. NeuroSci 2024, 5, 87-97. https://doi.org/10.3390/neurosci5010006
Alrehaili AA, Faizo NL, Alsulimani BM, Alsulimani RK, Aldwaila DA, Alqarni NJ, Faizo NL. Exploring Spinal Cord Changes in Multiple Sclerosis Patients Using MRI. NeuroSci. 2024; 5(1):87-97. https://doi.org/10.3390/neurosci5010006
Chicago/Turabian StyleAlrehaili, Amani A., Nahla L. Faizo, Batool M. Alsulimani, Raghad K. Alsulimani, Dana A. Aldwaila, Nada J. Alqarni, and Nisreen Lutfi Faizo. 2024. "Exploring Spinal Cord Changes in Multiple Sclerosis Patients Using MRI" NeuroSci 5, no. 1: 87-97. https://doi.org/10.3390/neurosci5010006