
Synergetic Effect of Chemical Coagulation and Electroflotation on Synthetic Palm Oil Mill Effluent Treatment

Abstract
:1. Introduction
2. Materials and Methods
2.1. Preparation of Synthetic POME
2.2. Experimental Procedure
2.2.1. Electroflotation (EF)
2.2.2. Chemical Coagulation
2.2.3. Combined Experiments
2.3. Analytical Methods
2.3.1. Removal Efficiency (R%)
2.3.2. Specific Energy Consumption
2.3.3. Operational Cost
2.4. Statistical Analysis
3. Results and Discussion
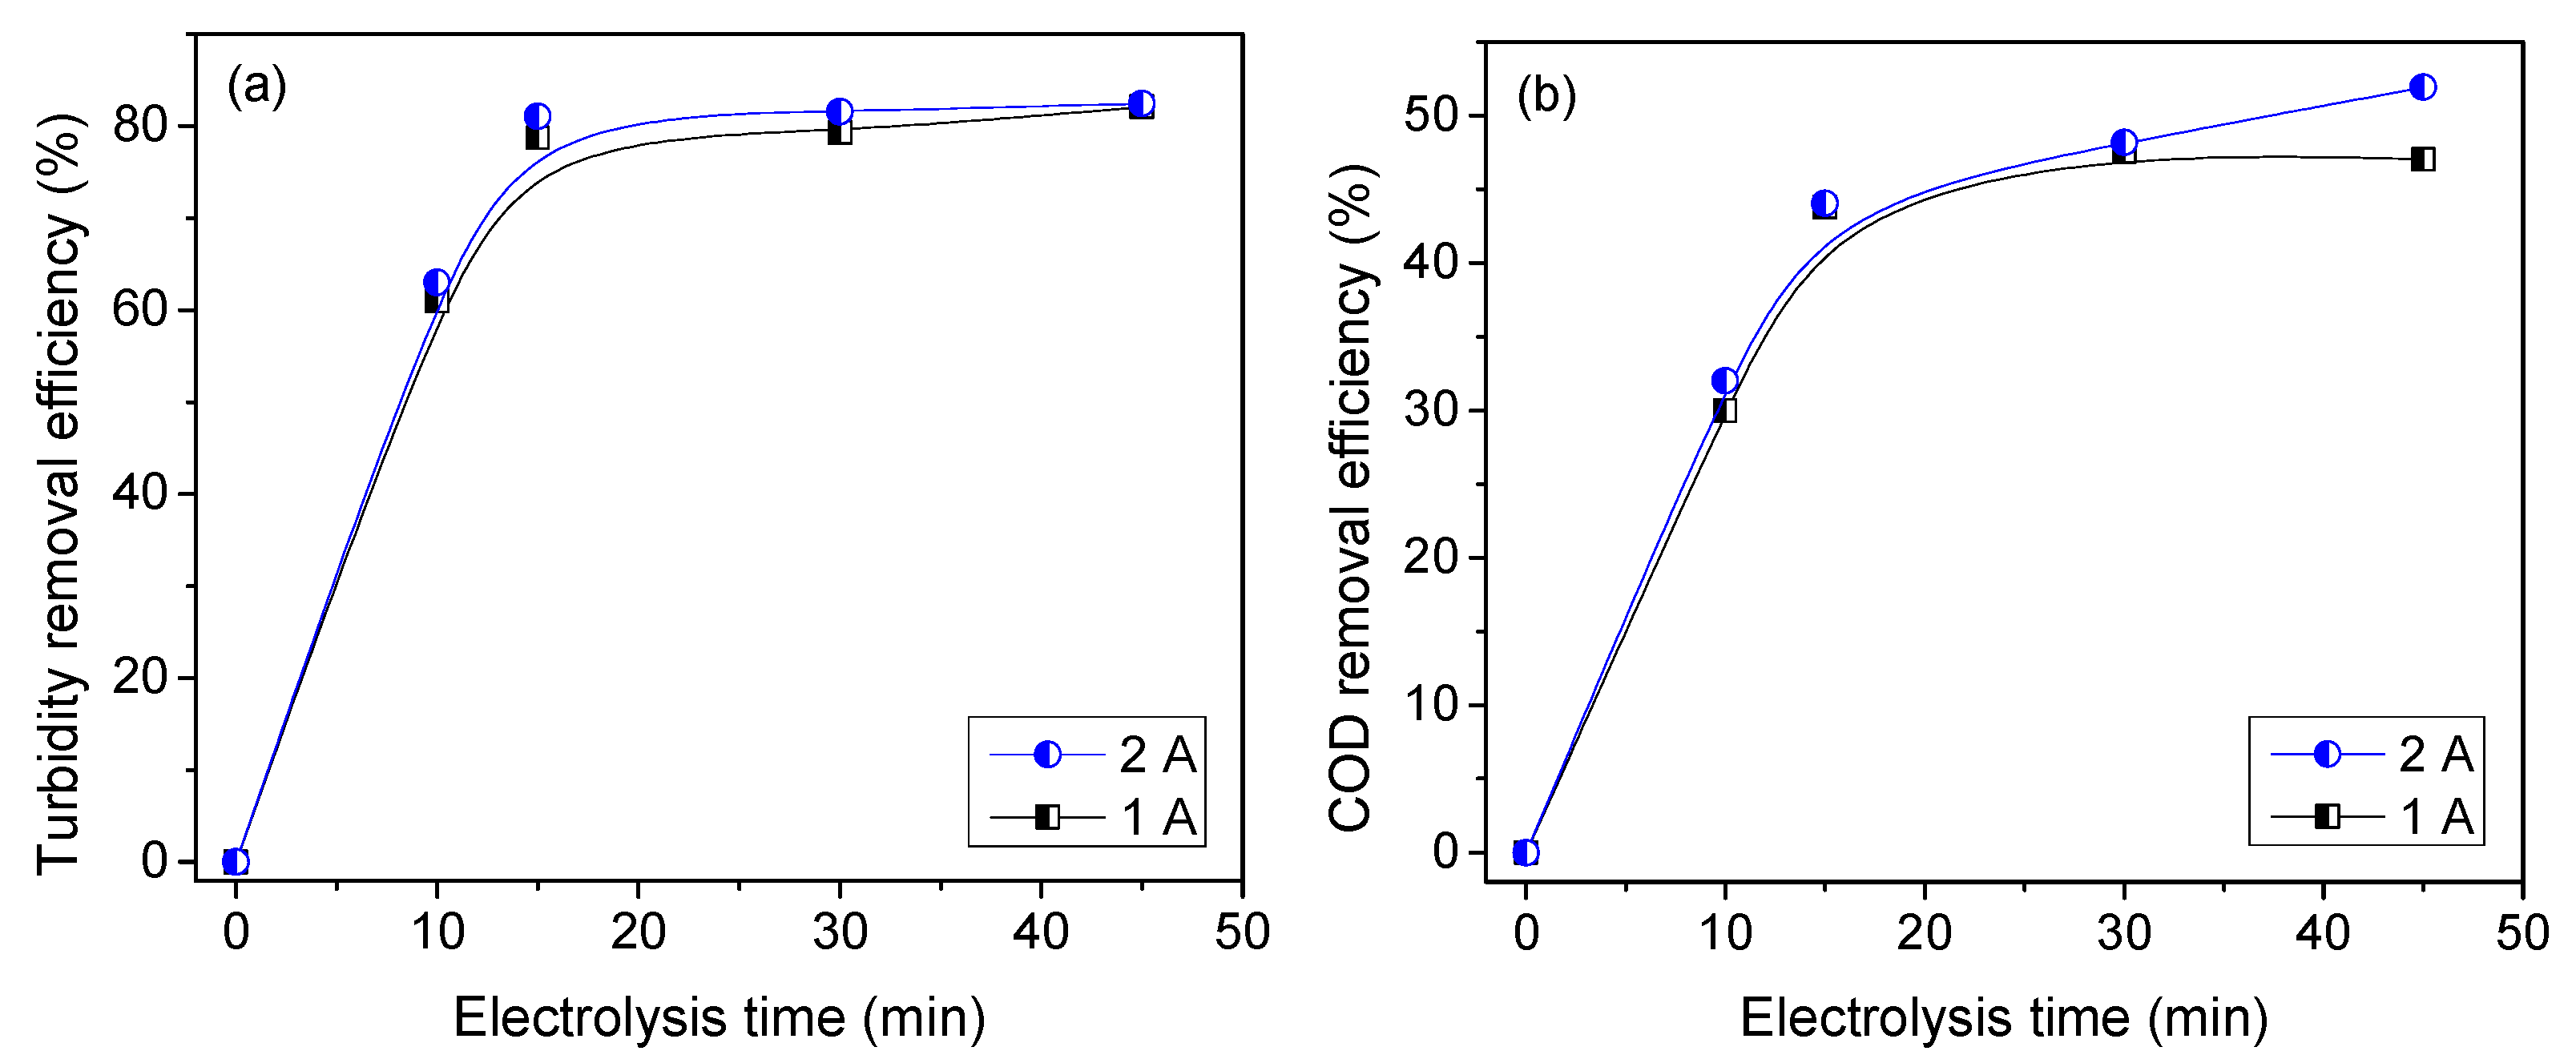
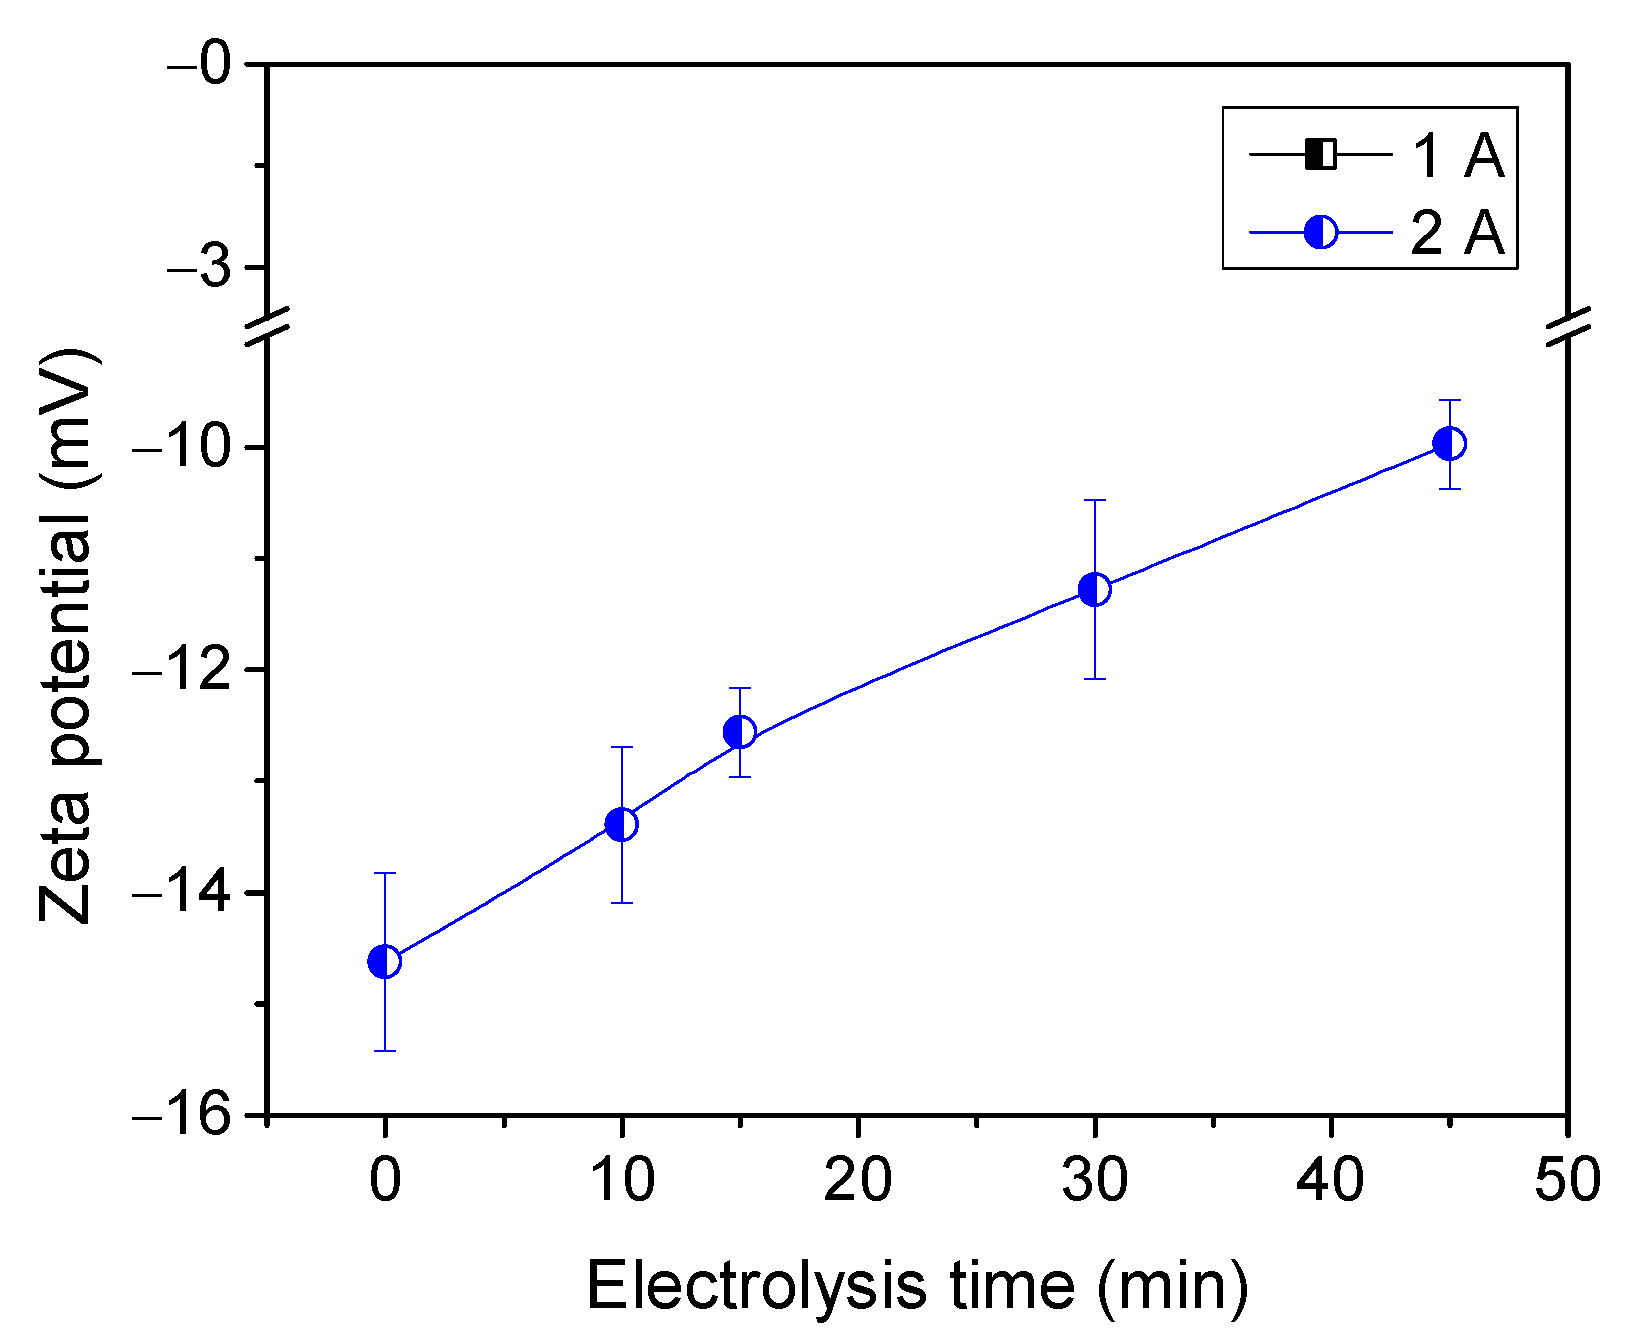
3.1. Effect of Electroflotation on POME Treatment
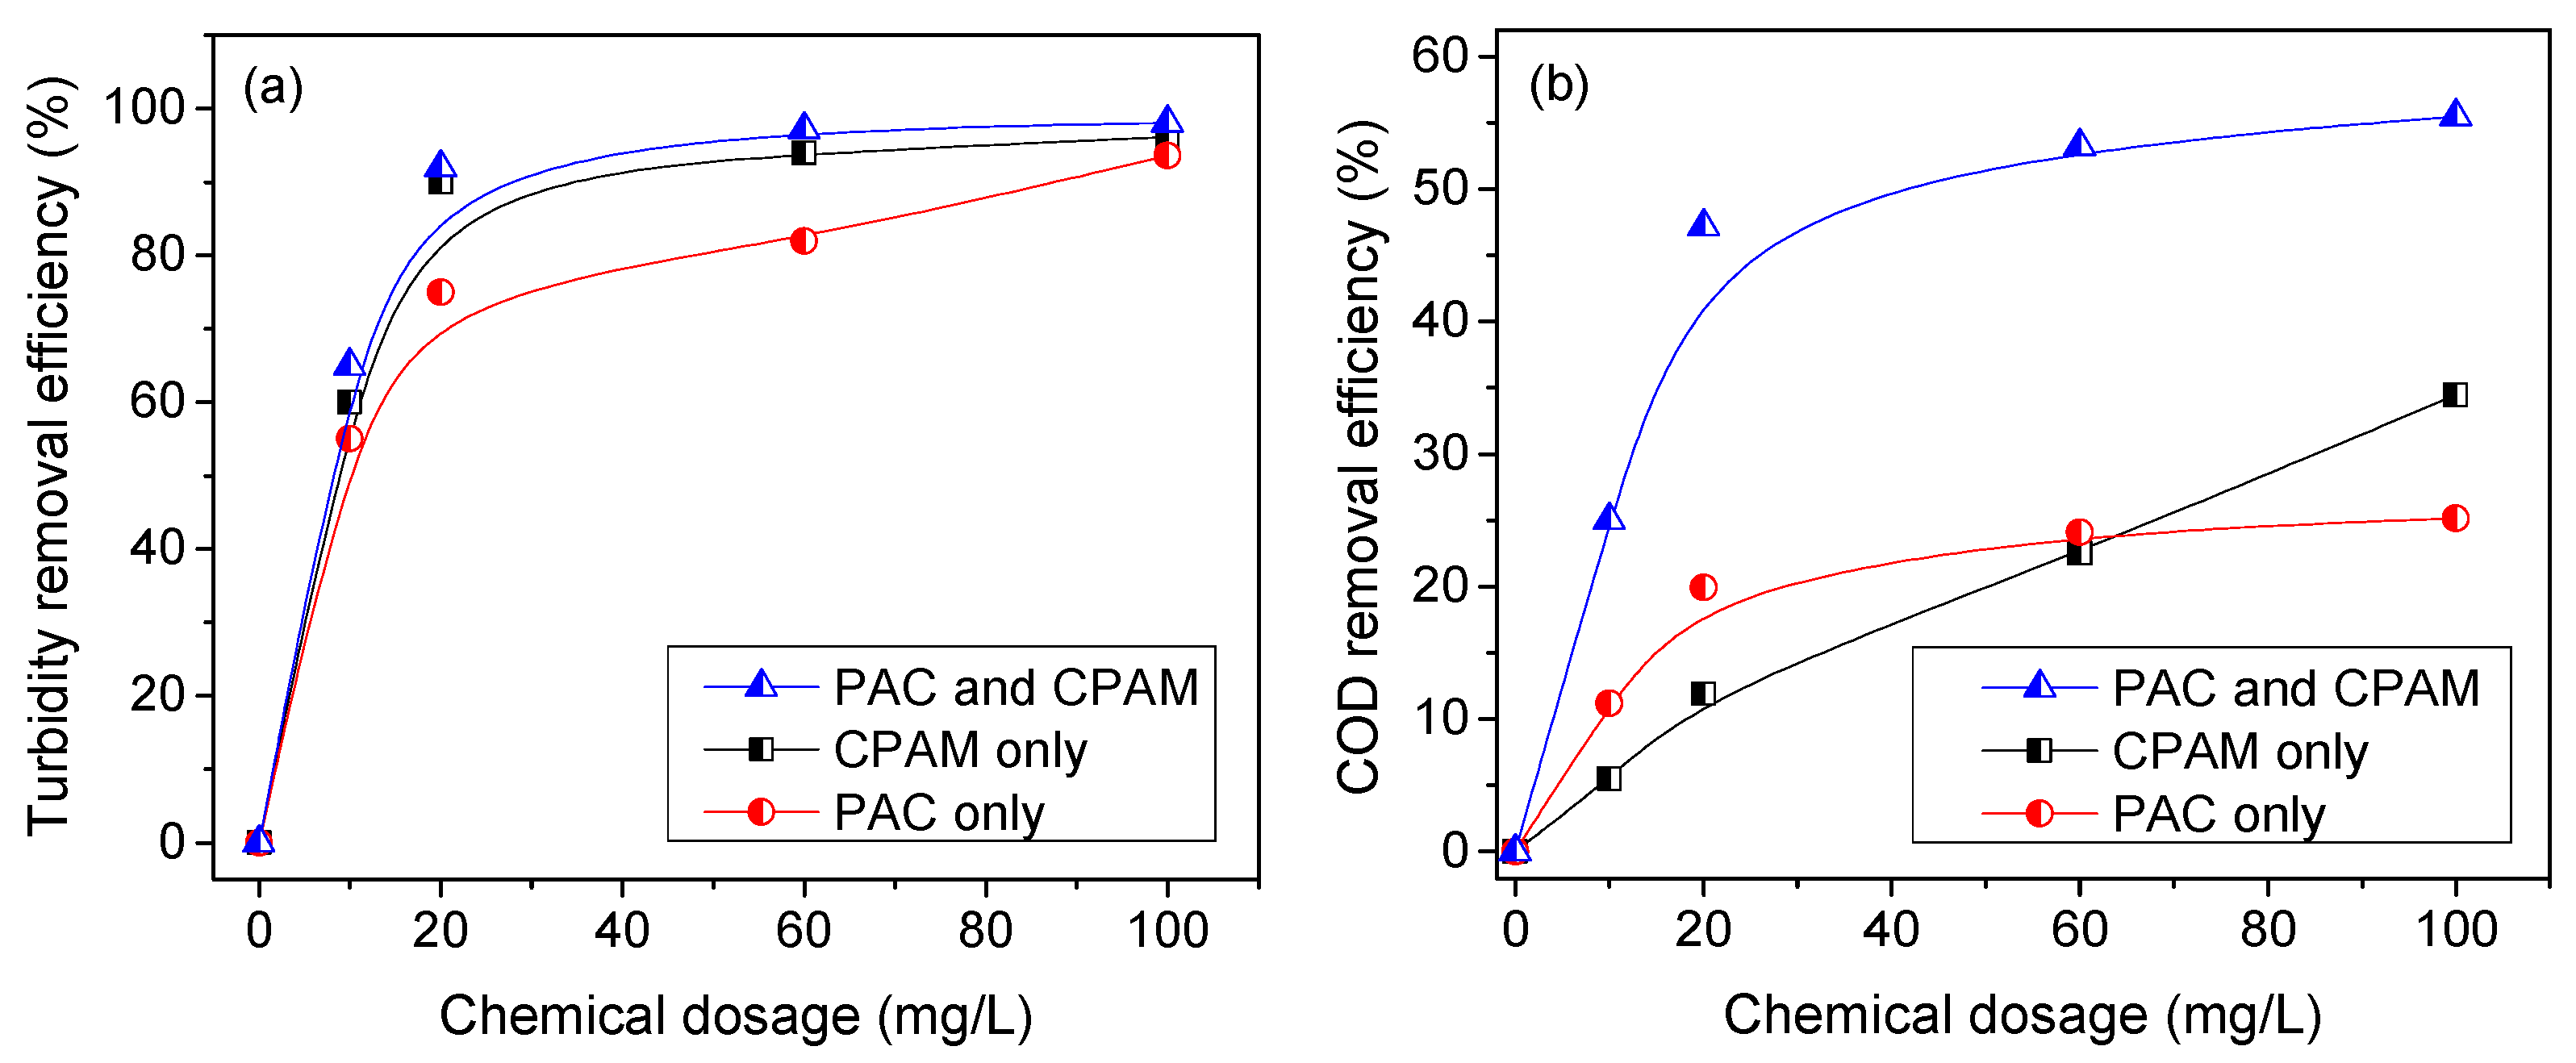
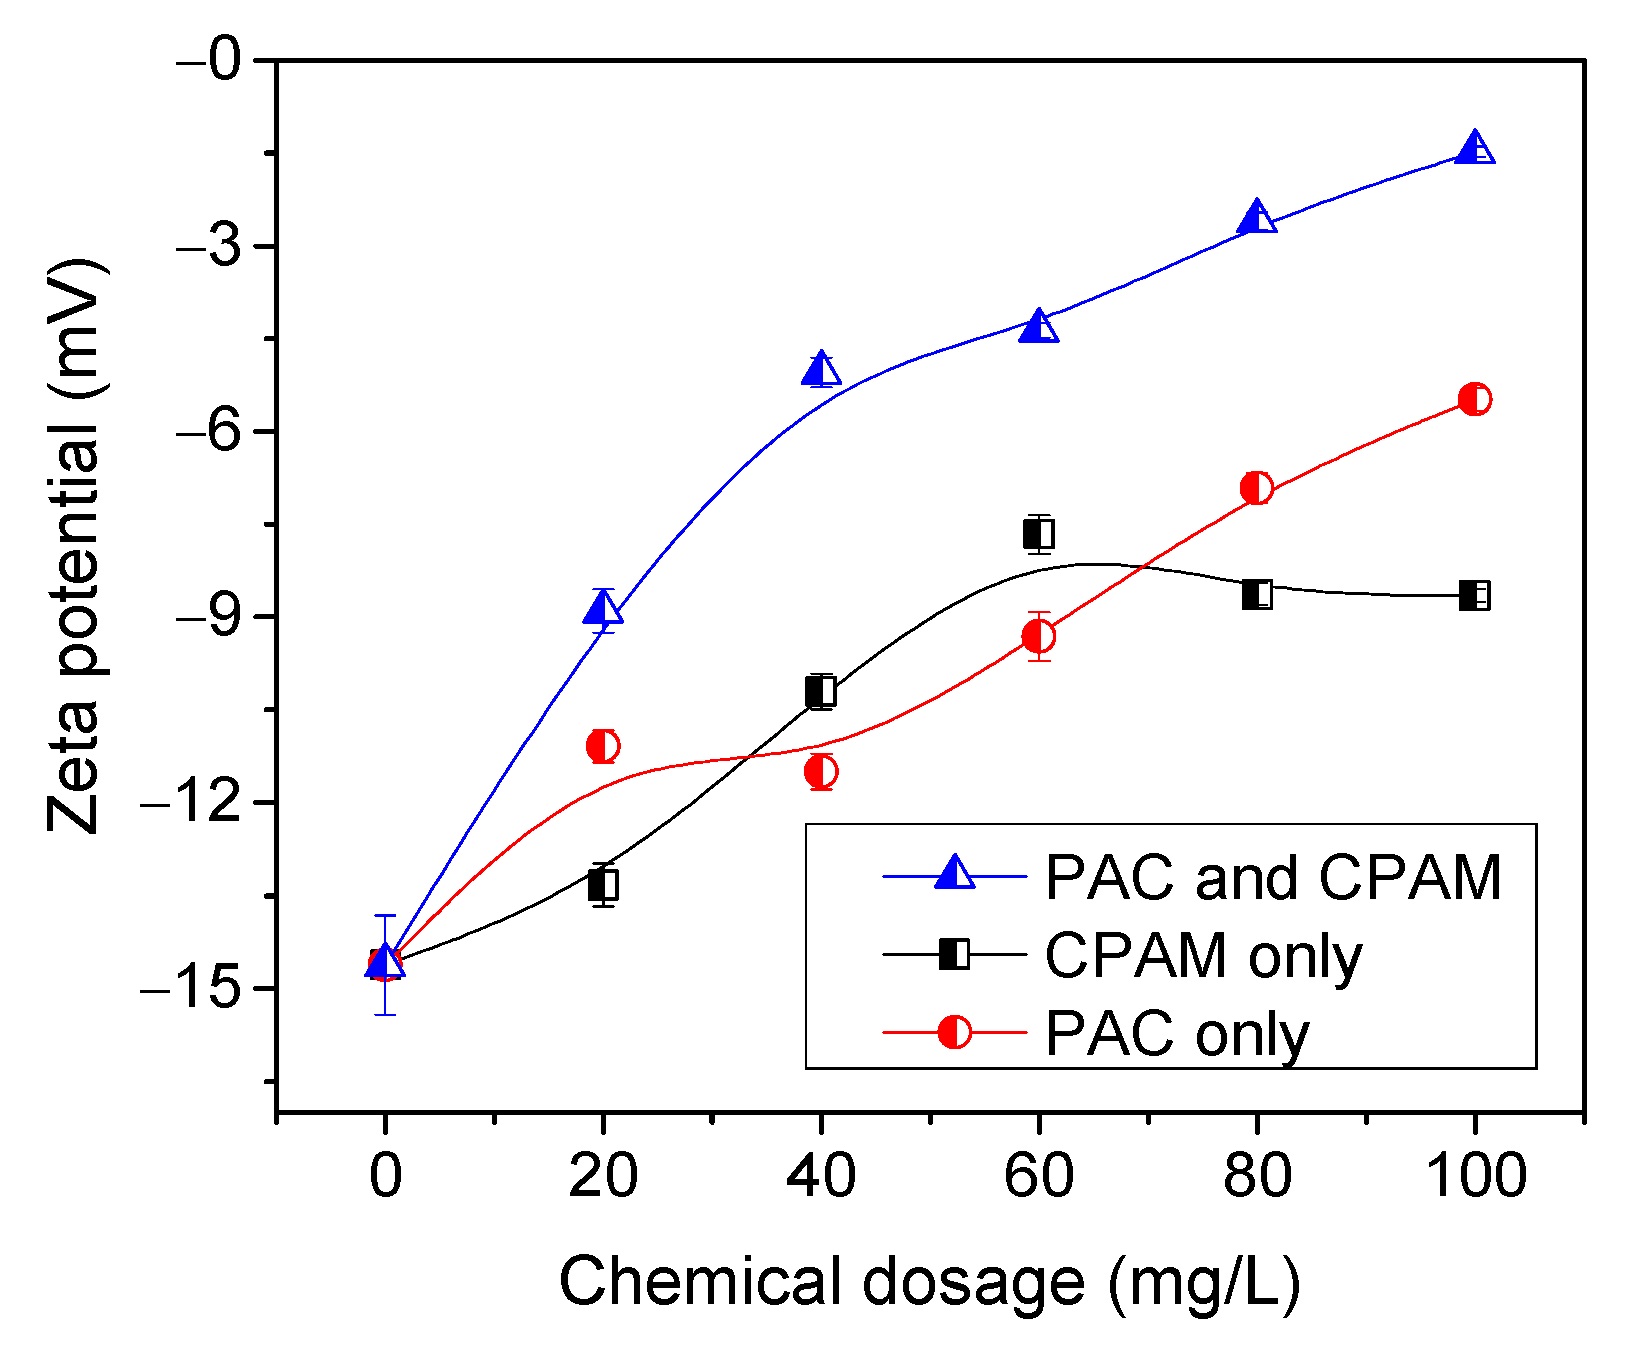
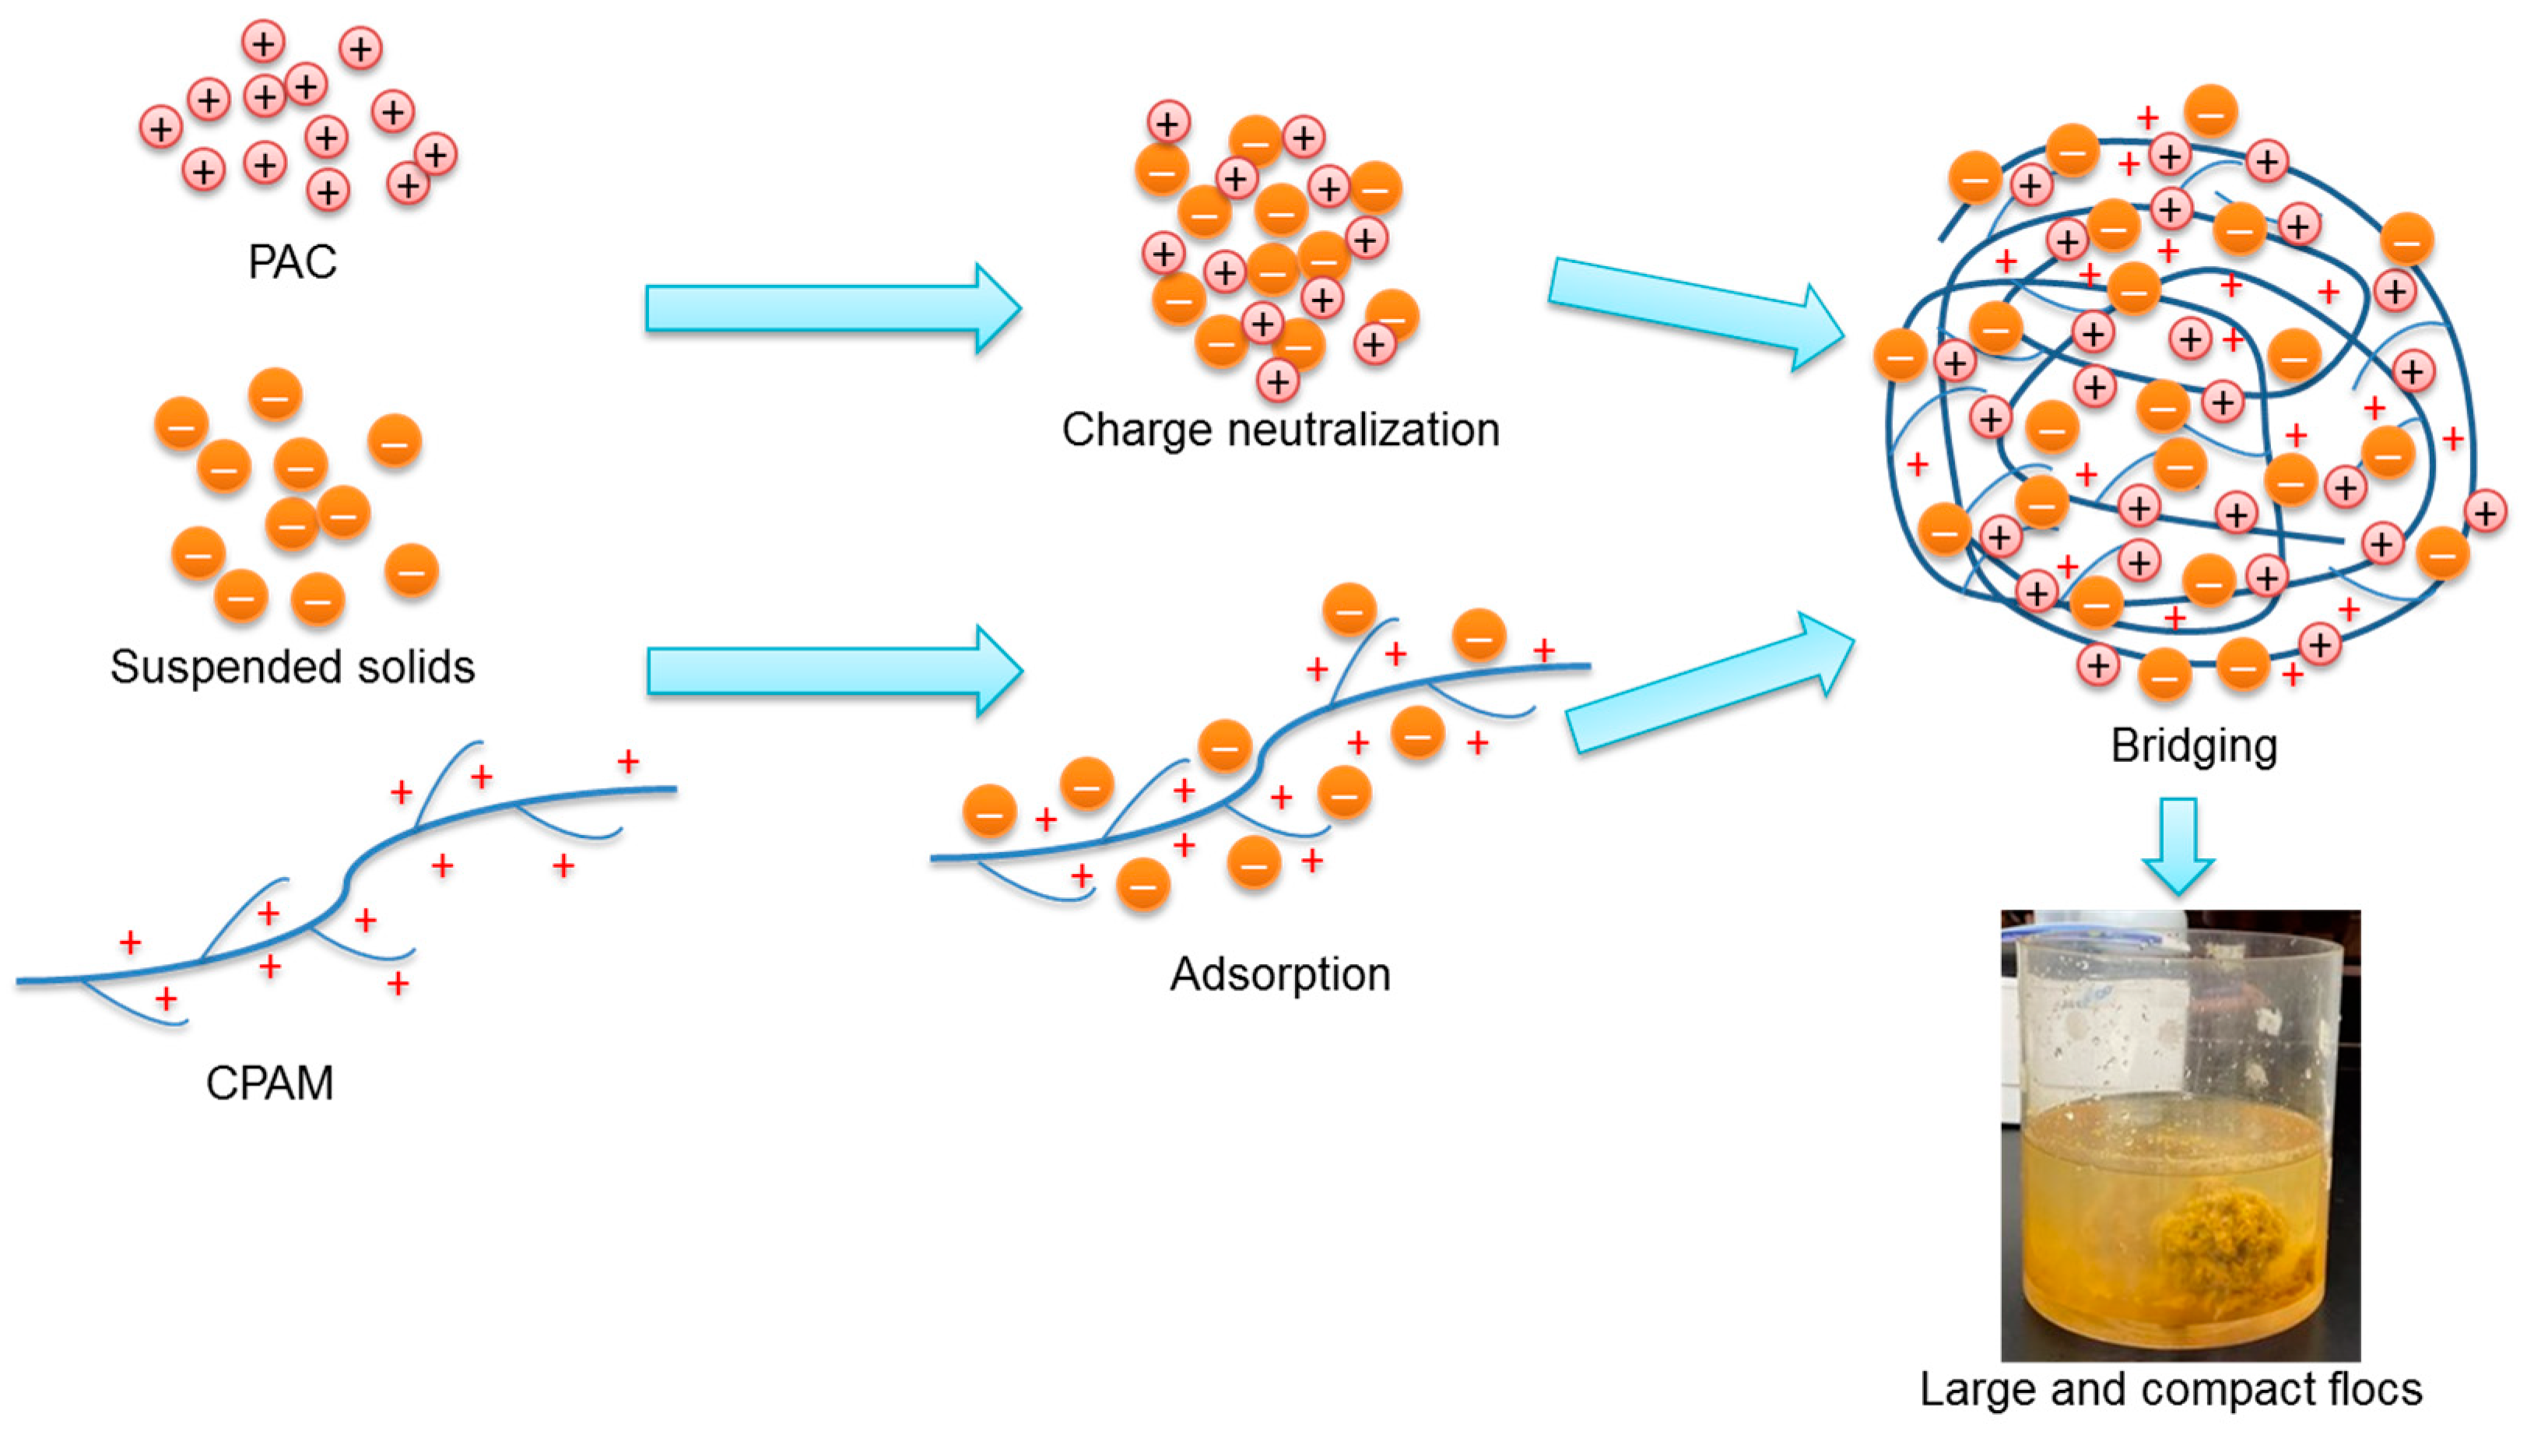
3.2. Effect of Chemical Coagulation on POME Treatment
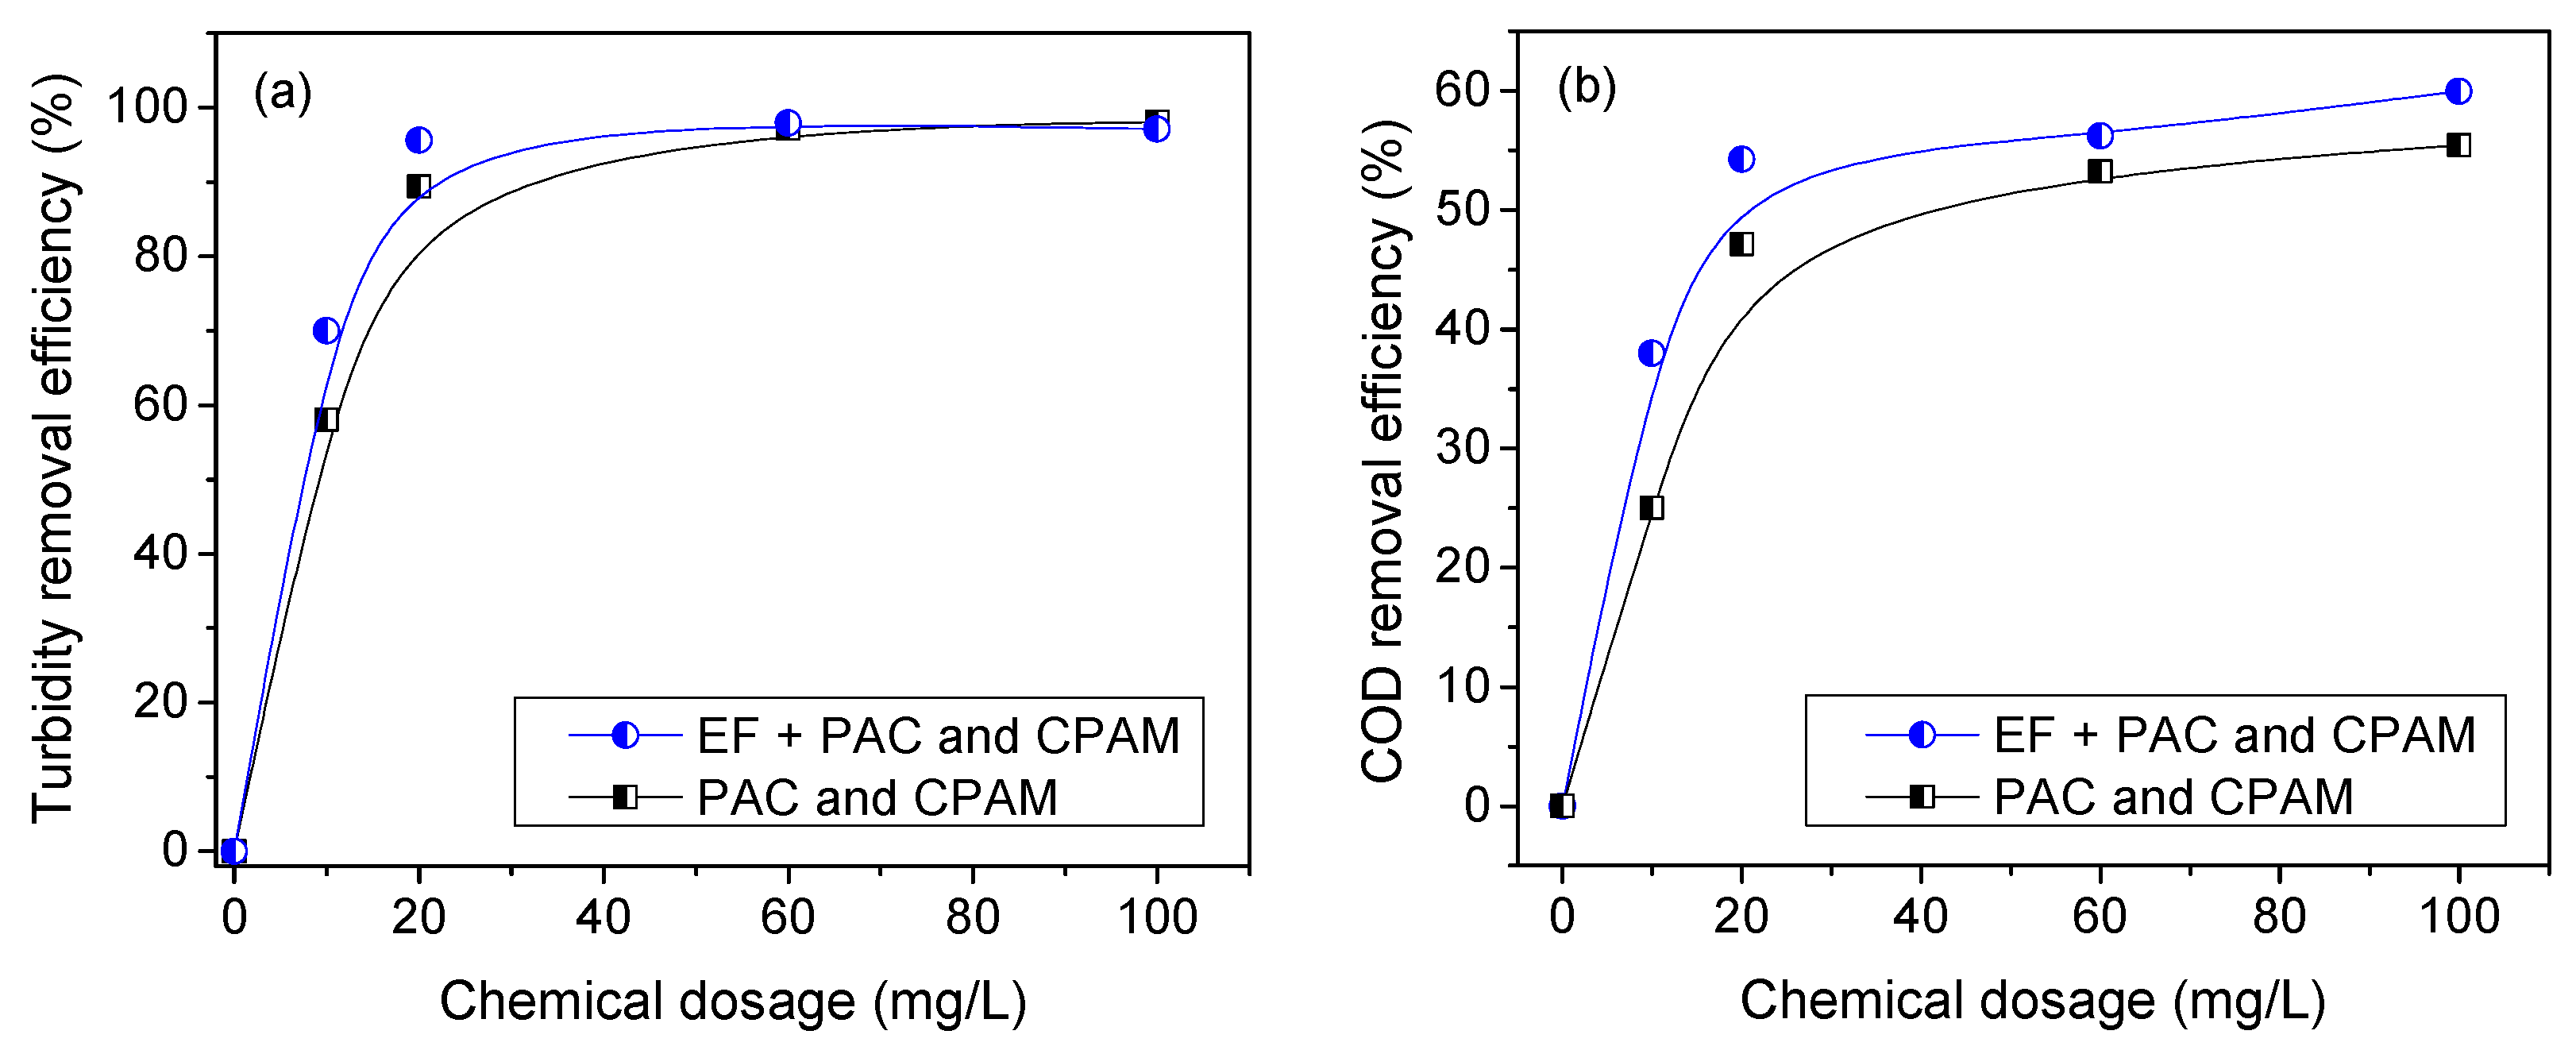
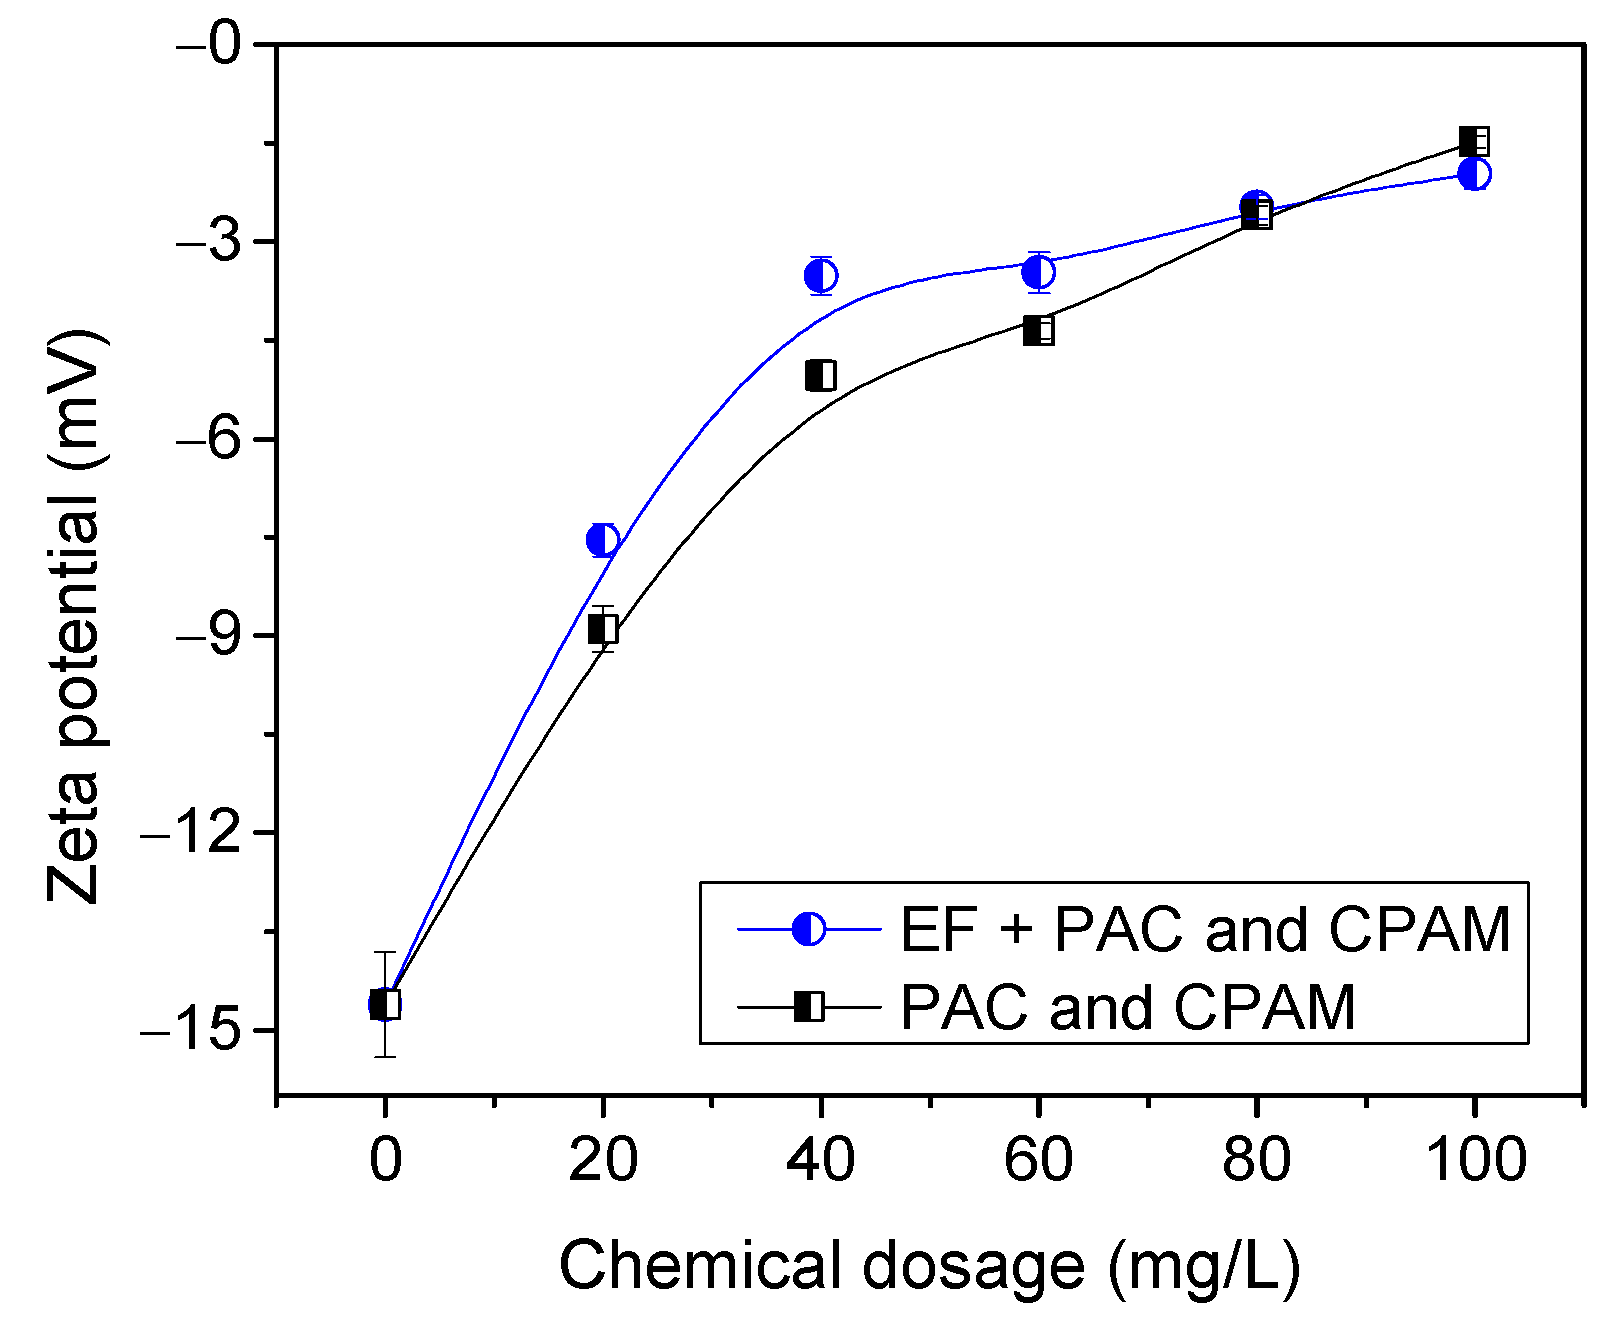
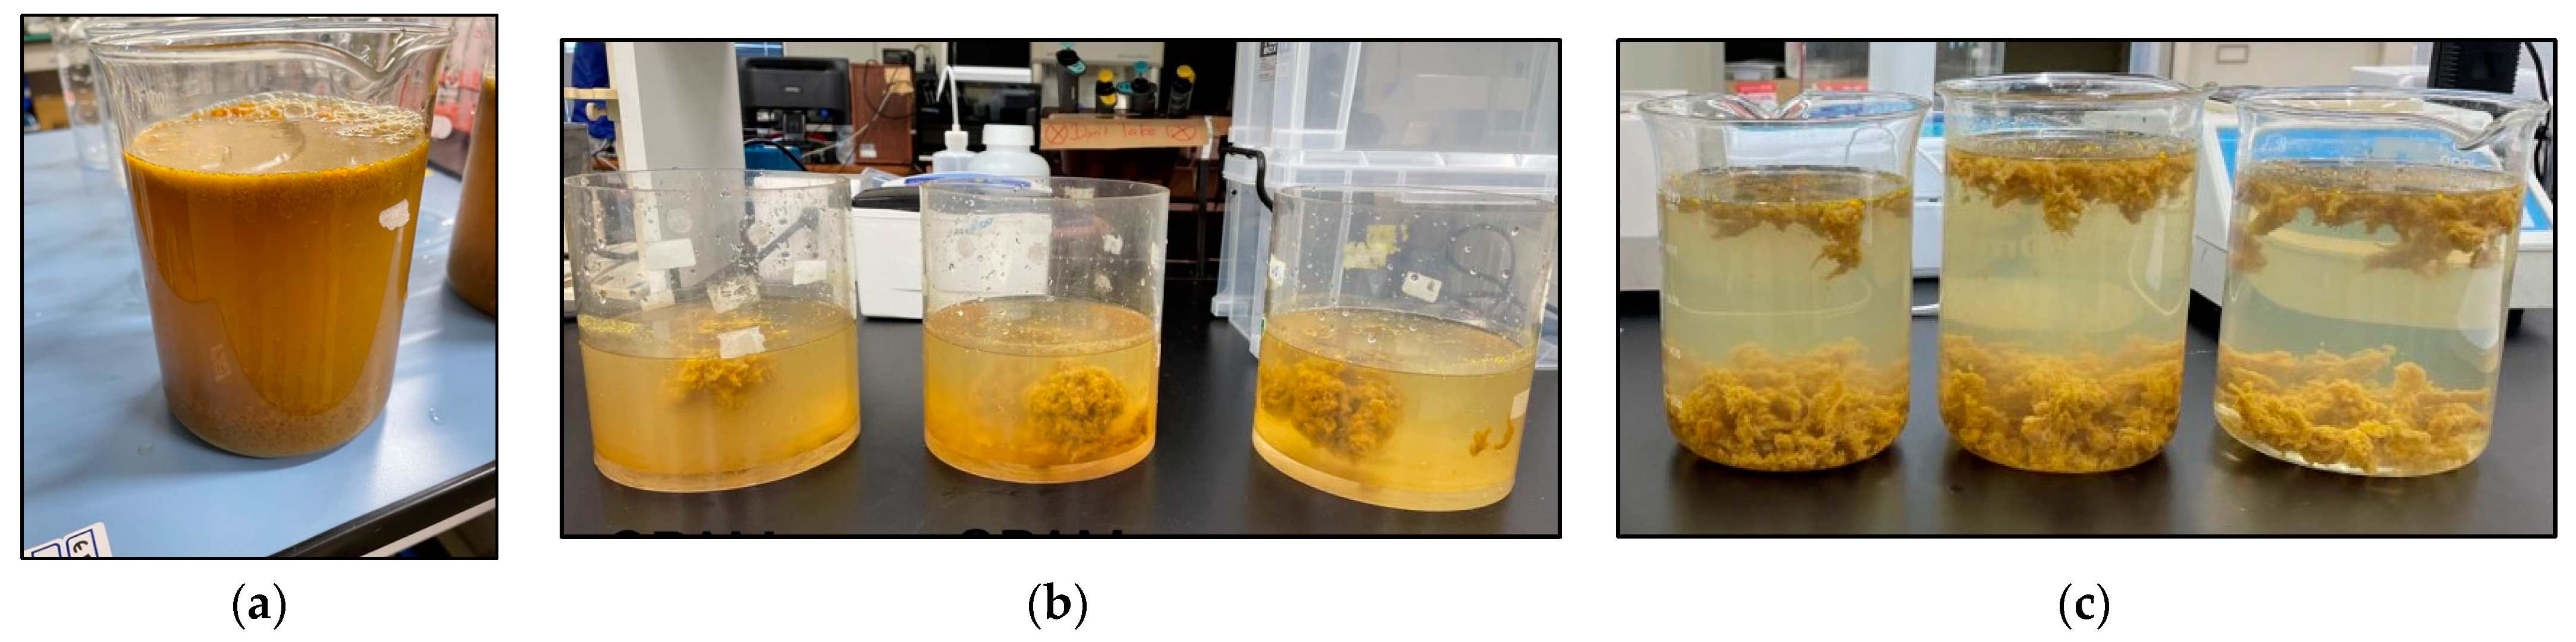
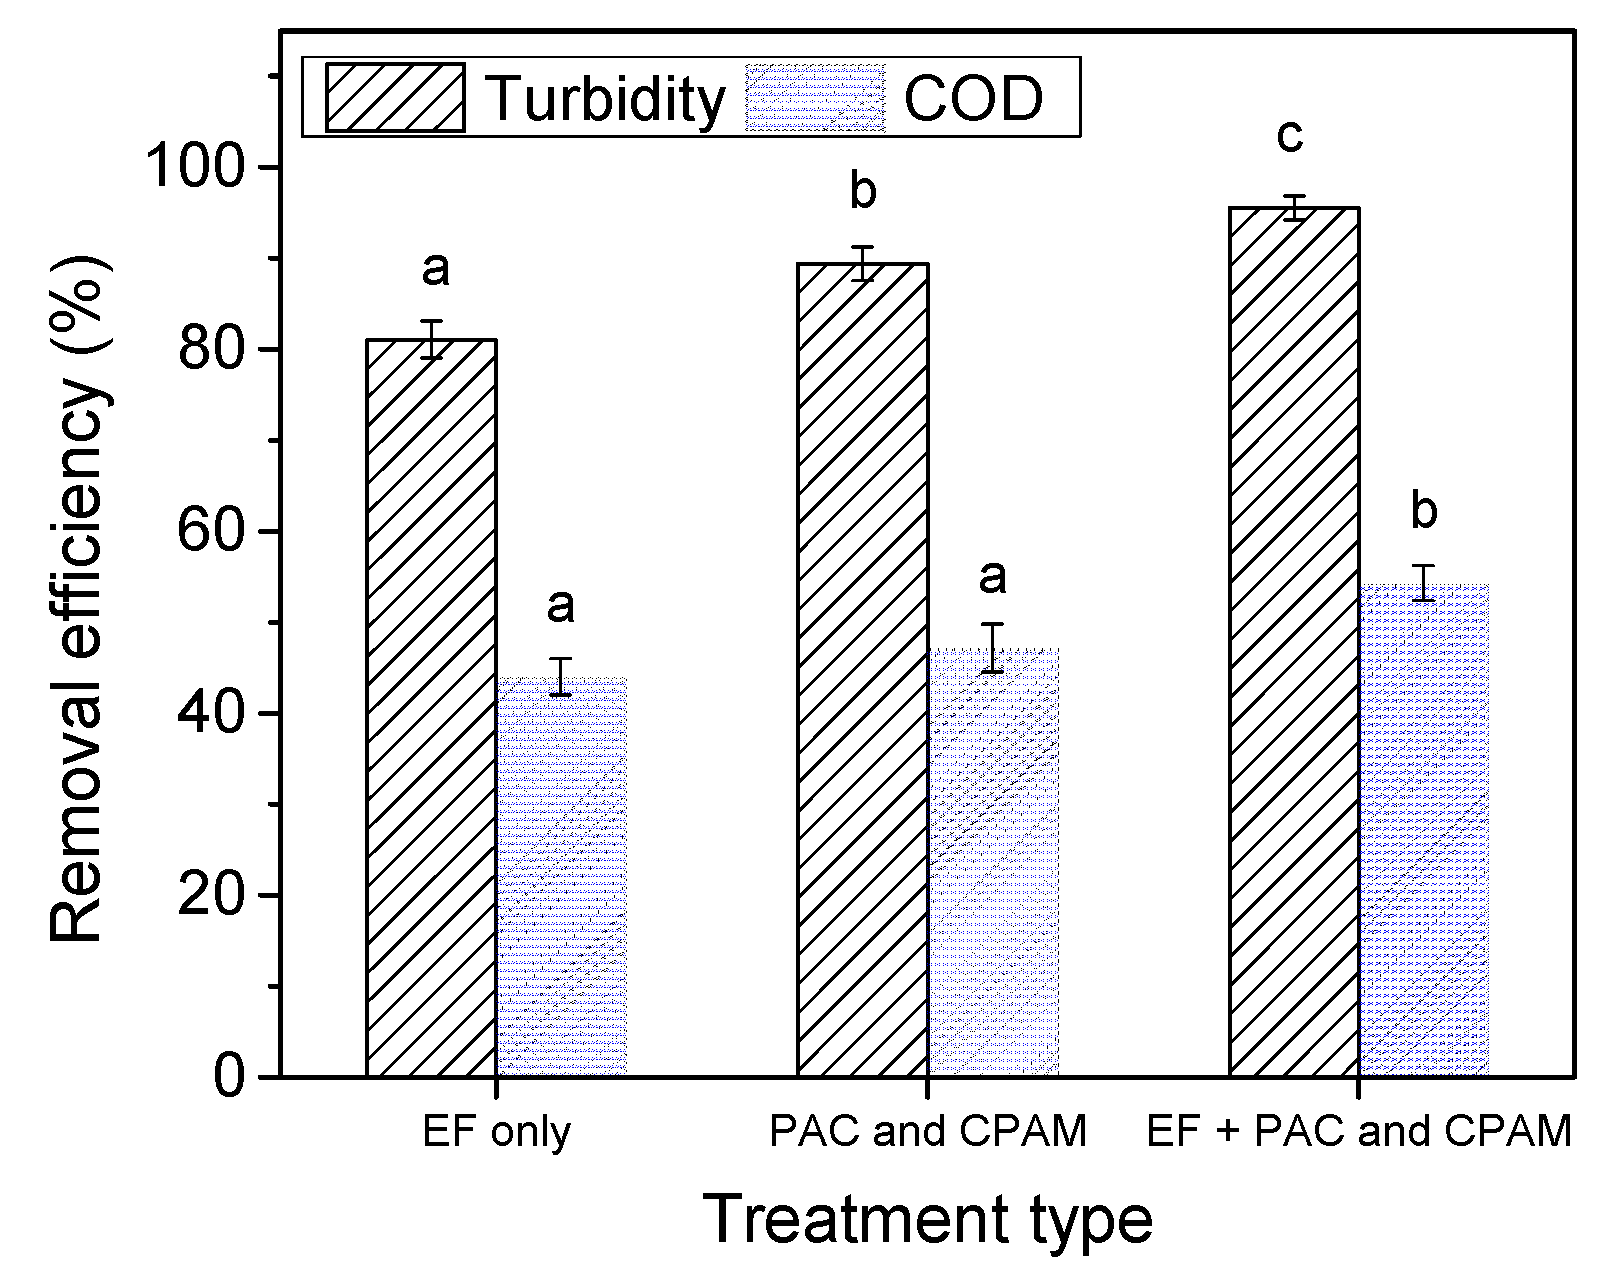
3.3. Effect of Combined Chemical Coagulation and Electroflotation on POME Treatment
4. Conclusions
Author Contributions
Funding
Institutional Review Board Statement
Informed Consent Statement
Data Availability Statement
Acknowledgments
Conflicts of Interest
References
- Karaman, C.; Karaman, O.; Show, P.L.; Orooji, Y.; Karimi-Maleh, H. Utilization of a Double-Cross-Linked Amino-Functionalized Three-Dimensional Graphene Networks as a Monolithic Adsorbent for Methyl Orange Removal: Equilibrium, Kinetics, Thermodynamics and Artificial Neural Network Modeling. Environ. Res. 2022, 207, 112156. [Google Scholar] [CrossRef] [PubMed]
- Dada, E.O.; Sifau, M.O.; Gbegbe, O.M.; Ibrahim, H.O.; Adefila, O.O. Effluent from Local Palm Oil Mill Refinery in Nigeria Is Excessively Oily and Potentially Genotoxic. Not. Sci. Biol. 2021, 13, 10962. [Google Scholar] [CrossRef]
- Ahmad, A.L.; Sithamparam, K.; Zulkali, M.M.D.; Ismail, S. Extraction of Residue Oil from Palm Oil Mill Effluent (POME) Using Organic Solvent. ASEAN J. Sci. Technol. Dev. 2017, 20, 385–394. [Google Scholar] [CrossRef] [Green Version]
- Lokman, N.A.; Ithnin, A.M.; Yahya, W.J.; Yuzir, M.A. A Brief Review on Biochemical Oxygen Demand (BOD) Treatment Methods for Palm Oil Mill Effluents (POME). Environ. Technol. Innov. 2021, 21, 101258. [Google Scholar] [CrossRef]
- Low, S.S.; Bong, K.X.; Mubashir, M.; Cheng, C.K.; Lam, M.K.; Lim, J.W.; Ho, Y.C.; Lee, K.T.; Munawaroh, H.S.H.; Show, P.L. Microalgae Cultivation in Palm Oil Mill Effluent (POME) Treatment and Biofuel Production. Sustainability 2021, 13, 3247. [Google Scholar] [CrossRef]
- Yılmaz, B.; Ağagündüz, D. Fractionated Palm Oils: Emerging Roles in the Food Industry and Possible Cardiovascular Effects. Crit. Rev. Food Sci. Nutr. 2022, 62, 1990–1998. [Google Scholar] [CrossRef]
- Ratnasari, A.; Syafiuddin, A.; Boopathy, R.; Malik, S.; Aamer Mehmood, M.; Amalia, R.; Dwi Prastyo, D.; Syamimi Zaidi, N. Advances in Pretreatment Technology for Handling the Palm Oil Mill Effluent: Challenges and Prospects. Bioresour. Technol. 2022, 344, 126239. [Google Scholar] [CrossRef]
- Cheng, Y.W.; Lee, Z.S.; Chong, C.C.; Khan, M.R.; Cheng, C.K.; Ng, K.H.; Hossain, S.S. Hydrogen-Rich Syngas Production via Steam Reforming of Palm Oil Mill Effluent (POME)—A Thermodynamics Analysis. Int. J. Hydrog. Energy 2019, 44, 20711–20724. [Google Scholar] [CrossRef]
- Onyla, C.O.; Uyub, A.M.; Akunna, J.C.; Norulaini, N.A.; Omar, A.K.M. Increasing the Fertilizer Value of Palm Oil Mill Sludge: Bioaugmentation in Nitrification. Water Sci. Technol. 2001, 44, 157–162. [Google Scholar] [CrossRef] [Green Version]
- Shavandi, M.A.; Haddadian, Z.; Ismail, M.H.S.; Abdullah, N. Continuous Metal and Residual Oil Removal from Palm Oil Mill Effluent Using Natural Zeolite-Packed Column. J. Taiwan Inst. Chem. Eng. 2012, 43, 934–941. [Google Scholar] [CrossRef]
- Syahin, M.S.; Ghani, W.W.A.K.; Loh, S.K. Decolourisation of Palm Oil Mill Effluent (Pome) Treatment Technologies: A Review. J. Oil Palm Res. 2020, 32, 1–15. [Google Scholar] [CrossRef]
- Lee, Z.S.; Chin, S.Y.; Lim, J.W.; Witoon, T.; Cheng, C.K. Treatment Technologies of Palm Oil Mill Effluent (POME) and Olive Mill Wastewater (OMW): A Brief Review. Environ. Technol. Innov. 2019, 15, 100377. [Google Scholar] [CrossRef]
- Chan, Y.J.; Chong, M.F. Palm Oil Mill Effluent (POME) Treatment—Current Technologies, Biogas Capture and Challenges. In Green Technologies for the Oil Palm Industry; Springer Singapore: Singapore, 2018; pp. 71–92. [Google Scholar]
- Department Of Environment (DOE). Environmental Quality Act 1974 [ACT 127] (Crude Palm Oil) (Amendment) Regulation; Percetakan Nasional Malaysia Berhad: Kuala Lumpur, Malaysia, 1982. Available online: https://www.doe.gov.my/wp-content/uploads/2021/11/Environmental_Quality_Prescribed_Premises_Crude_Palm_Oil_Amendment_Regulations_1982_-_P.U.A_183-82.pdf (accessed on 15 March 2023).
- Iskandar, M.J.; Baharum, A.; Anuar, F.H.; Othaman, R. Palm Oil Industry in South East Asia and the Effluent Treatment Technology—A Review. Environ. Technol. Innov. 2018, 9, 169–185. [Google Scholar] [CrossRef]
- Aris, A.; Siew, O.B.; Kee, K.S.; Ujang, Z. Tertiary Treatment of Palm Oil Mill Effluent Using Fenton Oxidation. Malays. J. Civ. Eng. 2008, 20, 12–25. [Google Scholar]
- Harsono, S.S.; Grundmann, P.; Soebronto, S. Anaerobic Treatment of Palm Oil Mill Effluents: Potential Contribution to Net Energy Yield and Reduction of Greenhouse Gas Emissions from Biodiesel Production. J. Clean. Prod. 2014, 64, 619–627. [Google Scholar] [CrossRef]
- Cheng, Y.W.; Chong, C.C.; Lam, M.K.; Ayoub, M.; Cheng, C.K.; Lim, J.W.; Yusup, S.; Tang, Y.; Bai, J. Holistic Process Evaluation of Non-Conventional Palm Oil Mill Effluent (POME) Treatment Technologies: A Conceptual and Comparative Review. J. Hazard. Mater. 2021, 409, 124964. [Google Scholar] [CrossRef] [PubMed]
- Othman, M.R.; Hassan, M.A.; Shirai, Y.; Baharuddin, A.S.; Ali, A.A.M.; Idris, J. Treatment of Effluents from Palm Oil Mill Process to Achieve River Water Quality for Reuse as Recycled Water in a Zero Emission System. J. Clean. Prod. 2014, 67, 58–61. [Google Scholar] [CrossRef]
- Suksong, W.; Kongjan, P.; O’Thong, S. Biohythane Production from Co-Digestion of Palm Oil Mill Effluent with Solid Residues by Two-Stage Solid State Anaerobic Digestion Process. Energy Procedia 2015, 79, 943–949. [Google Scholar] [CrossRef] [Green Version]
- Choi, W.H.; Shin, C.H.; Son, S.M.; Ghorpade, P.A.; Kim, J.J.; Park, J.Y. Anaerobic Treatment of Palm Oil Mill Effluent Using Combined High-Rate Anaerobic Reactors. Bioresour. Technol. 2013, 141, 138–144. [Google Scholar] [CrossRef]
- Hosseini, S.E.; Wahid, M.A. Pollutant in Palm Oil Production Process. J. Air Waste Manag. Assoc. 2015, 65, 773–781. [Google Scholar] [CrossRef]
- Ng, K.H. Adoption of TiO2-Photocatalysis for Palm Oil Mill Effluent (POME) Treatment: Strengths, Weaknesses, Opportunities, Threats (SWOT) and Its Practicality against Traditional Treatment in Malaysia. Chemosphere 2021, 270, 129378. [Google Scholar] [CrossRef] [PubMed]
- Chia, W.Y.; Chong, Y.Y.; Chew, K.W.; Vimali, E.; Jayaram, M.; Selvarajoo, A.; Muthuvelu, K.S.; Varalakshmi, P.; Show, P.L.; Arumugasamy, S.K. Outlook on Biorefinery Potential of Palm Oil Mill Effluent for Resource Recovery. J. Environ. Chem. Eng. 2020, 8, 104519. [Google Scholar] [CrossRef]
- Wahi, R.; Abdullah, L.C.; Mobarekeh, M.N.; Ngaini, Z.; Yaw, T.C.S. Utilization of Esterified Sago Bark Fibre Waste for Removal of Oil from Palm Oil Mill Effluent. J. Environ. Chem. Eng. 2017, 5, 170–177. [Google Scholar] [CrossRef]
- Khulbe, K.C.; Matsuura, T. Removal of Heavy Metals and Pollutants by Membrane Adsorption Techniques. Appl. Water Sci. 2018, 8, 14251. [Google Scholar] [CrossRef] [Green Version]
- Mahendran, R.; Malaisamy, R.; Arthanareeswaran, G.; Mohan, D. Cellulose Acetate-Poly(Ether Sulfone) Blend Ultrafiltration Membranes. II. Application Studies. J. Appl. Polym. Sci. 2004, 92, 3659–3665. [Google Scholar] [CrossRef]
- Haji Alhaji, M.; Sanaullah, K.; Fong Lim, S.; Ragai Henry Rigit, A.; Hamza, A.; Khan, A. Modeling and Optimization of Photocatalytic Treatment of Pre-Treated Palm Oil Mill Effluent (POME) in a UV/TiO2 System Using Response Surface Methodology (RSM). Cogent Eng. 2017, 4, 1382980. [Google Scholar] [CrossRef]
- Ng, K.H.; Cheng, C.K. A Novel Photomineralization of POME over UV-Responsive TiO2 Photocatalyst: Kinetics of POME Degradation and Gaseous Product Formations. RSC Adv. 2015, 5, 53100–53110. [Google Scholar] [CrossRef] [Green Version]
- Ganiyu, S.O.; Zhou, M.; Martínez-Huitle, C.A. Heterogeneous Electro-Fenton and Photoelectro-Fenton Processes: A Critical Review of Fundamental Principles and Application for Water/Wastewater Treatment. Appl. Catal. B Environ. 2018, 235, 103–129. [Google Scholar] [CrossRef]
- Rakhmania; Kamyab, H.; Yuzir, M.A.; Riyadi, F.A.; Ostadrahimi, A.; Khademi, T.; Ghfar, A.A.; Kirpichnikova, I. Electrochemical Oxidation of Palm Oil Mill Effluent Using Platinum as Anode: Optimization Using Response Surface Methodology. Environ. Res. 2022, 214, 113993. [Google Scholar] [CrossRef]
- Baran Özyurt, Ş.C. Applications of Combined Electrocoagulation and Electrooxidation Treatment to Industrial Wastewaters. Wastewater Water Qual. 2017, 56, 71–89. [Google Scholar]
- Mohd-Salleh, S.N.A.; Mohd-Zin, N.S.; Othman, N. A Review of Wastewater Treatment Using Natural Material and Its Potential as Aid and Composite Coagulant. Sains Malays. 2019, 48, 155–164. [Google Scholar] [CrossRef]
- Nasrullah, M.; Singh, L.; Krishnan, S.; Sakinah, M.; Zularisam, A.W. Electrode Design for Electrochemical Cell to Treat Palm Oil Mill Effluent by Electrocoagulation Process. Environ. Technol. Innov. 2018, 9, 323–341. [Google Scholar] [CrossRef]
- Nasrullah, M.; Zularisam, A.W.; Krishnan, S.; Sakinah, M.; Singh, L.; Fen, Y.W. High Performance Electrocoagulation Process in Treating Palm Oil Mill Effluent Using High Current Intensity Application. Chinese J. Chem. Eng. 2019, 27, 208–217. [Google Scholar] [CrossRef]
- Moussa, D.T.; El-Naas, M.H.; Nasser, M.; Al-Marri, M.J. A Comprehensive Review of Electrocoagulation for Water Treatment: Potentials and Challenges. J. Environ. Manag. 2017, 186, 24–41. [Google Scholar] [CrossRef] [PubMed]
- Mohtashami, R.; Shang, J.Q. Electroflotation for Treatment of Industrial Wastewaters: A Focused Review. Environ. Process. 2019, 6, 325–353. [Google Scholar] [CrossRef]
- Ghanbari, F.; Moradi, M.; Eslami, A.; Emamjomeh, M.M. Electrocoagulation/Flotation of Textile Wastewater with Simultaneous Application of Aluminum and Iron as Anode. Environ. Process. 2014, 1, 447–457. [Google Scholar] [CrossRef] [Green Version]
- Kumar, V.; Kangri Vishwavidyalaya, G. A Review on the Feasibility of Electrolytic Treatment of Wastewater: Prospective and Constraints Phytoremediation of Industrial Effluents Using Aquatic Macrophytes View Project Bio-Remediation of Contaminants along with Bio-Energy Production View Project. Constraints 2017, 2, 52–62. [Google Scholar]
- Nahui, F.N.B.; Nascimento, M.R.; Cavalcanti, E.B.; Vilar, E.O. Electroflotation of Emulsified Oil in Industrial Wastes Evaluated with a Full Factorial Design. Braz. J. Chem. Eng. 2008, 25, 435–442. [Google Scholar] [CrossRef] [Green Version]
- Kyzas, G.Z.; Matis, K.A. Electroflotation Process: A Review. J. Mol. Liq. 2016, 220, 657–664. [Google Scholar] [CrossRef]
- Ma, B.; Xue, W.; Ding, Y.; Hu, C.; Liu, H.; Qu, J. Removal Characteristics of Microplastics by Fe-Based Coagulants during Drinking Water Treatment. J. Environ. Sci. 2019, 78, 267–275. [Google Scholar] [CrossRef]
- Wu, Y.; Wang, D.; Liu, X.; Xu, Q.; Chen, Y.; Yang, Q.; Li, H.; Ni, B. Effect of Poly Aluminum Chloride on Dark Fermentative Hydrogen Accumulation from Waste Activated Sludge. Water Res. 2019, 153, 217–228. [Google Scholar] [CrossRef] [PubMed]
- Ahmad, A.L.; Wong, S.S.; Teng, T.T.; Zuhairi, A. Improvement of Alum and PACl Coagulation by Polyacrylamides (PAMs) for the Treatment of Pulp and Paper Mill Wastewater. Chem. Eng. J. 2008, 137, 510–517. [Google Scholar] [CrossRef]
- Krupińska, I. Aluminium Drinking Water Treatment Residuals and Their Toxic Impact on Human Health. Molecules 2020, 25, 641. [Google Scholar] [CrossRef] [PubMed]
- Meetiyagoda, T.A.O.K.; Fujino, T. Optimization of Electrocoagulation–Flotation Treatment with an Aluminum Anode to Enhance Microcystis Aeruginosa Cell Removal Efficiency. J. Water Process Eng. 2022, 48, 102871. [Google Scholar] [CrossRef]
- Malik, Q.H. Performance of Alum and Assorted Coagulants in Turbidity Removal of Muddy Water. Appl. Water Sci. 2018, 8, 40. [Google Scholar] [CrossRef]
- Zhang, Z.; Jing, R.; He, S.; Qian, J.; Zhang, K.; Ma, G.; Chang, X.; Zhang, M.; Li, Y. Coagulation of Low Temperature and Low Turbidity Water: Adjusting Basicity of Polyaluminum Chloride (PAC) and Using Chitosan as Coagulant Aid. Sep. Purif. Technol. 2018, 206, 131–139. [Google Scholar] [CrossRef]
- Sun, J.; Ma, X.; Li, X.; Fan, J.; Chen, Q.; Liu, X.; Pan, J. Synthesis of a Cationic Polyacrylamide under UV Initiation and Its Flocculation in Estrone Removal. Int. J. Polym. Sci. 2018, 2018, 8230965. [Google Scholar] [CrossRef] [Green Version]
- Zhao, C.; Zheng, H.; Gao, B.; Liu, Y.; Zhai, J.; Zhang, S.; Xu, B. Ultrasound-Initiated Synthesis of Cationic Polyacrylamide for Oily Wastewater Treatment: Enhanced Interaction between the Flocculant and Contaminants. Ultrason. Sonochem. 2018, 42, 31–41. [Google Scholar] [CrossRef]
- Foong, S.Z.Y.; Chong, M.F.; Ng, D.K.S. Strategies to Promote Biogas Generation and Utilisation from Palm Oil Mill Effluent. Process Integr. Optim. Sustain. 2021, 5, 175–191. [Google Scholar] [CrossRef]
- Aziz, M.M.A.; Kassim, K.A.; ElSergany, M.; Anuar, S.; Jorat, M.E.; Yaacob, H.; Ahsan, A.; Imteaz, M.A. Arifuzzaman Recent Advances on Palm Oil Mill Effluent (POME) Pretreatment and Anaerobic Reactor for Sustainable Biogas Production. Renew. Sustain. Energy Rev. 2020, 119, 109603. [Google Scholar] [CrossRef]
- Mahmod, S.S.; Takriff, M.S.; AL-Rajabi, M.M.; Abdul, P.M.; Gunny, A.A.N.; Silvamany, H.; Jahim, J.M. Water Reclamation from Palm Oil Mill Effluent (POME): Recent Technologies, by-Product Recovery, and Challenges. J. Water Process Eng. 2023, 52, 103488. [Google Scholar] [CrossRef]
- Soo, P.L.; Bashir, M.J.K.; Wong, L.P. Recent Advancements in the Treatment of Palm Oil Mill Effluent (POME) Using Anaerobic Biofilm Reactors: Challenges and Future Perspectives. J. Environ. Manage. 2022, 320, 115750. [Google Scholar] [CrossRef] [PubMed]
- Chin, M.J.; Poh, P.E.; Tey, B.T.; Chan, E.S.; Chin, K.L. Biogas from Palm Oil Mill Effluent (POME): Opportunities and Challenges from Malaysia’s Perspective. Renew. Sustain. Energy Rev. 2013, 26, 717–726. [Google Scholar] [CrossRef]
- Taha, M.R.; Ibrahim, A.H. COD Removal from Anaerobically Treated Palm Oil Mill Effluent (AT-POME) via Aerated Heterogeneous Fenton Process: Optimization Study. J. Water Process Eng. 2014, 1, 8–16. [Google Scholar] [CrossRef]
- Bashir, M.J.; Lim, J.H.; Abu Amr, S.S.; Wong, L.P.; Sim, Y.L. Post Treatment of Palm Oil Mill Effluent Using Electro-Coagulation-Peroxidation (ECP) Technique. J. Clean. Prod. 2019, 208, 716–727. [Google Scholar] [CrossRef]
- Vijayaraghavan, K.; Ahmad, D.; Ezani Bin Abdul Aziz, M. Aerobic Treatment of Palm Oil Mill Effluent. J. Environ. Manage. 2007, 82, 24–31. [Google Scholar] [CrossRef]
- Belkacem, S.; Bouafia, S.; Chabani, M. Study of Oxytetracycline Degradation by Means of Anodic Oxidation Process Using Platinized Titanium (Ti/Pt) Anode and Modeling by Artificial Neural Networks. Process Saf. Environ. Prot. 2017, 111, 170–179. [Google Scholar] [CrossRef]
- Swain, K.; Abbassi, B.; Kinsley, C. Combined Electrocoagulation and Chemical Coagulation in Treating Brewery Wastewater. Water 2020, 12, 726. [Google Scholar] [CrossRef] [Green Version]
- Poh, P.E.; Ong, W.Y.J.; Lau, E.V.; Chong, M.N. Investigation on Micro-Bubble Flotation and Coagulation for the Treatment of Anaerobically Treated Palm Oil Mill Effluent (POME). J. Environ. Chem. Eng. 2014, 2, 1174–1181. [Google Scholar] [CrossRef]
- Trinke, P.; Bensmann, B.; Hanke-Rauschenbach, R. Current Density Effect on Hydrogen Permeation in PEM Water Electrolyzers. Int. J. Hydrog. Energy 2017, 42, 14355–14366. [Google Scholar] [CrossRef]
- Mansour, L.B.; Kolsi, K.; Ksentini, I. Influence of Current Density on Oxygen Transfer in an Electroflotation Cell. J. Appl. Electrochem. 2007, 37, 887–892. [Google Scholar] [CrossRef]
- Ho, C.C.; Chan, C.Y. The Application of Lead Dioxide-Coated Titanium Anode in the Electroflotation of Palm Oil Mill Effluent. Water Res. 1986, 20, 1523–1527. [Google Scholar] [CrossRef]
- Zakaria, Z.A.; Ahmad, W.A. Organic and Inorganic Matter Removal Using High Polymeric Al13 Containing Polyaluminium Chloride. Water. Air. Soil Pollut. 2020, 231, 310. [Google Scholar] [CrossRef]
- Wang, J.; Zhu, M.; Chen, Z.; Chen, Y.; Hayat, T.; Alsaedi, A.; Wang, X. Polyacrylamide Modified Molybdenum Disulfide Composites for Efficient Removal of Graphene Oxide from Aqueous Solutions. Chem. Eng. J. 2019, 361, 651–659. [Google Scholar] [CrossRef]
- Guan, Q.; Zhu, G.; Liao, Y.; Xu, J.; Sun, X.; Tian, F.; Xu, J.; Luo, M. Preparation, Characterization, and Sludge Conditioning of Cationic Polyacrylamide Synthesized by a Novel UVA-Initiated System. Processes 2018, 6, 233. [Google Scholar] [CrossRef] [Green Version]
- Duggan, K.L.; Morris, M.; Bhatia, S.K.; Khachan, M.M.; Lewis, K.E. Effects of Cationic Polyacrylamide and Cationic Starch on Aquatic Life. J. Hazard. Toxic Radioact. Waste 2019, 23, 04019022. [Google Scholar] [CrossRef]


| Parameter | Limit |
|---|---|
| pH | 5.0–9.0 |
| Temperature | 45 °C |
| Total suspended solids | 400 mg/L |
| BOD (3-day) | 100 mg/L |
| COD | N/A |
| Oil and grease | 50 mg/L |
| Ammonia as nitrogen | 150 mg/L |
| Method | COD Removal Efficiency |
|---|---|
| Anaerobic filtration | 94% |
| Up-flow anaerobic sludge blanket (UASB) | 98.4% |
| Anaerobic sequencing batch reactor (ASBR) | 92% |
| Expanded granular sludge bed (EGSB) | 94.89% |
| Continuous stirred tank reactor (CSTR) | 80% |
| Ultrasonic membrane anaerobic system (UMAS) | 93–98.7% |
| Parameter | Value (Average, SD) |
|---|---|
| pH | 6.64 ± 0.1 |
| Electrical conductivity | 451 ± 20 µS/cm |
| Oxidation–reduction potential (ORP) | 164 ± 10 mV |
| Turbidity | 1431 ± 10 NTU |
| Dissolved oxygen | 8.24 ± 0.2 mg/L |
| Dissolved hydrogen | <0.001 mg/L |
| COD | 3860 ± 30 mg/L |
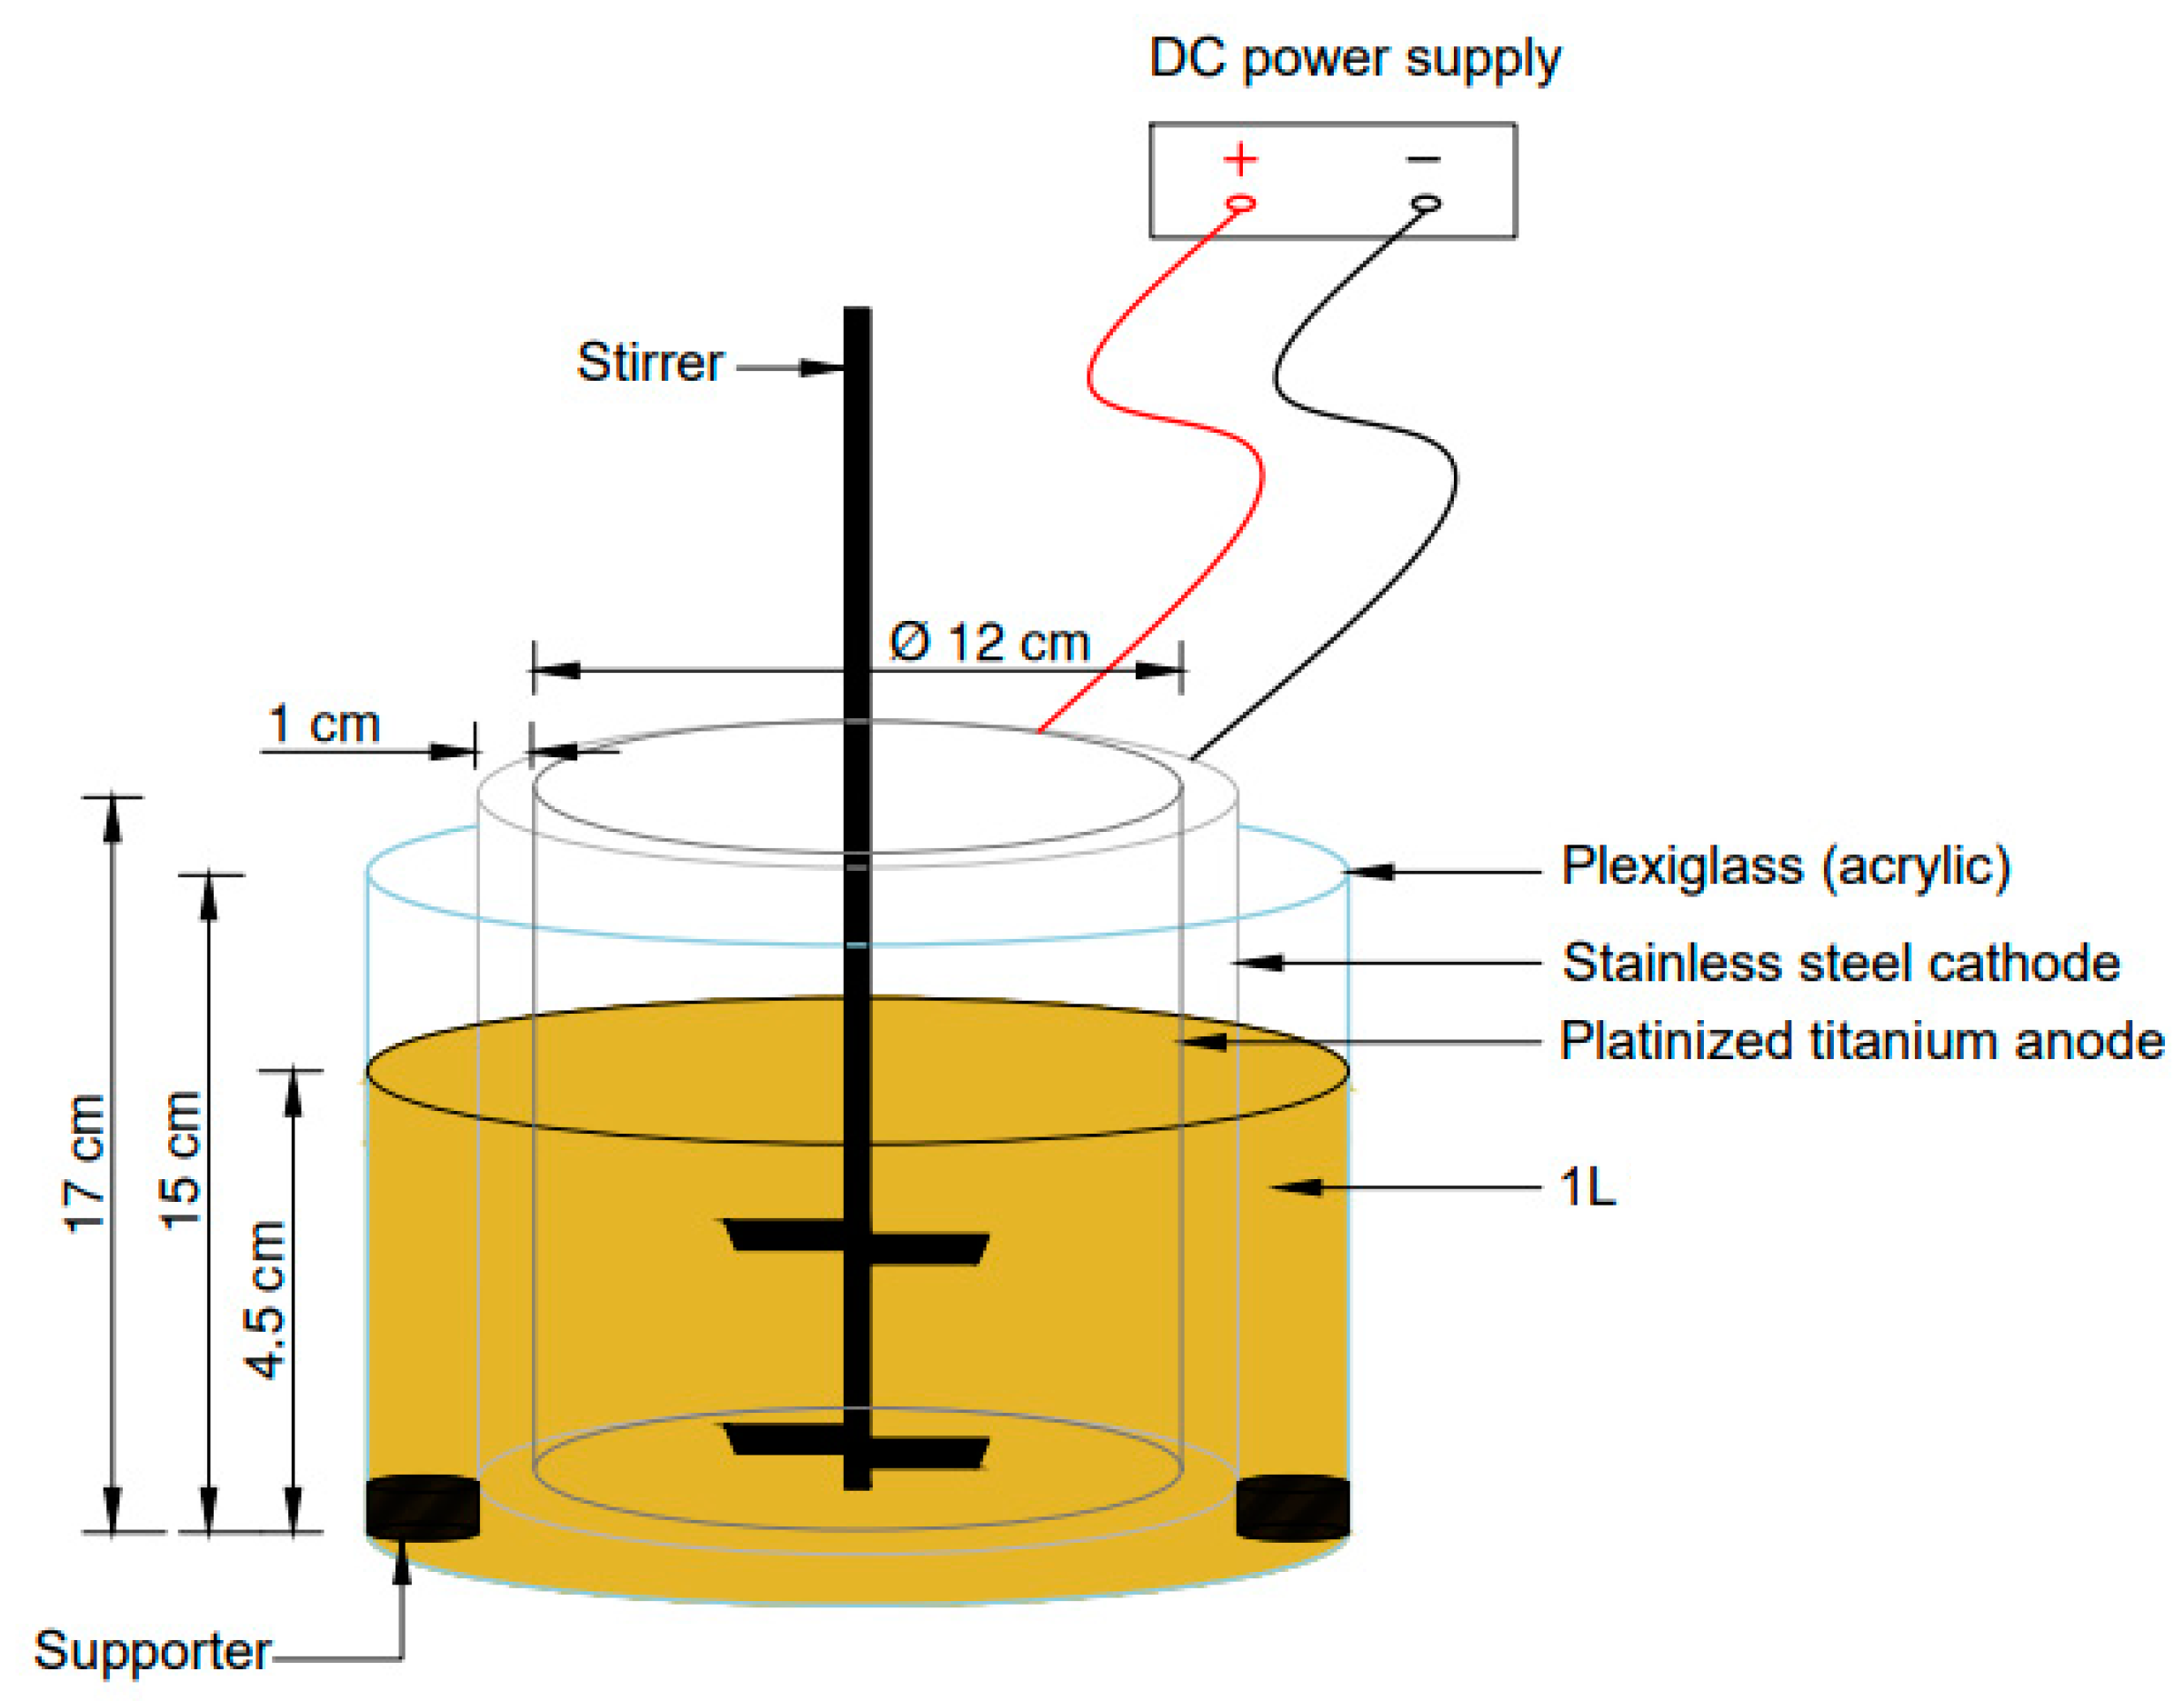
| Electrode material | Anode: Platinized titanium, Cathode: Stainless steel |
| Shape | Cylindrical |
| Effective surface area | Anode: 340 cm2, Cathode: 396 cm2 |
| Inter electrode distance | 1 cm |
| Reactor dimensions | 15 cm (Height); 16 cm (Diameter) |
| Effective volume of the cell | 1 L |
| Parameter (Units) | Instrument | Model |
|---|---|---|
| pH | Portable digital meter | HM-40P, DKK-TOA |
| Electrical conductivity (µS/cm) | Portable conductivity meter | AS710 |
| Zeta potential (mV) | Zeta potential and particle size analyzer | ELSZ-2000 |
| DO (mg/L) | Portable DO meter | HQ30D |
| DH (mg/L) | Portable hydrogen meter | ENH-2000 |
| Turbidity (NTU) | Laboratory turbidity meter | 2100 N |
Disclaimer/Publisher’s Note: The statements, opinions and data contained in all publications are solely those of the individual author(s) and contributor(s) and not of MDPI and/or the editor(s). MDPI and/or the editor(s) disclaim responsibility for any injury to people or property resulting from any ideas, methods, instructions or products referred to in the content. |
© 2023 by the authors. Licensee MDPI, Basel, Switzerland. This article is an open access article distributed under the terms and conditions of the Creative Commons Attribution (CC BY) license (https://creativecommons.org/licenses/by/4.0/).
Share and Cite
Fobang, E.Y.; Fujino, T.; Meetiyagoda, T.A.O.K. Synergetic Effect of Chemical Coagulation and Electroflotation on Synthetic Palm Oil Mill Effluent Treatment. Sustain. Chem. 2023, 4, 127-142. https://doi.org/10.3390/suschem4020010
Fobang EY, Fujino T, Meetiyagoda TAOK. Synergetic Effect of Chemical Coagulation and Electroflotation on Synthetic Palm Oil Mill Effluent Treatment. Sustainable Chemistry. 2023; 4(2):127-142. https://doi.org/10.3390/suschem4020010
Chicago/Turabian StyleFobang, Enjeh Yoland, Takeshi Fujino, and Thenuwara Arachchige Omila Kasun Meetiyagoda. 2023. "Synergetic Effect of Chemical Coagulation and Electroflotation on Synthetic Palm Oil Mill Effluent Treatment" Sustainable Chemistry 4, no. 2: 127-142. https://doi.org/10.3390/suschem4020010