
Utilization of Azadirachta indica Sawdust as a Potential Adsorbent for the Removal of Crystal Violet Dye


Abstract
:1. Introduction
2. Experimental Procedure
2.1. Materials
2.2. Adsorbent Preparation
2.3. Adsorbent Characterization
2.4. Study of Operational Parameters
2.5. Regeneration and Desorption Experiment
3. Results and Discussion
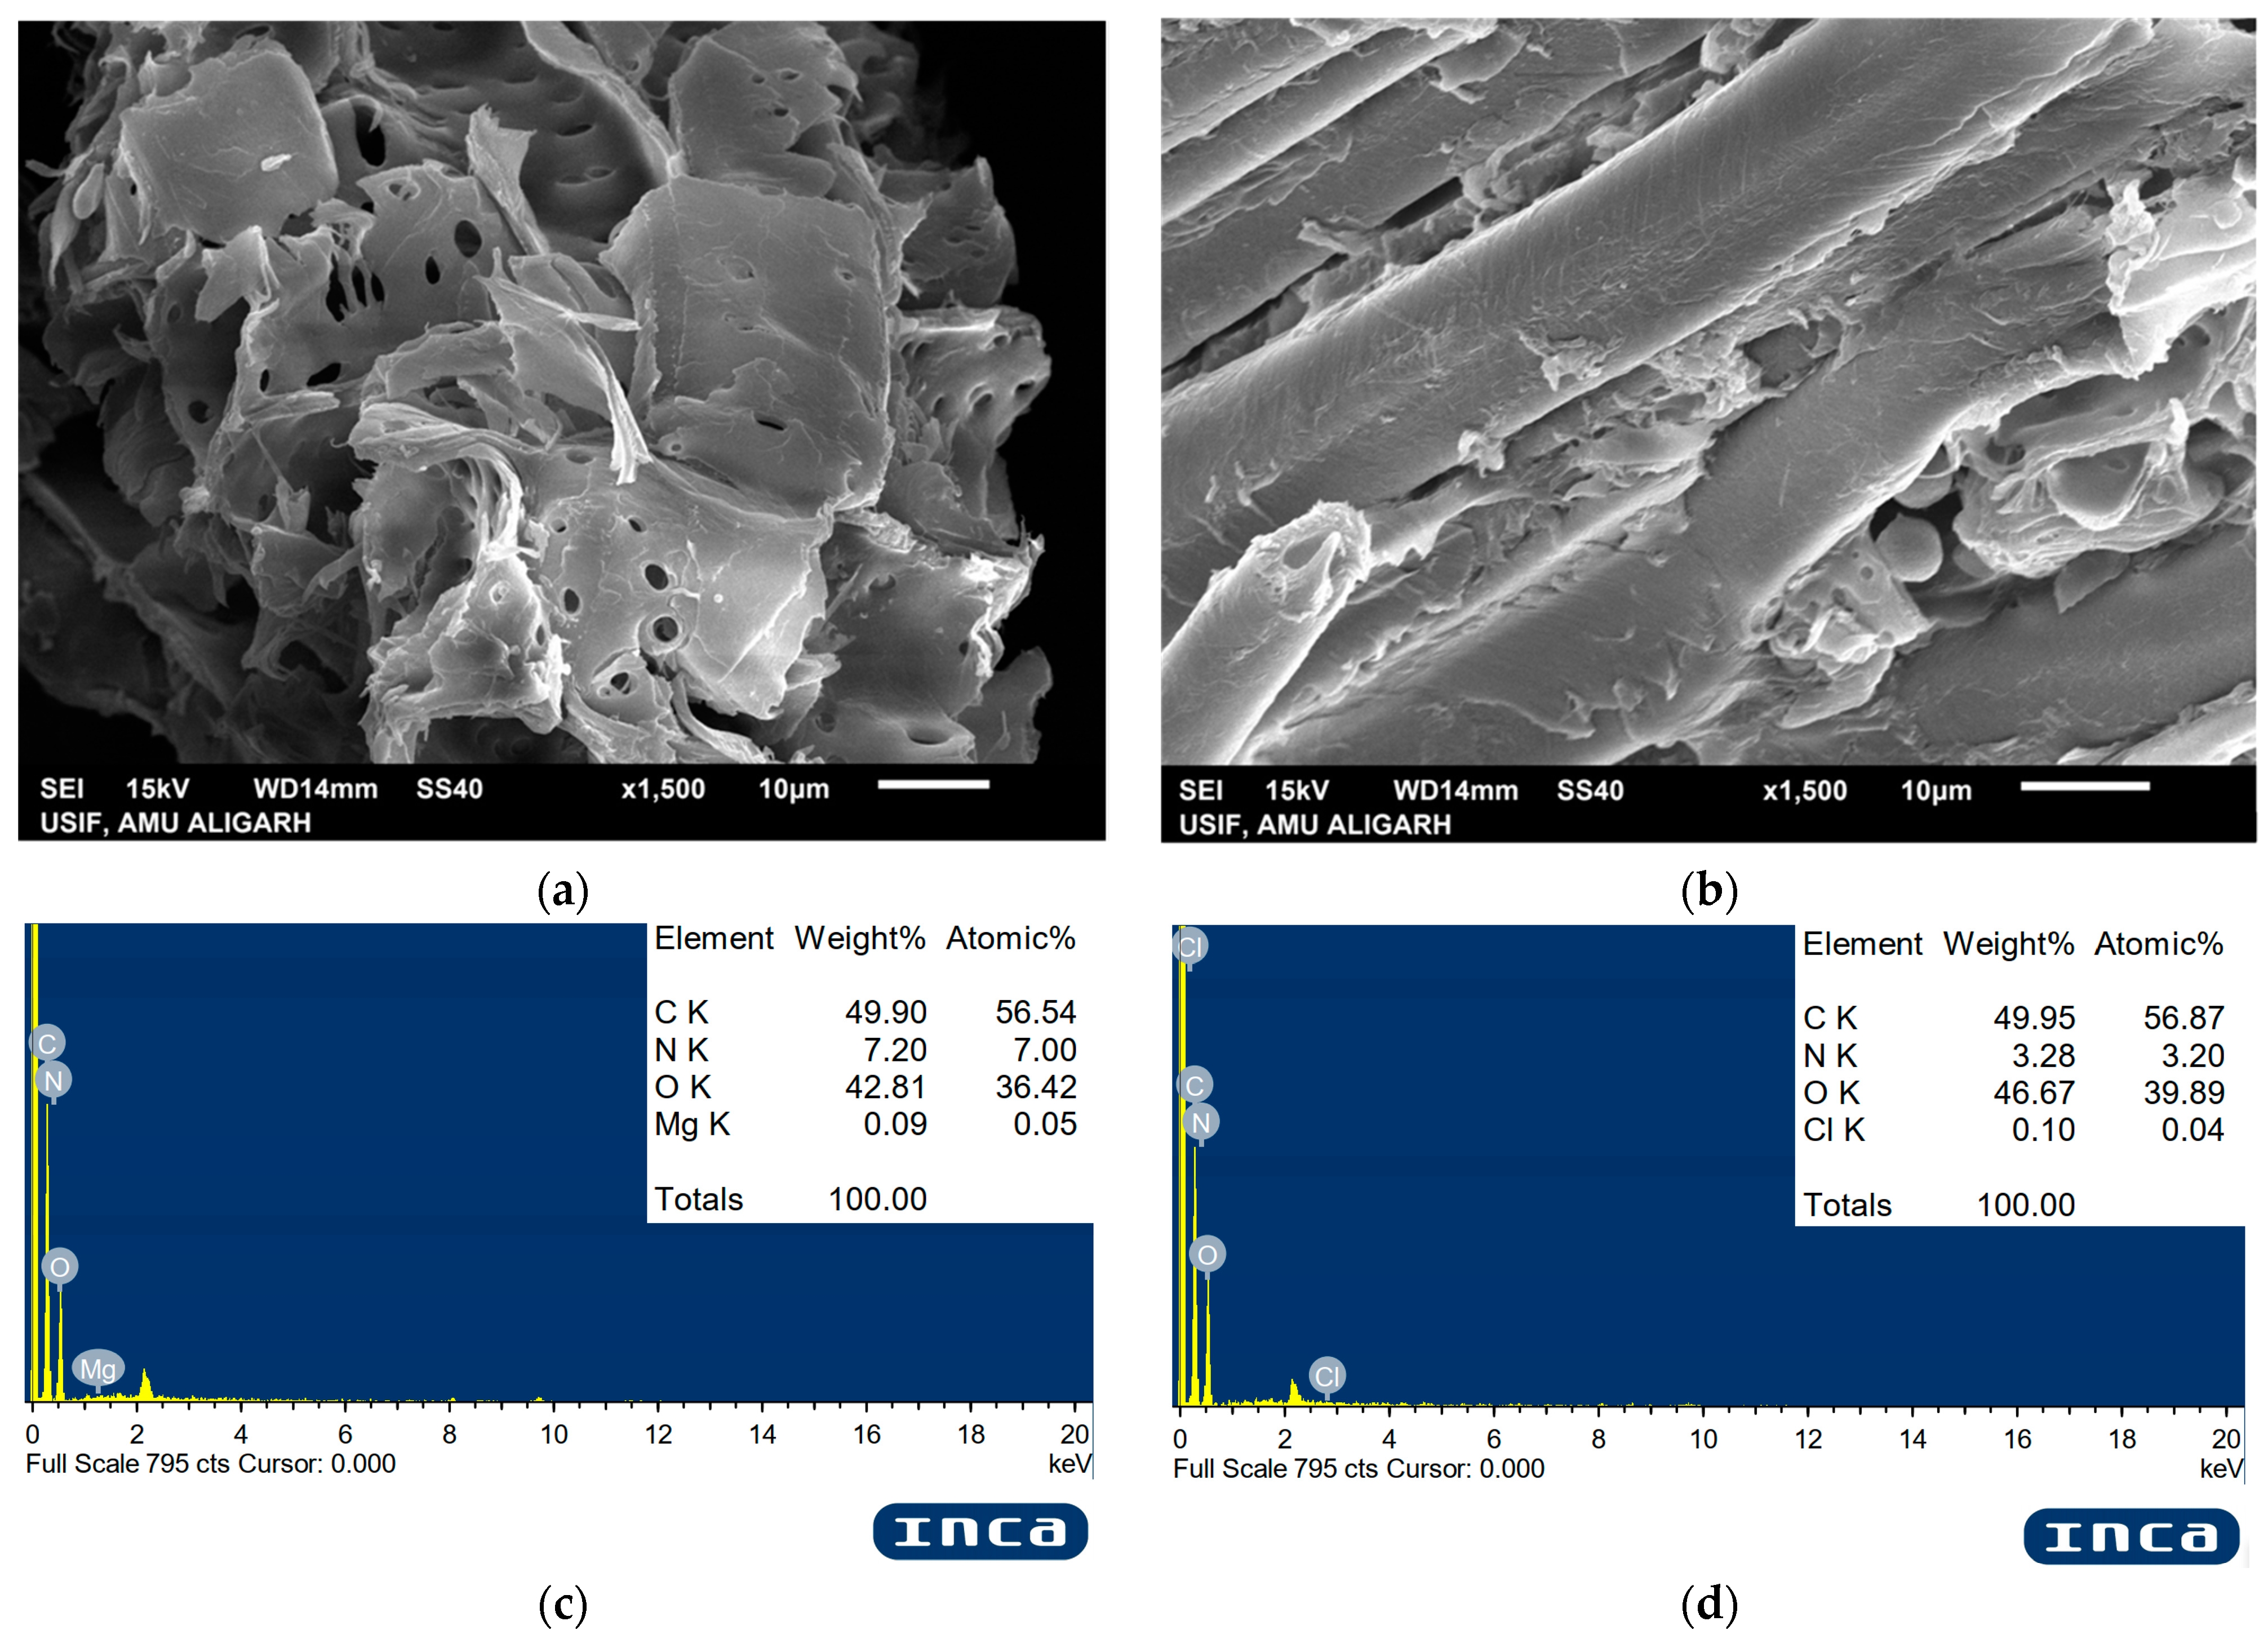
3.1. SEM/EDXS Analyses
3.2. TEM Analysis
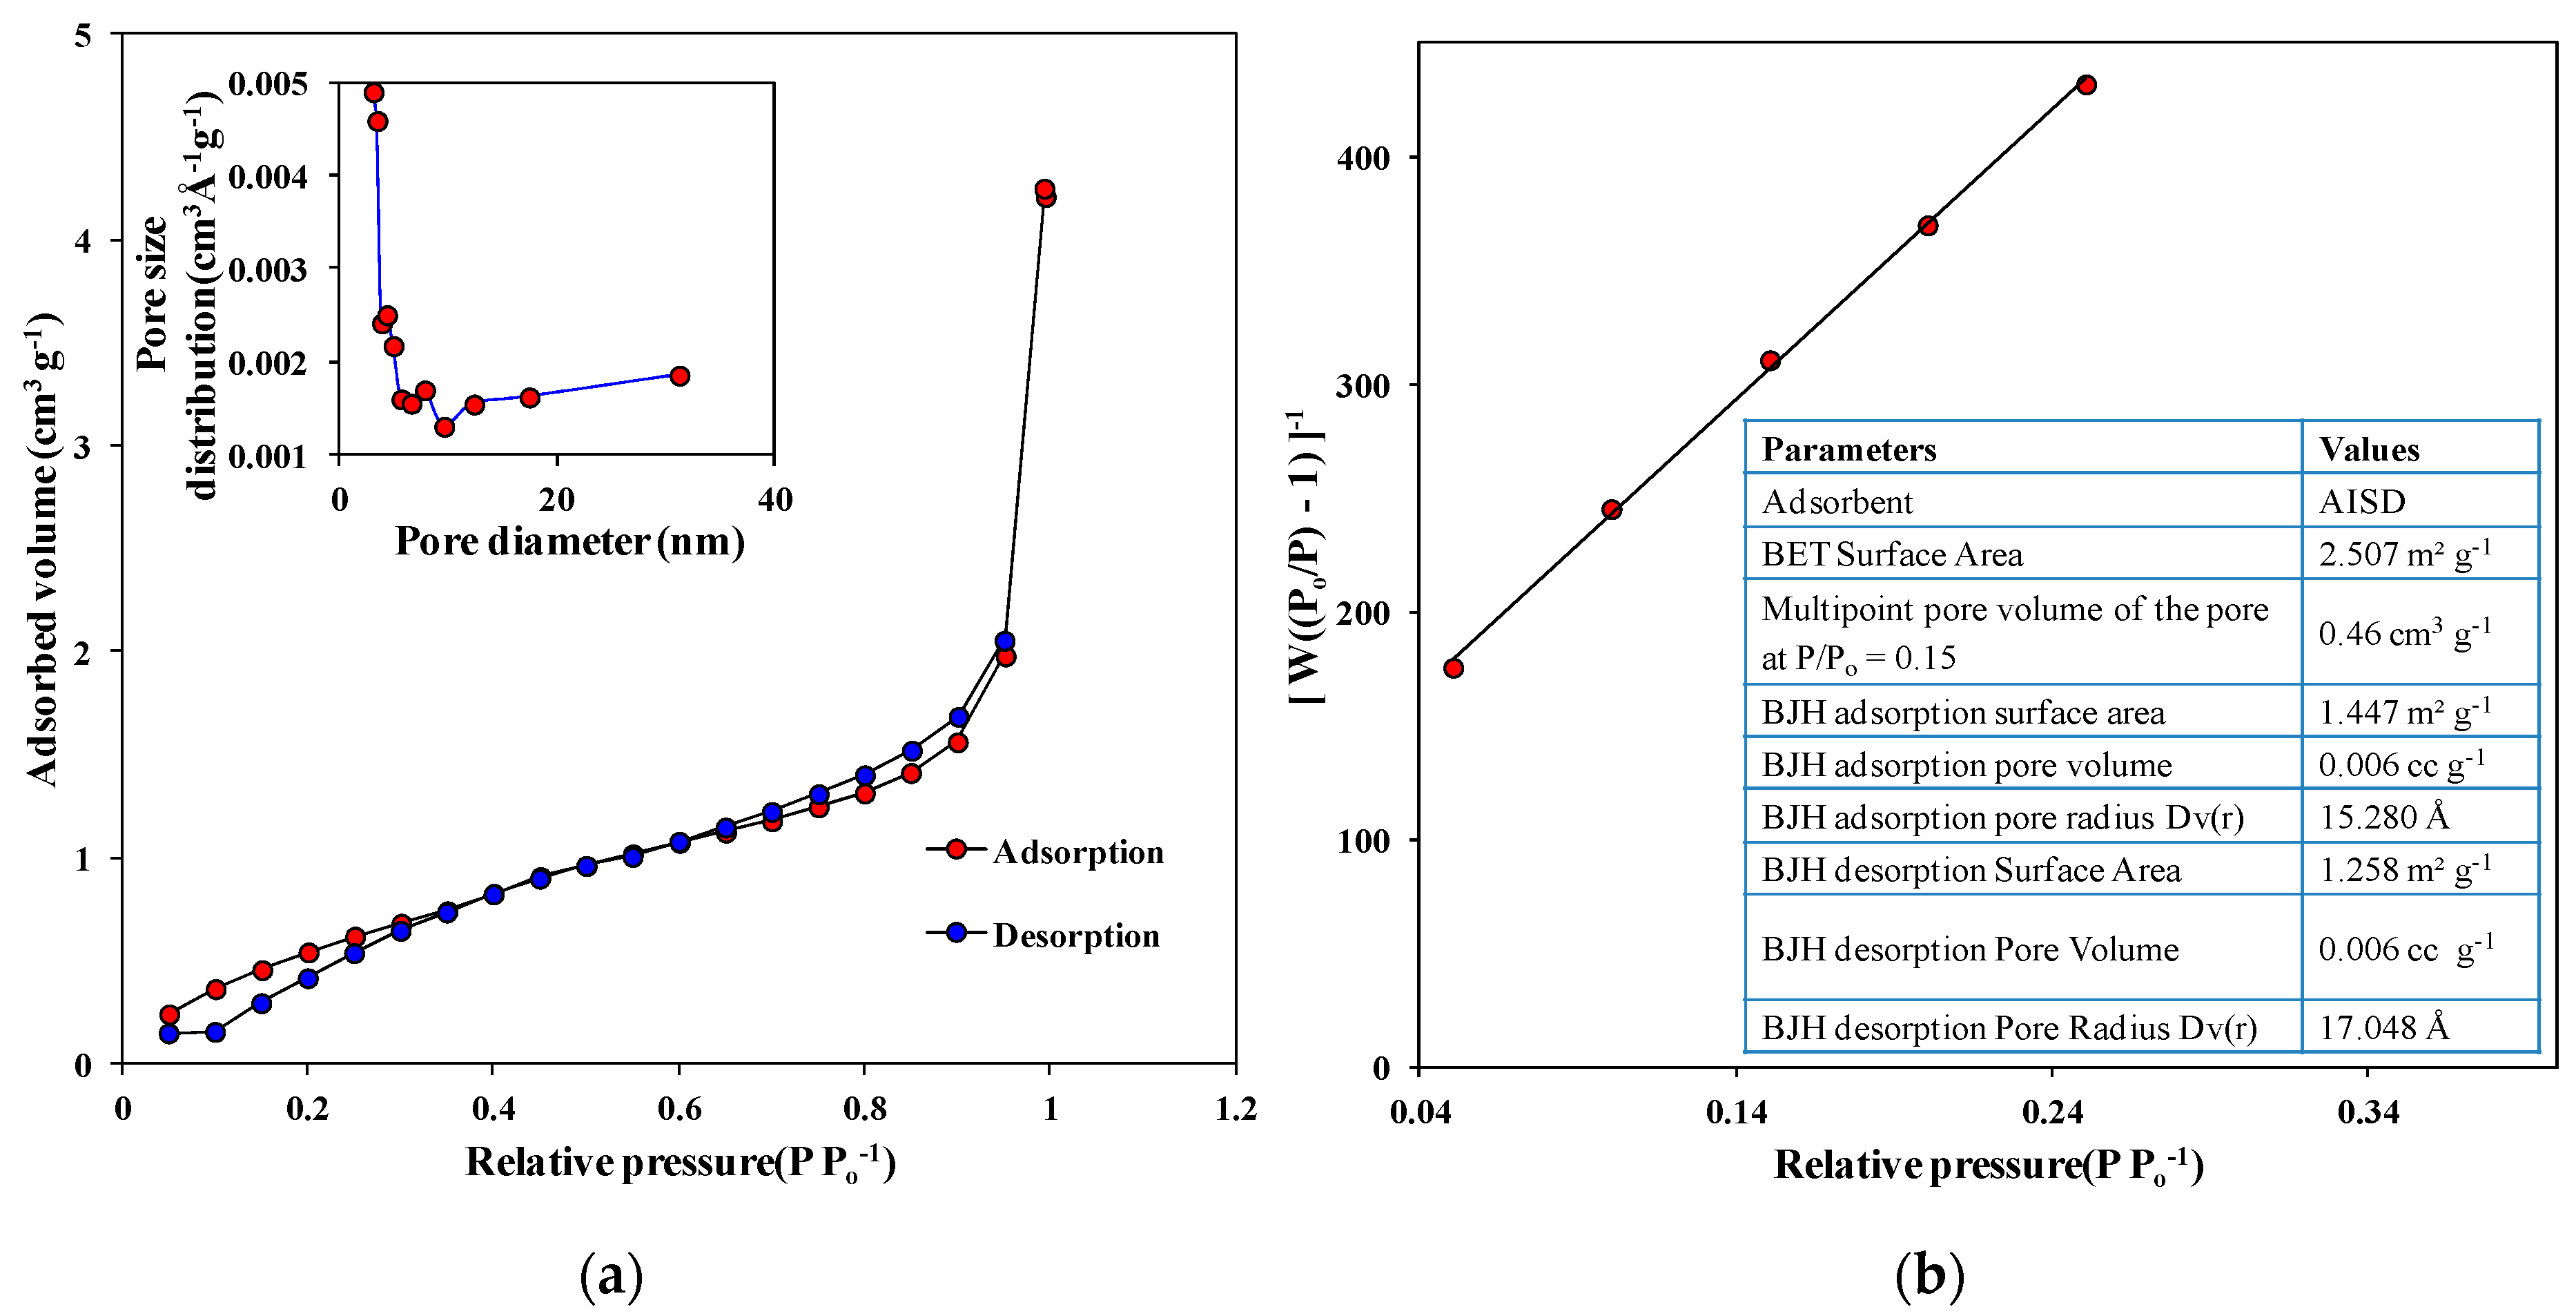
3.3. BET Analysis
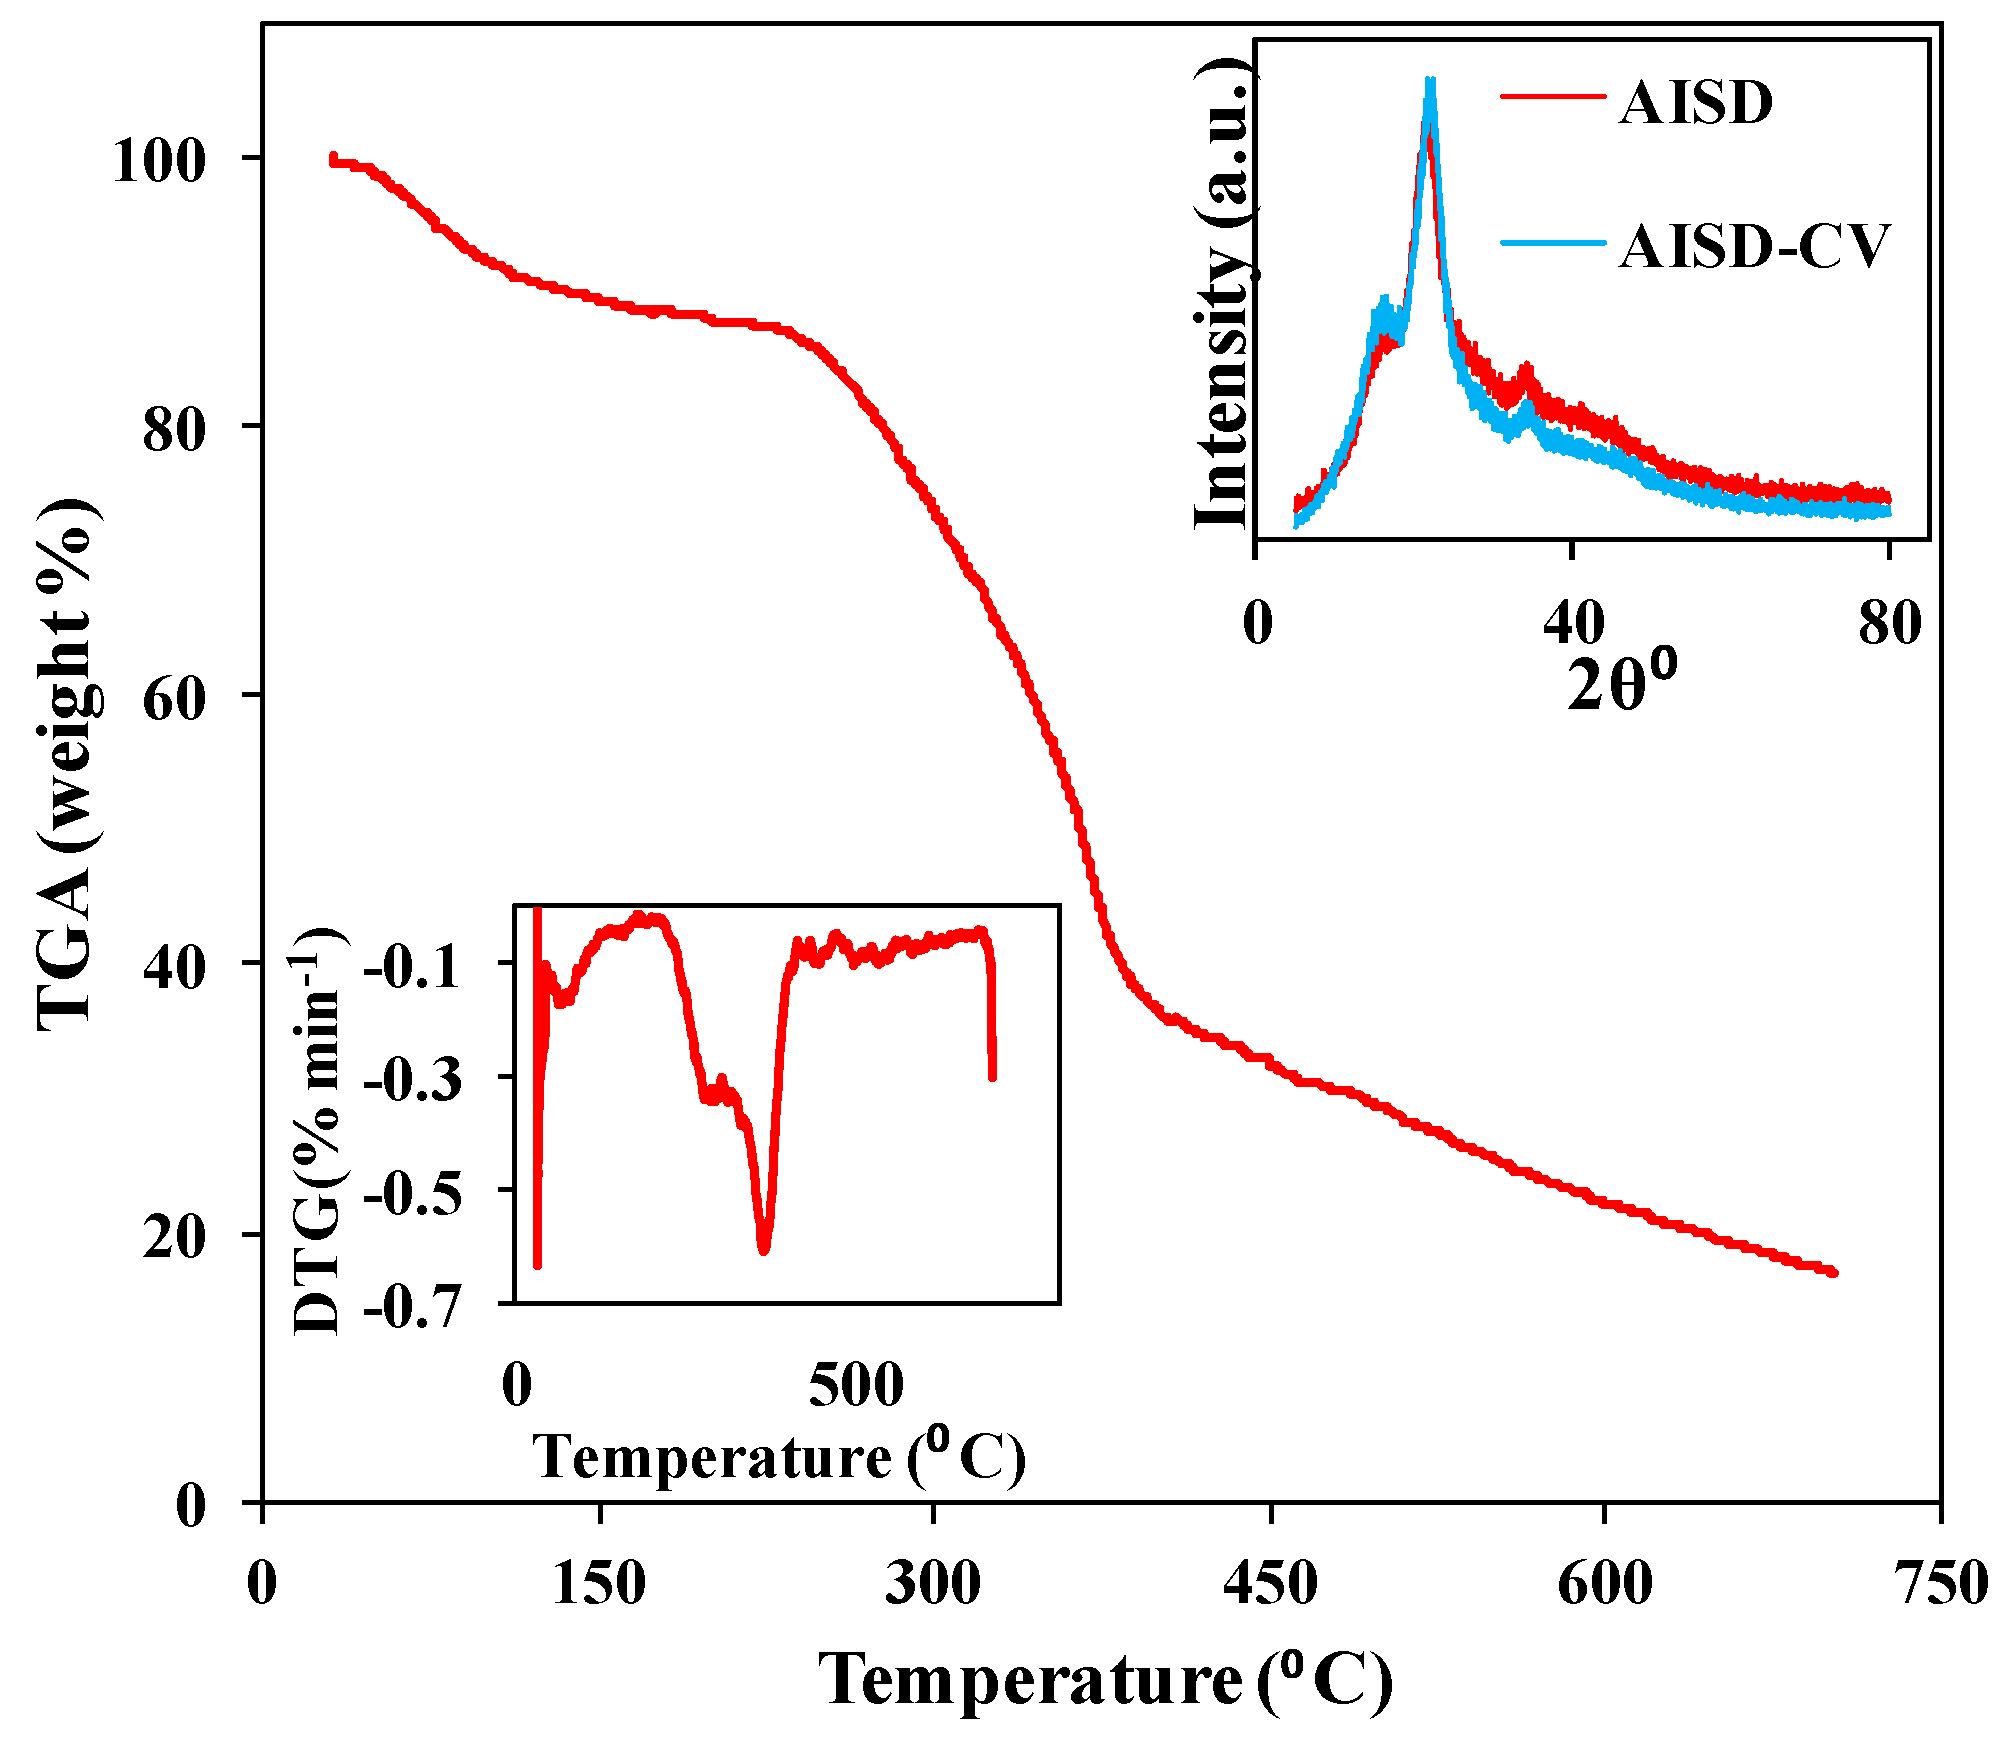
3.4. XRD Analysis
3.5. TGA-DTG Analysis
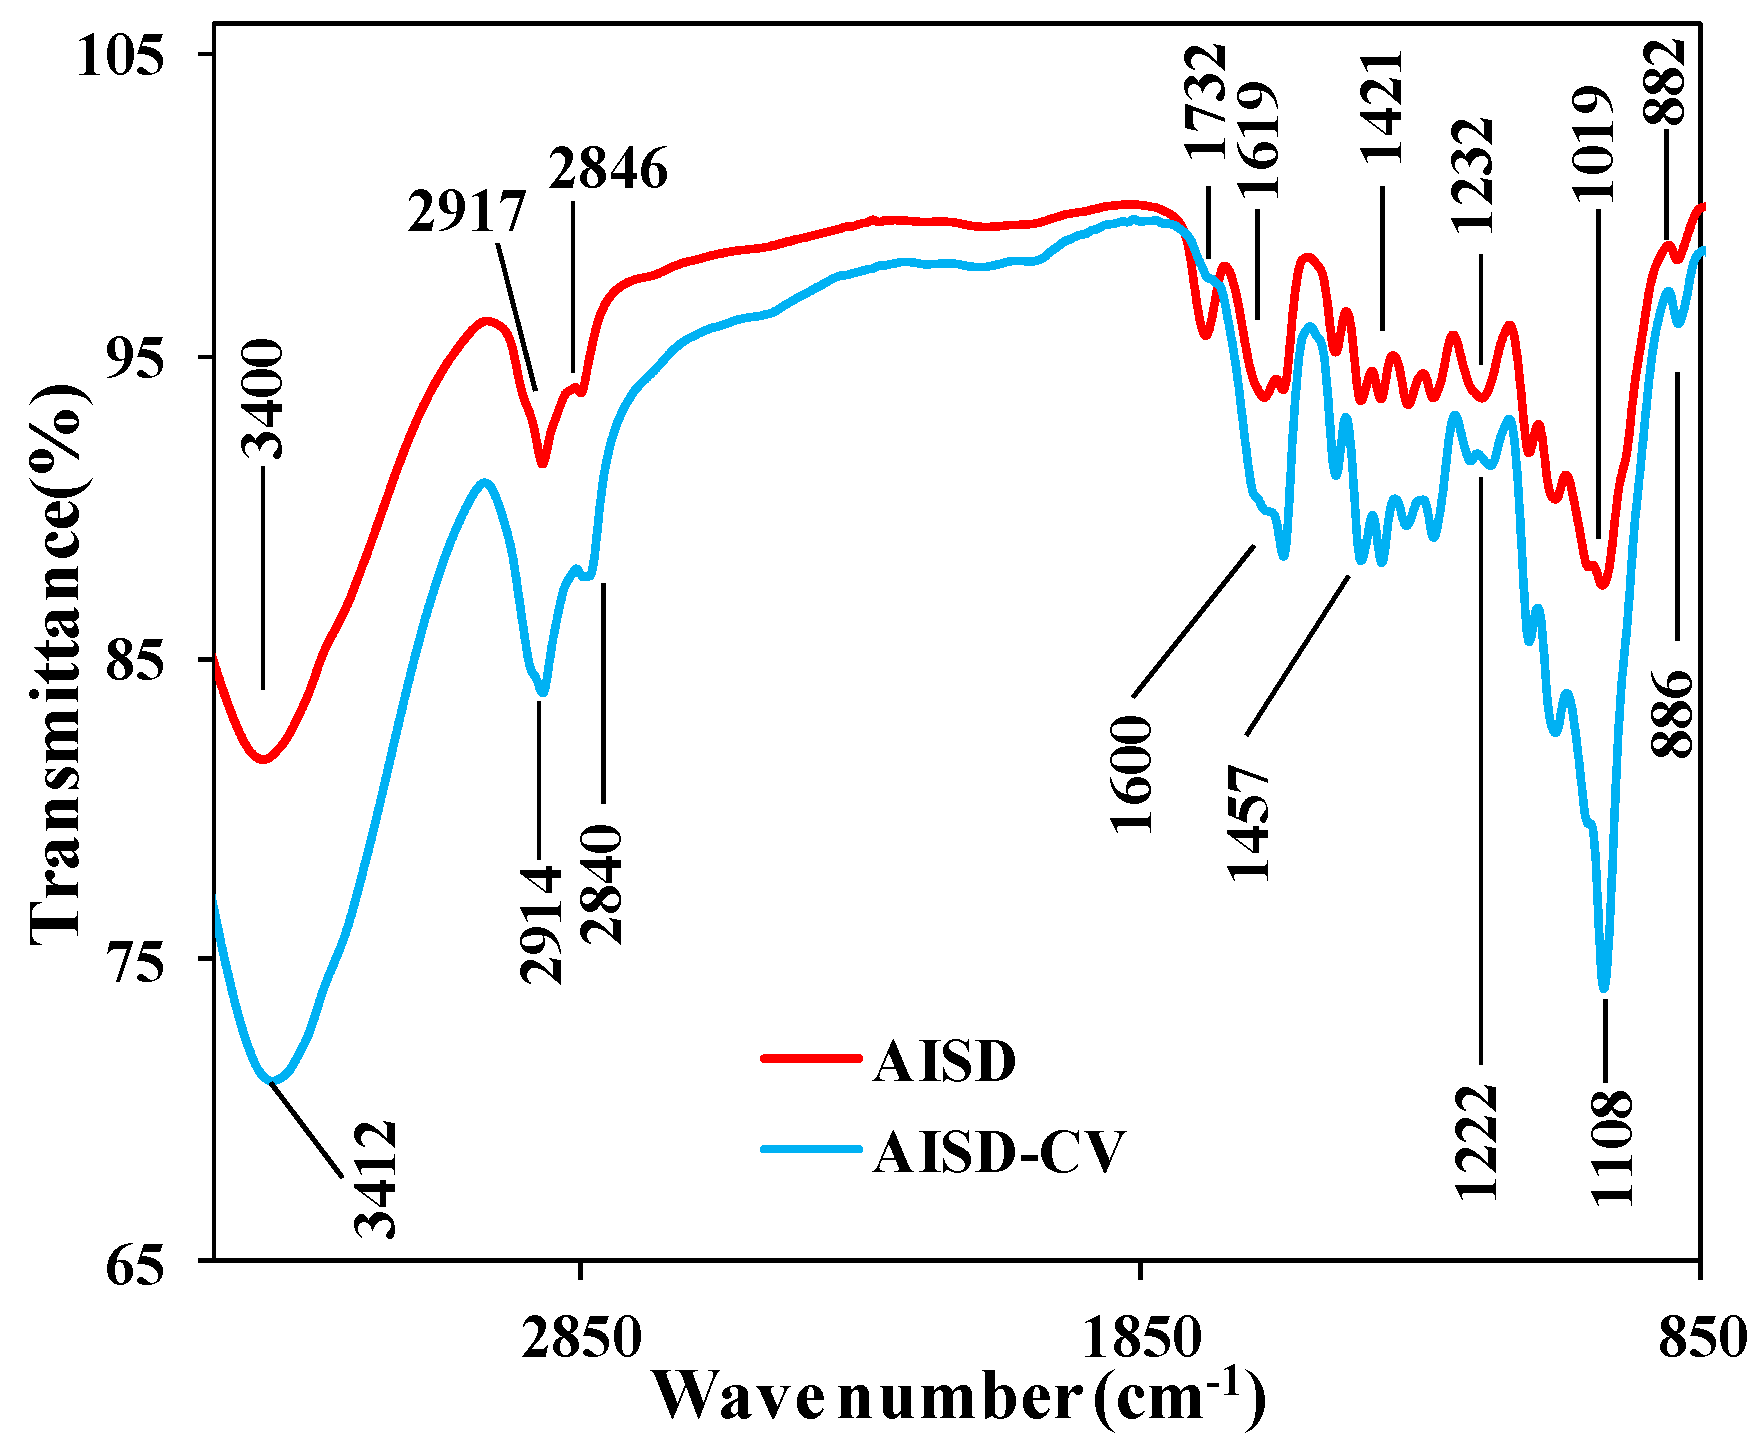
3.6. FTIR Analysis
3.7. Study of Operational Parameters
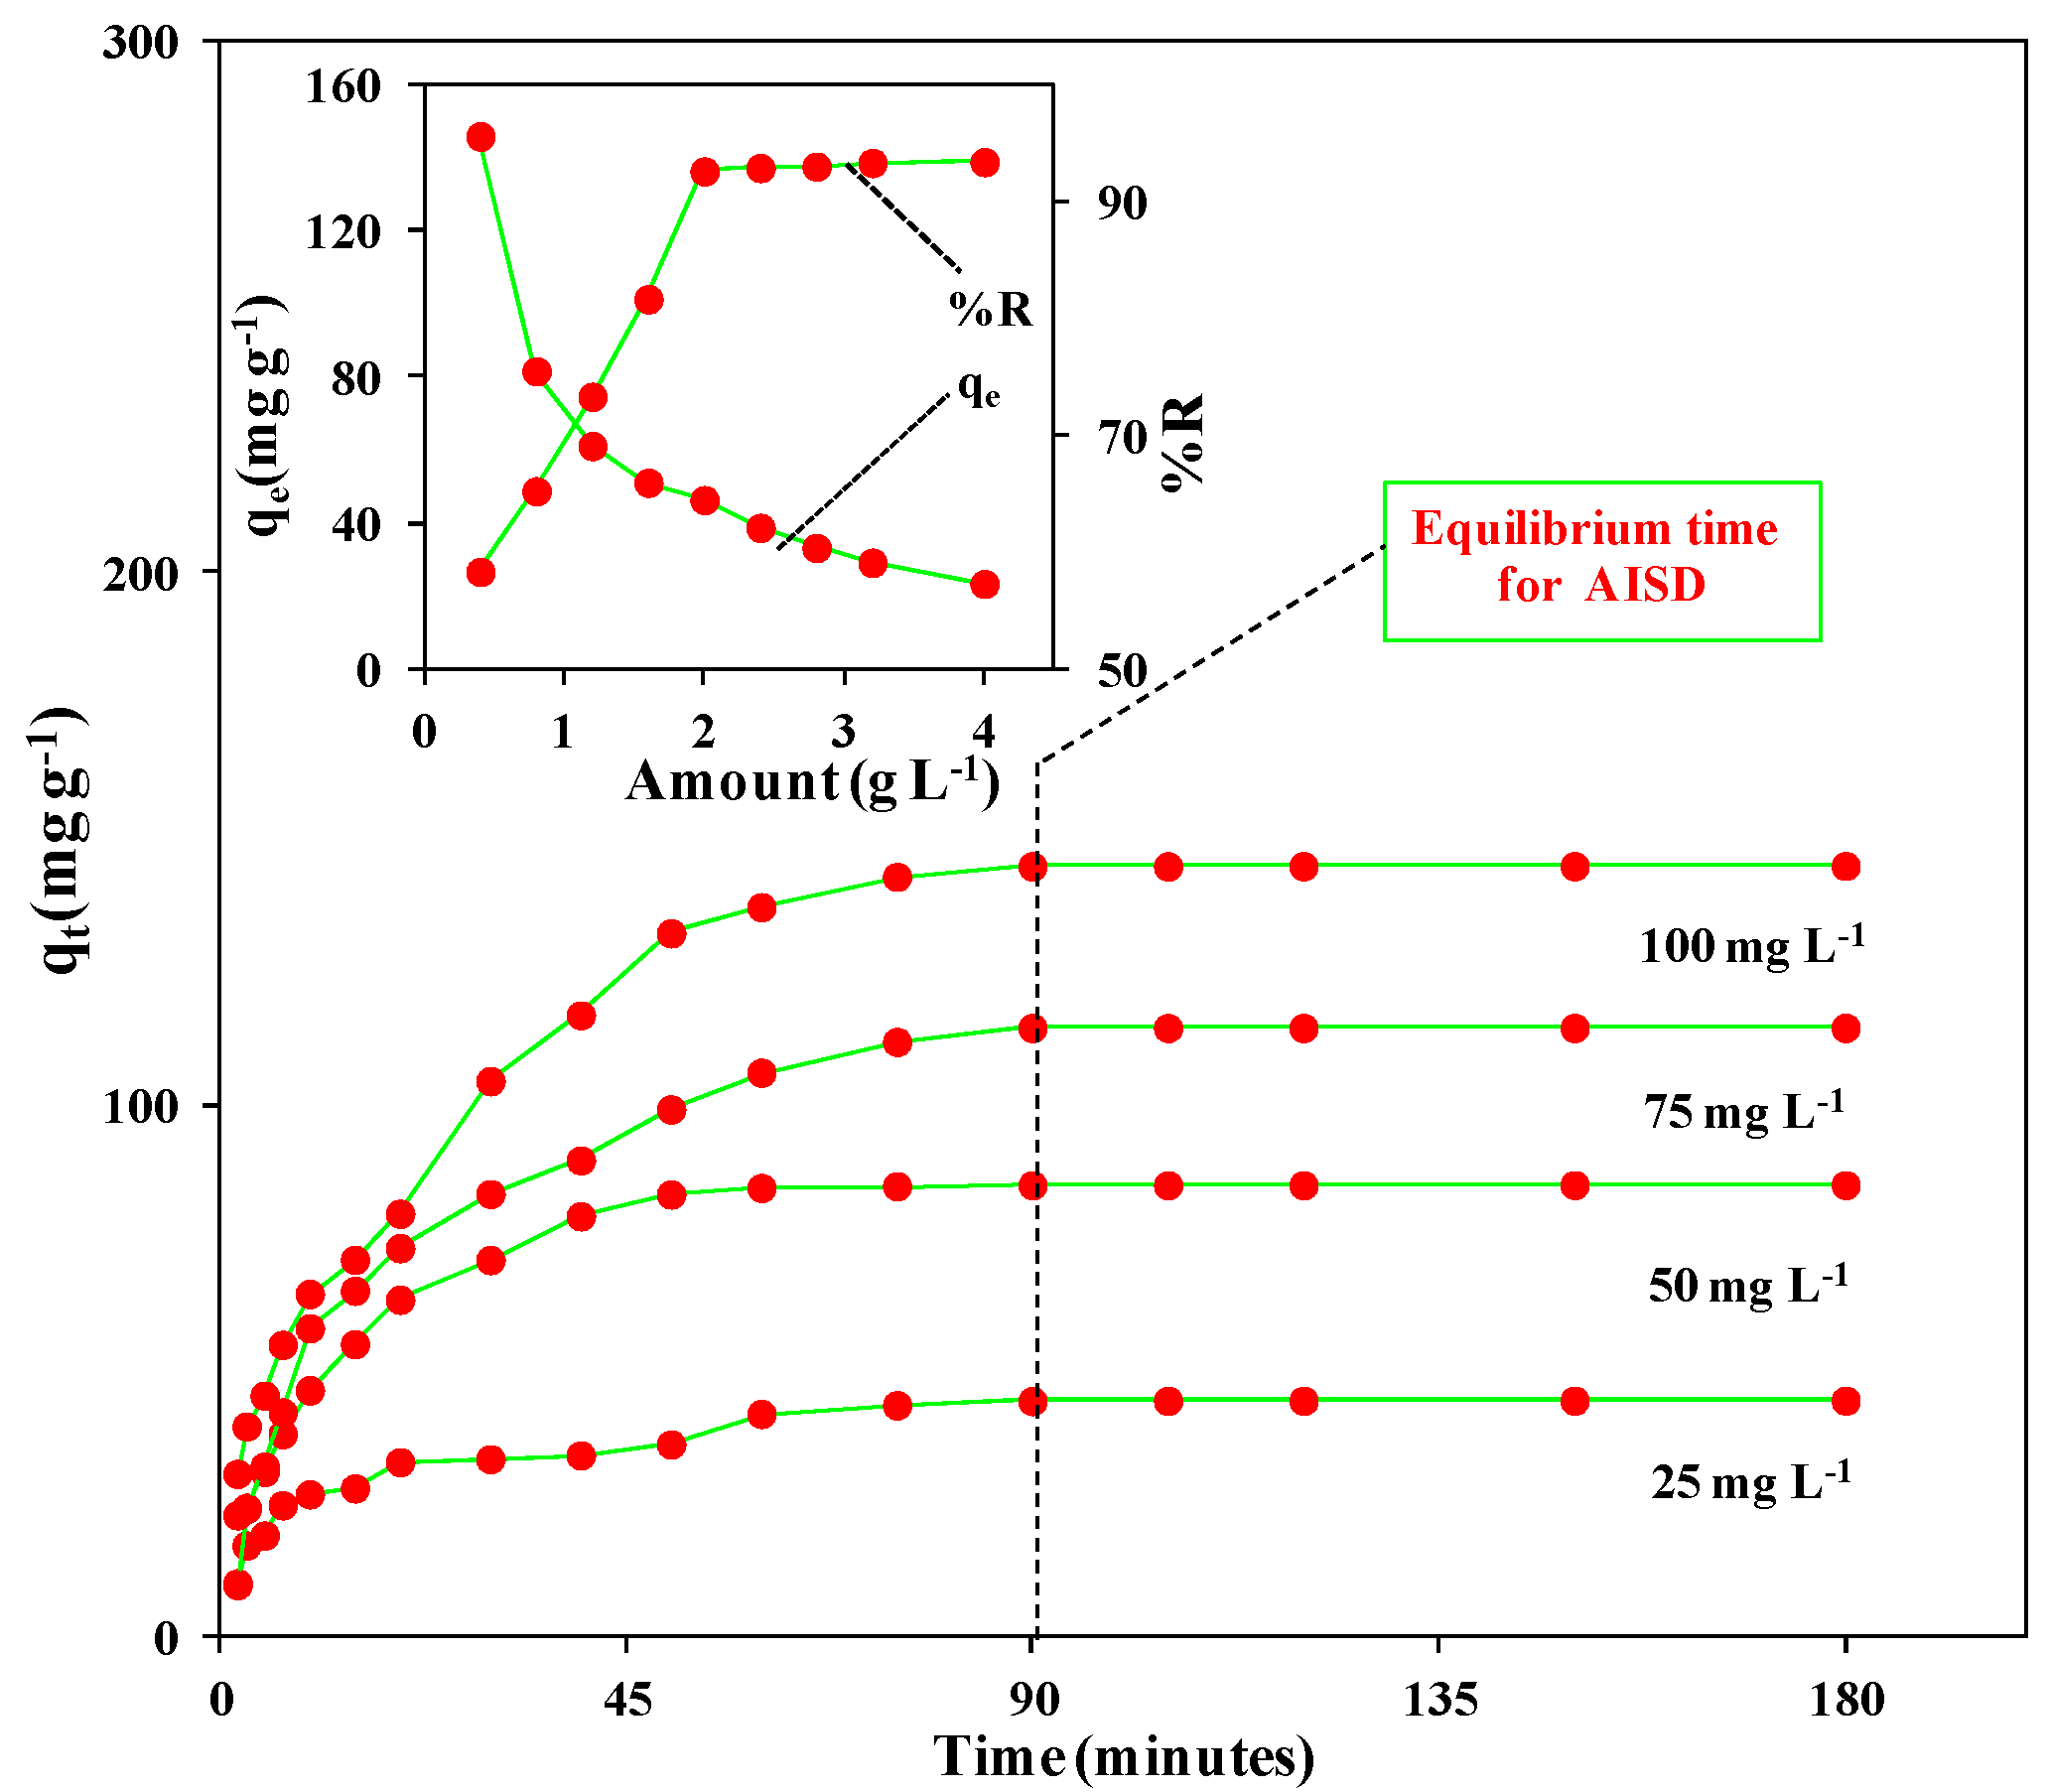
3.7.1. Adsorbent Dose
3.7.2. Initial Dye Concentration (Co) and Contact Time
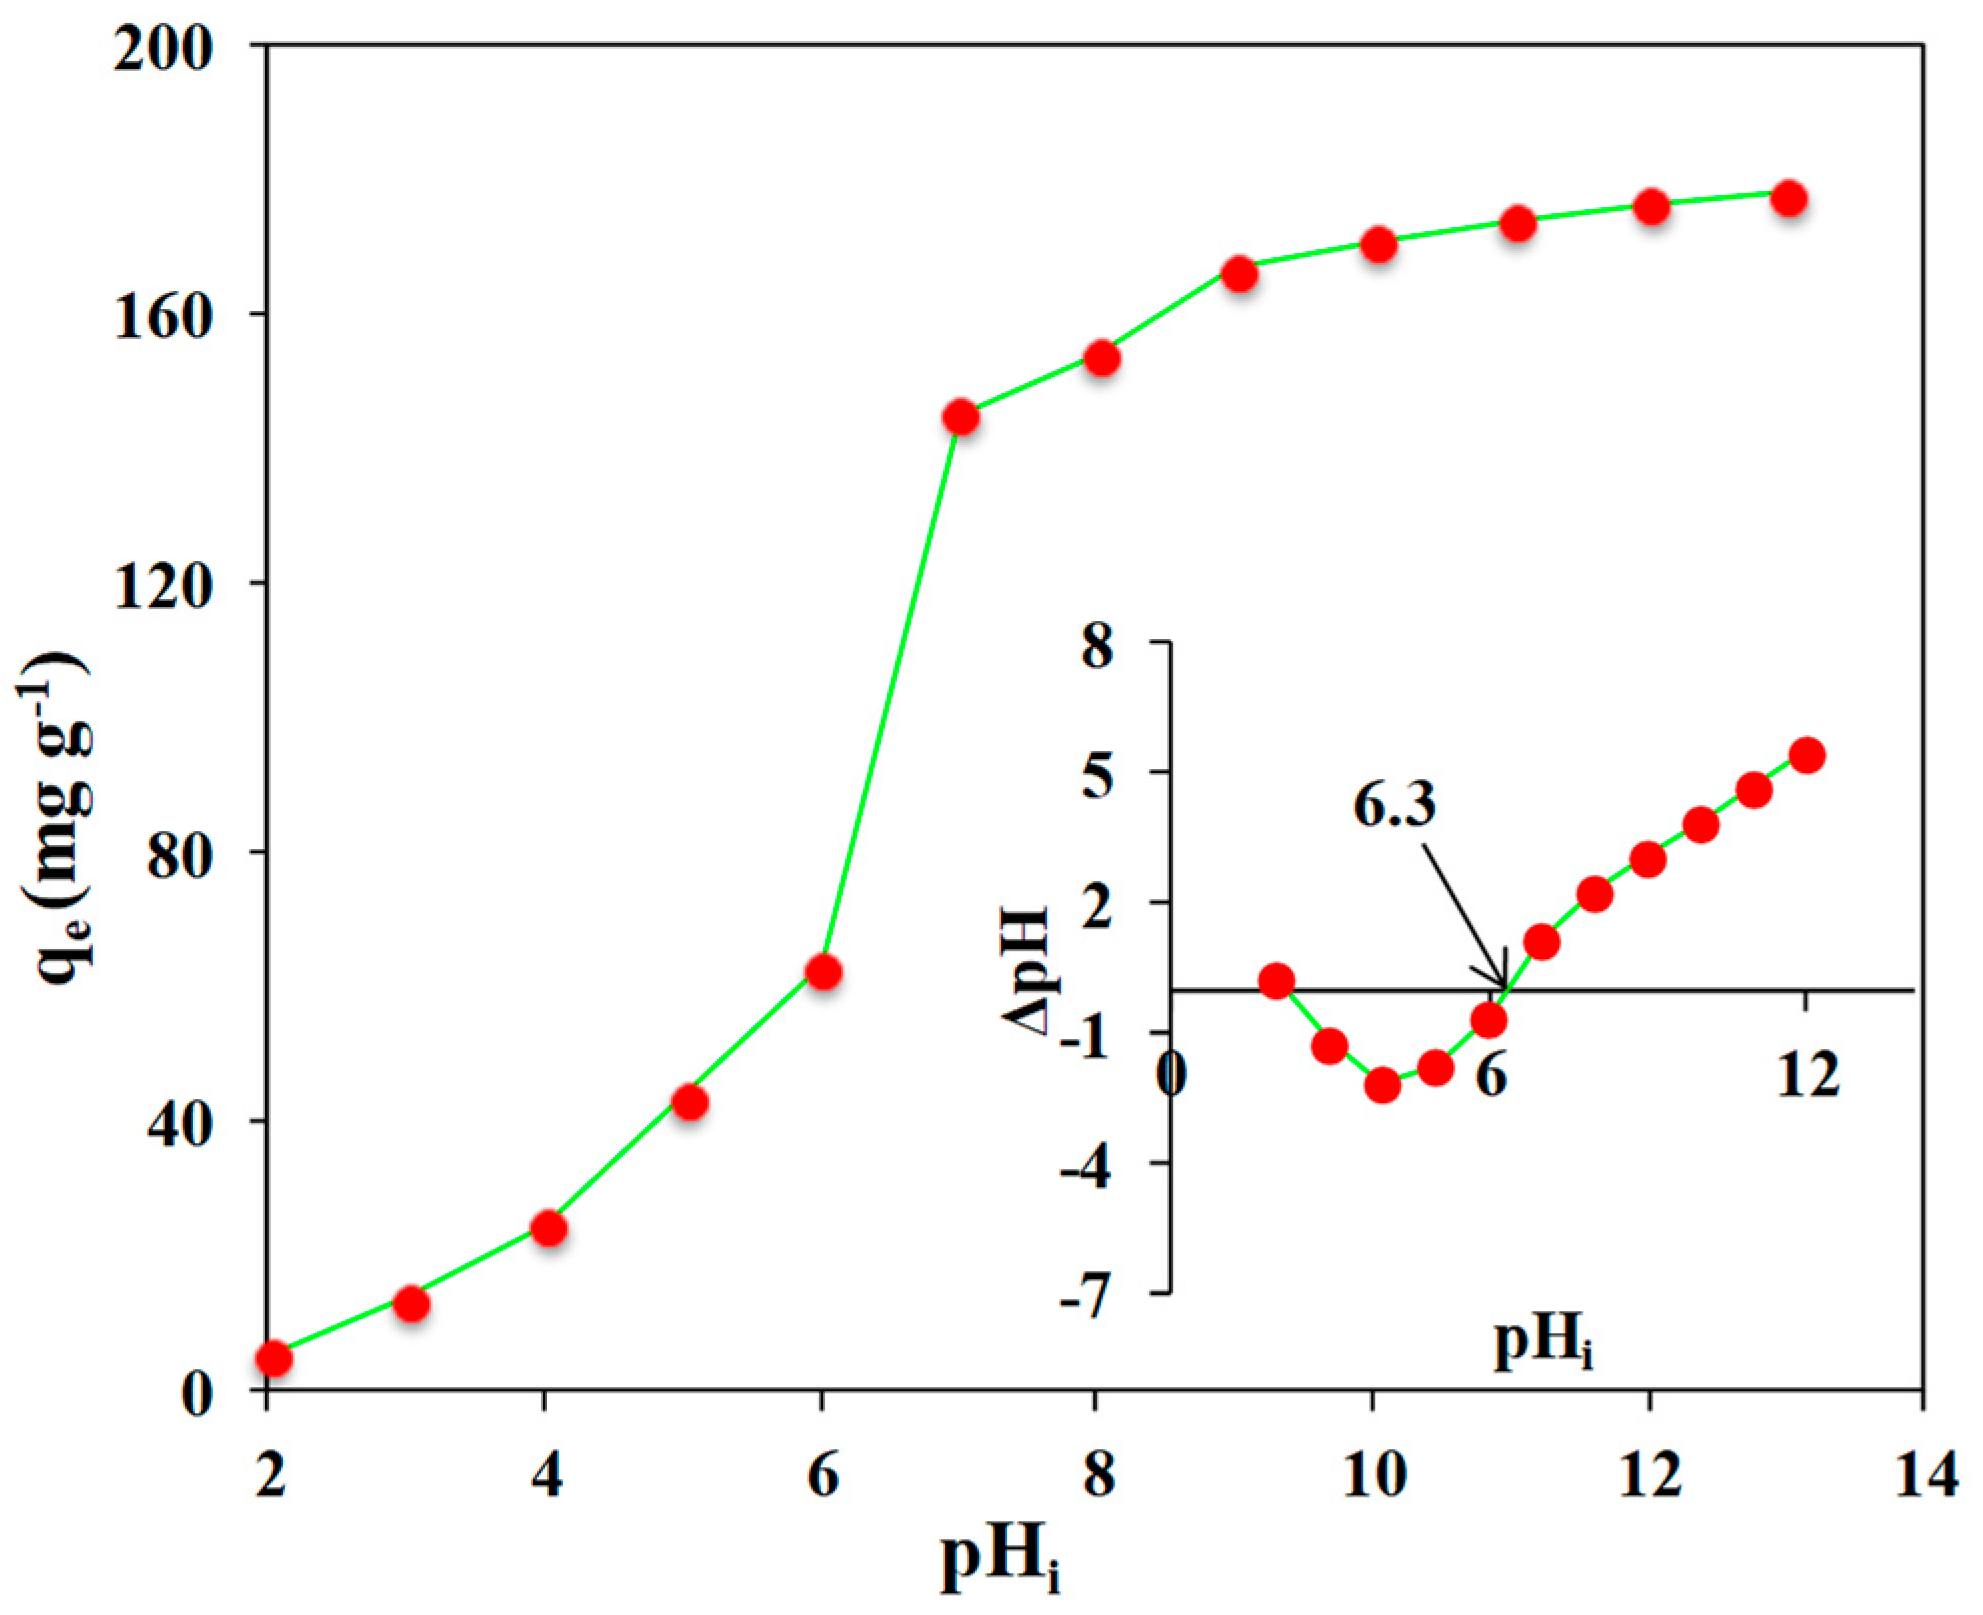
3.7.3. Effect of pH
3.8. Adsorption Kinetics

| Adsorbents | C₀ (mg L−1) | M (g L−1) | K2 (g min−1 mg−1) | qe (mg g−1) | R2 | Reference |
|---|---|---|---|---|---|---|
| Sugercane bagasse | 60 | 0.05 | 0.0172 | 59.27 | 0.9998 | [67] |
| Rubber seed pericarp biomass/sulfuric acid | 50 | 0.06 | 0.444 | 87.60 | 0.9400 | [68] |
| Charred rice husk (CRH) | 50 | 0.025 | 0.00054 | 57.803 | 0.9974 | [69] |
| Xanthated rice husk (XRH) | 50 | 0.025 | 0.00060 | 71.428 | 0.9981 | [69] |
| Bio-nanocomposite (Alg-Cst/Kal) | 20 | 0.01 | 0.0204 | 29.24 | 0.9999 | [70] |
| Tea waste/Fe3O4 magnetic composite | 100 | 1.0 | 0.0023 | 111.11 | 0.9970 | [71] |
| Coconut husk powder | 100 | 0.1 | 0.000015 | 909.09 | 0.9948 | [72] |
| Activated Chromolaena odorata biomass | 50 | 15.0 | 0.000614 | 3.223 | 0.9999 | [73] |
| Olive leaf powder | 50 | 0.1 | 0.63 | 12.32 | 1.0000 | [74] |
| Activated carbon of lemon wood (ACL) | 10 | 1.25 | 0.009 | 8.545 | 0.9664 | [75] |
| Magnetized activated carbon of lemon wood (ACL/Fe3O4) | 10 | 1.25 | 0.0138 | 8.648 | 0.9730 | [75] |
| Eucalyptus camdulensis biochar | 20 | 0.5 | 0.011 | 38.55 | 0.8300 | [76] |
| Rubber granulate and scrap polyurethane foam composite | 50 | 0.1 | 0.0734 | 14.73 | 0.9984 | [77] |
| Tectona grandis sawdust | 50 | 2 | 0.0565 | 23.74 | 1.0000 | [62] |
| Orange peel waste | 50 | 2 | 0.007 | 22.730 | 0.9960 | [78] |
| Magnetized orange peel waste | 50 | 1 | 0.004 | 46.940 | 0.9870 | [78] |
| Magnetized polypyrrole/chitosan | 50 | 2 | 0.0024 | 23.732 | 0.995 | [79] |
| Polyaniline/Tectona grandis sawdust | 50 | 0.8 | 0.0128 | 59.64 | 1.0000 | [80] |
| Cucumis sativus peels | 50 | 5 | 0.20 | 9.71 | 0.9999 | [81] |
| AISD | 50 | 0.4 | 0.00125 | 90.909 | 0.9970 | Present work |
3.9. Adsorption Isotherm
3.10. Adsorption Thermodynamics
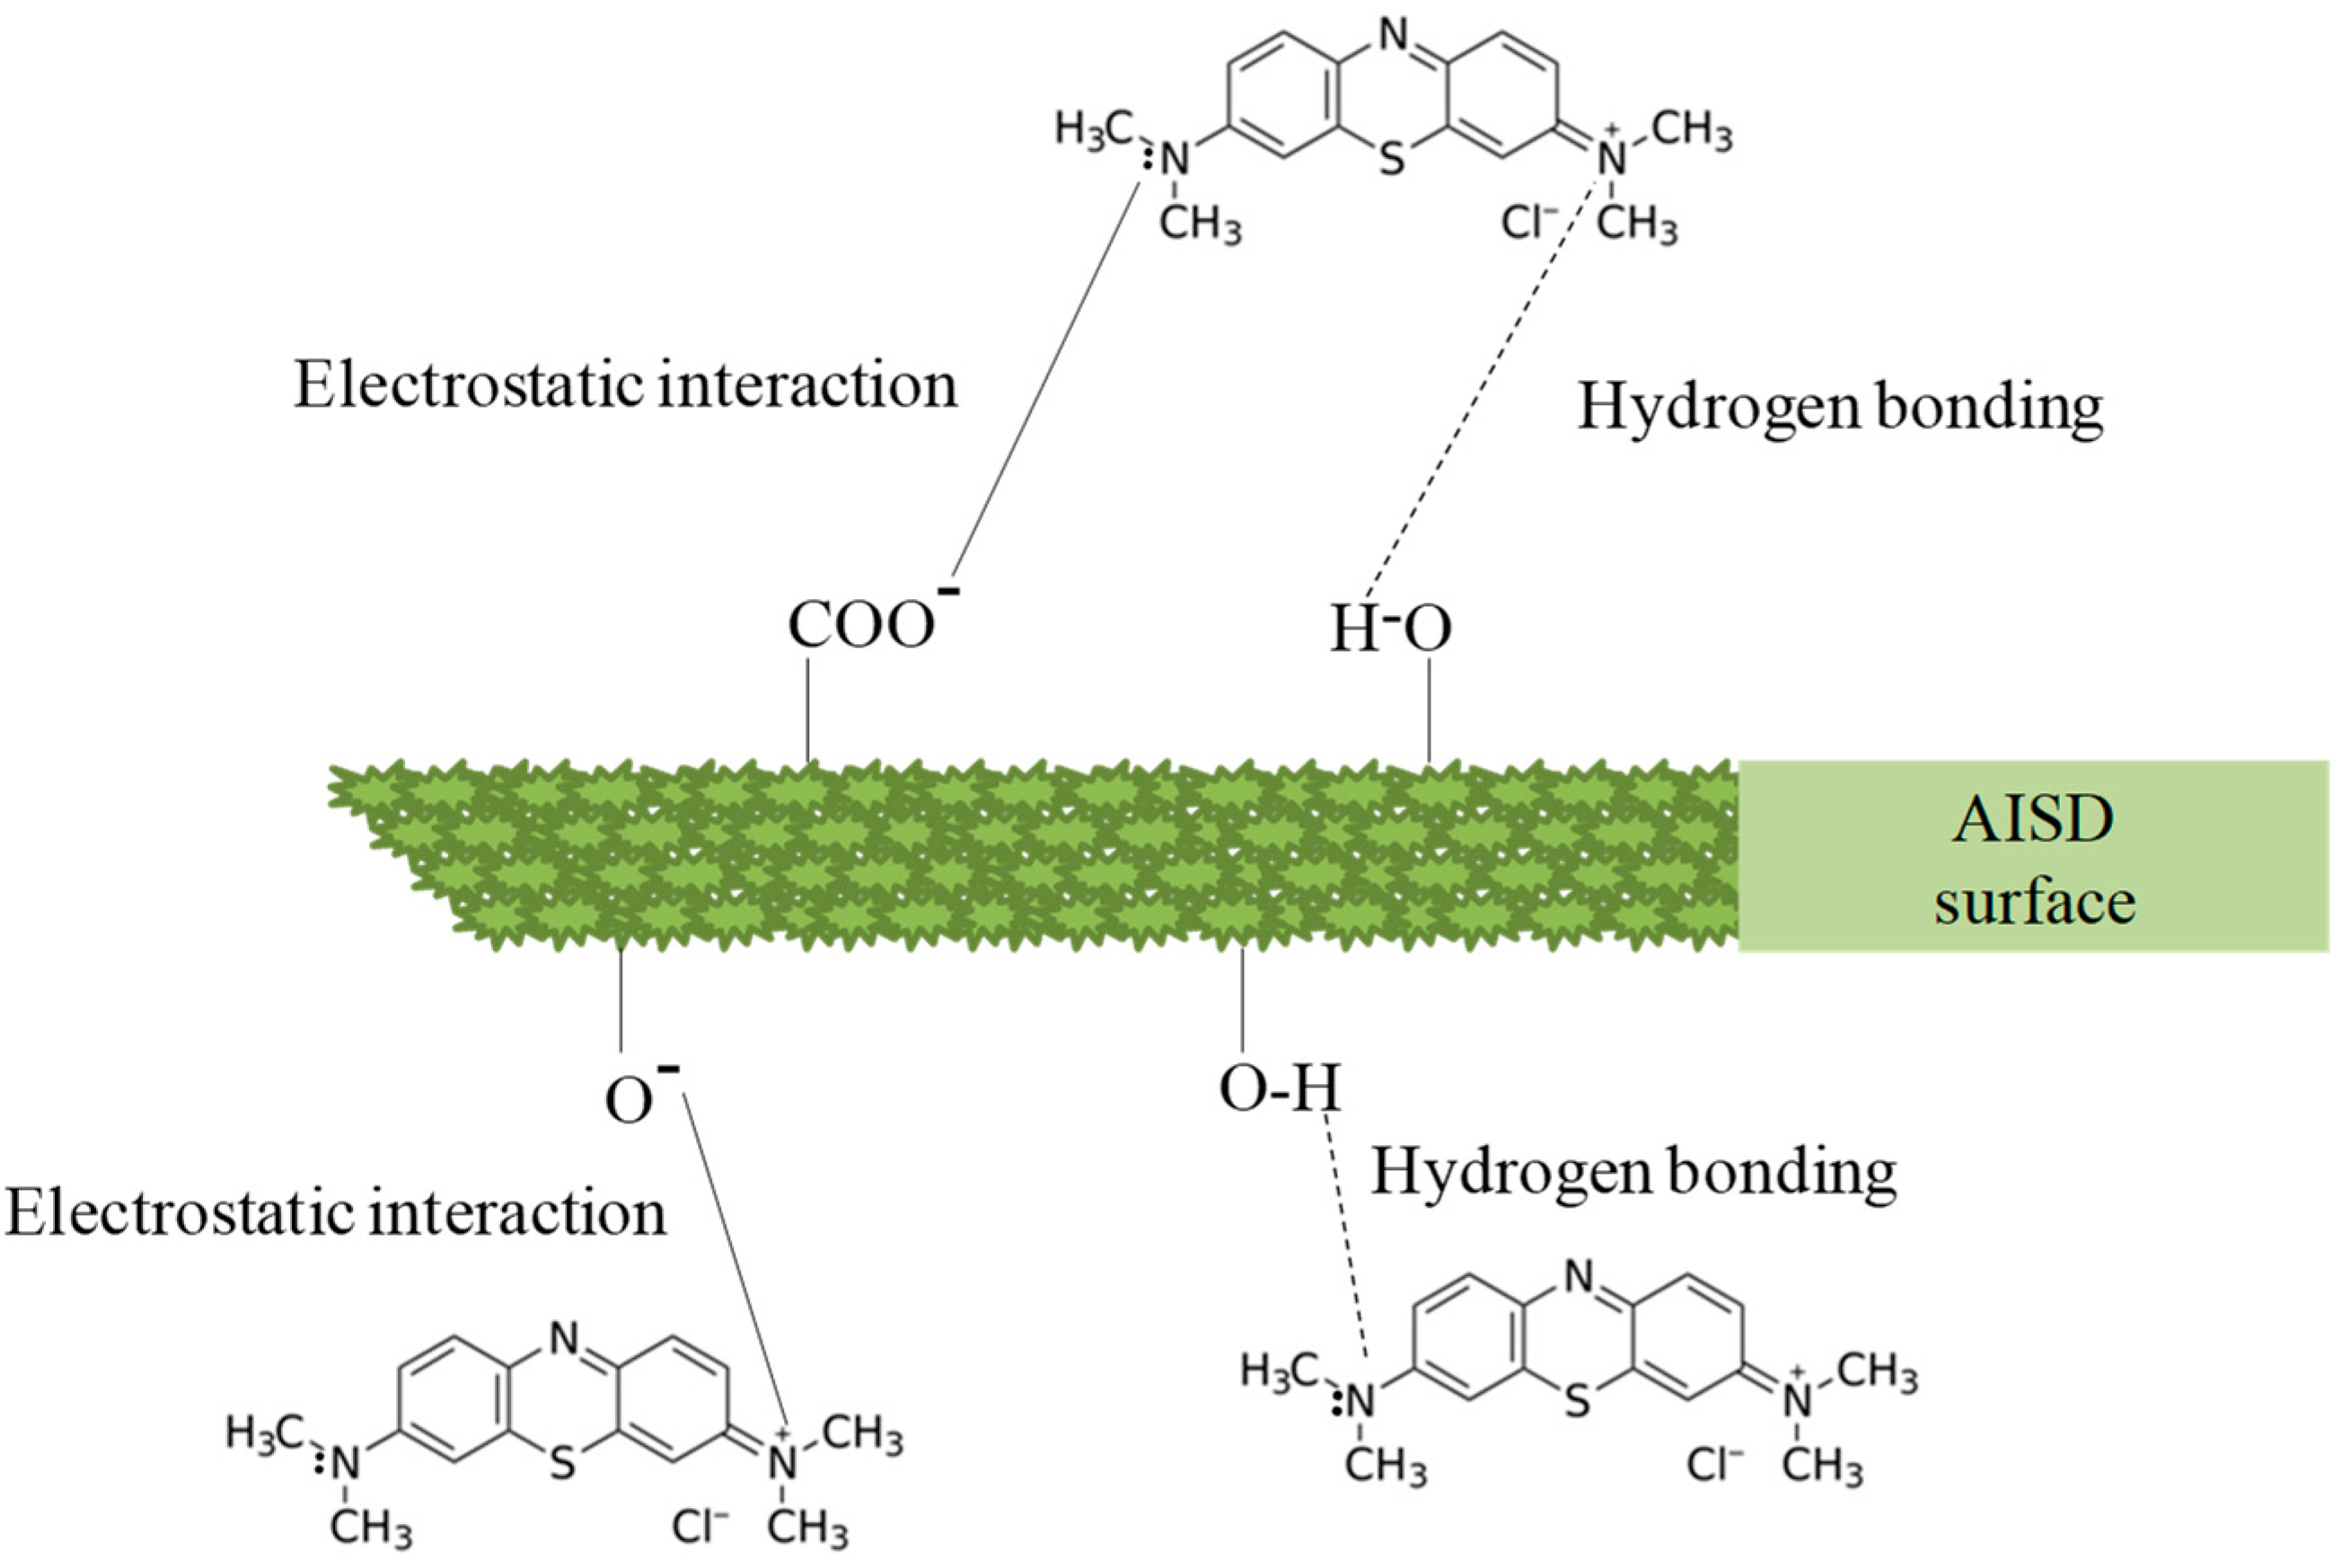
3.11. Adsorption Mechanism
3.12. Desorption
4. Conclusions
Supplementary Materials
Author Contributions
Funding
Institutional Review Board Statement
Informed Consent Statement
Data Availability Statement
Acknowledgments
Conflicts of Interest
References
- Ahmed, T.; Imdad, S.; Yaldram, K.; Butt, N.M.; Pervez, A. Emerging nanotechnology-based methods for water purification: A review. Desalin. Water Treat. 2014, 52, 4089–4101. [Google Scholar] [CrossRef]
- Jarup, L. Hazards of heavy metal contamination. Br. Med. Bull. 2003, 68, 167–182. [Google Scholar] [CrossRef] [PubMed] [Green Version]
- Schwarzenbach, R.P.; Egli, T.; Hofstetter, T.B.; Von Gunten, U.; Wehrli, B. Global water pollution and human health. Annu. Rev. Environ. Resour. 2010, 35, 109–136. [Google Scholar] [CrossRef]
- Jadhav, J.P.; Kalyani, D.C.; Telke, A.A.; Phugare, S.S.; Govindwar, S.P. Evaluation of the efficacy of a bacterial consortium for the removal of color, reduction of heavy metals, and toxicity from textile dye effluent. Bioresour. Technol. 2010, 101, 165–173. [Google Scholar] [CrossRef]
- Kar, D.; Sur, P.; Mandai, S.K.; Saha, T.; Kole, R.K. Assessment of heavy metal pollution in surface water. Int. J. Environ. Sci. Technol. 2008, 5, 119–124. [Google Scholar] [CrossRef] [Green Version]
- Prüss-Ustün, A.; Vickers, C.; Haefliger, P.; Bertollini, R. Knowns and unknowns on burden of disease due to chemicals: A systematic review. Environ. Health 2011, 10, 9. [Google Scholar] [CrossRef] [Green Version]
- Tsuboy, M.S.; Angeli, J.P.F.; Mantovani, M.S.; Knasmüller, S.; Umbuzeiro, G.A.; Ribeiro, L.R. Genotoxic, mutagenic and cytotoxic effects of the commercial dye CI Disperse Blue 291 in the human hepatic cell line HepG2. Toxicol. In Vitro 2007, 21, 1650–1655. [Google Scholar] [CrossRef]
- Barbosa, P.; Peters, T.M. The effects of vital dyes on living organisms with special reference to Methylene Blue and Neutral Red. Histochem. J. 1971, 3, 71–93. [Google Scholar] [CrossRef]
- Kant, R. Textile dyeing industry an environmental hazard. Nat. Sci. 2012, 04, 22–26. [Google Scholar] [CrossRef] [Green Version]
- Verma, A.K.; Dash, R.R.; Bhunia, P. A review on chemical coagulation/flocculation technologies for removal of colour from textile wastewaters. J. Environ. Manag. 2012, 93, 154–168. [Google Scholar] [CrossRef]
- Cassano, A.; Molinari, R.; Romano, M.; Drioli, E. Treatment of aqueous effluents of the leather industry by membrane processes. J. Memb. Sci. 2001, 181, 111–126. [Google Scholar] [CrossRef]
- Crini, G. Non-conventional low-cost adsorbents for dye removal: A review. Bioresour. Technol. 2006, 97, 1061–1085. [Google Scholar] [CrossRef]
- Forgacs, E.; Cserháti, T.; Oros, G. Removal of synthetic dyes from wastewaters: A review. Environ. Int. 2004, 30, 953–971. [Google Scholar] [CrossRef]
- Mittal, A.; Mittal, J.; Malviya, A.; Kaur, D.; Gupta, V.K. Adsorption of hazardous dye crystal violet from wastewater by waste materials. J. Colloid Interface Sci. 2010, 343, 463–473. [Google Scholar] [CrossRef] [PubMed]
- Brown, D. Effects of colorants in the aquatic environment. Ecotoxicol. Environ. Saf. 1987, 13, 139–147. [Google Scholar] [CrossRef] [PubMed]
- Deshannavar, U.B.B.; Ratnamala, G.M.M.; Kalburgi, P.B.B.; El-Harbawi, M.; Agarwal, A.; Shet, M.; Teli, M.; Bhandare, P. Optimization, Kinetic and Equilibrium Studies of Disperse Yellow 22 Dye Removal from Aqueous Solutions Using Malaysian Teak Wood Sawdust as Adsorbent. Indian Chem. Eng. 2016, 58, 12–28. [Google Scholar] [CrossRef]
- Mani, S.; Bharagava, R.N. Exposure to Crystal Violet, Its Toxic, Genotoxic and Carcinogenic Effects on Environment and Its Degradation and Detoxification for Environmental Safety. In Reviews of Environmental Contamination and Toxicology; Springer: Cham, Switzerland, 2016; pp. 71–104. [Google Scholar]
- Wu, J.; Eiteman, M.A.; Law, S.E. Evaluation of Membrane Filtration and Ozonation Processes for Treatment of Reactive-Dye Wastewater. J. Environ. Eng. 1998, 124, 272–277. [Google Scholar] [CrossRef]
- Soltani, A.; Faramarzi, M.; Mousavi Parsa, S.A. A review on adsorbent parameters for removal of dye products from industrial wastewater. Water Qual. Res. J. 2021, 56, 181–193. [Google Scholar] [CrossRef]
- Rezakazemi, M.; Khajeh, A.; Mesbah, M. Membrane filtration of wastewater from gas and oil production. Environ. Chem. Lett. 2018, 16, 367–388. [Google Scholar] [CrossRef]
- Malkoske, T.A.; Bérubé, P.R.; Andrews, R.C. Coagulation/flocculation prior to low pressure membranes in drinking water treatment: A review. Environ. Sci. Water Res. Technol. 2020, 6, 2993–3023. [Google Scholar] [CrossRef]
- Hassan, M.M.; Carr, C.M. A critical review on recent advancements of the removal of reactive dyes from dyehouse effluent by ion-exchange adsorbents. Chemosphere 2018, 209, 201–219. [Google Scholar] [CrossRef] [PubMed]
- Bashir, A.; Malik, L.A.; Ahad, S.; Manzoor, T.; Bhat, M.A.; Dar, G.N.; Pandith, A.H. Removal of heavy metal ions from aqueous system by ion-exchange and biosorption methods. Environ. Chem. Lett. 2019, 17, 729–754. [Google Scholar] [CrossRef]
- Robinson, T.; McMullan, G.; Marchant, R.; Nigam, P. Remediation of dyes in textile effluent: A critical review on current treatment technologies with a proposed alternative. Bioresour. Technol. 2001, 77, 247–255. [Google Scholar] [CrossRef] [PubMed]
- Dos Santos, A.B.; Cervantes, F.J.; van Lier, J.B. Review paper on current technologies for decolourisation of textile wastewaters: Perspectives for anaerobic biotechnology. Bioresour. Technol. 2007, 98, 2369–2385. [Google Scholar] [CrossRef]
- Korngold, E.; Kock, K.; Strathmann, H. Electrodialysis in advanced waste water treatment. Desalination 1977, 24, 129–139. [Google Scholar] [CrossRef]
- Aragaw, T.A.; Bogale, F.M. Biomass-Based Adsorbents for Removal of Dyes From Wastewater: A Review. Front. Environ. Sci. 2021, 9, 764958. [Google Scholar] [CrossRef]
- Al-Amshawee, S.; Yunus, M.Y.B.M.; Azoddein, A.A.M.; Hassell, D.G.; Dakhil, I.H.; Hasan, H.A. Electrodialysis desalination for water and wastewater: A review. Chem. Eng. J. 2020, 380, 122231. [Google Scholar] [CrossRef]
- Mohammadi, T.; Moheb, A.; Sadrzadeh, M.; Razmi, A. Modeling of metal ion removal from wastewater by electrodialysis. Sep. Purif. Technol. 2005, 41, 73–82. [Google Scholar] [CrossRef]
- Amuda, O.; Amoo, I. Coagulation/flocculation process and sludge conditioning in beverage industrial wastewater treatment. J. Hazard. Mater. 2007, 141, 778–783. [Google Scholar] [CrossRef]
- Bahnemann, D. Photocatalytic water treatment: Solar energy applications. Sol. Energy 2004, 77, 445–459. [Google Scholar] [CrossRef]
- Houas, A.; Lachheb, H.; Ksibi, M.; Elaloui, E.; Guillard, C.; Herrmann, J.M. Photocatalytic degradation pathway of methylene blue in water. Appl. Catal. B Environ. 2001, 31, 145–157. [Google Scholar] [CrossRef]
- Chakraborty, S.; Purkait, M.K.; DasGupta, S.; De, S.; Basu, J.K. Nanofiltration of textile plant effluent for color removal and reduction in COD. Sep. Purif. Technol. 2003, 31, 141–151. [Google Scholar] [CrossRef]
- Al-Rashdi, B.A.M.; Johnson, D.J.; Hilal, N. Removal of heavy metal ions by nanofiltration. Desalination 2013, 315, 2–17. [Google Scholar] [CrossRef]
- Chen, X.; Chen, G.; Yue, P.L. Novel Electrode System for Electroflotation of Wastewater. Environ. Sci. Technol. 2002, 36, 778–783. [Google Scholar] [CrossRef]
- De Oliveira da Mota, I.; de Castro, J.A.; de Góes Casqueira, R.; de Oliveira Junior, A.G. Study of electroflotation method for treatment of wastewater from washing soil contaminated by heavy metals. J. Mater. Res. Technol. 2015, 4, 109–113. [Google Scholar] [CrossRef] [Green Version]
- Kolesnikov, V.A.; Il’in, V.I.; Kolesnikov, A.V. Electroflotation in Wastewater Treatment from Oil Products, Dyes, Surfactants, Ligands, and Biological Pollutants: A Review. Theor. Found. Chem. Eng. 2019, 53, 251–273. [Google Scholar] [CrossRef]
- Qamruzzaman; Nasar, A. Kinetics of metribuzin degradation by colloidal manganese dioxide in absence and presence of surfactants. Chem. Pap. 2014, 68, 65–73. [Google Scholar] [CrossRef]
- Qamruzzaman; Nasar, A. Treatment of acetamiprid insecticide from artificially contaminated water by colloidal manganese dioxide in the absence and presence of surfactants. RSC Adv. 2014, 4, 62844–62850. [Google Scholar] [CrossRef]
- Qamruzzaman; Nasar, A. Degradation of acephate by colloidal manganese dioxide in the absence and presence of surfactants. Desalin. Water Treat. 2015, 55, 2155–2164. [Google Scholar] [CrossRef]
- Greenlee, L.F.; Lawler, D.F.; Freeman, B.D.; Marrot, B.; Moulin, P. Reverse osmosis desalination: Water sources, technology, and today’s challenges. Water Res. 2009, 43, 2317–2348. [Google Scholar] [CrossRef]
- Qasim, M.; Badrelzaman, M.; Darwish, N.N.; Darwish, N.A.; Hilal, N. Reverse osmosis desalination: A state-of-the-art review. Desalination 2019, 459, 59–104. [Google Scholar] [CrossRef] [Green Version]
- Li, X.; Hasson, D.; Semiat, R.; Shemer, H. Intermediate concentrate demineralization techniques for enhanced brackish water reverse osmosis water recovery—A review. Desalination 2019, 466, 24–35. [Google Scholar] [CrossRef]
- Thaçi, B.; Gashi, S. Reverse Osmosis Removal of Heavy Metals from Wastewater Effluents Using Biowaste Materials Pretreatment. Pol. J. Environ. Stud. 2018, 28, 337–341. [Google Scholar] [CrossRef]
- Lin, S.H.; Lin, C.M. Treatment of textile waste effluents by ozonation and chemical coagulation. Water Res. 1993, 27, 1743–1748. [Google Scholar] [CrossRef]
- Khamparia, S.; Jaspal, D.K. Adsorption in combination with ozonation for the treatment of textile waste water: A critical review. Front. Environ. Sci. Eng. 2017, 11, 8. [Google Scholar] [CrossRef]
- Wang, J.; Chen, H. Catalytic ozonation for water and wastewater treatment: Recent advances and perspective. Sci. Total Environ. 2020, 704, 135249. [Google Scholar] [CrossRef] [PubMed]
- Panizza, M. Electrochemical treatment of wastewater containing polyaromatic organic pollutants. Water Res. 2000, 34, 2601–2605. [Google Scholar] [CrossRef]
- Nidheesh, P.V.; Zhou, M.; Oturan, M.A. An overview on the removal of synthetic dyes from water by electrochemical advanced oxidation processes. Chemosphere 2018, 197, 210–227. [Google Scholar] [CrossRef] [PubMed]
- Singh, H.; Chauhan, G.; Jain, A.K.; Sharma, S.K. Adsorptive potential of agricultural wastes for removal of dyes from aqueous solutions. J. Environ. Chem. Eng. 2017, 5, 122–135. [Google Scholar] [CrossRef]
- Bhatnagar, A.; Sillanpää, M.; Witek-Krowiak, A. Agricultural waste peels as versatile biomass for water purification—A review. Chem. Eng. J. 2015, 270, 244–271. [Google Scholar] [CrossRef]
- Nasar, A. Utilization of tea wastes for the removal of toxic dyes from polluted water—A review. Biomass Convers. Biorefinery 2021, 13, 399–1415. [Google Scholar] [CrossRef]
- Khattri, S.D.; Singh, M.K. Removal of malachite green from dye wastewater using neem sawdust by adsorption. J. Hazard. Mater. 2009, 167, 1089–1094. [Google Scholar] [CrossRef]
- Bhattacharyya, K.G.; Sharma, A. Kinetics and thermodynamics of Methylene Blue adsorption on Neem (Azadirachta indica) leaf powder. Dye. Pigment. 2005, 65, 51–59. [Google Scholar] [CrossRef]
- Mashkoor, F.; Nasar, A. Preparation, characterization and adsorption studies of the chemically modified Luffa aegyptica peel as a potential adsorbent for the removal of malachite green from aqueous solution. J. Mol. Liq. 2019, 274, 315–327. [Google Scholar] [CrossRef]
- Thommes, M.; Kaneko, K.; Neimark, A.V.; Olivier, J.P.; Rodriguez-Reinoso, F.; Rouquerol, J.; Sing, K.S.W. Physisorption of gases, with special reference to the evaluation of surface area and pore size distribution (IUPAC Technical Report). Pure Appl. Chem. 2015, 87, 1051–1069. [Google Scholar] [CrossRef] [Green Version]
- Eskandari, M.; García, C.A.; Buceta, D.; Malekfar, R.; Taboada, P. NiCo2O4/MWCNT/PANI coral-like nanostructured composite for electrochemical energy-storage applications. J. Electroanal. Chem. 2019, 851, 113481. [Google Scholar] [CrossRef]
- Basu, M.; Guha, A.K.; Ray, L. Adsorption of Lead on Cucumber Peel. J. Clean. Prod. 2017, 151, 603–615. [Google Scholar] [CrossRef]
- Shaaban, A.; Se, S.-M.; Mitan, N.M.M.; Dimin, M.F. Characterization of Biochar Derived from Rubber Wood Sawdust through Slow Pyrolysis on Surface Porosities and Functional Groups. Procedia Eng. 2013, 68, 365–371. [Google Scholar] [CrossRef] [Green Version]
- Wang, Z.; Cao, J.; Wang, J. Pyrolytic characteristics of pine wood in a slowly heating and gas sweeping fixed-bed reactor. J. Anal. Appl. Pyrolysis 2009, 84, 179–184. [Google Scholar] [CrossRef]
- Jiang, Z.-H.H.; Yang, Z.; So, C.-L.L.; Hse, C.-Y.Y. Rapid prediction of wood crystallinity in Pinus elliotii plantation wood by near-infrared spectroscopy. J. Wood Sci. 2007, 53, 449–453. [Google Scholar] [CrossRef]
- Mashkoor, F.; Nasar, A.; Inamuddin; Asiri, A.M. Exploring the Reusability of Synthetically Contaminated Wastewater Containing Crystal Violet Dye using Tectona grandis Sawdust as a Very Low-Cost Adsorbent. Sci. Rep. 2018, 8, 8314. [Google Scholar] [CrossRef] [PubMed] [Green Version]
- Shakoor, S.; Nasar, A. Adsorptive decontamination of synthetic wastewater containing crystal violet dye by employing Terminalia arjuna sawdust waste. Groundw. Sustain. Dev. 2018, 7, 30–38. [Google Scholar] [CrossRef]
- Yang, H.; Yan, R.; Chen, H.; Lee, D.H.; Zheng, C. Characteristics of hemicellulose, cellulose and lignin pyrolysis. Fuel 2007, 86, 1781–1788. [Google Scholar] [CrossRef]
- Ho, Y.S.; McKay, G. Pseudo-second order model for sorption processes. Process Biochem. 1999, 34, 451–465. [Google Scholar] [CrossRef]
- Doğan, M.; Abak, H.; Alkan, M. Adsorption of methylene blue onto hazelnut shell: Kinetics, mechanism and activation parameters. J. Hazard. Mater. 2009, 164, 172–181. [Google Scholar] [CrossRef]
- Omer, A.S.; Naeem, G.A.; Abd-Elhamid, A.; Farahat, O.O.; El-Bardan, A.A.; Soliman, H.M.; Nayl, A. Adsorption of crystal violet and methylene blue dyes using a cellulose-based adsorbent from sugercane bagasse: Characterization, kinetic and isotherm studies. J. Mater. Res. Technol. 2022, 19, 3241–3254. [Google Scholar] [CrossRef]
- Uddin, M.K.; Abd Malek, N.N.; Jawad, A.H.; Sabar, S. Pyrolysis of rubber seed pericarp biomass treated with sulfuric acid for the adsorption of crystal violet and methylene green dyes: An optimized process. Int. J. Phytoremediat. 2023, 25, 393–402. [Google Scholar] [CrossRef]
- Homagai, P.L.; Poudel, R.; Poudel, S.; Bhattarai, A. Adsorption and removal of crystal violet dye from aqueous solution by modified rice husk. Heliyon 2022, 8, e09261. [Google Scholar] [CrossRef]
- Mittal, J.; Ahmad, R.; Ejaz, M.O.; Mariyam, A.; Mittal, A. A novel, eco-friendly bio-nanocomposite (Alg-Cst/Kal) for the adsorptive removal of crystal violet dye from its aqueous solutions. Int. J. Phytoremediat. 2022, 24, 796–807. [Google Scholar] [CrossRef]
- Kumbhar, P.; Narale, D.; Bhosale, R.; Jambhale, C.; Kim, J.-H.H.; Kolekar, S. Synthesis of tea waste/Fe3O4 magnetic composite (TWMC) for efficient adsorption of crystal violet dye: Isotherm, kinetic and thermodynamic studies. J. Environ. Chem. Eng. 2022, 10, 107893. [Google Scholar] [CrossRef]
- Sultana, S.; Islam, K.; Hasan, M.A.; Khan, H.M.J.; Khan, M.A.R.; Deb, A.; Al Raihan, M.; Rahman, M.W. Adsorption of crystal violet dye by coconut husk powder: Isotherm, kinetics and thermodynamics perspectives. Environ. Nanotechnol. Monit. Manag. 2022, 17, 100651. [Google Scholar] [CrossRef]
- Soosai, M.R.; Moorthy, I.M.G.; Varalakshmi, P.; Syed, A.; Elgorban, A.M.; Rigby, S.P.; Natesan, S.; Gunaseelan, S.; Joshya, Y.C.; Baskar, R.; et al. Use of activated Chromolaena odorata biomass for the removal of crystal violet from aqueous solution: Kinetic, equilibrium, and thermodynamic study. Environ. Sci. Pollut. Res. 2023, 30, 14265–14283. [Google Scholar] [CrossRef]
- Elsherif, K.M.; El-Dali, A.; Alkarewi, A.A.; Ewlad-ahmed, A.M.; Treban, A. Adsorption of crystal violet dye onto olive leaves powder: Equilibrium and kinetic studies. Chem. Int. 2021, 7, 79–89. [Google Scholar]
- Foroutan, R.; Peighambardoust, S.H.J.; Peighambardoust, S.H.J.; Pateiro, M.; Lorenzo, J.M. Adsorption of Crystal Violet Dye Using Activated Carbon of Lemon Wood and Activated Carbon/Fe3O4 Magnetic Nanocomposite from Aqueous Solutions: A Kinetic, Equilibrium and Thermodynamic Study. Molecules 2021, 26, 2241. [Google Scholar] [CrossRef] [PubMed]
- Amin, M.T.; Alazba, A.A.; Shafiq, M. Successful Application of Eucalyptus Camdulensis Biochar in the Batch Adsorption of Crystal Violet and Methylene Blue Dyes from Aqueous Solution. Sustainability 2021, 13, 3600. [Google Scholar] [CrossRef]
- Sulyman, M.; Kucinska-Lipka, J.; Sienkiewicz, M.; Gierak, A. Development, characterization and evaluation of composite adsorbent for the adsorption of crystal violet from aqueous solution: Isotherm, kinetics, and thermodynamic studies. Arab. J. Chem. 2021, 14, 103115. [Google Scholar] [CrossRef]
- Ahmed, M.; Mashkoor, F.; Nasar, A. Development, characterization, and utilization of magnetized orange peel waste as a novel adsorbent for the confiscation of crystal violet dye from aqueous solution. Groundw. Sustain. Dev. 2020, 10, 100322. [Google Scholar] [CrossRef]
- Mashkoor, F.; Nasar, A. Facile synthesis of polypyrrole decorated chitosan-based magsorbent: Characterizations, performance, and applications in removing cationic and anionic dyes from aqueous medium. Int. J. Biol. Macromol. 2020, 161, 88–100. [Google Scholar] [CrossRef]
- Mashkoor, F.; Nasar, A. Polyaniline/Tectona grandis sawdust: A novel composite for efficient decontamination of synthetically polluted water containing crystal violet dye. Groundw. Sustain. Dev. 2019, 8, 390–401. [Google Scholar] [CrossRef]
- Shakoor, S.; Nasar, A. Utilization of Cucumis Sativus Peel as an Eco-Friendly Biosorbent for the Confiscation of Crystal Violet Dye from Artificially Contaminated Wastewater. Anal. Chem. Lett. 2019, 9, 1–19. [Google Scholar] [CrossRef]
- Uddin, M.K.; Nasar, A. Decolorization of Basic Dyes Solution by Utilizing Fruit Seed Powder. KSCE J. Civ. Eng. 2020, 24, 345–355. [Google Scholar] [CrossRef]
- Chowdhury, S.; Mishra, R.; Saha, P.; Kushwaha, P. Adsorption thermodynamics, kinetics and isosteric heat of adsorption of malachite green onto chemically modified rice husk. Desalination 2011, 265, 159–168. [Google Scholar] [CrossRef]
- Valadez-Gonzalez, A.; Cervantes-Uc, J.; Olayo, R.; Herrera-Franco, P. Effect of fiber surface treatment on the fiber–matrix bond strength of natural fiber reinforced composites. Compos. Part B 1999, 309, 20. [Google Scholar] [CrossRef]
- Chakraborty, S.; Chowdhury, S.; Das Saha, P. Adsorption of crystal violet from aqueous solution onto NaOH-modified rice husk. Carbohydr. Polym. 2011, 86, 1533–1541. [Google Scholar] [CrossRef]
- Leng, L.; Yuan, X.; Zeng, G.; Shao, J.; Chen, X.; Wu, Z.; Wang, H.; Peng, X. Surface characterization of rice husk bio-char produced by liquefaction and application for cationic dye (Malachite green) adsorption. Fuel 2015, 155, 77–85. [Google Scholar] [CrossRef]
- Leng, L.; Yuan, X.; Huang, H.; Wang, H.; Wu, Z.; Fu, L.; Peng, X.; Chen, X.; Zeng, G. Characterization and application of bio-chars from liquefaction of microalgae, lignocellulosic biomass and sewage sludge. Fuel Process. Technol. 2015, 129, 8–14. [Google Scholar] [CrossRef]
- Leng, L.; Yuan, X.; Huang, H.; Shao, J.; Wang, H.; Chen, X.; Zeng, G. Bio-char derived from sewage sludge by liquefaction: Characterization and application for dye adsorption. Appl. Surf. Sci. 2015, 346, 223–231. [Google Scholar] [CrossRef]
- Wang, H.; Yuan, X.; Zeng, G.; Leng, L.; Peng, X.; Liao, K.; Peng, L.; Xiao, Z. Removal of malachite green dye from wastewater by different organic acid-modified natural adsorbent: Kinetics, equilibriums, mechanisms, practical application, and disposal of dye-loaded adsorbent. Environ. Sci. Pollut. Res. 2014, 21, 11552–11564. [Google Scholar] [CrossRef]


| Kinetic Parameters | Initial Dye Concentration (Co) in mg L−1 | |||
|---|---|---|---|---|
| 25 | 50 | 75 | 100 | |
| Pseudo-first-order (PFOR) | ||||
| K1 (min−1) | 0.0417 | 0.0434 | 0.0818 | 0.0509 |
| qcal (mg g−1) | 32.593 | 102.9249 | 95.8035 | 145.5034 |
| qexp (mg g−1) | 44.273 | 84.811 | 114.388 | 144.745 |
| R2 | 0.8984 | 0.9689 | 0.9817 | 0.9660 |
| Pseudo-second-order (PSOR) | ||||
| K2 (g min−1 mg−1) | 0.00248 | 0.00125 | 0.00063 | 0.00049 |
| qcal (mg g−1) | 46.948 | 90.909 | 125.000 | 158.730 |
| qexp (mg g−1) | 44.273 | 84.811 | 114.388 | 144.745 |
| R2 | 0.9969 | 0.9970 | 0.9979 | 0.9956 |
| Interparticle diffusion model (IDN) | ||||
| Kid (mg min−½ g−1) | 2.63536 | 5.7814 | 8.3504 | 10.645 |
| C (constant) | 16.103 | 26.513 | 26.476 | 32.861 |
| R2 | 0.8507 | 0.7603 | 0.8645 | 0.8728 |
| Elovich (EVH) | ||||
| β (g mg−1) | 0.1302 | 0.0572 | 0.0415 | 0.0330 |
| α (mg g−1 min−1) | 21.031 | 24.432 | 24.559 | 31.374 |
| R2 | 0.9684 | 0.9426 | 0.9762 | 0.9594 |
| Liquid film diffusion (LDN) | ||||
| Kfd (min−1) | 0.0417 | 0.0998 | 0.0434 | 0.0618 |
| D (constant) | −0.3063 | −0.0275 | −0.1056 | −0.0914 |
| R2 | 0.8984 | 0.9929 | 0.9689 | 0.9710 |
| Isotherm Parameters | Temperature in K | |||
|---|---|---|---|---|
| 303 | 313 | 323 | 333 | |
| Langmuir (LR) | ||||
| qm (mg g−1) | 270.27 | 285.72 | 322.58 | 370.37 |
| KL (L mg−1) | 0.0270 | 0.0175 | 0.0170 | 0.0168 |
| R2 | 0.9978 | 0.9906 | 0.9930 | 0.9933 |
| Freundlich (FH) | ||||
| N(constant) | 1.502 | 1.122 | 1.1189 | 1.109 |
| KF (mg1−1/n L1/n g−1) | 12.3073 | 2.5528 | 5.9097 | 6.60548 |
| R2 | 0.9882 | 0.9849 | 0.9888 | 0.9895 |
| Temkin (TN) | ||||
| B (= RT b−1; b (J mol−1)) | 55.636 | 18.746 | 21.514 | 21.973 |
| KT (L g−1) | 0.2936 | 0.3330 | 0.7382 | 0.8267 |
| R2 | 0.9897 | 0.9654 | 0.9694 | 0.9698 |
| Adsorbents | M (g L−1) | KL (L mg−1) | qm (mg g−1) | R2 | References |
|---|---|---|---|---|---|
| Sugarcane bagasse | 0.05 | 0.349 | 107.526 | 0.9900 | [67] |
| Rubber seed pericarp biomass treated with sulfuric acid | 0.025 | 0.510 | 567.600 | 0.9700 | [68] |
| Tea waste/Fe3O4 magnetic composite | 1.0 | 0.065 | 333.33 | 0.9890 | [71] |
| Coconut husk powder | 0.1 | - | 454.54 | 0.9980 | [72] |
| Activated Chromolaena odorata biomass | 15.0 | 40.0 | 142.85 | 0.9960 | [73] |
| Olive leaf powder | 0.1 | 0.042 | 133.33 | 0.9640 | [74] |
| Activated carbon of lemon wood (ACL) | 1.25 | 1.469 | 23.64 | 0.9704 | [75] |
| Magnetized activated carbon of lemon wood (ACL/Fe3O4) | 1.25 | 1.366 | 35.31 | 0.9826 | [75] |
| Eucalyptus camdulensis biochar | 0.5 | 26.14 | 54.64 | 0.9700 | [76] |
| Rubber granulate (RG) and scrap polyurethane foam (PUF) composite | 0.1 | 0.2284 | 20.92 | 0.9949 | [77] |
| Tectona grandis sawdust | 2 | 0.038 | 131.58 | 0.9980 | [62] |
| Orange peel waste | 2 | 0.210 | 138.88 | 0.9954 | [78] |
| Magnetized orange peel waste | 1 | 0.010 | 555.55 | 0.9912 | [78] |
| Magnetized polypyrrole/chitosan | 2 | 0.171 | 62.893 | 0.978 | [79] |
| Polyaniline/Tectona grandis sawdust | 0.8 | 0.148 | 263.2 | 0.9890 | [80] |
| Cucumis sativus peels | 5 | 0.03 | 149.25 | 0.9944 | [81] |
| AISD | 0.4 | 0.0270 | 270.27 | 0.9978 | Present work |
| Temperature (°C) | 30 | 40 | 50 | 60 |
|---|---|---|---|---|
| ∆G° (kJ mol−1) | 5.043 | 7.155 | 9.592 | 10.254 |
| ∆H° (kJ mol−1) | 50.0128 | |||
| ∆S° (J K−1 mol−1) | 182.467 | |||
Disclaimer/Publisher’s Note: The statements, opinions and data contained in all publications are solely those of the individual author(s) and contributor(s) and not of MDPI and/or the editor(s). MDPI and/or the editor(s) disclaim responsibility for any injury to people or property resulting from any ideas, methods, instructions or products referred to in the content. |
© 2023 by the authors. Licensee MDPI, Basel, Switzerland. This article is an open access article distributed under the terms and conditions of the Creative Commons Attribution (CC BY) license (https://creativecommons.org/licenses/by/4.0/).
Share and Cite
Ahamad, Z.; Nasar, A. Utilization of Azadirachta indica Sawdust as a Potential Adsorbent for the Removal of Crystal Violet Dye. Sustain. Chem. 2023, 4, 110-126. https://doi.org/10.3390/suschem4010009
Ahamad Z, Nasar A. Utilization of Azadirachta indica Sawdust as a Potential Adsorbent for the Removal of Crystal Violet Dye. Sustainable Chemistry. 2023; 4(1):110-126. https://doi.org/10.3390/suschem4010009
Chicago/Turabian StyleAhamad, Zeeshan, and Abu Nasar. 2023. "Utilization of Azadirachta indica Sawdust as a Potential Adsorbent for the Removal of Crystal Violet Dye" Sustainable Chemistry 4, no. 1: 110-126. https://doi.org/10.3390/suschem4010009