Article

WildTrack: An IoT System for Tracking Passive-RFID Microchipped Wildlife for Ecology Research

1
Department of Engineering, La Trobe University, Melbourne, VIC 3086, Australia
2
Department of Ecology, Environment and Evolution, La Trobe University, Melbourne, VIC 3086, Australia
*
Author to whom correspondence should be addressed.
Automation 2022, 3(3), 426-438; https://doi.org/10.3390/automation3030022
Submission received: 30 June 2022 / Revised: 2 August 2022 / Accepted: 5 August 2022 / Published: 8 August 2022
(This article belongs to the Special Issue Anniversary Feature Papers-2022)

Abstract

:
Wildlife tracking is used to acquire information on the movement, behaviour and survival of animals in their natural habitat for a wide range of ecological questions. However, tracking and monitoring free-ranging animals in the field is typically labour-intensive and particularly difficult in species that are small, cryptic, or hard to re-capture. In this paper, we describe and evaluate an Internet-of-Things (IoT)-based tracking system which automatically logs detected passive RFID tags and uploads them to the cloud. This system was successfully evaluated with 90 sensor modules deployed in a 30 ha wildlife sanctuary to monitor a small nocturnal mammal of less than 20 g in body size.

1. Introduction

The tracking and monitoring of wildlife is performed for many reasons and the technique used is often dictated by the needs of the research, size of the animals and length of time the monitoring needs to occur as well as budgetary considerations. For example, monitoring individuals following translocation or release in a conservation program is fundamental for assessing reintroduction success [1]. Both immediate short-term and long-term post release monitoring are essential. However, post release monitoring is often labour-intensive and difficult—especially when the species is small, cryptic or difficult to re-capture [2]. Technological advances, especially the miniaturisation of electronics, the extension of battery life and reduced energy consumption, have expanded the number of species that can be tracked electronically [3]. While there are currently multiple commonly used approaches for monitoring animals in their natural environment, these methods often come with a number of pros and cons (Table 1).
These techniques may be entirely passive with respect to the animal (e.g., camera, scat analysis), use animals tagged in a passive way (e.g., ID tags or RFID), or involve animals acting as radio beacons periodically transmitting data (e.g., VHF, Argos). Tags or beacons should not exceed 5% of the animals body weight, which significantly constrains tag design and type [4]. For some more difficult to access regions (e.g., underground) robotic camera/sensor systems may also be used [5].
RFID animal detection has been utilised widely in animal tracking in the past, particularly in livestock monitoring [6,7]. The use of RFID in wildlife monitoring has gained momentum in recent years, with active RFID tags/collars used in applications on larger species, for example, tracking koala use of road overpasses [8] and elephant movements in zoos [9]. With the miniaturisation of passive RFID now allowing some of the smallest animals to be tagged, this opens up the opportunity to monitor very small animals using stationary RFID readers as remote sensors within the environment. Stationary RFID readers have been used in monitoring bees returning to hives [10], birds visiting feeders and nestboxes [11], bats leaving cave roosts [12] and the movements of small mammals in semi-captive environments [13]. Despite the rapid expansion in the use of RFID technology in wildlife tracking, the expense of automated RFID readers had been a limiting factor (USD 1000–USD 10,000) resulting in the need for tagged individuals to repeatably visit a central location (i.e., feeder, nest box) to come in contact with a limited number of readers. The recent development of inexpensive readers coupled with wireless communication allows for a scalable solution with real-time data collection that may be accessed remotely.
The choice of tracking technology is often dependent on the animals being tracked, the cost, what information is required and environmental conditions, including the range over which the tracking occurs. Smaller animals, in particular, cannot support heavy active tracking solutions with batteries and, so, passive forms of tracking, including RFID and cameras, are normally used. Recent advances in image processing have led to automated visual tracking, which is non-invasive and can track animal pose and posture [14,15,16,17]. Active tracking approaches are being miniaturised but still require a power source (typically a battery) which can facilitate fewer readers and longer tracking distances but also have a finite life before the power source is expended [18]. In contrast, passive RFID tracking can work indefinitely and is widely used for stock management for farming using longer range UHF (868–915 MHz) ear-tags or collars [7]. Smaller animals (and often household pets) are typically fitted with microchip RFID devices (e.g., FDX-B) which are very lightweight, are typically injected under the skin and have a lower reading distance [19]. Figure 1 shows the chip location for a mouse, demonstrating that the chip orientation with respect to an antenna will move depending on the pose of the mouse.
Considering the labour-intensive challenges of tracking animals in the wild, particularly involving small, cryptic, nocturnal species, this paper describes a novel passive RFID tracking system which wirelessly uploads data to the cloud. This system is targeted towards smaller animals (<2 kg) provided that the RFID reader antenna can be mounted within a close vicinity of where the animal will traverse. Transmitters record microchipped ID numbers when the tagged individual passes base stations and communicate wirelessly to a data recording hub, allowing non-invasive automated tracking of animal movement, which would not be possible with other survey techniques for a small cryptic species <20 g. LoRa (long range) communications is one common communication protocol which allows data transmission up to several kilometers for low bandwidth applications [20]. This method allows non-invasive identification and location of individuals providing easily accessible, individual-specific data on survival as well as movement in the landscape. Hence, the system provides a means for highly scalable wildlife fieldwork in tracking passive RFID-microchipped animals.
This paper is structured as follows: Section 2 describes the system design and implementation. Section 3 describes the field testing methodology. Section 4 presents the system results and a discussion of the system efficacy. Finally, Section 5 presents the concluding remarks.
Table 1. Comparison of animal tracking techniques.
Tracking TechniqueDescriptionInformation ObtainedHow Information Is ObtainedSpatial AccuracyMinimum Body Size (g) *Lifespan of DeviceCost per UnitPros and Cons
Indirect measures (i.e., scats, tracks and hair samples) [21,22,23]Scats: identify species using faeces. Tracks: sand or ink pads to identify species from foot tracks. Hair funnels: sticky funnels or hoops which capture hair for species identification.Presence dataOpportunistically obtainedExactn/an/aVariableUseful for confirming presence of a species but not individual identification. Genetic analysis is time-consuming and expensive. Track analysis is weather-dependent.
Camera traps [24,25]Camera placed in the environment that is automatically triggered typically by passive infrared motion sensorPresence data. Time and location data.Requires animal to trigger the camera by passing through a sensorExactn/aDays to monthsUSD 100–USD 800Useful in picking up difficult-to-catch or cryptic species. Does not require animal to carry a device. Image sorting is labour-intensive. Rarely useful in individual identification.
Individual identification tags [26]Small individually numbered metal or plastic tags attached to the animal (i.e., ears, legs or wings)Location and survival at subsequent re-capturesRequires capture and attachment of tags, followed by recaptureExact 1 gYearsMinimal <USD 0.20/ tagCheap (can deploy large numbers). Suitable for small species. Usually lasts the animal’s lifetime. Requires re-capture. Labour intensive.
VHF (very high frequency) or transponder radio telemetry [3,27,28,29]Uses the transmission of radio signals to locate a transmitter attached to the animalTime and location dataRequires capture and attachment of tag. Data obtained when animal is near an antenna or receiver (<5 m) 10 m6.6 gFrom days to months dependant on battery size, transmitter power and update rate [30]USD 100–USD 300Relatively inexpensive. Transmitters come in a variety of sizes. Smaller tags have shorter battery life. Labour intensive, but can be automated with towers and fixed receivers for less mobile species. Lower spatial accuracy.
Satellite or transponder telemetry (GPS and Argos tracking) [31,32]Transmitter is attached to animal and sends a signal to orbiting satellites. The satellites retransmit the data back to be stored on the transmitter or sent to a receiving station.Time and location dat.aRequires capture and attachment of tag. Data transmitted to satellites. Requires recapture with some tags to retrieve stored data. 250–1500 m120 gFrom months to  1 year dependant on battery size of transmitterUSD 2000–USD 7000Expensive and large. Reduced labour as data is collected automatically. All Argos tags transmit but not all GPS do. Archival GPS tags store data on tag and hence require retrieval. Tags that transmit information do not need to be retrieved and data can be accessed by computer. Reduced spatial accuracy.
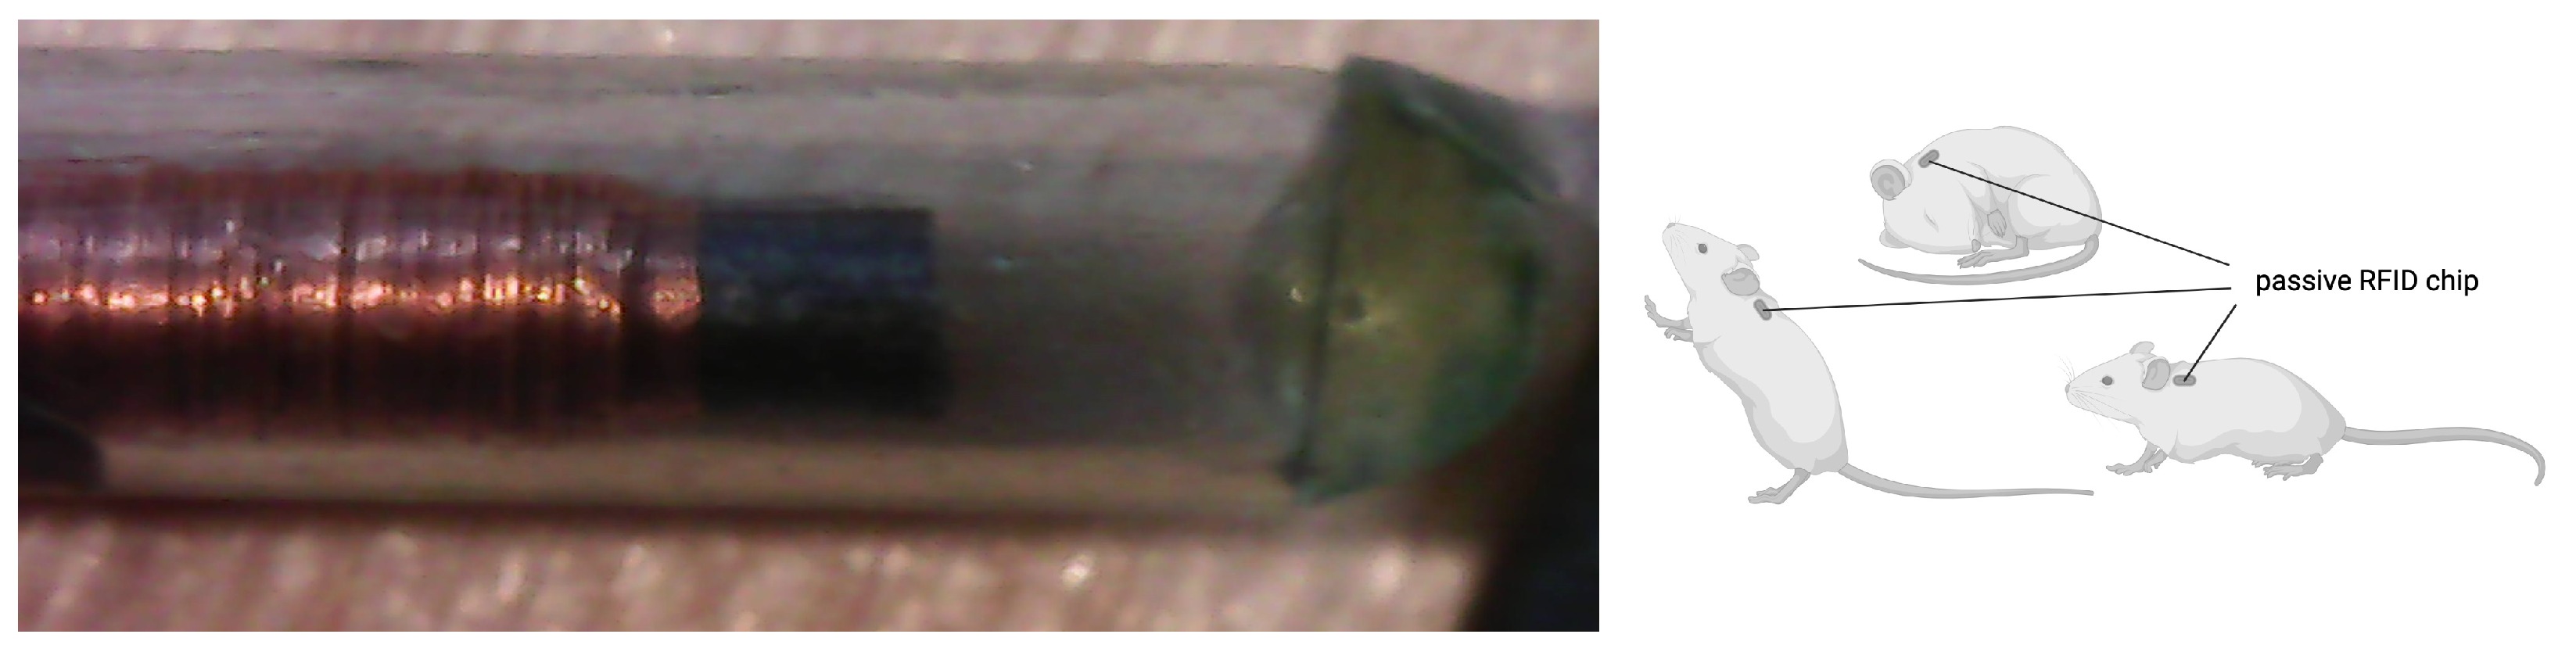
Radio frequency identification (RFID) tags [8,33]RFID tags or microchips can be glued or implanted on the animal. PIT (passive integrated transponder) tags are not powered; instead, the chip is activated when close to an antenna. Hence, they are some of the smallest tags available (3–60 mg).Time animal was near receiver (location if multiple receivers are used)When animal is close to a receiver (<1 m)Exact0.03 gYears<USD 2/ chipReceivers can be costly USD 2,000 and minimal expense per tag (can deploy large numbers). Tags are battery-less, lightweight and can last the animals lifetime. Suitable for very small species. Needs to come close to a receiver to transmit data
* Tags attached to wildlife should not exceed 5% of the body weight of the animal.
Many RFID reader systems perform on-board tag monitoring which is well-suited to laboratory environments but more cumbersome for conducting fieldwork trials over longer periods of time [19,34]. The introduction of IoT/RFID technology allows sensors to be distributed throughout the environment or placed at high traffic sites for the targeted species such as at entrances of burrows or hollows, allowing tagged individuals to register their unique microchip as they pass by or through the antenna. Data can be accessed remotely, and monitoring can occur over long time periods. This serves as a novel method for tracking the presence and location of individuals being monitored, without the need for time-consuming or expensive traditional methods of tracking each individual. Additionally, it allows for the detection of very small species and cryptic species that are difficult to re-capture. The system described in this paper is most well-suited to very small animals, where active tags are too heavy, so that data can be captured automatically as animals roam within their environment.

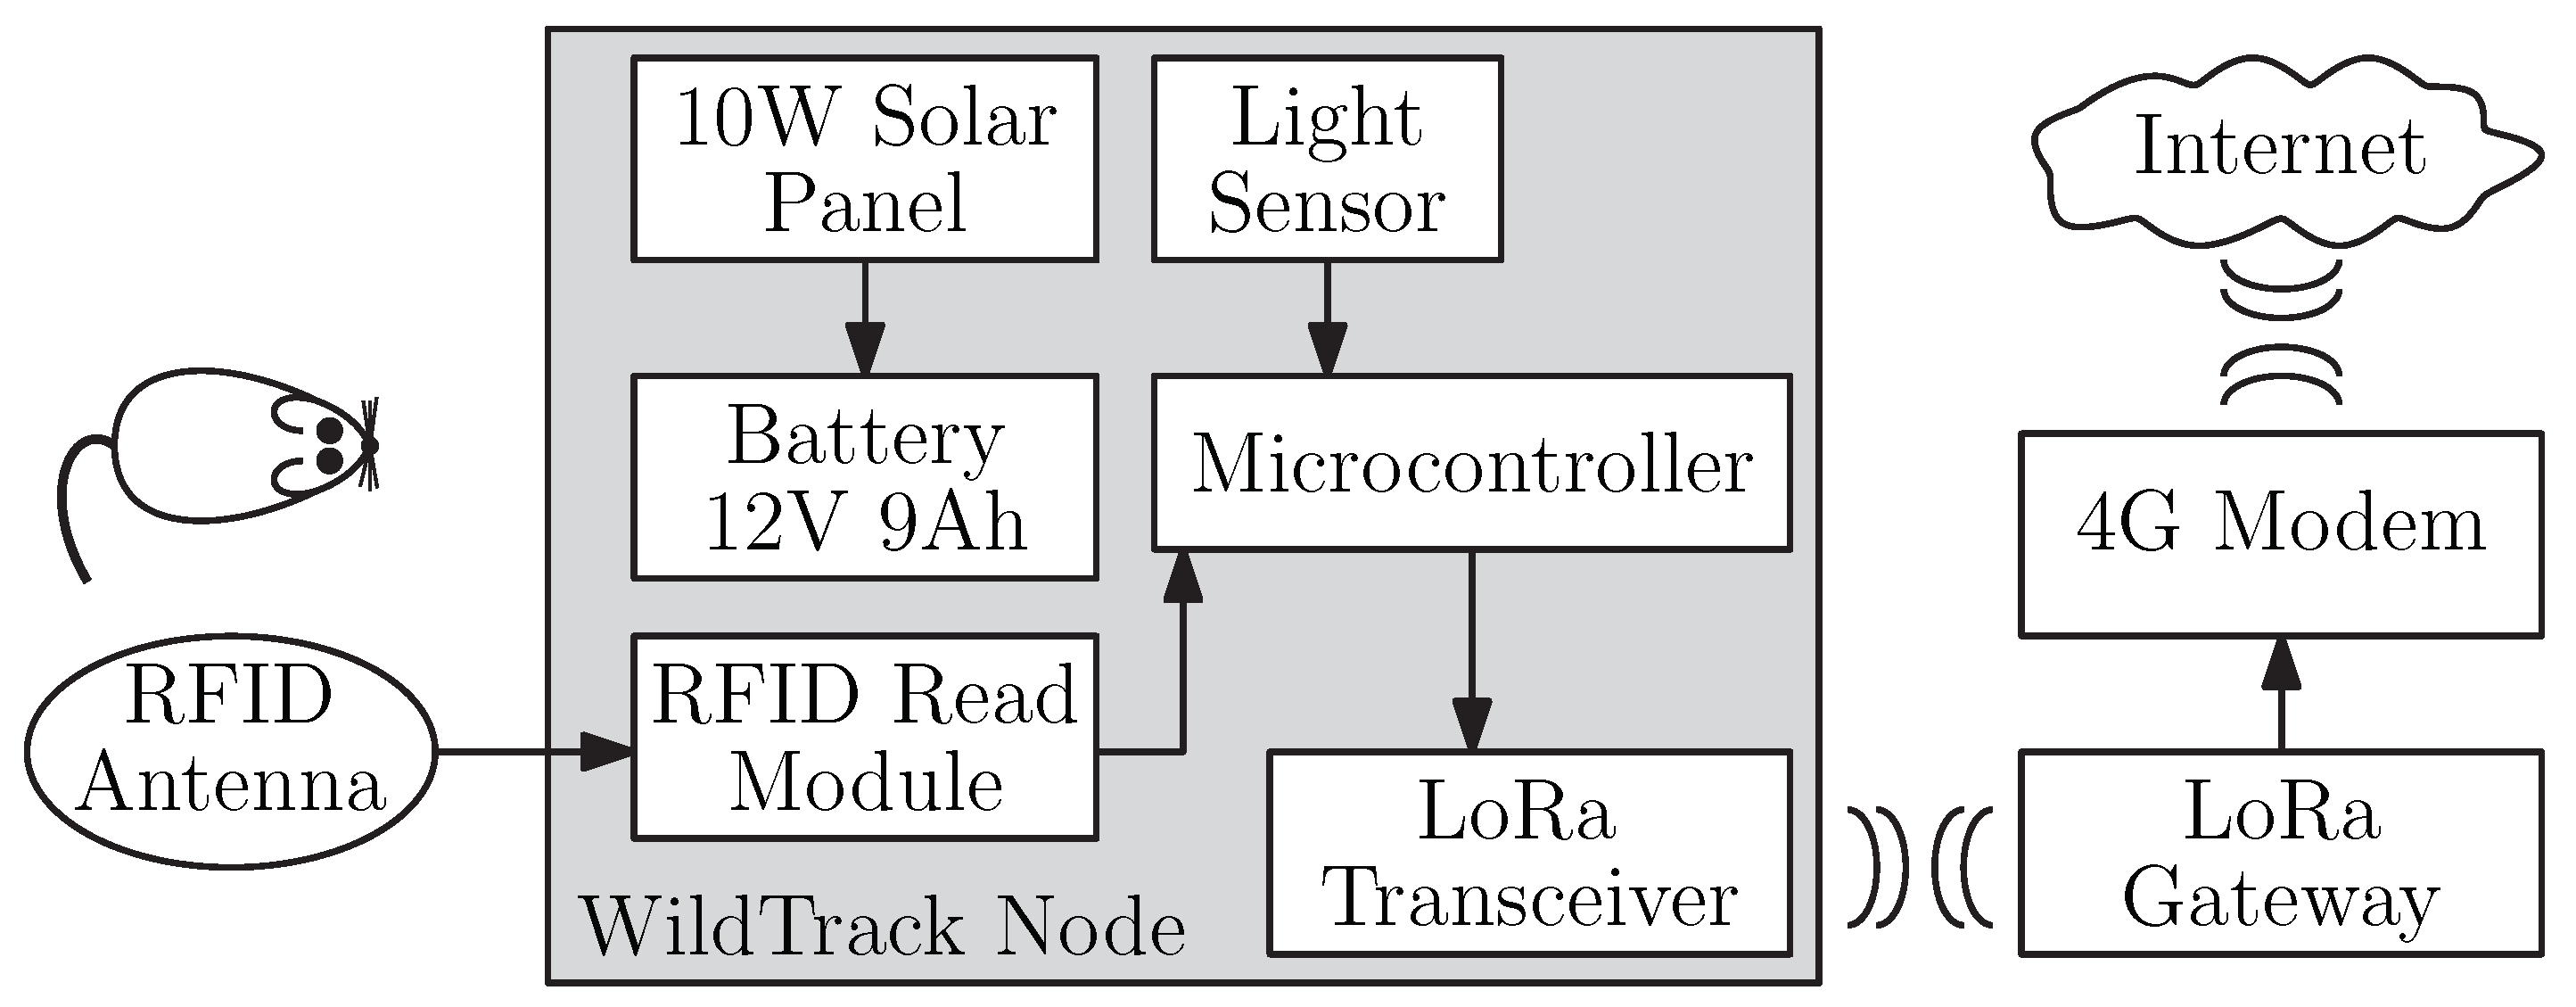
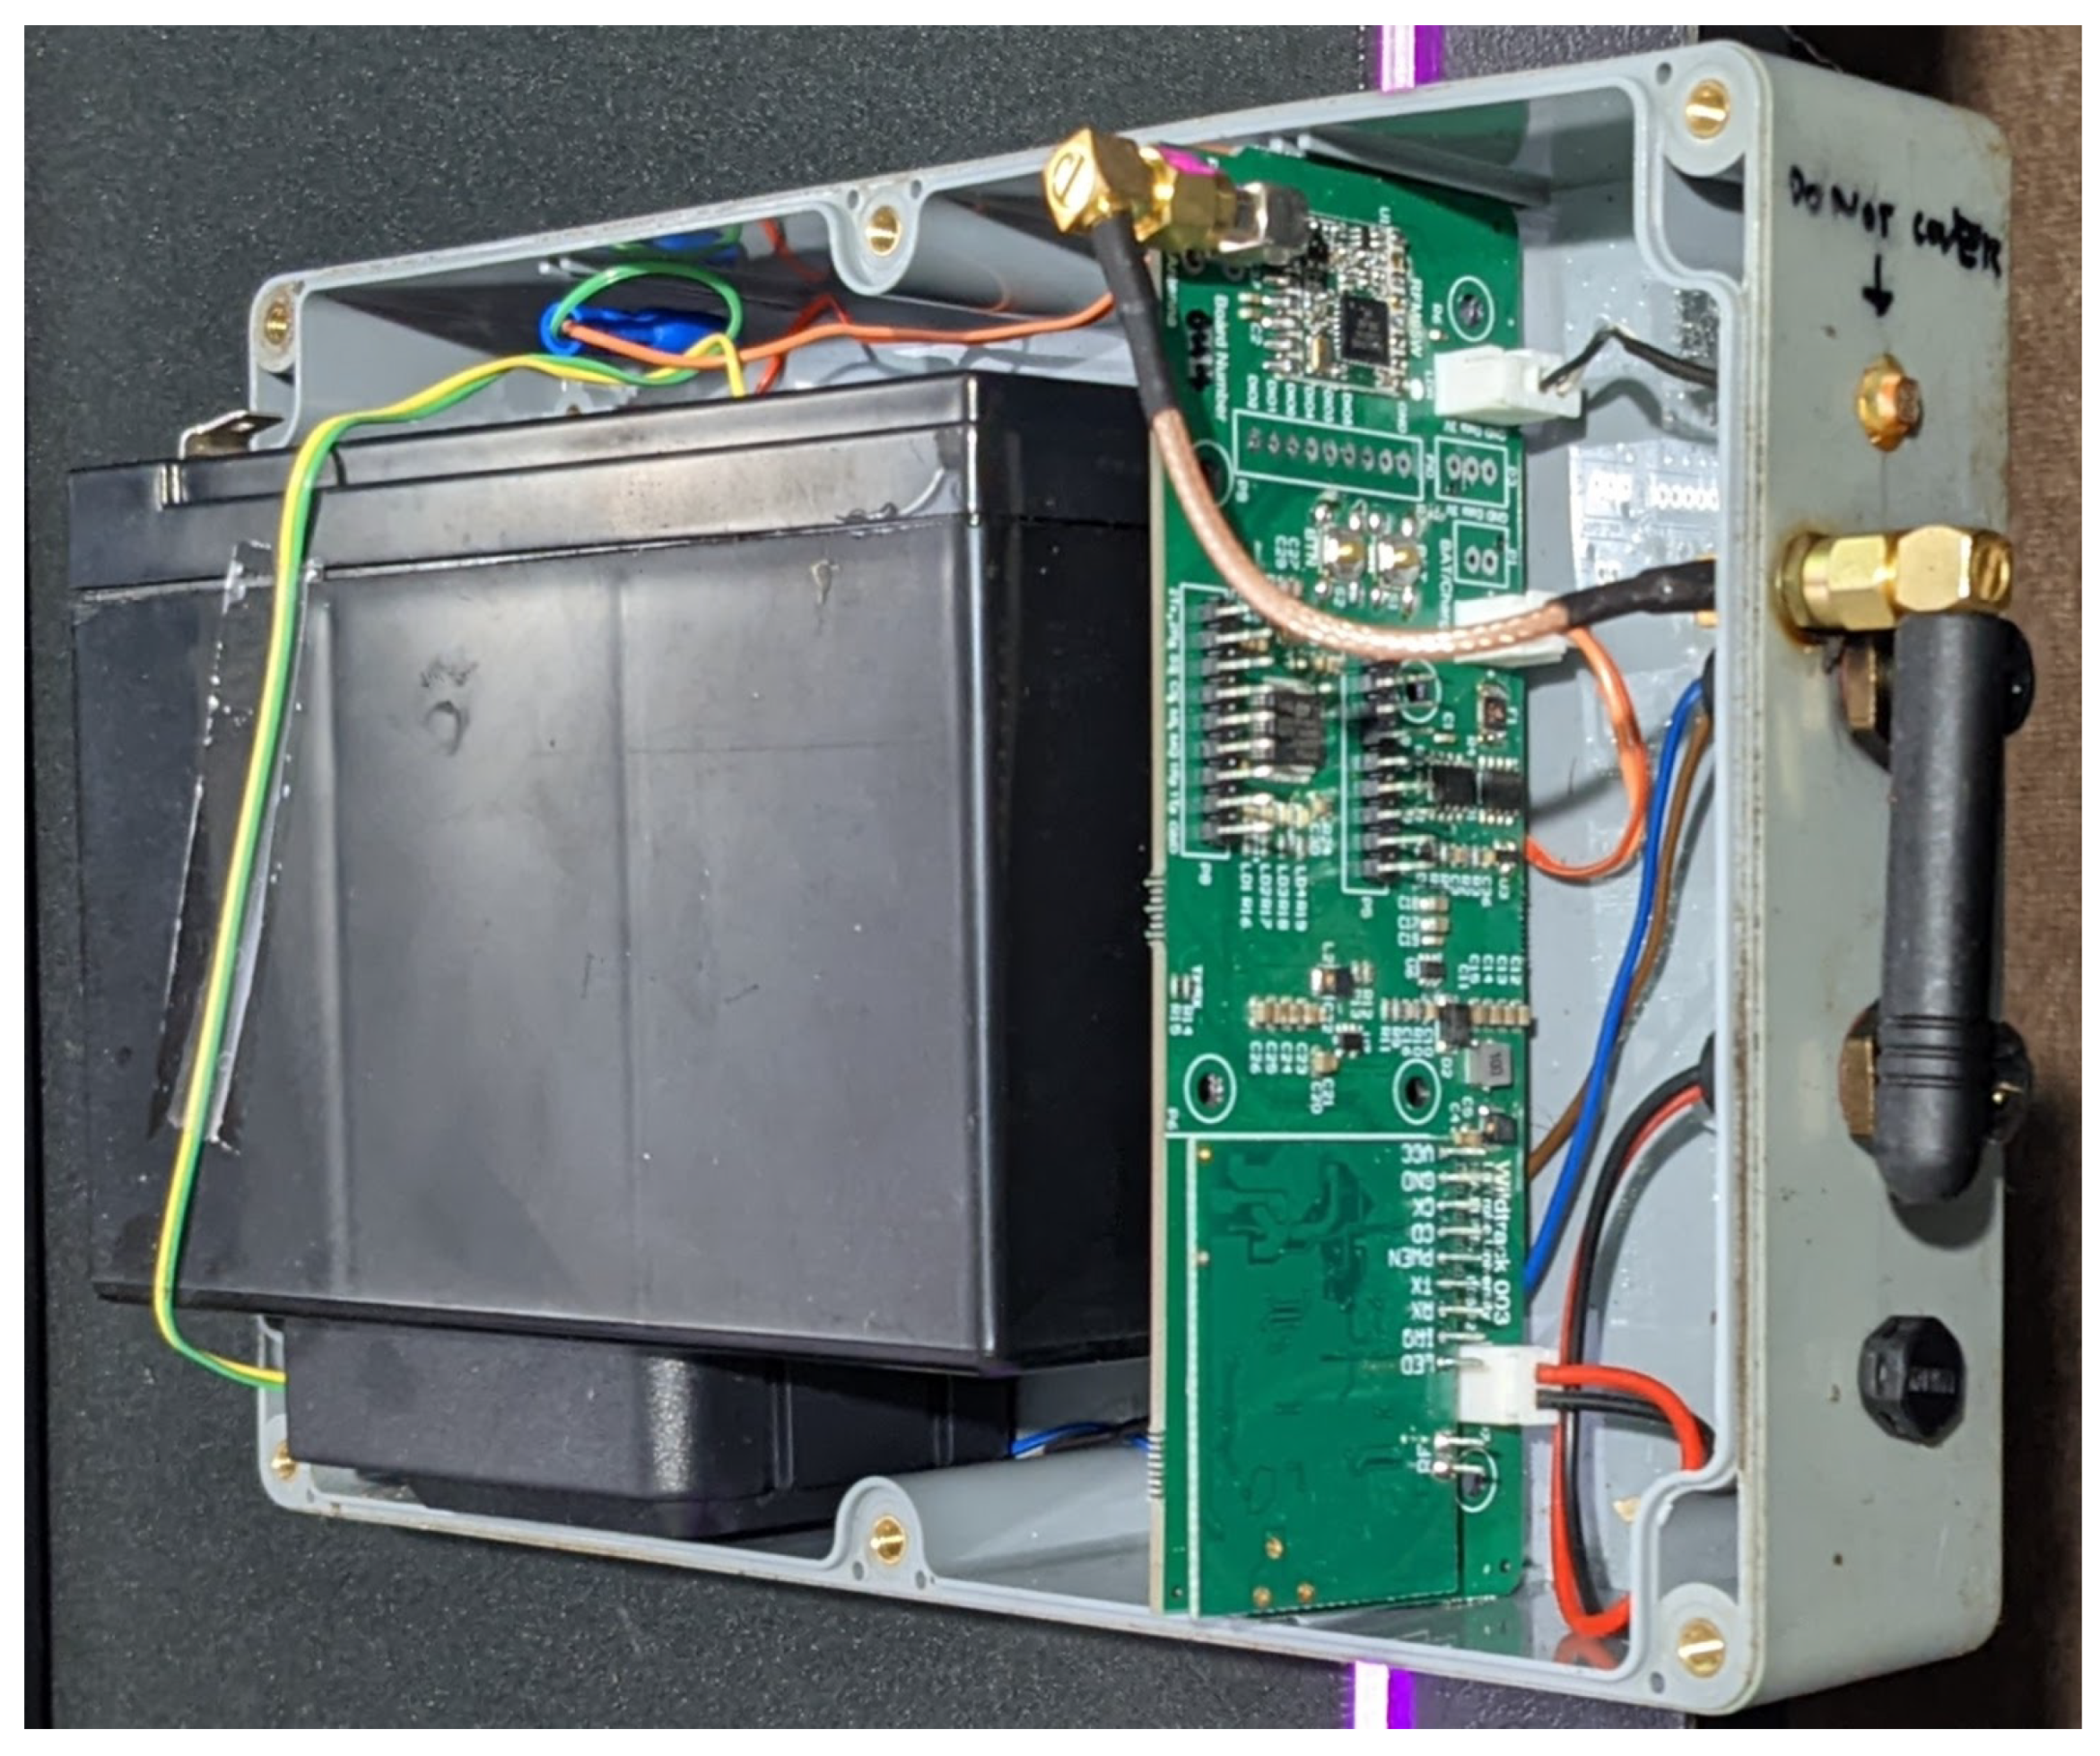
2. System Design and Implementation

In this section, we describe the design parameters and implementation details for the WildTrack system. Figure 2 shows a block diagram view of the automated system.
The system is powered by a single 12 V 9 Ah sealed lead acid (Gell Cell) battery (Figure 3), which comprises the majority of the weight and area of the device. A 10 W solar panel is used to charge up the battery using a pulse width modulation charge controller (Figure 4). When the RFID antenna is active, the systems draw approximately 0.75 W, which drops down to 0.25 W when the antenna is not active. The 0.25 W includes illumination of charging LEDs, which are a useful diagnostic tool but could be removed for significant power saving. Hence, it is advantageous (from the point of view of battery life) to match the RFID antenna active time with the expected detection behaviour (e.g., nocturnal or diurnal). As our test species (house mouse) are nocturnal, the system was configured to have the RFID antenna active only at night, which is measured using a light dependent resistor (LDR). Given a fully charged battery has a capacity of 9 × 12 = 108 W, the system could conceivably operate for approximately 9 days (from a full charge) given an average power consumption of 12 W per day (12 × 0.75 + 12 × 0.25) with no solar charging occurring.
A 6900 RFID reader module was integrated into the design with a tuned frequency of 134.2 kHz. The reader is connected to a 10 cm diameter loop antenna with an inductance of approximately 100 μ H. The reader module is set to continuously read and, when a tag is detected, outputs a serial string consisting of a label which specifies the type of tag (e.g., FDX-B), the tag number and a checksum value.
Communication to the internet gateway is facilitated by a LoRa gateway communicating with low-cost LoRa transceivers (RFM95W) on each of the boards operating at 915 MHz (LoRA frequency for Australia). LoRa was selected as the application requires a long range, low cost and very little bandwidth—all of which are reflected by LoRa technology. LoRa provides a significantly longer range than other low-cost alternatives (e.g., WiFi) and much lower cost compared to network implementations (e.g., NB-IoT or SigFox). Packets sent via LoRa each contain a packet counter (so missing packets can be identified), the RFID tag number (where detected), a unique hardware ID for each tracker and the battery voltage. On the server, each packet is also combined with a date/time stamp, the received signal strength indicator RSSI and signal-to-noise Ratio (SNR). The transceivers send a LoRa packet whenever an RFID tag is detected and also each hour to track battery life.
Data uploaded to the cloud is collated in a Google Docs spreadsheet, providing a simple interface for authorised people to investigate and interrogate data.

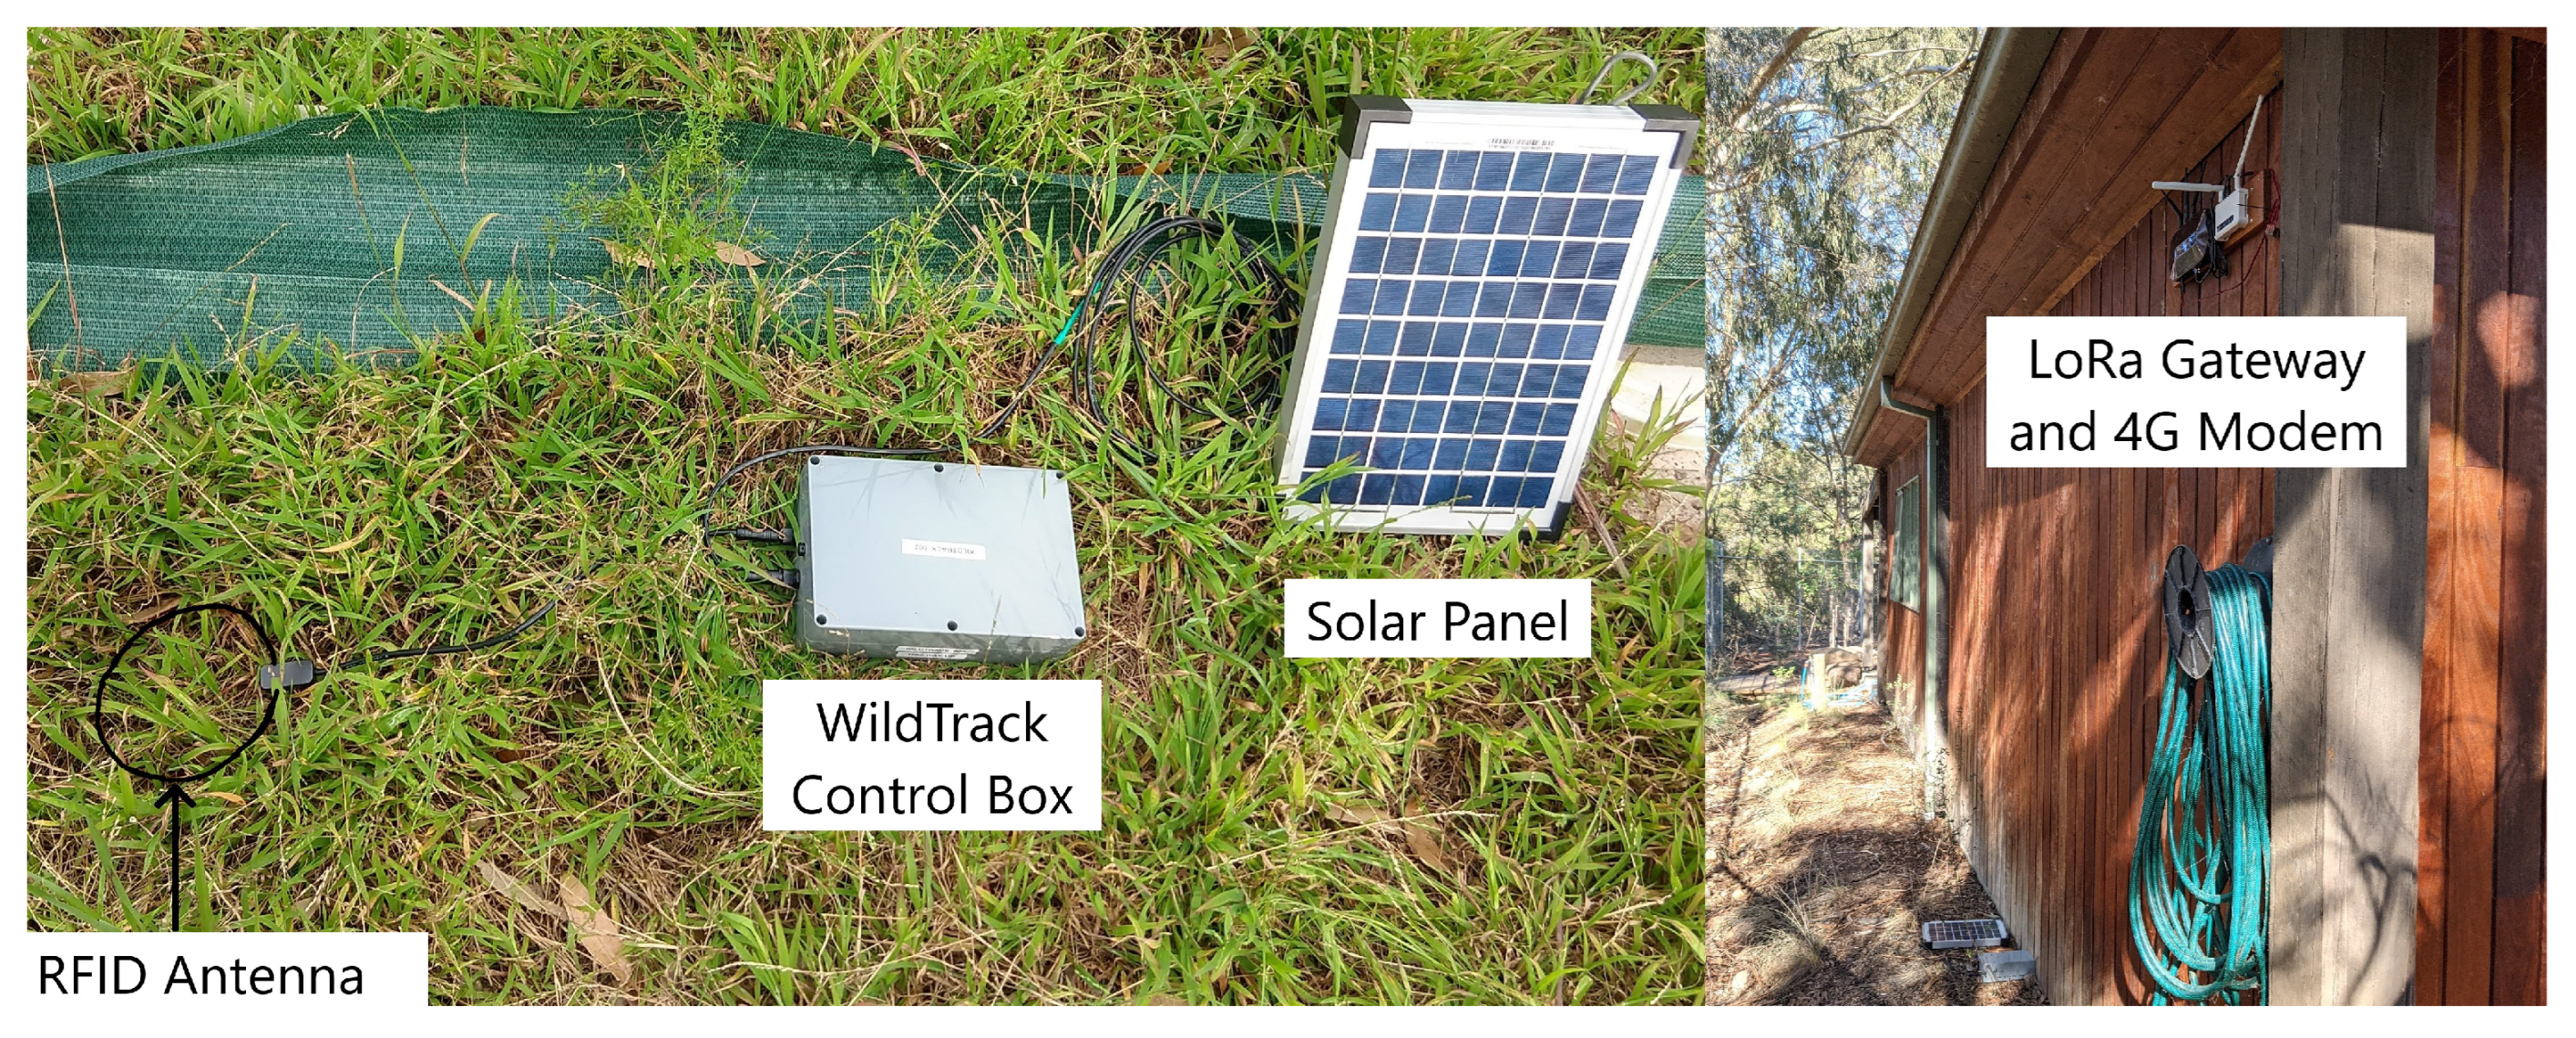
3. Field Testing Methodology

Here we describe the field based testing of WildTrack using microchipped house mice (Mus musculus) as a model for the reintroduction of a similar-sized small nocturnal native mammal into the same habitat. The field test site was the Nangak Tamboree Wildlife Sanctuary (formally the La Trobe Wildlife Sanctuary), a 30 ha river red gum (Eucalyptus camaldulensis) grassy woodland located 11 km north-east of the centre of Melbourne (37°39 55.58 S, 144°46 12.79 E). Previously a degraded agricultural landscape, it was redeveloped as a flora and fauna sanctuary in 1967. Within the sanctuary, we constructed 10 soft-release enclosures of 15 m 2 (Figure 5) and deployed 8–10 WildTrack base station/antennas randomly within each enclosure (Table 2). Six enclosures (1–5 and 7) had four microchipped mice released into them between the 10–18 of February 2021 and were monitored for a one month period (Table 2).
We trapped house mice in the vicinity of the enclosures using Elliot traps (from Elliot Scientific) baited with universal bait between the 1–18th of February 2021. On capture, each mouse was injected with a commercial microchip (8 mm AgriEid Pet ID Microchips) dorsally between the shoulder blades and released into one of the six soft-release enclosures (1–5 and 7) to be remotely monitored using WildTrack for a one-month period (Table 2).
Finally, testing was conducted to determine the efficacy of the LoRa communications and effect of antenna placement within the environment consisting of bushland, as shown in Figure 5. The LoRA gateway (Figure 4) was mounted 2.4 m from the ground on the side of a building, facing north.
At each of the location points (Figure 5) A, B and C), tests were conducted with three different antenna heights (0 m, 1 m and 1.5 m) to quantify the RF performance. Each test was repeated 5 times at 20-second intervals and then was repeated another 5 times on another node to confirm repeatability across nodes. For each test the RSSI (received signal strength indicator) and SNR (signal-to-noise ratio) was recorded on the gateway. For reference, LoRa can operate down to −120 dBm RSSI and −20 dB SNR, with higher values indicating better signal strength [35].

4. Results and Discussion

This section evaluates the performance of the WildTrack system in detecting microchipped mice (as described in the previous section) and evaluates the accuracy and performance of antenna reads and signal strength. All enclosures (1–5 and 7, see Figure 5 for locations) detected at least one of the four mice released with a total of 189 individual detections from 25 of the 54 readers installed in the enclosures (Table 2). Hence, 46% of all the readers made a detection during the monitoring period. Two mice from separate enclosures (4 and 5) escaped and were detected in enclosure 8—a 150–200 m distance away.
As accurate detection of the RFID tags is paramount for such a system, tests were carried out to determine read distance, orientation and the velocity at which tags could be detected. To record the maximum RFID read distance, a 12 mm FDX-B chip was slowly moved closer to the antenna with three different orientations with respect to the antenna plane: parallel, perpendicular and at a 45 degree angle. This test was performed at three different locations: at the edge of the antenna, 40 mm from the antenna edge and in the centre of the antenna. Each test was repeated five times with the results shown in Table 3.
The RFID antenna results (Table 3) indicate that the orientation of the plane of the antenna to the RFID chip has a significant influence on the expected reading range. The reading range varied from 38 mm to 153 mm dependent on orientation. In each case, the best orientation for reading occurs when the chip is closest to perpendicular to the plane of the antenna. In the case where the chip is perpendicular to the antenna plane, the internal antenna with the chip will be close to co-planar with the RFID reader (Figure 1). Although, when the RFID chip is parallel to the reader antenna, the range is greatly reduced. Chipped antennas (within animals) are unlikely to maintain a perfectly parallel orientation of their chips during their movement, so we expect the variations in animal movement to be helpful.
A high-speed camera was used to determine at what velocity the RFID chip can be recorded. The chip was passed moved with an angle of 45 , 40 mm from the centre of the antenna. The reader was able to detect and read the antennas up to a velocity of 3.5 m/s.
Table 4 summarises the signal-strength results for each of the three representative locations. The results show that lifting the antenna off the ground tends to improve the RSSI and SNR, which accords with conventional knowledge related to free-space path loss [36]. In contrast to conventional free-space path-loss models (e.g., Hata, Okumura) some of the 1.5 m node antenna measurements result in a lower RSSI and SNR than the 1 m height, and, so, in these environments higher is not always better. We expect this discrepancy is due to the environmental conditions where trees of varying heights are blocking the signal by varying amounts (i.e., some 1 m antenna heights may allow a signal to propagate below the tree canopy more effectively). A lower frequency (e.g., 433 MHz vs. 915 MHz), as permitted in some countries, would be expected to provide better signal penetration through the vegetation [37].

5. Conclusions

Tracking wildlife for the purpose of conservation and research is typically labour-intensive, expensive and difficult to scale. Inadequate post-release monitoring is a significant issue with the majority of monitoring difficulties occurring for species of a small or cryptic nature [1]. Many small species cannot be monitored well or at all post release due to their inability to carry tracking devices because of size or due to their cryptic or shy nature, which prevents recapture or detection. Even when species are large enough to carry monitoring devices, the monitoring is restricted by the battery life of the device. The use of small passive RFID microchips that remain with the animal for its lifetime and can be detected and automatically reported from the field provides a significant advantage to researchers. In this paper, we describe and evaluate WildTrack—a low-powered Internet-of-Things (IoT)-based cloud-connected passive RFID scanning device that can detect very small species implanted with RFID tags and allow researchers to access the detection data remotely. Evaluations were performed based on deployment of 90 WildTrack modules within an enclosed native wildlife sanctuary (54 in enclosures with microchipped mice of 20 g) with a single LoRa gateway receiver where data was logged and uploaded to the cloud. The results indicate that, even with the relatively dense flora, the system successfully captures RFID data and uploads packets to the cloud within seconds. We now consider the extent to which our requirements were met and discuss the future directions in which we are taking this work.
In terms of quality in use, we developed a LoRA-enabled RFID reader which logs all scanned tags to the cloud without user interaction. This remote-sensing solution significantly reduces labour and provides a solution which is scalable, as one LoRa gateway can support 100’s of sensor nodes. Consequently, we are able to claim that our overall objective was largely achieved, that is, we have achieved a cloud-connected RFID sensor system to facilitate wildlife research.
We envisage that potential future work could include a lower power variant which remains asleep until wakened (e.g., motion sensor, capacitive sensor) to take measurements which could potentially remove the need for solar charging or result in a substantially smaller solar panel.

Author Contributions

Conceptualization, R.R., K.A.R.; Formal analysis, K.A.R., B.A., R.R.; Funding acquisition, K.A.R., R.R.; Investigation, B.B., B.A., E.L.S., K.A.R., R.R.; Methodology, B.B., B.A., E.L.S., K.A.R., R.R.; Project administration, R.R., K.A.R.; Writing—original draft, R.R., K.A.R. All authors have read and agreed to the published vershion of the manuscript.

Funding

This research was funded by a grant from the Securing Food, Water and Environment (SFWE) Research Focus Area (RFA) to K.A.R. and R.R.

Institutional Review Board Statement

The animal study protocol was approved by the or Ethics Committee of La Trobe University (AEC18003).

Informed Consent Statement

Not Applicable.

Data Availability Statement

Not applicable.

Acknowledgments

Field testing was performed under La Trobe animal ethics approval AEC18003. We thank Kelly Williams for assistance in the field.

Conflicts of Interest

The author declares no conflict of interest.

References

  1. Linhoff, L.J.; Soorae, P.S.; Harding, G.; Donnelly, M.A.; Germano, J.M.; Hunter, D.A.; McFadden, M.; Mendelson, J.R., III; Pessier, A.P.; Sredl, M.J.; et al. IUCN Guidelines for Amphibian Reintroductions and Other Conservation Translocations. 2021. Available online: https://policycommons.net/artifacts/1529413/iucn-guidelines-for-amphibian-reintroductions-and-other-conservation-translocations/ (accessed on 20 July 2022).
  2. Berger-Tal, O.; Blumstein, D.; Swaisgood, R.R. Conservation translocations: A review of common difficulties and promising directions. First Edition. Int. Union Conserv. Nat. 2020, 23, 121–131. [Google Scholar]
  3. Kays, R.; Crofoot, M.C.; Jetz, W.; Wikelski, M. Terrestrial animal tracking as an eye on life and planet. Science 2015, 348, 1222–1233. [Google Scholar] [CrossRef] [PubMed] [Green Version]
  4. Sikes, R.S.; Care, A. 2016 Guidelines of the American Society of Mammalogists for the use of wild mammals in research and education. J. Mammal. 2016, 97, 663–688. [Google Scholar] [CrossRef] [PubMed]
  5. Ross, R.; Carver, S.; Browne, E.; Thai, B.S. WomBot: An exploratory robot for monitoring wombat burrows. SN Appl. Sci. 2021, 3, 1–10. [Google Scholar] [CrossRef]
  6. Ruiz-Garcia, L.; Lunadei, L. The role of RFID in agriculture: Applications, limitations and challenges. Comput. Electron. Agric. 2011, 79, 42–50. [Google Scholar] [CrossRef] [Green Version]
  7. Brown-Brandl, T.M.; Adrion, F.; Maselyne, J.; Kapun, A.; Hessel, E.; Saeys, W.; Van Nuffel, A.; Gallmann, E. A review of passive radio frequency identification systems for animal monitoring in livestock facilities. Appl. Eng. Agric. 2019, 35, 579–591. [Google Scholar] [CrossRef]
  8. Rafiq, K.; Appleby, R.G.; Edgar, J.P.; Radford, C.; Smith, B.P.; Jordan, N.R.; Dexter, C.E.; Jones, D.N.; Blacker, A.R.; Cochrane, M. WildWID: An open-source active RFID system for wildlife research. Methods Ecol. Evol. 2021, 12, 1580–1587. [Google Scholar] [CrossRef]
  9. Scott, N.L.; Hansen, B.; LaDue, C.A.; Lam, C.; Lai, A.; Chan, L. Using an active Radio Frequency Identification Real-Time Location System to remotely monitor animal movement in zoos. Anim. Biotelemetry 2016, 4, 1–10. [Google Scholar] [CrossRef] [Green Version]
  10. Barlow, S.E.; O’Neill, M.A.; Pavlik, B.M. A prototype RFID tag for detecting bumblebee visitations within fragmented landscapes. J. Biol. Eng. 2019, 13, 1–6. [Google Scholar] [CrossRef]
  11. Bonter, D.N.; Bridge, E.S. Applications of radio frequency identification (RFID) in ornithological research: A review. J. Field Ornithol. 2011, 82, 1–10. [Google Scholar] [CrossRef]
  12. van Harten, E.; Reardon, T.; Lumsden, L.F.; Meyers, N.; Prowse, T.A.; Weyland, J.; Lawrence, R. High detectability with low impact: Optimizing large PIT tracking systems for cave-dwelling bats. Ecol. Evol. 2019, 9, 10916–10928. [Google Scholar] [CrossRef] [PubMed]
  13. König, B.; Lindholm, A.K.; Lopes, P.C.; Dobay, A.; Steinert, S.; Buschmann, F.J.U. A system for automatic recording of social behavior in a free-living wild house mouse population. Anim. Biotelemetry 2015, 3, 1–15. [Google Scholar] [CrossRef] [Green Version]
  14. Walter, T.; Couzin, I.D. TRex, a fast multi-animal tracking system with markerless identification, and 2D estimation of posture and visual fields. eLife 2021, 10, e64000. [Google Scholar] [CrossRef] [PubMed]
  15. Bonneau, M.; Vayssade, J.A.; Troupe, W.; Arquet, R. Outdoor animal tracking combining neural network and time-lapse cameras. Comput. Electron. Agric. 2020, 168, 105150. [Google Scholar] [CrossRef]
  16. Ross, R.; Parsons, L.; Thai, B.S.; Hall, R.; Kaushik, M. An IOT smart rodent bait station system utilizing computer vision. Sensors 2020, 20, 4670. [Google Scholar] [CrossRef] [PubMed]
  17. Duda, N.; Nowak, T.; Hartmann, M.; Schadhauser, M.; Cassens, B.; Wägemann, P.; Nabeel, M.; Ripperger, S.; Herbst, S.; Meyer-Wegener, K.; et al. BATS: Adaptive ultra low power sensor network for animal tracking. Sensors 2018, 18, 3343. [Google Scholar] [CrossRef] [Green Version]
  18. Lu, J.; Li, H.; Tian, C.; Myjak, M.J.; Xiao, J.; Bellgraph, B.J.; Cartmell, S.S.; Deng, Z.D. A Frequency-Programmable Miniaturized Radio Frequency Transmitter for Animal Tracking. Sensors 2021, 21, 6683. [Google Scholar] [CrossRef]
  19. Habedank, A.; Urmersbach, B.; Kahnau, P.; Lewejohann, L. O mouse, where art thou? The Mouse Position Surveillance System (MoPSS)—An RFID-based tracking system. Behav. Res. Methods 2022, 54, 676–689. [Google Scholar] [CrossRef]
  20. Sinha, R.S.; Wei, Y.; Hwang, S.H. A survey on LPWA technology: LoRa and NB-IoT. ICT Express 2017, 3, 14–21. [Google Scholar] [CrossRef]
  21. Klare, U.; Kamler, J.F.; Macdonald, D.W. A comparison and critique of different scat-analysis methods for determining carnivore diet. Mammal Rev. 2011, 41, 294–312. [Google Scholar] [CrossRef]
  22. Gužvica, G.; Bošnjak, I.; Bielen, A.; Babić, D.; Radanović-Gužvica, B.; Šver, L. Comparative analysis of three different methods for monitoring the use of green bridges by wildlife. PLoS ONE 2014, 9, e106194. [Google Scholar] [CrossRef] [PubMed] [Green Version]
  23. Mills, D.; Harris, B.; Claridge, A.; Barry, S. Efficacy of hair-sampling techniques for the detection of medium-sized terrestrial mammals. I. A comparison between hair-funnels, hair-tubes and indirect signs. Wildl. Res. 2002, 29, 379–387. [Google Scholar] [CrossRef]
  24. Fonteyn, D.; Vermeulen, C.; Deflandre, N.; Cornelis, D.; Lhoest, S.; Houngbégnon, F.G.; Doucet, J.L.; Fayolle, A. Wildlife trail or systematic? Camera trap placement has little effect on estimates of mammal diversity in a tropical forest in Gabon. Remote. Sens. Ecol. Conserv. 2021, 7, 321–336. [Google Scholar] [CrossRef]
  25. Rovero, F.; Zimmermann, F.; Berzi, D.; Meek, P. “Which camera trap type and how many do I need?” A review of camera features and study designs for a range of wildlife research applications. Hystrix 2013, 24, 148–156. [Google Scholar]
  26. Rivalan, P.; Godfrey, M.H.; PRÉVOT-JULLIARD, A.C.; Girondot, M. Maximum likelihood estimates of tag loss in leatherback sea turtles. J. Wildl. Manag. 2005, 69, 540–548. [Google Scholar] [CrossRef]
  27. Kays, R.; Tilak, S.; Crofoot, M.; Fountain, T.; Obando, D.; Ortega, A.; Kuemmeth, F.; Mandel, J.; Swenson, G.; Lambert, T.; et al. Tracking animal location and activity with an automated radio telemetry system in a tropical rainforest. Comput. J. 2011, 54, 1931–1948. [Google Scholar] [CrossRef]
  28. Ojo, M.O.; Viola, I.; Baratta, M.; Giordano, S. Practical experiences of a smart livestock location monitoring system leveraging gnss, lorawan and cloud services. Sensors 2021, 22, 273. [Google Scholar] [CrossRef]
  29. Liu, X.; Yang, T.; Yan, B. Internet of things for wildlife monitoring. In Proceedings of the 2015 IEEE/CIC International Conference on Communications in China-Workshops (CIC/ICCC), Shenzhen, China, 2–4 November 2015; pp. 62–66. [Google Scholar]
  30. Dyo, V.; Ellwood, S.A.; Macdonald, D.W.; Markham, A.; Mascolo, C.; Pásztor, B.; Trigoni, N.; Wohlers, R. Wildlife and environmental monitoring using RFID and WSN technology. In Proceedings of the 7th ACM Conference on Embedded Networked Sensor Systems, Berkley, CA, USA, 4–6 November 2009; pp. 371–372. [Google Scholar]
  31. Coyne, M.; Godley, B. Satellite Tracking and Analysis Tool (STAT): An integrated system for archiving, analyzing and mapping animal tracking data. Mar. Ecol. Prog. Ser. 2005, 301, 1–7. [Google Scholar] [CrossRef] [Green Version]
  32. Thomas, B.; Holland, J.D.; Minot, E.O. Wildlife tracking technology options and cost considerations. Wildl. Res. 2011, 38, 653–663. [Google Scholar] [CrossRef]
  33. Floyd, R.E. RFID in animal-tracking applications. IEEE Potentials 2015, 34, 32–33. [Google Scholar] [CrossRef]
  34. Neff, E.P. An RFID-based tracking system gives mice their say. Lab Anim. 2021, 50, 282. [Google Scholar] [CrossRef]
  35. Lie, R. LoRa. 2018. Available online: https://lora.readthedocs.io/en/latest/ (accessed on 20 May 2022).
  36. Singh, Y. Comparison of okumura, hata and cost-231 models on the basis of path loss and signal strength. Int. J. Comput. Appl. 2012, 59. [Google Scholar] [CrossRef]
  37. Ojo, M.O.; Adami, D.; Giordano, S. Experimental evaluation of a LoRa wildlife monitoring network in a forest vegetation area. Future Internet 2021, 13, 115. [Google Scholar] [CrossRef]
Figure 1. Left: 12 mm RFID chip showing antenna orientation within the chip, right: graphic illustrating changing RFID chip orientation with different animal postures (created with Biorender.com, accessed on 25 July 2022).
Automation 03 00022 g001
Figure 2. WildTrack system block diagram.
Automation 03 00022 g002
Figure 3. Wildtrack electronics mounted in sealed box.
Automation 03 00022 g003
Figure 4. WildTrack system—Left: WildTrack unit with circular RFID antenna (highlighted in black), receiver box and solar panel; Right: LoRA gateway and 4G modem mounted on building.
Automation 03 00022 g004
Figure 5. Map of enclosure locations within the Nangak Tamboree Wildlife Sanctuary. Red circles (No. 1–5 and 7) were used for testing with four micro-chipped mice released into each enclosure. Yellow circles (No. 6, 8–10) were enclosures without micro-chipped mice. White letters (A, B, C) were used for antenna testing.
Automation 03 00022 g005
Table 2. Summary of mouse detections and number of base stations making detections during the monitoring period.
EnclosureNo. of DetectionsNo. of Base Stations that Made Detections (No. Installed)Date of DetectionsComments
1315 (9)12 January–7 March 20212 mice released 10 January, 1 on 11 January, 1 on 16 January
2322 (9)11 January–14 March 20211 mouse released 10 January, 1 on 11 January, 2 on 12 January
3315 (8)17 January–19 March 20212 mice released 16 January, 2 on 17 January
482 (10)13 January–6 March 20211 mouse released 10 January, 3 on 18 January. One mouse escaped and was detected in enclosure 8
5536 (10)10 January–22 March 20212 mice released 10 January, 2 on 18 January. One mouse escaped and was detected in enclosure 8, then returned to enclosure 5
7345 (8)13 January 21–22 March 20212 mice released 10 January, 2 on 16 January
Table 3. RFID antenna read-range results (mm).
Position: Edge of Antenna
Angle to Antenna PlaneMean Distance (mm)Standard Deviation
0 (‖) Tangent389.7
0 (‖) 90 Tangent105.83.8
45 () Tangent89.22.9
45 () 90 Tangent666.5
90 (⊥)117.62.5
Position: 40 mm from Antenna Edge
Angle to Antenna PlaneMean Distance (mm)Standard Deviation
0 (‖) min(Secant)466.5
0 (‖) max(Secant)855
45 () min(Secant)597.4
45 () max(Secant)1292.2
90 (⊥)1444.2
Position: Antenna Center
Angle to Antenna PlaneMean Distance (mm)Standard Deviation
0 (‖)3814.4
45 ()1253.5
90 (⊥)1532.7
Table 4. Signal strength with average (standard deviation) measurements. RSSI: return signal strength indicator; SNR: signal-to-noise ratio.
Test Site A
Height: 0 mHeight: 1 mHeight: 1.5 m
Node 1Node 2Node 1Node 2Node 1Node 2
RSSI−104 [3.6]−103 [3.2]−100 [2.4]−101 [3.3]−103 [3.5]−99 [3.6]
SNR−3.9 [3.6]−5 [2.7]5.6 [1.3]1.6 [1.8]−1.6 [3.4]4.1 [4.0]
Test Site B
Height: 0 mHeight: 1 mHeight: 1.5 m
Node 1Node 2Node 1Node 2Node 1Node 2
RSSI−96.8 [1.5]−96.4 [3.6]−86.2 [4.6]−89 [1.2]−91.2 [3.9]−90.2 [2.9]
SNR6.85 [1.9]7 [2.0]10.95 [0.9]10.8 [2.2]9.9 [1.2]10.1 [1.3]
Test Site C
Height: 0 mHeight: 1 mHeight: 1.5 m
Node 1Node 2Node 1Node 2Node 1Node 2
RSSI−106 [1.2]−107 [3.5]−105.8 [3.0]−103.8 [2.78]−106.4 [1.3]−104 [2.4]
SNR−5.65 [3.1]−7.5 [2.4]−4.6 [3.7]−5.3 [4.3]−4.7 [3.3]−5.25 [5.0]
Publisher’s Note: MDPI stays neutral with regard to jurisdictional claims in published maps and institutional affiliations.

