Article

Stimuli-Sensitive Pyrenylated Hydrogels as Optical Sensing Platform for Multiple Metal Ions

by
Dipen Biswakarma
1,2,
Nilanjan Dey
3 and
Santanu Bhattacharya
1,4,*
1
Department of Organic Chemistry, Indian Institute of Science, Bangalore 560012, India
2
Solid State and Structural Chemistry Unit, Indian Institute of Science, Bangalore 560012, India
3
Department of Chemistry, Birla Institute of Technology and Science Pilani, Hyderabad 500078, India
4
Indian Institute of Science Education and Research Tirupati, Tirupati 517507, India
*
Author to whom correspondence should be addressed.
Organics 2023, 4(3), 447-458; https://doi.org/10.3390/org4030032
Submission received: 29 March 2023 / Revised: 7 June 2023 / Accepted: 21 July 2023 / Published: 4 September 2023
(This article belongs to the Special Issue Aromatic Heterocycles: A Wonderful Pool of Organic Materials)

Abstract

:
In the present work, we report a thermoresponsive hydrogel formed by the self-assembly of compounds 1 and 2 Milli Q water. Both hydrogels showed thixotropic behavior. Atomic force microscopy (AFM) studies confirm the fiber-like microstructure of compounds 1 and 2, but denser fibers were observed in the case of compound 1. The hydrogel formed by compound 1 detected Cu2+, Fe3+, and Hg2+, whereas the hydrogel of 2 showed a change in the optical signal, specifically upon adding Cu2+ and Hg2+. Mechanistically, adding metal ions to the hydrogel resulted in the formation of a (1:1) complex with Fe3+ and Hg2+ and (2:1) with Cu2+. The detection of metal ions has also been achieved in real-life samples, such as in tap water. Low-cost portable gel-coated paper strips have also been developed for the onsite detection of these metal ions.

Graphical Abstract

1. Introduction

More recently, stimuli-sensitive hydrogel, which responds to various external stimuli, such as pH [1], temperature [2], light [3], electricity [4], and magnetic fields [5], has drawn remarkable attention due to its widespread application in the fields of sensing [6], tissue engineering [7], drug delivery [8], catalysis [9], bionic devices [10], and more [11]. In this regard, supramolecular hydrogel derived from low-molecular-weight gelators (LMWGs) has been actively developed. It is now considered a unique material due to its programmable stiffness, softness, and high flexibility, which gives them stimuli sensitivity [12,13,14]. Thus, these hydrogelators are designed such that a suitable stimulus group in the scaffold is sensitive. Due to the solid relationship between the hydrogelator structure and the gelation properties, a small perturbation in the structure of the gelator by a stimulus might result in a gel-to-sol or sol-to-gel transition. However, the employed stimuli have been relatively simple so far [15,16].
On the other hand, metal ions, up to a certain level, play vital roles in the proper functioning of many physiological processes, including redox reactions, oxygen transport, etc. [17,18]. However, beyond the permissible levels, these benign micronutrients trigger unwanted physiological transformations, which lead to fatal health problems, such as gastrointestinal disorders, neurodegenerative diseases, cardiovascular problems, renal failure, etc. [19,20]. Thus, regular monitoring of these metal ions in consumable food items (food, drinking water, etc.), as well as in biological samples (human blood serum, urine, etc.), has become one of the major concerns for supramolecular chemists. The traditional metal ion-sensing probes usually use a one-to-one recognition strategy similar to that of natural enzymes [21,22,23]. However, over the years, researchers have become interested in designing sensory systems that can detect multiple metal ions simultaneously, thus reducing the time and cost associated with sample analyses. One such strategy is to devise ‘array-based sensor systems’ to detect multiple metal ions simultaneously [24,25].
Considering this, we have demonstrated the design and synthesis of compounds 1 and 2, which can form a self-supported ‘gel’ in Milli Q water. Compound 1 showed fluorescence quenching in the presence of Cu2+, Fe3+, and Hg2+, while compound 2 showed selective interaction with Hg2+ and Cu2+. Stimuli-responsive behavior was observed when metal ions were added to the self-supported hydrogels of compounds 1 and 2, leading to a change in the color of the fluorescent gel. This toxic metal ion detection was achieved in real-life applications, such as in tap water. A low-cost gel-coated paper strip was also designed to detect these metal ions so that it could be used in remote areas.

2. Materials and Methods

2.1. Chemicals

All chemicals, solvents, and silica gel used for TLC were obtained from well-known commercial sources and were used without further purification, as appropriate. Before using the solvents, the samples were freshly distilled and dried using a standard procedure. Melting points were measured in open capillaries and uncorrected. 1H-NMR and 13C-NMR spectra were recorded using a Bruker-400 Advance NMR spectrometer. Chemical shifts were reported in ppm downfield from the internal standard tetramethylsilane (TMS). Mass spectrometry of the individual compounds was performed using a Micro Mass ESI-TOF MS instrument. Elemental analysis was performed using Thermo Finnigan EA FLASH 1112 SERIES.

2.2. Gelation Studies

The formation of the gel was confirmed using the tube inversion method [11]. In a typical experiment, the gelator molecules under investigation (compounds 1 and 2) were taken. To this mixture, 1 mL of Milli Q water was added, followed by heating at 80 °C till the solution became transparent. The resultant mixture was sonicated for five mins and then cooled to room temperature. The critical gelator concentration (CGC) of the gels formed by these molecules was evaluated quantitatively. To evaluate the CGC, a known amount of the gelators (compounds 1 and 2) in Milli Q water was heated to 75–80 °C, resulting in a slightly turbid solution, and then sonicated for 5 min. The resulting clear solution transformed into an optically transparent/opaque robust hydrogel within 1–2 min. The gelation propensities of compounds 1 and 2 were checked systematically by gradually lowering the amount of gelator. In this way, the minimum concentration of the gelator required to immobilize 1 mL of Milli Q water, i.e., the CGC value, was determined, as reported for other systems [11]. The above measurement was carried out three times, and the average CGC value was reported with a standard deviation of less than 1%. A glass tube with a 10 × 75 mm capacity was used for the CGC measurement. For thixotropic properties, the gel was vortexed for 1 min for a complete gel-to-sol transition and then kept at rest for 10 min to revert to a gel.

2.3. FT-IR Spectroscopy

The prepared solution and gels of individual samples were drop-coated on a CaF2 cell and dried under a vacuum. FT-IR spectra were recorded using a PerkinElmer Spectrum BX FT-IR system. For baseline correction, the spectrum of neat CHCl3 was subtracted from the sample spectrum.

2.4. Fluorescence Spectroscopy

The fluorescence spectroscopy of the mentioned solutions/suspensions was performed using a Cary-Eclipse spectrofluorometer equipped with a temperature-controlled bath. In this experiment, slit width was set at 5 nm (excitation) and 5 nm (emission), while the excitation wavelength was set at 345 nm.

2.5. Atomic Force Microscopy (AFM)

A dilute solution of the gel sample was drop-cast on a freshly cleaved mica surface, and the resultant surface was carefully allowed to freeze dry. Each sample was analyzed using a JPK 00901 AFM instrument and Nano-Wizard software: tapping mode off 10 nm tip radius, silicon tip, 292 kHz resonant frequency, 0.7–1 Hz scan speed, and 256 × 256 and 512 × 512 pixels.

2.6. Rheological Studies

Rheology experiments using hydrogels were carried out using an Anton Paar MCR 52 with a cone and plate geometry (CP 25-2) with an adjustable Peltier temperature-controlling system. The distance between the cone and plates was fixed at 0.105 mm for all the measurements. The rheometer has built-in software that converts torque measurements into either G′ (the storage modulus) or G″ (the loss modulus), representing strain or shear stress. The thixotropic properties were studied to examine the alteration of the rheological properties of the hydrogel material under the application and the release of shear stress. This process included two steps: (i) deformation of the hydrogel with increasing shear stress from 0.01 to 80 Pa for 6.14 min and (ii) recovery of the sol state to the gel state under low shear stress (0.01 Pa) for 6 min. In these two steps, the frequency was kept constant at 1 Hz. Three cycles were applied to the hydrogels to compare the extent of the gel strength recovery.

2.7. Preparation of the Metal Ion Solution

A freshly prepared metal ion solution in its nitrate salts was used as a source of metal ions, and an aliquot was directly added to the solution.

2.8. Preparation of Test Strips

To prepare gel-coated paper strips, filter paper (Whatman 40) was cut into a square shape (1 × 2 cm). To these square-shaped paper strips, 30 μL of the pre-prepared gel sample (2.5 mM) was uniformly spread on the surface. The gel coated on the paper strip was absorbed entirely within 15 min under an ambient open atmosphere and then naturally air-dried. These gel-coated paper strips were then used for checking different metal ions.

2.9. Analysis of Metal Ions in Different Water Samples

Tap water samples were collected from the Department of Organic Chemistry Laboratory, IISc. To remove the insoluble and suspended dirt particles from the tap water, it was filtered through a 0.22 μm membrane filter cartridge. To these water samples, different amounts of metal ions were added for more than 30 min before the analysis.

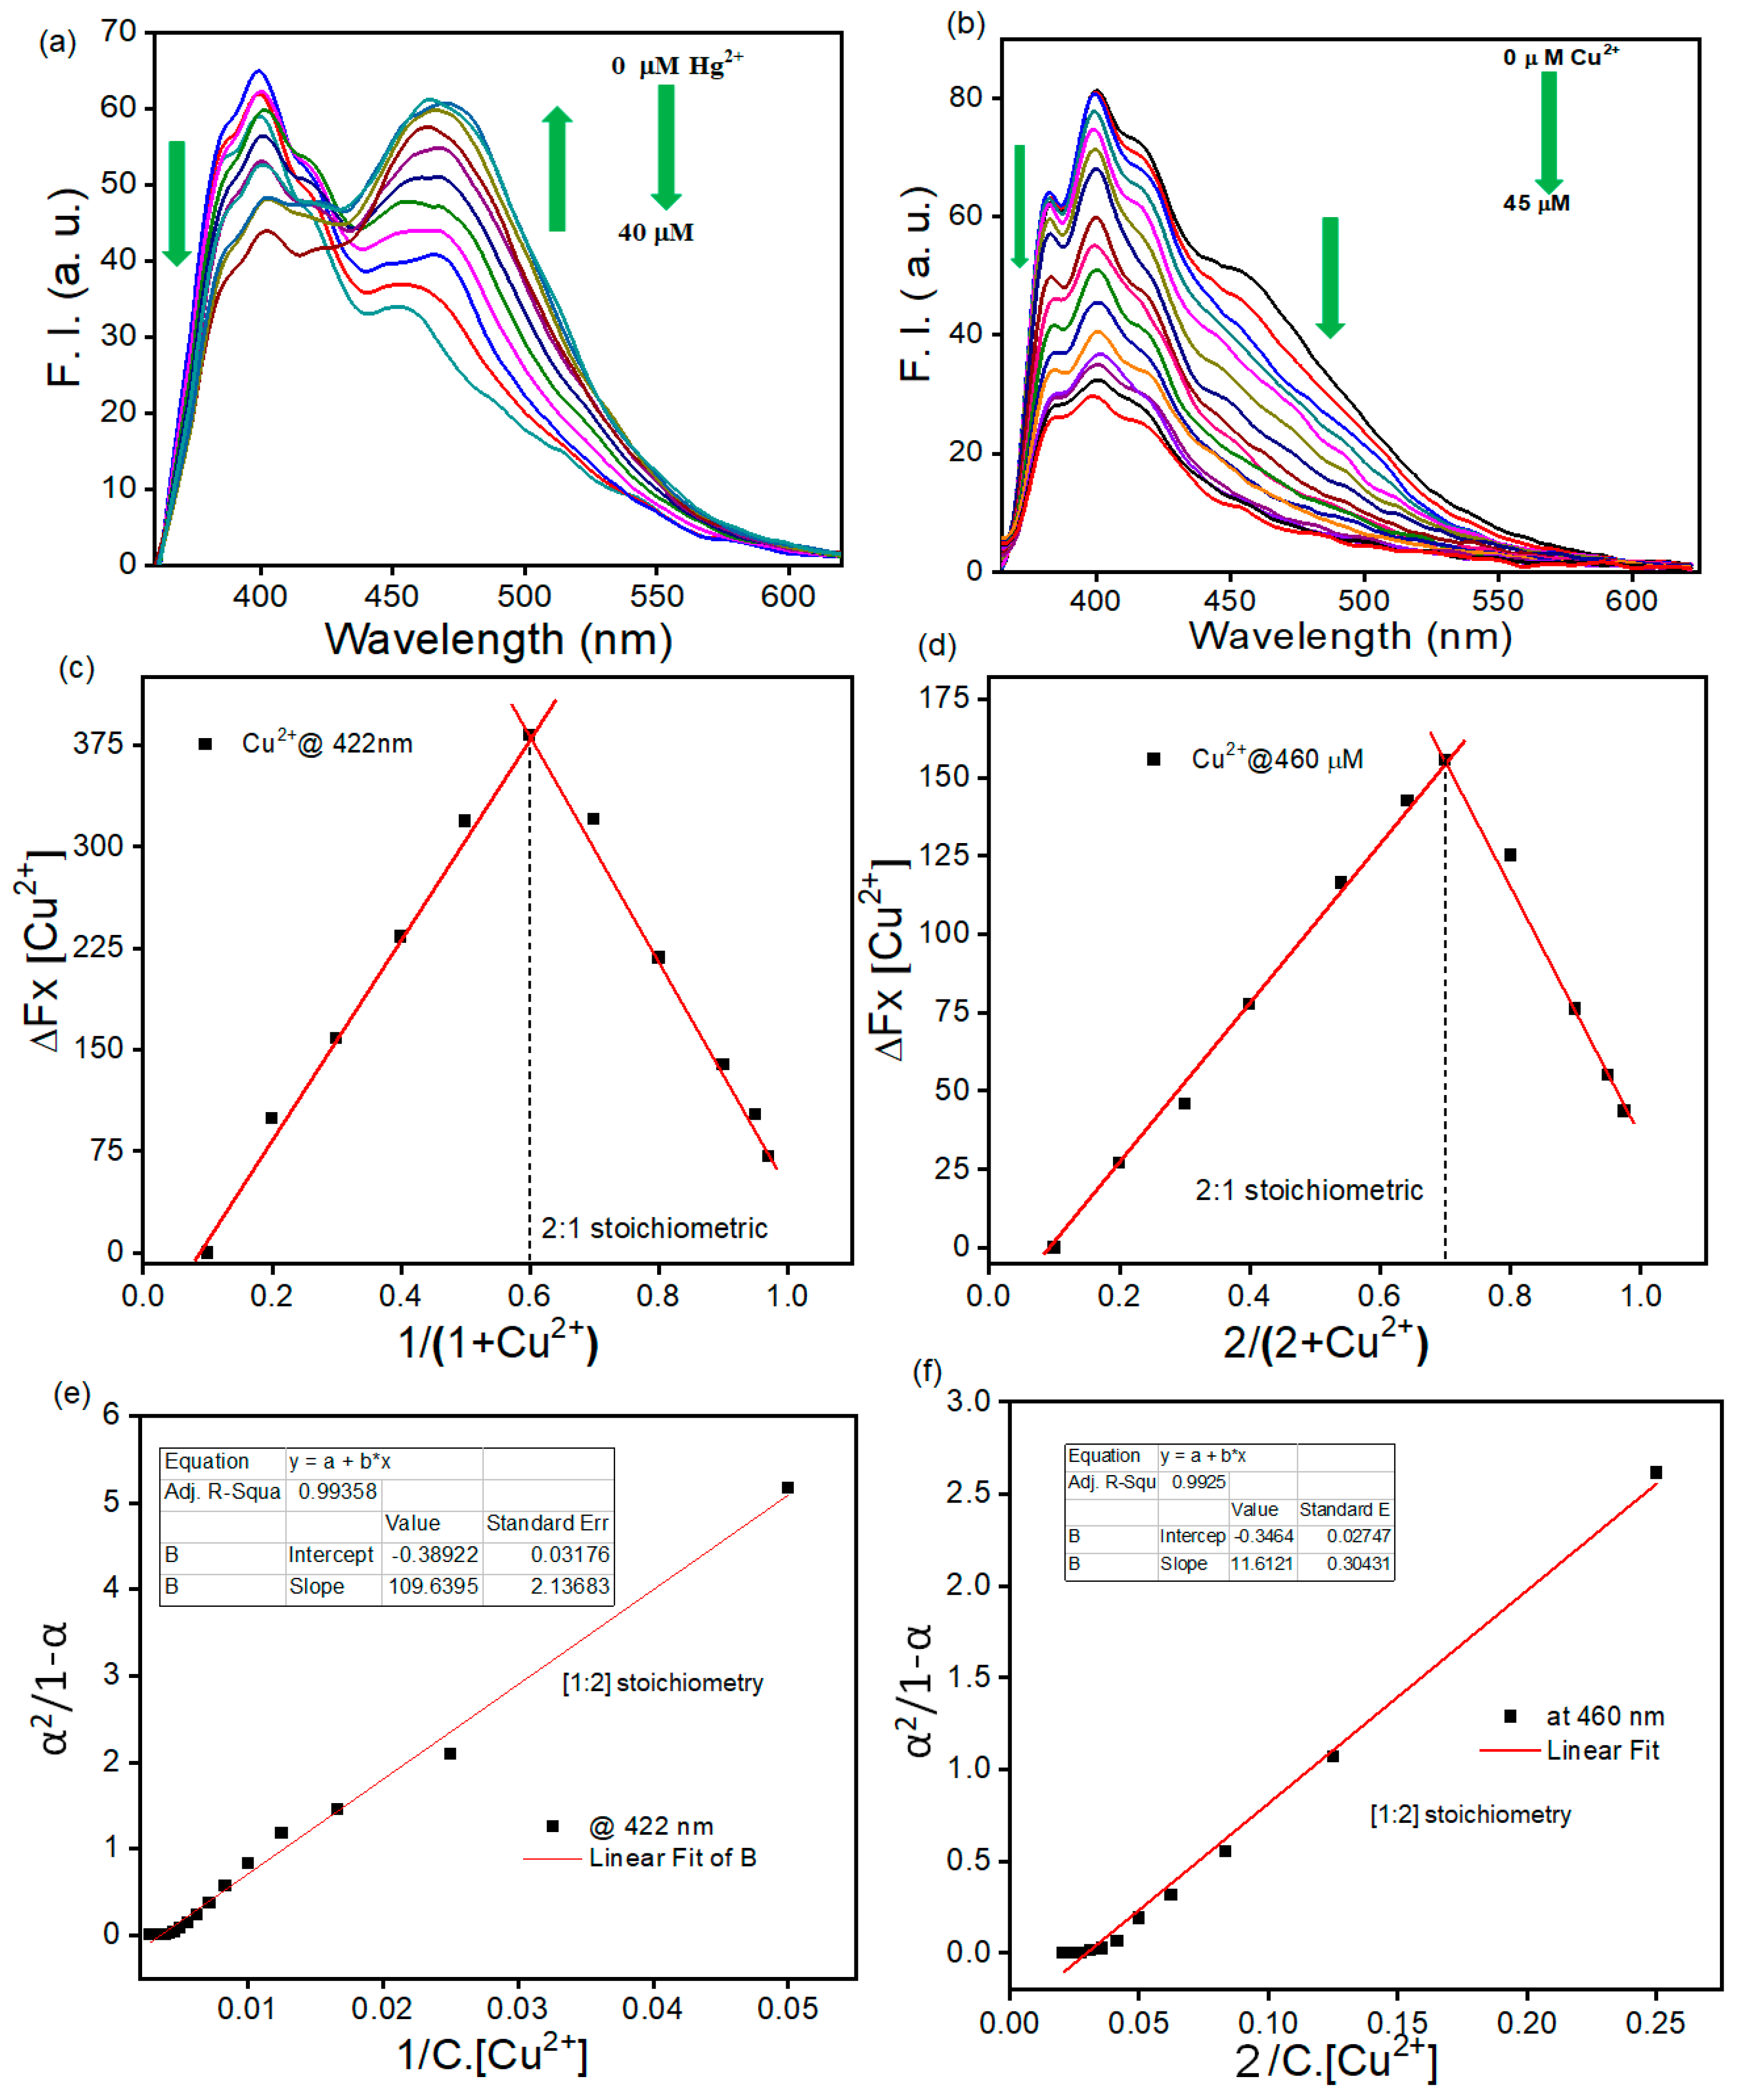
2.10. Stoichiometry Determination using Job Plot

Job plot is a method of continuous variation used for determining the stoichiometry of the interaction between the two species. In this method, the total molar concentration of the two binding specie was kept constant (1 × 10⁻⁴ M), and the mole fraction was varied. Further, the change (here, fluorescence) was plotted against the mole fraction. The maxima or minima showed the stoichiometry of the interaction.

2.11. Binding Constant Calculation

Binding constants were calculated based on the Benesi–Hildebrand equation of the respective stoichiometry. The concentration of the guest was increased while the concentration of the host was fixed so that a wide concentration range could be adopted.
A straight-line plot was obtained, which in turn yielded an intercept of 1/ε and a slope of 1/Kε, from which the formation constant was obtained.

2.12. Detection Limit Determination

Here, we used the blank variability method to calculate the detection limit of the metal ions. This method prepared the calibration curve by gradually adding the analyte to a fixed ligand concentration via UV-vis titration.
From the equation obtained from the calibration plot, the added analyte concentrations were calculated. Then, another calibration curve was drawn between the Creal (added analyte) and Ccalc. (calculated amount of analyte). This afforded the value of the slope (b). The signal of the ligand in the absence of the added analyte was taken as blank reading. Ten blank replicates were measured. The standard deviation from the blank readings was calculated by fitting the fluorescence reading into the equation obtained from the first calibration curve (titration spectra). We calculated the detection limit using this standard deviation value using the following equation.
LC = tC × s × (1 + 1/N)1/2
where N is the number of blank replicates taken; the value of tC for 10 blank readings is 1.833; and s is the standard deviation value.
The detection limit (LD) was calculated as double the decision limit obtained,
LD = 2Lc
In concentration terms, the detection limit appeared as follows:
xD = 2 × C = 2LC/b
where b = slope of the second calibration curve (Creal vs. Ccalc.)

3. Results and Discussion

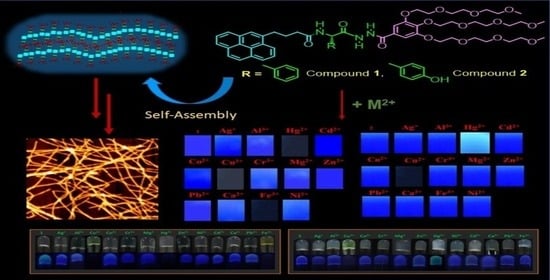
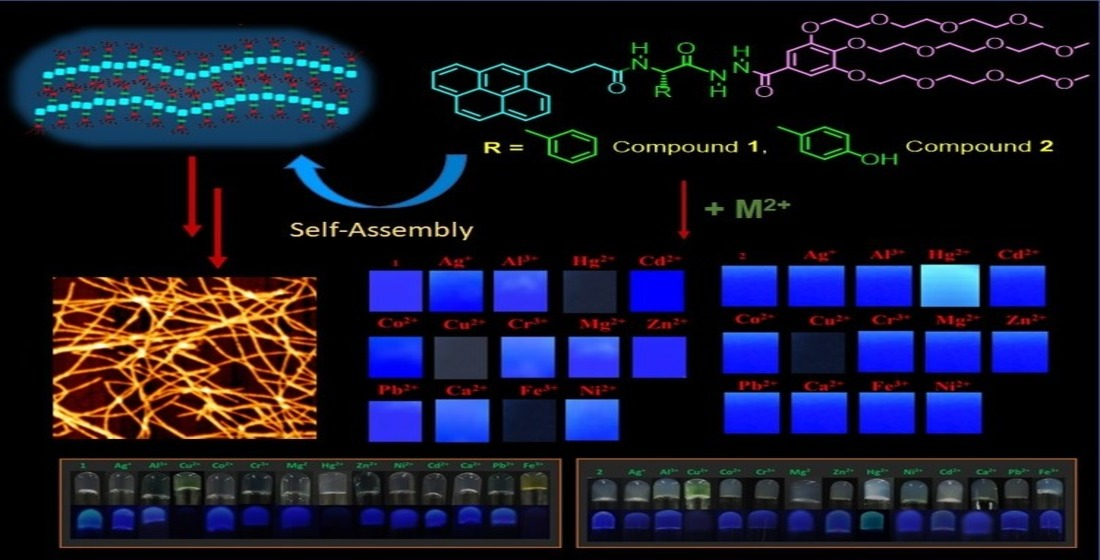
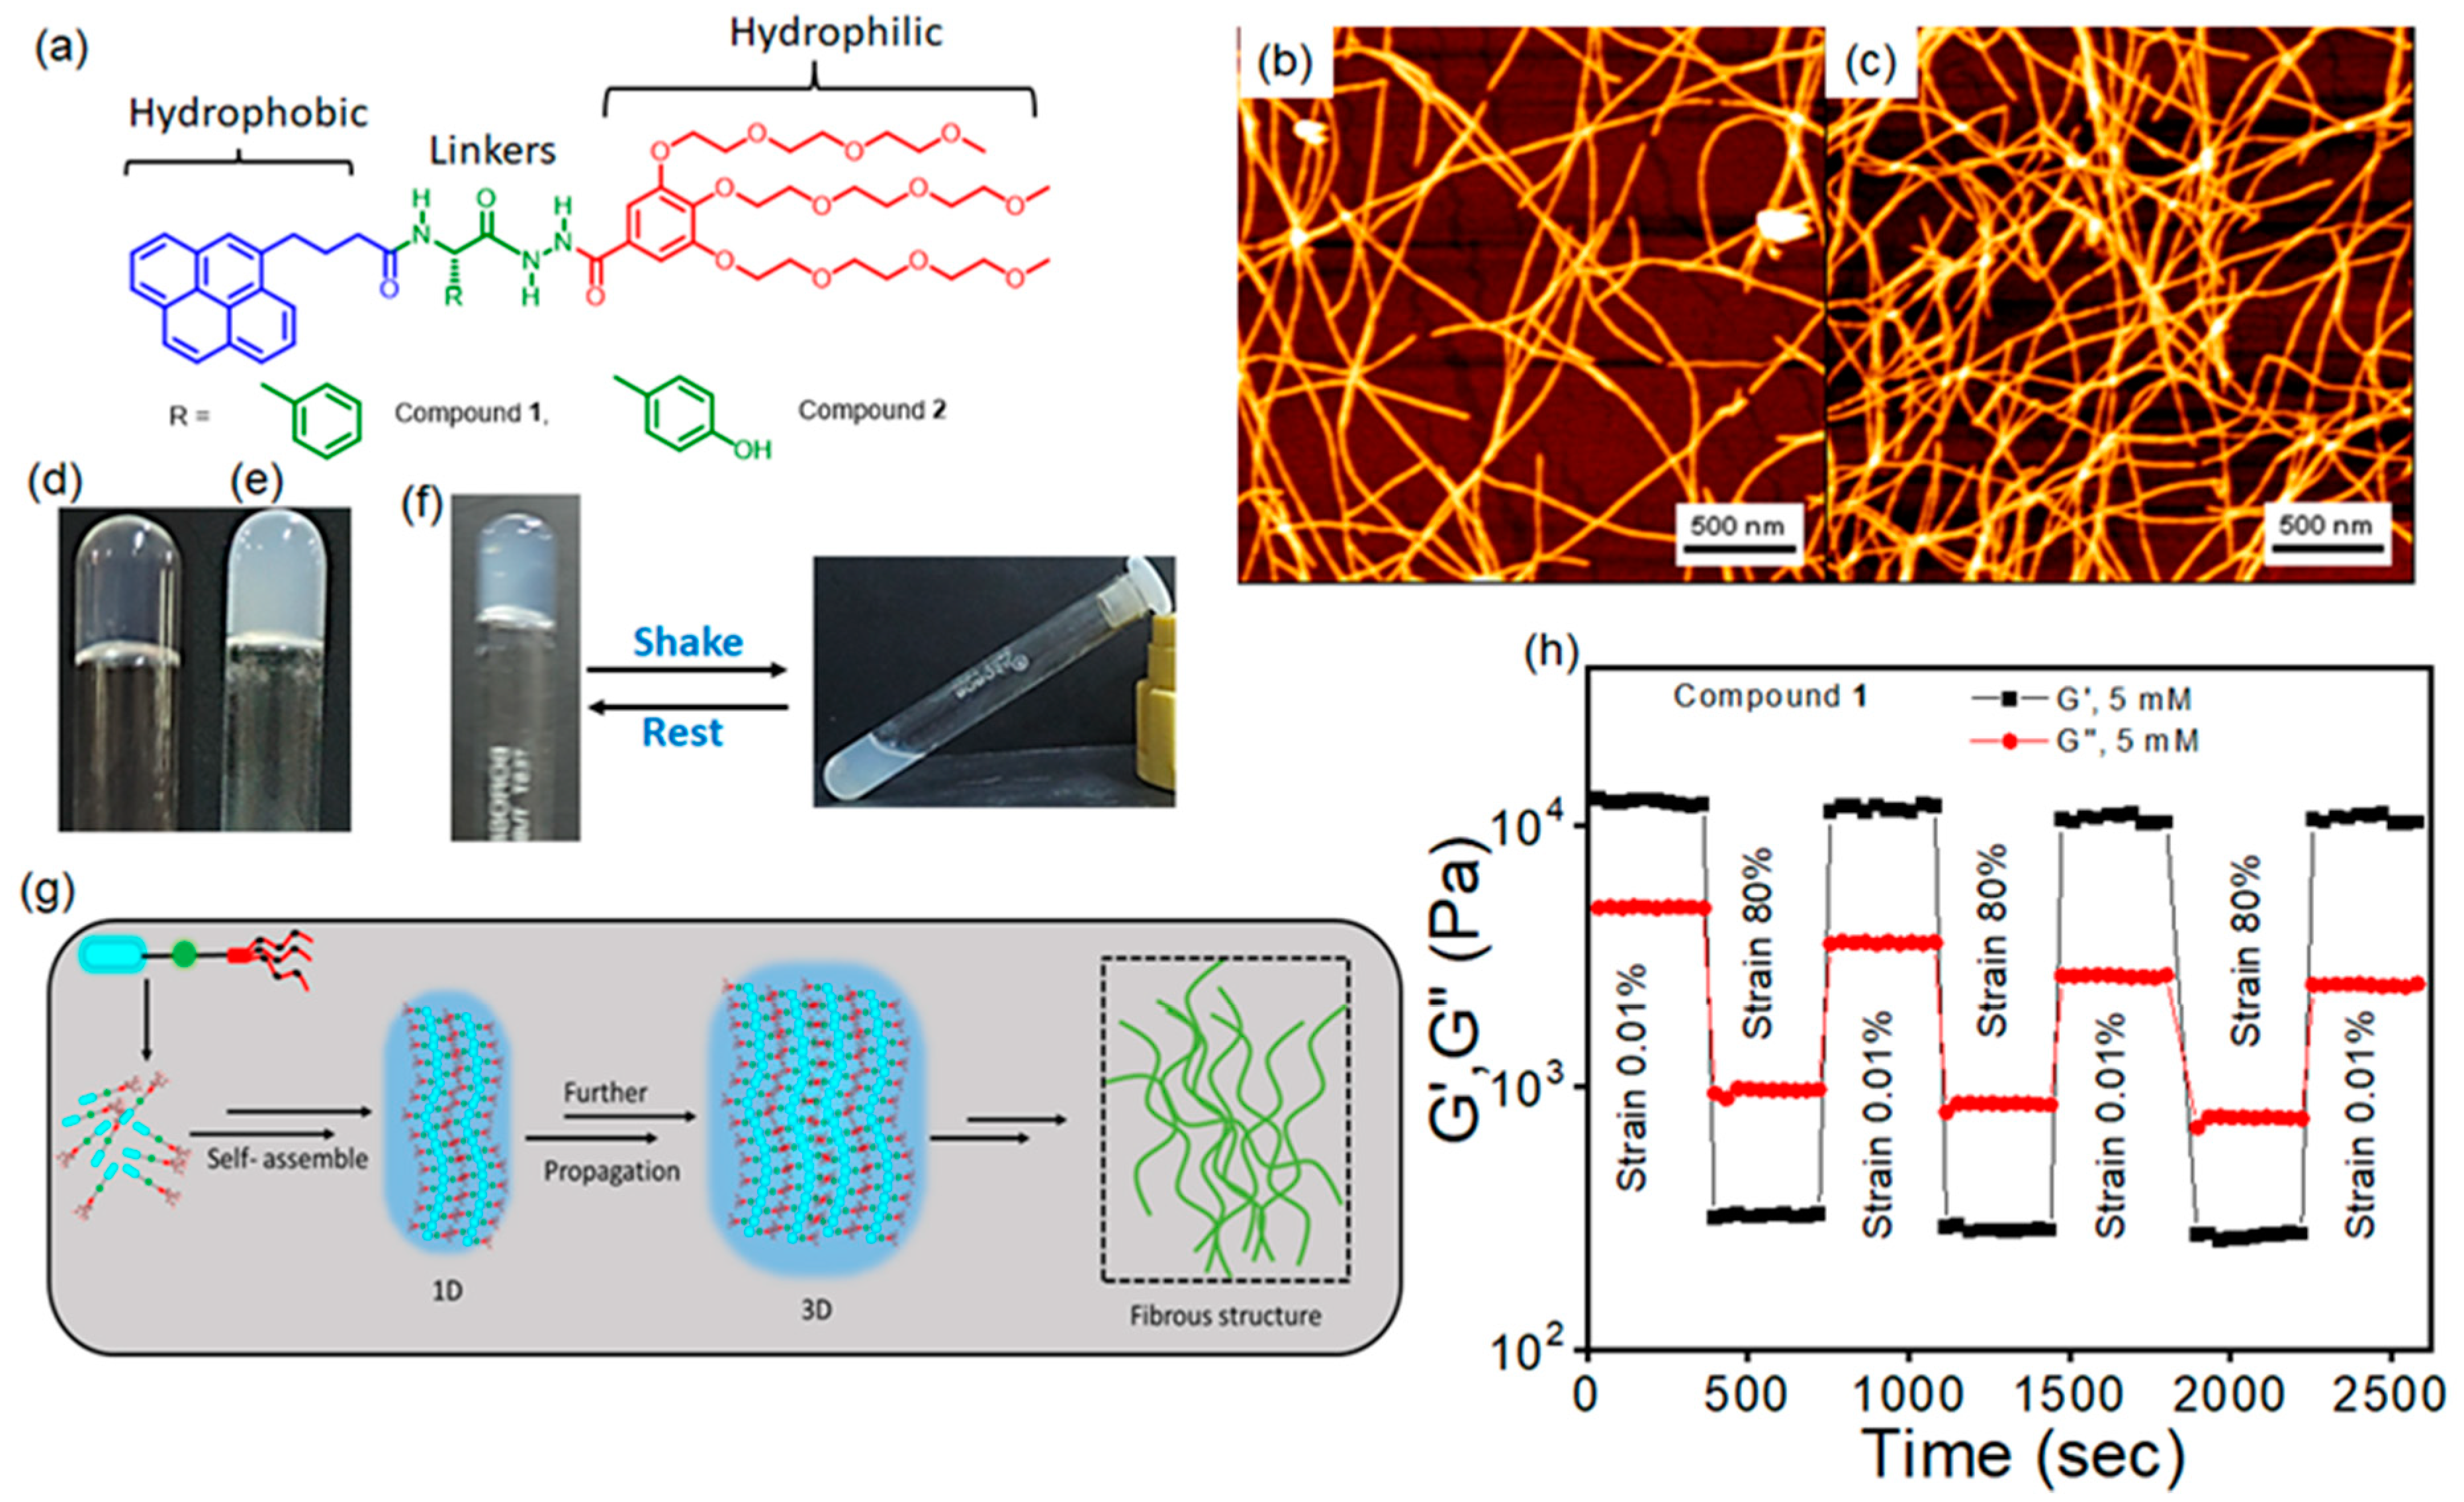
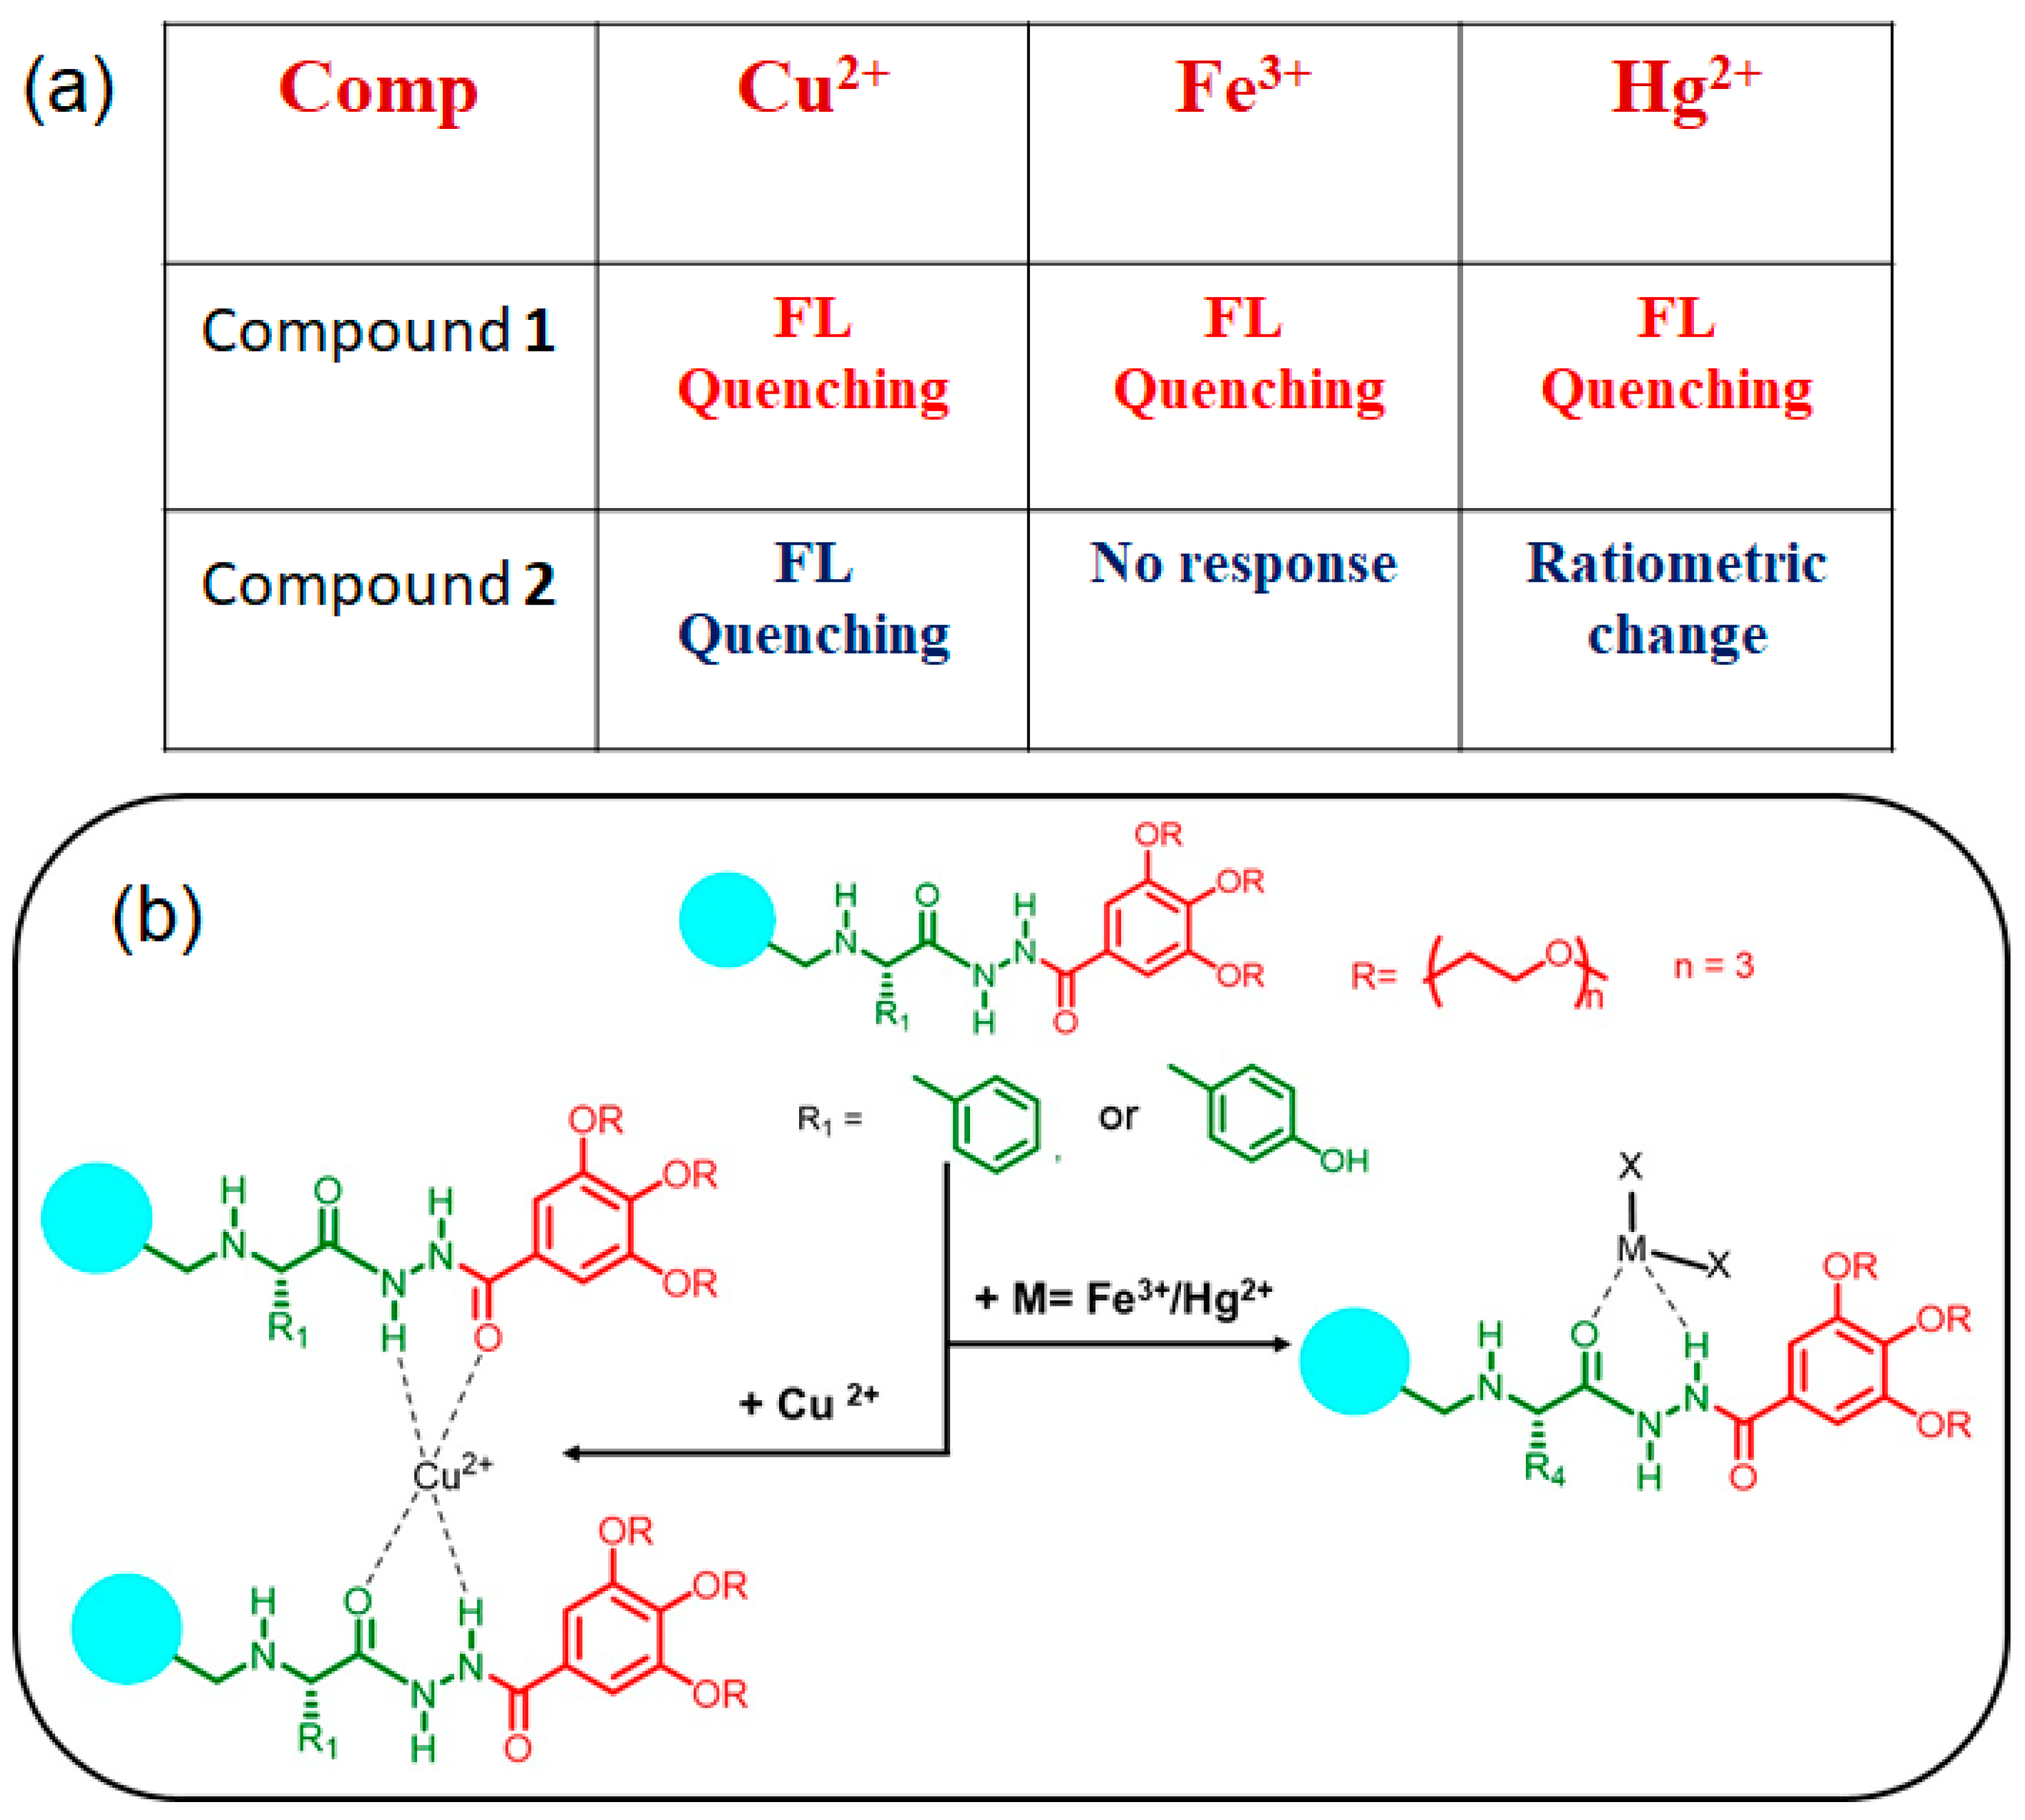
3.1. Design and Synthesis of Hydrogelators 1 and 2

We designed and synthesized fluorophores (Figure 1a) linked via aromatic amino acids, namely phenylalanine (compound 1) and tyrosine (compound 2). As reported by our group earlier, these compounds were synthesized using typical peptide coupling reagents and fully characterized using various spectroscopic techniques, such as 1H-NMR, 13C NMR, ESI-MS, FT-IR, and elemental analysis [6].

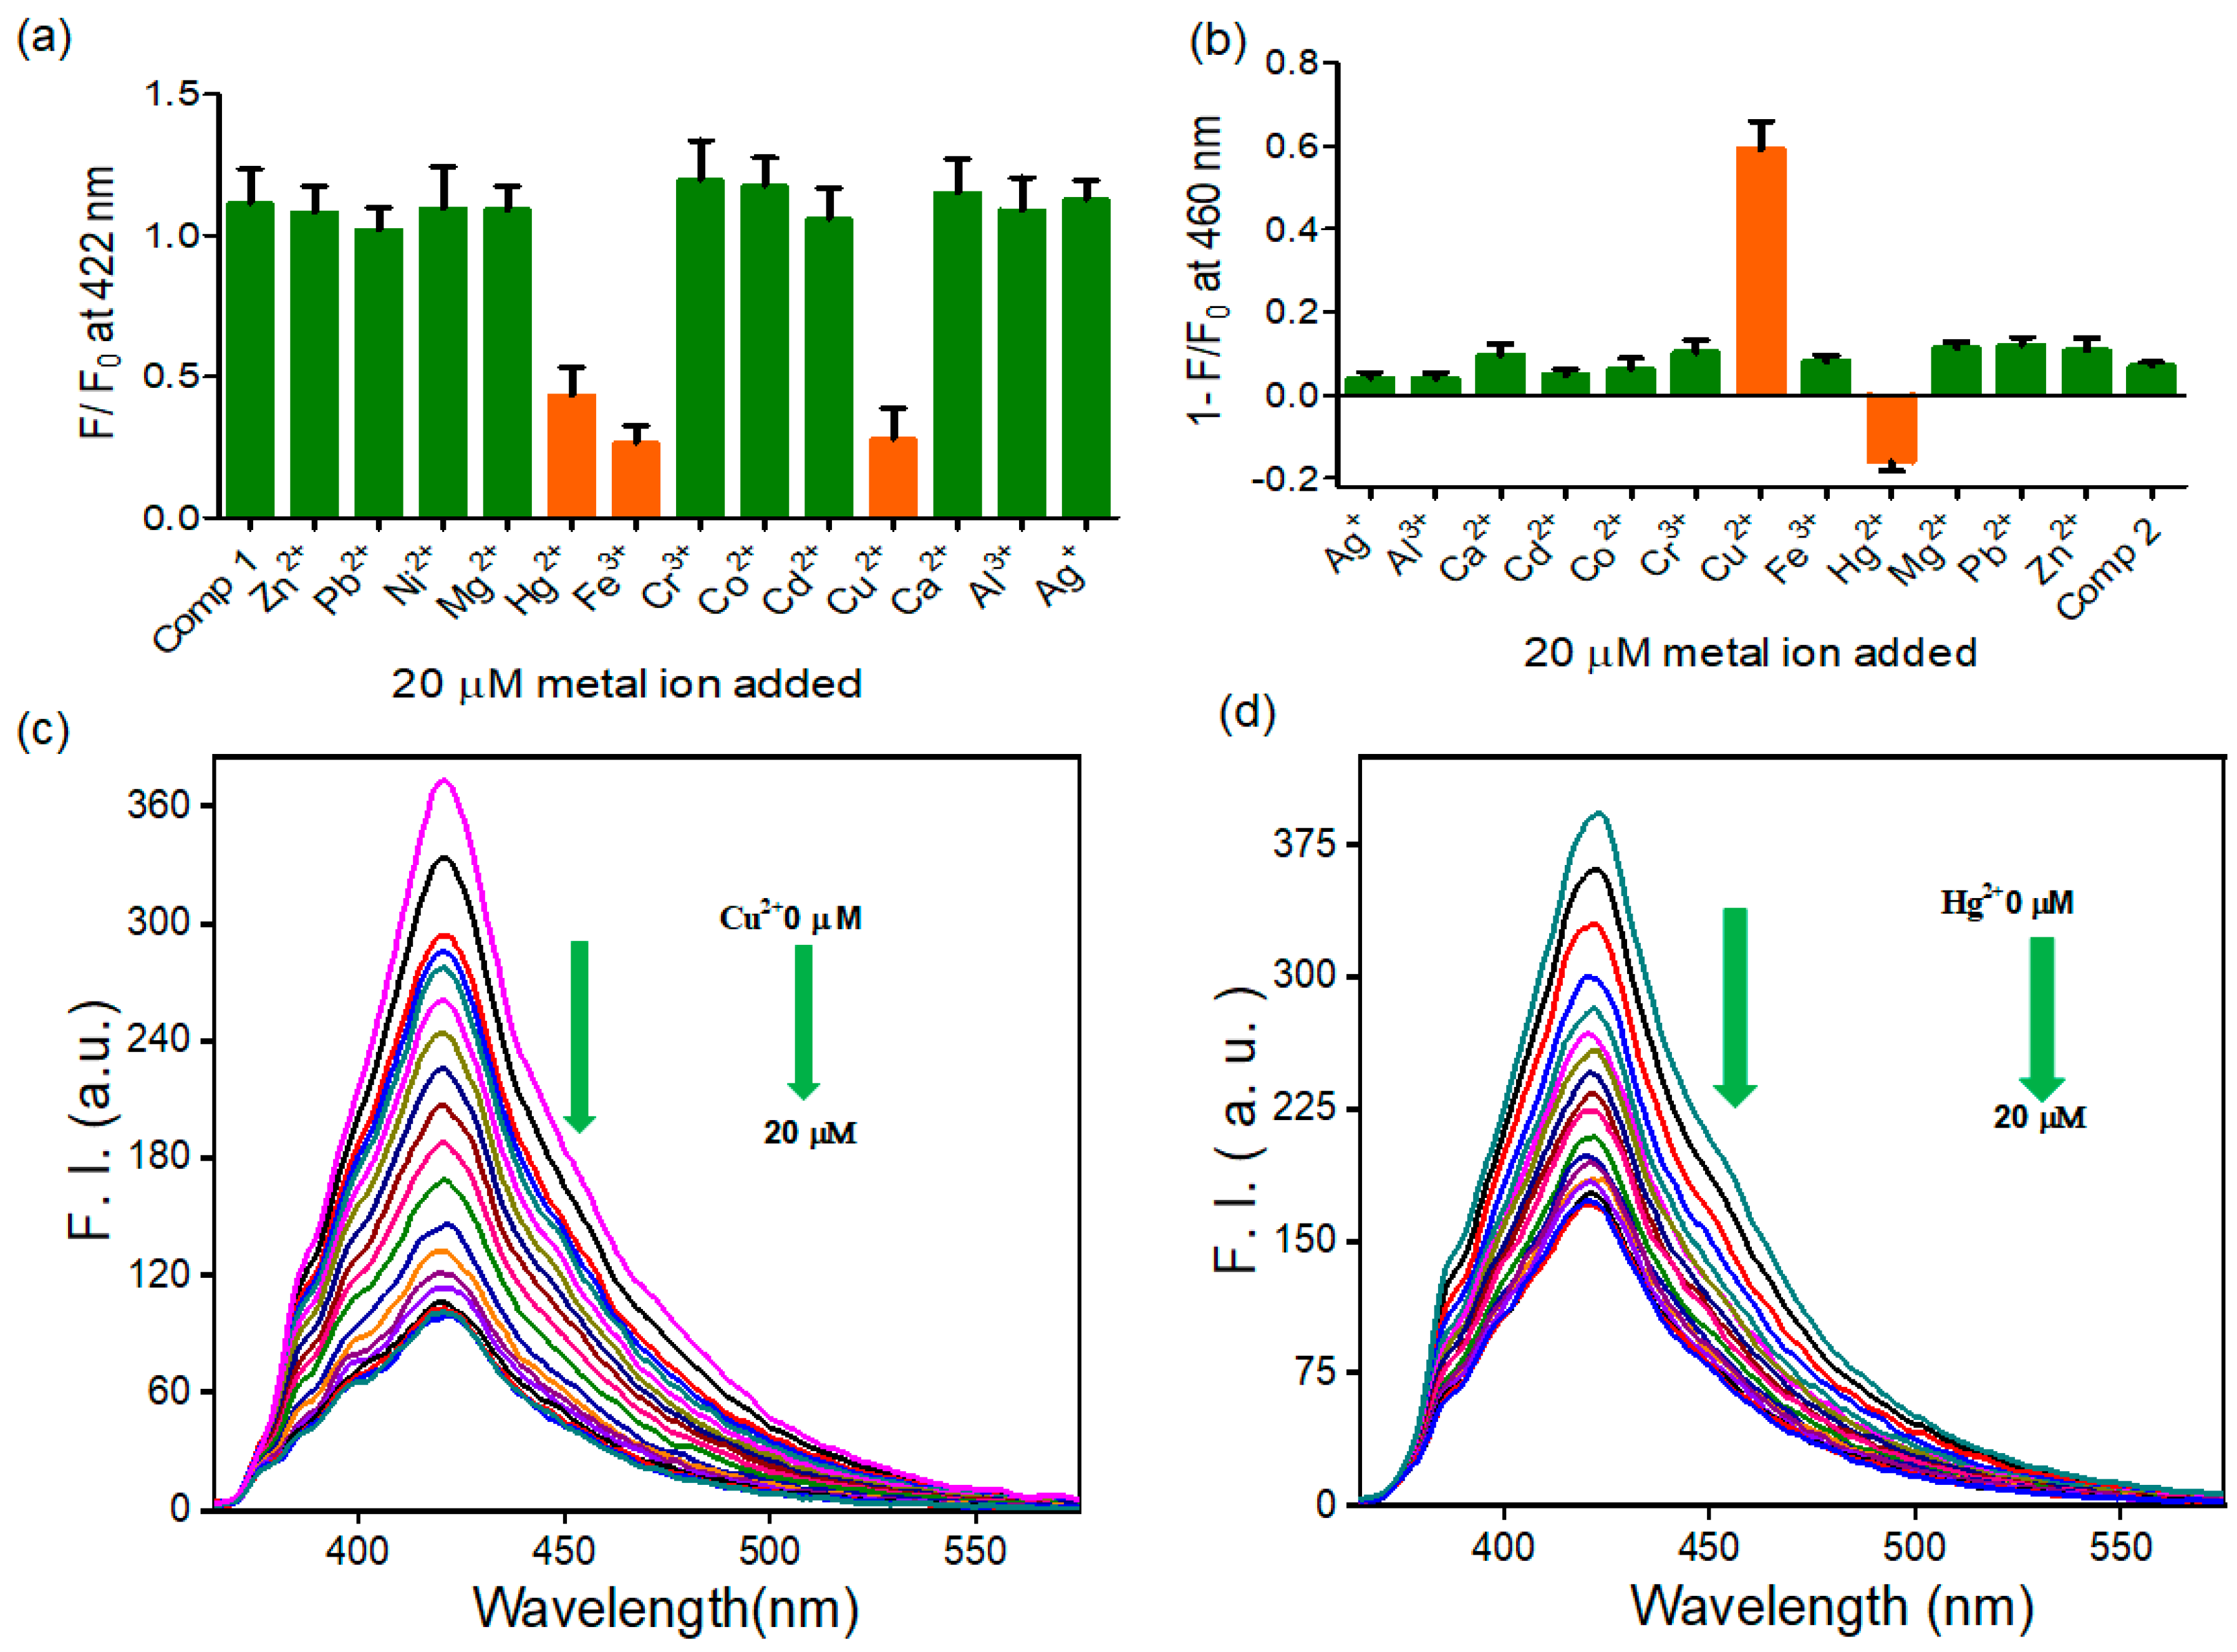
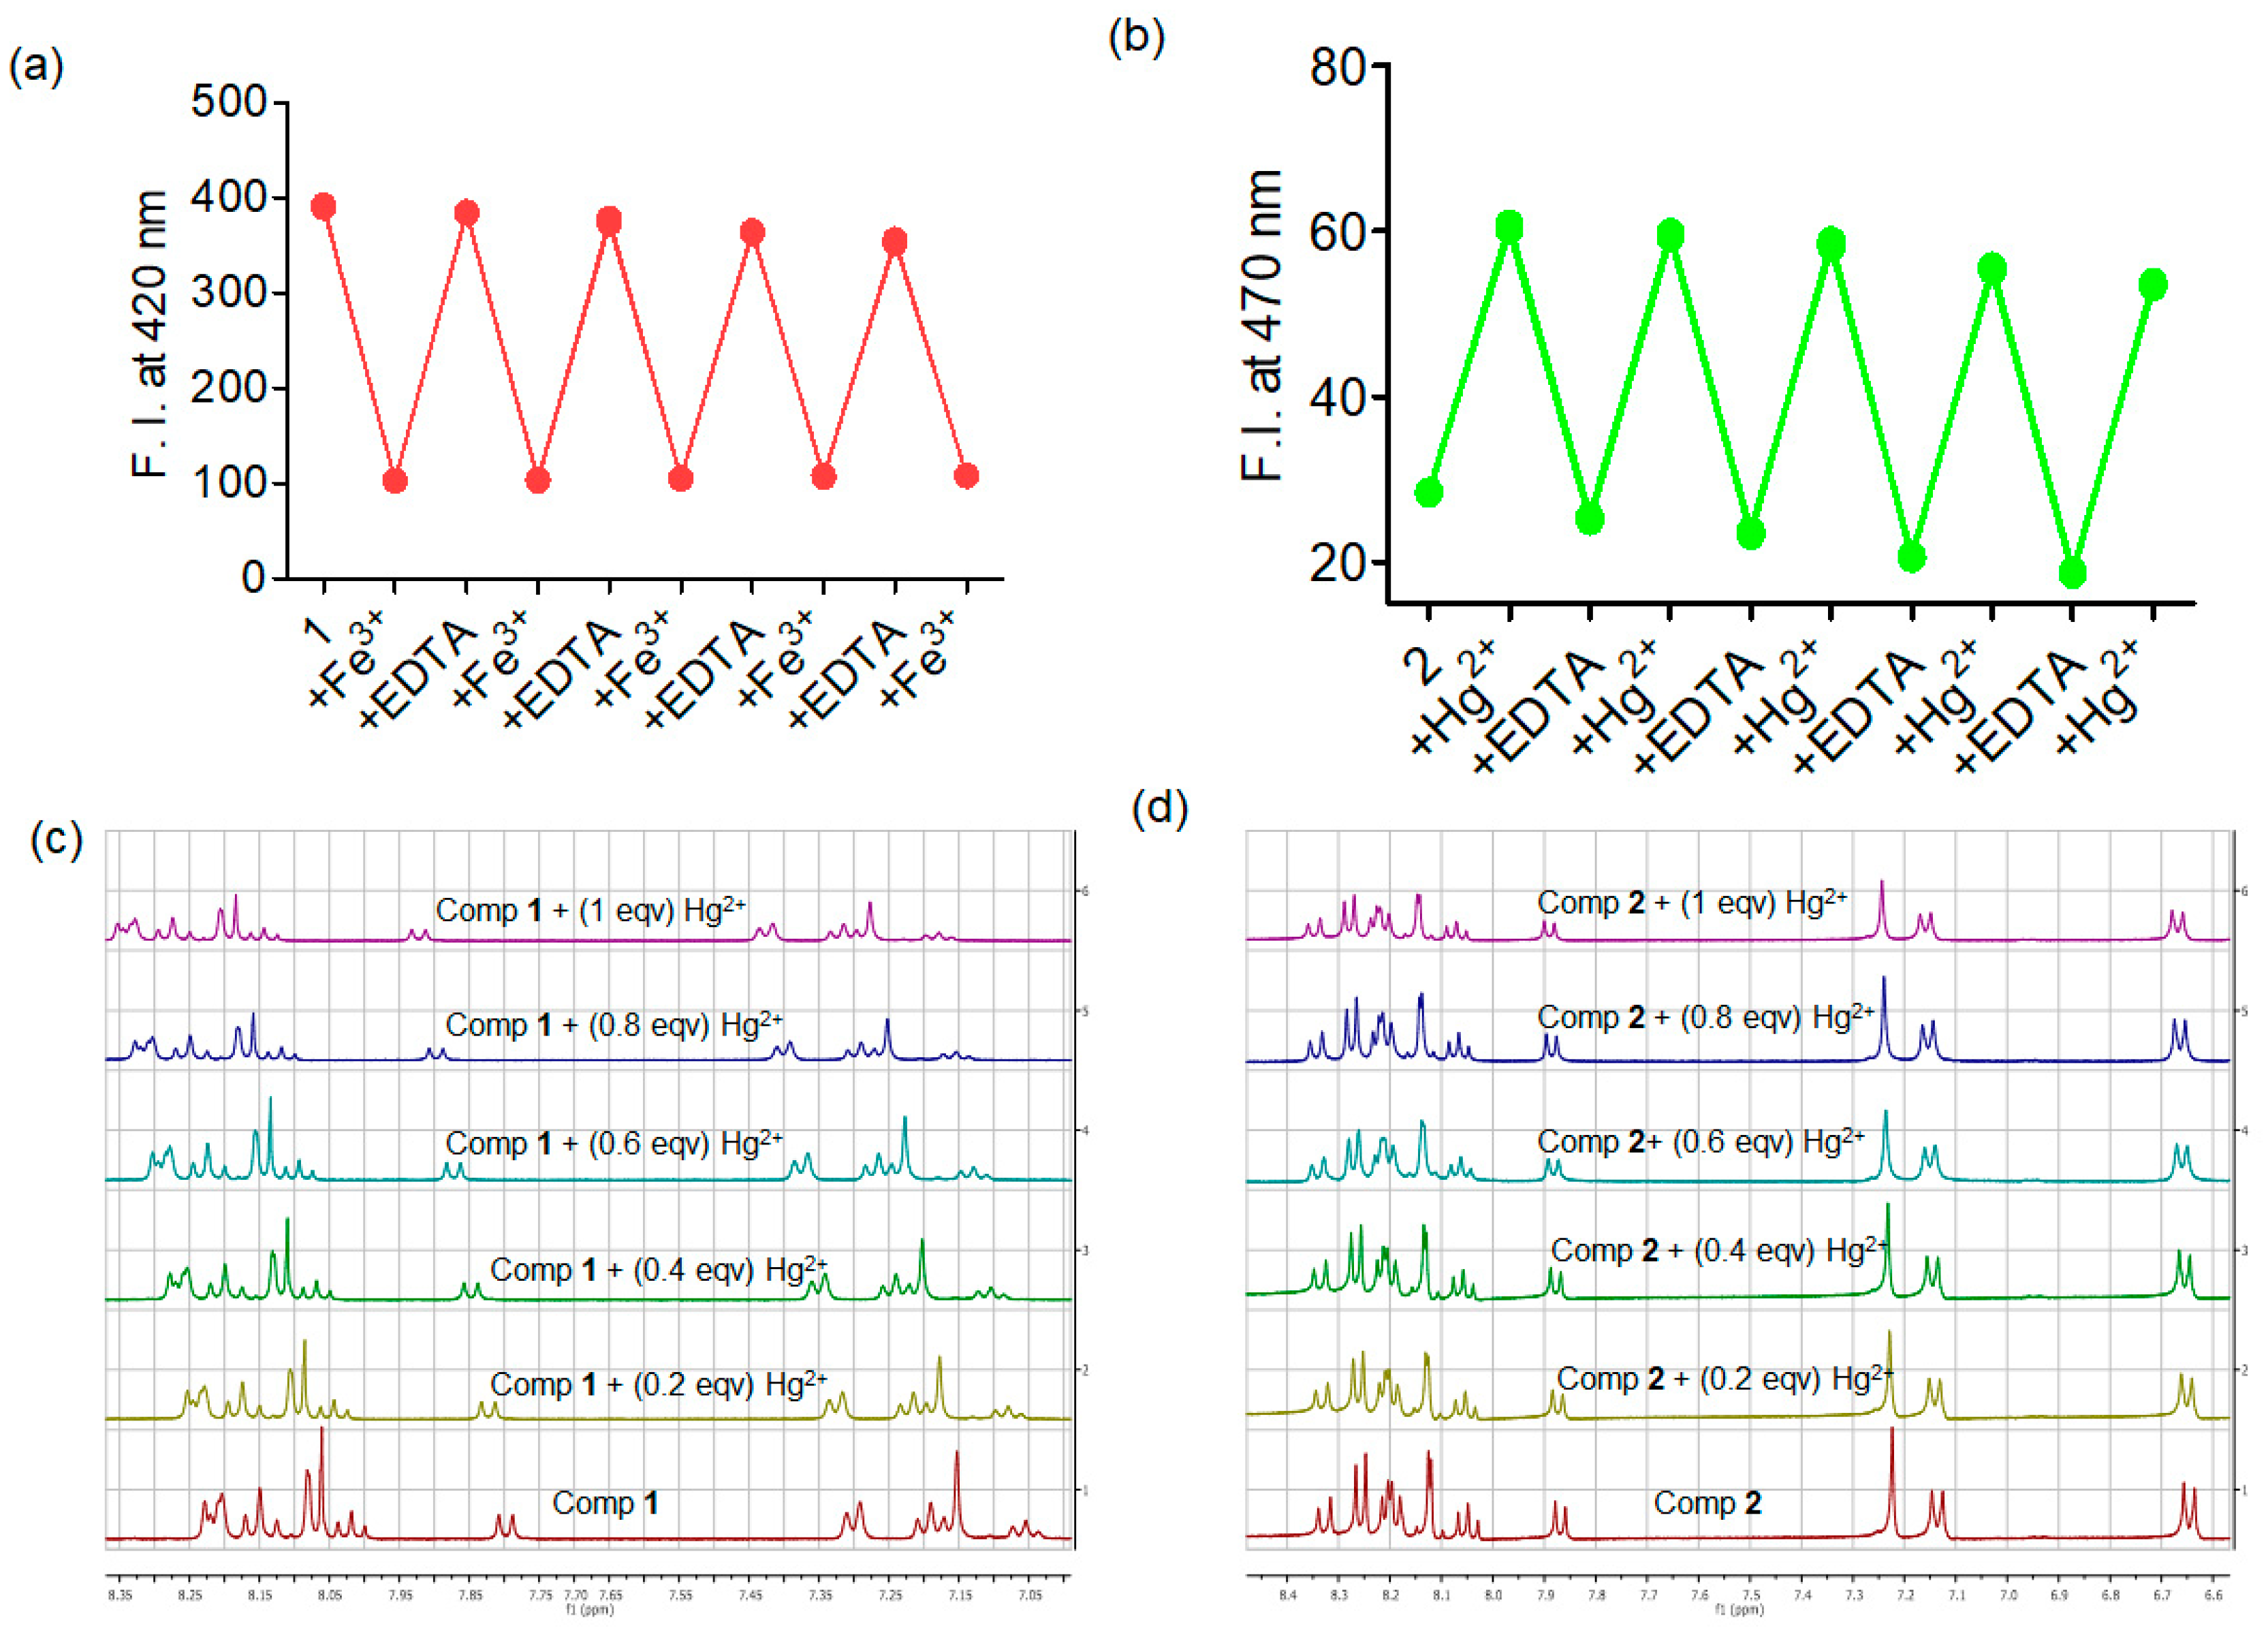
3.2. Interaction of Metal Ions with Compounds 1 and 2

Both compounds 1 and 2 formed a self-supported thermoreversible transparent and opaque hydrogel in Milli Q water with critical gelator concentrations of 0.52 mM and 0.82 mM, respectively (Figure 1d,e). Interestingly, both hydrogelators readily converted to sol upon applying the mechanical force while reverting to gel when they were at rest, thus confirming their thixotropic behavior (Figure 1f). The thixotropic behavior of the hydrogel formed from compound 1 was further confirmed by a hysteresis loop rheology test [25]. In this experiment, the hydrogel was subjected to a high strain of 80% for 6 min for a complete gel-to-sol transition and a low strain of 0.01% for a sol-to-gel transition. As shown in Figure 1h, upon removing the high strain, the original mechanical strength of the hydrogel formed by compound 1 recovered by almost 98%, thus confirming its thixotropic behavior. Microscopic characterization using atomic force microscopy analysis revealed the formation of a fibrous microstructure (Figure 1b,c), but dense fibers were observed in the case of compound 1. The proposed nano-model for the self-assembly of compounds 1 and 2 is shown in Figure 1g. As evident from the fluorescence spectra, there are considerable π–π stacking interactions between the two pyrene moieties, which are hydrophobic. Hence, it stays away from the water molecules while the oxyethylene chain remains exposed to the water molecules. These molecules undergo self-assembly to form 1D aggregates, which leads to 3D aggregates upon further aggregation. These aggregate molecules ultimately form entangled fibers, which in turn entrap the water molecules inside it, leading to gelation.
Because compounds 1 and 2 possess acyl aroyl hydrazine (AAH) units and aromatic amino acid residue, we were intrigued to investigate their metal ion-binding properties in Milli Q water. Figure S1a shows that even at a concentration as low as 20 µM, compounds 1 and 2 exhibited broad red-shifted emission maxima due to the self-assembled nanostructure. Though compound 1 with phenylalanine (λmax = 422 nm) residue showed effective aggregation in water compared to its tyrosine analog, the latter showed a larger red-shift (λmax = 460 nm) in the emission maxima, as evident in Figure S1b. This is indeed an interesting observation and can probably be explained by the preferential charge transfer interaction between pyrene and tyrosine [26]. The addition of metal ions to the aqueous solution of compound 1 (Figure 2a) resulted in a significant reduction in the emission intensity, particularly in the presence of Cu2+, Fe3+, and Hg2+ (20 μM). The addition of Cu2+ induced a 4-fold quenching of emission intensity at the 422 nm band (Figure 2c and Figure S1d), whereas Hg2+ induced quenching of the emission intensity by ~2.5-fold (Figure 2d and Figure S1e). Similarly, Figure S1c,f show that when Fe3+ ions were added to a solution of compound 1, it induced the quenching of emission intensity by ~3.7 fold.
However, the extent of the change was found to be slightly less in the case of Hg2+ (Ksv = 0.080), which was also evident by its small Stern –Volmer constant value than that observed with Cu2+ (Ksv = 0.159) and Fe3+ (Ksv = 0.134). The interaction stoichiometries of compound 1 with the concerned metal ions were evaluated using the continuous variation method, where it showed 1:1 interaction with Fe3+ and Hg2+, as shown in Figure S2a,b, respectively, and 1:2 in the case of Cu2+ (Figure 3c). The binding affinity with transition metal ions was found to follow the Irving–Williams series and was KCu2+ = 4.56 ± 0.18 × 10⁹ mol−1 (Figure 3e). The binding constant of Fe3+ and Hg2+ calculated from Figure S2c,d was found to be KFe3+ = 1.21 ± 0.04 × 10⁵ mol−1 and KHg2+ = 2.81 ± 0.05 × 10⁵ mol−1, respectively, which indicates that the stability of the metal complexes depends on the ionic radius of M2+ and its crystal field stabilization energy [27]. The minimum detectable concentrations of Cu2+, Fe3+, and Hg2+ for compound 1 were calculated using the blank variation method, and they were found to be 0.047 ppm, 0.052 ppm, and 0.196 ppm, respectively.
On the other hand, when compound 2 was exposed to various transition metal ions, a distinct response was observed for Hg2+ and Cu2+ (Figure 2b). The addition of Cu2+ induced a 5-fold quenching of the emission intensity at the 460 nm band with a diminution of blue fluorescence (Figure 3b). At the same time, the incorporation of Hg2+ indicated a ratiometric change in emission intensity with the appearance of cyan fluorescence. Further, titration with Hg2+ showed a decreased emission intensity at the 397 nm band with concomitant enhancement at 460 nm (Figure 3a). Here also, the Job plot indicated the formation of a 1:2 complex with Cu2+ (Figure 3d). Similarly, as shown in Figure S3a, Hg2+ showed a 1:1 interaction with compound 2. Further, the binding constants with Cu2+ and Hg2+ were calculated from Figure 3f and Figure S3b based on the Benesi–Hildebrand model for 1:2 and 1:1 complex, and they were found to be KCu2+ = (4.30 ± 0.11 × 10¹⁰ mol−1) and KHg2+ = (1.18 ± 0.06 × 10⁵ mol−1), respectively. The minimum detectable concentrations of Cu2+ and Hg2+ for compound 2 were calculated using the blank variation method, and they were found to be 0.065 ppm and 0.232 ppm, respectively [28].

3.3. Mechanistic Investigation of Metal Ions Binding

The interaction of peptide-based probes with metal ions can either result in an ion-induced hydrolysis reaction or a formation of the coordination complex. To distinguish between these two pathways, an EDTA-mediated recovery experiment was performed by sequentially adding equimolar amounts of M2+ and EDTA to the same solution. In all cases, as shown in Figure 4a,b and Figure S4, we observed the recovery of the original emission signal in the presence of EDTA, which ruled out the possibility of metal ion-mediated hydrolysis reactions.
Further, to explore the exact modes of interaction with metal ions, 1H-NMR titrations of the compound were performed with Hg2+, Cu2+, and Fe3+ in the DMSO-d6 medium. As expected, Cu2+ and Fe3+ induced paramagnetic quenching of 1H-NMR signals due to their open-shell electronic configurations. 1H-NMR titration with Hg2+ resulted in downfield shifts of all the aromatic protons with changes in the AHH unit and tyrosine moiety (Figure 4c,d). This indicates that in the self-assembled state, the closely placed AAH units formed a metal ion-binding cleft along with a tyrosine residue. The FT-IR studies in Figure S5 further substantiate this speculation, where a shift in the stretching frequencies of the C=O and N-H bond was observed upon interaction with metal ions. Additional AFM images revealed that spherical nanoaggregates formed when the metal ion was added to the compound (Figure S6).

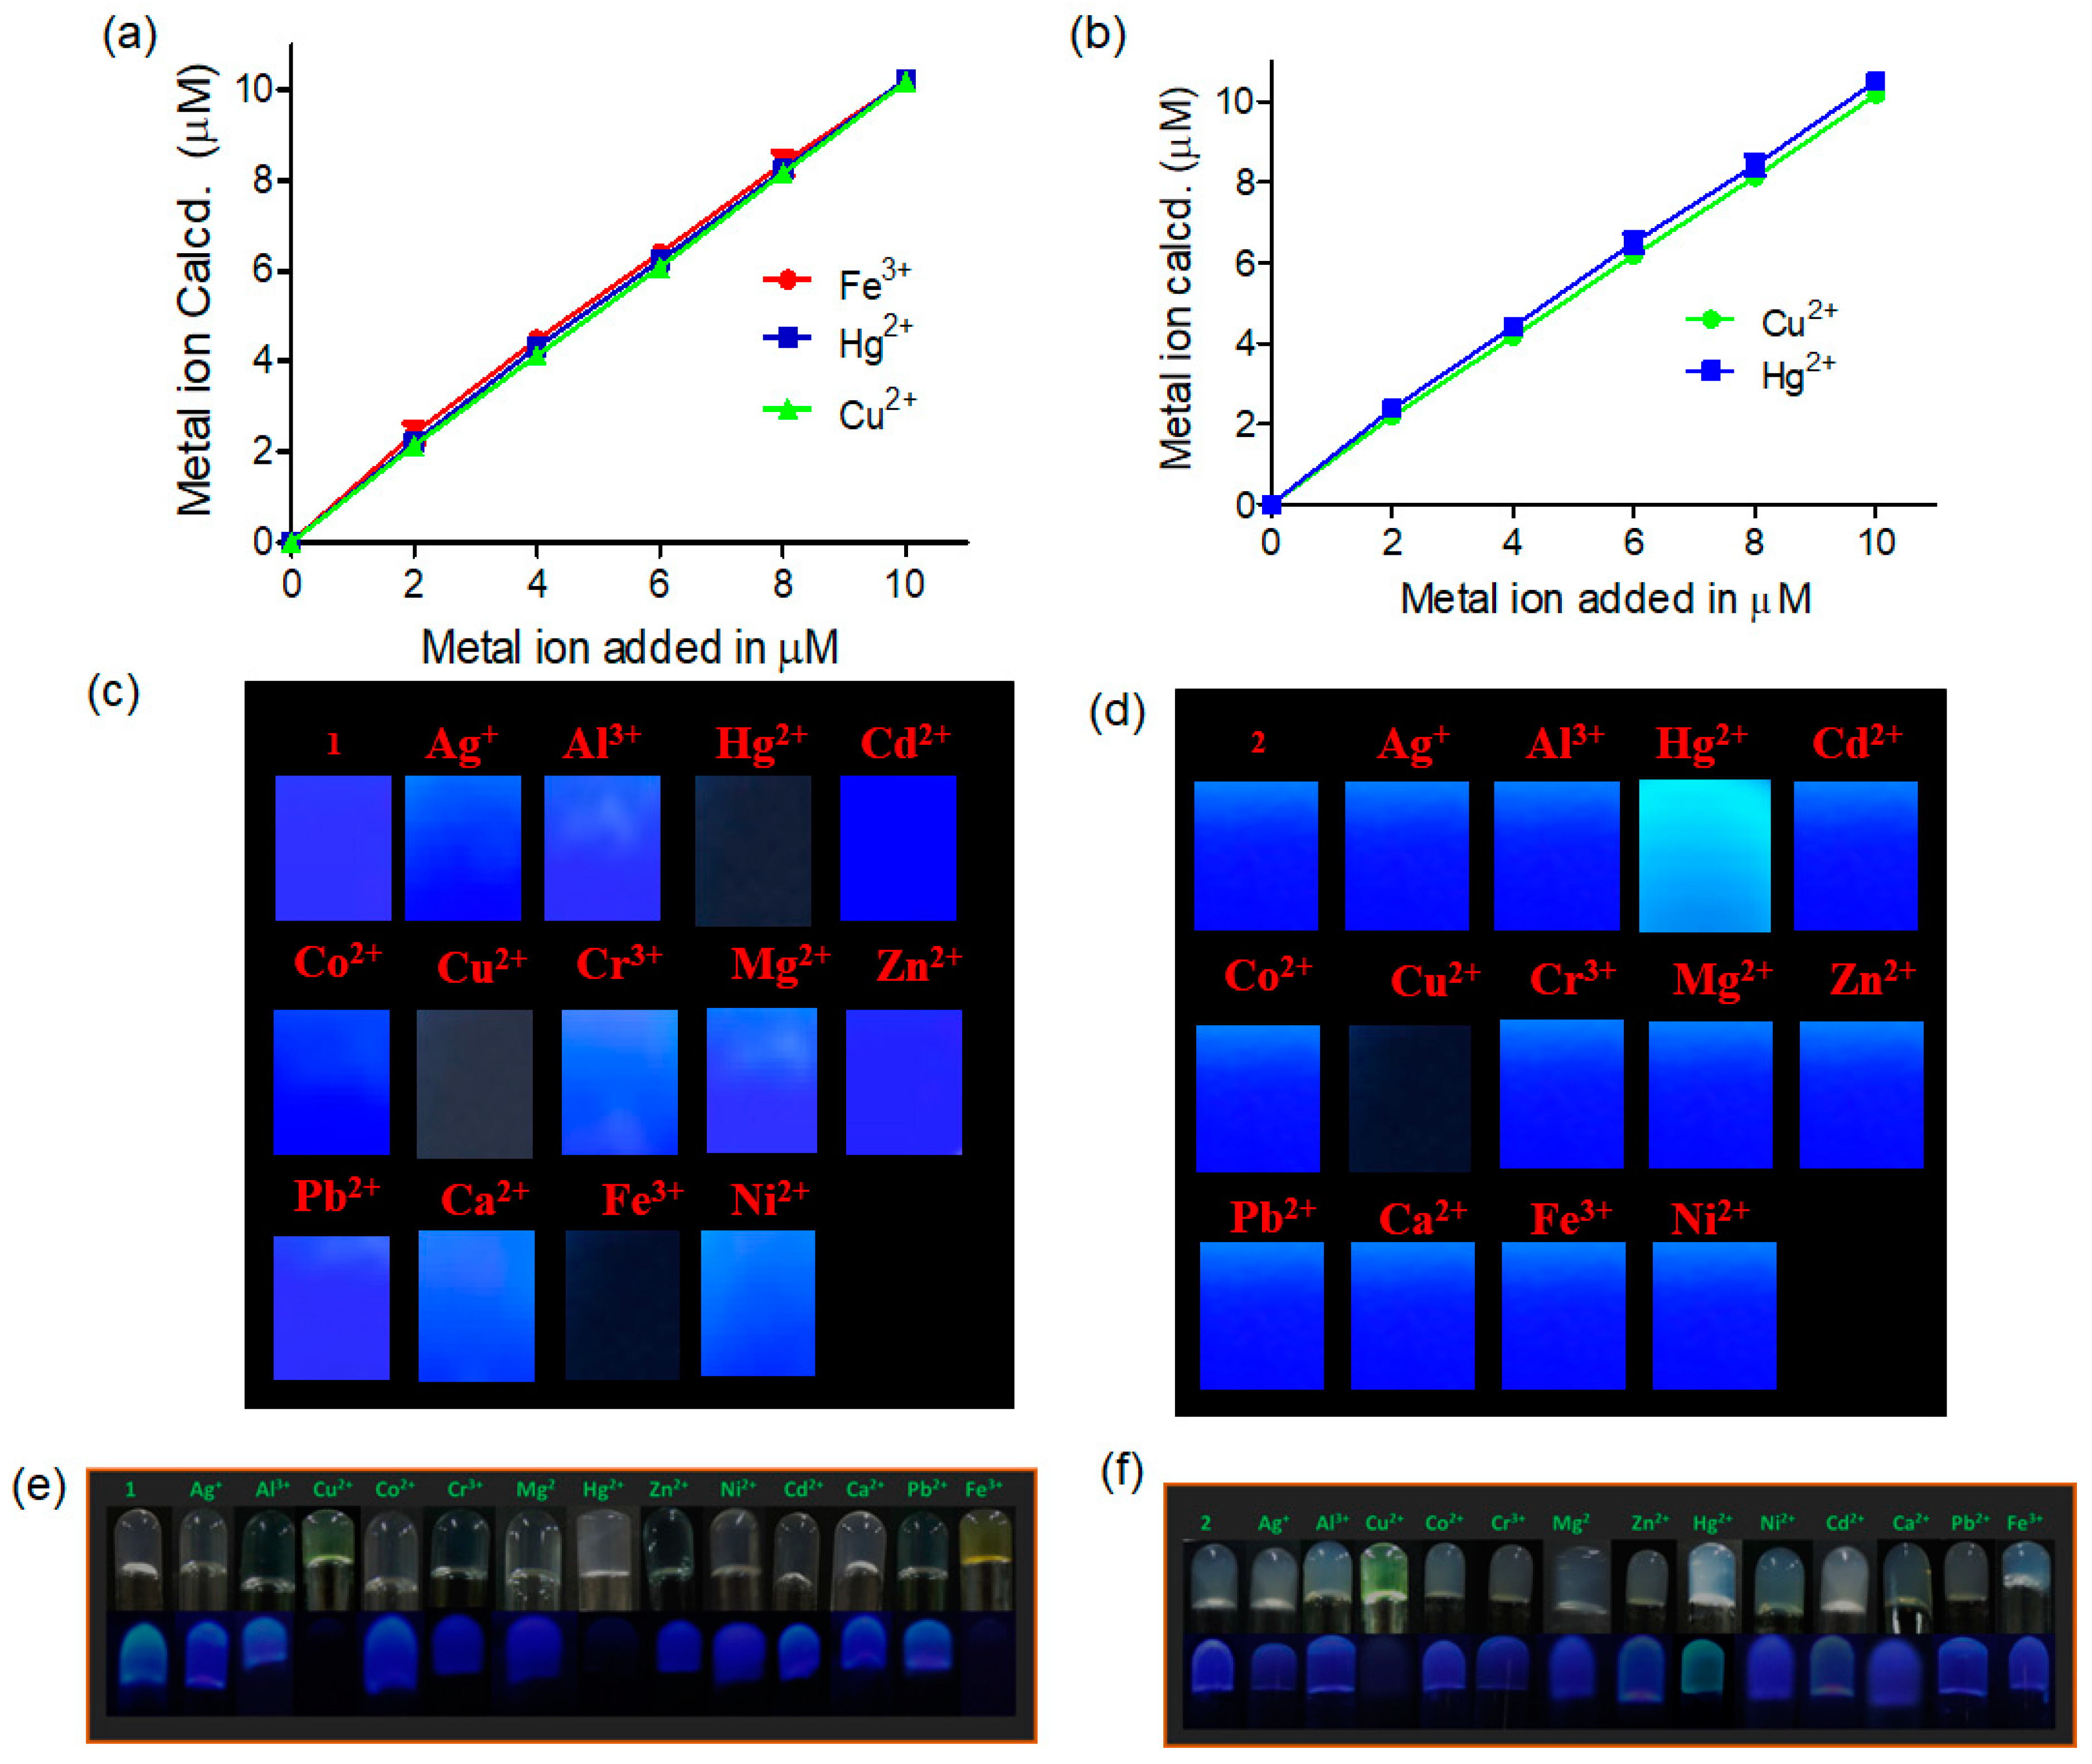
3.4. Application in Analyzing Real-Life Samples

3.4.1. Detection of Metal Ions in Water Samples

Here, we used water samples collected from laboratory taps to estimate the metal ions. An increase in the metal ion (0–10 μM) concentration led to a gradual decrease in the emission intensity of F/F0 at 422 nm for compound 1 and 470 nm for compound 2, thereby ensuring the quantitative nature of the method (Figure 5a,b). This was further supported by the recovery experiment, as presented in Tables S1 and S2 [28], where we observed that the degree of proportional errors was less than 5% in all the cases.

3.4.2. Detection of Metal Ions Using Dye-Coated Paper Strips

We developed paper strips coated with compounds 1 and 2 for on-site detection [29]. The paper strips coated with the compound showed blue fluorescence under a standard UV lamp, which markedly changed upon immersion into Cu2+, Hg2+, and Fe3+ (for compound 1) and Cu2+ and Hg2+ (for compound 2) solutions.
As shown in Figure 5c,d, metal ions could efficiently quench the native blue color of the compound 1 coated paper strip. However, in the case of compound 2 coated paper strips, we observed that blue fluorescence became cyan upon immersion into Hg2+ while quenching was observed upon spiking with Cu2+ solution. We also observed that immersing them into other metal ions led to no change in the fluorescence color.

3.5. Gelation Ability of Compounds 1 and 2

We then checked the gelation ability of both compounds in the presence of various metal ions. We observed that upon the addition of metal ions to the compounds, there was no gel-to-sol transition; instead, it formed a weak gel compared to that of the hydrogel formed by compounds 1 and 2, respectively. Interestingly, the addition of Cu2+ and Fe3+ resulted in a change in color from colorless to green and yellow in the case of compound 1-based hydrogel, which may be due to mild charge transfer from an electron-dense pyrenyl unit to a metal ion (Figure 5e). A similar color change was observed for the interaction of Cu2+ with compound 2 (Figure 5f). As expected, the blue fluorescence of compound 1 was efficiently quenched by the interaction of Cu2+, Hg2+, and Fe3+ with compound 1 (Figure 5e). In the case of compound addition of Hg2+ resulted in the formation of cyan fluorescence. In contrast, quenching was observed after adding Cu2+ to the hydrogel (Figure 5f). Thus, using all the findings, we generated a table to predict the presence of individual metal ions in the unknown samples. This can be achieved by comparing the responses of the metal ions with compounds 1 and 2. If there is quenching for only compound 1, we can predict that the unknown sample contains Fe3+. When both the compounds’ responses are quenched, it confirms the presence of Cu2+ ions in the sample; on the other hand, if the fluorescence responses are quenched and ratiometric for compounds 1 and 2, respectively, then there is a presence of Hg2+ (Figure 6a).

4. Conclusions

In conclusion, we have designed and synthesized pyrene-based amino-acid linked gallate-based amphiphiles 1 and 2, which can be super gelators in an aqueous medium. Both the hydrogels were thermoreversible and thixotropic in nature. The AFM analysis confirmed the presence of a fibrous microstructure in the self-assembled state. Further, the compounds were used to detect metal ions in a water medium, such as Cu2+, Fe3+, and Hg2+. Compound 1 showed emission quenching with all three metal ions but to different extents. On the contrary, compound 2 showed quenching with Cu2+ ions and a ratiometric color change with Hg2+. Compound 2 showed no interaction with Fe3+. Thus, by comparing the responses of compound 1 and compound 2, we can predict whether the unknown sample contains Fe3+ or not. Though compound 1 and compound 2 showed a similar spectral change with Cu2+ (quenching in both cases), a distinctive behavior was observed with Hg2+. Thus, here also, we can differentiate between Cu2+ and Hg2+ by comparing the relative responses of the two compounds. Mechanistic studies revealed the formation of a coordination complex when metal ions were added to the hydrogel. Adding metal ions to hydrogel resulted in a distinct change in color under daylight and UV lamp. Moreover, metal ions were successfully detected in various natural water samples. The gel-coated low-cost paper strips were also developed to easily detect metal ions in remote areas.

Supplementary Materials

The following supporting information can be downloaded at: https://www.mdpi.com/article/10.3390/org4030032/s1. The supporting information contains the following details. Figure S1. (a): Absorbance spectra of compounds 1 and 2 in water; (b): Emission spectra of compounds 1 and 2 in water; (c): Fluorescence titration of compound 1 with increasing concentration of Fe3+; (d): Change in the emission intensity of compound 1 in the presence of increasing concentrations of different metal ions; Figure S2. (a,b): Job plot and binding constant calculation for the interaction of compound 1 with Fe3+ and Hg2+; Figure S3. (a,b): Job plot and binding constant calculation for the interaction of compound 2 with Hg2+; Figure S4. (a,b): EDTA-mediated recovery plot for the interaction of compound 1 with Fe3+ and Hg2+; (c) EDTA-mediated recovery plot for the interaction of compound 2 with Hg2+; Figure S5. (a): FT-IR spectra for the interaction of compound 1 with Cu2+, Fe3+, and Hg2+; (b): FT-IR spectra for the interaction of compound 2 with Cu2+ and Hg2+; Figure S6: AFM images for the interaction of compound 1 with Cu2+, Fe3+, and Hg2+; Table S1. (a–c): Recovery experiment of Cu2+, Fe3+, and Hg2+ using compound 1 in a tap water sample; Table S2. (a,b): Recovery experiment of Cu2+ and Hg2+ using compound 2 in a tap water sample.

Author Contributions

The project was performed in the laboratory of S.B., which provided financial support and overall guidance; D.B. and N.D. did the experimental work and collected all the data. D.B. prepared the original manuscript draft, and D.B., N.D. and S.B. reviewed and edited it. After scrutinizing the accuracy of all the data, the final form was uploaded by the first author, D.B. All authors have read and agreed to the published version of the manuscript.

Funding

This research received no external funding.

Data Availability Statement

Author will provide the data on request.

Acknowledgments

S. Bhattacharya thanks the Department of Science and Technology for the J. C. Bose Fellowship. D. Biswakarma thanks DSKPDF for the fellowship.

Conflicts of Interest

The authors declare no conflict of interest.

References

  1. Xu, L.; Qiu, L.; Sheng, Y.; Sun, Y.; Deng, L.; Li, X.; Bradley, M.; Zhang, R. Biodegradable pH-Responsive Hydrogels for Controlled dual-drug release. J. Mater. Chem. B 2018, 6, 510–517. [Google Scholar] [CrossRef] [PubMed]
  2. Han, D.; Lu, Z.; Chester, S.A.; Lee, H. Micro 3D Printing of a Temperature-Responsive Hydrogel Using Projection Micro-Stereolithography. Sci. Rep. 2018, 8, 1963. [Google Scholar] [CrossRef]
  3. Lv, S.-W.; Liu, Y.; Xie, M.; Wang, J.; Yan, X.-W.; Li, Z.; Dong, W.-G.; Huang, W.-H. Near-Infrared Light-Responsive Hydrogel for Specific Recognition and Photothermal Site-Release of Circulating Tumor Cells. ACS Nano 2016, 10, 6201–6210. [Google Scholar] [CrossRef] [PubMed]
  4. Ambrozc, R.; Plazl, I. Development of an Electrically Responsive Hydrogel for Programmable Insitu Immobilization Within a Microfluidic Device. Soft Matter 2021, 17, 6751–6764. [Google Scholar] [CrossRef]
  5. Araújo-Custódio, S.; Gomez-Florit, M.; Tomás, A.R.; Mendes, B.B.; Babo, P.S.; Mithieux, S.M.; Weiss, A.; Domingues, R.M.A.; Reis, R.L.; Gomes, M.E. Injectable and Magnetic Responsive Hydrogels with Bioinspired Ordered Structures. ACS Biomater. Sci. Eng. 2019, 5, 1392–1404. [Google Scholar] [CrossRef]
  6. Biswakarma, D.; Dey, N.; Bhattacharya, S. A Biocompatible Aydrogel as a Template for Oxidative Decomposition Reactions: A Chemodosimetric Analysis and In-vitro Imaging of Hypochlorite. Chem. Sci. 2022, 13, 2286–2295. [Google Scholar] [CrossRef] [PubMed]
  7. Tang, J.D.; Mura, C.; Lampe, K.J. Stimuli-Responsive, Pentapeptide, Nanofiber Hydrogel for Tissue Engineering. J. Am. Chem. Soc. 2019, 141, 4886–4899. [Google Scholar] [CrossRef]
  8. Biswakarma, D.; Dey, N.; Bhattacharya, S. Thermoresponsive Sustainable Release of Anticancer Drugs using Cyto-compatible Pyrenylated Hydrogel as Vehicle. J. Chem. Sci. 2023, 135, 7. [Google Scholar] [CrossRef]
  9. Hapiot, F.; Menuel, S.; Monflier, E. Thermoresponsive Hydrogels in Catalysis. ACS Catal. 2013, 3, 1006–1010. [Google Scholar] [CrossRef]
  10. Huang, H.; Han, L.; Fu, X.; Wang, Y.; Yang, Z.; Pan, L.; Xu, M. Multiple Stimuli-Responsive and Identifiable Zwitterionic Ionic Conductive Hydrogel for Bionic Electronic Skin. Adv. Electron. Mater. 2020, 6, 2000239. [Google Scholar] [CrossRef]
  11. Biswakarma, D.; Dey, N.; Bhattacharya, S. Thermo-responsive Supramolecular Hydrogel that Senses Cholera Toxin via Color-changing Response. Chem. Commun. 2020, 56, 7789–7792. [Google Scholar] [CrossRef]
  12. Shigemitsu, H.; Hamachi, I. Supramolecular Assemblies Responsive to Biomolecules toward Biological Applications. Chem. Asian J. 2015, 10, 2026–2038. [Google Scholar] [CrossRef] [PubMed]
  13. Versluis, F.; van Esch, J.H.; Eelkema, R. Synthetic Self-Assembled Materials in Biological Environments. Adv. Mater. 2016, 28, 4576–4592. [Google Scholar] [CrossRef]
  14. Du, X.; Zhou, J.; Shi, J.; Xu, B. Supramolecular Hydrogelators and Hydrogels: From Soft Matter to Molecular Biomaterials. Chem. Rev. 2015, 115, 13165–13307. [Google Scholar] [CrossRef] [PubMed]
  15. Shigemitsu, H.; Hamachi, I. Design Strategies of Stimuli-Responsive Supramolecular Hydrogels Relying on Structural Analyses and Cell-Mimicking Approaches. Acc. Chem. Res. 2017, 50, 740–750. [Google Scholar] [CrossRef]
  16. Biswakarma, D.; Dey, N.; Bhattacharya, S. A Two-Component Charge Transfer Hydrogel with Excellent Sensitivity Towards the Microenvironment: A Responsive Platform for Biogenic Thiols. Soft Matter 2020, 16, 9882–9889. [Google Scholar] [CrossRef]
  17. Park, J.; Morimoto, Y.; Lee, Y.-M.; Nam, W.; Fukuzumi, S. Metal Ion Effect on the Switch of Mechanism from Direct Oxygen Transfer to Metal Ion-Coupled Electron Transfer in the Sulfoxidation of Thioanisoles by a Non-Heme Iron (IV)-Oxo Complex. J. Am. Chem. Soc. 2011, 133, 5236–5239. [Google Scholar] [CrossRef] [PubMed]
  18. Kim, N.; Lee, H.J. Redox-Active Metal Ions and Amyloid-Degrading Enzymes in Alzheimer’s Disease. Int. J. Mol. Sci. 2021, 22, 7697. [Google Scholar] [CrossRef] [PubMed]
  19. Jaishankar, M.; Tseten, T.; Anbalagan, N.; Mathew, B.B.; Beeregowda, K.N. Toxicity, Mechanism and Health Effects of Some Heavy Metals. Inter Discip. Toxicol. 2014, 7, 60–72. [Google Scholar] [CrossRef]
  20. Carter, K.P.; Young, A.M.; Palmer, A.E. Fluorescent Sensors for Measuring Metal Ions in Living Systems. Chem. Rev. 2014, 114, 4564–4601. [Google Scholar] [CrossRef]
  21. Zhu, H.; Fan, J.; Wang, B.; Peng, X. Fluorescent, MRI, and Colorimetric Chemical Sensors for the First-Row d-Block Metal Ions. Chem. Soc. Rev. 2015, 44, 4337–4366. [Google Scholar] [CrossRef]
  22. Samanta, S.K.; Dey, N.; Kumari, N.; Biswakarma, D.; Bhattacharya, S. Multimodal Ion Sensing by Structurally Simple Pyridine-End Oligo p-Phenylenevinylenes for Sustainable Detection of Toxic Industrial Waste. ACS Sustain. Chem. Eng. 2019, 7, 12304–12314. [Google Scholar] [CrossRef]
  23. Wu, Y.; Tan, Y.; Wu, J.; Chen, S.; Chen, Y.Z.; Zhou, X.; Jiang, Y.; Tan, C. Fluorescence Array-Based Sensing of Metal Ions Using Conjugated Polyelectrolytes. ACS Appl. Mater. Interfaces 2015, 7, 6882–6888. [Google Scholar] [CrossRef] [PubMed]
  24. Wu, Y.; Liu, X.; Wu, Q.; Zhang, J.Y.G. Differentiation and Determination of Metal Ions Using Fluorescent Sensor Array Based on Carbon Nanodots. Sens. Actuators B 2017, 246, 680–685. [Google Scholar] [CrossRef]
  25. Biswakarma, D.; Dey, N.; Bhattacharya, S. Molecular design of amphiphiles for Microenvironment-Sensitive Kinetically Controlled Gelation and Their Utility in Probing Alcohol Contents. J. Colloid Interface Sci. 2022, 615, 335–345. [Google Scholar] [CrossRef]
  26. Acar, N.; Kınal, A.; Yener, N.; Yavas, A.; Güloglu, P. A DFT and TDDFT Investigation of Interactions Between Pyrene and Amino Acids with Cyclic Side Chains. Comput. Theor. Chem. 2016, 1081, 49–61. [Google Scholar] [CrossRef]
  27. Irving, H.; Williams, R.J.P. The stability of Transition-Metal Complexes. J. Chem. Soc. 1953, 637, 3192–3210. [Google Scholar] [CrossRef]
  28. Dey, N.; Biswakarma, D.; Bhattacharya, S. Metal Complex as an Optical Sensing Platform for Rapid Multimodal Recognition of a Pathogenic Biomarker in Real-Life Samples. ACS Sustain. Chem. Eng. 2019, 7, 569–577. [Google Scholar] [CrossRef]
  29. Biswakarma, D.; Dey, N.; Bhagat, D.; Bhattacharya, S. Switchable Luminescent Probe for Trace-Level Detection of the Spodoptera litura Nuclear Polyhedrosis Virus via a Color-Changing Response. ACS Agric. Sci. Technol. 2021, 1, 322–328. [Google Scholar] [CrossRef]
Figure 1. (a) Molecular structure of the compounds (1 and 2) used in the investigation. AFM images of the freeze-dried hydrogel of (b) compound 1 and (c) compound 2. Picture of the gel formation by (d) compound 1 and (e) compound 2 in Milli Q water. (f) Gel-to-sol transition and vice versa of hydrogel formed by compound 2 under mechanical shaking and at rest, respectively. (g) Schematic representation for the self-assembly of compounds 1 and 2 in Milli Q water. (h) Hysteresis loop test rheology data of hydrogel 1.
Organics 04 00032 g001
Figure 2. Change in the emission spectra of (a) compound 1 (20 μM, λex = 345 nm) at 422 nm and (b) compound 2 (20 μM, λex = 345 nm) at 470 nm upon the addition of various metal ions (20 μM). Fluorescence titrations of 1 (20 μM, λex = 345 nm) with (c) Cu2+ and (d) Hg2+.
Organics 04 00032 g002
Figure 3. Fluorescence titration of compound 2 (20 μM, λex = 345 nm) with (a) Hg2+ and (b) Cu2+. Job plot for the interaction of (c) compound 1 and (d) compound 2 with Cu2+. Calculation of the binding constant for the interaction of (e) compound 1 and (f) compound 2 with Cu2+.
Organics 04 00032 g003
Figure 4. EDTA-mediated recovery plot for the interaction of (a) compound 1 with Fe3+ and (b) compound 2 with Hg2+. 1H-NMR titration of (c) compound 1 and (d) compound 2 with Hg2+ in DMSO-d6/D2O (4:1) mixture medium.
Organics 04 00032 g004
Figure 5. Estimation of different metal ions by (a) compound 1 (20 μM, λmax = 345 nm) and (b) compound 2 (20 μM, λmax = 345 nm) in a tap water sample. Picture of paper-coated hydrogel strip on the addition of different metal ions to (c) compound 1 (2.5 mM) and (d) compound 2 (2.5 mM) coated paper strips (irradiated by >360 nm UV lamp). Gel picture of (e) compound 1 (2.5 mM) and (f) compound 2 (2.5 mM) in normal daylight/under a UV lamp in the presence of different metal ions.
Organics 04 00032 g005
Figure 6. (a) Comparison table for the fluorescence responses generated by compounds 1 and 2 in the presence of multiple metal ions. (b) Proposed mechanism for the interaction between different metal ions with compounds 1 and 2.
Organics 04 00032 g006
Disclaimer/Publisher’s Note: The statements, opinions and data contained in all publications are solely those of the individual author(s) and contributor(s) and not of MDPI and/or the editor(s). MDPI and/or the editor(s) disclaim responsibility for any injury to people or property resulting from any ideas, methods, instructions or products referred to in the content.

