Article

Modelling of an Anaerobic Digester: Identification of the Main Parameters Influencing the Production of Methane Using the Sobol Method

Laboratoire de Sécurité des Procédés Chimiques, INSA Rouen Normandie, Normandie Université, UNIVROUEN, LSPC-EA 4704, 76000 Rouen, France
*
Authors to whom correspondence should be addressed.
Fuels 2022, 3(3), 436-448; https://doi.org/10.3390/fuels3030027
Submission received: 5 May 2022 / Revised: 12 June 2022 / Accepted: 23 June 2022 / Published: 16 July 2022

Abstract

:
Anaerobic digestion is a promising method of organic waste valorisation, particularly for fish farm waste, which has experienced a high growth rate in recent years. The literature contains predictive mathematical models that have been developed by various authors, allowing the prediction of the composition of bio-gas production from organic waste. In general, Monod’s kinetic expression is the basis for describing the enzymatic reaction rates for anaerobic digestion. In this work, several parameters are taken into account, such as temperature, cell growth inhibition, and other operating parameters, and systems of differential equations coupling the kinetics and stoichiometry for bio-reactions are applied to better describe the dynamics. Because of the high number of initial parameters that need to be defined for the anaerobic digester, the use of this model requires significant resources and a long calculation time. For this reason, a global sensitivity analysis (GSA) is applied to this predictive model based on the Sobol index method, in order to identify the most influential key parameters and the interactions between them. For the digestion of fish waste, it is observed that the key parameters influencing methane production are the lipid concentration of the waste, temperature, and hydraulic retention time (HRT).

1. Introduction

Today, communities worldwide are working on the transition to different forms of energy. Changing fossil fuel sources for new technologies can lead to a decrease in CO2 emissions and can ensure the supply of energy required to meet incessant and growing demands, especially in areas where organic matter is available and abundant [1,2,3], and this is the goal for numerous research teams. However, despite the efforts made by these different communities, multiple challenges are still faced in developing secure and sustainable energy sources, mainly due to intermittency, grid restrictions, curtailment, and high costs [4].
Renewable energy has been widely studied. According to Zerta et al. [5], in the year 2030, the main sources of renewable energy will be hydropower, wind, raw waste, and solar. To better describe the different types of clean energy production technology, the authors have examined the different models and their parameters for the operation of photovoltaic panels, which form the main component of solar energy production [6]. Likewise, Ciulla et al. [7] have studied the modelling of the real behaviour of a wind turbine and the differences that can be found from theoretical approaches. Another interesting source of energy production is anaerobic digestion (AD), a promising technology that is becoming more extensively used. AD is an enzyme-catalysed reaction system, and takes place in a bioreactor used for the transformation of organic molecules (mainly proteins, lipids, and carbohydrates) to biogas with an anticipated heating value. For an efficient waste valorisation, some authors studied the co-digestion of two or more types of waste [8]. This biogas can be treated and upgraded for use in a combined cycle of heat and power (CHP) to generate heat and electricity. Although the production of bio-methane depends on the parameters of all the different processing units, the bottleneck and key unit in the process is the bioreactor [9,10]. AD has been applied as a solution for organic waste treatment from crops, cattle raising, and the food processing industry [11].
AD is defined by a system of bioreactions in which organic matter is transformed by the action of microorganisms and the absence of oxygen, producing biogas (a rich mixture of methane (CH4) and carbon dioxide (CO2)) and other energetic compounds [12]. AD mainly begins with fats, proteins, and carbohydrates, which are reduced into smaller compounds (acetic acid, butyrate, propionate, hydrogen, and so on) to produce biogas. A digestate is produced as a secondary product of the process and, after upgrading, can be used as a fertiliser [13].
The reaction system has been studied by Batstone et al. [14], who developed mathematical approaches for modelling the kinetic system representing these complex enzymatic reactions. Angelidaki et al. [15] proposed the detailed stoichiometry of the reaction system. Predictive models have also been developed by Flotats et al. [16] for the estimation of the potential quantity of methane produced from different feedstocks. These models have been consolidated using mathematical expressions to take into account the influence of inhibitors [17] and operating conditions such as temperature and pH [18]. The main objective of all of this research has been to increase the yield of methane. In an AD system, the bioreactor is designed based on the hydraulic retention time, a parameter that needs to be considered to describe the reaction progress. The evolution of these reactions as a function of time has been presented as a system of differential equations based on the kinetic model for this process [19,20].
Global sensitivity analysis (GSA) has not been applied to anaerobic digestion as a tool for analysing nonlinear systems, although authors such as Ochoa et al. [21] have applied GSA to a bioreactor system for producing bioethanol, and have obtained a ranking of parameters based on their influence. Recently, Vaneeckhaute et al. [22] proposed the application of GSA in a detailed model that included the design of the whole process, from the inlet solid raw material to gas cleaning and digestate production. Their model considered the physical phenomena and the global production process based on the concentration of nutrients in the products, giving an optimised treatment train configuration. Although the importance of the feedstock has been identified based on these results, no ranking was proposed in terms of sensitivity to the composition of lipids, proteins, and carbohydrates as the major molecules of the feedstock. Generally, the methane produced from waste is often utilized through combustion for power generation. In a previous work of Zhang and Jiang [23], the GSA method was also used to identify the key parameters influencing the combustion characteristics of biogas. Applying this method to the entire power generation process (from biomass, then methane and its combustion, to power generation) could identify the key parameters influencing methane production and combustion.
Previous studies did focus on evaluating the effect of certain operational parameters or composition specifications [11,24,25,26], but they did not take into account the interactions between different parameters by evaluating all of them at the same time. The results have been used to define ranges of operation for each parameter evaluated, but have not considered the relations among the various parameters (not only operational parameters, but also those related to the composition of the feedstock) [27].
The goal of this work is to identify the key parameters influencing methane production in the bioreactor and to quantify the interactions between these parameters. This study focuses on analysing the influence of each parameter on the kinetic model and evaluating their degree of dependence. Our methodology, which is based on the Sobol index method, allows the proposition of a ranking of the main parameters in order to increase the yield of biogas production. In addition, the results of this study provide a quantification of the influence of the variation in each parameter evaluated. This study can also be extended to involve other parameters such as the organic loading rate (OLR), for example. However, we have limited ourselves to the parameters mentioned above.

2. Kinetic Modelling of Anaerobic Digestion

AD consists of a sequence of four different reactions: hydrolysis, acidogenesis, acetogenesis, and methanogenesis. The hydrolysis phase is characterised by turning complex biopolymers (fats, proteins, and carbohydrates) into smaller compounds (long-chain fatty acids, amino acids, sugars, and so on), and the enzymes produced by microorganisms support this reaction. For acetogenesis, valeric acid, butyric acid, and propionic acid are converted into hydrogen, carbon dioxide, and acetate. In the third phase, acetogenesis, fatty acids are converted into hydrogen, carbon dioxide, and acetate, and in the final phase of methanogenesis, hydrogen and carbon dioxide are used by the CO2 methanogens to produce methane, and acetate is transformed by the action of acetoclastic methanogens into methane and carbon dioxide [28].
The use of experimental bioreactors at the laboratory scale has contributed to a deep comprehension of the AD mechanism and allowed authors such as Batstone et al. [14] to propose mathematical approaches to modelling the kinetic system representing complex enzymatic reactions. This comprehension has given rise to other studies from the impact of feedstock composition and the response of the system to the heterogenic concentrations of the organic matter used. These models have also formed the basis of other technical models to represent the detailed effects of different inhibitor parameters and the use of a co-substrate [10].
In order to predict the production of biogas and enhance the yield of methane in different case studies, a hybrid model based on the kinetic system proposed by Angelidaki et al. [15] was used, which was improved by taking into account some proprieties from Anaerobic Digestion Model No. 1 (ADM1) [19]. These proprieties can be summarised as follows:
  • The hydrolysis of lipids, carbohydrates, and proteins based on an expression for enzymatic degradation;
  • The proposal of differential equations for describing the dynamic state, following the stoichiometrics proposed by Angelidaki [15];
  • pH variation depending on the acid/base equilibrium.
This hybrid kinetic model describes the system using first-order kinetic reactions, from the decomposition of lipids, carbohydrates, and proteins to the production of biogas. This process is composed of the four main steps of hydrolysis, acidogenesis, acetogenesis, and methanogenesis [29], as described above.
Globally, the rate expression of each compound is based on the kinetic constant for each reaction. This kinetic constant is a function of the maximum rate for each compound, taking into account the correction due to the concentration of inhibitors following Monod’s expression [30,31]. These kinetic constants are then added to the first-order kinetic system.
Monod’s expression is a way to express kinetic systems based on cells growing where the maximal rate is corrected depending on the concentration of the substrate and its half-saturation coefficients. The concentration of the inhibitor and its coefficient affect the expression by decreasing the reaction rate [32]. Molecules used as inhibitors are part of cells that do not grow above a specific concentration [31] and can be generally described using the following expression:
μ = μ m a x 1 + K s S + I K i  
where µmax is the maximum achievable specific growth rate (day−1), S is the concentration of the limiting substrate (g L−1), Ks is the limiting substrate concentration when the specific growth rate is at half of its maximum value (g L−1), I is the inhibitor concentration (g L−1), and Ki the inhibition constant (g L−1).
Table 1 summarises the reaction rate expressions used in the model, based on the equations reported by Angelidaki et al. [15] for acidogenesis, acetogenesis, and methanogenesis. However, the hydrolysis step is not considered using the Monod expression; it is modelled as a first-order equation with a reaction constant that depends on the source of the waste [33].
This model also considers the influence of temperature on the reaction rate via the expression proposed by Angeldaki et al. [15]; this has a direct influence on the maximum rate values and the half-saturation coefficients. The influence of temperature on the hydrolytic step is based on the ADM1 model [33]. In the present work, the kinetic constants and their dependence on temperature were assumed to correspond to values estimated based on thermophilic conditions (about 55 °C) [34] (for more information, the reader is referred to Annex 1). The model is not sensitive to changes in temperature due to the thermodynamics of the reactions, and it is assumed that the user of the model can set the temperature and control this condition during the entire AD process (Hilkiah et al., 2007).
According to the literature, thermophilic microorganisms are highly sensitive to low-pH environments [35]. Furthermore, pH is a dynamic specification that depends on the production and consumption of sub-products, causing variations in the acidification of the media during the four reaction steps [36]. Inhibition due to the variation in pH is calculated based on the Michaelis function [37], and is added to the system as a coefficient for each rate expression following relation (2), which was proposed for the ADM1 model [38] and describes lower inhibition.
F p H = p H < p H L L   e 3 p H p H U L p H U L p H L L p H > p H L L   I = 1
The kinetic system may be affected by the pH of the feedstock used. The acidity of the medium can be calculated by the acid/base equilibrium in the liquid phase (Table 2) [39], and is a dynamic value that has an effect on the global kinetic system [40]. This measure depends not only on the initial pH, but also on the concentration of the different intermediates, such as volatile fatty acids and acetic acid, according to the steps of the reaction [38].
The feedstock composition is specified in terms of the mass fractions of lipids, carbohydrates, and proteins. The kinetic model then follows the stoichiometry defined by [37] to be given as the concentration of the biogas. This stoichiometry was validated and produces a quantity of methane based on the biochemical methane potential (BMP).
The gas yield and its composition are calculated in this model as a function of the operational parameters, based on the numerical solution of the differential equation system during the time defined as HRT. This leads to the development of the system of differential equations based on ADM1, as used previously by several authors in the literature [20]. The variation in the concentration over time for each molecule reacting and/or produced in the system is expressed in Equation (3). For this work, the liquid phase contained twenty components, giving twenty differential equations, as follows:
d   X i d t =   q l i q V l i q   X i n , i X t , i + 1 20 ρ j v i , j
The flow rate of the feedstock and operational settings such as temperature, pH, and HRT were considered as the input parameters of the system. In addition, initial conditions for concentrations and pH were considered. The model was implemented in MatLab®.
In this work, the organic matter is assumed to be the feedstock composed of lipids, carbohydrates, and proteins as volatile solids (VSs) dissolved in water with the optimal (specified) concentration of ammonia [18].
The yield of methane produced is normalised under standard conditions (STC) according to Equation (4) by considering the amount of VS introduced in the feedstock. This value leads to optimisation of the amount of methane produced by a unit of raw material, and each parameter is evaluated and compared in terms of its influence on the production of methane [41].
y i e l d = v o l u m e     o f   C H 4   V S     L / k g   a t   S T C

3. Analysis of Parameters

3.1. Global Sensitivity Analysis Method

Sobol’s (1993) method is used to study the influence of different bioreactor inputs on the output, i.e., the yield of CH4, designated as Y. In the case of the bioreactor, these input parameters, designated as X, include the acidity of the media; the HRT; the temperature; and the fractions of lipids, carbohydrates, and proteins.
If the mathematical model can be integrated in the range [0, 1] with k as the number of input parameters, then it can be decomposed into terms of increasing dimensions [42] as follows:
f = f 0 + i f i ( x i ) + i j > i f i j ( x i , x j ) + + f 1 , 2 , , k x i , x j , , x k
The components fi(xi), fij(xi, xj), … are called first-order terms, second-order terms, and so on, respectively, where
f 0 = E y = f x d x  
E y | x i = f x k i d x k = f 0 + f i x i    
By square integrating each term in Equation (5),
V y = f 2 x d x i d x n f 0 2  
V i 1 i s = f 2 i 1 i s d x i 1 d x i s  
where V(y) is the unconditional variance and V i 1 i s represents the conditional variance. By deriving the so-called ANOVA-HDMR decomposition,
V y = i V i + i j > i V i j + + V 1 , 2 , , k  
Equation (11) is obtained by dividing Equation (10) by V(y), as follows:
1 = i S i + i j > i S i j + i j > i l > j S i j l + S 1 , 2 , 3 , , k
where Si and SiTOT can be defined as follows:
S i = V E y | x i V y = V i V y  
S i T O T = E V y | x i         V y = V i T O T V y    
S i i n t = S i j + + S 1 , 2 , 3 , , k =   S i T O T S i  
where S i ,   S i j ,   S i j l ,   and   S i T O T are the variance of the first expectation outlet variable and the second-, third-, and total-order sensitivity indices, respectively; V i = V E y | x i is the variance in the expectation of the output parameters Y, conditioned on an input parameter xi; V i T O T = E V y | x i is the expectation outlet variable variance if all input variables excluding xi are fixed; and Siint allows the estimation of the interactions between the input parameters.
For a more detailed description of Sobol’s method, the reader is referred to (Sobol, 1993; Sobol, 2001).

3.2. Sobol Sequence Method

A quasi-Monte Carlo Sobol sequence fill was chosen as a sampling method to build the input matrix for the simulations. N samples were used to avoid a reduction in accuracy.
The indices are defined by subtracting Equation (15) from Equation (17), according to Saltelli et al. (2010), as follows:
V y = 1 N j = 1 N f A j 2   f 0   2  
V E y | x i = 1 N j = 1 N f B j f ( A B i ) j f A j 2 ,   i = 1 , , k  
E V y | x i = 1 2 N j = 1 N f A j f ( A B i ) j 2 ,   i = 1 , , k  
where N is the sample size and A, B, and AB are matrices of N quasi-random values for the k input parameters. The ith column of matrix B forms the matrix AB, and the other k − 1 columns come from matrix A. Three vectors (N × 1) for the model output are obtained: yA = f(A), yB = f(B), and yAB = f(AB(i)).
The values of the sensitivity indices (Si, Siint, and SiTOT) represent the variation in the model output due to the model input i. The influence of an input parameter on an output parameter can be neglected if Si, Siint, or SiTOT are lower than 5% (Di Maggio et al., 2010).

4. Results and Discussion

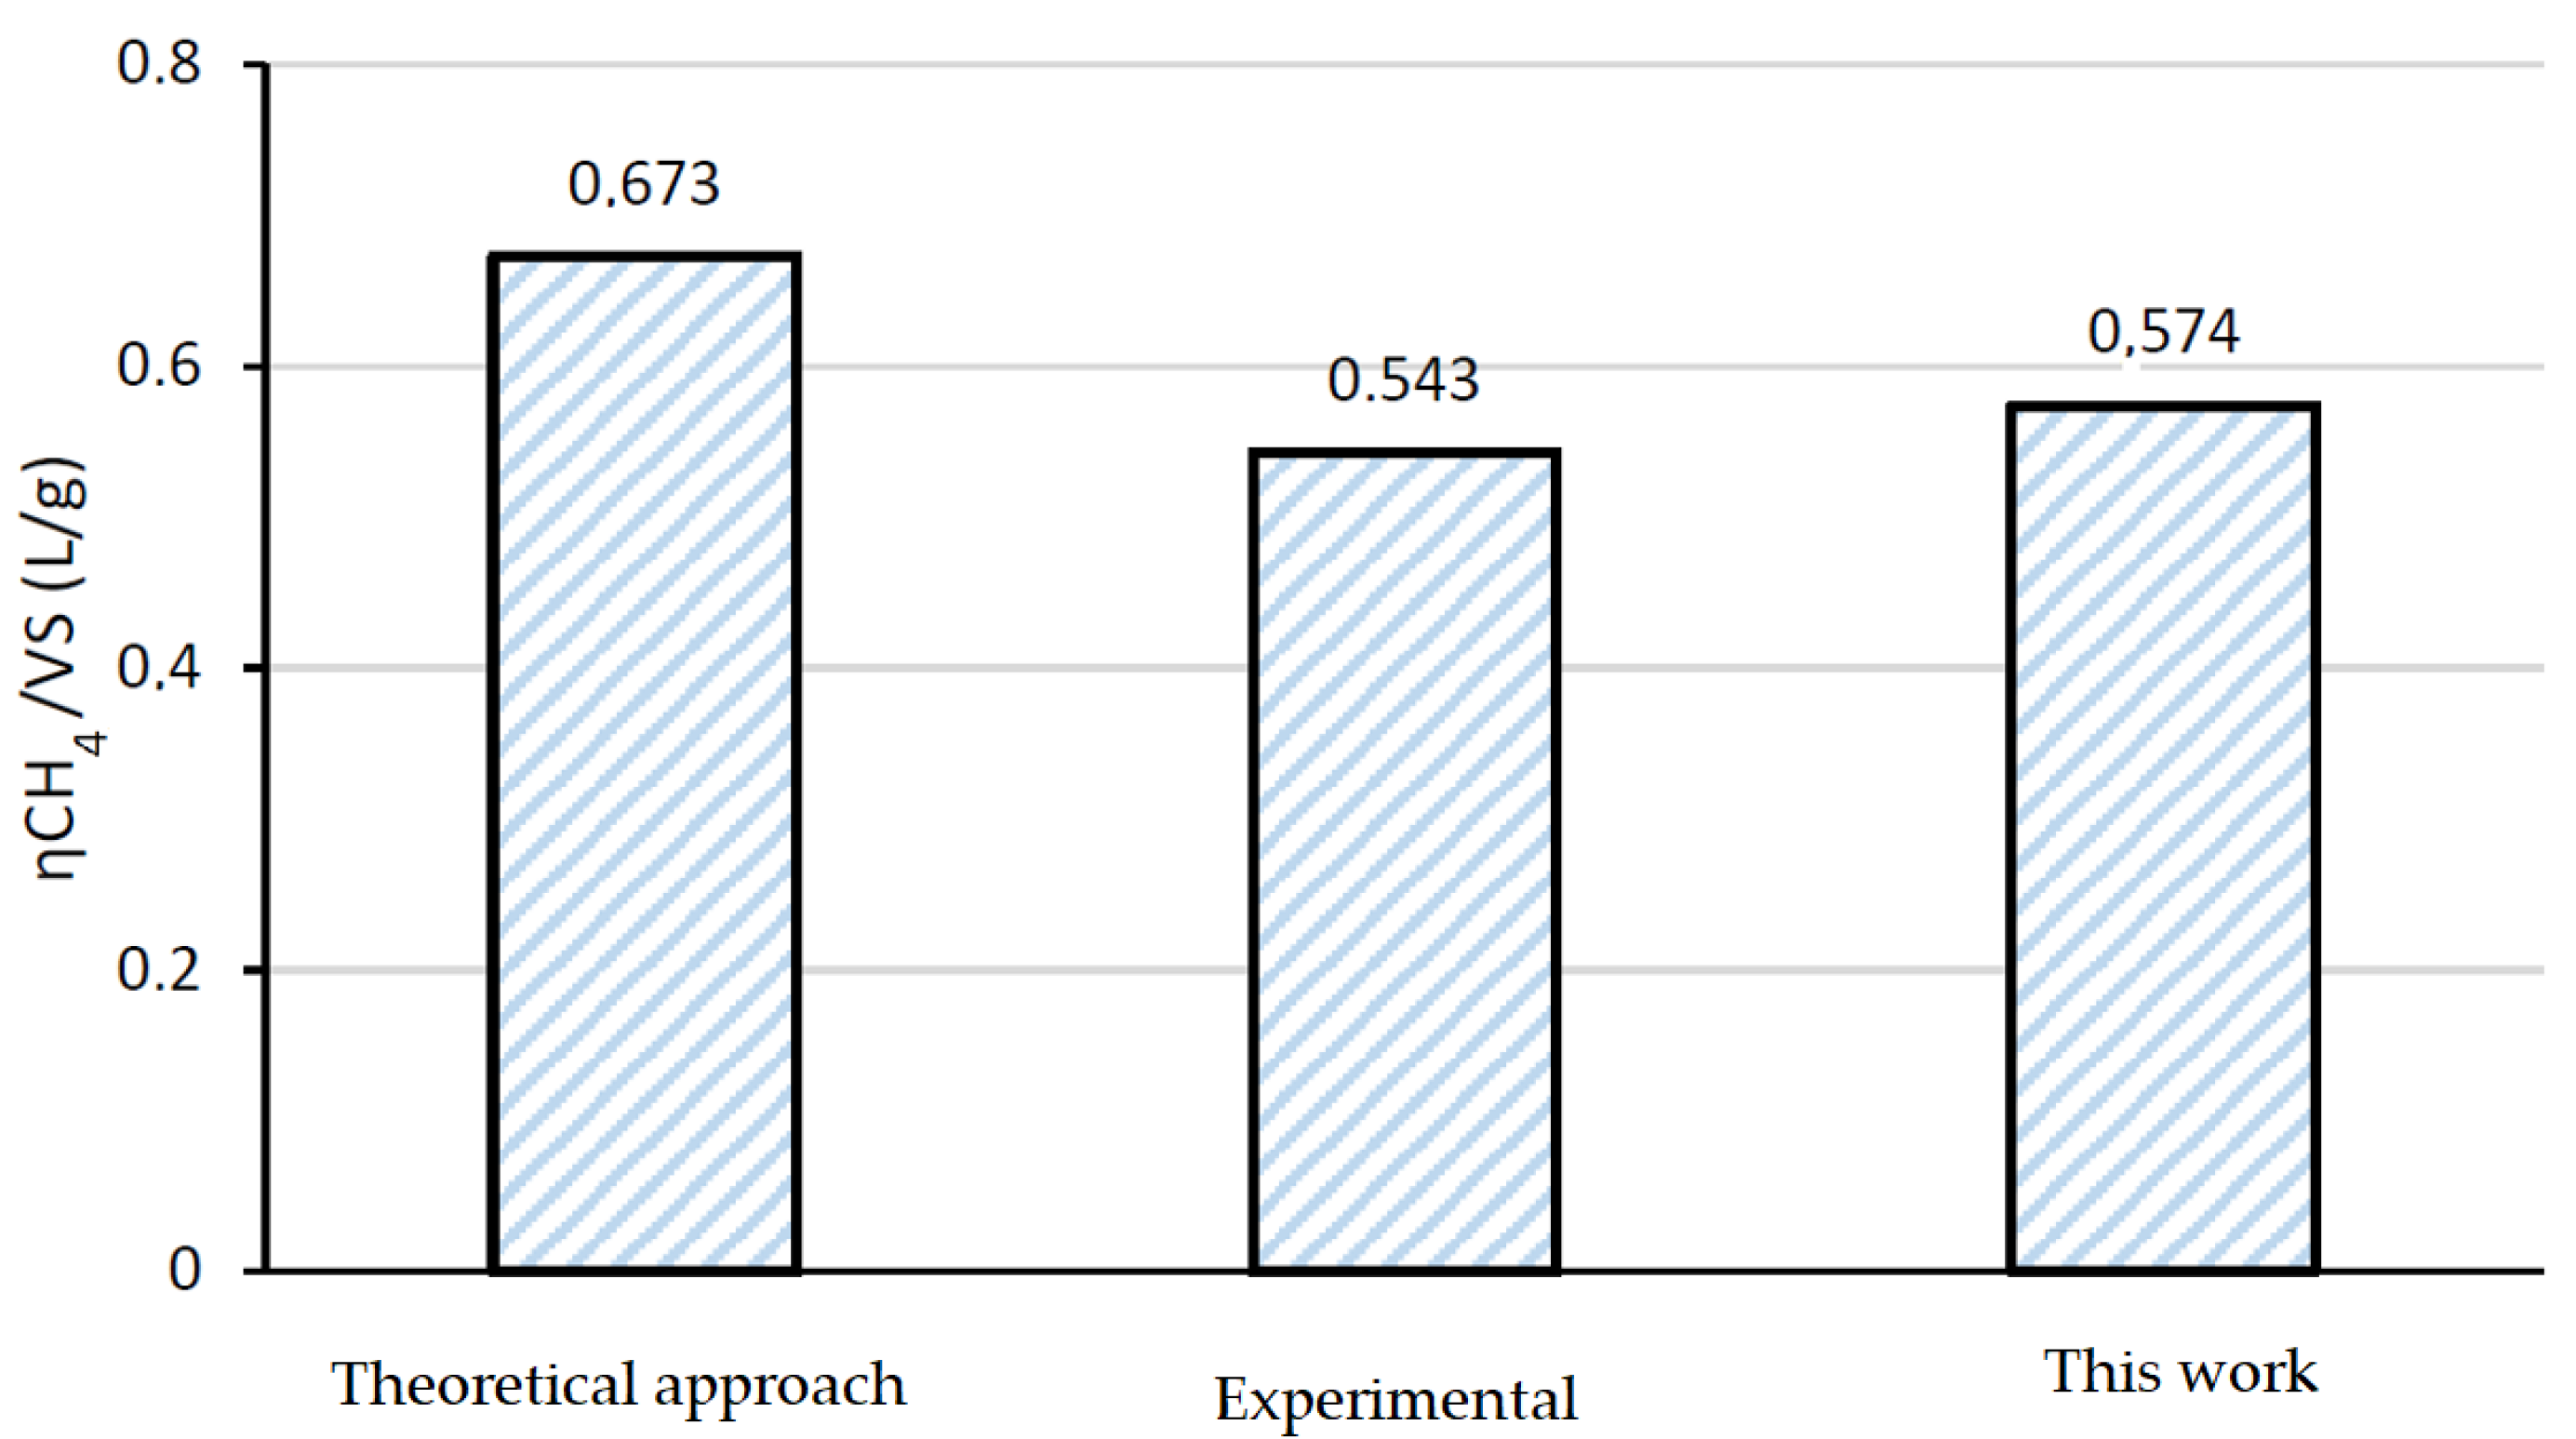
4.1. Validation of the Model Based on the Experimental Results
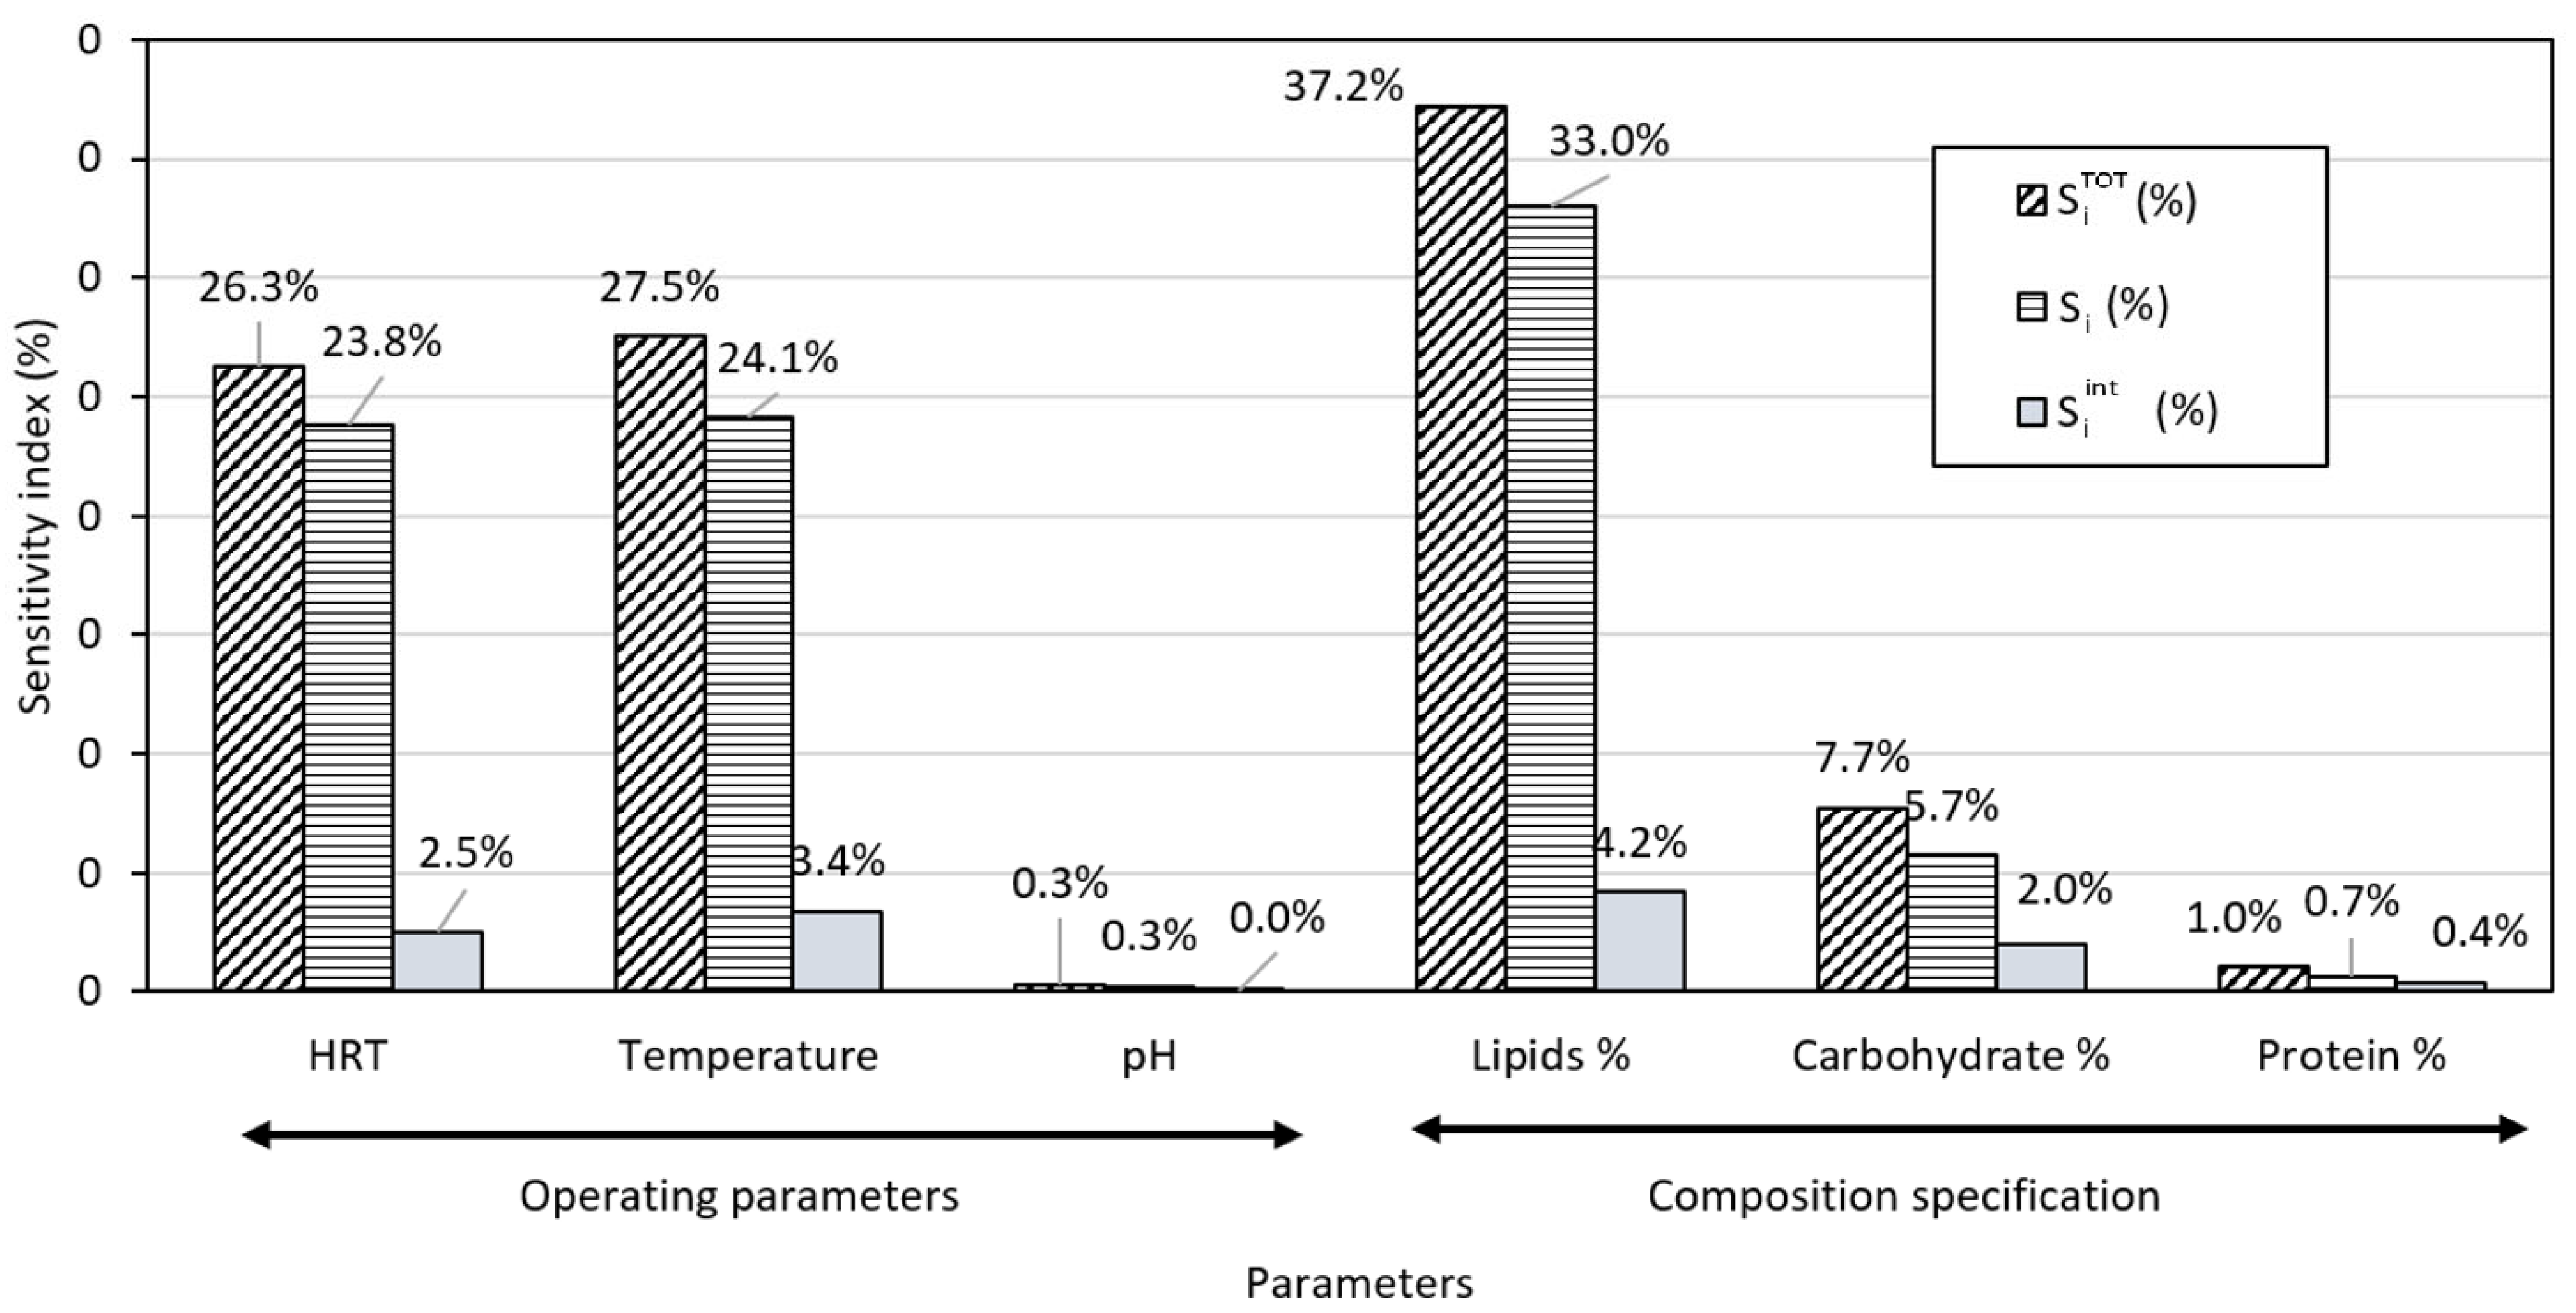
In order to validate the mathematical model, the results from this work were compared with the results from the literature under the same operating conditions (temperature = 55 °C, HRT = 50 days) and for the same waste composition. It should be noted that few works in the literature give the details of the gas yield, its composition, the composition of the waste, and the operating conditions. Figure 1 shows the yield of methane predicted by the model developed in this study, the yield of methane calculated using the theoretical approach [43], and the yield of methane produced experimentally [26]. This figure shows that the model predicts the flow of methane better than the theoretical approach, with an error of less than 6%.

4.2. GSA Results

GSA was applied to the kinetic model in order to analyse the influence of the waste composition and operational conditions on methane yield. Three parameters were considered regarding the operational conditions (pH, HRT, and temperature) and three parameters concerning the waste composition (lipids, proteins, and carbohydrates). Table 3 shows the range of evaluation for each input.
Under these operating conditions, Figure 2 shows that the HRT influenced the methane yield with a sensitivity of about 26.3% and the temperature of the media by about 27.5%. For the waste concentration, the concentration of lipids has the highest global Sobol index (37.2%), followed by 7.7% for the concentrations of carbohydrates. The effect of the concentration of proteins can be neglected as their Sobol indices were lower than 5%.
The results of this analysis show that the ranking of the main parameters influencing the methane yield is lipid concentration > temperature > HRT. Their interactions can also be neglected, as the interaction sensitivity indices, Sint, were about 4%.

4.3. Analysis of HRT as an Influential Operating Parameter

The operational parameters can be evaluated separately to identify the optimal region of operation. For this purpose, the yield of methane as a function of the HRT was evaluated at a temperature of 55 °C for the same feedstock (i.e., the concentrations of lipids, carbohydrates, and proteins were kept constant), as shown in Figure 3. In this case, the behaviour of the system was highly influenced by the HRT. The yield of CH4 increased with the increasing HRT to its optimal value and then formed a plateau, meaning that an optimal region of HRT could be established. Although an apparent maximum was achieved at a value of 46 days, 95% of the production could be achieved in half the time (i.e., 23 days). This result could be used to reduce the time or the size of the installation for a new process. Efforts towards optimisation can be made using these key parameters to improve the yield of CH4. Moreover, the HRT can be used as the manipulated variable to balance the changes in the other operational variables.

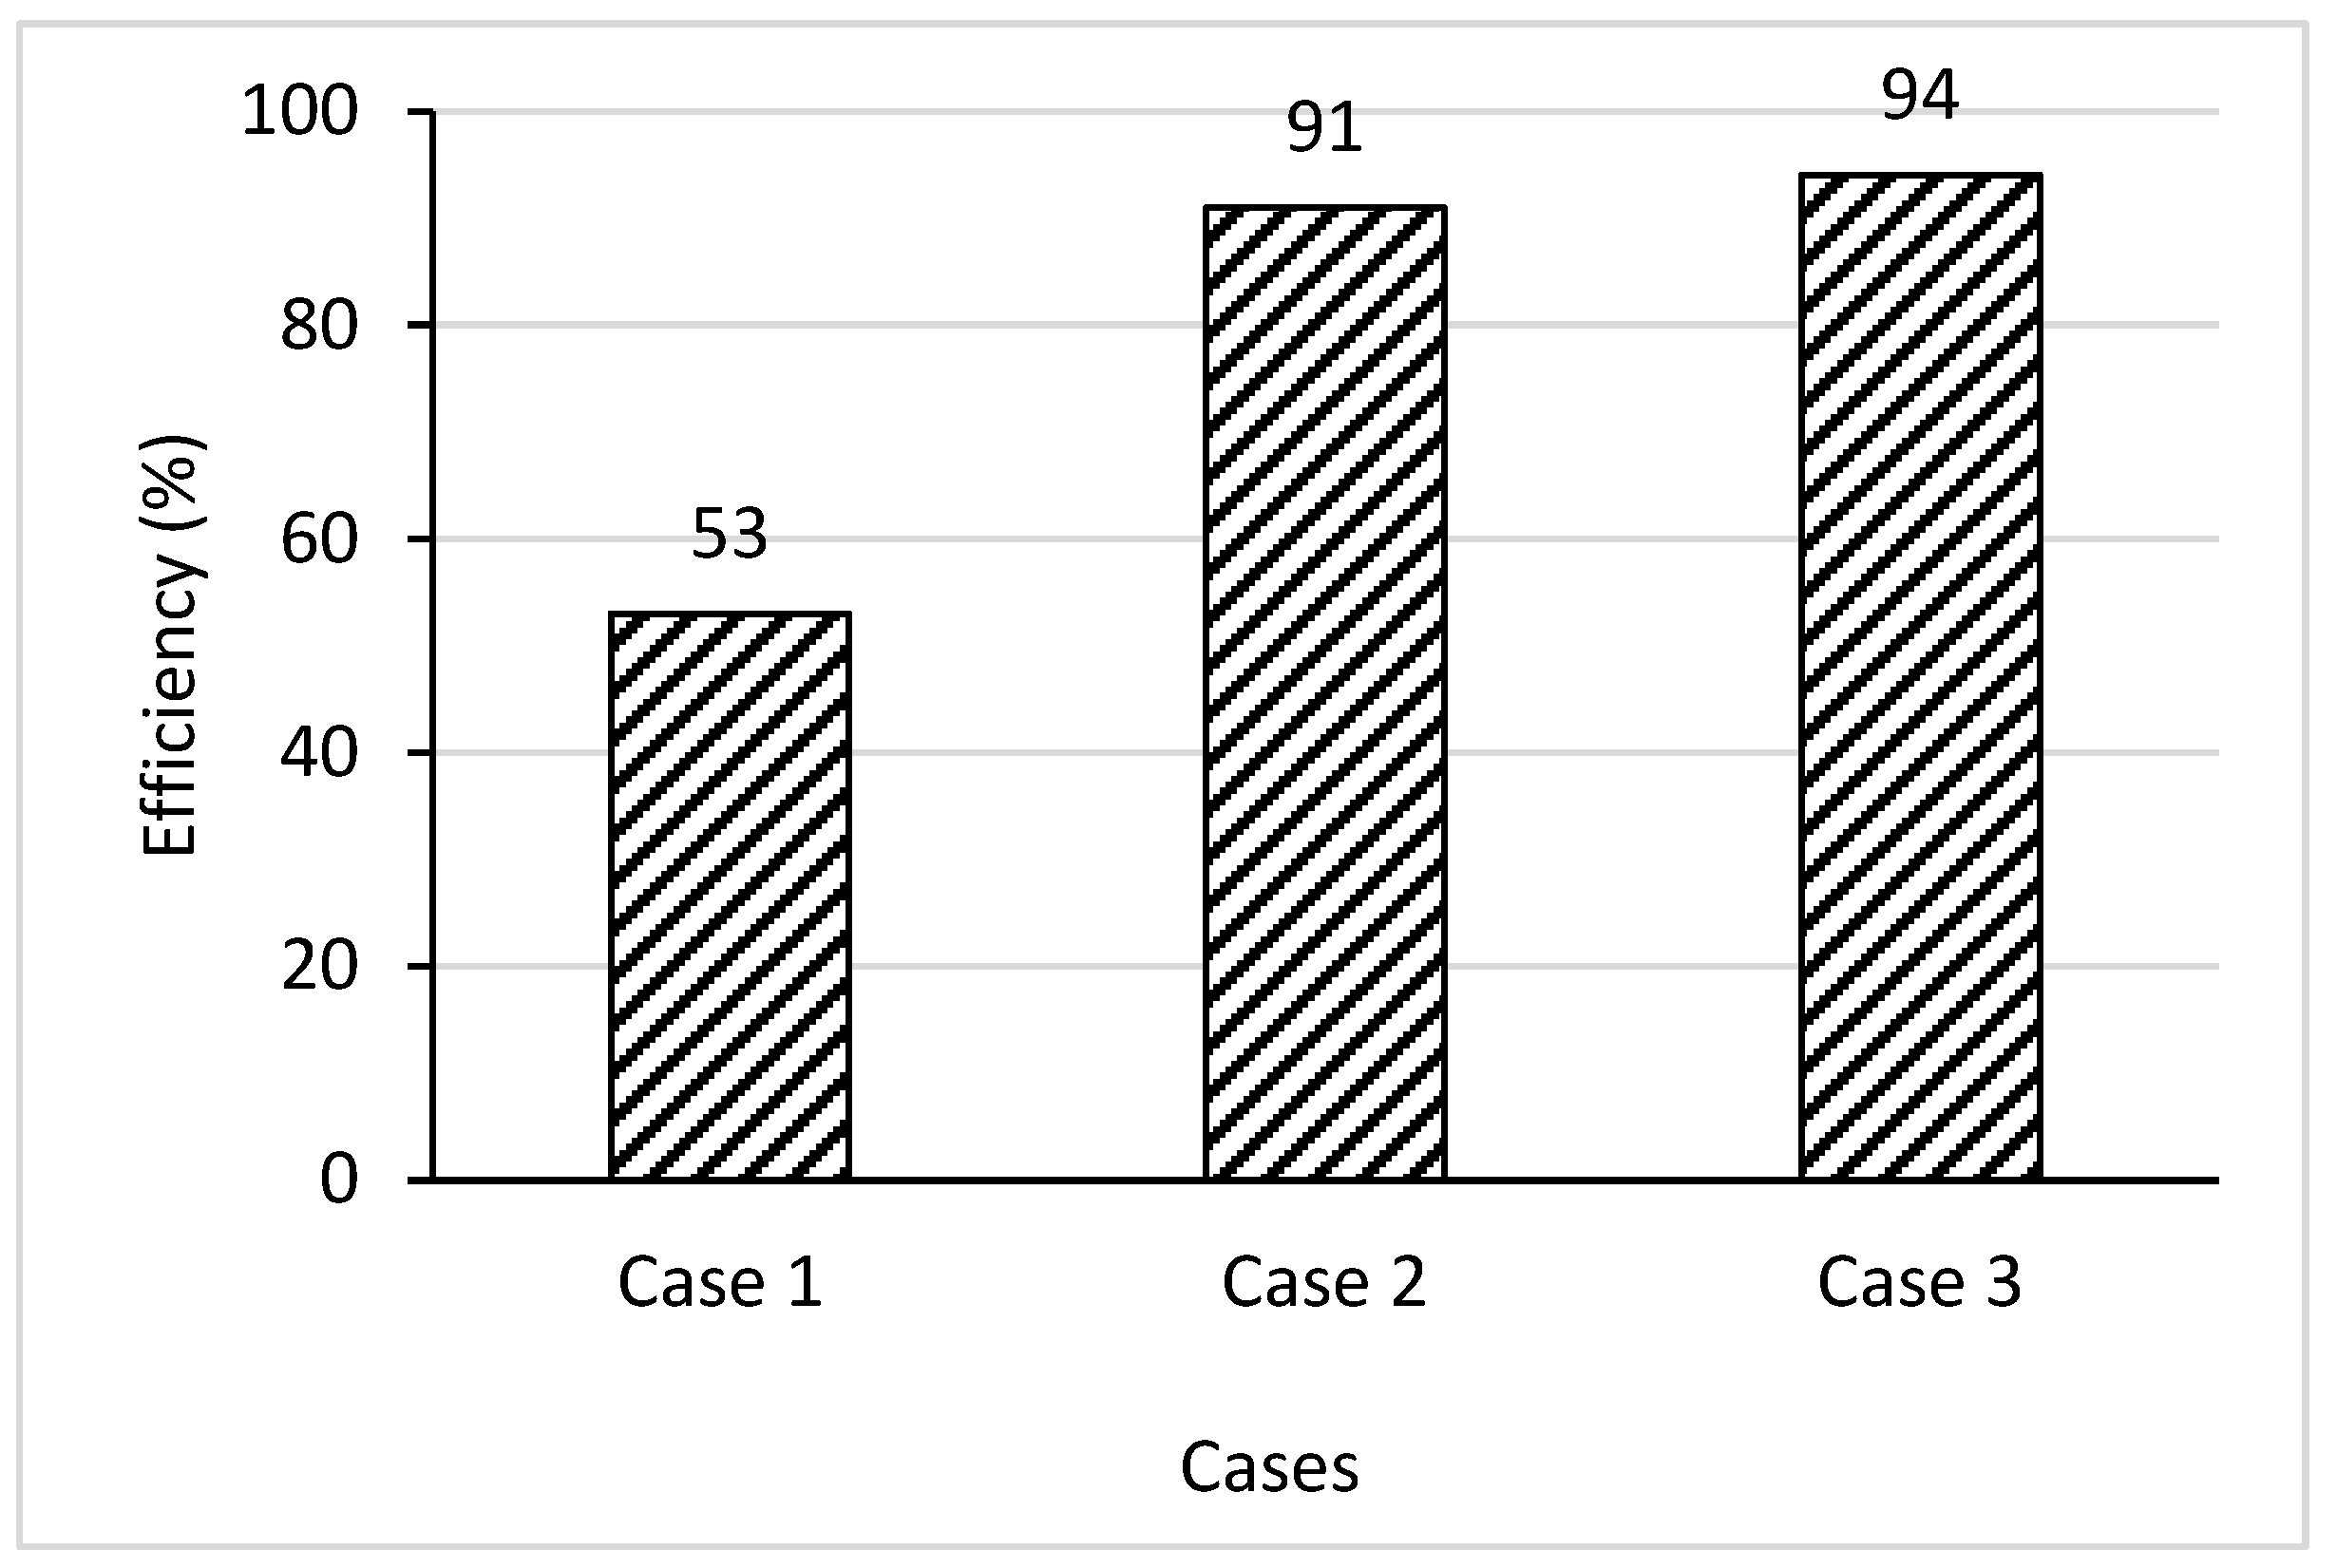
4.4. Case Study: Influence of Different Main Parameters

An additional test to observe the effect of the key parameters is shown in Figure 4. Methane production was compared among different cases for food waste, using the composition studied by [26], for anaerobic digestion at 55 °C, but with changes to the key parameters, as shown in Table 4. The simulated cases include as their input different changes in the key parameters as compared with the adjustment of each key parameter.
The efficiency of each case was evaluated according to Equation (18). A theoretical approach representing the maximum yield was found to give a value of 0.673 L/g for VS [43]. The yield for the different cases is presented as a percentage of the maximal potential in Figure 4.
E f f i c i e n c y = P r e d i c t e d   y i e l d   c a s e   1 ,   2   o r   3 T h e o r e t i c a l   y i e l d   0.673 L g
The results obtained for the first case are due to the use of unfavourable random conditions as inputs. Case 2 shows improved results by making the first adjustment over the temperature, while in Case 3, the adjustment is carried out to the HRT. As shown in Figure 4, Case 2 achieves the optimal value of methane yield. In Case 3, the yield increases by about 3% as compared with Case 2, but this configuration requires higher resources in terms of time and space for the reaction; however, it is shown that half of the HRT could achieve a similar result in terms of improving the media temperature (relative to Case 2). A local sensitivity analysis could be applied to the other parameters so as to increase the yield of the anaerobic digestion for a specific feedstock.

5. Conclusions

It is essential for designers of anaerobic reactors to identify the key parameters of anaerobic digestion. It appears that biogas production from organic waste is dependent on operating parameters. The objective of this study is to develop a mathematical model for the prediction of fish waste digestion. A global sensitivity analysis was applied to this prediction model, based on the Sobol index method, in order to identify the most influential parameters and interactions, because ranking the most influential parameters is important for the design and operation of an anaerobic reactor. The results obtained by applying GSA to a nonlinear model for anaerobic digestion show that the lipid content is the most influencing parameter, with a total Sobol index of 37.2%, followed by the effect of temperature and HRT with almost the same index (27.5% and 26.3%, respectively). These three parameters are identified as the key parameters for predicting the performance of methane production. The correct selection of the key operational parameters improves the performance of anaerobic digestion, increasing the production from 53% to 94% and ensuring robustness in the reaction in the case of changes to the other parameters. The effect of pH is negligible here because of the small pH range selected in this study. Usually, the pH varies between 6.5 and 8.5 in the literature in order to ensure a considerable activity of the microorganisms. An increase in the acidity of the media can promote an inhibition and a drop in the biogas production. Moreover, it is very important to keep watch over the HRT, because a high HRT can imply an increase in the acidity of the media.

Author Contributions

Conceptualization, L.A. and L.E.; methodology, B.T., L.A., L.E. and L.V.-H.; software, L.A., A.M. and L.V.-H.; validation, L.A., L.E. and L.V.-H.; formal analysis, L.A., L.E. and L.V.-H.; investigation, C.M., L.A., A.M. and L.V.-H.; resources, L.A., A.M., L.E. and L.V.-H.; data curation, L.A., L.E. and L.V.-H.; writing—original draft preparation, L.A. and A.M.; writing—review and editing, L.A., A.M. and L.V.-H.; visualization, L.A.; supervision, L.A.; project administration, L.A. and L.E.; funding acquisition, L.A. and L.E. All authors have read and agreed to the published version of the manuscript.

Funding

This work was done within the GENCOMM project. GENCOMM is co-funded by the European Union through the INTERREG NWE program.

Institutional Review Board Statement

Not applicable.

Informed Consent Statement

Not applicable.

Conflicts of Interest

The authors declare no conflict of interest.

Nomenclature

AAAmino acids
ac BButyric acid
ac PPropionic acid
ac VValeric acid
ADAnaerobic digester
ADM1Anaerobic Digestion Model No.1
CarbCarbohydrate
DSTDecision support tool
GSAGlobal sensitivity analysis
GTOGlycerol trioleate
HAcAcetic acid
HRTHydraulic retention time (day)
iConcentration for component i (g·L−1)
ka,iEquilibrium constant for the component i (day−1)
Ki,iInhibitor concentration coefficient due to component i (day−1)
Ks,iHalf saturation coefficient for component i (g·L−1)
LCFALong chain fatty acids
pHLLpH Lower Limit for 50% inhibition (according to ADM1 model)
qliqLiquid flow rate (L·s−1)
SSubtract concentration (g·L−1)
SiFirst-order sensitivity index
SiintInteraction sensitivity index
SiTOTTotal sensitivity index
STCStandard thermodynamic conditions (293.15K, 101.325 kPa)
VFAVolatile fatty acids (wt%)
VliqLiquid volume (L)
VSVolatile solids (wt%)
Xin,iInitial concentration of component i (g·L−1)
Xt,iConcentration time t for the component i (g·L−1)
νi,jStoichiometric coefficients for component i on the reaction j
ρjKinetic rate equation (g·L−1·s−1)
pHULUpper limit for pH
μi,Reactional rate for component i (day−1)
μi,maxMaximal reactional rate for component i (day−1)
μmaxMaximal reactional rate (day−1)
[T-NH3]Total ammonia concentration (g·L−1)

References

  1. Gedminaitė-Raudonė, Ž.; Lankauskienė, R.; Simonaitytė, V. Pathway to Green Transformation in Lithuania: Biogas Production from Manure and Waste. Energies 2022, 15, 2989. [Google Scholar] [CrossRef]
  2. Weiland, P. Biogas Production: Current State and Perspectives. Appl. Microbiol. Biotechnol. 2010, 85, 849–860. [Google Scholar] [CrossRef] [PubMed]
  3. Yerassyl, D.; Jin, Y.; Zhanar, S.; Aigul, K.; Saltanat, Y. The Current Status and Lost Biogas Production Potential of Kazakhstan from Anaerobic Digestion of Livestock and Poultry Manure. Energies 2022, 15, 3270. [Google Scholar] [CrossRef]
  4. Anuta, O.H.; Taylor, P.; Jones, D.; McEntee, T.; Wade, N. An International Review of the Implications of Regulatory and Electricity Market Structures on the Emergence of Grid Scale Electricity Storage. Renew. Sustain. Energy Rev. 2014, 38, 489–508. [Google Scholar] [CrossRef] [Green Version]
  5. Zerta, M.; Schmidt, P.R.; Stiller, C.; Landinger, H. Alternative World Energy Outlook (AWEO) and the Role of Hydrogen in a Changing Energy Landscape. Int. J. Hydrog. Energy 2008, 33, 3021–3025. [Google Scholar] [CrossRef]
  6. Chin, V.J.; Salam, Z.; Ishaque, K. Cell Modelling and Model Parameters Estimation Techniques for Photovoltaic Simulator Application: A Review. Appl. Energy 2015, 154, 500–519. [Google Scholar] [CrossRef]
  7. Ciulla, G.; D’Amico, A.; Di Dio, V.; Lo Brano, V. Modelling and Analysis of Real-World Wind Turbine Power Curves: Assessing Deviations from Nominal Curve by Neural Networks. Renew. Energy 2019, 140, 477–492. [Google Scholar] [CrossRef]
  8. Murillo-Roos, M.; Uribe-Lorío, L.; Fuentes-Schweizer, P.; Vidaurre-Barahona, D.; Brenes-Guillén, L.; Jiménez, I.; Arguedas, T.; Liao, W.; Uribe, L. Biogas Production and Microbial Communities of Mesophilic and Thermophilic Anaerobic Co-Digestion of Animal Manures and Food Wastes in Costa Rica. Energies 2022, 15, 3252. [Google Scholar] [CrossRef]
  9. Colmenar-Santos, A.; Bonilla-Gómez, J.-L.; Borge-Diez, D.; Castro-Gil, M. Hybridization of Concentrated Solar Power Plants with Biogas Production Systems as an Alternative to Premiums: The Case of Spain. Renew. Sustain. Energy Rev. 2015, 47, 186–197. [Google Scholar] [CrossRef]
  10. Xie, S.; Hai, F.I.; Zhan, X.; Guo, W.; Ngo, H.H.; Price, W.E.; Nghiem, L.D. Anaerobic Co-Digestion: A Critical Review of Mathematical Modelling for Performance Optimization. Bioresour. Technol. 2016, 222, 498–512. [Google Scholar] [CrossRef]
  11. Hartmann, H.; Ahring, B.K. Anaerobic Digestion of the Organic Fraction of Municipal Solid Waste: Influence of Co-Digestion with Manure. Water Res. 2005, 39, 1543–1552. [Google Scholar] [CrossRef] [PubMed] [Green Version]
  12. Luna-delRisco, M.; Normak, A.; Orupõld, K. Biochemical Methane Potential of Different Organic Wastes and Energy Crops from Estonia. Agron. Res. 2011, 9, 331–342. [Google Scholar]
  13. Lüthi, C. Anaerobic Digestion of Biowaste in Developing Countries Practical Information and Case Studies; Eawag-Sandec: Dübendorf, Switzerland, 2014; ISBN 978-3-906484-58-7. [Google Scholar]
  14. Batstone, D.J.; Keller, J.; Angelidaki, I.; Kalyuzhnyi, S.V.; Pavlostathis, S.G.; Rozzi, A.; Sanders, W.T.M.; Siegrist, H.; Vavilin, V.A. The IWA Anaerobic Digestion Model No 1 (ADM1). Water Sci. Technol. 2002, 45, 65–73. [Google Scholar] [CrossRef]
  15. Angelidaki, I.; Ellegaard, L.; Ahring, B.K. A Comprehensive Model of Anaerobic Bioconversion of Complex Substrates to Biogas. Biotechnol. Bioeng. 1999, 63, 363–372. [Google Scholar] [CrossRef]
  16. Flotats, X.; Palatsi, J.; Ahring, B.K.; Angelidaki, I. Identifiability Study of the Proteins Degradation Model, Based on ADM1, Using Simultaneous Batch Experiments. Water Sci. Technol. 2006, 54, 31–39. [Google Scholar] [CrossRef]
  17. Angelidaki, I.; Ahring, B.K. Effects of Free Long-Chain Fatty Acids on Thermophilic Anaerobic Digestion. Appl. Microbiol. Biotechnol. 1992, 37. [Google Scholar] [CrossRef]
  18. Angelidaki, I.; Ahring, B.K. Thermophilic Anaerobic Digestion of Livestock Waste: The Effect of Ammonia. Appl. Microbiol. Biotechnol. 1993, 38. [Google Scholar] [CrossRef]
  19. Blumensaat, F.; Keller, J. Modelling of Two-Stage Anaerobic Digestion Using the IWA Anaerobic Digestion Model No. 1 (ADM1). Water Res. 2005, 39, 171–183. [Google Scholar] [CrossRef]
  20. Thamsiriroj, T.; Murphy, J.D. Modelling Mono-Digestion of Grass Silage in a 2-Stage CSTR Anaerobic Digester Using ADM1. Bioresour. Technol. 2011, 102, 948–959. [Google Scholar] [CrossRef]
  21. Ochoa, M.P.; Estrada, V.; Di Maggio, J.; Hoch, P.M. Dynamic Global Sensitivity Analysis in Bioreactor Networks for Bioethanol Production. Bioresour. Technol. 2016, 200, 666–679. [Google Scholar] [CrossRef]
  22. Vaneeckhaute, C.; Remigi, E.; Tack, F.M.G.; Meers, E.; Belia, E.; Vanrolleghem, P.A. Optimizing the Configuration of Integrated Nutrient and Energy Recovery Treatment Trains: A New Application of Global Sensitivity Analysis to the Generic Nutrient Recovery Model (NRM) Library. Bioresour. Technol. 2018, 269, 375–383. [Google Scholar] [CrossRef] [PubMed]
  23. Zhang, K.; Jiang, X. An Assessment of Fuel Variability Effect on Biogas-Hydrogen Combustion Using Uncertainty Quantification. Int. J. Hydrog. Energy 2018, 43, 12499–12515. [Google Scholar] [CrossRef]
  24. Eiroa, M.; Costa, J.C.; Alves, M.M.; Kennes, C.; Veiga, M.C. Evaluation of the Biomethane Potential of Solid Fish Waste. Waste Manag. 2012, 32, 1347–1352. [Google Scholar] [CrossRef] [Green Version]
  25. Gannoun, H.; Othman, N.B.; Bouallagui, H.; Moktar, H. Mesophilic and Thermophilic Anaerobic Co-Digestion of Olive Mill Wastewaters and Abattoir Wastewaters in an Upflow Anaerobic Filter. Ind. Eng. Chem. Res. 2007, 46, 6737–6743. [Google Scholar] [CrossRef]
  26. Kafle, G.K.; Kim, S.H.; Sung, K.I. Ensiling of Fish Industry Waste for Biogas Production: A Lab Scale Evaluation of Biochemical Methane Potential (BMP) and Kinetics. Bioresour. Technol. 2013, 127, 326–336. [Google Scholar] [CrossRef] [PubMed]
  27. Zhang, R.; Elmashad, H.; Hartman, K.; Wang, F.; Liu, G.; Choate, C.; Gamble, P. Characterization of Food Waste as Feedstock for Anaerobic Digestion. Bioresour. Technol. 2007, 98, 929–935. [Google Scholar] [CrossRef] [PubMed]
  28. Bagi, Z.; Ács, N.; Bálint, B.; Horváth, L.; Dobó, K.; Perei, K.R.; Rákhely, G.; Kovács, K.L. Biotechnological Intensification of Biogas Production. Appl. Microbiol. Biotechnol. 2007, 76, 473–482. [Google Scholar] [CrossRef]
  29. Brulé, M.; Oechsner, H.; Jungbluth, T. Exponential Model Describing Methane Production Kinetics in Batch Anaerobic Digestion: A Tool for Evaluation of Biochemical Methane Potential Assays. Bioprocess Biosyst. Eng. 2014, 37, 1759–1770. [Google Scholar] [CrossRef]
  30. Costello, D.J.; Greenfield, P.F.; Lee, P.L. Dynamic Modelling of a Single-Stage High-Rate Anaerobic Reactor—I. Model Derivation. Water Res. 1991, 25, 847–858. [Google Scholar] [CrossRef]
  31. Han, K.; Levenspiel, O. Extended Monod Kinetics for Substrate, Product, and Cell Inhibition. Biotechnol. Bioeng. 1988, 32, 430–447. [Google Scholar] [CrossRef]
  32. Bekins, B.A.; Warren, E.; Godsy, E.M. A Comparison of Zero-Order, First-Order, and Monod Biotransformation Models. Ground Water 1998, 36, 261–268. [Google Scholar] [CrossRef]
  33. Ramirez, I.; Mottet, A.; Carrère, H.; Déléris, S.; Vedrenne, F.; Steyer, J.-P. Modified ADM1 Disintegration/Hydrolysis Structures for Modeling Batch Thermophilic Anaerobic Digestion of Thermally Pretreated Waste Activated Sludge. Water Res. 2009, 43, 3479–3492. [Google Scholar] [CrossRef] [PubMed]
  34. Vavilin, V.A.; Fernandez, B.; Palatsi, J.; Flotats, X. Hydrolysis Kinetics in Anaerobic Degradation of Particulate Organic Material: An Overview. Waste Manag. 2008, 28, 939–951. [Google Scholar] [CrossRef] [PubMed]
  35. Al Seadi, T.; Rutz, D.; Prassl, H.; Köttner, M.; Finsterwalder, T.; Volk, S.; Janssen, R. Biogas Handbook; University of Southern Denmark Esbjerg: Esbjerg, Denmark, 2008; ISBN 978-87-992962-0-0. [Google Scholar]
  36. Miron, Y. The Role of Sludge Retention Time in the Hydrolysis and Acidification of Lipids, Carbohydrates and Proteins during Digestion of Primary Sludge in CSTR Systems. Water Res. 2000, 34, 1705–1713. [Google Scholar] [CrossRef]
  37. Angelidaki, I.; Ellegaard, L.; Ahring, B.K. A Mathematical Model for Dynamic Simulation of Anaerobic Digestion of Complex Substrates: Focusing on Ammonia Inhibition. Biotechnol. Bioeng. 1993, 42, 159–166. [Google Scholar] [CrossRef]
  38. Serrano, R.P. Biogas Process Simulation Using Aspen Plus; Department of Chemical Engineering, Biotechnology and Environmental Technology, University of Southern Denmark: Odense, Denmark, 2011. [Google Scholar]
  39. Sun, H.; Wu, S.; Dong, R. Monitoring Volatile Fatty Acids and Carbonate Alkalinity in Anaerobic Digestion: Titration Methodologies. Chem. Eng. Technol. 2016, 39, 599–610. [Google Scholar] [CrossRef]
  40. Shi, E.; Li, J.; Zhang, M. Application of IWA Anaerobic Digestion Model No. 1 to Simulate Butyric Acid, Propionic Acid, Mixed Acid, and Ethanol Type Fermentative Systems Using a Variable Acidogenic Stoichiometric Approach. Water Res. 2019, 161, 242–250. [Google Scholar] [CrossRef]
  41. Ahring, B.K. (Ed.) Advances in Biochemical Engineering/Biotechnology; Springer: Berlin/Heidelberg, Germany, 2003; ISBN 978-3-540-44322-3. [Google Scholar]
  42. Sobol’, I.M. Global Sensitivity Indices for Nonlinear Mathematical Models and Their Monte Carlo Estimates. Math. Comput. Simul. 2001, 55, 271–280. [Google Scholar] [CrossRef]
  43. Angelidaki, I.; Sanders, W. Assessment of the Anaerobic Biodegradability of Macropollutants. Rev. Environ. Sci. Biotechnol. 2004, 3, 117–129. [Google Scholar] [CrossRef]
  44. Kafle, G.K.; Kim, S.H. Evaluation of the Biogas Productivity Potential of Fish Waste: A Lab Scale Batch Study. J. Biosyst. Eng. 2012, 37, 302–313. [Google Scholar] [CrossRef] [Green Version]
Figure 1. Model validation with a theoretical approach [43] and experimental [26] results.
Fuels 03 00027 g001
Figure 2. (SiTOT) Total sensitivity index, (Si) first-order sensitivity index, and (Siint) interaction sensitivity index for each evaluated parameter.
Fuels 03 00027 g002
Figure 3. Effect of HRT on methane yield.
Fuels 03 00027 g003
Figure 4. Efficiency of different cases studied.
Fuels 03 00027 g004
Table 1. Rate law expressions for the AD steps [14,15].
ConversionRate Law (Day−1)
Acidogenesis step (Amino acid degradation) μ A A = μ A A   max T 1 1 + K s , A A A A
Acidogenesis step (Glucose degradation) μ c a r b = μ c a r b max T 1 1 + K s , c a r b T C a r b 1 1 + K s , N H 3 T T N H 3 1 1 + L C F A K i , L C F A
Acidogenesis step (Lipolytic degradation) μ L i p i d = μ L i p i d max T 1 1 + K s , G T O T G T O 1 1 + K s , N H 3 T N H 3 1 1 + L C F A K i , L C F A
Acetogenesis step (VFA–Propionate acid, butyrate acid, valerate acid degradation) μ V F A = μ V F A max T 1 1 + K s , a c i d T V F A 1 1 + K s , N H 3 T N H 3 1 1 + H A c K i , H A c 1 1 + L C F A K i , L C F A
Acetogenesis step (LCFA degradation) μ L C F A = μ L C F A   max T 1 1 + K s , L C F A L C F A + L C F A K i , L C F A 1 1 + K s , N H 3 T N H 3
Methanogenesis step μ H A c = μ H A c max T 1 1 + K s , H A c T H A c 1 1 + K s , N H 3 T N H 3 1 1 + N H 3 K i , N H 3 1 1 + L C F A K i , L C F A
Table 2. Acid/base equilibrium reactions included in the model to calculate the pH.
Intermediate MoleculeEquilibriumEquilibrium Expression
Ammonium N H 3 + H 2 O   N H 4 + + O H k N H 3 = N H 4 + O H N H 3
Acetic acid C H 3 C O O H   H + + C H 3 C O O k a , H A c = H + C H 3 C O O C H 3 C O O H
Propionic acid C H 3 C H 2 C O O H   H + + C H 3 C H 2 C O O k a , a c   P = H + C 3 H 5 O 2 C 3 H 6 O 2
Butiryc acid C H 3 C H 2 C H 2 C O O H   H + + C H 3 C H 2 C H 2 C O O k a , a c   B = H + C 4 H 7 O 2 C 4 H 8 O 2
Valeric acid C H 3 C H 2 C H 2 C H 2 C O O H   H + + C H 3 C H 2 C H 2 C H 2 C O O k a , a c   V = H + C 5 H 9 O 2 C 5 H 10 O 2
Table 3. Parameters and their ranges considered for the GSA for the bioreactor.
ParameterLower LimitUpper LimitReference
Operating parameterHRT (day)160[26]
Acidity (pH)6.58.5[26]
Temperature (K)318.15338.15[11]
Substrate compositionLipids (g·L−1)010[44]
Carbohydrates (g·L−1)010[44]
Proteins (g·L−1)010[44]
Table 4. Input values for case studies.
Case 1Case 2Case 3
Operating parametersHRT (Day)24.324.346.3
pH7.07.07.0
Temperature (°C)505555
Composition of feedstockLipid (g·L−1)4.74.74.7
Carbohydrates (g·L−1)0.00.00.0
Protein (g·L−1)4.04.04.0
Publisher’s Note: MDPI stays neutral with regard to jurisdictional claims in published maps and institutional affiliations.

