Article

Machine Learning-Assisted Characterization of Pore-Induced Variability in Mechanical Response of Additively Manufactured Components

Department of Mechanical Engineering, University of Alberta, Edmonton, AB T6G 2R3, Canada
*
Author to whom correspondence should be addressed.
Modelling 2024, 5(1), 1-15; https://doi.org/10.3390/modelling5010001
Submission received: 26 November 2023 / Revised: 14 December 2023 / Accepted: 17 December 2023 / Published: 19 December 2023

Abstract

:
Manufacturing defects, such as porosity and inclusions, can significantly compromise the structural integrity and performance of additively manufactured parts by acting as stress concentrators and potential initiation sites for failure. This paper investigates the effects of pore system morphology (number of pores, total volume, volume fraction, and standard deviation of size of pores) on the material response of additively manufactured Ti6Al4V specimens under a shear–compression stress state. An automatic approach for finite element simulations, using the J2 plasticity model, was utilized on a shear–compression specimen with artificial pores of varying characteristics to generate the dataset. An artificial neural network (ANN) surrogate model was developed to predict peak force and failure displacement of specimens with different pore attributes. The ANN demonstrated effective prediction capabilities, offering insights into the importance of individual input variables on mechanical performance of additively manufactured parts. Additionally, a sensitivity analysis using the Garson equation was performed to identify the most influential parameters affecting the material’s behaviour. It was observed that materials with more uniform pore sizes exhibit better mechanical properties than those with a wider size distribution. Overall, the study contributes to a better understanding of the interplay between pore characteristics and material response, providing better defect-aware design and property–porosity linkage in additive manufacturing processes.

1. Introduction

In recent years, additive manufacturing (AM) has shown great potential in the creation of highly complex geometries, thus reducing manufacturing constraints in comparison to traditional manufacturing processes. One significant advantage of AM is the process simplicity from design to installation, where the entire additive manufacturing process requires only a few steps, which results in increased productivity compared with traditional manufacturing processes [1,2,3,4,5,6]. Meanwhile, like in most manufacturing methods, the mechanical properties of final products made by AM can be negatively affected by manufacturing defects or flaws [7,8,9,10]. Therefore, it is crucial to continuously enhance processes and reduce the occurrence of defects that can have adverse impacts [11]. Among all the probable defects [10,12] of different AM processes [13], pores or voids [14] are commonly considered the most common defects [15,16,17] that can negatively impact the performance of the produced components [18,19,20]. The pore defects in AM parts can appear due to several mechanisms such as keyhole pore formation [21,22], pores resulting from lack of fusion [23,24], pores formed during gas atomization [25,26], escaping gas bubbles from the melt pool [27], etc. The resulting pores with varying sizes from nanoscale or macroscale [28] have a significant influence on the part’s mechanical and thermal properties [11,29,30].
The effect of pores on the mechanical performance of additively manufactured materials has been extensively studied [31,32]. In the past decade, advances in AM technology have made it possible to create parts with intricate internal features such as porosities or artificial pores, facilitating research in this area. The presence of pores in a component leads to stress concentrations, resulting in reduced strength, stiffness, and ductility [33,34]. The size, shape, and distribution of the voids can also affect the mechanical properties of the material [35]. Kim et al. [36] used X-ray computed tomography (XCT) to quantitatively and qualitatively analyse the pore structure in additively manufactured (AMed) cobalt–chrome alloy specimens with porosities ranging from 0.1% to 70%. Wilson-Heid et al. [37] studied the effect of pores on the tensile response of AMed 316L stainless steel. Artificial pores with different diameters were embedded in the samples, demonstrating that pores begin to influence ultimate tensile strength after reaching a certain diameter (2.4 mm or 16% of the sample’s cross-sectional area). Kotzem et al. [38] studied the fatigue properties of AMed 316L specimens with artificial defects and showed that the size and position of a single pore defect significantly impact the fatigue strength. In a series of studies, Fadida et al. [33,39,40,41] investigated the embedded pores under different loading conditions, namely tension [40], compression [41], shear–tension [39] and shear–compression [33]. They showed that the presence of voids has a detrimental effect on failure displacement. Similar results were reported from both quasi-static and dynamic tests. Meng et al. [42] investigated the effect of a single spherical pore defect on the tensile properties of AMed Ti6Al4V specimens. Pores with different diameters (0.1–1 mm) and at different locations (sub/near-surface) were considered, and it was shown that the embedded pores significantly influenced the tensile elongation while the elastic modulus and strength remained nearly unchanged. While the impact of pores on the mechanical performance of AMed materials under tension loads has been extensively studied [37,41,43], the behaviour under more complex stress states (e.g., shear-dominated stress states) has received comparatively less attention.
Several researchers have applied physics-based simulations, machine learning (ML), and data-driven techniques to investigate the mechanical behaviour of defect- and pore-containing parts [44,45,46,47,48,49]. Owing to the outstanding capabilities of ML models, handling large and complex datasets obtained from XCT or simulations of parts with pores is now possible. That is a necessary step towards identifying patterns and relationships which are incomprehensible by following traditional analytical models. Most of the published work in the literature employed ML models for the detection of manufacturing defects [50,51] and to estimate the mechanical properties of AMed specimens [52]. In this context, Machado et al. [53] developed a ML model based on the convolutional neural network to analyze the void content of optical microscopy images. Shen et al. [54] used ML for the prediction of plastic yield surface and macroscopic yield stress of porous materials. They trained the model with numerical results of simulations of samples with varied porosities and stress triaxialities showing, the accuracy and feasibility of the proposed method.
The reviewed research papers provide insights into either characterizing the morphology of pores or the role of pores on the mechanical behaviour of AMed specimens. However, it is important to note the lack of models used to identify morphology–property relationships for pore-containing materials. Addressing this gap, this paper introduces an approach using feedforward artificial neural networks (ANN) to develop a surrogate model of porous materials that considers parameters such as number (NOP), total (Vt) and average (Va) volume, volume fraction (Vf), and standard deviation of size (SD) of pores as the inputs to predict the mechanical response of AMed materials subjected to a shear-dominated stress state. The surrogate model is trained with a dataset generated with finite element simulations and then used for parametric sensitivity analysis to evaluate the most effective input parameters of a pore system on the mechanical performance of a part. We also discuss the potential applications and implications of this surrogate model in advancing the design and optimization of additive manufactured materials, particularly focusing on how understanding pore characteristics can lead to stronger and more reliable AM products. The importance of this work lies in its potential to improve material design in additive manufacturing, leading to advancements in their performance and durability.

2. Methods

Finite element (FE) simulations were conducted, and an ANN surrogate model was created to predict peak force and failure displacement based on pore system attributes. The geometry on the cylindrical specimen consists of a narrow-notched section with a 45° angle with respect to the loading direction and this promotes a shear–compression dominant stress state on the failure band. A shear–compression specimen based on the geometry proposed by Rittel et al. [55] was used to study the embedded voids. Figure 1a shows the specimen (h = 20 mm, d = 10 mm, and r = 1.5 mm, detailed dimensions are summarized in Table 1) consisting of a narrow-notched section with a 45° angle promoting a shear–compression dominant stress-state and failure band (A-A plane in Figure 1a), as reported by quasi-static and dynamic experiments in [33]. This allows for assessing the influence of pores on the fracture behaviour of the materials in a complex stress state by placing the artificial pores on the fracture surface [33]. We used this geometry to generate computer-generated synthetic Ti6Al4V specimens with porous regions on the failure surface with varying morphological structure parameters of the pores such as number, size, volume, location, and volume fraction of the pores. The section reports the methodological approaches used in the paper starting from describing the finite element model in Section 2.1, the routine for generation of the data set is explained in Section 2.2; finally, the structure of the ANN network is described in Section 2.3.

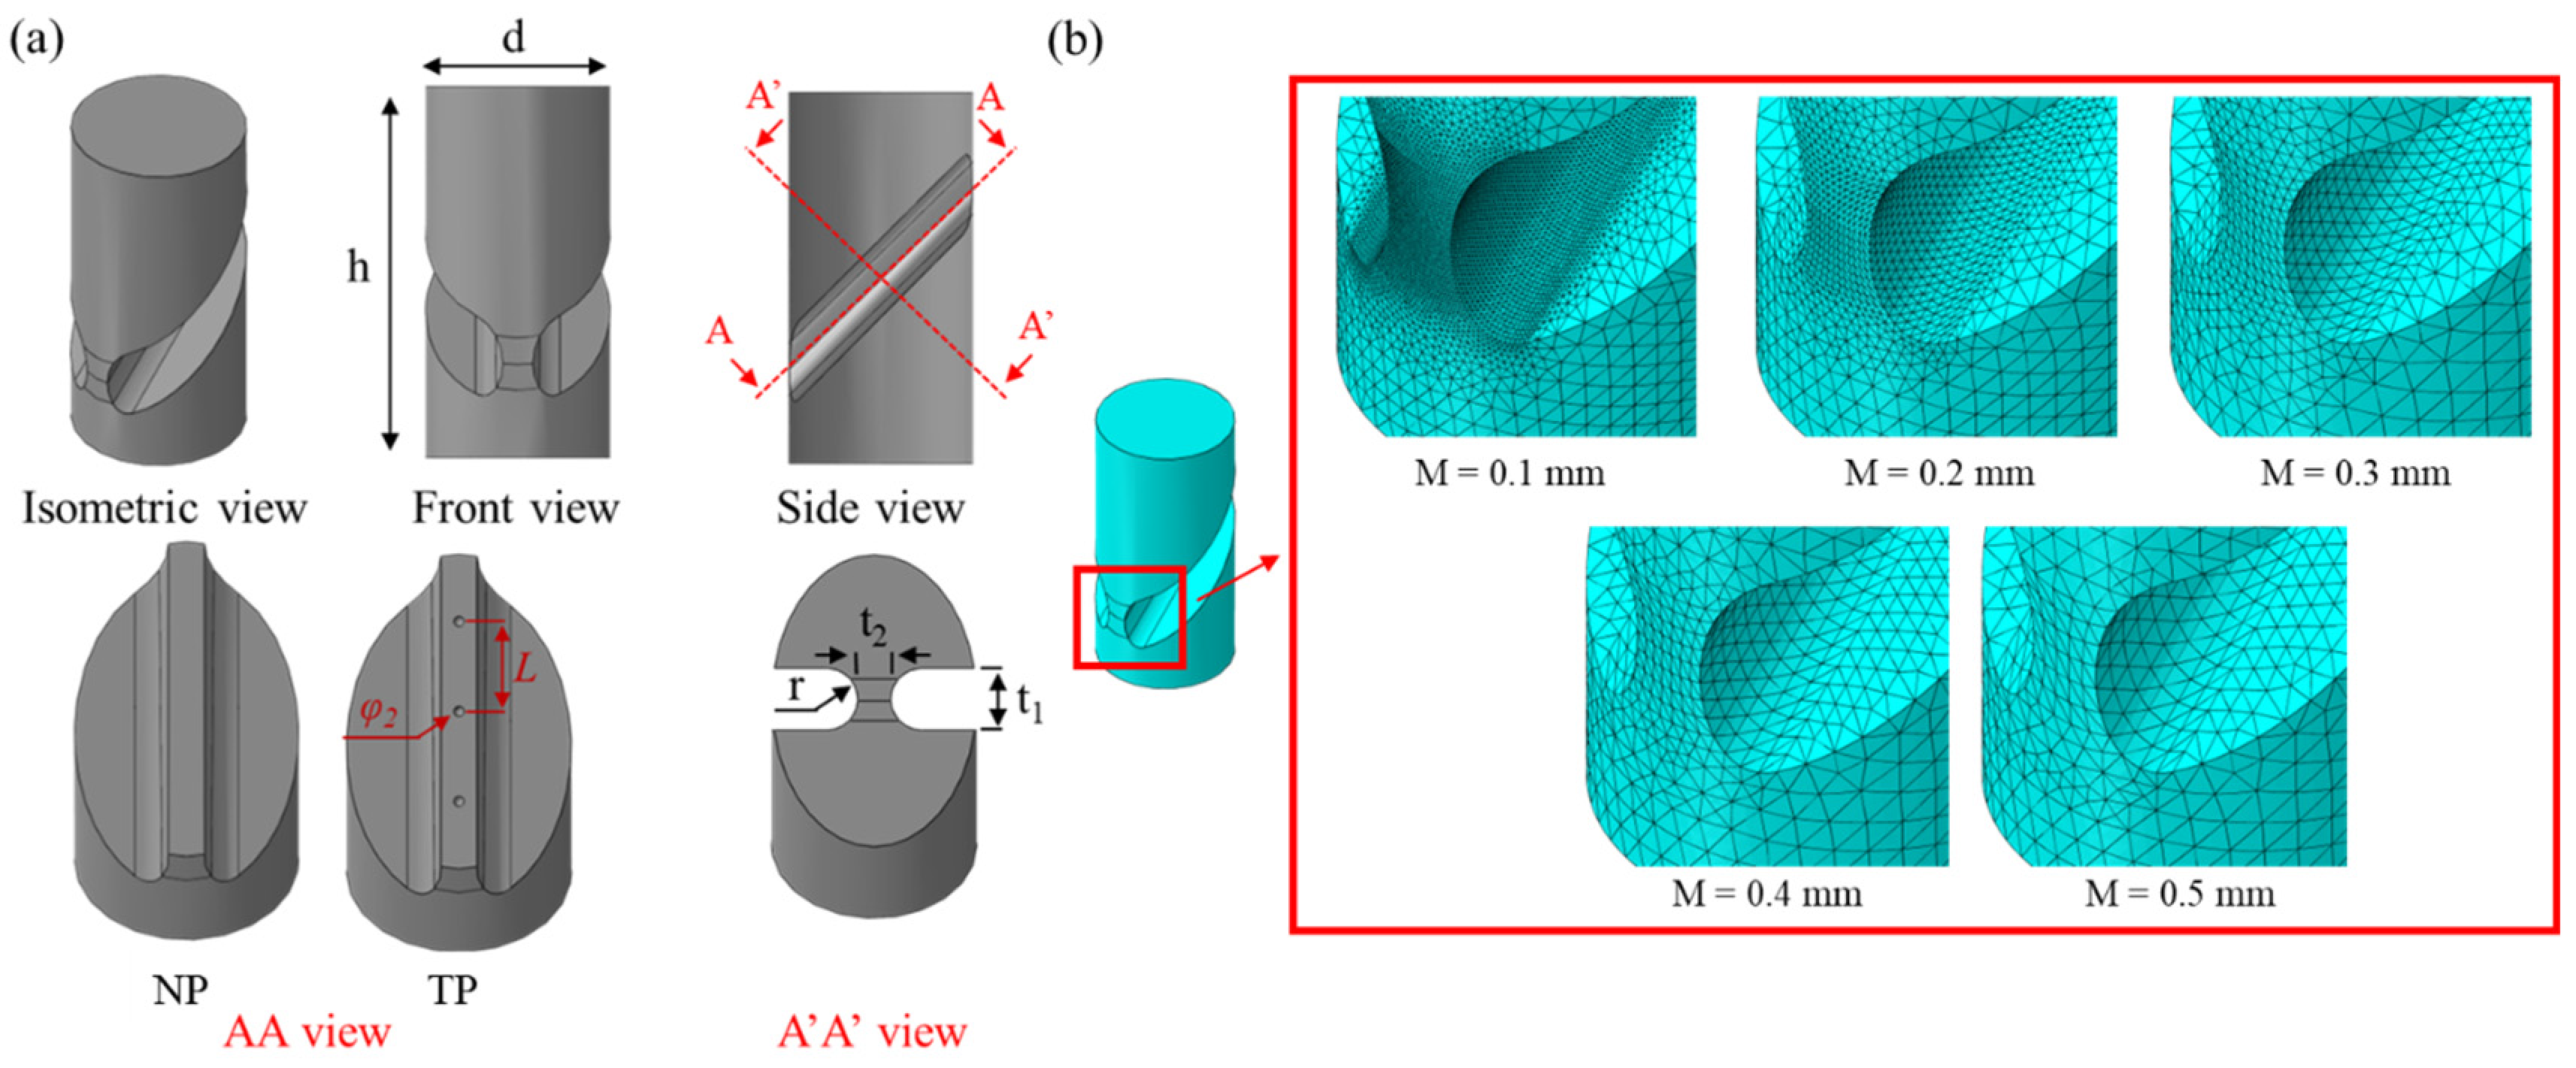
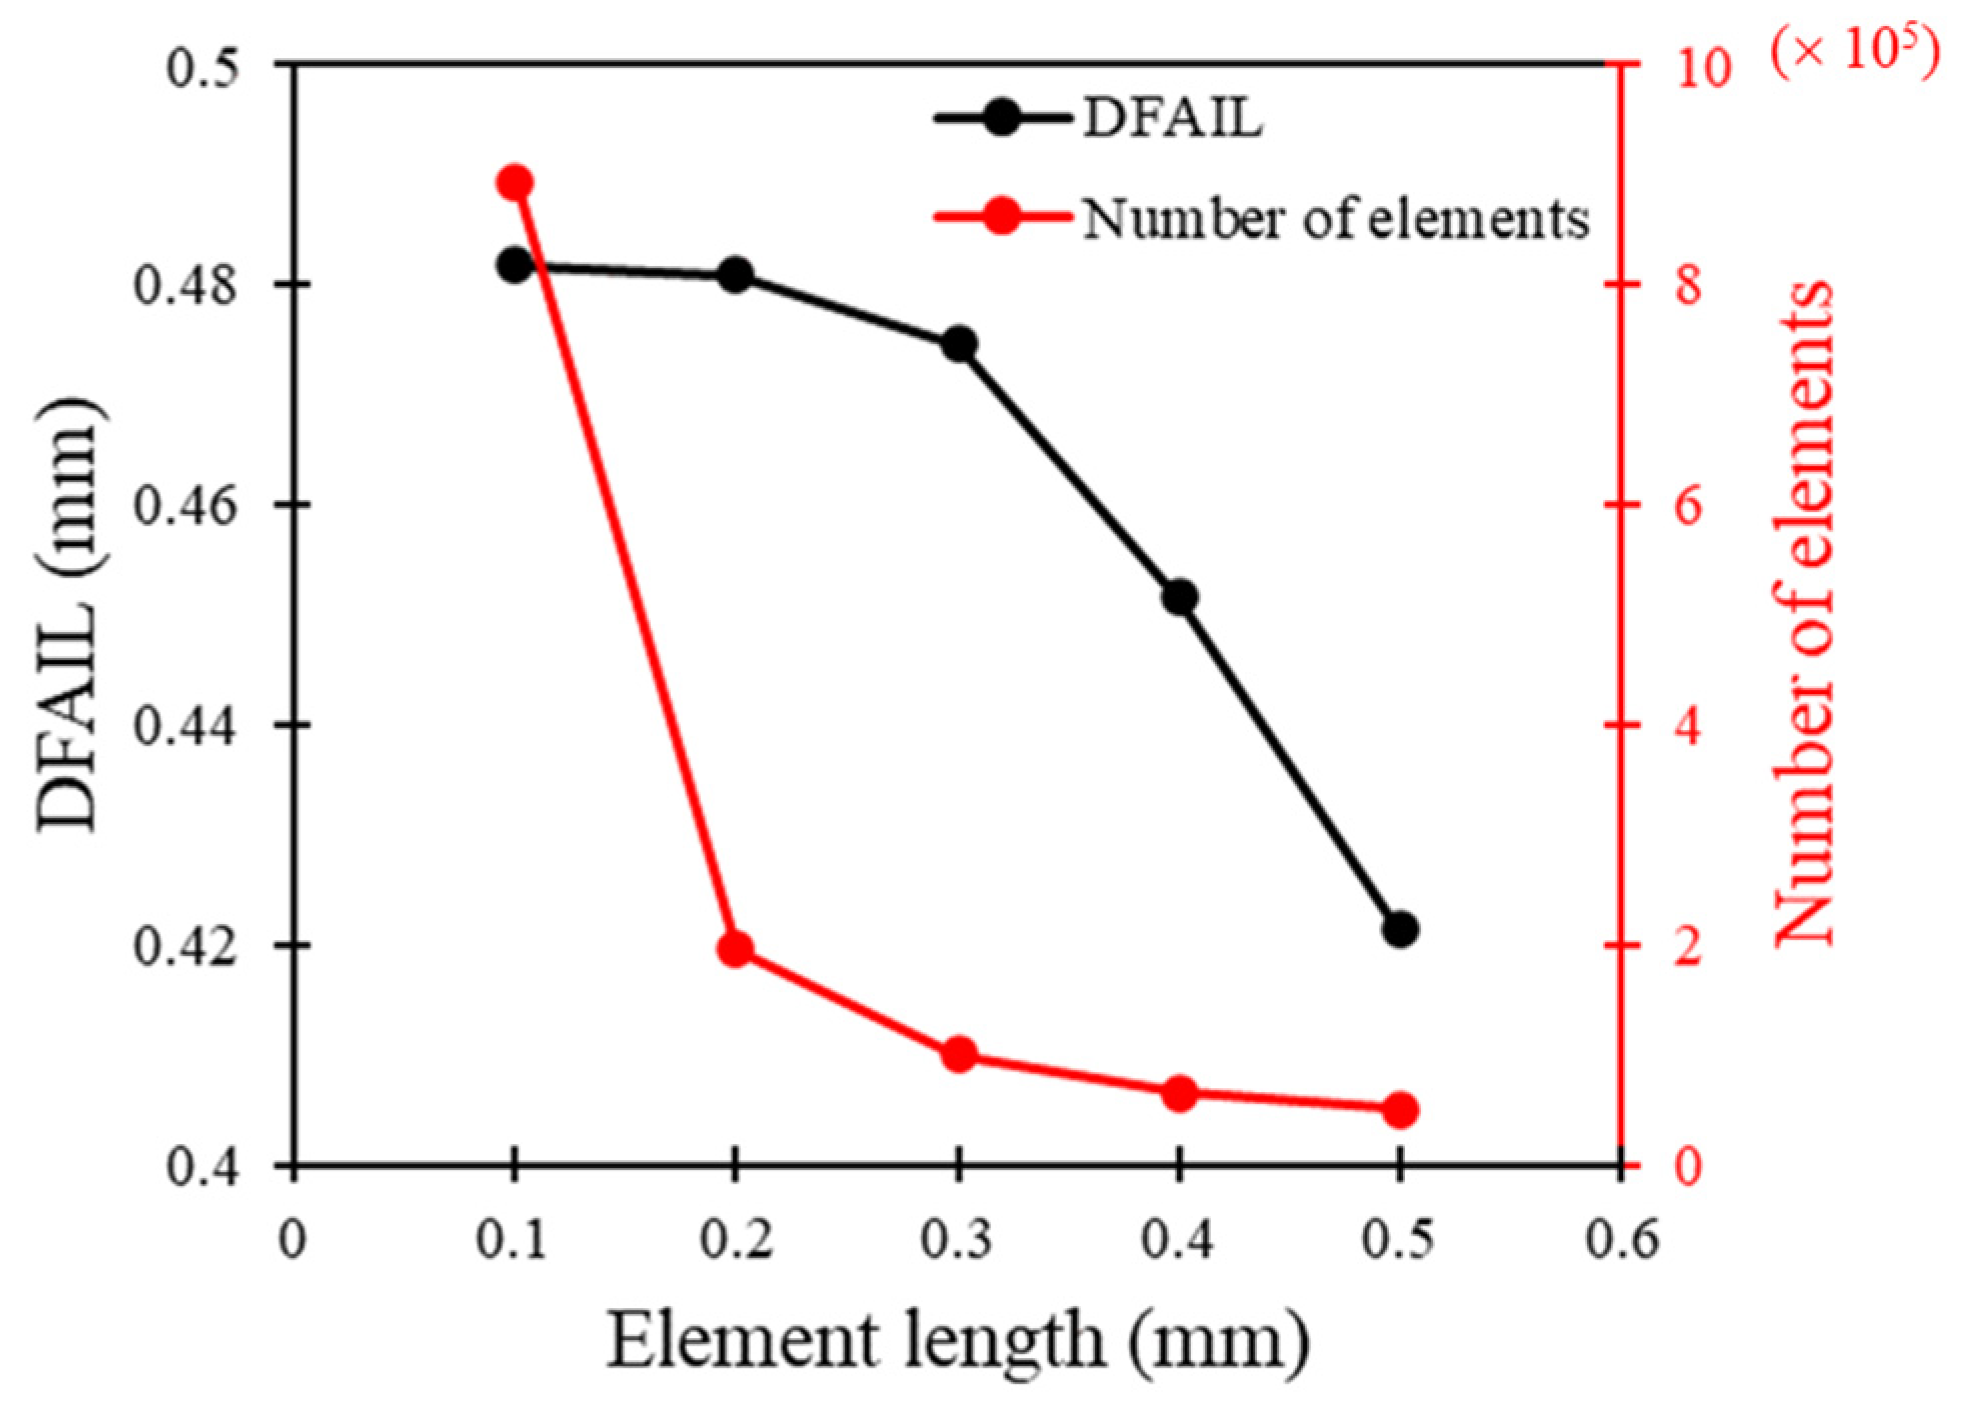
2.1. Finite Element Model

FEM has proven to be a valuable method for analysing the mechanical behaviour and performance of materials such as metals [20,56,57,58] and composites [59,60,61,62] under mechanical loads; therefore, it was used here to generate the dataset for the ML model. Figure 1a shows the 3D CAD model of the compression–shear specimen that was used to perform FEM using the Abaqus/Standard commercial solver [63]. The dimensions of the dense specimen (with no pores) are reported in Table 1 which is taken from the specimen geometry of [33]. In each model, a compression load was implemented by applying a displacement-controlled boundary condition on the top surface of the sample along with the cylinder axis under a quasi-static condition, and the bottom surface of the sample was fixed. The model was meshed with C3D10 (quadratic tetrahedral elements with 10 nodes), and a region of dense mesh (0.2 mm) was applied to the vicinity of the notch while a coarser mesh (0.7 mm) was applied to the rest of the specimen to achieve a desirable computational efficiency. Figure 1b shows five different models that were developed with different mesh sizes in the notched region to investigate the mesh sensitivity of the FE model. In all the porous models, the pores were imposed on the fracture surface (A-A plane in Figure 1a) and a mesh refinement was performed to ensure a consistent mesh size on the fracture surface of the samples. The numerical model was validated by comparison with experimental data on AMed Ti6Al4V samples from [33]. Moreover, Figure 1a shows the geometry of the models (dense model—NP, and the model with three artificial pores—TP) that were developed for validation. The model TP contained three spherical pores, each with a diameter of φ2 = 0.45 mm, and the distance between pores was equal to L = 4 mm, placed on a straight line with the central pore located on the centre of the fracture surface.
The behaviour of AMed Ti6Al4V material was expressed using J2 plasticity with an isotropic hardening model following Equation (1); the damage was implemented by employing the build-in definition of the ductile damage model in Abaqus, which has been shown to be accurate in predicting the damage response of compression–shear samples in the work of Fadida et al. [33] without considering the strain rate and stress triaxiality dependency.
σ = σ 0 + K ε p n
where ε p is the plastic strain, σ 0 is the yield stress (920 MPa [33]). K and n are constants equal to 395 and 0.345 [33]. In addition, equivalent fracture strains ( ε p e q ) at the initiation of damage, elastic modulus, and Poisson’s ratio, were set to 0.27, 117 GPa, and 0.34, respectively [33]. The numerical model was validated by comparison with experimental data on the AMed Ti6Al4V samples [33].

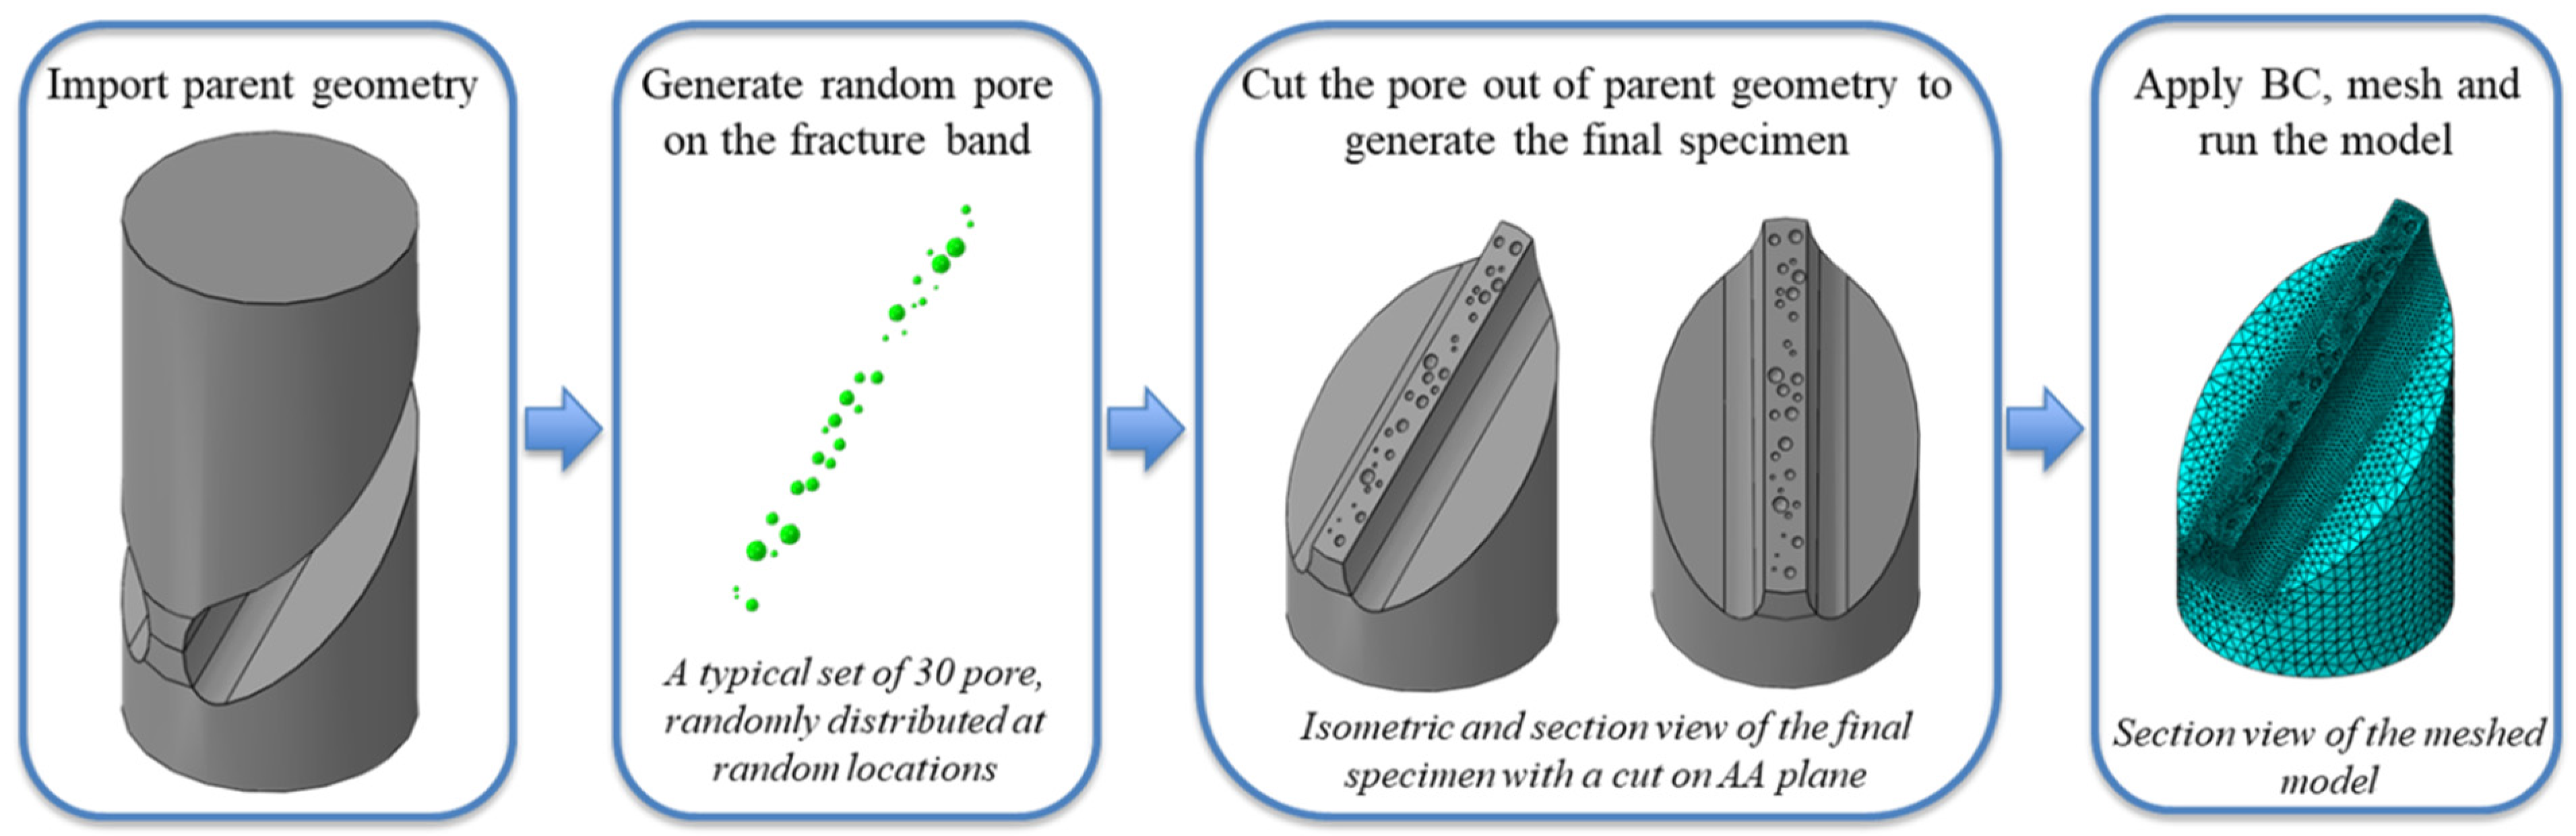
2.2. Automatic Dataset Generation

The dataset for the ANN was obtained by doing FE simulations on synthetic specimens with different morphologies of the pore system. To increase the efficiency, models with different numbers and sizes, and locations of pores were generated using the Python scripting function of Abaqus. Figure 2 shows four steps of the Python script for the generation of a new specimen geometry. In the first step, the geometry of the dense compression –shear specimen (shown in Figure 1a and dimensions in Table 1) is imported to the software for imposing the pore system on the fracture surface. The pore system is constructed and assembled in the next step as a set of spherical parts with different radii. The take-and-place algorithm [64,65] was used, assuming a uniform random distribution function to generate input parameters for the pore system. In this method, a newly generated pore (spherical part) is randomly placed on the fracture surface with the condition that it does not overlap with any previously placed pore while also keeping the spatial distribution macroscopically homogeneous. If the newly placed pore overlaps with a previous pore, it is discarded, and a new pore is generated. This process is repeated until the desired total volume of pores is reached. In the next step, the pore system is cut from the dense geometry to form a porous region on the prescribed fracture surface of the new specimen. Finally, the material properties, boundary conditions, and mesh are applied to the new geometry and the model is run. The force–displacement curves are collected for each model after the simulations are completed. The finite element model is validated by comparing to the experimental data from the literature [33] as discussed in Section 3.1. The primary outputs from the finite element model are failure displacement and peak force, and these are used for training the ANN model.

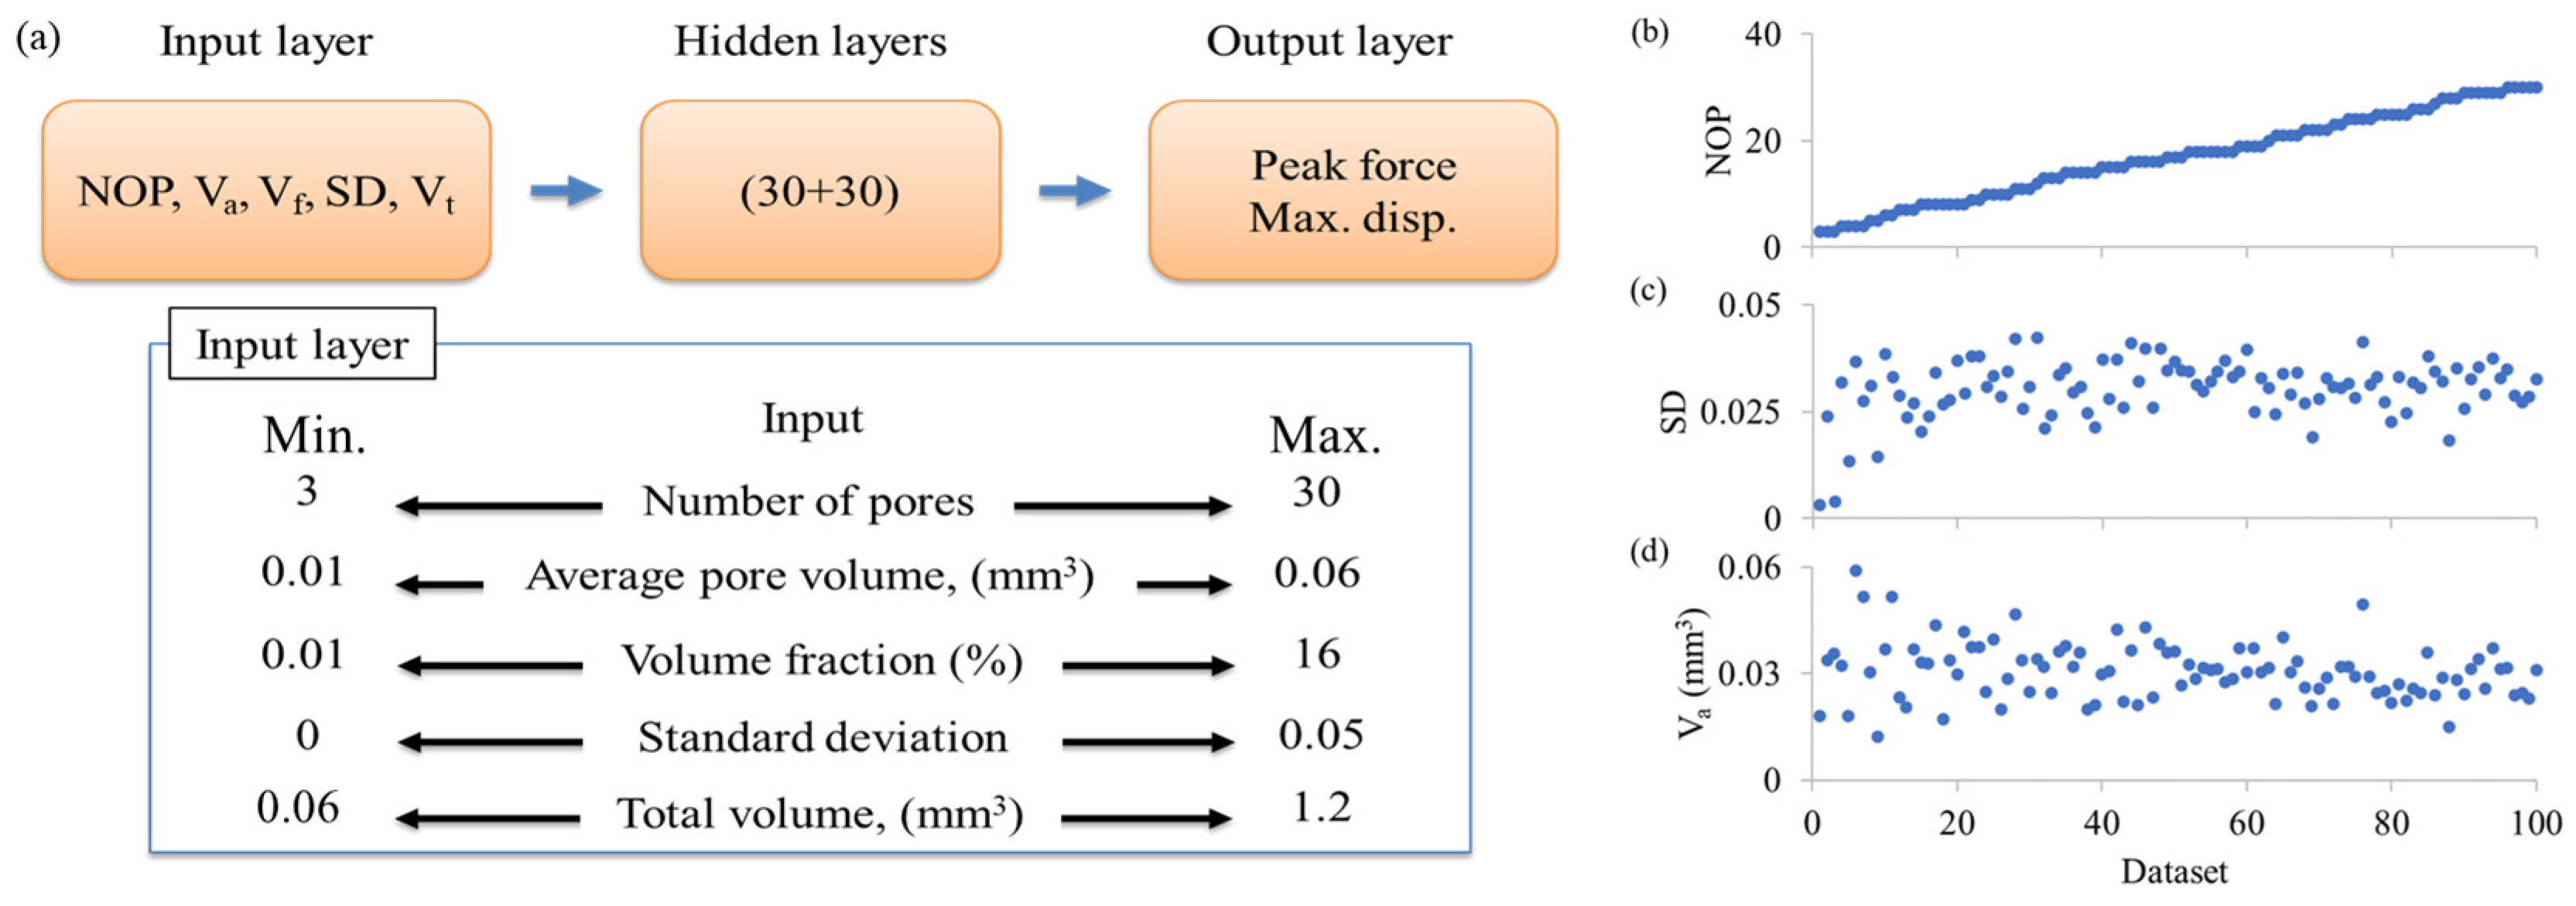
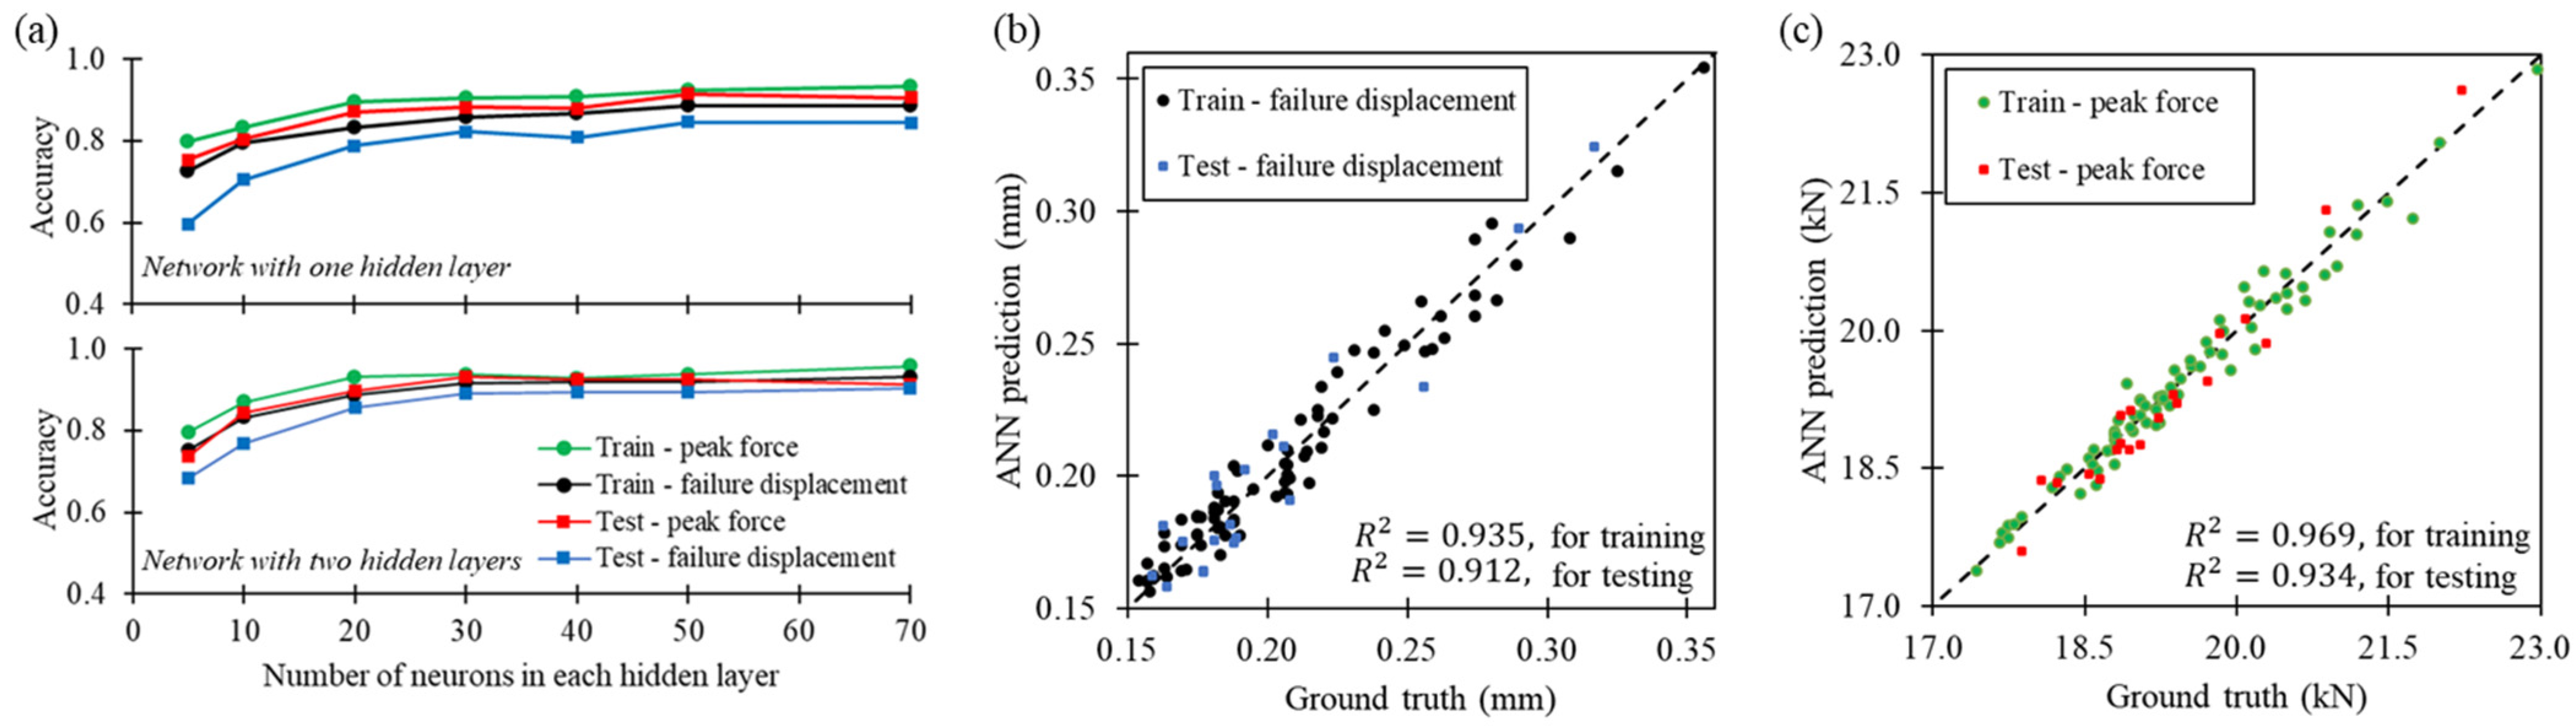
2.3. Structure of the ANN

We used a feedforward neural network regression model [66] for the implementation of the surrogate model in MATLAB, R2021a [67]. The dataset from finite element simulation included failure displacement and peak force of 100 different sample geometries which were split into 80% for training and 20% for testing. The FE simulation data were used to train the ANN. Figure 3b–d show the distribution of several input parameters, i.e., number of pores, standard deviation, and average pore volume, for samples in the dataset, respectively. The inputs were morphological parameters of the void system, and the model was used for the prediction of the outputs (peak force and failure displacement) of the AMed Ti6Al4V specimens. The schematic of the network is shown in Figure 3. Overfitting was avoided by applying Bayesian regularization backpropagation. The inputs were normalized on a consistent scale between 0 and 1, thereby enhancing both performance and accuracy [68]. We used trial and error to determine the architecture of the ANN. The final surrogate model consisted of two hidden layers with 30 neurons in each and a single output layer. The Relu activation function [69,70] was employed for the hidden layers, and in all cases, the maximum number of epochs was 3000. The dataset from FE simulations was split into two parts: 80% of the dataset was used for training and 20% was used for testing of the ANN. For training the model, we utilized the mean squared error (MSE) loss function, which is a standard approach for solving regression problems. To evaluate the accuracy of the model’s predictions, metrics such as the R-squared value were utilized, which is more representative of the model’s performance in regression analysis.
Following the evaluation of the developed neural networks to determine the final surrogate model with the highest accuracy, the model was used to analyse parametric variation and sensitivity to the inputs. Additionally, the weight matrix of the surrogate model was used to assess the significance and importance of each input parameter’s effect on output variations using the Garson equation (Equation (2)) [71,72].
I j = m = 1 N h ( ( W j m i h k = 1 N i W k m i h ) × W m n h o ) k = 1 N i { m = 1 N h W k m i h k = 1 N i W k m i h × W m n h o }
where W is the weight. Subscript j identifies each input parameter and subscripts o, h, and i refer to neurons in output, hidden, and input layers, respectively. Ij is the importance, Ni is the number of input neurons, and Nh is the number of hidden neurons.

3. Results and Discussions

In the results section, we first present the finite element simulation results alongside validation against experimental data and mesh sensitivity, examining the effects of pore features on material performance. Then, the outcomes of the ANN surrogate model are presented, and we evaluate its predictive accuracy for peak force and failure displacement.

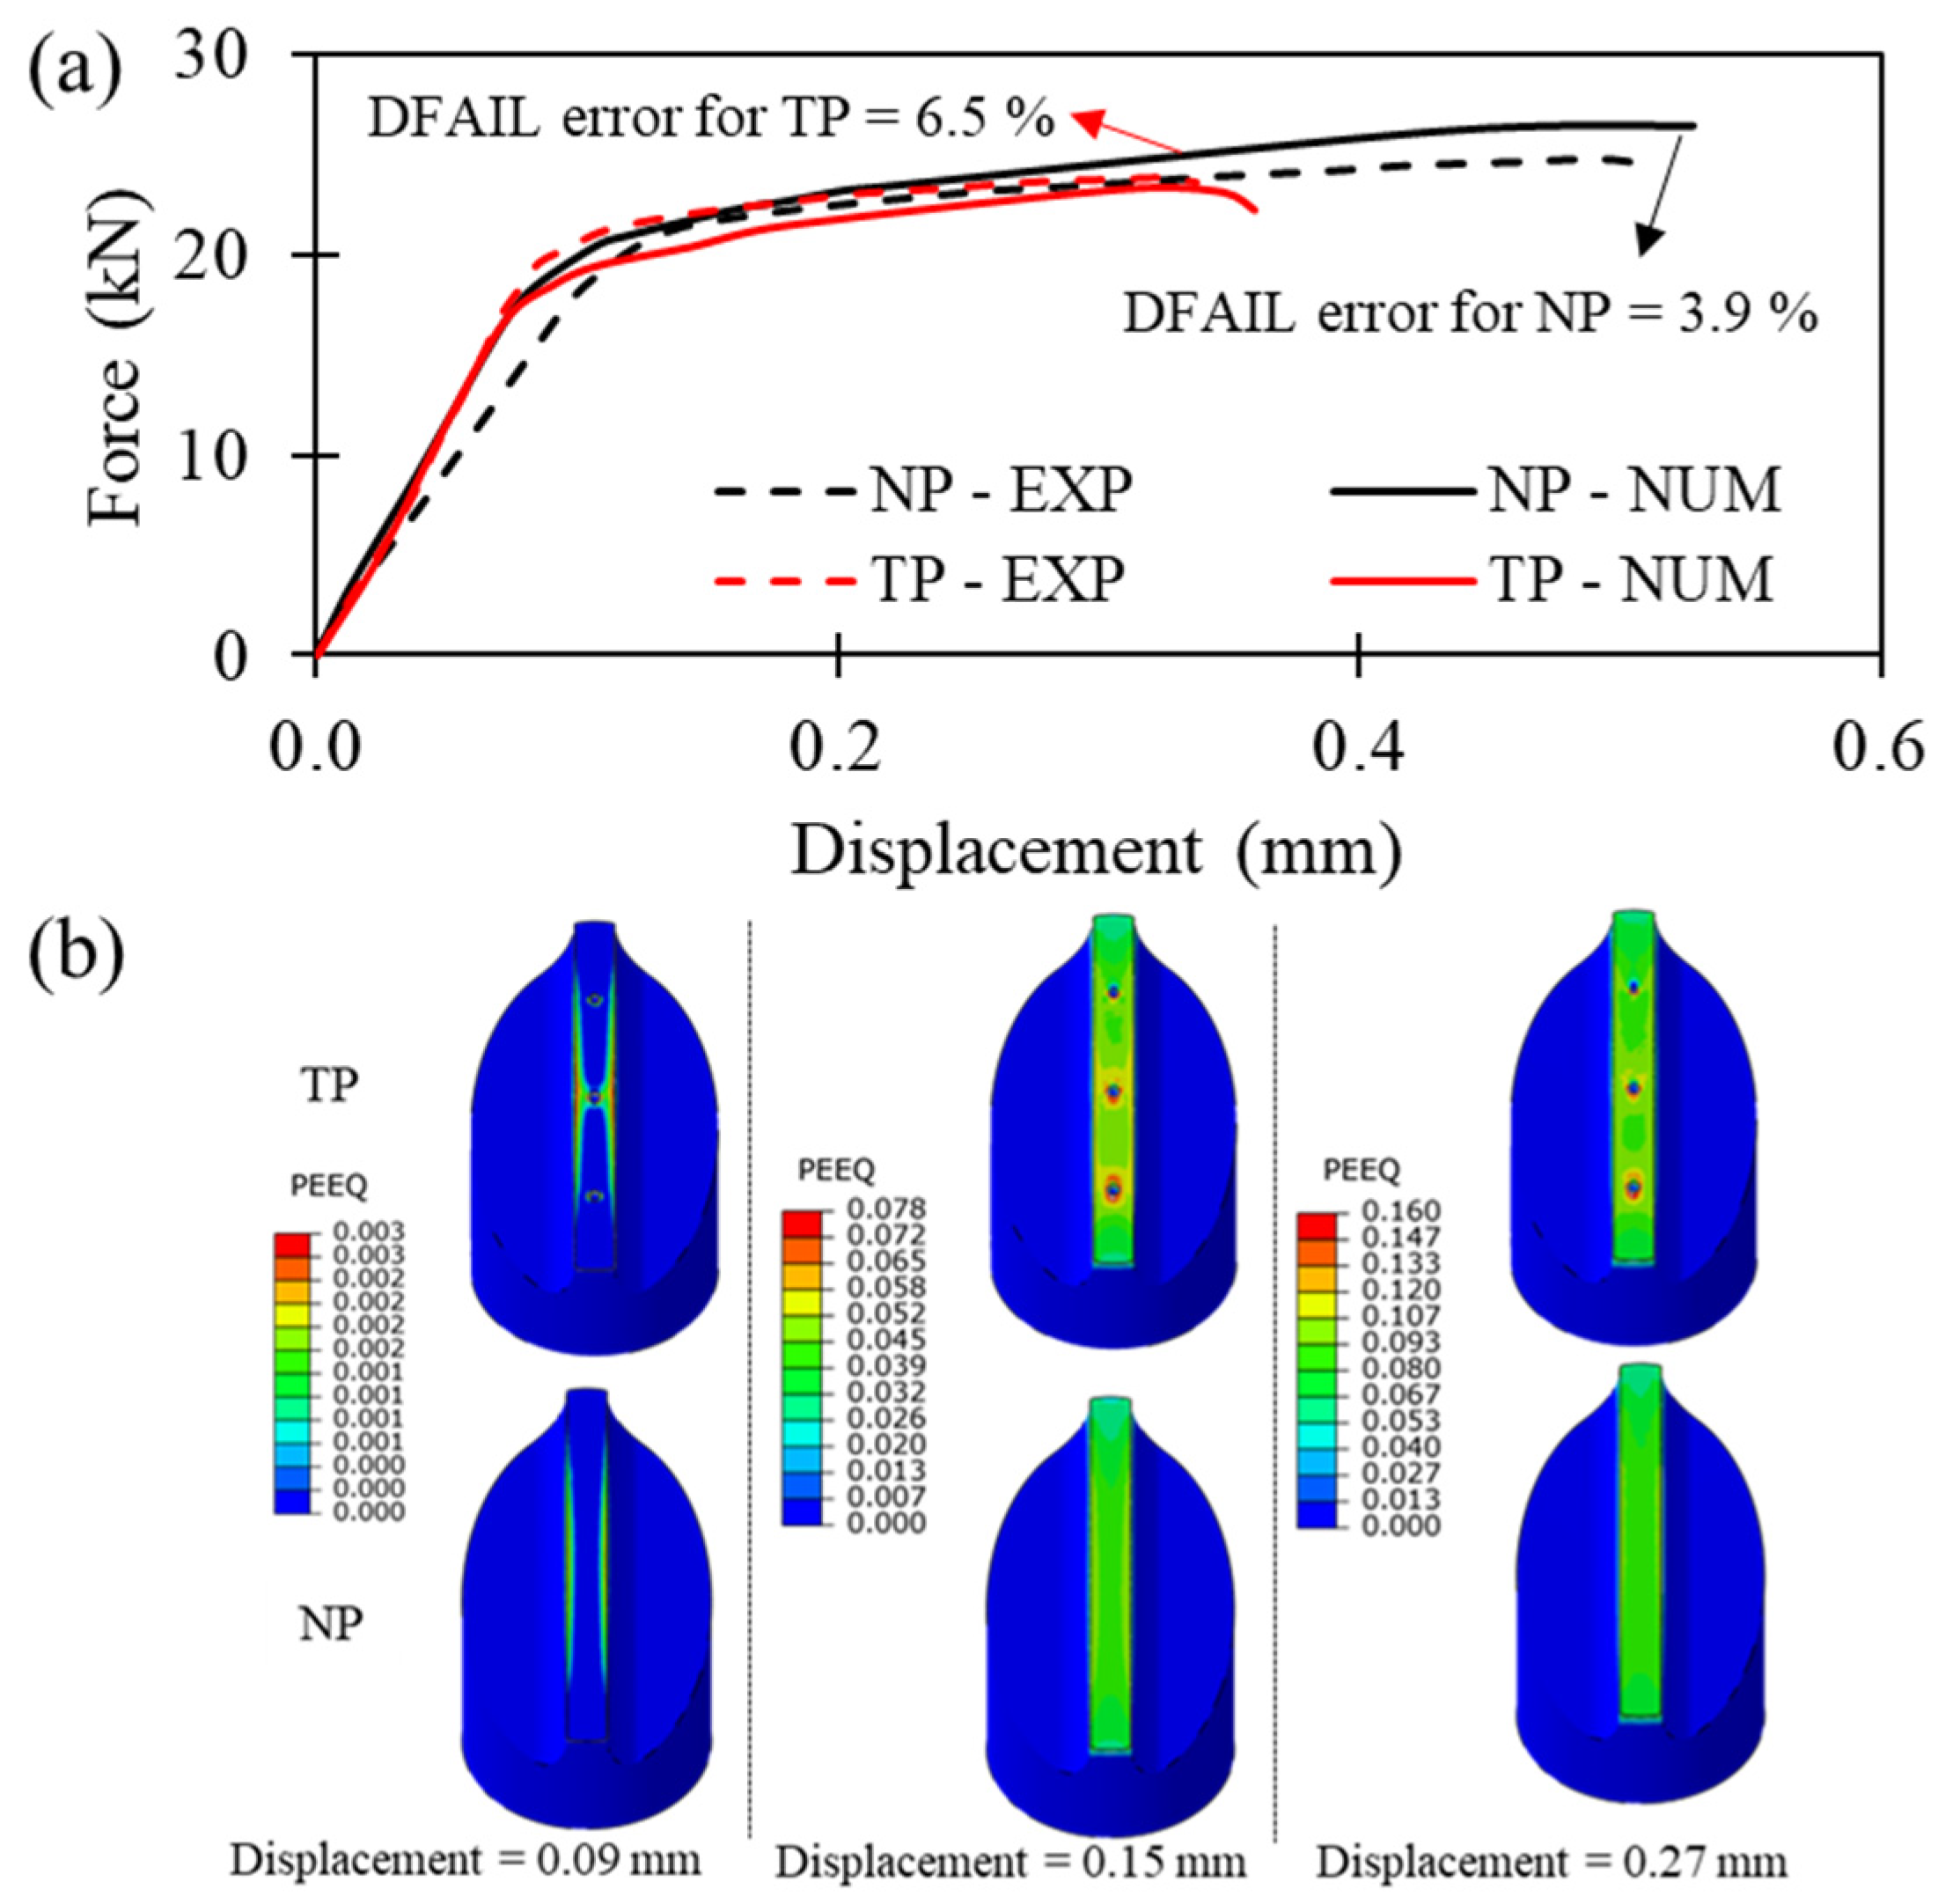
3.1. Finite Element Simulation Results and Validation

Experimental data from the literature [33] on quasi-static shear–compression behaviour of AMed Ti6Al4V materials were used for validation of the finite element models. Figure 4a shows the comparison between experimental and numerical force–displacement curves of dense NP (dense specimen) and TP (specimen with three pores) specimens. The mechanical response of the shear–compression specimen is significantly affected by the presence of the pores. Higher failure displacement (DFAIL) in dense specimens was observed, as reported in the literature, the presence of pores significantly reduced the ductility of the material [73,74,75], which is well predicted by the FE model. Additionally, reduced load was observed in the response of the specimen with pores. There are inconsistencies in the slope, and these are attributed to variations in experimental data due to the tolerance of specimen preparation in [33]. The numerical model predicted the failure displacements with an error of 3.9% and 6.5% for the NP and TP models, respectively. The presence of pores led to concentration of accumulated plastic strain in the vicinity of the pores, as shown in Figure 4b. This strain localization is a critical factor that can significantly impact the overall mechanical properties of the material [76,77], and the lower failure displacement observed in samples containing pores can be attributed to this strain localization in the vicinity of the pores.
Figure 5 shows the results of the mesh sensitivity analysis by providing the correlation between element length and both failure displacement and the number of elements in the TP model. As the element length decreased, DFAIL slightly increased, indicating the convergence in the results, while the number of elements and thus computational demand raised sharply. An element length of 0.2 mm was chosen as it offered a good balance between computational efficiency and the accuracy of the simulation results.

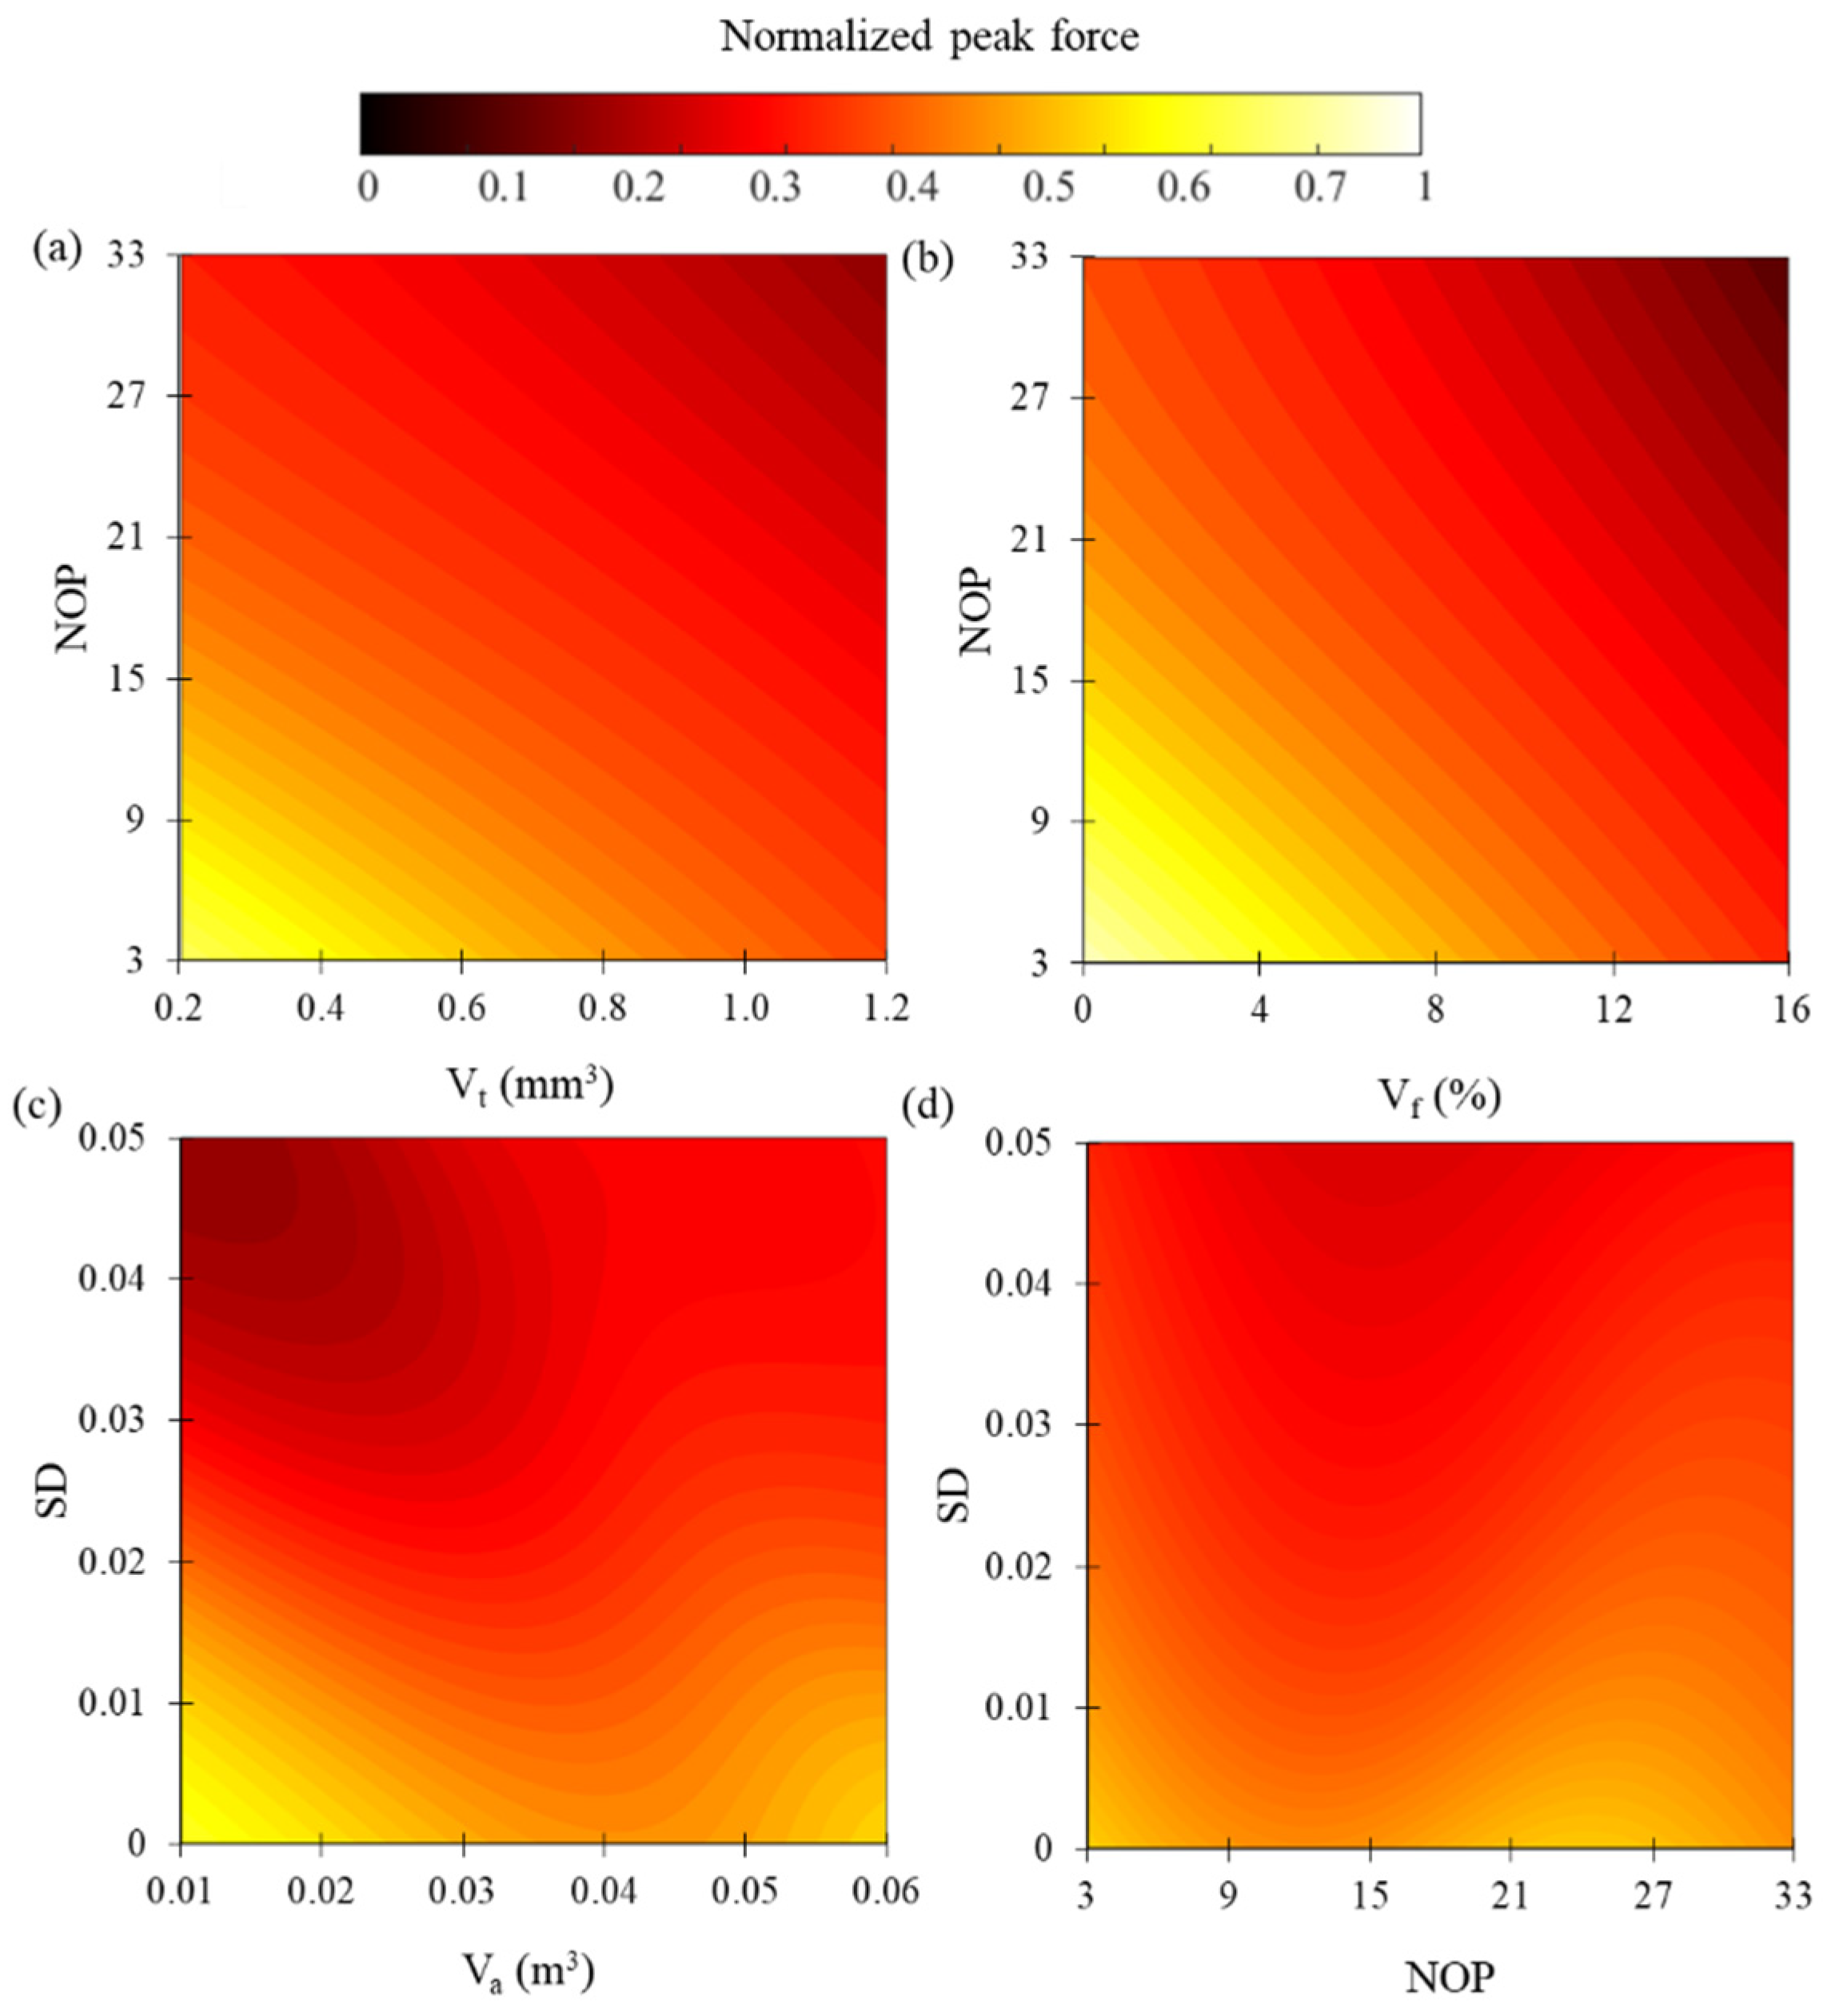
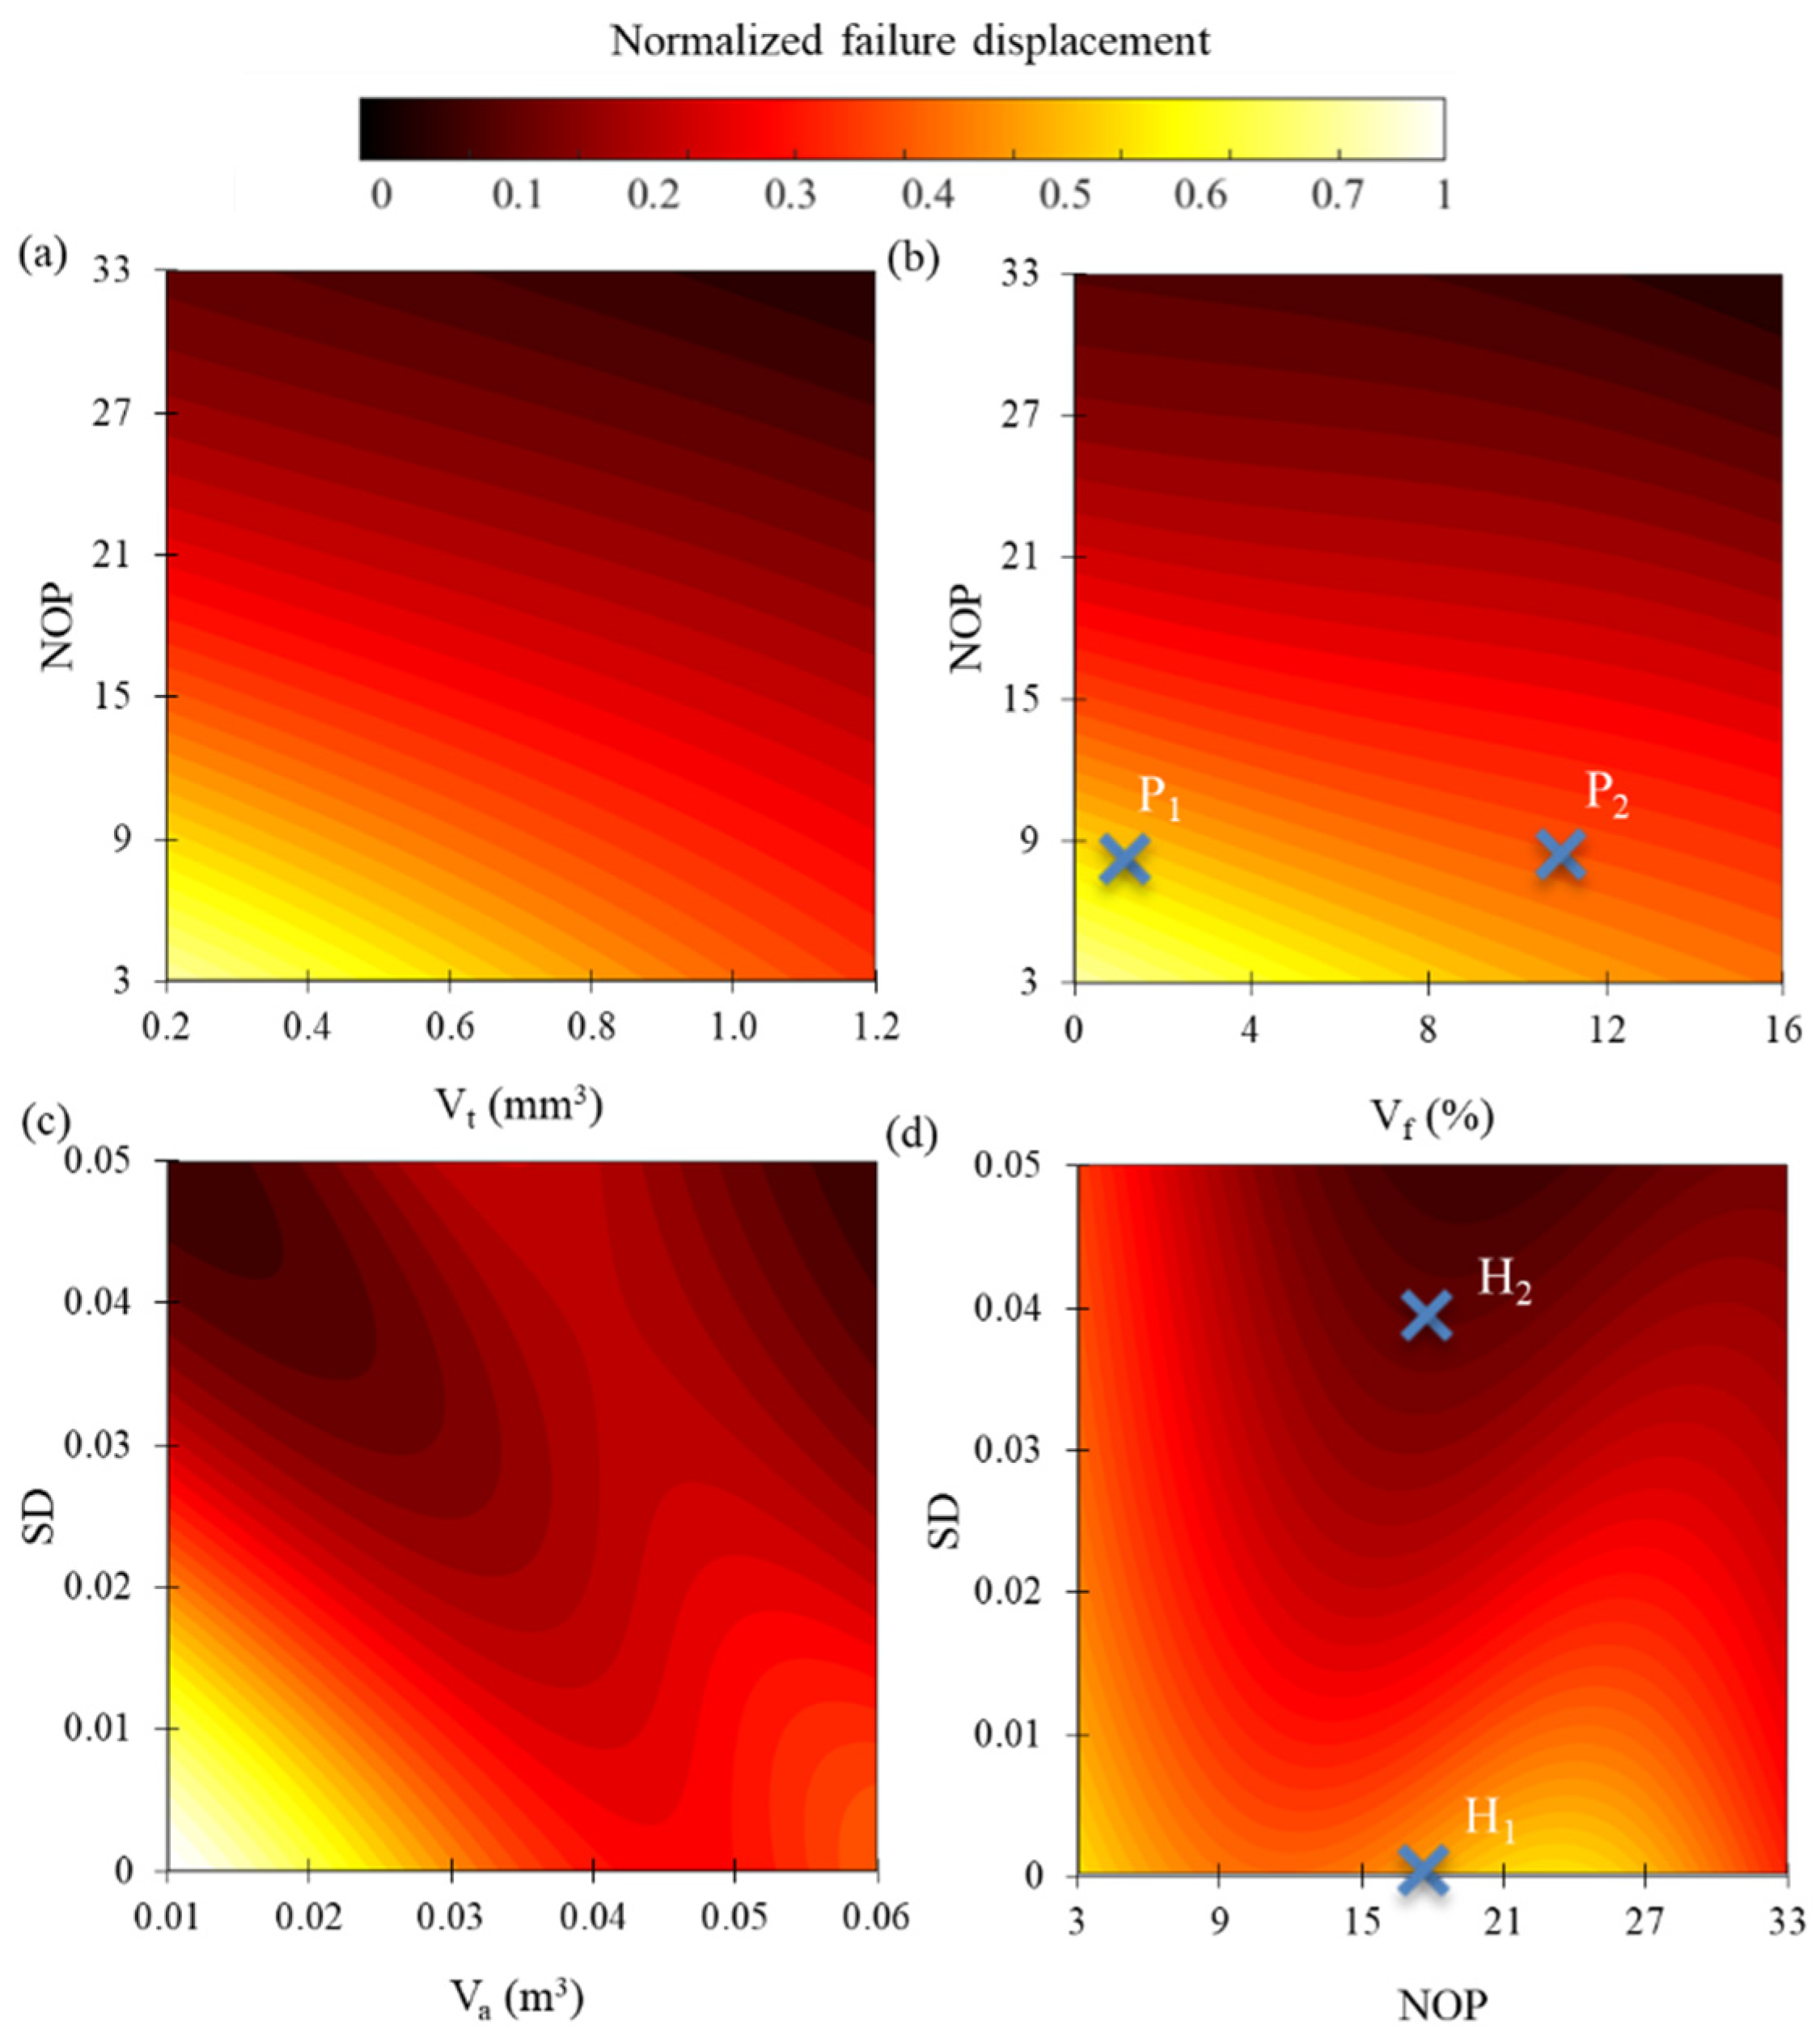
3.2. Artificial Neural Network Results

A trial-and-error approach was used to determine the final network structure. The results of the trial-and-error approach are presented in Figure 6a showing the prediction accuracy of several different network structures with one or two hidden layers. In all these models, similar network parameters such as number of inputs and outputs, training rate, regularization, and activation function were used. In this figure, the accuracy of the model for the prediction of both outputs (peak force and failure displacement) is presented. Increasing the number of hidden layers from one to two significantly improved the prediction accuracy of the ANN. In models featuring one or two hidden layers, the augmentation of neurons resulted in improved accuracy up to 30 neurons, beyond which further increments maintained consistent performance. This pattern highlights the optimal neuron count for maximizing predictive precision in the given neural network architecture. Therefore, the network architecture with two layers and 30 neurons in each was chosen as the final model architecture and is discussed in this section.
Figure 6b,c demonstrate the comparison between ANN predictions and ground truth data (from FE) for failure displacement and peak force, respectively. The ANN model was trained for both outputs simultaneously. The data presented in the figure were normalized between 0 and 1 using a min–max normalization technique [78] for each output variable separately. The scatter plot reveals a high degree of correlation between the ANN predictions and the actual FE results. The achieved R-squared value of 0.952 and the value of 0.923 for the training and test data (combined for both outputs) was observed, and this is considered an acceptable indicator of the surrogate model’s accuracy.
To establish the correlation between the outputs (failure displacement and peak force) and the inputs (pore system morphology), a comprehensive parametric study was conducted. The 2D contours depicted in Figure 7 and Figure 8 show these correlations for normalized peak force and failure displacement, respectively. Figure 7a,b and Figure 8a,b show that, as expected, any input parameter leading to a quantitative increase in the pore system size (such as NOP, Vt, and Va) corresponds to an adverse impact on the outputs resulting in lower peak force and reduced failure displacement. The lower gradient of change observed in Figure 8a,b along the vertical direction indicates that the NOP has a more pronounced influence on failure displacement compared to the Vt or Va. The correlation between the standard deviation of pores (SD) and the other inputs (Va and NOP) with the outputs does not display a similar clear trend.
The complex color gradations in the plots corresponding to the standard deviation of pore size suggest that variations in pore size distribution could lead to non-linear effects on peak force, which might not be immediately apparent from simple linear models. This implies that materials with more uniform pore sizes could exhibit different mechanical properties than those with a wider size distribution, even if other metrics such as the number of pores or total pore volume are held constant. In general, as shown in Figure 7d and Figure 8d, for the same number of pores, an increased standard deviation is not favorable, and a pore system with an evenly dispersed distribution tends to result in better mechanical performance. A consistent observation can be discerned in Figure 7c and Figure 8c for SD and Va, with a similar effect. For instance, it can be observed in Figure 8c that for two samples with similar average pore volumes, an increased standard deviation within the pore size distribution adversely affects the material’s failure displacement. This is true regardless of the value of the average volume and is evident by the vertical color gradations in the figure; however, the influence of the standard deviation on failure displacement seems to be more intense for pore systems with lower average pore size values. These findings are notable as they suggest that both the size and the distribution of pores sizes can be a critical factor in the mechanical response of the additively manufactured material.
Finally, it is also worth mentioning that in Figure 7c,d and Figure 8c,d, the observed trends regarding standard deviation become more complex as standard deviation values increase, and the clarity of these trends within the model’s predictions diminishes. This represents one of the limitations of the model, which is partly attributable to the dataset generation process. It is challenging to create samples that possess a high number of pores or a high average volume with a high standard deviation. This difficulty originates from the limitations of the size of the fracture surface and the upper and lower limits for pore sizes. Consequently, these factors may limit the ANN’s training, particularly in regions characterized by high standard deviation in pore sizes and could affect the model’s ability to generalize to such scenarios.
Another significant aspect of the pore system is the random distribution and placement of pores. It has been demonstrated that a random pore population results in considerable variations in mechanical performance [11,79]. Such a variation is investigated in the present study for four specific points highlighted in Figure 8b,d and the results are shown in Figure 9a,b, respectively. The variation is more pronounced for lower volume fractions (Vf) which is evident from the bar plot data in Figure 9b, where the 10 different models with a Vf = 1.2% had a standard deviation of 0.013 for the prediction of DFAIL, whereas at Vf = 12%, the standard deviation between results of different models was equal to 0.006. This indicated that void coalescence might not be a significant influencing mechanism in the FE simulation results as represented by Nielsen et al. [80] where the overall material response remained fairly consistent across different pore spacings until the initiation of coalescence. Figure 9a,b show that the ML model demonstrated its effectiveness in capturing the observed trends. However, it is worth noting that addressing the limitations of this model, such as incorporating more advanced techniques such as convolutional neural networks (CNNs) [81] would be beneficial, particularly for considering the placement of pores as an additional input parameter.
The outcomes of the Garson equation [71] for input importance analysis with respect to both outputs are illustrated in Figure 10. The sensitivity analysis from the ANN model indicates that the NOP has the most significant impact on the mechanical behavior of the material, with an importance value of 33.4%. This suggests that the count of pores is a critical determinant of the material’s structural performance. In comparison, the SD of pore size, at 27.0%, points to the variability in pore size as a substantial factor affecting material properties. Notably, both Vt, Va, and Vf emerge as inputs with similar significance. It is evident that all of these most crucial inputs are closely associated with the overall size of the pore system.

4. Conclusions

In this paper, we studied the influence of pore system morphology on the material response of additively manufactured Ti6Al4V specimens subjected to a shear–compression stress state. The study utilized shear–compression specimens with artificial pores of varying characteristics. The ANN surrogate model effectively predicted peak force and failure displacement. The ANN’s predictive accuracy was acceptable. Parametric analysis further evaluated the relationships between pore attributes and material response. An increase in the pore system size corresponded to adverse effects. The dispersion pattern of random pore distribution, particularly pronounced at lower volume fractions, underscored the necessity of more advanced models. In conclusion, this study underlined the significance of understanding pore morphology in AM materials, a crucial aspect of defect-aware design and property–porosity linkage [82,83].

Author Contributions

Conceptualization, M.R. and J.D.H.; methodology, M.R.; software, M.R.; validation, M.R.; formal analysis, M.R.; investigation, M.R.; writing—original draft preparation, M.R.; writing—review and editing, M.R. and J.D.H.; visualization, M.R.; supervision, J.D.H.; project administration, J.D.H.; funding acquisition, J.D.H. All authors have read and agreed to the published version of the manuscript.

Funding

Funding support from the Natural Sciences and Engineering Research Council of Canada Discovery Grant program to JDH (#2023-04457).

Data Availability Statement

Data will be made available upon request from corresponding author.

Conflicts of Interest

The authors declare no conflict of interest.

References

  1. Yuan, L.; Ding, S.; Wen, C. Additive Manufacturing Technology for Porous Metal Implant Applications and Triple Minimal Surface Structures: A Review. Bioact. Mater. 2019, 4, 56–70. [Google Scholar] [CrossRef] [PubMed]
  2. Bajaj, P.; Hariharan, A.; Kini, A.; Kürnsteiner, P.; Raabe, D.; Jägle, E.A. Steels in Additive Manufacturing: A Review of Their Microstructure and Properties. Mater. Sci. Eng. A 2020, 772, 138633. [Google Scholar] [CrossRef]
  3. Askari, M.; Hutchins, D.A.; Thomas, P.J.; Astolfi, L.; Watson, R.L.; Abdi, M.; Ricci, M.; Laureti, S.; Nie, L.; Freear, S.; et al. Additive Manufacturing of Metamaterials: A Review. Addit. Manuf. 2020, 36, 101562. [Google Scholar] [CrossRef]
  4. Deckers, J.; Vleugels, J.; Kruth, J.P. Additive Manufacturing of Ceramics: A Review. J. Ceram. Sci. Technol. 2014, 5, 245–260. [Google Scholar] [CrossRef]
  5. Cottam, R.; Palanisamy, S.; Avdeev, M.; Jarvis, T.; Henry, C.; Cuiuri, D.; Balogh, L.; Abdul, R.; Rashid, R. Diffraction Line Profile Analysis of 3D Wedge Samples of Ti-6Al-4V Fabricated Using Four Different Additive Manufacturing Processes. Metals 2017, 9, 60. [Google Scholar] [CrossRef]
  6. Rashid, R.; Masood, S.; Ruan, D.; Palanisamy, S.; Huang, X.; Rahman Rashid, R.A. Design Optimization and Finite Element Model Validation of LPBF-Printed Lattice-Structured Beams. Metals 2023, 13, 184. [Google Scholar] [CrossRef]
  7. Mostafaei, A.; Zhao, C.; He, Y.; Reza Ghiaasiaan, S.; Shi, B.; Shao, S.; Shamsaei, N.; Wu, Z.; Kouraytem, N.; Sun, T.; et al. Defects and Anomalies in Powder Bed Fusion Metal Additive Manufacturing. Curr. Opin. Solid State Mater. Sci. 2022, 26, 100974. [Google Scholar] [CrossRef]
  8. Smith, T.R.; Sugar, J.D.; Schoenung, J.M.; San Marchi, C. Relationship between Manufacturing Defects and Fatigue Properties of Additive Manufactured Austenitic Stainless Steel. Mater. Sci. Eng. A 2019, 765, 138268. [Google Scholar] [CrossRef]
  9. Sanaei, N.; Fatemi, A.; Phan, N. Defect Characteristics and Analysis of Their Variability in Metal L-PBF Additive Manufacturing. Mater. Des. 2019, 182, 108091. [Google Scholar] [CrossRef]
  10. Honarvar, F.; Varvani-Farahani, A. A Review of Ultrasonic Testing Applications in Additive Manufacturing: Defect Evaluation, Material Characterization, and Process Control. Ultrasonics 2020, 108, 106227. [Google Scholar] [CrossRef]
  11. du Plessis, A.; Yadroitsava, I.; Yadroitsev, I. Effects of Defects on Mechanical Properties in Metal Additive Manufacturing: A Review Focusing on X-ray Tomography Insights. Mater. Des. 2020, 187, 108385. [Google Scholar] [CrossRef]
  12. Wu, B.; Pan, Z.; Ding, D.; Cuiuri, D.; Li, H.; Xu, J.; Norrish, J. A Review of the Wire Arc Additive Manufacturing of Metals: Properties, Defects and Quality Improvement. J. Manuf. Process 2018, 35, 127–139. [Google Scholar] [CrossRef]
  13. DebRoy, T.; Wei, H.L.; Zuback, J.S.; Mukherjee, T.; Elmer, J.W.; Milewski, J.O.; Beese, A.M.; Wilson-Heid, A.; De, A.; Zhang, W. Additive Manufacturing of Metallic Components—Process, Structure and Properties. Prog. Mater. Sci. 2018, 92, 112–224. [Google Scholar] [CrossRef]
  14. du Plessis, A. Effects of Process Parameters on Porosity in Laser Powder Bed Fusion Revealed by X-ray Tomography. Addit. Manuf. 2019, 30, 100871. [Google Scholar] [CrossRef]
  15. Sola, A.; Nouri, A. Microstructural Porosity in Additive Manufacturing: The Formation and Detection of Pores in Metal Parts Fabricated by Powder Bed Fusion. J. Adv. Manuf. Process 2019, 1, e10021. [Google Scholar] [CrossRef]
  16. Malekipour, E.; El-Mounayri, H. Common Defects and Contributing Parameters in Powder Bed Fusion AM Process and Their Classification for Online Monitoring and Control: A Review. Int. J. Adv. Manuf. Technol. 2017, 95, 527–550. [Google Scholar] [CrossRef]
  17. Gong, H.; Rafi, K.; Gu, H.; Janaki Ram, G.D.; Starr, T.; Stucker, B. Influence of Defects on Mechanical Properties of Ti–6Al–4 V Components Produced by Selective Laser Melting and Electron Beam Melting. Mater. Des. 2015, 86, 545–554. [Google Scholar] [CrossRef]
  18. Biswal, R.; Syed, A.K.; Zhang, X. Assessment of the Effect of Isolated Porosity Defects on the Fatigue Performance of Additive Manufactured Titanium Alloy. Addit. Manuf. 2018, 23, 433–442. [Google Scholar] [CrossRef]
  19. Teng, C.; Pal, D.; Gong, H.; Zeng, K.; Briggs, K.; Patil, N.; Stucker, B. A Review of Defect Modeling in Laser Material Processing. Addit. Manuf. 2017, 14, 137–147. [Google Scholar] [CrossRef]
  20. Afroz, L.; Inverarity, S.B.; Qian, M.; Easton, M.; Das, R. Analysing the Effect of Defects on Stress Concentration and Fatigue Life of L-PBF AlSi10Mg Alloy Using Finite Element Modelling. Prog. Addit. Manuf. 2023, 2023, 1–19. [Google Scholar] [CrossRef]
  21. King, W.E.; Barth, H.D.; Castillo, V.M.; Gallegos, G.F.; Gibbs, J.W.; Hahn, D.E.; Kamath, C.; Rubenchik, A.M. Observation of Keyhole-Mode Laser Melting in Laser Powder-Bed Fusion Additive Manufacturing. J. Mater. Process Technol. 2014, 214, 2915–2925. [Google Scholar] [CrossRef]
  22. Bayat, M.; Mohanty, S.; Hattel, J.H. Multiphysics Modelling of Lack-of-Fusion Voids Formation and Evolution in IN718 Made by Multi-Track/Multi-Layer L-PBF. Int. J. Heat Mass Transf. 2019, 139, 95–114. [Google Scholar] [CrossRef]
  23. Laleh, M.; Hughes, A.E.; Yang, S.; Li, J.; Xu, W.; Gibson, I.; Tan, M.Y. Two and Three-Dimensional Characterisation of Localised Corrosion Affected by Lack-of-Fusion Pores in 316L Stainless Steel Produced by Selective Laser Melting. Corros. Sci. 2020, 165, 108394. [Google Scholar] [CrossRef]
  24. Shrestha, S.; Chou, K. Formation of Keyhole and Lack of Fusion Pores during the Laser Powder Bed Fusion Process. Manuf. Lett. 2022, 32, 19–23. [Google Scholar] [CrossRef]
  25. Chen, G.; Zhou, Q.; Zhao, S.Y.; Yin, J.O.; Tan, P.; Li, Z.F.; Ge, Y.; Wang, J.; Tang, H.P. A Pore Morphological Study of Gas-Atomized Ti-6Al-4V Powders by Scanning Electron Microscopy and Synchrotron X-ray Computed Tomography. Powder Technol. 2018, 330, 425–430. [Google Scholar] [CrossRef]
  26. Chen, G.; Zhao, S.Y.; Tan, P.; Wang, J.; Xiang, C.S.; Tang, H.P. A Comparative Study of Ti-6Al-4V Powders for Additive Manufacturing by Gas Atomization, Plasma Rotating Electrode Process and Plasma Atomization. Powder Technol. 2018, 333, 38–46. [Google Scholar] [CrossRef]
  27. Li, E.; Zhou, Z.; Wang, L.; Zou, R.; Yu, A. Numerical Studies of Melt Pool and Gas Bubble Dynamics in Laser Powder Bed Fusion Process. Addit. Manuf. 2022, 56, 102913. [Google Scholar] [CrossRef]
  28. Guo, Z.; Zhou, C. Recent Advances in Ink-Based Additive Manufacturing for Porous Structures. Addit. Manuf. 2021, 48, 102405. [Google Scholar] [CrossRef]
  29. Ghamarian, I.; Ball, S.; Ghayoor, M.; Pasebani, S.; Tabei, A. Statistical Analysis of Spatial Distribution of Pores in Metal Additive Manufacturing. Addit. Manuf. 2021, 47, 102264. [Google Scholar] [CrossRef]
  30. D’Accardi, E.; Ulbricht, A.; Krankenhagen, R.; Palumbo, D.; Galietti, U. Capability of Active Thermography to Detect and Localize Pores in Metal Additive Manufacturing Materials. IOP Conf. Ser. Mater. Sci. Eng. 2021, 1038, 012018. [Google Scholar] [CrossRef]
  31. Kan, W.H.; Chiu, L.N.S.; Lim, C.V.S.; Zhu, Y.; Tian, Y.; Jiang, D.; Huang, A. A Critical Review on the Effects of Process-Induced Porosity on the Mechanical Properties of Alloys Fabricated by Laser Powder Bed Fusion. J. Mater. Sci. 2022, 57, 9818–9865. [Google Scholar] [CrossRef]
  32. Al-Maharma, A.Y.; Patil, S.P.; Markert, B. Effects of Porosity on the Mechanical Properties of Additively Manufactured Components: A Critical Review. Mater. Res. Express 2020, 7, 122001. [Google Scholar] [CrossRef]
  33. Fadida, R.; Shirizly, A.; Rittel, D. Static and Dynamic Shear-Compression Response of Additively Manufactured Ti6Al4V Specimens with Embedded Voids. Mech. Mater. 2020, 147, 103413. [Google Scholar] [CrossRef]
  34. Lu, T.; Liu, C.; Li, Z.; Wu, Q.; Wang, J.; Xu, T.; Liu, J.; Wang, H.; Ma, S. Hot-Wire Arc Additive Manufacturing Ti–6.5Al–2Zr–1Mo–1V Titanium Alloy: Pore Characterization, Microstructural Evolution, and Mechanical Properties. J. Alloys Compd. 2020, 817, 153334. [Google Scholar] [CrossRef]
  35. Choren, J.A.; Heinrich, S.M.; Silver-Thorn, M.B. Young’s Modulus and Volume Porosity Relationships for Additive Manufacturing Applications. J. Mater. Sci. 2013, 48, 5103–5112. [Google Scholar] [CrossRef]
  36. Kim, F.H.; Moylan, S.P.; Garboczi, E.J.; Slotwinski, J.A. Investigation of Pore Structure in Cobalt Chrome Additively Manufactured Parts Using X-ray Computed Tomography and Three-Dimensional Image Analysis. Addit. Manuf. 2017, 17, 23–38. [Google Scholar] [CrossRef] [PubMed]
  37. Wilson-Heid, A.E.; Novak, T.C.; Beese, A.M. Characterization of the Effects of Internal Pores on Tensile Properties of Additively Manufactured Austenitic Stainless Steel 316L. Exp. Mech. 2019, 59, 793–804. [Google Scholar] [CrossRef]
  38. Kotzem, D.; Kleszczynski, S.; Stern, F.; Elspaß, A.; Tenkamp, J.; Witt, G.; Walther, F. Impact of Single Structural Voids on Fatigue Properties of AISI 316L Manufactured by Laser Powder Bed Fusion. Int. J. Fatigue 2021, 148, 106207. [Google Scholar] [CrossRef]
  39. Fadida, R.; Shirizly, A.; Rittel, D. The Static and Dynamic Shear-Tension Mechanical Response of AM Ti6Al4V Containing Spherical and Prolate Voids. Int. J. Eng. Sci. 2019, 141, 1–15. [Google Scholar] [CrossRef]
  40. Fadida, R.; Shirizly, A.; Rittel, D. Dynamic Tensile Response of Additively Manufactured Ti6Al4V with Embedded Spherical Pores. J. Appl. Mech. Trans. ASME 2018, 85, 041004. [Google Scholar] [CrossRef]
  41. Fadida, R.; Rittel, D.; Shirizly, A. Dynamic Mechanical Behavior of Additively Manufactured Ti6Al4V with Controlled Voids. J. Appl. Mech. Trans. ASME 2015, 82, 041004. [Google Scholar] [CrossRef]
  42. Meng, L.X.; Ben, D.D.; Yang, H.J.; Ji, H.B.; Lian, D.L.; Zhu, Y.K.; Chen, J.; Yi, J.L.; Wang, L.; Yang, J.B.; et al. Effects of Embedded Spherical Pore on the Tensile Properties of a Selective Laser Melted Ti6Al4V Alloy. Mater. Sci. Eng. A 2021, 815, 141254. [Google Scholar] [CrossRef]
  43. Hastie, J.C.; Koelblin, J.; Kartal, M.E.; Attallah, M.M.; Martinez, R. Evolution of Internal Pores within AlSi10Mg Manufactured by Laser Powder Bed Fusion under Tension: As-Built and Heat Treated Conditions. Mater. Des. 2021, 204, 109645. [Google Scholar] [CrossRef]
  44. Chan, H.; Cherukara, M.; Loeffler, T.D.; Narayanan, B.; Sankaranarayanan, S.K.R.S. Machine Learning Enabled Autonomous Microstructural Characterization in 3D Samples. NPJ Comput. Mater. 2020, 6, 1–9. [Google Scholar] [CrossRef]
  45. Nalajam, P.K.; Ramesh, V. Microstructural Porosity Segmentation Using Machine Learning Techniques in Wire-Based Direct Energy Deposition of AA6061. Micron 2021, 151, 103161. [Google Scholar] [CrossRef] [PubMed]
  46. Rezasefat, M.; Giglio, M.; Manes, A. Numerical Investigation of the Effect of Open Holes on the Impact Response of CFRP Laminates. Appl. Compos. Mater. 2022, 2022, 1555–1578. [Google Scholar] [CrossRef]
  47. Rezasefat, M.; Beligni, A.; Sbarufatti, C.; Amico, S.C.; Manes, A. Experimental and Numerical Study of the Influence of Pre-Existing Impact Damage on the Low-Velocity Impact Response of CFRP Panels. Materials 2023, 16, 914. [Google Scholar] [CrossRef]
  48. Fulginiti, F.; Rezasefat, M.; Xavier da Silva, A.; Amico, S.C.; Giglio, M.; Manes, A. Experimental and Numerical Studies on the Repeated Low-Velocity Impact Response and Damage Accumulation in Woven S2-Glass Fibre/Epoxy Composites. Adv. Compos. Mater. 2023, 32, 916–941. [Google Scholar] [CrossRef]
  49. Rezasefat, M.; Hogan, J.D. A Finite Element-Convolutional Neural Network Model (FE-CNN) for Stress Field Analysis around Arbitrary Inclusions. Mach. Learn. Sci. Technol. 2024, 4, 045052. [Google Scholar] [CrossRef]
  50. Zhang, X.; Saniie, J.; Heifetz, A. Detection of Defects in Additively Manufactured Stainless Steel 316L with Compact Infrared Camera and Machine Learning Algorithms. JOM 2020, 72, 4244–4253. [Google Scholar] [CrossRef]
  51. Parsazadeh, M.; Wu, D.; Sharma, S.; Joshi, S.S.; Pantawane, M.V.; Dahotre, N. A New Data-Driven Framework for Prediction of Molten Pool Evolution and Lack of Fusion Defects in Multi-Track Multi-Layer Laser Powder Bed Fusion Processes. Int. J. Adv. Manuf. Technol. 2023, 124, 2493–2513. [Google Scholar] [CrossRef]
  52. Hu, E.; Seetoh, I.P.; Lai, C.Q. Machine Learning Assisted Investigation of Defect Influence on the Mechanical Properties of Additively Manufactured Architected Materials. Int. J. Mech. Sci. 2022, 221, 107190. [Google Scholar] [CrossRef]
  53. Machado, J.M.; Tavares, J.M.R.S.; Camanho, P.P.; Correia, N. Automatic Void Content Assessment of Composite Laminates Using a Machine-Learning Approach. Compos. Struct. 2022, 288, 115383. [Google Scholar] [CrossRef]
  54. Shen, W.Q.; Cao, Y.J.; Shao, J.F.; Liu, Z.B. Prediction of Plastic Yield Surface for Porous Materials by a Machine Learning Approach. Mater. Today Commun. 2020, 25, 101477. [Google Scholar] [CrossRef]
  55. Rittel, D.; Lee, S.; Ravichandran, G. A Shear-Compression Specimen for Large Strain Testing. Exp. Mech. 2002, 42, 58–64. [Google Scholar] [CrossRef]
  56. Rezasefat, M.; Mirzababaie Mostofi, T.; Ozbakkaloglu, T. Repeated Localized Impulsive Loading on Monolithic and Multi-Layered Metallic Plates. Thin-Walled Struct. 2019, 144, 106332. [Google Scholar] [CrossRef]
  57. Rezasefat, M.; Mirzababaie Mostofi, T.; Babaei, H.; Ziya-Shamami, M.; Alitavoli, M. Dynamic Plastic Response of Double-Layered Circular Metallic Plates Due to Localized Impulsive Loading. Proc. Inst. Mech. Eng. Part L J. Mater. Des. Appl. 2019, 233, 1449–1471. [Google Scholar] [CrossRef]
  58. Ni, Y.; Wang, Z.; Bai, H.; Zeng, Q.; Liao, H.; Wu, W. Investigations of the Failure Mode for Additive Manufactured Interlocked Interface Structure Based on X-ray CT Image Guided Finite Element Analysis and Experimental Comparisons. Eng. Fract. Mech. 2023, 284, 109220. [Google Scholar] [CrossRef]
  59. Rezasefat, M.; Mostafavi, Y.; Ma, D.; Manes, A. A Hybrid Micro-Macro Mechanical Damage Model to Consider the Influence of Resin-Rich Zones on the Transverse Tensile Behaviour of Unidirectional Composites. Compos. Struct. 2023, 308, 116714. [Google Scholar] [CrossRef]
  60. Rezasefat, M.; Amico, S.C.; Giglio, M.; Manes, A. A Numerical Study on the Influence of Strain Rate in Finite-Discrete Element Simulation of the Perforation Behaviour of Woven Composites. Polymers 2022, 14, 4279. [Google Scholar] [CrossRef]
  61. Rezasefat, M.; Gonzalez-Jimenez, A.; Giglio, M.; Manes, A. An Evaluation of Cuntze and Puck Inter Fibre Failure Criteria in Simulation of Thin CFRP Plates Subjected to Low Velocity Impact. Compos. Struct. 2021, 278, 114654. [Google Scholar] [CrossRef]
  62. Rezasefat, M.; Gonzalez-Jimenez, A.; Giglio, M.; Manes, A. Numerical Study on the Dynamic Progressive Failure Due to Low-Velocity Repeated Impacts in Thin CFRP Laminated Composite Plates. Thin-Walled Struct. 2021, 167, 108220. [Google Scholar] [CrossRef]
  63. ABAQUS 2016 Documentation. ABAQUS Theory Manual. 2017. Available online: http://130.149.89.49:2080/v2016/index.html (accessed on 14 December 2023).
  64. Ma, D.; Liang, Z.; Liu, Y.; Jiang, Z.; Liu, Z.; Zhou, L.; Tang, L. Mesoscale Modeling of Epoxy Polymer Concrete under Tension or Bending. Compos. Struct. 2021, 256, 113079. [Google Scholar] [CrossRef]
  65. Wang, Z.M.; Kwan, A.K.H.; Chan, H.C. Mesoscopic Study of Concrete I: Generation of Random Aggregate Structure and Finite Element Mesh. Comput. Struct. 1999, 70, 533–544. [Google Scholar] [CrossRef]
  66. Goodfellow, I.; Bengio, Y.; Courville, A. Deep Learning; MIT Press: Cambridge, MA, USA, 2016; ISBN 9780262035613. [Google Scholar]
  67. Higham, D.; Higham, N. MATLAB Guide; 2016; ISBN 0883854503. Available online: https://epubs.siam.org/doi/pdf/10.1137/1.9781611974669.fm (accessed on 14 December 2023).
  68. Hou, Z.; Guertler, C.A.; Okamoto, R.J.; Chen, H.; Garbow, J.R.; Kamilov, U.S.; Bayly, P.V. Estimation of the Mechanical Properties of a Transversely Isotropic Material from Shear Wave Fields via Artificial Neural Networks. J. Mech. Behav. Biomed. Mater. 2022, 126, 105046. [Google Scholar] [CrossRef] [PubMed]
  69. Rasamoelina, A.D.; Adjailia, F.; Sincak, P. A Review of Activation Function for Artificial Neural Network. In Proceedings of the SAMI 2020—IEEE 18th World Symposium on Applied Machine Intelligence and Informatics, Herlany, Slovakia, 23–25 January 2020; pp. 281–286. [Google Scholar] [CrossRef]
  70. Mercioni, M.A.; Holban, S. The Most Used Activation Functions: Classic Versus Current. In Proceedings of the 2020 15th International Conference on Development and Application Systems, DAS 2020—Proceedings. Suceava, Romania, 21–23 May 2020; pp. 141–145. [Google Scholar] [CrossRef]
  71. Olden, J.D.; Joy, M.K.; Death, R.G. An Accurate Comparison of Methods for Quantifying Variable Importance in Artificial Neural Networks Using Simulated Data. Ecol. Modell. 2004, 178, 389–397. [Google Scholar] [CrossRef]
  72. Maleki, E.; Bagherifard, S.; Guagliano, M. Correlation of Residual Stress, Hardness and Surface Roughness with Crack Initiation and Fatigue Strength of Surface Treated Additive Manufactured AlSi10Mg: Experimental and Machine Learning Approaches. J. Mater. Res. Technol. 2023, 24, 3265–3283. [Google Scholar] [CrossRef]
  73. Xiao, Y.; Niordson, C.F.; Nielsen, K.L. Void Size, Shape, and Orientation Effects in Shear-Dominated Void Coalescence across Scales. Eng. Fract. Mech. 2023, 279, 109045. [Google Scholar] [CrossRef]
  74. Laursen, C.M.; DeJong, S.A.; Dickens, S.M.; Exil, A.N.; Susan, D.F.; Carroll, J.D. Relationship between Ductility and the Porosity of Additively Manufactured AlSi10Mg. Mater. Sci. Eng. A 2020, 795, 139922. [Google Scholar] [CrossRef]
  75. Kumar, P.; Chandran, K.S.R. Strength–Ductility Property Maps of Powder Metallurgy (PM) Ti-6Al-4V Alloy: A Critical Review of Processing-Structure-Property Relationships. Metall. Mater. Trans. A Phys. Metall. Mater. Sci. 2017, 48, 2301–2319. [Google Scholar] [CrossRef]
  76. Benson, D.J. An Analysis of Void Distribution Effects on the Dynamic Growth and Coalescence of Voids in Ductile Metals. J. Mech. Phys. Solids 1993, 41, 1285–1308. [Google Scholar] [CrossRef]
  77. Needleman, A.; Kushner, A.S. An Analysis of Void Distribution Effects on Plastic Flow in Porous Solids. Eur. J. Mech. A Solids 1990, 9, 193–206. [Google Scholar]
  78. Gopal, S.; Patro, K.; Kumar Sahu, K. Normalization: A Preprocessing Stage. IARJSET 2015, 20–22. [Google Scholar] [CrossRef]
  79. Cadet, C.; Besson, J.; Flouriot, S.; Forest, S.; Kerfriden, P.; de Rancourt, V. Ductile Fracture of Materials with Randomly Distributed Voids. Int. J. Fract. 2021, 230, 193–223. [Google Scholar] [CrossRef]
  80. Nielsen, K.L.; Dahl, J.; Tvergaard, V. Collapse and Coalescence of Spherical Voids Subject to Intense Shearing: Studied in Full 3D. Int. J. Fract. 2012, 177, 97–108. [Google Scholar] [CrossRef]
  81. O’Shea, K.; Nash, R. An Introduction to Convolutional Neural Networks. Int. J. Res. Appl. Sci. Eng. Technol. 2015, 10, 943–947. [Google Scholar] [CrossRef]
  82. Cecen, A.; Dai, H.; Yabansu, Y.C.; Kalidindi, S.R.; Song, L. Material Structure-Property Linkages Using Three-Dimensional Convolutional Neural Networks. Acta Mater. 2018, 146, 76–84. [Google Scholar] [CrossRef]
  83. Gupta, A.; Cecen, A.; Goyal, S.; Singh, A.K.; Kalidindi, S.R. Structure–Property Linkages Using a Data Science Approach: Application to a Non-Metallic Inclusion/Steel Composite System. Acta Mater. 2015, 91, 239–254. [Google Scholar] [CrossRef]
Figure 1. (a): Geometry of the shear–compression specimen, showing the no pores (NP) and three pore (TP) models used for validation of the finite element models, and (b): different model discretization for mesh sensitivity analysis. A region of fine mesh is defined at the shear–compression failure band while coarser mesh was used in other regions to make the model computationally efficient.
Modelling 05 00001 g001
Figure 2. Automatic model development for data generation.
Modelling 05 00001 g002
Figure 3. (a): Schematic of the machine-learning-based ANN, and (bd): distribution of several input parameters, i.e., number of pores, standard deviation, and average pore volume, for samples in the dataset, respectively.
Modelling 05 00001 g003
Figure 4. Validation of the numerical models: (a): force–displacement curves of NP and TP models compared to experiments, and (b): the effect of pores on accumulated plastic strain of samples with and without pores.
Modelling 05 00001 g004
Figure 5. Mesh sensitivity analysis shows the correlation between element length and both failure displacement and the number of elements in the TP model.
Modelling 05 00001 g005
Figure 6. Results of the artificial neural network model: (a) accuracy versus the number of neurons for the model with one hidden layer (top) and two hidden layers (bottom), (b) the ANN model prediction versus the ground truth (form FE simulations) for failure displacement, and (c) the ANN model prediction versus the ground truth (form FE simulations) for peak force.
Modelling 05 00001 g006
Figure 7. Parametric analysis for normalized peak force for input values of: (a) number of pores (NOP) versus total volume (Vt), (b) number of pores (NOP) versus volume fraction (Vf), (c) standard deviation of size (SD) of pores versus average volume (Va), and (d) standard deviation of size (SD) of pores versus number of pores (NOP).
Modelling 05 00001 g007
Figure 8. Parametric analysis for normalized failure displacement for input values of: (a) number of pores (NOP) versus total volume (Vt), (b) number of pores (NOP) versus volume fraction (Vf), (c) standard deviation of size (SD) of pores versus average volume (Va), and (d) standard deviation of size (SD) of pores versus number of pores (NOP).
Modelling 05 00001 g008
Figure 9. Effect of distribution of pores on the fracture surface: (a) influence of pore distribution dispersion in models generated by inputs from points P1 and P2 from Figure 8b; (b) the same graph for points H1 and H2 from Figure 8d.
Modelling 05 00001 g009
Figure 10. Model sensitivity to input parameters (number of pores (NOP), total volume (Vt), volume fraction (Vf), average volume (Va), and standard deviation of size of pores (SD)).
Modelling 05 00001 g010
Table 1. Dimensions of the shear–compression specimen that are shown in Figure 1a.
DimensionValue (mm)DimensionValue (mm)
h20t13
d10t21.6
r1.5θ45°
L4φ20.45
Disclaimer/Publisher’s Note: The statements, opinions and data contained in all publications are solely those of the individual author(s) and contributor(s) and not of MDPI and/or the editor(s). MDPI and/or the editor(s) disclaim responsibility for any injury to people or property resulting from any ideas, methods, instructions or products referred to in the content.

