Article

Li+ Separation from Multi-Ionic Mixtures by Nanofiltration Membranes: Experiments and Modeling

Laboratory of Fluid Separations, TU Dortmund University, Emil-Figge Str. 70, 44227 Dortmund, Germany
*
Author to whom correspondence should be addressed.
Modelling 2023, 4(3), 408-425; https://doi.org/10.3390/modelling4030024
Submission received: 16 August 2023 / Revised: 8 September 2023 / Accepted: 16 September 2023 / Published: 20 September 2023

Abstract

:
Aqueous sources like salt lake brines and seawater are the most abundant source for lithium ions and might contribute to the growing demand for lithium for energy storage. By coupling with the increasingly relevant reverse osmosis systems, nanofiltration can provide a promising process alternative to conventional methods such as water evaporation and salt precipitation from ores or brines for this purpose. One possible model for nanofiltration is the solution-diffusion-electromigration model (SDEM). First, the model was parametrized by determining the permeances from simple electrolyte mixtures containing two salts. Then, the SDEM was used to predict the rejections of complex multi-electrolyte solutions that mimic seawater and reverse osmosis brine, without fitting additional parameters to experimental data of this complex mixture. This allowed predicting ion rejections satisfactorily. Negative rejections due to spontaneously generated electric fields in the membrane could also be qualitatively described. In summary, this SDEM modeling can provide an important contribution to the purification of Li+ from aqueous sources.

1. Introduction

The demand for lithium as an important component of lithium-ion batteries is actually increasing due to the increasing demand for electric cars. This partially results from political requirements such as the ban on combustion engines in the European Union from 2035 [1]. While the demand has almost tripled from 28,100 t in 2010 to 82,500 t in 2020, a demand of 900,000 t is forecast for 2025 [2]. Whereas current methods of lithium recovery, such as water evaporation, extraction from ores and extraction from brine or salt precipitation, cannot meet global demand and have ecological disadvantages [3], seawater offers a nearly inexhaustible source of 230 billion tons of lithium [4]. Research into new processes to utilize these enormous resources has increased significantly in recent years. In particular, research groups are focusing on liquid/liquid extraction [5], electrodialysis [6] and adsorption [7]. Also, membrane processes are considered to be a promising and environmentally friendly part of a process for the recovery of lithium from aqueous sources. The advantages of such membrane processes are especially the high energy efficiency, the simple scale-up and the easy operation in a continuous process [8,9]. While reverse osmosis can be used to concentrate Li+ and other ions non-selectively [10], aqueous nanofiltration (NF) can be used to lower the ratio of divalent ions to lithium ions, especially to decrease the Mg2+/Li+ ratio. This ratio is particularly critical in further steps for lithium purification. Mg2+/Li+ should ideally be less than 6, as this ratio is considered suitable for the subsequent removal of magnesium and other constituents by conventional precipitation methods by addition of sodium hydroxide or calcium hydroxide [11,12]. However, experimental studies on the separation performance of available membranes are required prior to implementing membrane processes on a large scale. Several membranes have already been characterized for Mg2+/Li+ separation using aqueous nanofiltration. The first studies on the application of nanofiltration from Li+-containing waters were conducted by Wen et al. [11]. Using the Desal-5 DL membrane, an attempt was made to realize the separation of Li+ from a multi-electrolyte solution consisting of high concentrations of Mg2+, BH4 and SO42−. However, the reported separation factor (SF) between Li+ and Mg2+ was only 3.5.
The separation factor between Li+ and Mg2+ is defined as:
S F i , j = c F , M g 2 + c F , L i + c P , M g 2 +   c P , L i +
where c P , i and c F , i are the ion concentrations of the permeate and feed stream, respectively.
Yang et al. [13] investigated the separation of Mg2+/Li+ from an initial ratio of 18–24, mimicking the East Taijinaier Salt Lake in China, using the Desal DK membrane. While Li+ showed a negative rejection of −60% depending on the permeate flow, Mg2+ could only be rejected to a maximum of 60%, resulting in an SF of 3.2. The experimental results were used to regress the membrane charge density (XD) as a model parameter from the Donnan-steric-pore model (DSPM). However, the model was not used to predict separations at other conditions, and a subsequent comparison with experimental data was also not performed. The Desal-5 DL membrane was further investigated in a work by Li et al. [14]. While SFs of 21 were achieved at high pressures and with a feed solution consisting exclusively of MgCl2 and LiCl, the rejection of Li+ in the presence of other monovalent cations increased significantly due to the competition to permeate through the membrane by size and electrostatic effects.
In contrast, significantly higher Mg2+ rejection was achieved by Somrani et al. [3] with the XLE (Filmtec, Dow) and NF90 (Filmtec Dow) membranes. With a brine solution mimicking a Tunisian salt lake, Mg2+ with a concentration of 0.3 g L−1 was rejected completely, while Li+ had a rejection of 16%. However, the initial flow rate dropped by 50% after 6 h. In a second membrane step, the authors investigated the separation of Li+/Na+, but the membrane was not selective to one of the species. Moreover, Bi et al. [15] used a DK 1812 module for their experiments on Mg2+/Li+ separation from brine. When only MgCl2 and LiCl were present in the feed solution, an SF of 42 was achieved under the best conditions. Once other cations such as Na+ or K+ were present, SF decreased to values between 10 and 12. The Desal DL (Suez) was studied by Sun et al. [16]. Different influencing factors on Mg2+/Li+ separation like concentration, operating pressure, water inlet temperature, and pH of solution were systematically investigated for an artificial composition of the East Taijiner Brine Lake, China. The authors concluded that high transmembrane pressure (20 bar), elevated temperature (308 K), low pH (3.1) and a low Mg2+/Li+ ratio of 50 were beneficial for the Mg2+/Li+ separation. A further study of Pramanik et al. [12] investigated the combination of nanofiltration with membrane distillation for lithium recovery. However, in NF with the NF270 (Filmtec, Dow), only an SF of 8.1 was obtained between Mg2+ and Li+, whereas the pretreated electrolyte solution was concentrated fivefold during membrane distillation. Very recently, an integrated membrane cascade system for Mg2+/Li+ separation was proposed by Ashraf et al. [17]. By interconnecting an ultrafiltration (UA001) and a nanofiltration (NF270) membrane, an SF of 15.4 was achieved and 82.5% of Li+ was recovered.
Besides commercially available membranes, a research field has also emerged that deals with tailor-made membranes for Li+ separation and purification. Zhang et al. [18] developed a membrane of polyethersulfone and polyethylenimine, which, in a performance analysis also based on the East Taijiner brine in China, showed only low Mg2+ rejection (below 60%) and a low permeance of 0.5 L m−2 h−1. An interesting approach was also taken by Zhang et al. [19], who incorporated a typical Li+ liquid/liquid extraction system, tributyl phosphate and FeCl3 into a polyvinyl chloride-based polymer inclusion membrane. A high SF of up to 176 was achieved, but the high loss of 18% of FeCl3 after a batch also shows that this system is not yet mature and leads to further separation efforts. Other tailor-made membranes for this application were developed by Zhao et al. [20], Xu et al. [21], Wang et al. [22], Saif et al. [23], Luo et al. [24], Li et al. [25] and He et al. [26].
Zhang et al. [18] and Zhang et al. [27] recently summarized the research on Mg2+/Li+ separation from aqueous systems using nanofiltration.
To conclude, the separation of Li+ and polyvalent cations by nanofiltration works well depending on the membrane, but especially the effect on separation performance of other ions besides Mg2+ and Li+ has not yet been studied intensively. The studies presented are also limited to concentrated brines, but these are only available in a limited number of locations around the world. Experiments on the NF separation of Li+ in the concentration range of seawater are still lacking. Moreover, most of the previous work is limited to experimental studies, while research on modeling the Li+ separation behavior under different operating conditions is scarce. Nevertheless, several approaches exist to model nanofiltration in multi-electrolyte solutions, such as the Spiegler–Kedem model [28], the Teorrell–Meyer–Sievers model [29] and the Donnan-steric-pore dielectric exclusion model (DSPM-DE). The latter has been used for a variety of nanofiltration applications, such as NaCl/Na2SO4 separation [30], purification of amine solutions [31] and even in the presence of various single salts [32]. Liu et al. [33] were also able to explore the influence of the surface charge of the support layer on the membrane performance using the DSPM-DE. In the DSPM-DE, the equilibrium distribution at the two membrane interfaces is linked to the transport within the homogeneous polymer matrix described by the extended Nernst–Planck equations. A combination of steric exclusion, Donnan potential difference and dielectric exclusion describes the partitioning relations [34,35]. The disadvantage of DSPM-DE is the requirement of a huge experimental database effort and the lack of prediction performance, especially in the separation of mono- and divalent ions [35,36]. However, Rehman and Lienhard [37] recently showed that the number of model parameters can be reduced using global optimization. Using this method, Foo et al. [38] were able to predict the separation of monovalent ions and divalent ions in different salt lakes. However, the model parameters had already been directly regressed to the rejection of electrolyte solutions with up to six ion species.
Using simplified models can be significantly more practical for engineering purposes. Hence, in the early stages of process design, the feasibility of a membrane plant can be estimated based on a few required model parameters. Several authors have shown that individual ion rejections in electrolyte mixtures can be described using constant ion permeances [35,39,40,41]. These phenomenological parameters in the so-called solution-diffusion-electromigration model (SDEM) lump the membrane thickness, the partitioning coefficient and the ion diffusivity in the membrane into a single parameter per ion species. Pages et al. [40,42] applied SDEM to a variety of combinations of dominant salts (NaCl, MgCl2) and trace ions (Na+, Cl, SO42−), and permeances were obtained by fitting to experimental rejection data. Moving one step further toward industrial applications, Reig et al. [43] measured and modeled ion rejections with a flat-sheet laboratory-scale configuration and an industrial spiral wound configuration. The modeling approach with constant ion permeances was able to describe the ion rejections well, and the ion rejections of the different configurations were modeled qualitatively and correctly. Despite the simplification in the derivation of the SDEM model, the model can be extended, for instance, for concentration polarization or reactions between species in solution as conducted by López et al. [44]. The extended model was applied to predict ion rejections from a complex electrolyte mixture, mimicking the Llobregat river water, and it was able to reproduce the rejections qualitatively. Another application-oriented study was conducted by Fridman-Bishop et al. [35], who predicted the rejection of major seawater ions (Na+, Cl, Ca2+, Mg2+ and SO42−) by incorporating a concentration dependence of ion permeances. Wang et al. [45] also used a concentration dependence of the permeance in their work on Mg2+/Li+ separation and made it clear that, in addition to the separation factor, the lithium recovery also plays a major role for a meaningful separation. In summary, it can be stated that the SDEM model is able to reflect experimental data for a wide range of solutes and concentrations. However, SDEM has not yet been applied to predict Li+ separation from complex aqueous sources.
Therefore, this work comprises three parts: 1. an introduction to the used model and the method to solve the equations algebraically, 2. the measurement of rejections in several electrolyte mixtures and 3. the application of the model to predict the experimental data with the minimum number of parameters. To select a suitable commercially available membrane, different membranes were evaluated experimentally (
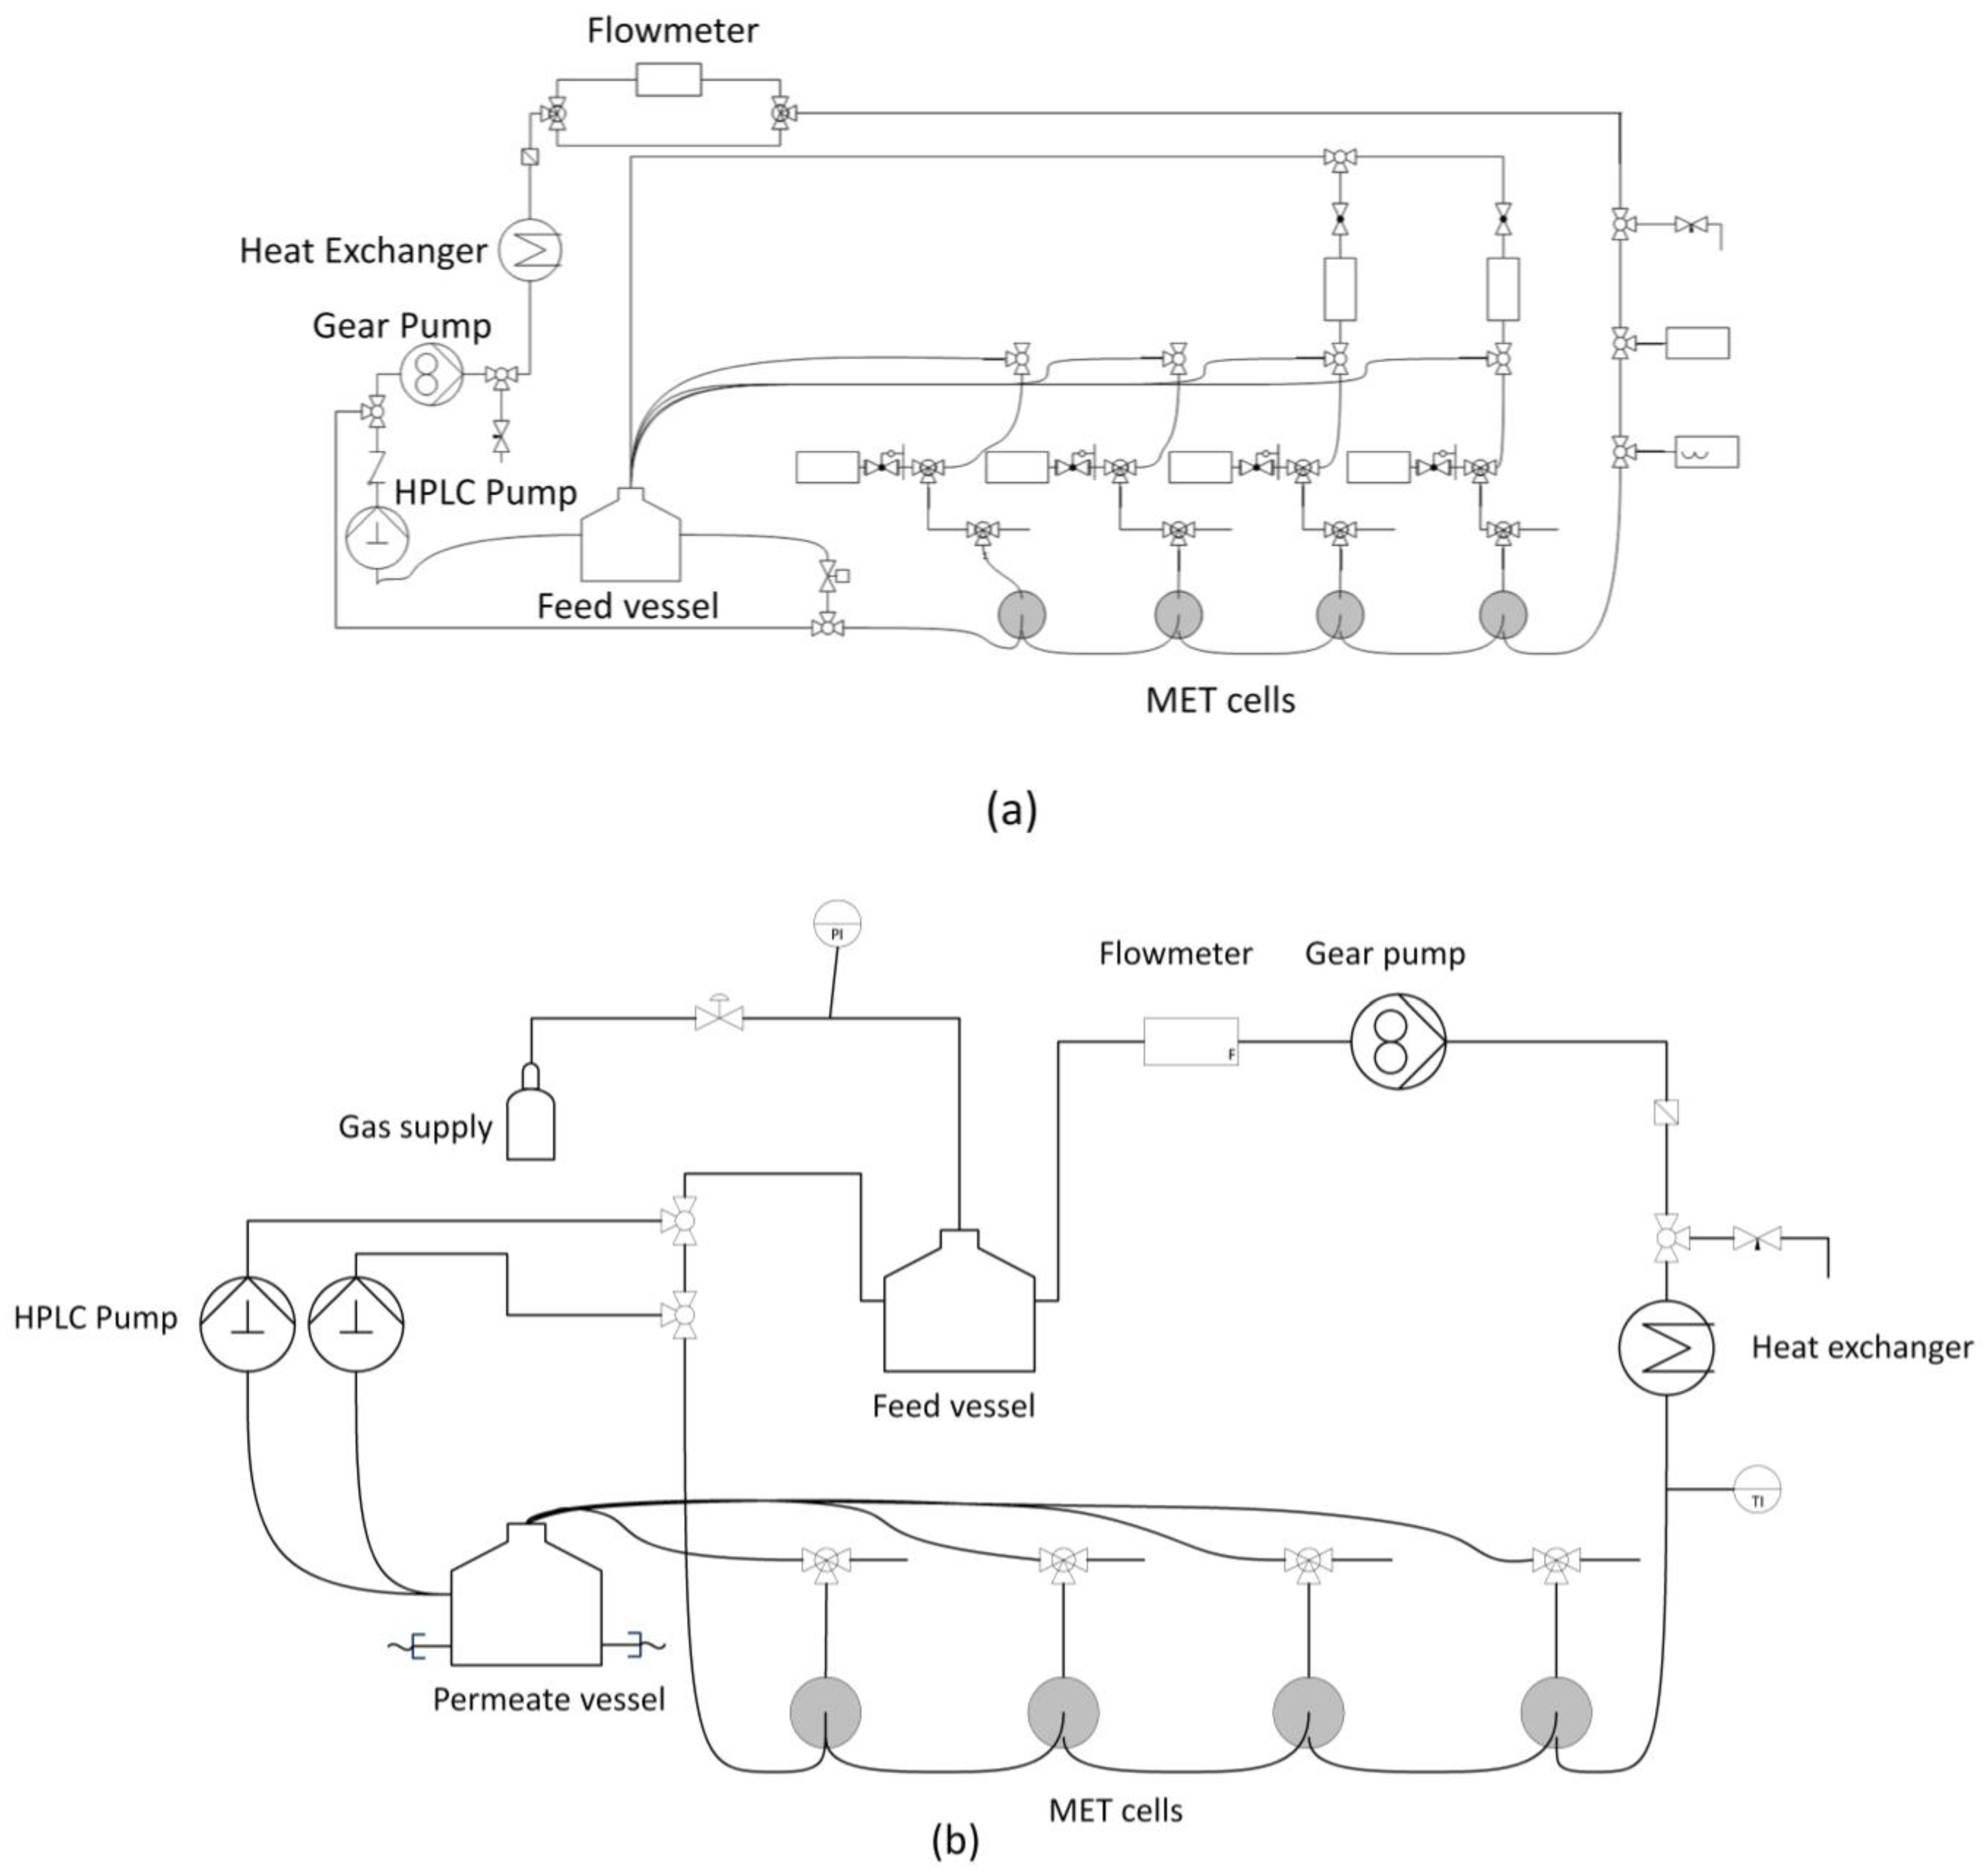
Section 3.1). The experimental setup and procedure to determine the ion permeances are described in Section 3.2. Finally, the comparison between predicted rejections for complex multi-electrolyte systems and experimental data is presented in Section 3.3. The findings of the work are concluded in Section 4.

2. Theory

2.1. Modeling Approach

The one-dimensional transport of ion i without convection can be described by Equation (2) [46]:
j i = c ¯ i D i R T d μ ¯ i e d x
where μ ¯ i e is the electrochemical potential of ion i, c ¯ i is the real concentration of this ion in the membrane, x is the transmembrane coordinate and D i and is the ion diffusivity. The electrochemical potential μ i e can also be expressed in terms of a virtual aqueous solution that is in equilibrium with a particular point in the membrane. Then, the electrochemical potential can be defined by [46]:
μ i e = μ i 0 + R T ln ( γ i c i ) + z i F R T ϕ
Here, γ i and c i are the activity coefficient and the ion concentration of ion species i in the virtual solution, z i is the ion charge, F is the Faraday constant, T is the temperature, R is the ideal gas constant and ϕ is the electrostatic potential. Assuming constant activity coefficients, with the definitions for the partition coefficient Γ i and permeances P i [46]:
Γ i = c ¯ i c i   a n d   P i = Γ i D i
Equation (3) can be rearranged in Equation (2) for the ion flux:
j i = P i d c i d x Z i P i c i F R T d ϕ d x
In addition, the electroneutrality condition holds at every point in the virtual solution:
i = 1 n c i Z i = 0
The further assumptions of the SDEM are listed in Appendix S5. To solve the resulting differential algebraic equation system (Equations (5) and (6)), we used collocation. Hereby, the system was transformed into a purely algebraic system of equations, which can then be solved by any nonlinear solver. Collocation is a numerical method to solve differential equations and differential algebraic equations considering boundary conditions by transforming the set of equations into purely algebraic equations. Yaroshchuk and Bruening [9] developed analytical solutions for special applications of the SDEM model, which enable a fast and simple calculation of the flux and concentration profile. However, analytical solutions are restricted to a small number of ion species. In order to solve the differential algebraic equation system in a general way, we transformed Equations (5) and (6) into an algebraic system of equations using orthogonal collocation, which can be solved by any non-linear programming solver. We used v = 6 collocation points, 4 internal collocation points, 1 at z 0 = 0 and 1 at z v = 1 . Note that z is the dimensionless transmembrane coordinate z = x δ . Thus, the boundary conditions were taken into account when solving the system of Equations (3) and (4). The first boundary condition at z 0 = 0 describes the feed concentration of the components. The second boundary condition results from the relationship between ion concentration in the permeate c i P , ion flux j i and the total permeate flux J v :
j i = c i P J v
To solve Equations (5) and (6), the concentration profile of an ion and the electrostatic potential over the membrane thickness δ, so-called modeled variables y , were approximated using polynomials y ( z ) with coefficients α i :
y z = θ 0 + θ 1 z + θ 2 z 2 + + θ v z v
Thus, for a polynomial of degree v, v collocation points were set across the thickness of the membrane. In this work, the collocation points were not chosen equidistantly, but result from the roots of the shifted Lagrange polynomials.
In previous works, the permeances have been regressed specifically for a so-called subsystem, consisting of a dominant salt (e.g., NaCl) and a trace salt (e.g., NaI). Hence, different permeances were obtained for Na+ depending on the kind of electrolyte, e.g., P N a + is different for NaCl + MgCl2 and NaCl + CaCl2 subsystems. The method of combining dominant and trace salts to characterize transport properties of NF membranes was first presented by Yaroshchuk and Ribitisch [47] and was then used by many other authors [40,42,43,48,49]. In order to overcome this shortcoming, the concentration of trace ions must be so low that it does not affect the membrane properties (e.g., fixed charge density) and that it does not cause strong interactions with the other salts. It was shown that the rejection of the trace ion is much more sensitive to the rejection mechanism than that of the dominant salts [47]. Because Na+ has by far the highest concentration in seawater, in our work we used only NaCl as the dominant salt and always measured the rejections and permeate fluxes in the combinations with NaCl and a single other salt using the concentrations observed in seawater Equation (5) was then established for each ion species and pressure level. Because Na+ and Cl occurred in each subsystem, Equation (5) was also set up only once for each. In addition, the electroneutrality condition Equation (6) was set up for each pressure level in each subsystem. This resulted in 56 data points for 8 pressure levels and 7 ion species for the reverse osmosis brine concentration range. Subsequently, the ion permeances (Equation (5)), as the only fitting parameters, were fitted to all subsystems simultaneously so that only one permeance was obtained for each ion species. By directly fitting the permeance, the system of equations was solved several times in each iteration step, but this did not significantly increase the computation time due to the prior transformation into an algebraic system. The sum of the sums of the root of squares between experimental rejection and calculated rejection (here called total sum of errors (tse)) served as the objective function to be minimized. Thus, for q subsystems, n pressure levels and p ion species, this results in:
t s e = k = 1 q 1 n h = 1 n l = 1 p R e x p , k , h , l R c a l c . , k , h , l 2
The optimization problem was implemented in Matlab™ and solved using a multi-start solver. In the next step, these permeances were used to predict the rejections of a complex multi-electrolyte solution with Equation (5). The predicted rejections were compared to the experimentally determined rejections. The permeate fluxes were not predicted in this work.

2.2. Experimental Section

In order to measure the ion rejections as well as pure water and electrolyte solution fluxes, the used membranes, chemicals and the experimental procedure are described in the following sections.

2.2.1. Membranes and Chemicals

Three commercially available membranes were tested as flat sheets in a preliminary membrane screening. To the best of our knowledge, the NFAL membrane and TS40 membrane have not yet been tested for Mg2+/Li+ separation. Available information about the polymer used, the maximum operating pressure and the suppliers is provided in Table 1. The evaluation of the separation performance is described in Section 3.

2.2.2. Chemicals

All the reagents used were of analytical reagent grade. Magnesium chloride hexahydrate (MgCl2 6H2O), calcium chloride (CaCl2), potassium chloride (KCl), sodium chloride (NaCl) and sodium sulfate (Na2SO4) were purchased from Carl Roth, Karlsruhe, Germany. Lithium chloride monohydrate (LiCl 1H2O) was supplied by Thermo Fisher Scientific, Ward Hill, USA. The Stokes radii of the ions present in the prepared solutions are depicted in Table 2. The aqueous solutions were prepared using deionized water (MilliQ), produced by a Millipore system (Millipore System, Molsheim, France) with an electrical conductivity < 0.55 µS cm−1 and pH = 7.34 ± 0.2. Accounting for the molar masses, the electrolyte solutions were prepared from the reagents for seawater concentrations [53] and concentrations of a retentate stream of a reverse osmosis plant [54] as shown in Table 3 and Table 4.

2.2.3. Membrane Setup

Two different lab-scale setups for cross-flow measurement were used for the membrane experiments. Circular membrane modules supplied by Evonik MET contained the membrane cutouts with an active membrane area of A m e m = 17 cm2. The transmembrane pressure difference Δ p between the feedside pressure and the atmospheric pressure on the permeate side of the membrane was varied between 5 and 40 bar at a constant temperature of 20 °C. The set mass flow rate of 75 kg h−1 resulted in a cross-flow velocity of 2.08 m s−1 calculated according to Lejeune et al. [57]. Based on the small membrane area and the high cross-flow velocity, the concentration polarization was neglected in the analysis of the separation efficiency and in the modeling approach. For the membrane screening, the setup depicted in Figure 1a was used. It consisted of a feed vessel, an HPLC pump for pressure generation and four membrane cells connected in series. Each membrane cell contained a membrane cutout from the same batch of the membrane material to be screened in order to perform an estimation of the mean and standard deviation for membrane flux and ion rejection. The membrane flux, as determined by small samples in lab-scale experiments, is well known to exhibit significant variations due to the inhomogeneity of the membrane material [58]. Retentate and permeate were continuously recycled to the feed vessel. Before every experiment, all membranes were flushed with pure MilliQ water at 10 bar transmembrane pressure difference as recommended by the suppliers. Afterwards, the prepared electrolyte solution was charged into the feed vessel and the experiment was conducted until a constant permeate flux was achieved, which was monitored by Coriolis flowmeters.
The detailed characterization of the NFAL membrane performances was conducted in a similar cross-flow setup, which is depicted in Figure 1b. The pressure control is the major difference between the two setups. Instead of an HPLC pump, the whole system was pressurized using nitrogen. Moreover, the set-up comprises a feed vessel, a recirculation pump and four membrane modules connected in series, which are identical to the ones used in the membrane screening experiments. The permeate from the four modules was collected in an unpressurized permeate vessel from where it was continuously pumped back to the pressurized feed vessel by two HPLC pumps. Before performing any experiments, the membrane cutouts were placed overnight in a NaOH solution (pH 8.5–10.5) to wash out potential preservatives as recommended by the supplier. In these experiments, feed solutions were prepared with the concentrations shown in Table 4.

2.2.4. Analytical Methods

Subsequent to the experiments, the mass fractions of the feed and permeate samples for Li+, Na+, K+, Ca2+ and Mg2+ were determined by ion chromatography using a Dionex™ ICS-2100. The cations were analyzed with an analytical column 2 × 30 mm IonPac™ CS16-Fast-4 µm (Dionex), at 40 °C with a 10 µL injection volume and a conductivity detector. Millipore water with a 30 mM concentration of methanesulphonic acid (CH3SO3H) served as the eluent. For quantitative analysis, the substances were calibrated beforehand. The samples taken during the experiment were diluted one hundredfold for analysis. The Cl mass fraction was calculated by the electroneutrality condition (c.f. Equation(4)). The ion rejection R i of species i was calculated by:

3. Results and Discussion

In this section, the results of the membrane screening are presented to provide a justification for the membrane selection in this work. Then, the permeance fitting results are presented prior to evaluation of the prediction performance of the NF for more complex solutions using the fitted permeance of the subsystems.

3.1. Membrane Screening for Li+ Separation from Saltwater

Because high Mg2+ rejection and low Li+ rejection are critical for the separation of Li+ from aqueous media, the selected membranes were first tested in artificially mixed seawater feed STS (c.f. Table 4) at three pressure levels. Figure 2a depicts the SF between Mg2+ and Li+ for the applied pressures and different membranes. All membranes achieved an SF > 1. The pressure dependence is evident for all membranes, and the higher the pressure, the lower the SF. The NFAL membrane significantly outperforms the other two membranes at all pressure levels. In addition to the rejection, Figure 2b depicts the total flux obtained for the membrane setup. Flux is of crucial importance for the determination of the required membrane area for a specific separation task. The fluxes for the TS40 and NFAL membranes are very similar, considering the standard deviations determined from the four tested membrane cells, with an average flux of 95.1 kg m−2 h−1 and 86.9 kg m−2 h−1 at 40 bar for TS40 and NFAL membranes, respectively. The DL membrane exhibits a higher flux than the other two membranes with 121.6 kg m−2 h−1 at 40 bar. This is in accordance with the manufacturer’s data, which indicate a permeance of 7.73 L m−2 h−1 bar−1 for the DL membrane and 4.49 L m−2 h−1 bar−1 for the TS40 membrane at test conditions (2000 ppm MgSO4, 7.6 bar operating pressure, T = 25 °C). However, these values are not directly comparable with the values we measured, because the osmotic pressure in the experiments leads to a decrease in flux. Nevertheless, the flux values are satisfying.
A more detailed insight into the membrane NFAL is given by Figure 3, which shows rejections of all cations present in the feed solution for the different pressure levels. The divalent ions Mg2+ and Ca2+ show a high rejection which is nearly independent of pressure. In contrast, Li+ rejection strongly depends on pressure, which makes it the dominating factor for the pressure dependence of SF. Further, negative rejections of Li+ were observed at the lowest pressure level, indicating a favorable Li+ enrichment in the permeate. This changes at pressures above 30 bar. None of the membranes allowed a significant selectivity between Li+ and the other monovalent cations Na+ and K+ at the chosen conditions. The fact that one of the four cells had higher rejection and fluxes than the other three cells resulted in a comparatively large error bar for the DL membrane. Small defects in the active separation layer of this cutout could be the reason for this. Based on these screening experiments, the NFAL membrane was selected as the most promising one because of the beneficial ion rejections and Mg2+/Li+ factors. Both are of the upmost importance for the application, and acceptable fluxes were still achieved. Thus, the NFAL membrane was used to further characterize and model the separation of Li+ from seawater in Section 3.2. Rejection and fluxes for the NFAL membrane are stable over time and were constant for an aqueous NaCl solution at a constant pressure for at least 7 h.
For the ion rejections for the DL and TS40 membranes, please refer to Figures S1 and S2 in Appendix S2.

3.2. Membrane Characterization

Based on the results of the membrane screening shown in Section 3.1, the NFAL membrane (Alfa Laval) was further investigated with the objective of determining the ion permeances according to the SDEM model (Equation (5)) and the procedure in Section 2.1. For the ROB experiments, the experimental results and the rejection profiles calculated with the SDEM for the different subsystems are shown in Figure 4. For the MW experiments, the experimental results are listed in Tables S9–S14 in the Supporting Information.
Noticeably, the rejection for all ions in all subsystems increased with increasing permeate flux and increasing feed pressure. Pressure increases the driving force for the water flux while affecting the ion fluxes to a smaller extent, and this results in a higher water fraction in the permeate and finally in higher rejections. Moreover, it can be observed that the rejection of the divalent ions SO42− (Figure 4a), Mg2+ (Figure 4b) and Ca2+ (Figure 4c) is significantly higher than the rejection of the monovalent ions (Figure 4d,e).
The fitted rejections of the Mg2+ ions are in good agreement with the experimental data. The high rejections are also expressed in the significantly lower permeances of Mg2+ and Ca2+ (see Table 5), which include the Donnan effect and dielectric exclusion. These low permeances compared to monovalent ions are consistent with the observations in other studies by Pages [40,42] and Reig [43].
Figure 4b depicts a negative Na+ rejection measured for low permeate fluxes, which is also reproduced by the model. Among all subsystems, it is the only one with a measured and calculated negative Na+ rejection. This is caused by the high Mg2+ rejection, which leads to the formation of an electrical potential [59]. The negative Na+ rejection is in accordance with other works [59,60]. Therefore, by fixing the concentrations to those of seawater and RO brine, Mg2+ is no longer a trace salt in the original sense, because the presence of Mg2+ ions affects the rejection of the dominant salt NaCl. However, this negative Na+ rejection is not observed for the subsystem with CaCl2 (c.f. Figure 4c), suggesting that a high concentration of a divalent ion with a low permeance is essential for the occurrence of negative rejection. The Ca2+ rejection does not increase as steeply compared to the Mg2+ rejection and approaches a constant value of 87%. Nonetheless, at higher permeate fluxes, the model slightly overestimates the rejection for Ca2+ similar to Mg2+. The rejection of K+ (c.f. Figure 4d) can be fitted in good agreement to the experimental data, but here, the rejection of Cl and Na+ is slightly overestimated. It is encouraging to note that Li+ (c.f. Figure 4e) has the lowest rejection of all the cations considered in the range J v < 15·10−3 kg m−2 s−1, with a maximum rejection of 12.3%. The fact that electrostatic effects also play a role here can be seen from the Stokes radii in Table 1. Although Li+ has the largest Stokes radius of the monovalent ions, it has the lowest rejection. In Figure 4e, it can be observed that, because the Li+ concentration is extremely low, due to the electroneutrality condition, the rejection of Cl and Na+ is almost identical. This can also be reproduced when fitting the permeances of the model. In addition, the size of the error bars in Figure 4 provides a measure of the uncertainty resulting potentially from defects in the different cutouts, which lead to the standard deviation in the measured permeate fluxes and rejections. Nonetheless, the reported standard deviations are in the expected range of lab-scale experiments for commercial membranes [58]. However, the fitting to the SDEM produces a positive Li+ rejection, whereas the error bar of the experimental data does not allow a definite statement on this. Due to the low Li+ feed concentration, even very small amounts of positively charged ions with lower permeances in the feed mixture can provide negative Li+ rejection.
Considering all subplots in Figure 4, it is evident that the pressure dependence of the rejections of the divalent ions is much less pronounced than of the monovalent ions. This is a well-known phenomenon, which can be explained by the Donnan equilibrium as well as by the dielectric exclusion. The lower dielectric constant of water inside the membrane (compared to the bulk solution of the feed) causes an increase in the solvation energy. This additional energy must be provided for ions to enter the pore of the membrane [3,61]. Because the excess solvation energy is proportional to the square of the ionic charge, this results in an increased rejection of divalent ions [62].
Additionally, a charged membrane rejects ions due to the Donnan equilibrium. Thereby, divalent ions are rejected more strongly than monovalent ions [60]. Even at a low permeate flux, the rejection of Mg2+ is almost constant with values greater than 95% (c.f Figure 4b), which can be represented well by the SDEM model.
Besides the graphical representations in Figure 4, the fitting errors of the individual subsystems are also listed in Table 6 in order to provide a quantitative statement on the quality of the fitting. Remarkably, especially for the systems LiCl + NaCl and NaCl + Na2SO4, the errors are particularly small. Approximately four times as high is this value for the system NaCl + CaCl2. The concentration polarization layer, which we explicitly did not consider for reasons of simplicity and which can result from high Ca2+ rejection, could be the reason for this. Nevertheless, the plot shows that the curves can be represented quite well. Particularly noteworthy is that the relationship between permeate flux and rejection can be well reproduced for all subsystems even though only a single parameter was fitted for each ion species. Especially outstanding is the profile of Cl and Na+ in the subsystems, because for both ion species, even five different profiles can be described with the fitted permeance values and even the negative rejection of Na+ in the system NaCl + MgCl2 is correctly reproduced.

3.3. Prediction of Ion Rejections in Multi-Electrolyte Solutions

In this section, the permeances determined by fitting to the experimental rejections of the subsystems in Section 3.2 are used to predict the rejections for the multi-electrolyte systems. Thus, permeances determined from the simpler subsystems at the same ion concentrations are transferred to a much more complex multi-electrolyte solution with more ion species. The multi-electrolyte systems in this work did not contain the ion species SO42− because the modeling did not account for complexation with the Mg2+ ions.
Figure 5 shows the predicted rejections R i of the ion species of the multi-electrolyte reverse osmosis brine (ME-ROB) feed as a function of the measured permeate flux Jv. The higher rejections of the divalent Mg2+ and Ca2+ ions (compared to the monovalent ions) can be reproduced quantitatively well. Even the lower rejections of Ca2+ (R = 0.49) and Mg2+ (R = 0.74) that occur at low permeate fluxes were predicted accurately. This is particularly noteworthy because the measured rejections were much higher in the subsystems with a dominant and trace salt (see previous section). The asymptotic approximation of high rejections at high permeate fluxes, as produced by the virtues of the model, is also well reproduced. In addition, the rejections of Cl calculated from the electroneutrality condition can be predicted reasonably especially for permeate fluxes up to Jv < 8·10−3 kg m−2 s−1. At higher permeate fluxes, the prediction slightly underestimates the experimental data.
While negative rejections occurred only for Na+ in the aqueous subsystem NaCl + MgCl2, all monovalent cations show a negative rejection at low permeate fluxes in the complex mixture. Nonetheless, the model is able to precisely predict these negative rejections. The Li+ rejection is predicted with high precision. The change from negative to positive rejection between Jv < 8·10−3 kg m−2 s−1 and Jv < 10·10−3 kg m−2 s−1 is also well reproduced. Li+ rejection is accurately predicted even at higher permeate fluxes. Compared to the subsystems used for the fitting (see Section 3.2), it can be seen that the Li+ rejection changes into positive values at higher permeate fluxes. In contrast to this high accuracy regarding Li+, the rejection of K+ is underestimated over the entire flux range. This can also be seen considering the tse values in Table 7. The tse value for K+ is the highest compared to the other five ion species, accounting for nearly 40 percent of the total tse value. Reasons for this may be the assumptions of the model used, the constant partition coefficient and the neglect of convection. Additionally, because of the high feed concentration of Mg2+ ions, it could be assumed that the Mg2+ ions interact with the membrane charges, increasing the rejection of the cations due to a charge reversal. Nonetheless, the general trends of the rejections can be well reproduced with only one ion-specific parameter.
Considering the low rejection of monovalent ions, we assume that the influence of concentration polarization on their behavior is also minimal. However, for divalent ions, this phenomenon is more significant and can potentially explain the slightly higher predicted rejection for Mg2+.
Figure 5 also shows impressively that the phenomenological SDEM model, which uses few parameters, is well suited to describe and predict the complex multi-electrolyte solution. With other models such as the Spiegler–Kedem model and the solution-diffusion model, low and negative rejection cannot be reasonably reproduced.

4. Conclusions

The increasing demand for lithium, along with the challenges associated with current production methods, necessitates the exploration of new processes for lithium recovery. In this regard, nanofiltration emerges as a promising, energy-efficient and easily scalable solution. The aim of this study was to model and predict ion rejection as a function of permeate flux. The approach involved determining ion-specific permeances using the solution-diffusion-electromigration model, based on experimental rejections from subsystems, and subsequently predicting rejections in multi-electrolyte systems. A novel approach was employed to determine ion permeances by directly fitting the solution-diffusion-electromigration model in the respective aqueous subsystems.
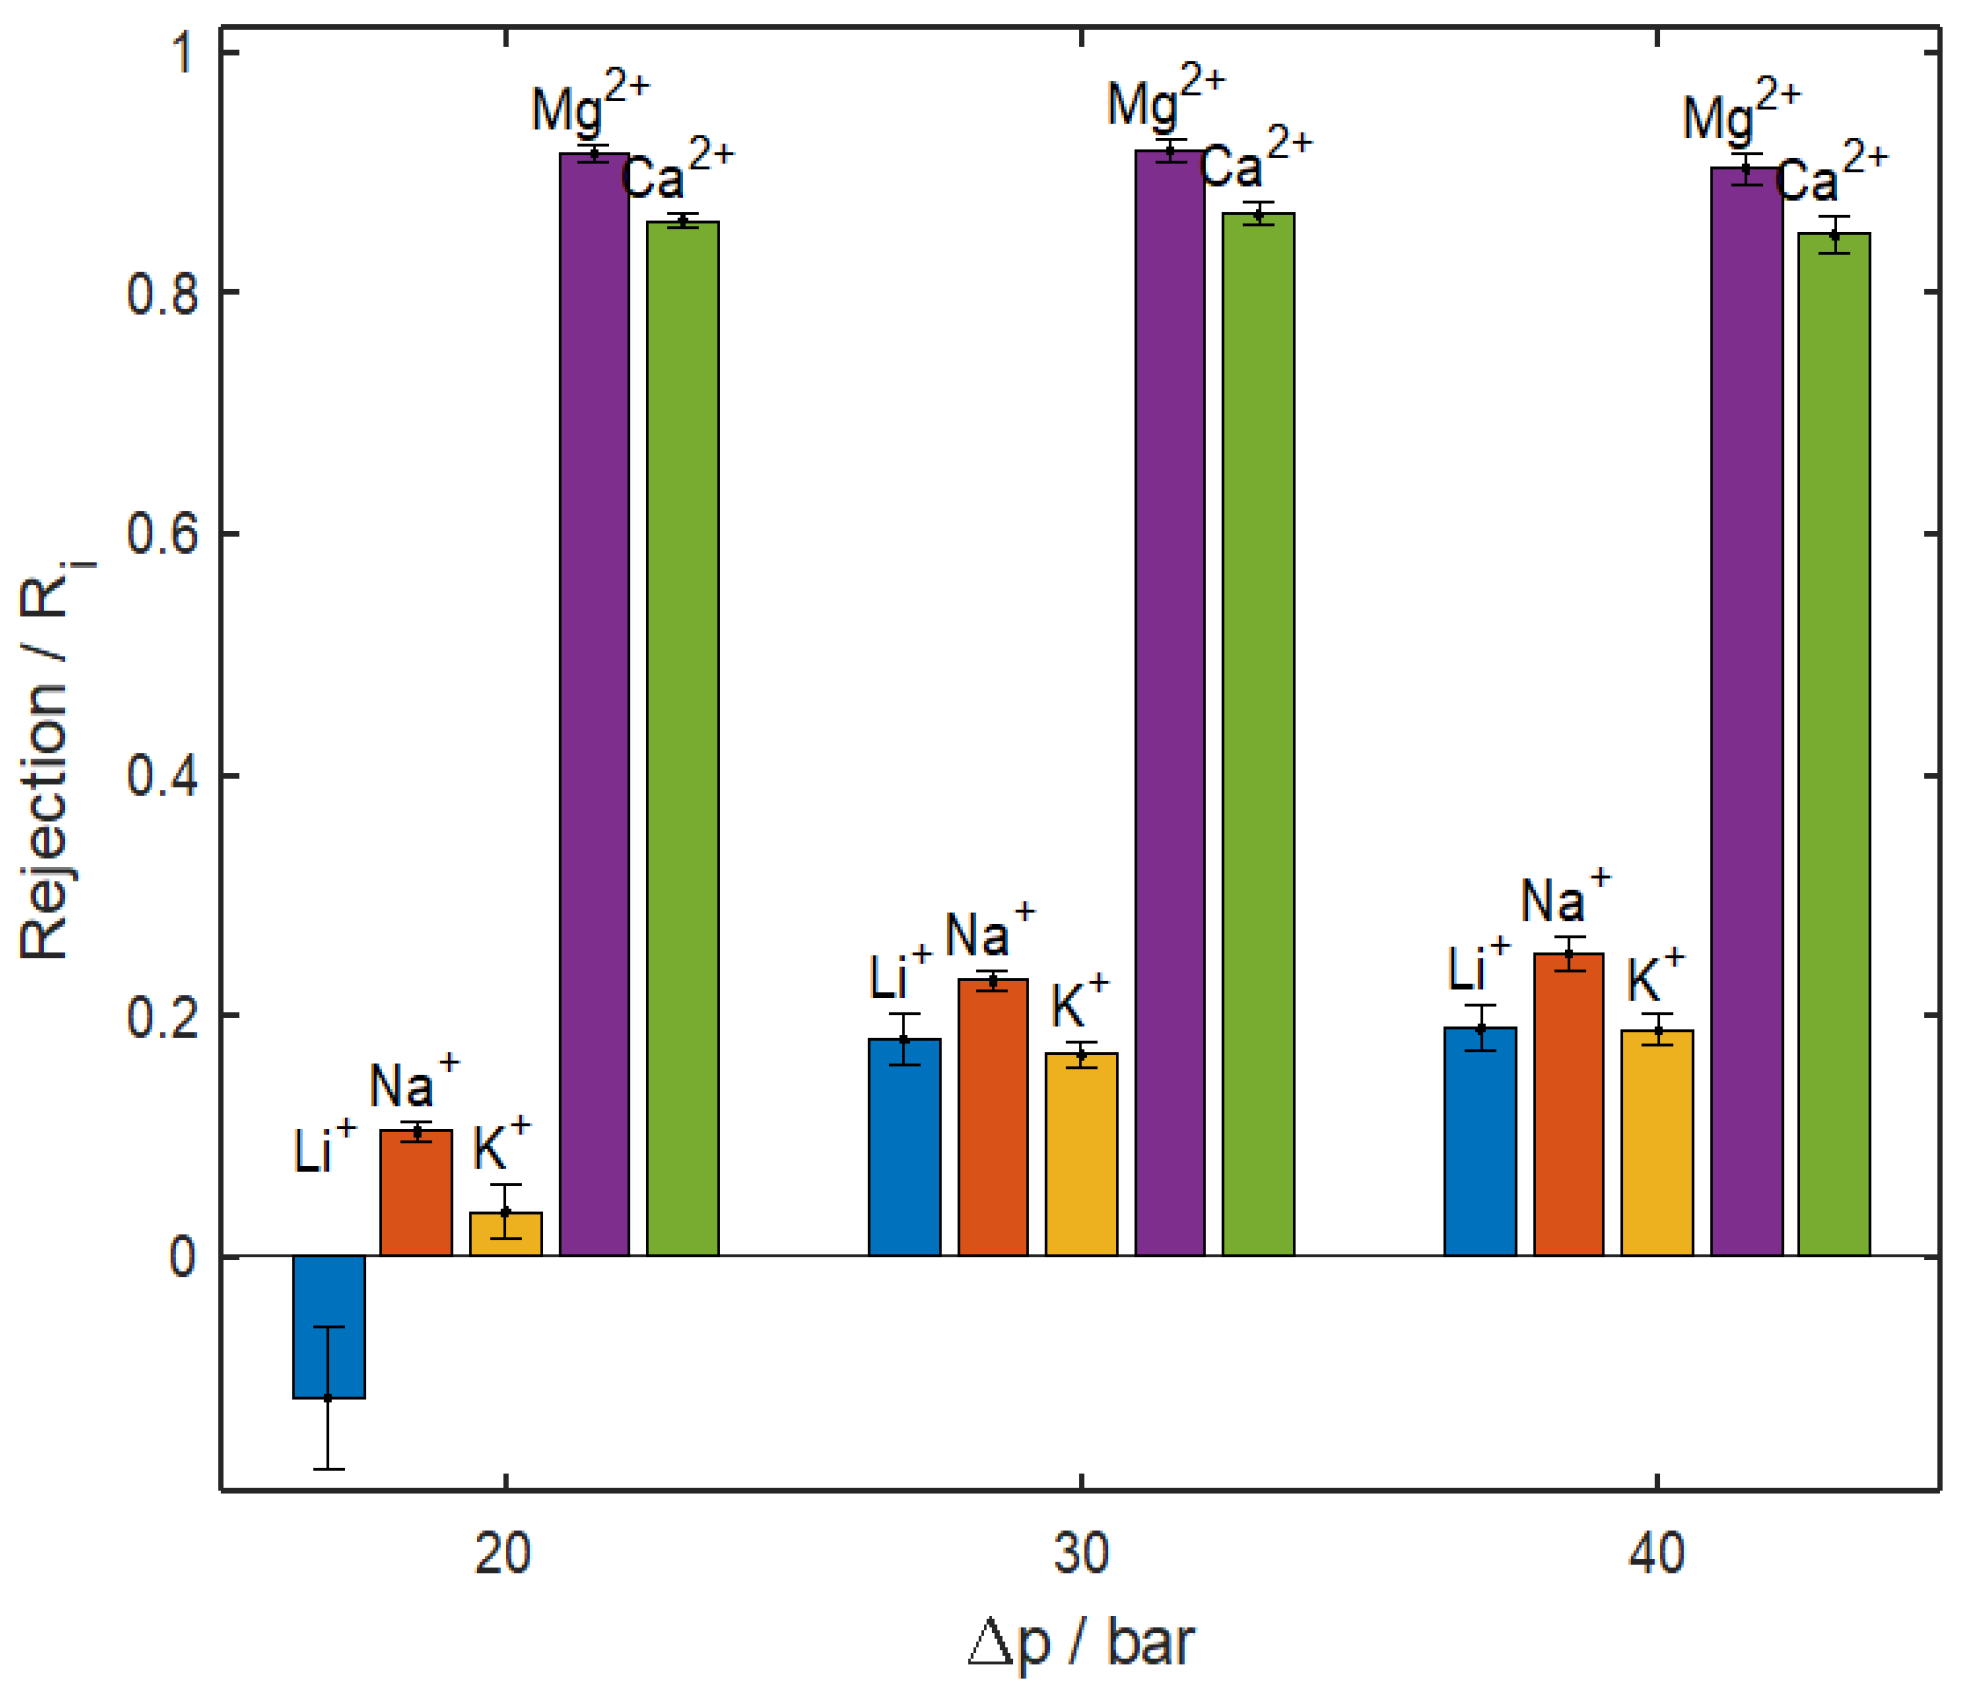
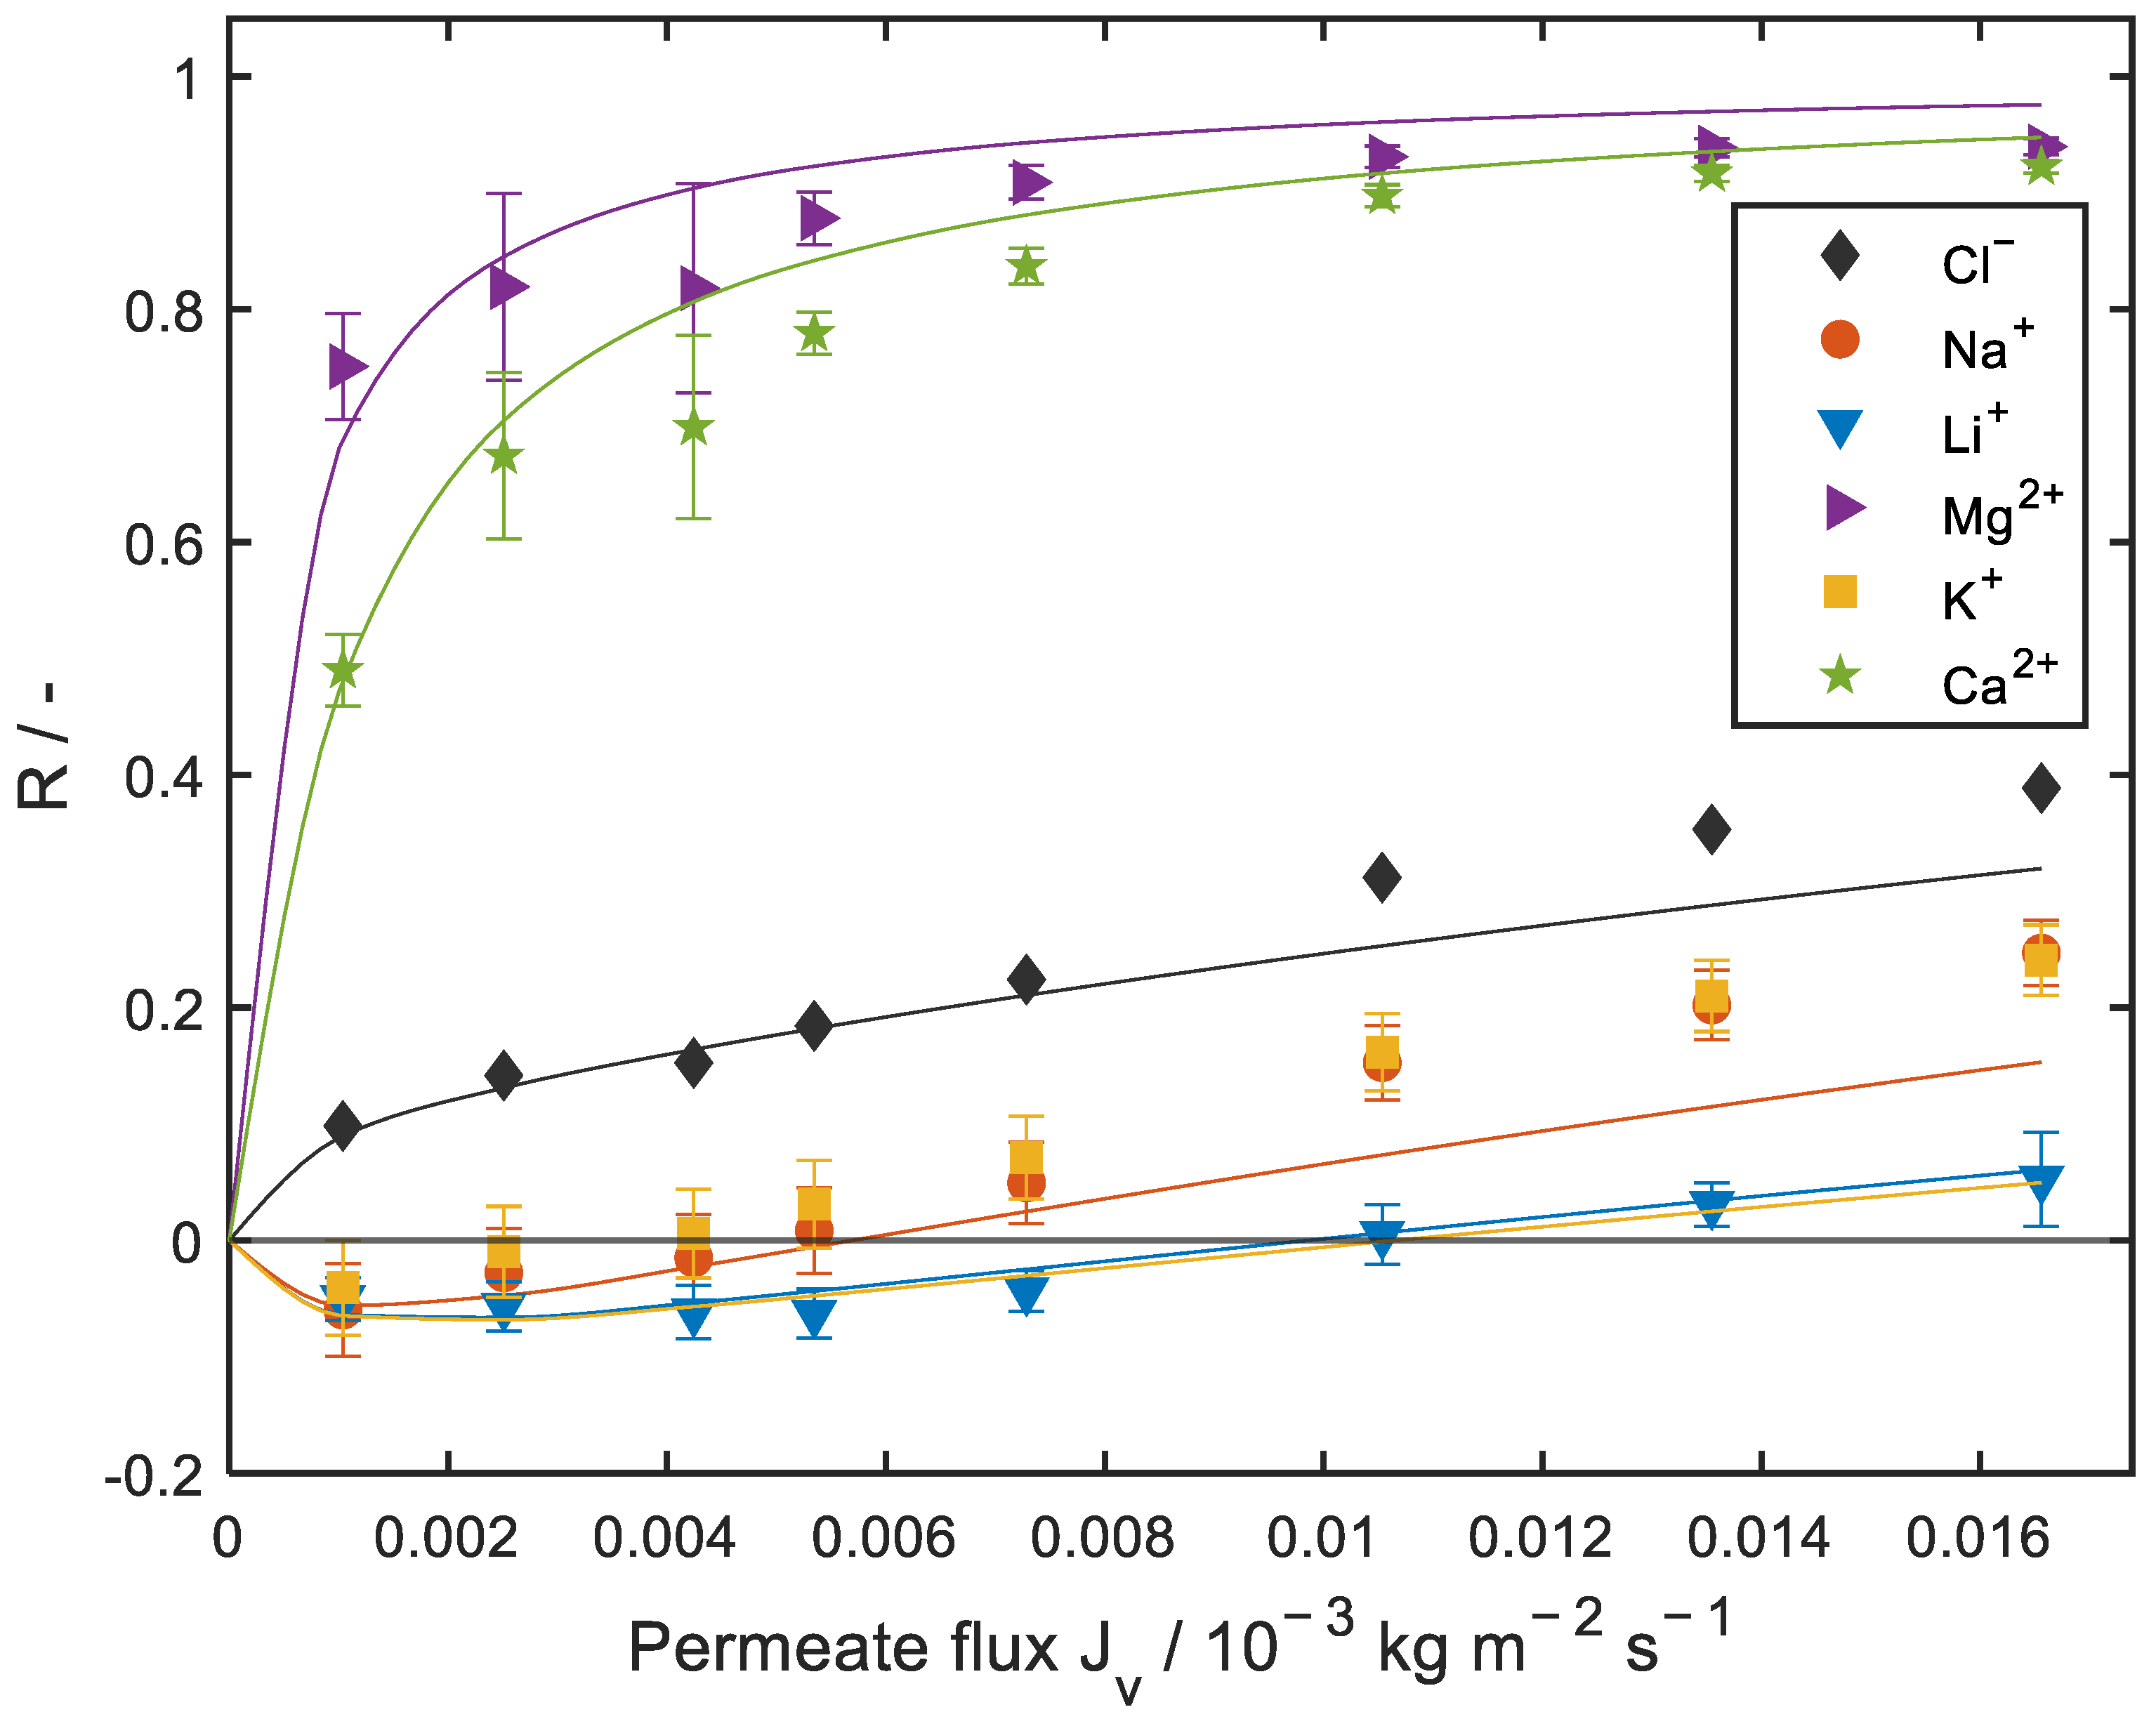
When considering the experimental results, it was found that the rejections of the divalent cations Mg2+ and Ca2+ were at least 50% higher than those of the monovalent cations Na+, Li+ and K+. The largest difference, over 90%, was observed at Δp = 5 bar between the rejections of the ions Mg2+ and Li+. In addition, the rejection of the Li+ ions was negative at this feed pressure. In reverse osmosis brine (ME-ROB), the Mg2+/Li+ mass ratio is about 8300. To reduce this ratio, nanofiltration is a suitable process, and it could be reduced to about 582 by the NF (Alfa Laval) membrane with a single-stage process at 45 bar feed pressure.
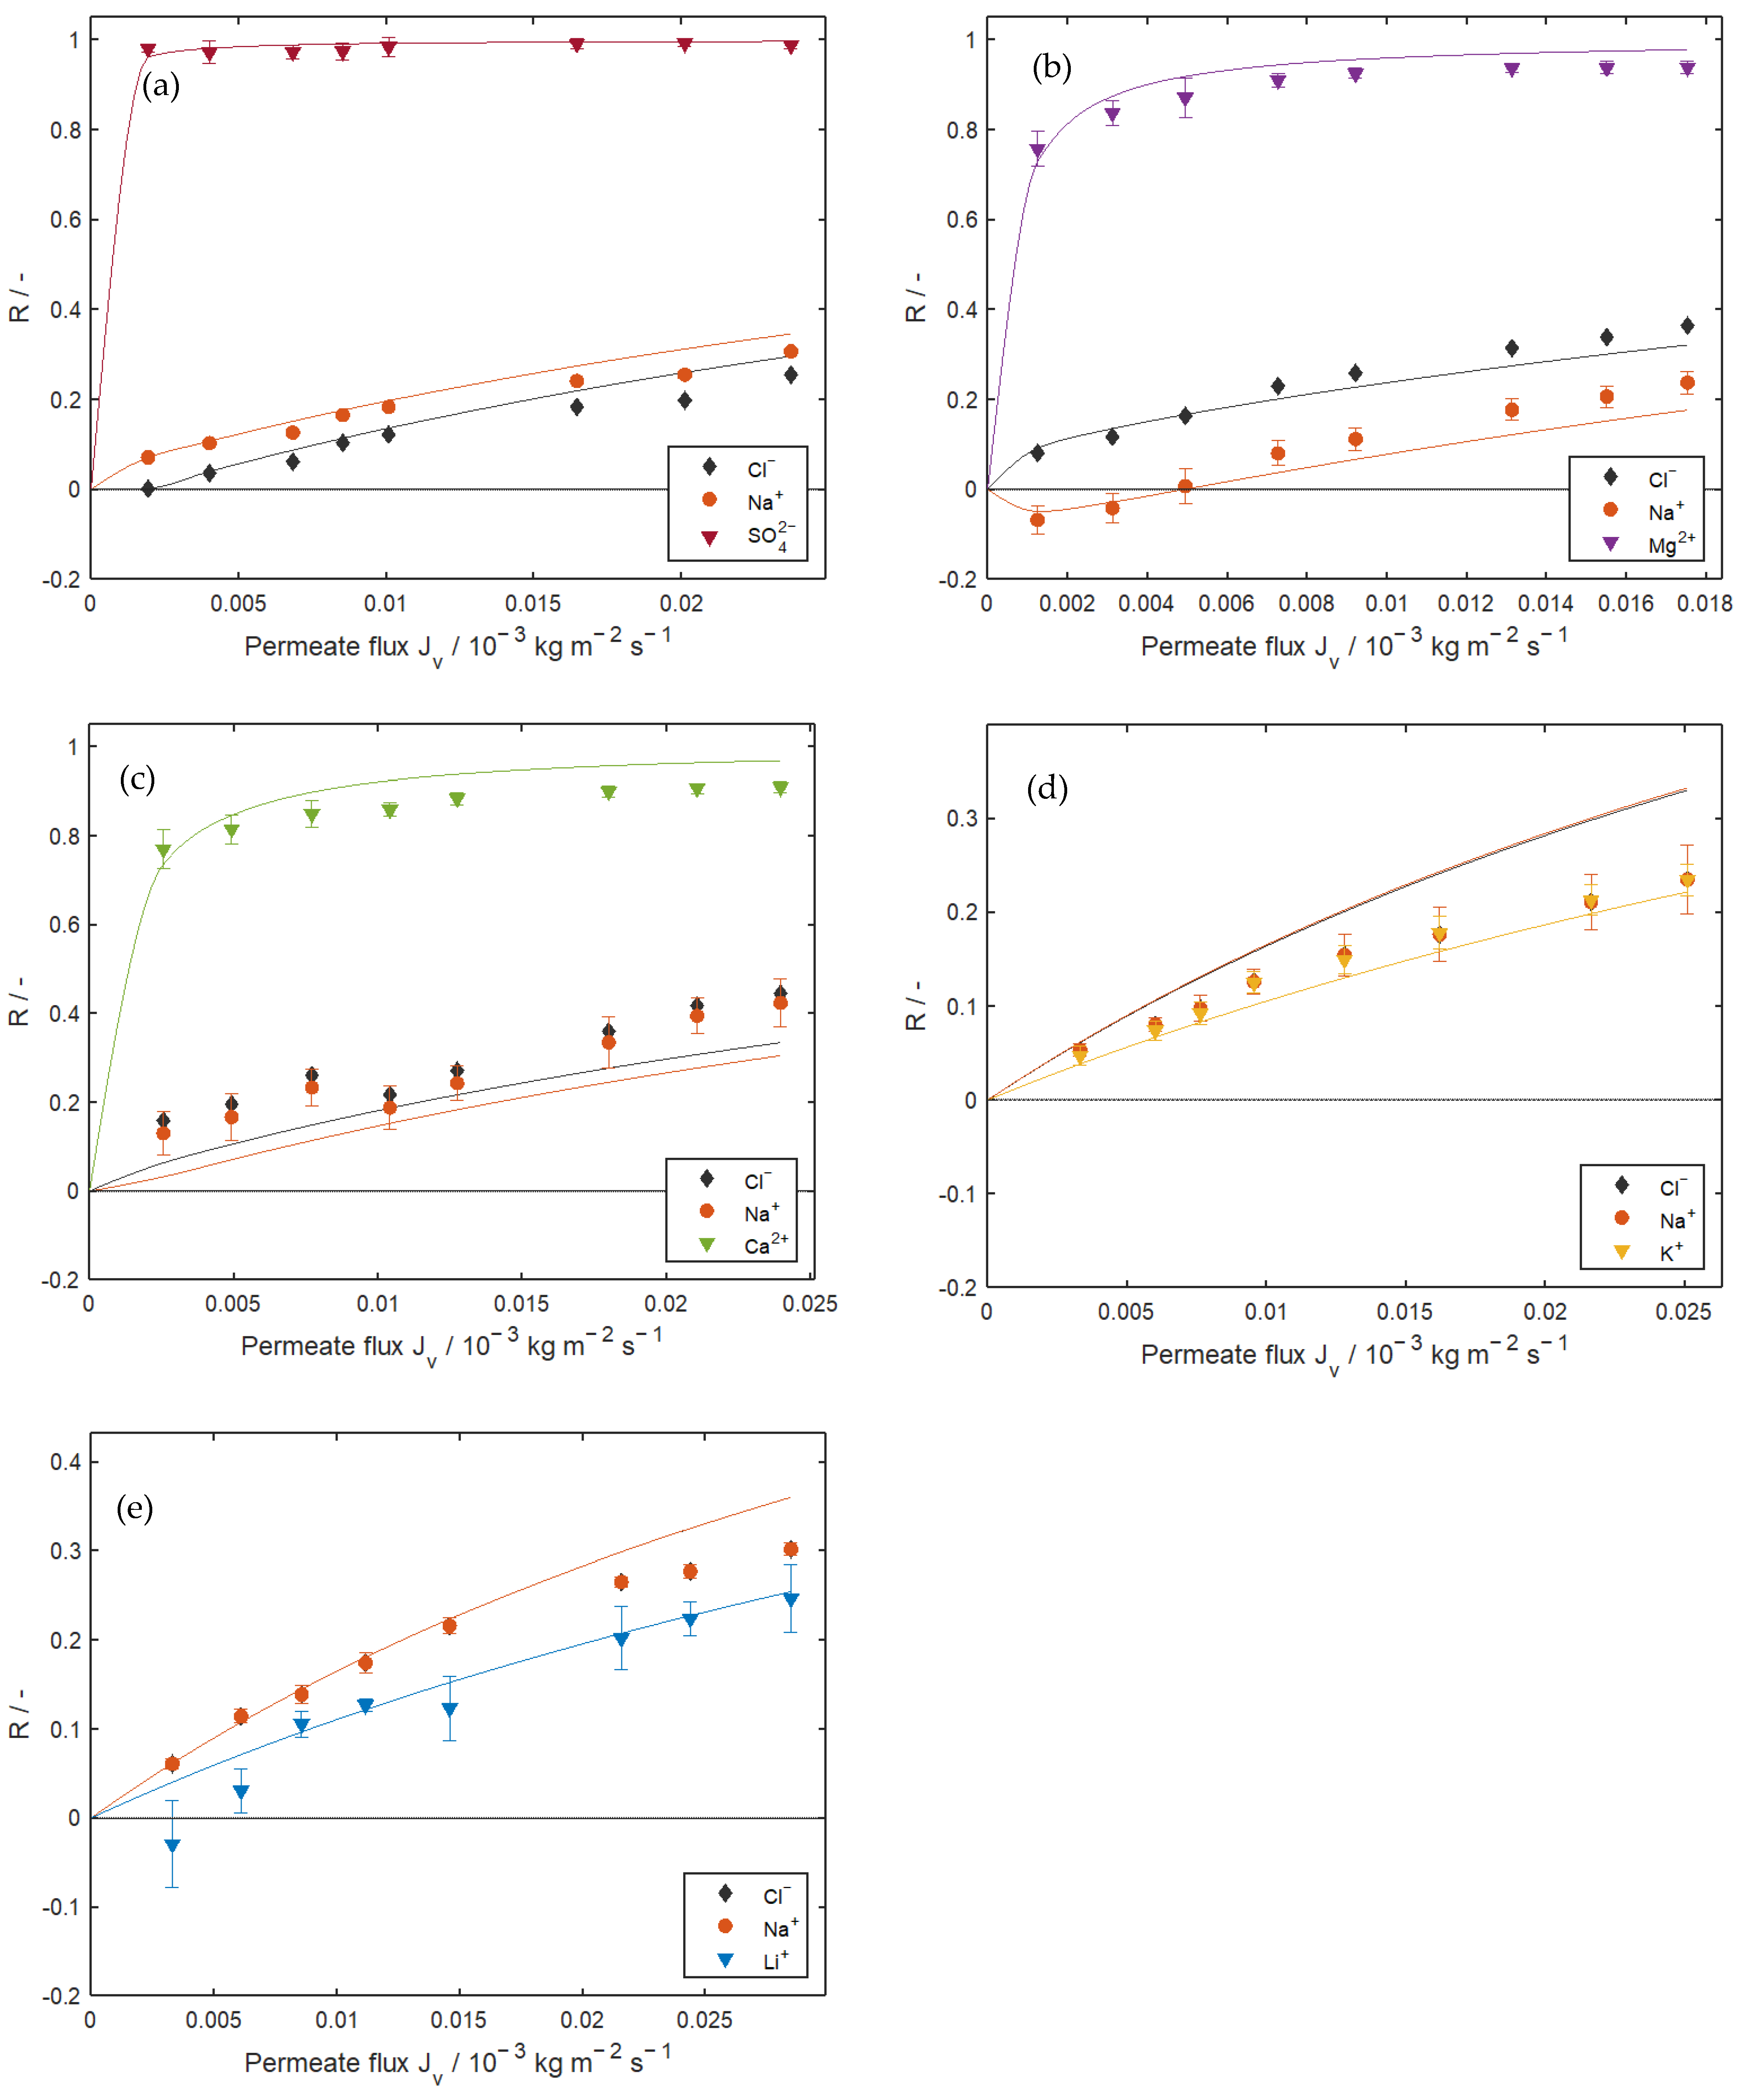
When modeling the subsystems, it was found that the ion rejections can be reliably described by SDEM with increasing permeate flux and, on the other hand, the SDEM also allows depicting negative rejections.
Taking into account the fitted ion permeances, it is possible to model an interconnection of membrane modules and multiple membrane stages. By means of an optimization, in which influencing variables such as the membrane area, the interconnection of the membrane modules or the transmembrane pressure difference are taken into account, an industrial membrane process can be designed economically on the basis of the modeling.

Supplementary Materials

The following supporting information can be downloaded at https://www.mdpi.com/article/10.3390/modelling4030024/s1. Appendix S1: Details on solving the differential algebraic equation. Appendix S2: Ion rejections in the membrane screening for DL and TS40 membranes. Figure S1: Experimentally determined ion rejections for DL membrane at different pressure levels. Figure S2: Experimentally determined ion rejections for TS40 membrane at different pressure levels. Appendix S3—experimental permeate flows and ion rejections. Appendix S4: Circular METcell. Appendix S5—Model assumptions and limitations from the SDEM by Yaroshchuk and Bruening.

Author Contributions

T.H.: methodology, software, validation, formal analysis, data curation, writing—original draft preparation, visualization. M.P.: methodology, software, investigation, writing—review and editing. C.K.: investigation. S.S.: validation, writing—review and editing, supervision. C.H.: resources, supervision, writing—review and editing, project administration, funding acquisition. All authors have read and agreed to the published version of the manuscript.

Funding

This research received no external funding.

Data Availability Statement

Data are contained within the article and Supplementary Materials. The Matlab™ Code is provided upon request from the corresponding author.

Acknowledgments

We acknowledge financial support by the journal for the Open Access Publishing.

Conflicts of Interest

The authors declare that they have no known competing financial interest or personal relationship that could have appeared to influence the work reported in this paper.

Abbreviations

SymbolDescriptionUnit
j i Ion flux of imol m−2 s−1
c ¯ i real concentration of ion i in the membrane
D i Ion diffusivity of ion i µm s−1
μ i e Electrochemical potential of ion iJ mol−1
γ i Activity coefficient of ion i-
c i Concentration of ion i in the virtual solutionmol kg−1
Γ i Partitioning coefficient of ion i-
x Transmembrane coordinatem
P i lPermeance of ion ikg s−1 m−2
F Faraday constantC mol−1
eElementary chargeC
R Ideal gas constantJ mol−1 K−1
ϵ r Relative permittivity-
ϵ 0 Vacuum permittivityF m−1
ρ Densitykg m−3
T TemperatureK
ϕ Electrostatic potentialV
nNumber of ion species-
tseTotal sum of errors-
R i Ion rejection-
ΔpTransmembrane pressure differencebar
m ˙ feedMass flow of feed to the membrane cellkg s−1
AMemMembrane aream
SDEMSolution-diffusion-electromigration Model
DSPM-DEDonnan-steric-pore dielectric exclusion model
DSPMDonnan-steric-pore model
J v Total permeate fluxkg m−2 s−1

References

  1. Council of the European Union. Proposal for a Regulation of the European Parliament and of the Council Amending Regulation (EU) 2019/631 as Regards Strengthening the CO2 Emission Performance Standards for New Passenger Cars and New Light Commercial Vehicles in Line with the Union’s Increased Climate Ambition: 2021/0197. 2022. Available online: https://data.consilium.europa.eu/doc/document/ST-14869-2022-INIT/en/pdf (accessed on 8 August 2023).
  2. Battistel, A.; Palagonia, M.S.; Brogioli, D.; La Mantia, F.; Trócoli, R. Electrochemical Methods for Lithium Recovery: A Comprehensive and Critical Review. Adv. Mater. 2020, 32, e1905440. [Google Scholar] [CrossRef]
  3. Somrani, A.; Hamzaoui, A.H.; Pontie, M. Study on lithium separation from salt lake brines by nanofiltration (NF) and low pressure reverse osmosis (LPRO). Desalination 2013, 317, 184–192. [Google Scholar] [CrossRef]
  4. Arroyo, F.; Morillo, J.; Usero, J.; Rosado, D.; El Bakouri, H. Lithium recovery from desalination brines using specific ion-exchange resins. Desalination 2019, 468, 114073. [Google Scholar] [CrossRef]
  5. Harvianto, G.R.; Kim, S.-H.; Ju, C.-S. Solvent extraction and stripping of lithium ion from aqueous solution and its application to seawater. Rare Met. 2016, 35, 948–953. [Google Scholar] [CrossRef]
  6. Yang, S.; Zhang, F.; Ding, H.; He, P.; Zhou, H. Lithium Metal Extraction from Seawater. Joule 2018, 2, 1648–1651. [Google Scholar] [CrossRef]
  7. Hong, H.-J.; Park, I.-S.; Ryu, J.; Ryu, T.; Kim, B.-G.; Chung, K.-S. Immobilization of hydrogen manganese oxide (HMO) on alpha-alumina bead (AAB) to effective recovery of Li+ from seawater. Chem. Eng. J. 2015, 271, 71–78. [Google Scholar] [CrossRef]
  8. Li, X.; Mo, Y.; Qing, W.; Shao, S.; Tang, C.Y.; Li, J. Membrane-based technologies for lithium recovery from water lithium resources: A review. J. Membr. Sci. 2019, 591, 117317. [Google Scholar] [CrossRef]
  9. Khalil, A.; Mohammed, S.; Hashaikeh, R.; Hilal, N. Lithium recovery from brine: Recent developments and challenges. Desalination 2022, 528, 115611. [Google Scholar] [CrossRef]
  10. Stringfellow, W.T.; Dobson, P.F. Technology for the Recovery of Lithium from Geothermal Brines. Energies 2021, 14, 6805. [Google Scholar] [CrossRef]
  11. Wen, X.; Ma, P.; Zhu, C.; He, Q.; Deng, X. Preliminary study on recovering lithium chloride from lithium-containing waters by nanofiltration. Sep. Purif. Technol. 2006, 49, 230–236. [Google Scholar] [CrossRef]
  12. Pramanik, B.K.; Asif, M.B.; Roychand, R.; Shu, L.; Jegatheesan, V.; Bhuiyan, M.; Hai, F.I. Lithium recovery from salt-lake brine: Impact of competing cations, pretreatment and preconcentration. Chemosphere 2020, 260, 127623. [Google Scholar] [CrossRef] [PubMed]
  13. Yang, G.; Shi, H.; Liu, W.; Xing, W.; Xu, N. Investigation of Mg2+/Li+ Separation by Nanofiltration. Chin. J. Chem. Eng. 2011, 19, 586–591. [Google Scholar] [CrossRef]
  14. Li, Y.; Zhao, Y.; Wang, H.; Wang, M. The application of nanofiltration membrane for recovering lithium from salt lake brine. Desalination 2019, 468, 114081. [Google Scholar] [CrossRef]
  15. Bi, Q.; Zhang, Z.; Zhao, C.; Tao, Z. Study on the recovery of lithium from high Mg(2+)/Li(+) ratio brine by nanofiltration. Water Sci. Technol. J. Int. Assoc. Water Pollut. Res. 2014, 70, 1690–1694. [Google Scholar] [CrossRef] [PubMed]
  16. Sun, S.-Y.; Cai, L.-J.; Nie, X.-Y.; Song, X.; Yu, J.-G. Separation of magnesium and lithium from brine using a Desal nanofiltration membrane. J. Water Process Eng. 2015, 7, 210–217. [Google Scholar] [CrossRef]
  17. Awais Ashraf, M.; Usman, M.; Hussain, I.; Ahmad, F.; Guo, S.; Zhang, L. Lithium extraction from high magnesium salt lake brine with an integrated membrane technology. Sep. Purif. Technol. 2022, 302, 122163. [Google Scholar] [CrossRef]
  18. Zhang, Y.; Wang, L.; Sun, W.; Hu, Y.; Tang, H. Membrane technologies for Li+/Mg2+ separation from salt-lake brines and seawater: A comprehensive review. J. Ind. Eng. Chem. 2020, 81, 7–23. [Google Scholar] [CrossRef]
  19. Zhang, C.; Mu, Y.; Zhao, S.; Zhang, W.; Wang, Y. Lithium extraction from synthetic brine with high Mg2+/Li+ ratio using the polymer inclusion membrane. Desalination 2020, 496, 114710. [Google Scholar] [CrossRef]
  20. Zhao, Y.; Wu, M.; Shen, P.; Uytterhoeven, C.; Mamrol, N.; Shen, J.; Gao, C.; van der Bruggen, B. Composite anti-scaling membrane made of interpenetrating networks of nanofibers for selective separation of lithium. J. Membr. Sci. 2021, 618, 118668. [Google Scholar] [CrossRef]
  21. Xu, P.; Hong, J.; Xu, Z.; Xia, H.; Ni, Q.-Q. Novel aminated graphene quantum dots (GQDs-NH2)-engineered nanofiltration membrane with high Mg2+/Li+ separation efficiency. Sep. Purif. Technol. 2021, 258, 118042. [Google Scholar] [CrossRef]
  22. Wang, L.; Rehman, D.; Sun, P.-F.; Deshmukh, A.; Zhang, L.; Han, Q.; Yang, Z.; Wang, Z.; Park, H.-D.; Lienhard, J.H.; et al. Novel Positively Charged Metal-Coordinated Nanofiltration Membrane for Lithium Recovery. ACS Appl. Mater. Interfaces 2021, 13, 16906–16915. [Google Scholar] [CrossRef] [PubMed]
  23. Saif, H.M.; Huertas, R.M.; Pawlowski, S.; Crespo, J.G.; Velizarov, S. Development of highly selective composite polymeric membranes for Li+/Mg2+ separation. J. Membr. Sci. 2021, 620, 118891. [Google Scholar] [CrossRef]
  24. Luo, H.; Peng, H.; Zhao, Q. High flux Mg2+/Li+ nanofiltration membranes prepared by surface modification of polyethyleneimines thin film composite membranes. Appl. Surf. Sci. 2022, 579, 152161. [Google Scholar] [CrossRef]
  25. Li, Q.; Liu, H.; He, B.; Shi, W.; Ji, Y.; Cui, Z.; Yan, F.; Mohammad, Y.; Li, J. Ultrahigh-efficient separation of Mg2+/Li+ using an in-situ reconstructed positively charged nanofiltration membrane under an electric field. J. Membr. Sci. 2022, 641, 119880. [Google Scholar] [CrossRef]
  26. He, R.; Xu, S.; Wang, R.; Bai, B.; Lin, S.; He, T. Polyelectrolyte-based nanofiltration membranes with exceptional performance in Mg2+/Li+ separation in a wide range of solution conditions. J. Membr. Sci. 2022, 663, 121027. [Google Scholar] [CrossRef]
  27. Zhang, T.; Zheng, W.; Wang, Q.; Wu, Z.; Wang, Z. Designed strategies of nanofiltration technology for Mg2+/Li+ separation from salt-lake brine: A comprehensive review. Desalination 2023, 546, 116205. [Google Scholar] [CrossRef]
  28. Spiegler, K.S.; Kedem, O. Thermodynamics of hyperfiltration (reverse osmosis): Criteria for efficient membranes. Desalination 1966, 1, 311–326. [Google Scholar] [CrossRef]
  29. Hussain, A.A.; Abashar, M.; Al-Mutaz, I.S. Effect of Ion Sizes on Separation Characteristics of Nanofiltration Membrane Systems. J. King Saud Univ.-Eng. Sci. 2006, 19, 1–18. [Google Scholar] [CrossRef]
  30. Bowen, W.; Cassey, B.; Jones, P.; Oatley, D.L. Modelling the performance of membrane nanofiltration—Application to an industrially relevant separation. J. Membr. Sci. 2004, 242, 211–220. [Google Scholar] [CrossRef]
  31. Ghorbani, A.; Bayati, B.; Drioli, E.; Macedonio, F.; Kikhavani, T.; Frappa, M. Modeling of Nanofiltration Process Using DSPM-DE Model for Purification of Amine Solution. Membranes 2021, 11, 230. [Google Scholar] [CrossRef]
  32. Mohammad, A.W.; Hilal, N.; Al-Zoubi, H.; Darwish, N.A. Prediction of permeate fluxes and rejections of highly concentrated salts in nanofiltration membranes. J. Membr. Sci. 2007, 289, 40–50. [Google Scholar] [CrossRef]
  33. Liu, Y.; Liang, H.; Bai, L.; Yang, J.; Zhu, X.; Luo, X.; Li, G. Modeling insights into the role of support layer in the enhanced separation performance and stability of nanofiltration membrane. J. Membr. Sci. 2022, 658, 120681. [Google Scholar] [CrossRef]
  34. Déon, S.; Dutournié, P.; Bourseau, P. Modeling nanofiltration with Nernst-Planck approach and polarization layer. AIChE J. 2007, 53, 1952–1969. [Google Scholar] [CrossRef]
  35. Fridman-Bishop, N.; Nir, O.; Lahav, O.; Freger, V. Predicting the Rejection of Major Seawater Ions by Spiral-Wound Nanofiltration Membranes. Environ. Sci. Technol. 2015, 49, 8631–8638. [Google Scholar] [CrossRef] [PubMed]
  36. Wang, R.; Lin, S. Pore model for nanofiltration: History, theoretical framework, key predictions, limitations, and prospects. J. Membr. Sci. 2021, 620, 118809. [Google Scholar] [CrossRef]
  37. Rehman, D.; Lienhard, J.H. Global optimization for accurate and efficient parameter estimation in nanofiltration. J. Membr. Sci. Lett. 2022, 2, 100034. [Google Scholar] [CrossRef]
  38. Foo, Z.H.; Rehman, D.; Bouma, A.T.; Monsalvo, S.; Lienhard, J.H. Lithium Concentration from Salt-Lake Brine by Donnan-Enhanced Nanofiltration. Environ. Sci. Technol. 2023, 57, 6320–6330. [Google Scholar] [CrossRef]
  39. Yaroshchuk, A.; Bruening, M.L.; Licón Bernal, E.E. Solution-Diffusion—Electro-Migration model and its uses for analysis of nanofiltration, pressure-retarded osmosis and forward osmosis in multi-ionic solutions. J. Membr. Sci. 2013, 447, 463–476. [Google Scholar] [CrossRef]
  40. Pagès, N.; Reig, M.; Gibert, O.; Cortina, J.L. Trace ions rejection tunning in NF by selecting solution composition: Ion permeances estimation. Chem. Eng. J. 2017, 308, 126–134. [Google Scholar] [CrossRef]
  41. de Labastida, M.F.; Yaroshchuk, A. Nanofiltration of Multi-Ion Solutions: Quantitative Control of Concentration Polarization and Interpretation by Solution-Diffusion-Electro-Migration Model. Membranes 2021, 11, 272. [Google Scholar] [CrossRef]
  42. Pages, N.; Yaroshchuk, A.; Gibert, O.; Cortina, J.L. Rejection of trace ionic solutes in nanofiltration: Influence of aqueous phase composition. Chem. Eng. Sci. 2013, 104, 1107–1115. [Google Scholar] [CrossRef]
  43. Reig, M.; Pagès, N.; Licon, E.; Valderrama, C.; Gibert, O.; Yaroshchuk, A.; Cortina, J.L. Evolution of electrolyte mixtures rejection behaviour using nanofiltration membranes under spiral wound and flat-sheet configurations. Desalination Water Treat. 2015, 56, 3519–3529. [Google Scholar] [CrossRef]
  44. López, J.; Yaroshchuk, A.; Reig, M.; Gibert, O.; Cortina, J.L. An engineering model for solute transport in semi-aromatic polymeric nanofiltration membranes: Extension of Solution-Electro-Diffusion model to complex mixtures. J. Environ. Chem. Eng. 2021, 9, 105262. [Google Scholar] [CrossRef]
  45. Wang, R.; He, R.; He, T.; Elimelech, M.; Lin, S. Performance metrics for nanofiltration-based selective separation for resource extraction and recovery. Nat. Water 2023, 1, 291–300. [Google Scholar] [CrossRef]
  46. Yaroshchuk, A.; Bruening, M.L. An analytical solution of the solution-diffusion-electromigration equations reproduces trends in ion rejections during nanofiltration of mixed electrolytes. J. Membr. Sci. 2017, 523, 361–372. [Google Scholar] [CrossRef]
  47. Yaroshchuk, A. The use of trace ions for advanced characterisation of transport properties of NF membranes in electrolyte solutions: Theoretical analysis. J. Membr. Sci. 2002, 201, 85–94. [Google Scholar] [CrossRef]
  48. Déon, S.; Escoda, A.; Fievet, P.; Dutournié, P.; Bourseau, P. How to use a multi-ionic transport model to fully predict rejection of mineral salts by nanofiltration membranes. Chem. Eng. J. 2012, 189–190, 24–31. [Google Scholar] [CrossRef]
  49. Nir, O.; Bishop, N.F.; Lahav, O.; Freger, V. Modeling pH variation in reverse osmosis. Water Res. 2015, 87, 328–335. [Google Scholar] [CrossRef]
  50. Trisep. TS40 NF Flat Sheet Membrane Datasheet. Available online: https://www.google.com/url?sa=t&rct=j&q=&esrc=s&source=web&cd=&ved=2ahUKEwjjwb3DnM2AAxVdgP0HHSN5ARgQFnoECB0QAQ&url=https%3A%2F%2Fwater-fluid-filtration.mann-hummel.com%2Fcontent%2Fdam%2Flse-wfs%2Fproduct-related-assets%2Fdata-sheets%2FTS40-Flat-Sheet-Membrane.pdf&usg=AOvVaw1HSidyyhlnuCszZYA0UW3h&opi=89978449 (accessed on 8 August 2023).
  51. Alfa Laval NF and RO Spiral Membranes—Datasheet. Available online: https://www.alfalaval.com/globalassets/documents/products/separation/membranes/spiral-membranes/ro-spiral/nf-and-ro-spiral-membranes-200000088-8-en-gb.pdf (accessed on 8 August 2023).
  52. Lenntech. Datasheet—GE-Osmonics-DL-Series-Industrial-High-Flow-Nanofiltration-Elements. 2023. Available online: https://www.lenntech.com/Data-sheets/GE-Osmonics-DL-Series-Industrial-High-Flow-Nanofiltration-Elements-L.pdf (accessed on 7 September 2023).
  53. Li, Z.; Li, C.; Liu, X.; Cao, L.; Li, P.; Wei, R.; Li, X.; Guo, D.; Huang, K.-W.; Lai, Z. Continuous electrical pumping membrane process for seawater lithium mining. Energy Environ. Sci. 2021, 14, 3152–3159. [Google Scholar] [CrossRef]
  54. Naidu, G.; Jeong, S.; Choi, Y.; Song, M.H.; Oyunchuluun, U.; Vigneswaran, S. Valuable rubidium extraction from potassium reduced seawater brine. J. Clean. Prod. 2018, 174, 1079–1088. [Google Scholar] [CrossRef]
  55. Robinson, R.A.; Stokes, R.H. Electrolyte Solutions, 2nd ed.; Dover Publications: Mineola, NY, USA, 2002. [Google Scholar]
  56. Veazey, W.R. CRC Handbook of Chemistry and Physics: A Ready-Reference Book of Chemical and Physical Data, 84th ed.; CRC Press: Boca Raton, FL, USA, 2003. [Google Scholar]
  57. Lejeune, A.; Rabiller-Baudry, M.; Vankelecom, I.; Renouard, T. On the relative influence of the hydrodynamics of lab-scale set-ups and the membrane materials on the rejection of homogeneous metal catalysts in solvent resistant nanofiltration. Sep. Sci. Technol. 2021, 56, 766–778. [Google Scholar] [CrossRef]
  58. Goebel, R.; Schreiber, M.; Koleva, V.; Horn, M.; Górak, A.; Skiborowski, M. On the reliability of lab-scale experiments for the determination of membrane specific flux measurements in organic solvent nanofiltration. Chem. Eng. Res. Des. 2019, 148, 271–279. [Google Scholar] [CrossRef]
  59. Yaroshchuk, A.E. Negative rejection of ions in pressure-driven membrane processes. Adv. Colloid Interface Sci. 2008, 139, 150–173. [Google Scholar] [CrossRef]
  60. Evdochenko, E.; Kamp, J.; Dunkel, R.; Nikonenko, V.V.; Wessling, M. Charge distribution in polyelectrolyte multilayer nanofiltration membranes affects ion separation and scaling propensity. J. Membr. Sci. 2021, 636, 119533. [Google Scholar] [CrossRef]
  61. Bandini, S.; Boi, C. Transport phenomena in reverse osmosis/nanofiltration membranes. In Current Trends and Future Developments on (Bio-) Membranes; Elsevier: Amsterdam, The Netherlands, 2021; pp. 49–90. [Google Scholar]
  62. Yaroshchuk, A. Non-steric mechanisms of nanofiltration: Superposition of Donnan and dielectric exclusion. Sep. Purif. Technol. 2001, 22–23, 143–158. [Google Scholar] [CrossRef]
Figure 1. Experimental setups for the membrane screening (a) and characterization (b).
Modelling 04 00024 g001
Figure 2. (a) Experimentally determined Mg2+/Li+ separation factors; (b) total flux at different pressure levels. Colors denote the three selected membranes. Error bars represent standard deviations estimated from four membrane cells. Conditions: AMem = 17 cm2, T = 20 °C, Δp = 5–40 bar, m ˙ feed = 75 kg h−1. Feed concentrations according to Table 4—STS, membrane specifications in Table 1. Full data sets can be found in the Supporting Information in Tables S1–S3.
Modelling 04 00024 g002
Figure 3. Experimentally determined ion rejections for NFAL membrane at different pressure levels. Colors denote the five ion species. Error bars represent standard deviations estimated from four membrane cells. Conditions: Membrane = NFAL (Alfa Laval), AMem = 17 cm2, T = 20 °C, Δp = 5–40 bar, m ˙ feed = 75 kg h−1. Feed concentrations according to Table 4—STS. Full data sets can be found in the Supporting Information in Tables S1–S3.
Modelling 04 00024 g003
Figure 4. Experimental ion rejections (symbols) and fitted ion rejections using the SDEM model (lines) for ROB feed subsystems (a) NaCl + NaSO4, (b) NaCl + MgCl2, (c) NaCl + CaCl2, (d) NaCl + KCl, (e) NaCl + LiCl. Feed concentrations according to Table 3. Error bars represent standard deviations estimated from four membrane cells. Conditions: Membrane = NFAL (Alfa Laval), AMem = 17 cm2, T = 20 °C, Δp = 5–40 bar, m ˙ feed = 75 kg h−1. Full data sets can be found in the Supporting Information in Tables S10–S14.
Modelling 04 00024 g004
Figure 5. Experimental ion rejections (symbols) and predicted ion rejections using the SDEM model (lines) for ME-ROB feed (c.f. Table 4) with permeances from Table 5. Error bars represent standard deviations estimated from four membrane cells. Conditions: Membrane = NFAL (Alfa Laval), AMem = 17 cm2, T = 20 °C, Δp = 5–40 bar, m ˙ feed = 75 kg h−1. Full data sets can be found in the Supporting Information in Table S15.
Modelling 04 00024 g005
Table 1. NF membranes used in this work.
MembraneMaterialSupplierpmaxRejection
//
Bar%
TS40 PolypiperazineMann + Hummel4199 (1)
NFALPolyamideAlfa Laval5599 (2)
DLPolyamideSuez4096 (3)
(1) Provided by manufacturer [50] measured on 2000 ppm MgSO4, 7.6 bar, 25 °C; (2) provided by manufacturer [51] measured on 2000 ppm MgSO4, 5 bar, 25 °C; (3) provided by manufacturer [52] measured on 2000 ppm MgSO4, 7.6 bar, 25 °C.
Table 2. Diffusion coefficients of ions at infinite dilution and the Stokes radii of ions, where r s = k B T 6 π μ D ± , s δ × 10 9 (Einstein–Stokes relation) [55].
Ion D ± , s δ 1 0 9 [56]
Stokes   Radii   r s
/m2 s−1/nm
Li+1.030.240
Mg2+0.710.349
Ca2+0.790.314
Cl2.040.121
Na+1.340.185
K+1.960.126
SO42−1.070.231
Table 3. Feed compositions for the nanofiltration experiments of multi-ion solutions by the NFAL (Alfa Laval) membrane. SW for seawater concentrations and ROB for concentrations of reverse osmosis brine.
Feed ConcentrationTransmembrane Pressure Δp
Dominant SaltTrace SaltDominant SaltTrace Salt
/mg kg−1/mg kg−1/bar
SW
NaClLiCl31,4101.285–40
NaClMgCl231,41061315–40
NaClCaCl231,41013395–40
NaClKCl31,41014235–40
NaClNa2SO435,17339175–40
ROB
NaClLiCl60,8812.445–40
NaClMgCl260,88196265–40
NaClCaCl260,88122065–40
NaClKCl60,88115265–40
NaClNa2SO466,78978345–40
Table 4. Composition of multi-electrolyte solutions used in this work.
Li+Na+K+Mg2+Ca2+Cl
/mg kg−1/mg kg−1/mg kg−1/mg kg−1/mg kg−1/mg kg−1
Screening Test Solution STS0.2112,340745.511559.29483.1025,110
ME-SW0.2112,356746.561565.16483.5925,154
ME-ROB0.4023,950800.152457.30796.7546,239
Table 5. Fitted permeances (c.f. Equation (5)) for NFAL membrane from the subsystem with ROB concentrations (c.f. Table 4).
Ion Species ClNa+Li+Mg2+K+Ca2+SO42−
P [kg s−1 m−2]0.03370.10130.36334.17 × 10−40.4999.29 × 10−47.33 × 10⁻⁵
Table 6. Fitting error tse (c.f. Equation (9)) to the ROB subsystems containing Cl, Na+, Li+, Mg2+, K+, Ca2+ and SO42− ions used to determine permeances.
SubsystemNaCl + LiClNaCl + MgCl2NaCl +KClNaCl + CaCl2NaCl + Na2SO4Total
t s e [-]0.06050.07560.10660.20510.05030.4982
Table 7. Prediction error tse (c.f. Equation (9)) of the ME-ROB containing Cl, Na+, Li+, Mg2+, K+ and Ca2+ ions.
IonClNa+Li+Mg2+K+Ca2+Total
t s e [-]0.02530.03060.01110.03330.08760.02270.2106
Disclaimer/Publisher’s Note: The statements, opinions and data contained in all publications are solely those of the individual author(s) and contributor(s) and not of MDPI and/or the editor(s). MDPI and/or the editor(s) disclaim responsibility for any injury to people or property resulting from any ideas, methods, instructions or products referred to in the content.

