
A Numerical Simulation of Electrical Resistivity of Fiber-Reinforced Composites, Part 1: Brittle Cementitious Concrete


Abstract
:1. Introduction
1.1. Durability of Cementitious Concrete Composites
1.2. Fiber-Reinforced Concrete
1.3. Literature Review
1.4. Significance of the Research
2. Materials and Methods
3. Results
4. Discussion
5. Conclusions
Author Contributions
Funding
Institutional Review Board Statement
Informed Consent Statement
Data Availability Statement
Acknowledgments
Conflicts of Interest
References
- Tehrani, F.M.; Nelson, D. From Sustainability to Resilience: A Practical Guide to ENVISION®. In Objective Resilience, Book 2: Objective Processes; Ettouney, M., Ed.; ASCE Press: Reston, VA, USA, 2022. [Google Scholar]
- Nelson, D.; Tehrani, F.M. Is resilience … sustainable? APWA Rep. 2018, 85, 53–56. [Google Scholar]
- Tehrani, F.M. Deploying and Rating Sustainable Practices for Resilient Bridge Infrastructure. In Proceedings of the Fifth International Conference on Bridges, Tehran, Iran, 17–18 December 2019; AUT: Tehran, Iran, 2019. Paper MS05. [Google Scholar]
- Tehrani, F.M.; Miller, N.M. Tire-Derived Aggregate Cementitious Materials: A Review of Mechanical Properties. In Cement-Based Materials; Saleh, H., Ed.; IntechOpen: London, UK, 2018. [Google Scholar]
- Berry, E.; Shadravan, B.; Tehrani, F.M. A Sustainable Approach to Assess the Resilience of Perforated Wood Shear Walls. In Proceedings of the AEI Conference, Oklahoma City, OK, USA, 11–13 April 2017; ASCE: Reston, VA, USA, 2017; pp. 506–512. [Google Scholar]
- Tehrani, F.M. Sustainability and Resilience through Project Management. In Proceedings of the 5th International Congress on Civil Engineering, Architecture & Urban Development, Tehran, Iran, 17–18 December 2017; AB-01440-B. ICSAU: Tehran, Iran, 2017. [Google Scholar]
- Tehrani, F.M.; Dadkhah, M. A Case Study on the Analysis of Energy and Emissions for Sustainability Rating. Int. J. Clim. Chang. Impacts Responses 2018, 10, 13–23. [Google Scholar] [CrossRef]
- Tehrani, F.M.; Alexandrou, A.; Mahoney, M.; Adhikari, D.; Raymond, M. Energy inputs and carbon dioxide emissions from construction equipment during construction of a golf course. Int. J. Eng. Res. Innov. 2014, 6, 78–86. [Google Scholar]
- Kosmatka, S.H.; Kerkhoff, B.; Panarese, W.C. Design and Control of Concrete Mixtures; Portland Cement Association: Skokie, IL, USA, 2002. [Google Scholar]
- Gulden, W. Continuously Reinforced Concrete Pavement: Extending Service Life of Existing Pavements; Report No. FHWA-HIF-13-024; Federal Highway Administration: Washington, DC, USA, 2013.
- Tehrani, F.M.; Farshidpour, R.; Pouramini, M.; Mousavi, M.; Esfahani, A.N. Sustainability Rating of Lightweight Expanded Clay Aggregates Using Energy Inputs and Carbon Dioxide Emissions in Life-Cycle Analysis. In Proceedings of the Sixth International Symposium on Life Cycle Civil Engineering, Ghent, Belgium, 28–31 October 2018; Caspeele, R., Taerwe, L., Frangopol, D.M., Eds.; CRC Press: Boca Raton, FL, USA, 2018; pp. 2989–2993. [Google Scholar]
- Tehrani, F.M.; Nazari, M.; Truong, D.; Farshidpour, R. Sustainability of Tire-Derived Aggregate Concrete: A Case Study on Energy, Emissions, Economy, and Envision. In Proceedings of the International Conference on Sustainable Infrastructure 2019: Leading Resilient Communities through the 21st Century 2019, Los Angeles, CA, USA, 6–9 November 2019; Chester, M.V., Norton, M., Eds.; ASCE: Reston, VA, USA, 2019; pp. 399–408. [Google Scholar]
- Nazari, M.; Tehrani, F.M.; Ansari, M.; Jeevanlal, B.; Rahman, F.; Farshidpour, R. Green Strategies for Design and Construction of Non-Auto Transportation Infrastructure; Report 19-17; Mineta Transportation Institute: San Jose, CA, USA, 2019. [Google Scholar]
- Nazari, M.; Tehrani, F.M.; Ansari, M. Lightweight Rubberized Concrete Slabs for Sustainable Road Pavements Serving Non-Auto Traffic. Period. Polytech. Civ. Eng. 2022. [Google Scholar] [CrossRef]
- Davodijam, F.; Dastan Diznab, M.A.; Tehrani, F.M. Sustainability Rating of Internally-Cured Concrete in Marine Environments Using Service Life Prediction Models. In Proceedings of the ASCE International Conference on Sustainable Infrastructure 2021, Houston, TX, USA, 2–4 December 2021; ASCE: Reston, VA, USA, 2022; pp. 141–150. [Google Scholar]
- Kalantari, S.; Dastan Diznab, M.A.; Tehrani, F.M. Sustainability of Internally-Cured Concrete for Mitigating Shrinkage Cracking Using Service Life Prediction Models. In Proceedings of the International RILEM Conference on Early-Age and Long-Term Crack Width Analysis in RC Structures, Paris, France, 9 April 2021; Kanavaris, F., Benboudjema, F., Azenha, M., Eds.; Springer: Cham, Switzerland, 2021; pp. 277–289. [Google Scholar]
- Kalantari, S.; Tehrani, F.M. Enhancing the Resilience of Concrete Pavements Using Service Life Prediction Models. In Proceedings of the ASCE International Airfield & Highway Pavements Conference: Pavement Design Construction, and Condition Evaluation, Austin, TX, USA, 8–10 June 2021; Ozer, H., Rushing, J.F., Leng, Z., Eds.; ASCE: Reston, VA, USA, 2021; pp. 178–185. [Google Scholar]
- Pouramini, M.; Tehrani, F.M. The Durability of High Strength Concrete Pavements Exposed to Freeze-Thaw Cycles in Different Saline Environments. In Proceedings of the ASCE International Airfield & Highway Pavements Conference: Pavement Design Construction, and Condition Evaluation, Austin, TX, USA, 8–10 June 2021; Ozer, H., Rushing, J.F., Leng, Z., Eds.; ASCE: Reston, VA, USA; pp. 159–168. [Google Scholar]
- Bentz, D.P.; Clifton, J.R.; Ferraris, C.F.; Garboczi, E.J.; Torrents, J.M. Transport Properties and Durability of Concrete: Literature Review and Research Plan; NISTIR-6395; NIST: Washington, DC, USA, 1999. [Google Scholar]
- Tehrani, F.M. Service Life Prediction of Internally Cured Concrete Pavements using Transport Properties. In Proceedings of the ASCE International Airfield & Highway Pavements Conference: Pavement Design Construction, and Condition Evaluation, Austin, TX, USA, 8–10 June 2021; Ozer, H., Rushing, J.F., Leng, Z., Eds.; ASCE: Reston, VA, USA, 2021; pp. 82–91. [Google Scholar]
- Tehrani, F.M. Service Life Prediction of Structural Lightweight Concrete Using Transport Properties; ESCSI Report 4363; ESCSI: Chicago, IL, USA, 2020. [Google Scholar]
- ASTM C1556-11A; Standard Test Method for Determining the Apparent Chloride Diffusion Coefficient of Cementitious Mixtures by Bulk Diffusion. American Society for Testing and Materials: West Conshohocken, PA, USA, 2016.
- Azarsa, P.; Gupta, R. Electrical resistivity of concrete for durability evaluation: A review. Adv. Mater. Sci. Eng. 2017, 2017, 8453095. [Google Scholar] [CrossRef] [Green Version]
- Layssi, H.; Ghods, P.; Alizadeh, A.R.; Salehi, M. Electrical resistivity of concrete. Concr. Int. 2015, 37, 41–46. [Google Scholar]
- ASTM C1876-19; Standard Test Method for Bulk Electrical Resistivity or Bulk Conductivity of Concrete. American Society for Testing and Materials: West Conshohocken, PA, USA, 2019.
- AASHTO T358-19; Standard Method of Test for Surface Resistivity Indication of Concrete’s Ability to Resist Chloride Ion Penetration. American Association of State and Highway Transportation Officials: Washington, DC, USA, 2019.
- Rupnow, T.D.; Icenogle, P.J. Surface resistivity measurements evaluated as alternative to rapid chloride permeability test for quality assurance and acceptance. Trans. Res. Rec. 2012, 2290, 30–37. [Google Scholar] [CrossRef]
- Maraveas, C.; Bartzanas, T. Sensors for Structural Health Monitoring of Agricultural Structures. Sensors 2021, 21, 314. [Google Scholar] [CrossRef]
- Tehrani, F.M. An Experimental Investigation of Mechanical Properties of Bonded Concrete. Eur. J. Eng. Res. Sci. 2020, 5, 88–91. [Google Scholar] [CrossRef]
- Tehrani, F.M. Performance of Steel Fiber Reinforced Concrete in Beam-Column Connections. Ph.D. Thesis, University of California, Los Angeles, CA, USA, 2008. [Google Scholar]
- Tehrani, F.M.; Serrano, R.M. Crack propagation of concrete beams prestressed with single strand tendons. J. Civ. Eng. Res. 2014, 4, 71–81. [Google Scholar]
- Walraven, J.C. High performance fiber reinforced concrete: Progress in knowledge and design codes. Mater. Struct. 2009, 42, 1247–1260. [Google Scholar] [CrossRef] [Green Version]
- Sivakumar, A.; Santhanam, M. Mechanical properties of high strength concrete reinforced with metallic and non-metallic fibres. Cem. Concr. Compos. 2007, 29, 603–608. [Google Scholar] [CrossRef]
- McComb, C.; Tehrani, F.M. Enhancement of shear transfer in composite deck with mechanical fasteners. Eng. Struct. 2015, 88, 25–261. [Google Scholar] [CrossRef] [Green Version]
- Rico, S.; Farshidpour, R.; Tehrani, F.M. State-of-the-art Report on Fiber-reinforced Lightweight-aggregate Concrete Masonry. J. Adv. Civ. Eng. 2017, 2017, 8078346. [Google Scholar] [CrossRef] [Green Version]
- Soto, A.; Tehrani, F.M. An Investigation of Crack Propagation in Steel Fiber-Reinforced Composite Beams. Period. Polytech. Civ. Eng. 2018, 62, 956–962. [Google Scholar] [CrossRef] [Green Version]
- Tehrani, F.M.; Rico, S.; Farshidpour, R. Shear Ductility of Fiber-Reinforced Lightweight-Aggregate Concrete Masonry. In Proceedings of the 11th US National Conference on Earthquake Engineering, Los Angeles, CA, USA, 25–29 June 2018; EERI: Oakland, CA, USA, 2018; p. 1112. [Google Scholar]
- Mohammadi, Y.; Singh, S.P.; Kaushik, S.K. Properties of steel fibrous concrete containing mixed fibres in fresh and hardened state. Constr. Build. Mater. 2008, 22, 956–965. [Google Scholar] [CrossRef]
- Klyuev, S.V.; Khezhev, T.A.; Pukharenko, Y.V.; Klyuev, A.V. Fiber concrete for industrial and civil construction. Mater. Sci. Forum 2019, 945, 120–124. [Google Scholar] [CrossRef]
- Afroughsabet, V.; Ozbakkaloglu, T. Mechanical and durability properties of high-strength concrete containing steel and polypropylene fibers. Constr. Build. Mater. 2015, 94, 73–82. [Google Scholar] [CrossRef]
- Bae, Y.; Pyo, S. Effect of steel fiber content on structural and electrical properties of ultra high performance concrete (UHPC) sleepers. Eng. Struct. 2020, 222, 111131. [Google Scholar] [CrossRef]
- Payakaniti, P.; Pinitsoontorn, S.; Thongbai, P.; Amornkitbamrung, V.; Chindaprasirt, P. Electrical Conductivity and Compressive Strength of Carbon Fiber Reinforced Fly Ash Geopolymeric Composites. Constr. Build. Mater. 2017, 135, 164–176. [Google Scholar] [CrossRef]
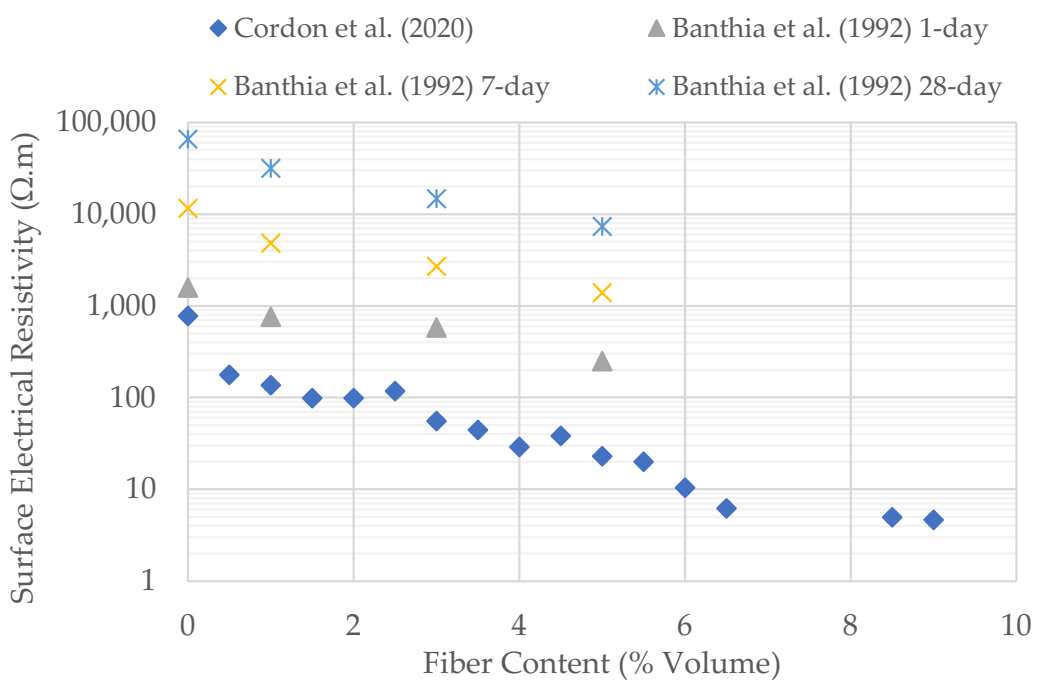
- Cordon, H.C.F.; Tadini, F.B.; Akiyama, G.A.; de Andrade, V.O.; da Silva, R.C. Development of electrically conductive concrete. Cerâmica 2020, 66, 88–92. [Google Scholar] [CrossRef]
- Sanchez, J.; Andrade, C.; Torres, J.; Rebolledo, N.; Fullea, J. Determination of reinforced concrete durability with on-site resistivity measurements. Mater. Struct. 2017, 50, 41. [Google Scholar] [CrossRef]
- Lim, Y.C.; Noguchi, T.; Cho, C.G. A quantitative analysis of the geometric effects of reinforcement in concrete resistivity measurement above reinforcement. Constr. Build. Mater. 2015, 83, 189–193. [Google Scholar] [CrossRef]
- Miri, A.; Ehsani, R.; Tehrani, F.M. A Numerical Simulation of the Electrical Resistivity of Concrete Pavements Containing Steel Fibers. In Proceedings of the ASCE International Airfield & Highway Pavements Conference: Pavement Design Construction, and Condition Evaluation, Austin, TX, USA, 8–10 June 2021; Ozer, H., Rushing, J.F., Leng, Z., Eds.; ASCE: Reston, VA, USA, 2021; pp. 356–364. [Google Scholar]
- Lee, C.Y.; Wang, S.R. Analysis of resistance characteristics of conductive concrete using press-electrode method. World Acad. Sci. Eng. Technol. 2010, 72, 91–94. [Google Scholar]
- Tuan, C.Y. Implementation of Conductive Concrete for Deicing (Roca Bridge); Report SPR-P1(04) P565; NE Department of Transportation Reseaarch: Omaha, NE, USA, 2008. [Google Scholar]
- Banthia, N.; Djeridane, S.; Pigeon, M. Electrical resistivity of carbon and steel micro-fiber reinforced cements. Cem. Concr. Res. 1992, 22, 804–814. [Google Scholar] [CrossRef]
- You, I.; Yoo, D.Y.; Kim, S.; Kim, M.J.; Zi, G. Electrical and self-sensing properties of ultra-high-performance fiber-reinforced concrete with carbon nanotubes. Sensors 2017, 17, 2481. [Google Scholar] [CrossRef] [PubMed] [Green Version]
- Butler, S.L.; Sinha, G. Forward modeling of applied geophysics methods using COMSOL and comparison with analytical and laboratory analog models. Comput. Geosci. 2012, 42, 168–176. [Google Scholar] [CrossRef]
- Clement, R.; Bergeron, M.; Moreau, S. COMSOL: Multiphysics Modelling for Measurement Device of Electrical Resistivity in Laboratory Test Cell. In Proceedings of the 2011 COMSOL Conference, Stuttgart, Germany, 26–28 October 2011; COMSOL, Inc.: Burlington, MA, USA, 2011. [Google Scholar]
- COMSOL. COMSOL Multiphysics 5.5 (Build: 359); COMSOL, Inc.: Burlington, MA, USA, 2019. [Google Scholar]
- MATLAB. MATLAB and Statistics Toolbox Release 2021a; The MathWorks, Inc.: Natick, MA, USA, 2021. [Google Scholar]
- Ruan, T.; Poursaee, A. Fiber-distribution assessment in steel fiber–reinforced UHPC using conventional imaging, X-ray CT scan, and concrete electrical conductivity. J. Mater. Civ. Eng. 2019, 31, 04019133. [Google Scholar] [CrossRef]


| Reference | Matrix | Fibers |
|---|---|---|
| Cordon et al. (2020) [43] | Coarse aggregate (S.G. 2.66), fine aggregate (S.G. 2.65), cement type CPV-ARI (S.G. 2.81) | Carbon steel type AII (Tec-Machine), 0.60-mm-diameter, 30-mm-long |
| Banthia et al. (1992) [49] | Sand–cement ratio of 0.5; silica fume/cement ratio of 0.2 | Steel fibers (S.G. 7.85), 25-mm-diameter, 3-mm-long |
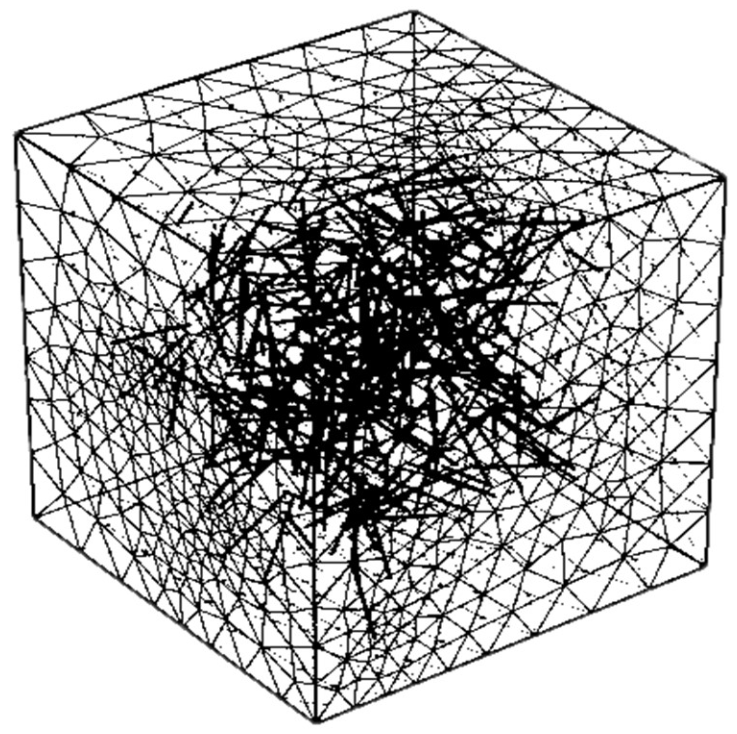
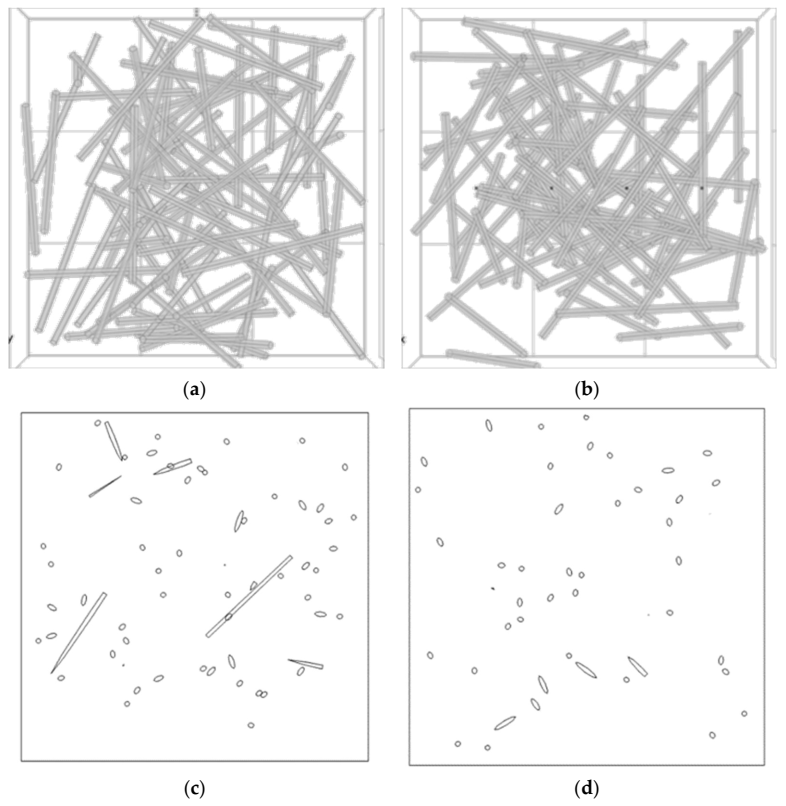
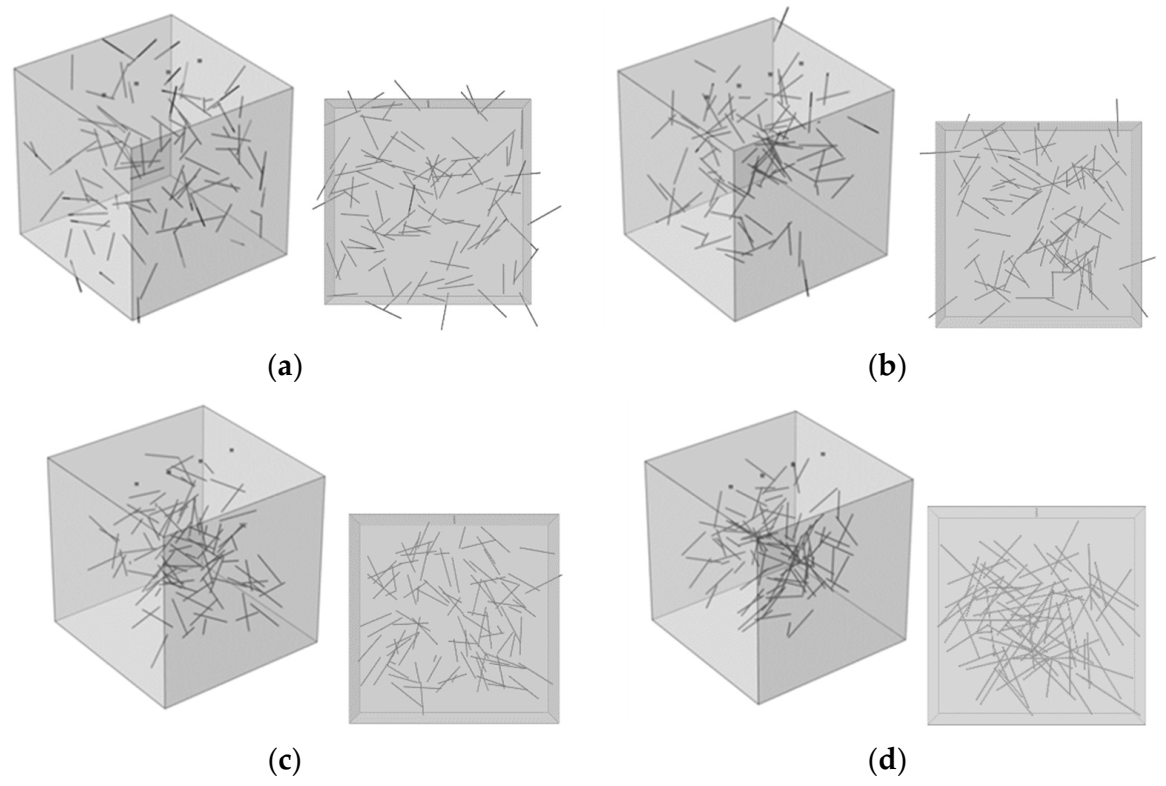
| Model | Length, mm | Diameter, mm |
|---|---|---|
| F1-1 | 25 | 0.5 |
| F1-2 | 50 | 1.0 |
| F1-3 | 75 | 1.5 |
| F2-1 | 50 | 2.0 |
| F2-2 | 75 | 3.0 |
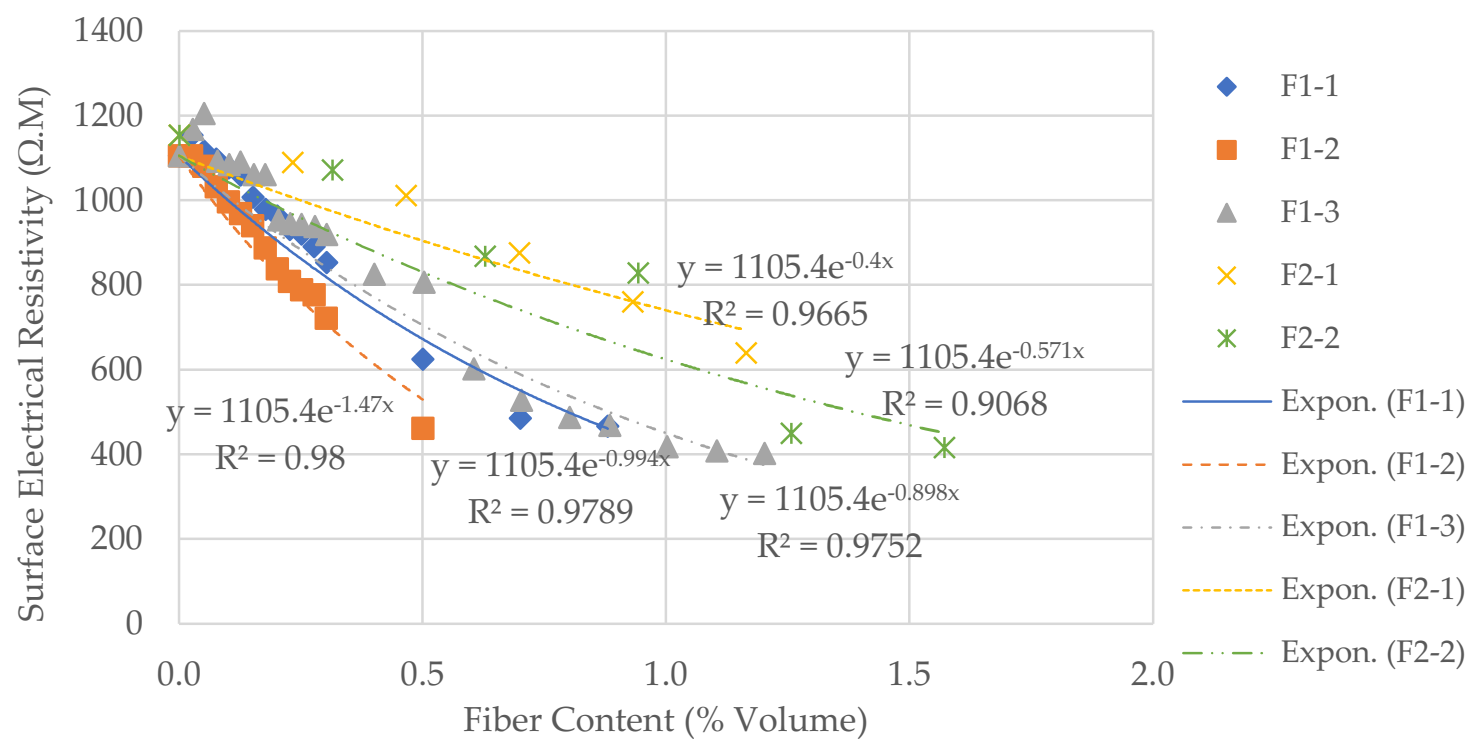
| Model | Exponential Rate of Decline | Coefficient of Determination |
|---|---|---|
| F1-1 | −0.994 | 0.9435 |
| F1-2 | −1.47 | 0.9429 |
| F1-3 | −0.898 | 0.9515 |
| F2-1 | −0.400 | 0.8984 |
| F2-2 | −0.571 | 0.8539 |
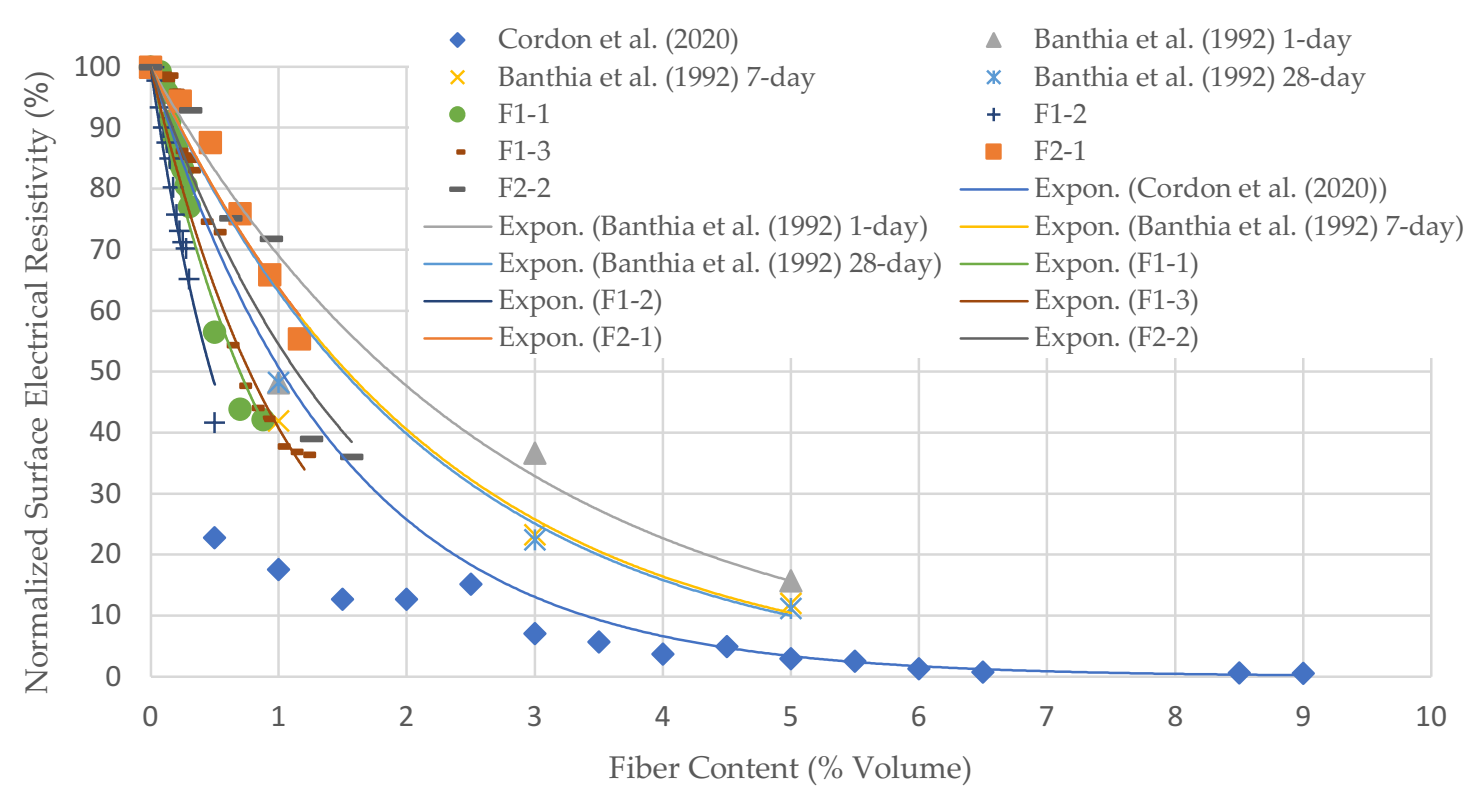
| Source | Exponential Rate of Decline | Coefficient of Determination |
|---|---|---|
| Cordon et al. (2020) [43] | −0.679 | 0.7606 |
| Banthia et al. (1992) 1-day [49] | −0.371 | 0.9119 |
| Banthia et al. (1992) 7-days [49] | −0.452 | 0.9275 |
| Banthia et al. (1992) 28-days [49] | −0.461 | 0.9669 |
| F1-1 | −0.994 | 0.9789 |
| F1-2 | −1.47 | 0.9800 |
| F1-3 | −0.898 | 0.9752 |
| F2-1 | −0.45 | 0.9636 |
| F2-2 | −0.608 | 0.9035 |
Publisher’s Note: MDPI stays neutral with regard to jurisdictional claims in published maps and institutional affiliations. |
© 2022 by the authors. Licensee MDPI, Basel, Switzerland. This article is an open access article distributed under the terms and conditions of the Creative Commons Attribution (CC BY) license (https://creativecommons.org/licenses/by/4.0/).
Share and Cite
Miri, A.; Ehsani, R.; Tehrani, F.M. A Numerical Simulation of Electrical Resistivity of Fiber-Reinforced Composites, Part 1: Brittle Cementitious Concrete. Modelling 2022, 3, 164-176. https://doi.org/10.3390/modelling3010011
Miri A, Ehsani R, Tehrani FM. A Numerical Simulation of Electrical Resistivity of Fiber-Reinforced Composites, Part 1: Brittle Cementitious Concrete. Modelling. 2022; 3(1):164-176. https://doi.org/10.3390/modelling3010011
Chicago/Turabian StyleMiri, Alireza, Rojina Ehsani, and Fariborz M. Tehrani. 2022. "A Numerical Simulation of Electrical Resistivity of Fiber-Reinforced Composites, Part 1: Brittle Cementitious Concrete" Modelling 3, no. 1: 164-176. https://doi.org/10.3390/modelling3010011