Article

A Numerical Model for Tracing Structural Response of Ultra-High Performance Concrete Beams

Department of Civil and Environmental Engineering, Michigan State University, East Lansing, MI 48824, USA
*
Author to whom correspondence should be addressed.
Modelling 2021, 2(4), 448-466; https://doi.org/10.3390/modelling2040024
Submission received: 31 July 2021 / Revised: 22 September 2021 / Accepted: 23 September 2021 / Published: 1 October 2021
(This article belongs to the Special Issue Advances in Structure Mechanics and Finite Element Modelling)

Abstract

:
This paper presents a finite element-based numerical model for tracing the behavior of ultra-high performance concrete (UHPC) beams. The model developed in ABAQUS can account for stress–strain response of UHPC and reinforcing bar in both tension and compression, bond between concrete and reinforcing steel, and strain hardening effects in bars and UHPC and can trace the detailed response of UHPC beams in the entire range of loading. This model is validated by comparing predicted response parameters including load-strain, load-deflection, and crack propagation against experimental data governed from tests on UHPC beams with different reinforcement ratios, fiber volume fractions, and loading configurations (shear and flexural loading). The validated model is applied to quantify the contribution of stirrups and concrete to shear strength of beams so as to explore the feasibility of removing shear reinforcement in UHPC beams.

1. Introduction

Ultra-high performance concrete (UHPC) is a new class of cementitious material possessing excellent mechanical properties [1,2]. One of the major drawbacks of UHPC is the brittle behavior of such concretes. This drawback is overcome to certain extent through adding steel fibers to UHPC mix and this type of concrete is referred to as ultra-high performance fiber-reinforced concrete (UHPFRC). UHPFRC exhibits superior strength, improved fracture toughness, ductility, energy absorption capacity, and enhanced post cracking tensile response [2,3]. These outstanding properties result from extremely homogenized microstructure achieved through optimizing the granular mixture along with a low water-to binder ratio, high fineness admixtures, and effective use of steel fibers [4].
In recent years, UHPFRC is finding increasing applications in infrastructural systems owing to its superior properties [5,6,7]. Despite recent research efforts to evaluate structural behavior of UHPC (or UHPFRC), currently there are limited design provisions for structural design of UHPC in international codes and standards (AFGC-SETRA [8], JSCE [9], and KCI [10]).
A number of experiments have been conducted in literature on response of UHPFRC beams. These studies revealed that increasing steel fiber fraction with high specific surface area, improves post cracking stiffness and thus enhances flexural capacity of UHPFRC beams. The results also demonstrate that using a higher fiber volume fraction in UHPFRC and a lower shear span to depth ratio can result in a higher shear capacity [5,11,12,13,14,15,16,17].
A number of detailed numerical studies has been reported in literature on the response of beams made with different types of concrete such as normal strength concrete (NSC), high strength concrete (HSC), and fiber-reinforced concrete (FRC) [18,19,20,21,22,23,24,25,26,27,28,29,30,31,32]. There are a number of numerical studies on the structural behavior of UHPFRC beams. Majority of the conducted numerical studies focused on sectional analysis approach to trace moment curvature behavior of beams subjected to flexural loading [5,11]. There are limited finite element-based numerical studies that evaluated the behavior of UHPFRC members. Tysmans et al. [33] evaluated the behavior of high performance concrete under biaxial tension. These authors inferred that the developed model incorporating concrete damage plasticity (CDP) material model can account for strain hardening behavior of UHPFRC in tension and thus can predict realistic load capacity of UHPFRC member. However, in their model validation, the authors relied upon small-scale specimens with no reinforcing bars. Singh et al. [34] developed a finite element model for evaluating structural behavior of UHPFRC beams wherein developed model was validated only under flexural and not under dominant shear loading. Chen and Graybeal [35,36] concentrated on evaluating load-deflection and strain response of UHPFRC I-girders and Pi-girders subjected to shear and flexure. The authors demonstrated that finite element model applying smeared cracking model produce a stiffer response as compared to CDP model. However, in this study strain hardening response of UHPFRC in tension was neglected. Bahij et al. [37] developed a numerical model for tracing shear response of UHPFRC beams. However, strain hardening in steel and UHPFRC was not included in the developed model and therefore post-peak response of the beams was not captured. Moreover, shear contribution of concrete and stirrups was not quantified.
The developed numerical models were not validated for tracing shear behavior of UHPFRC beams. Further, majority of previous studies focused on global response of UHPFRC structural members with no attention to local response (such as crack propagation direction, contribution of concrete and stirrups to shear capacity) and strain hardening in UHPFRC under tension was neglected. To address some of the noted issues, Solhmirzaei and Kodur [38] developed a finite element numerical model for tracing structural response of UHPFRC beams. However, the model was developed through load control technique and was not able to trace post peak response of the beams. The model was not validated fully and shear response of beams, failure mode (crack propagation direction) were not studied in detail.
This study presents details on the development of a numerical model in tracing the comprehensive structural response of UHPC and UHPFRC beams with a focus on material models to be adopted for evaluating realistic response in the entire range of loading till collapse of member. The model is applied to quantify contribution of concrete and steel to shear strength of UHPFRC beams and to study feasibility of removing shear reinforcement in flexural UHPFRC members.

2. Finite Element Model

A numerical model for tracing the structural behavior of a UHPFRC beam in the entire range of loading, from preloading stage till collapse, is developed in ABAQUS. A displacement controlled technique is utilized to trace the post peak response of the beam wherein displacement incremented at the nodes located under load points in steps till failure is attained. Details of the developed numerical model are described in following sections.

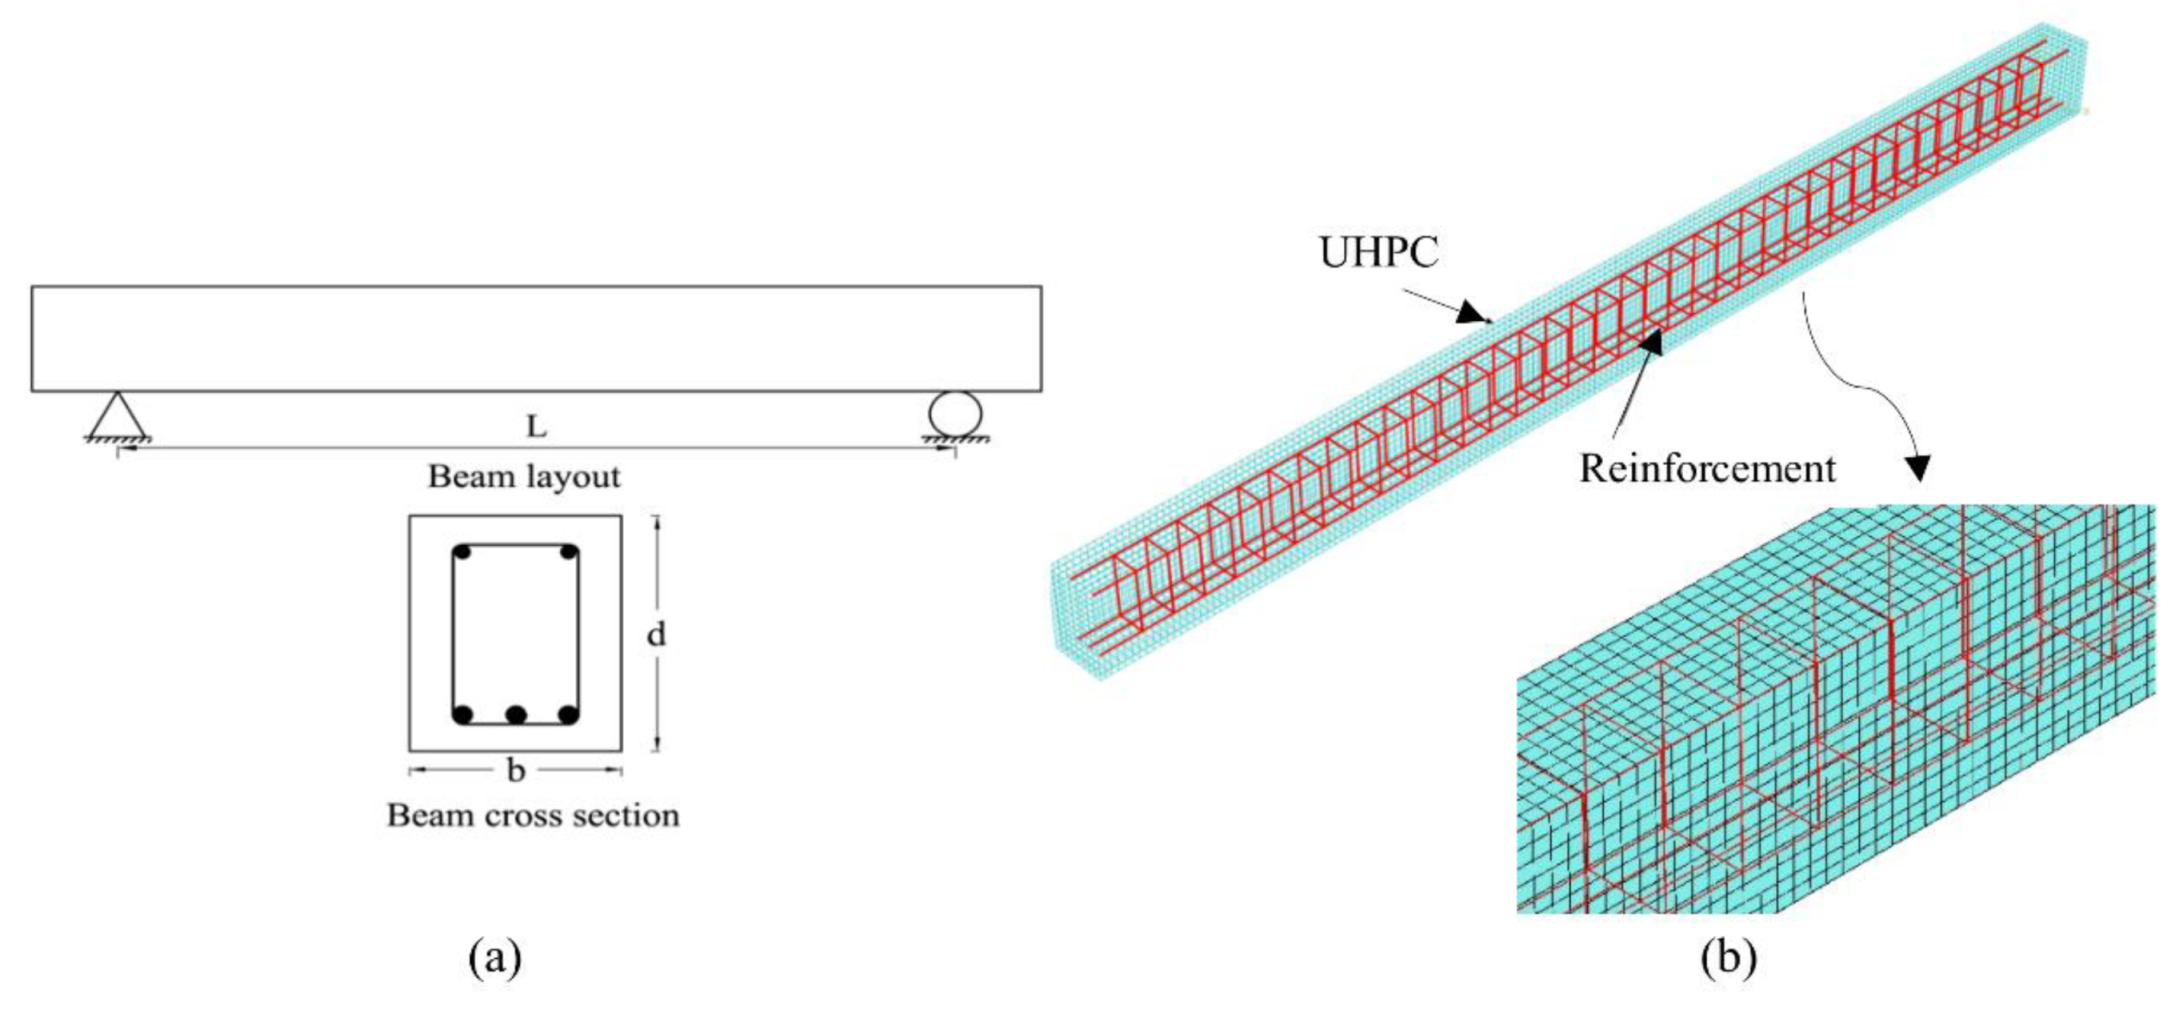
2.1. Discretization of the Beam

In a given UHPC (or UHPFRC) beam, concrete mass is discretized with brick elements (C3D8) while reinforcing steel is modeled as link elements (T3D2). C3D8 element is of eight nodes with three degrees of freedom in directions of x, y, and z. The steel reinforcing bars were modeled using truss elements (T3D2), with the cross section of each bar defined within 3D solid. T3D2 are two noded elements and are used to model one-dimensional reinforcing bars that are assumed to deform by axial stretching only. The bond between concrete and reinforcement is modeled by using bond-link element approach [39,40]. Figure 1 illustrates discretization of a typical UHPFRC beam. Details on size of the beams and reinforcement are presented in Section 3.1.

2.2. Material Models for UHPC

A damage-based concrete plasticity model (CDP) in ABAQUS was used to trace the nonlinear material response of UHPC (or UHPFRC). CDP is a smeared crack material model and is based on the theory of plastic flow [33]. The yield surface in CDP model is based on the yield surface proposed by Lubliner et al. [41] along with modifications proposed by Lee and Fenves [42] to account for different evolution laws of the strength under tension and compression. In order to define CDP model, a set of material properties such as tension stiffening in concrete, response under compression, elastic modulus, density, Poisson’s ratio, and plasticity parameters requires to be input in model [33,34,39,43].

2.2.1. Parameters for Modeling UHPC Behavior

Five parameters relating to plasticity response in UHPC, namely σ b 0 / σ c 0 ,   k c ,   ψ ,   ξ ,   μ , are required to define CDP model. Two parameters of σ b 0 / σ c 0 and k c modify the yield surface. σ b 0 / σ c 0 is the ratio of biaxial compressive strength to uniaxial compressive strength which influences the yield surface in a plane stress state and the parameter k c is the ratio between distances measured from the hydrostatic axis to tensile and compressive meridians and is used to define the shape of the failure surface in deviatoric plane. The other two parameters, ψ and ξ modify the non-associated potential flow. ψ is the dilation angle that describes the angle of inclination of the failure surface toward the hydrostatic axis measured in the meridional plane. ξ is an eccentricity parameter that controls the deviation of the hyperbolic plastic potential from its asymptote. μ is the viscosity parameter which is used for the visco-plastic regularization of the concrete constitutive equations [33,35,39,43]. These five parameters were selected to be 1.05, 2/3, 30, 0.1, 1E-4, respectively, according to the literature and sensitivity analysis conducted in this study [33,35,38,43,44,45]. In addition, Poisson’s ratio of UHPC (or UHPFRC) were considered to be 0.2 according to AFGC [8]. Density of UHPC (or UHPFRC) was measured to be 2565 kg / m 3 [17].
CDP model accounts for stiffness degradation in compression and tension. This stiffness degradation is defined in terms of scalar variables that are functions of the plastic strains. These variables capture degradation in material stiffness with increased loading. In other words, the degradation variables get more pronounced with increasing plastic strain which are zero and unity (=1) for an undamaged state and a complete damage state, respectively.
The tensile damage parameter ( d t ) gets activated after attaining peak tensile strength. Therefore, damage contours indicate tensile cracking and the level of damage increases with increasing strain (crack widening) at higher load levels. To account for degradation in stiffness due to cracking, tensile damage parameter (shown in Equation (1)) was included in the model. Moreover, the stiffness reduction in compression was incorporated in the plasticity model as presented in Equation (2) [34,35,43].
d t = 1 σ t f t  
d c = 1 [ σ c / E 0.2 ε c i n + σ c / E ]
where in σ t , f t , E , σ c , d t , and d c are tensile stress, tensile strength, elastic modulus, compressive stress, tensile, and compressive damage parameters, respectively.

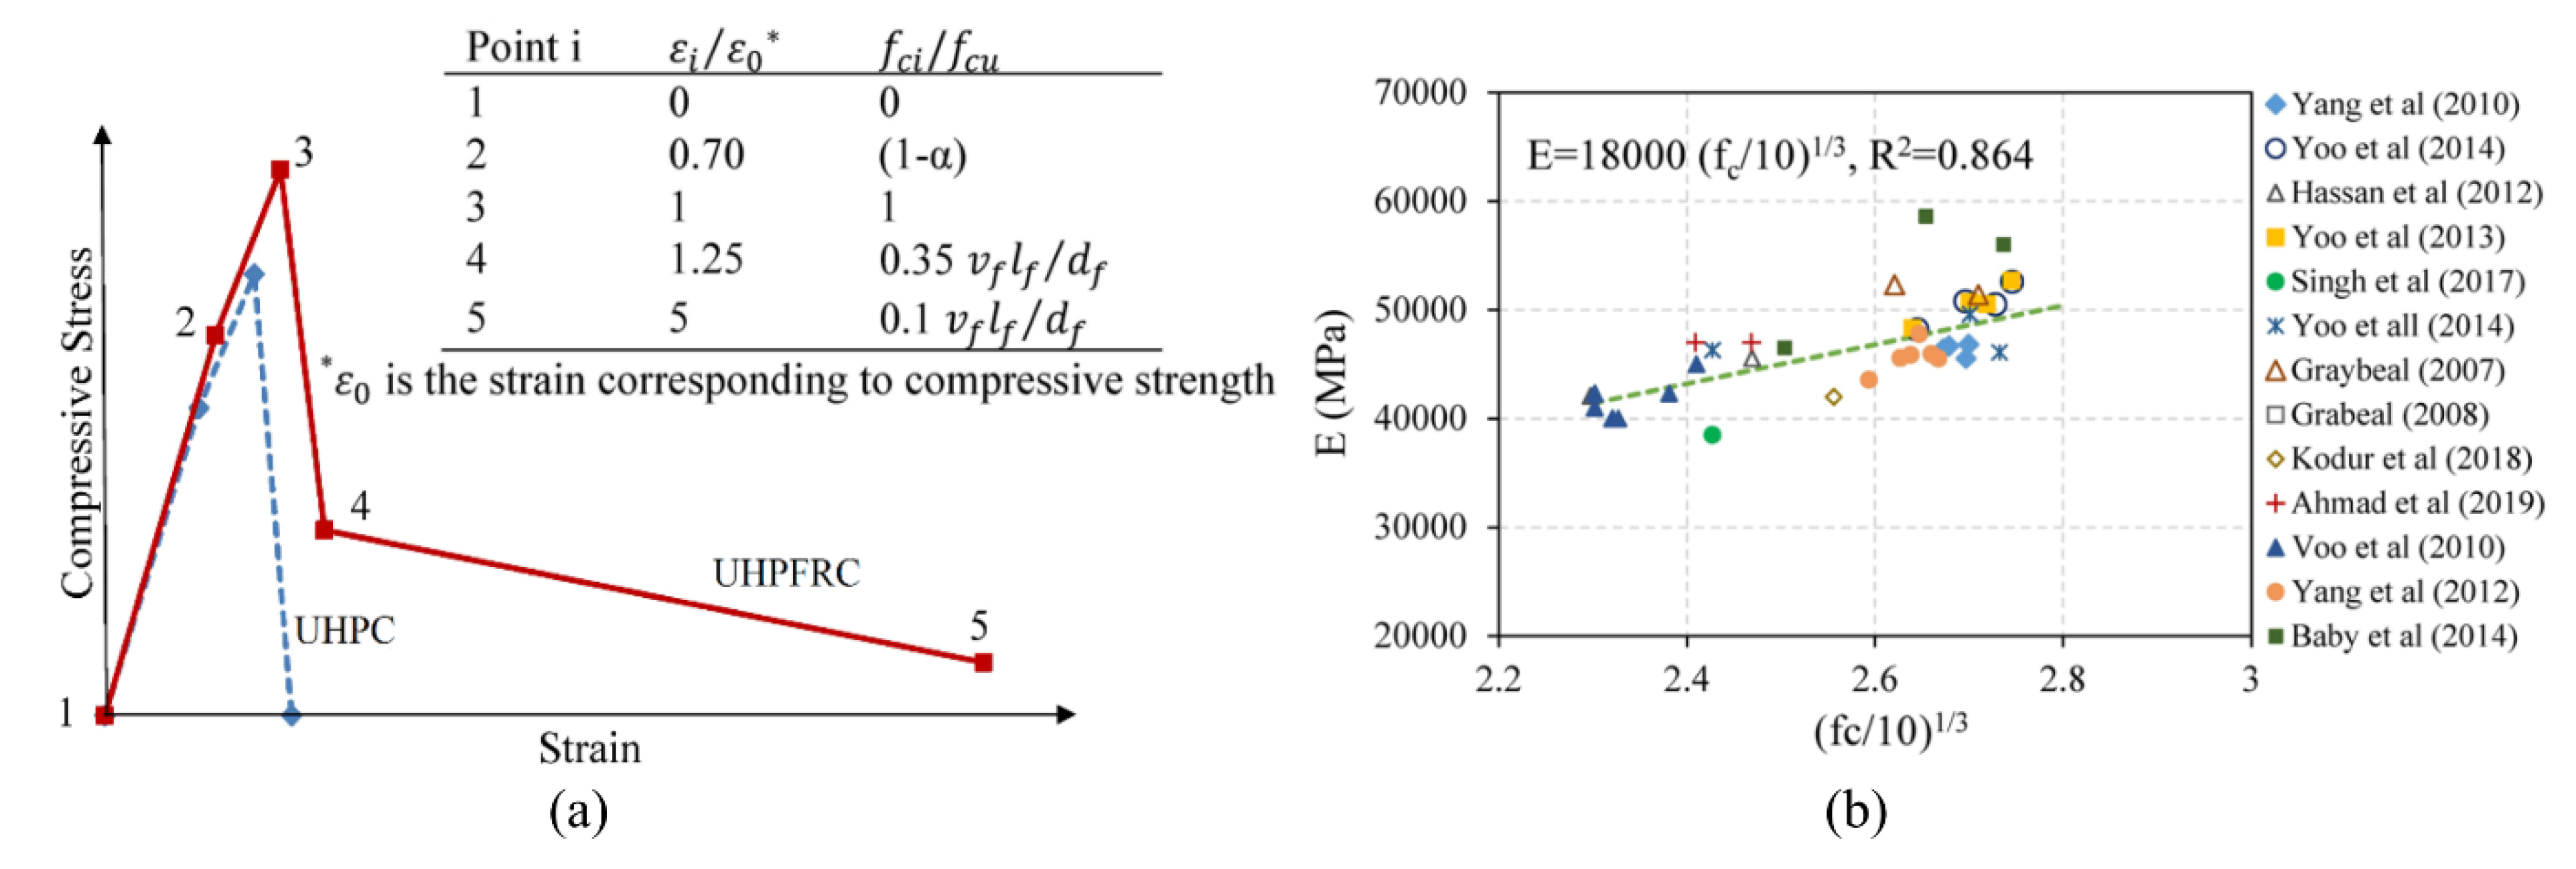
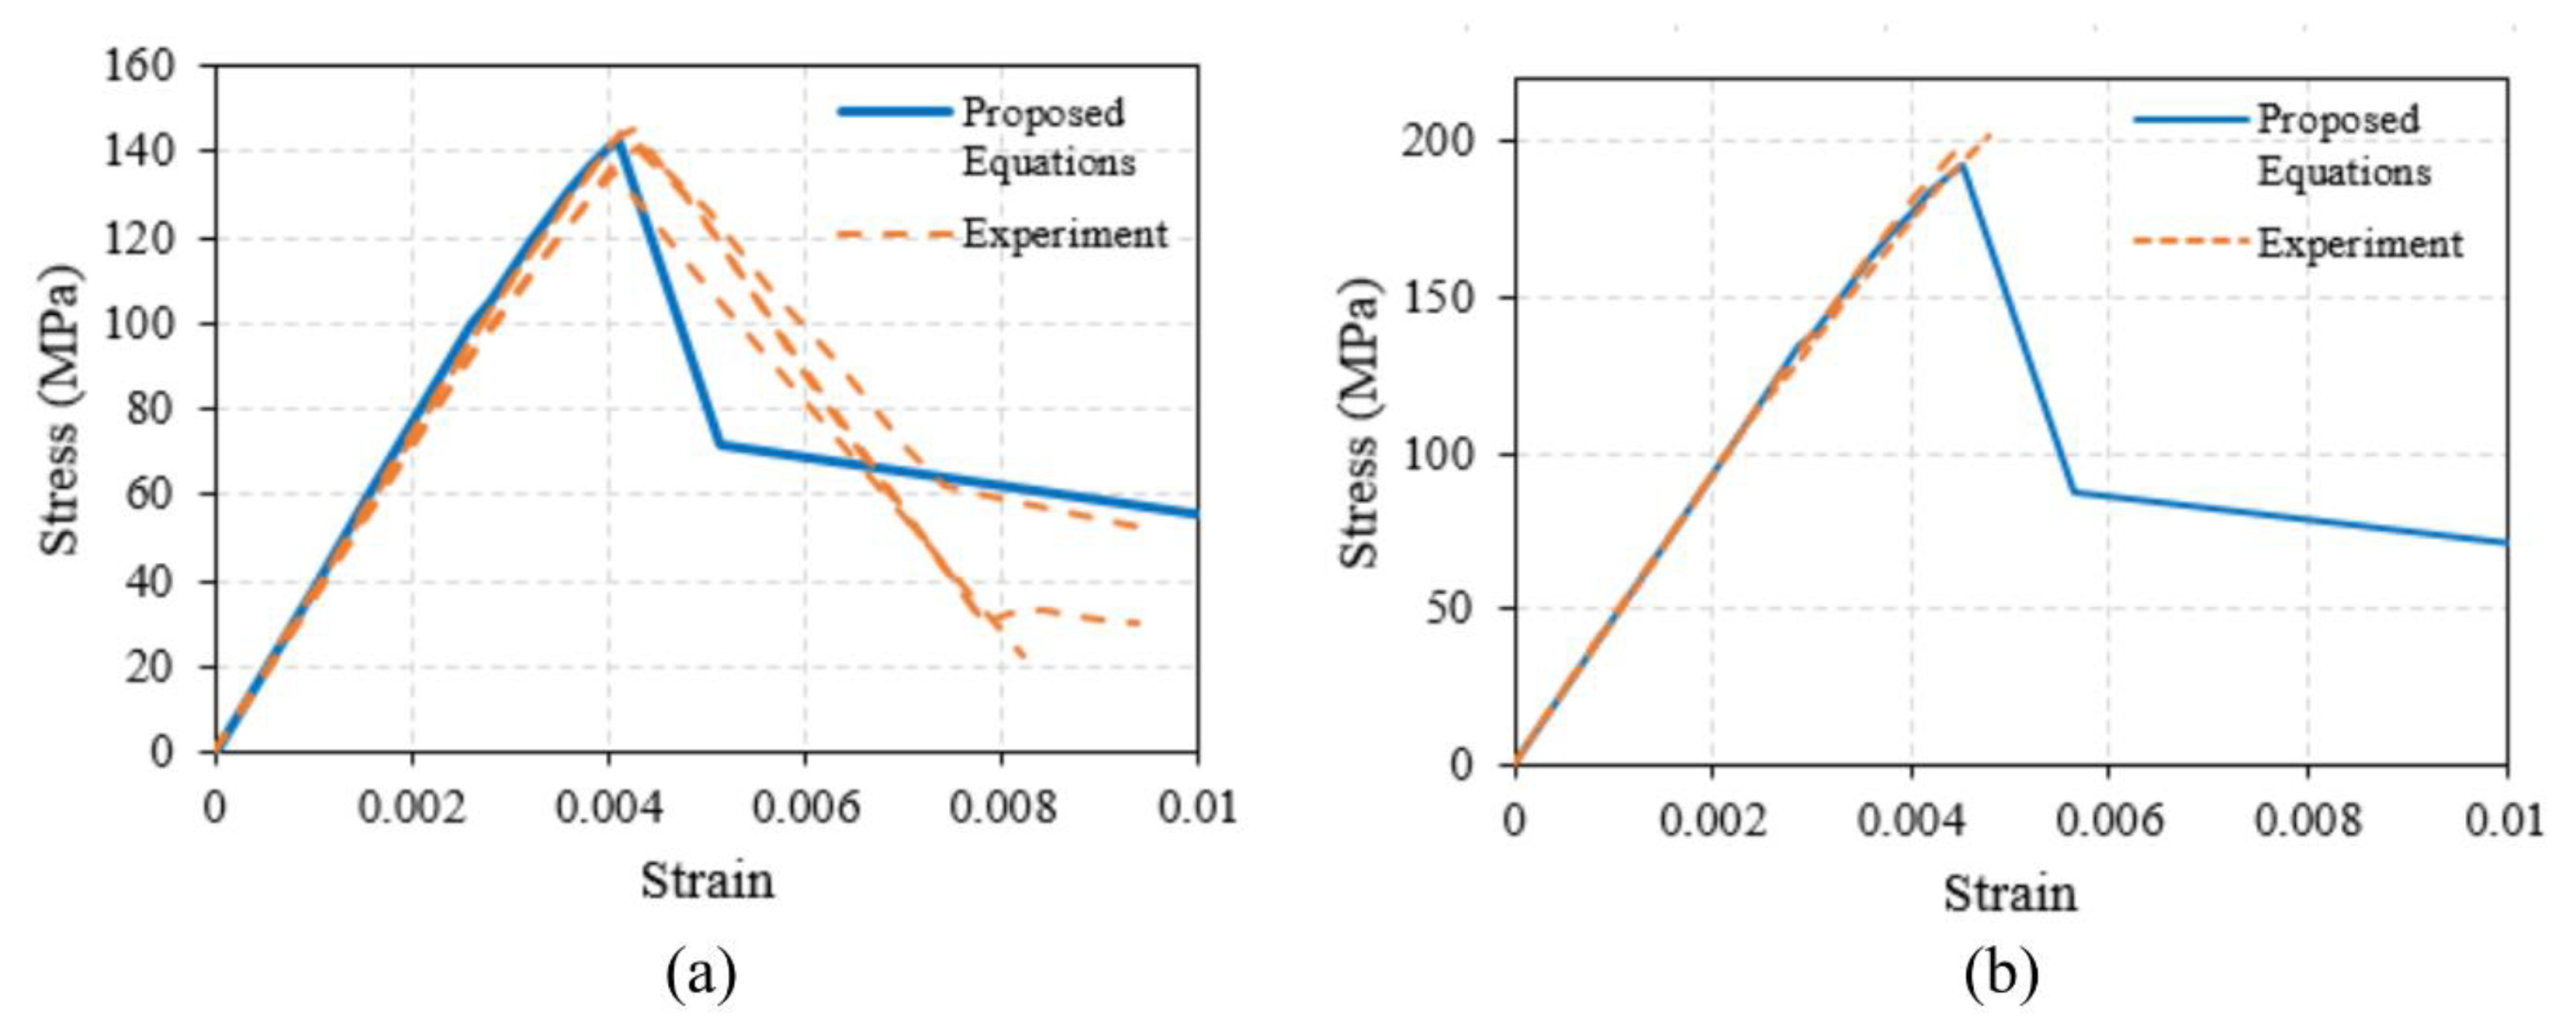
2.2.2. Compressive Behavior of UHPC

There are limited test data and associated relations for tracing uniaxial compressive stress–strain behavior of UHPC and UHPFRC. A material model that can relate stress–strain behavior of UHPC (or UHPFRC) to compressive strength and modulus of elasticity is developed for undertaking detailed analysis of UHPC and UHPFRC structures.
The uniaxial stress–strain response of UHPFRC can be approximated with a quad-part model that include softening branch as well. A schematic representation of the proposed model of stress–strain response of UHPFRC under compression is shown in Figure 2a. UHPFRC under compression, unlike conventional concrete, exhibits nearly linear behavior up to almost 70% of their compressive strength [46] (point 2 in Figure 2a). Compressive strength of UHPFRC which varies depending on fiber content and type, curing regime, mix design, etc., is to be determined by uniaxial compression test. The stress–strain response in this linear part can be defined by elastic modulus using Equation (3). The linear part of stress strain response is followed by a nonlinear phase until peak strength is reached and can be represented using Equation (4), which relates strain to stress by elastic modulus and a reduction factor (α). This reduction factor (Equation (5)), defines reduction of stress from linear elastic stress [46].
f c = E ε                                                     f o r   0 < f c < 0.70 f c
f c = E ε ( 1 α )                       f o r   0.70 f c < f c < f c
in which α the reduction factor is given as:
α = 0.001 e E ε 0.243   f c
where ε , E , f c , and α are compressive strain, elastic modulus, compressive strength, and reduction factor, respectively. Using data from literature [13,34,46,47,48,49,50,51,52,53,54], elastic modulus of UHPFRC is plotted as a function of ( f c 10 ) ( 1 3 ) in Figure 2b and an empirical relation available in literature for calculating elastic modulus of high strength concrete [55] is modified for UHPFRC as:
E = 18,000 ( f c 10 ) 1 3  
The ascending branch of compressive stress strain response (1–2, and 2–3) is calculated using Equations (3)–(6). The descending branch (3–4, and 4–5), is obtained based on empirically derived parameters generated in experiments by Empelmann [3]. The relations to calculate these five key points based on fiber content (by volume) and fiber size (aspect ratio) are given in Figure 2a. Where ε 0 is the strain corresponding to compressive strength and v f ,   l f , and d f are fiber volume fraction, fiber length, and diameter, respectively. Behavior of UHPC with no fibers is also linear up to 70% of compressive strength and it fails in brittle manner under compression (explosive) [56] as shown in Figure 2a. Predicted stress–strain response of UHPFRC based on parameters generated from two different experiments is plotted along with experimental stress–strain response in Figure 3. It shows a good agreement between the predicted stress–strain response using proposed model and test data especially in ascending branch of response.

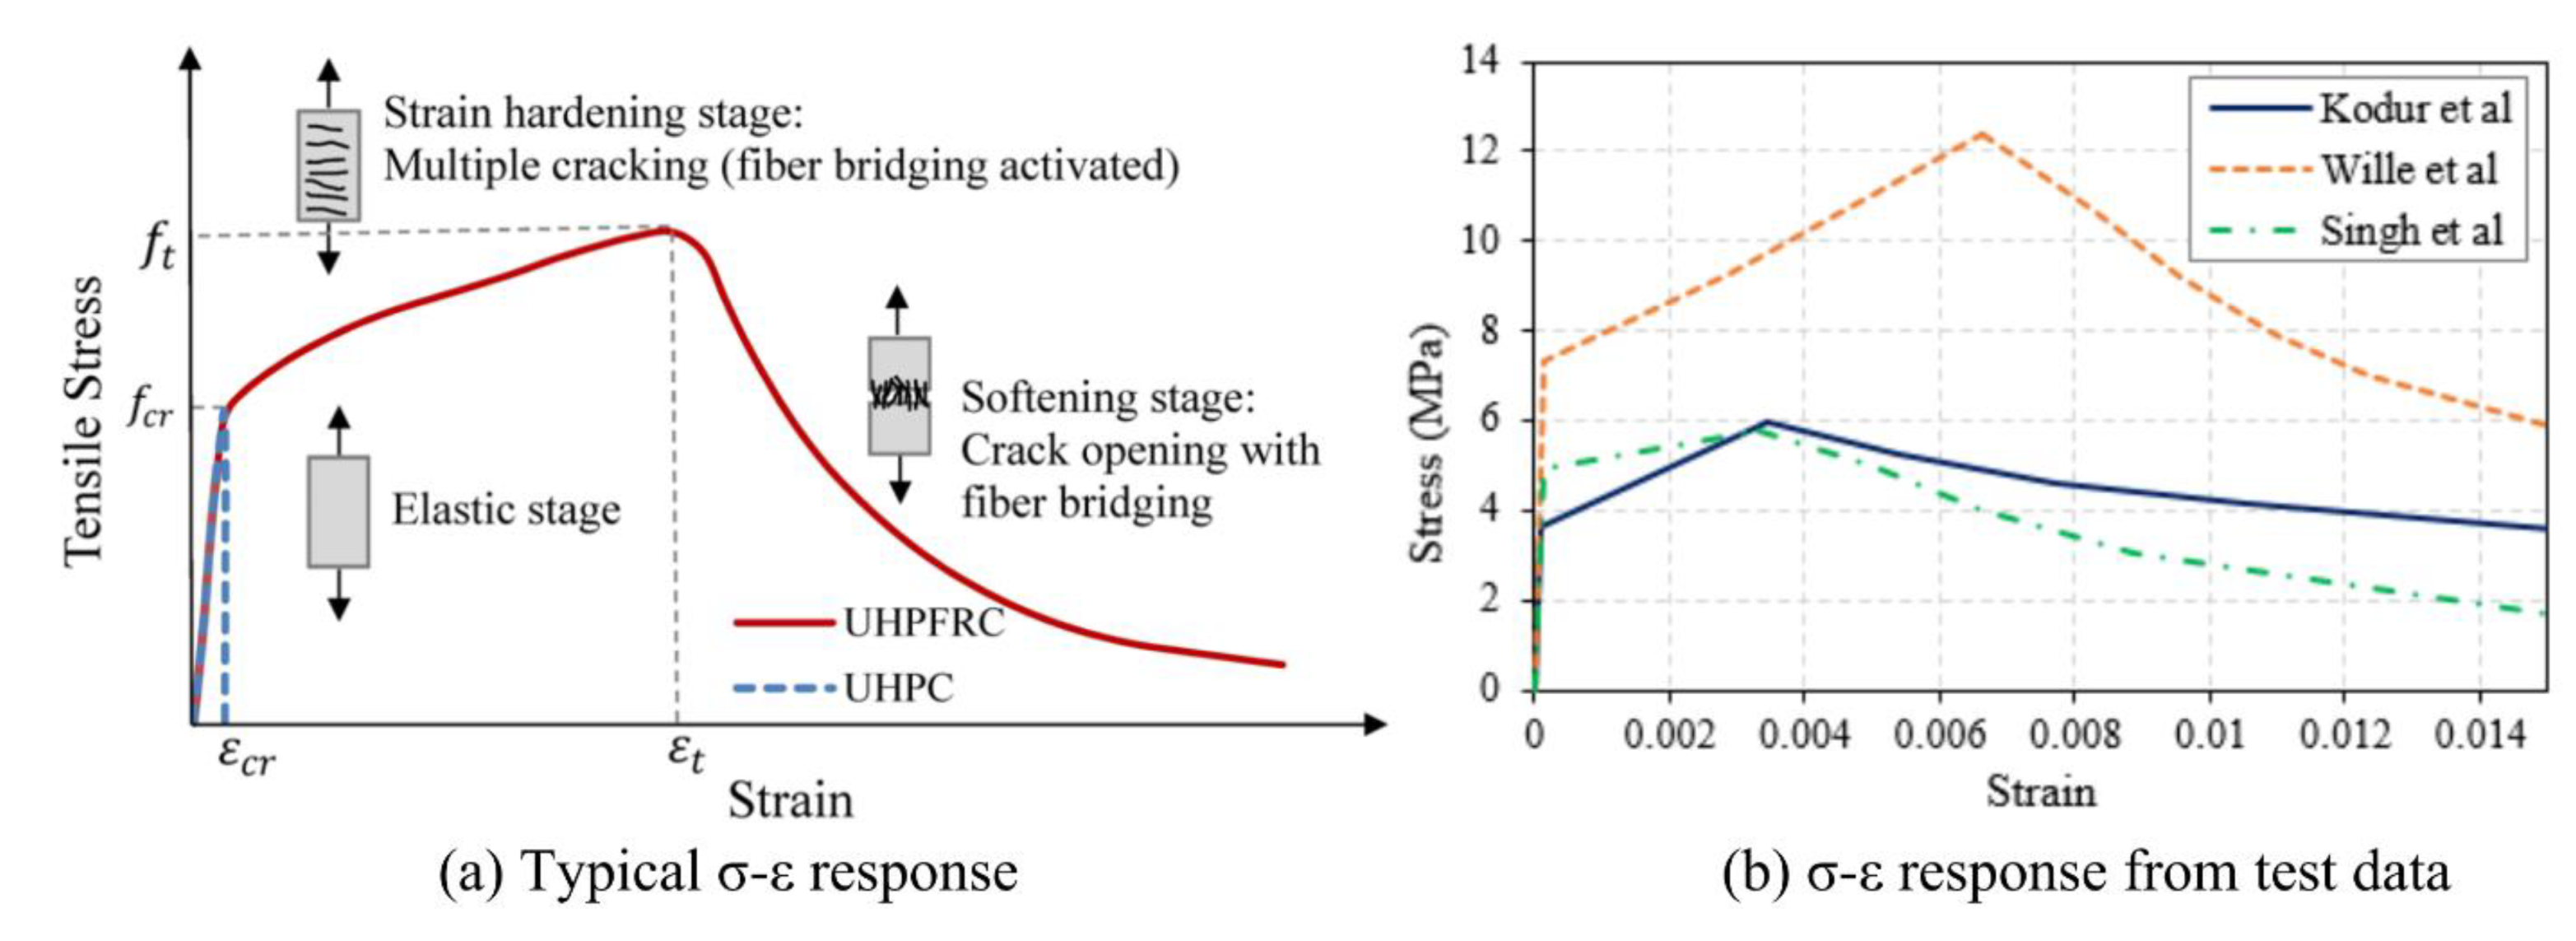
2.2.3. Tensile Behavior of UHPC

To capture the beneficial effects of UHPFRC, tensile response of UHPFRC is to be properly replicated before and after cracking. For this, stress–strain response in uniaxial tension is needed to capture the hardening and softening response of concrete.
Behavior of UHPC without fibers under tension after cracking is brittle and does not exhibit strain hardening and a significant descending branch [56] as shown in Figure 4a. However, the fibers present in UHPFRC induce significant bridging stress between open crack faces. This bridging stress between opened cracks faces leads to a relatively higher fracture toughness and ductility in UHPFRC. Therefore, it is essential that this fiber bridging mechanism is effectively incorporated in modeling tensile fracture of UHPFRC through stress–strain response in tension. Typical stress strain behavior of UHPFRC is idealized into three stages as shown in Figure 4a [57]. The initial part is linear elastic up to cracking stress of UHPFRC, which is followed by strain hardening part accompanied by initiation of multiple cracking facilitated by fiber bridging. This is further followed by softening branch that presents crack opening with fiber bridging.
Tensile behavior of UHPFRC cast for this study [17] as well as UHPFRC studied by Sing et al. [34] and Wille et al. [57] under direct tension is presented in Figure 4b. It can be seen that there is significant variation in tensile stress–strain response of UHPFRC with different mix, fiber type, volume fraction, and distribution. Since the shape of tensile stress–strain response of UHPFRC is highly influenced by various factors such as characteristic strength of the concrete matrix, fiber type, orientation and distribution of fibers, fiber aspect-ratio and fiber content (by volume), the key points on stress strain response plot, namely cracking, peak, and ultimate points are to be evaluated from direct tension tests. In addition, uniaxial tensile strength can be calculated through flexural tests on concrete prisms. However, flexural capacity alone cannot be utilized to describe the complete fracture mechanism. Therefore, inverse analysis is to be conducted to develop a tensile fracture model for UHPFRC from flexural tests [1,2,49,51,58].

2.2.4. Steel Reinforcement

An available plasticity model in ABAQUS based on Mises yield surface with associated plastic flow and isotropic hardening was utilized for constitutive modeling of steel reinforcing bars. The response of steel bars under tension and compression consisting of three phases of linear elastic, yield plateau, and strain hardening is incorporated in the model. The strain hardening part of stress strain curve can be calculated using Equation (7) [59].
f = f y [ f u f y 0.5 ( ε u ε ε u ε s h ) 2 ]
where f y , f u , ε s h , and ε u are yield strength, ultimate strength, strain at the end of the plateau part, and ultimate strain, respectively.

2.2.5. Bond Slip Behavior of UHPC

Number of researchers have investigated bond behavior of steel reinforcement with UHPC. These authors reported that the average bond strength of steel bars embedded in UHPC is about ten times higher than that of steel bars placed in conventional concrete [50].
The modified CMR [60] model proposed by Yoo et al. [50] for UHPC and UHPFRC with varying fiber content was utilized to define bond behavior of steel bars embedded in UHPC. The CMR model is defined in Equations (8) and (9), where τ and τ m a x are bond stress and bond strength, respectively. s r and β are the coefficients based on curve fitting of experimental results on UHPC and UHPFRC which were adopted as 0.07, and 0.8, respectively.
τ = τ m a x ( 1 e s / s r ) β
τ m a x = 5.0   f c 0.5
The bond force between the concrete and reinforcing steel bar for the bond element is obtained by multiplying contact area between reinforcing bar and concrete by average bond stress between concrete and steel reinforcement.

2.3. Analysis Details

Since UHPFRC beams, owing to high ductility, undergo large deflections (as compared to beams made of conventional concrete or UHPC), the effect of geometric non-linearity should be given due consideration in the analysis. This was considered in the model through updated Lagrangian method [39]. Newton–Raphson solution technique is adopted and a tolerance limit of 0.5% of average force is specified to meet convergence criterion at each load increment [61]. The analysis is carried out in small displacement increments which are automatically chosen by ABAQUS. The mesh size was arrived by carrying out a parametric study with different mesh sizes and a mesh size of 25 mm was able to predict good post yield response in the beams selected for validation.

2.4. Modeling Interfacial Bond between Rebar and Concrete

The interfacial bond between reinforcement and concrete can be accounted for through explicit modeling of both reinforcement ribs and the concrete lugs [62]. Alternatively, local bond-slip can be modeled as bond-link elements which provides a reasonable compromise between accuracy and computational efficiency [40].
In bond-link element approach, the concrete and the reinforcing steel are represented by two different sets of elements, and node pairs at the interface are connected using interfacial spring elements. Three spring elements are modeled at each node pair, wherein one spring represents shear bond behavior according to a bond-slip relationship. This bond-slip is related to longitudinal axis direction. The other two springs represent the bond behavior in the normal directions which are assumed to be rigid by assigning large spring stiffness to the normal springs [40].

3. Model Validation

The developed finite element-based model was validated by analyzing a set of UHPC and UHPFRC beams tested in the laboratory [5,11,13,17,34]. To evaluate the effectiveness of the developed model in tracing structural response of UHPC and UHPFRC beams, model predictions including load carrying capacity, load-strain behavior, load-deflection behavior, and cracking were compared with results and observations from experiments [63].

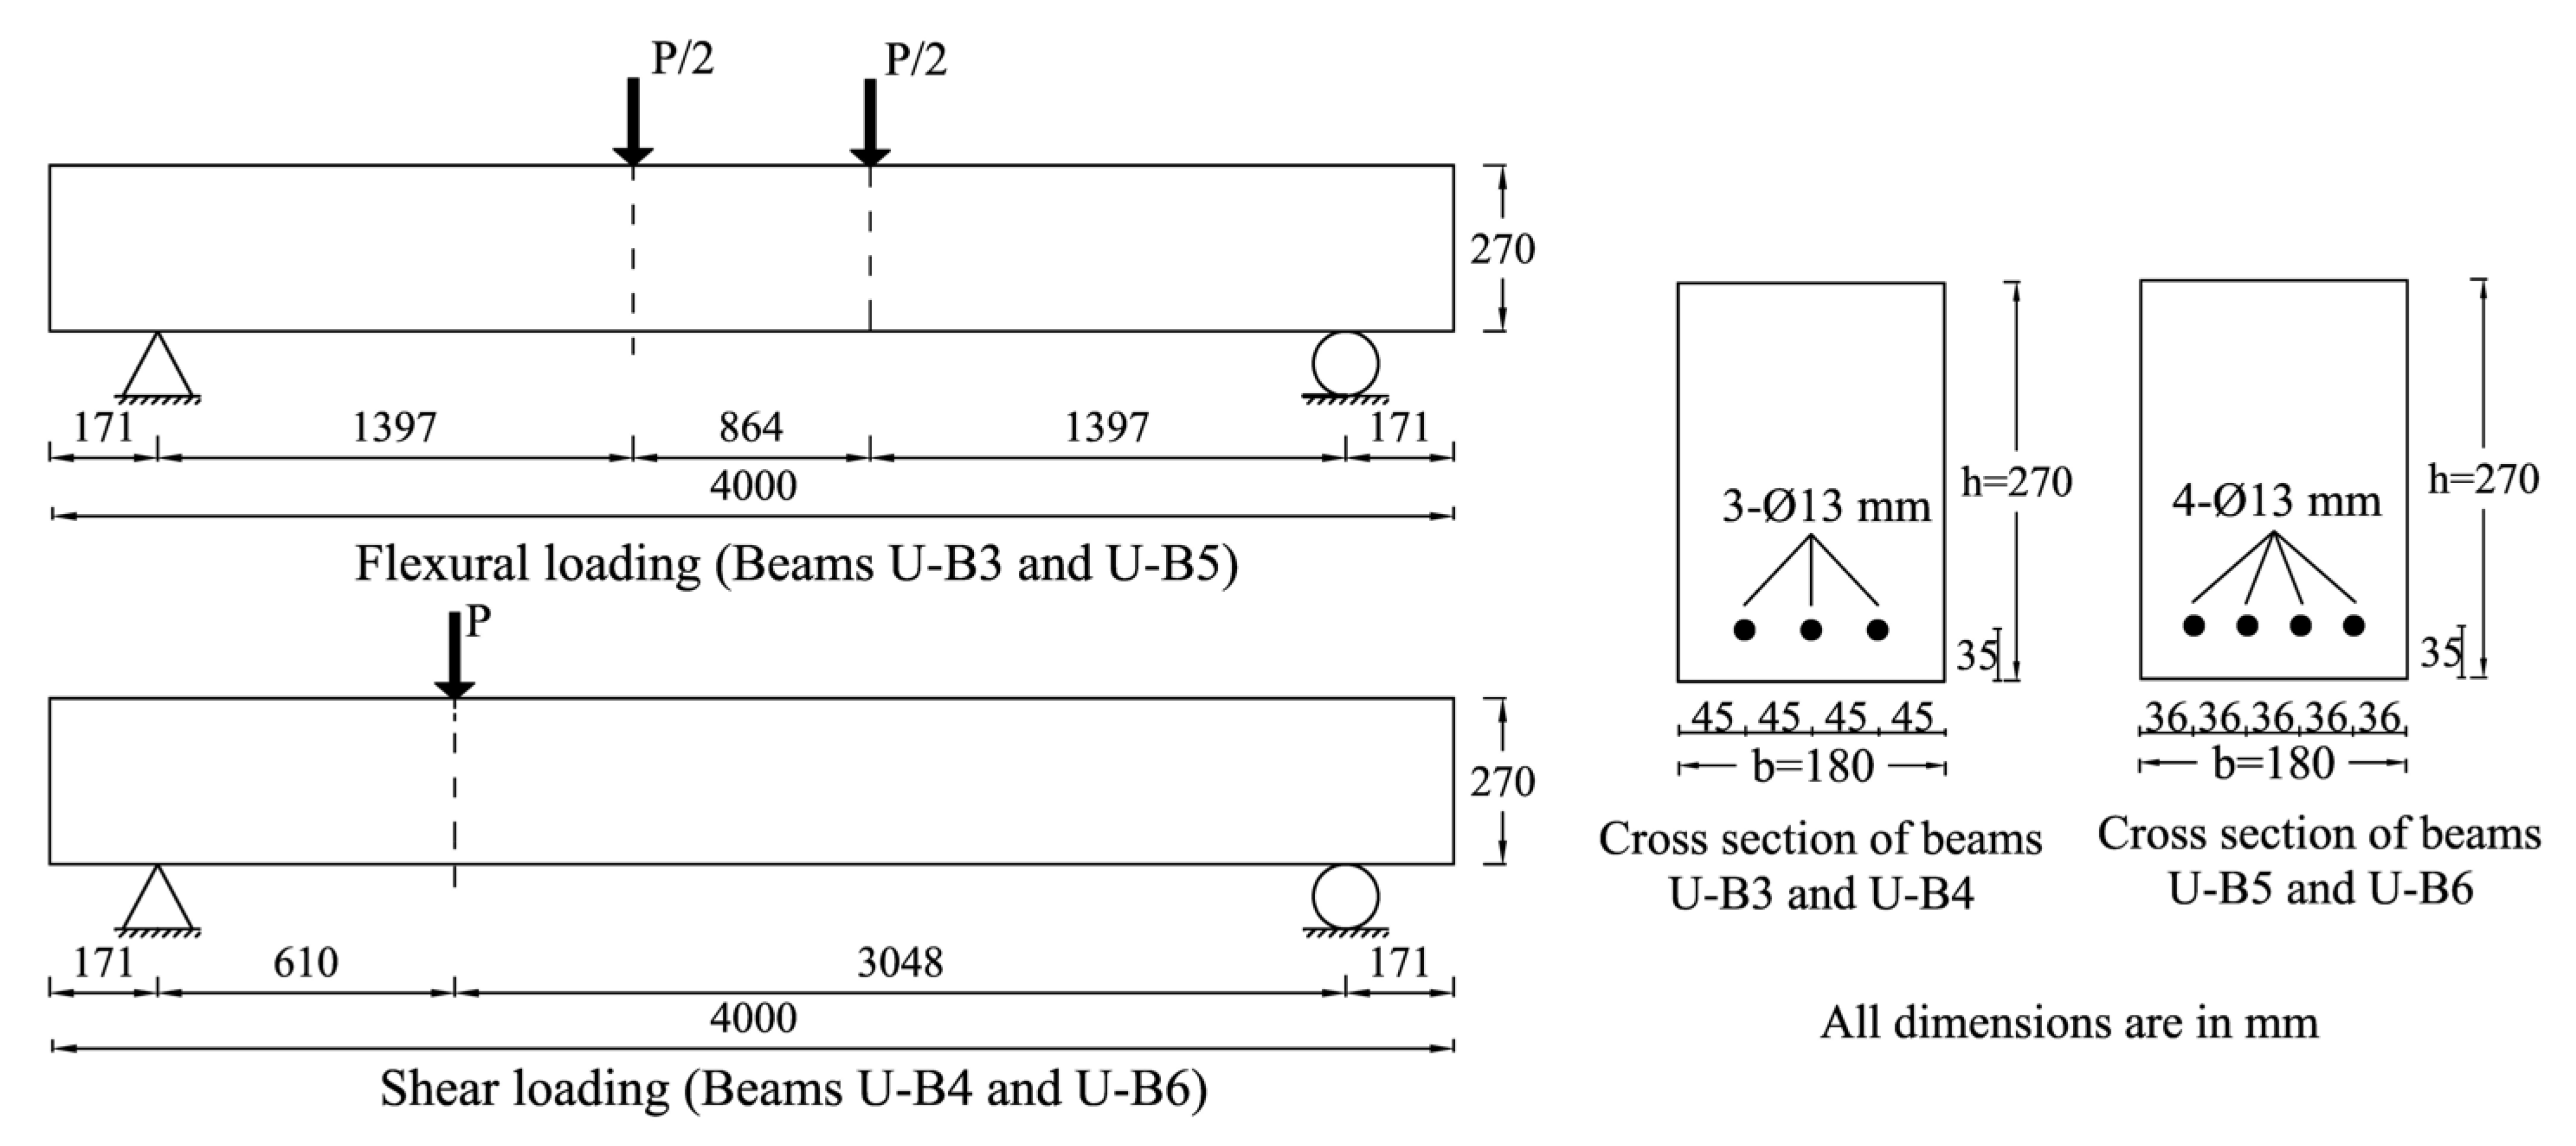
3.1. Selected Beams for Validation

Four UHPFRC beams, designated as U-B3 to U-B6 were fabricated and tested for tracing flexural and shear response of beams. Two beams (U-B3 and U-B5) were tested under flexure by applying two point loads on top face of the beams as shown in Figure 5. This test set-up ensured that the critical span between loading points was subjected to pure flexure and no shear. Two beams (U-B4 and U-B6) were subjected to dominant shear loading through applying a single point load at the distance of 610 mm from support (see Figure 5) [17,64].
In addition, results from tests on UHPC and UHPFRC beams conducted by Yoo and Yoon [11], Yang et al. [5], and Singh et al. [34] were utilized to validate the model. Details of these beam are presented in Table 1. Additional details on experiments, including arrangement of reinforcing bars, loading set-up, and material properties can be found in relevant references [7,11,13,17,34,64]. The compressive strength of UHPC and UHPFRC cylinders reported by authors were used to define compressive stress strain response as proposed in Section 2.2.2. Properties of concrete in tension were based on results of the tests conducted under direct tension. Stress strain response of reinforcement bars were calculated using Equation (7) based on reported yield and ultimate stress of the reinforcement.

3.2. Comparison of Response Parameters

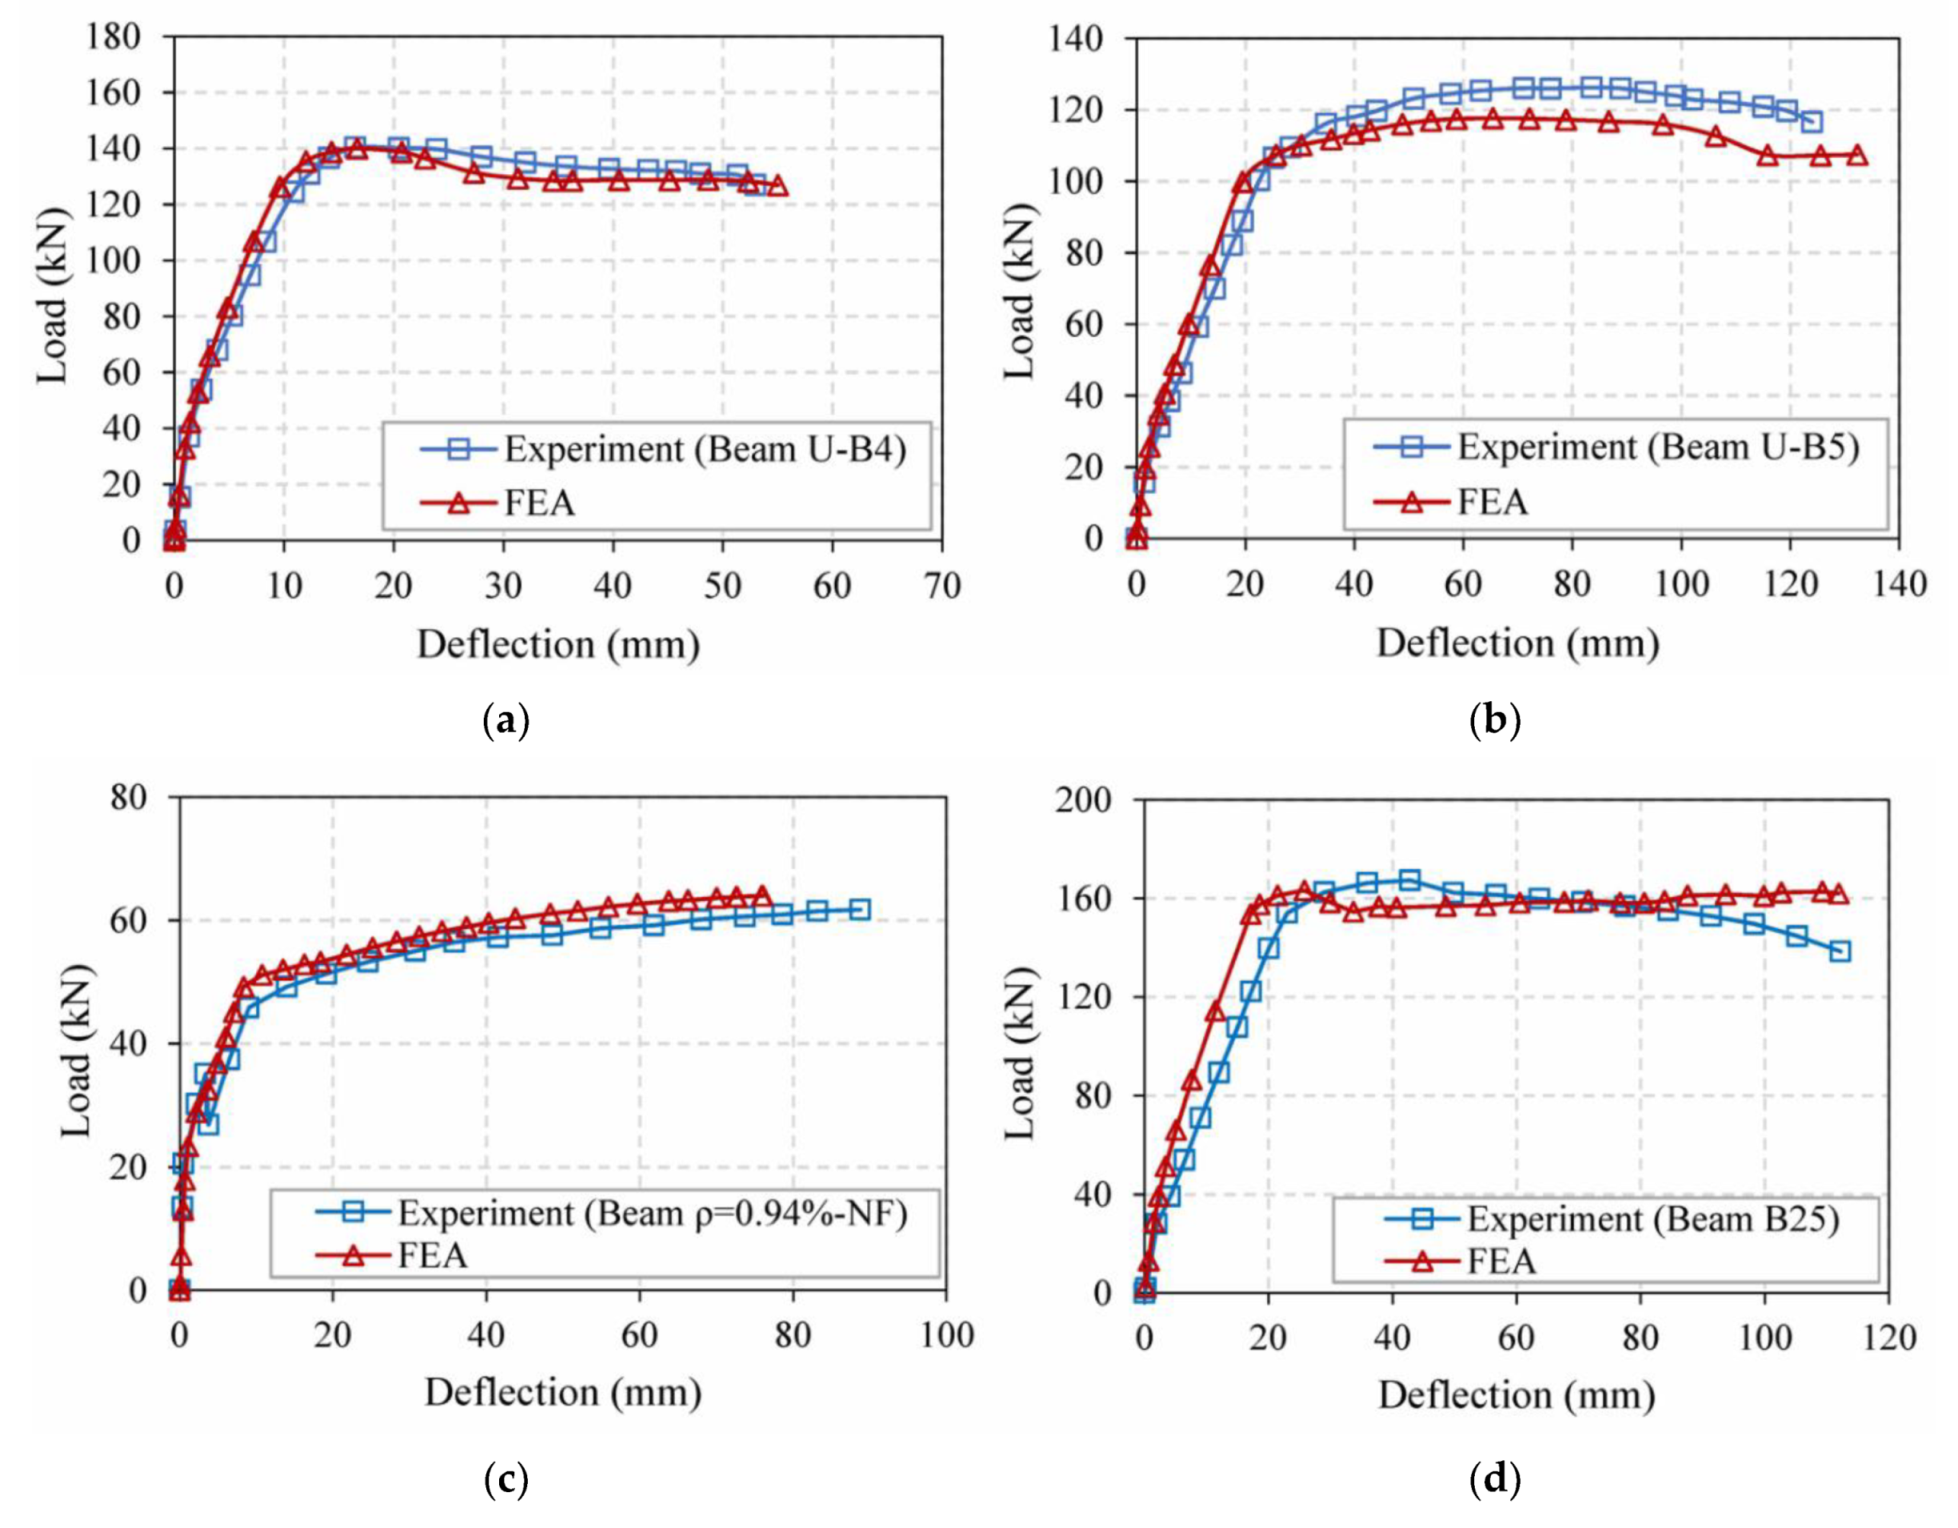
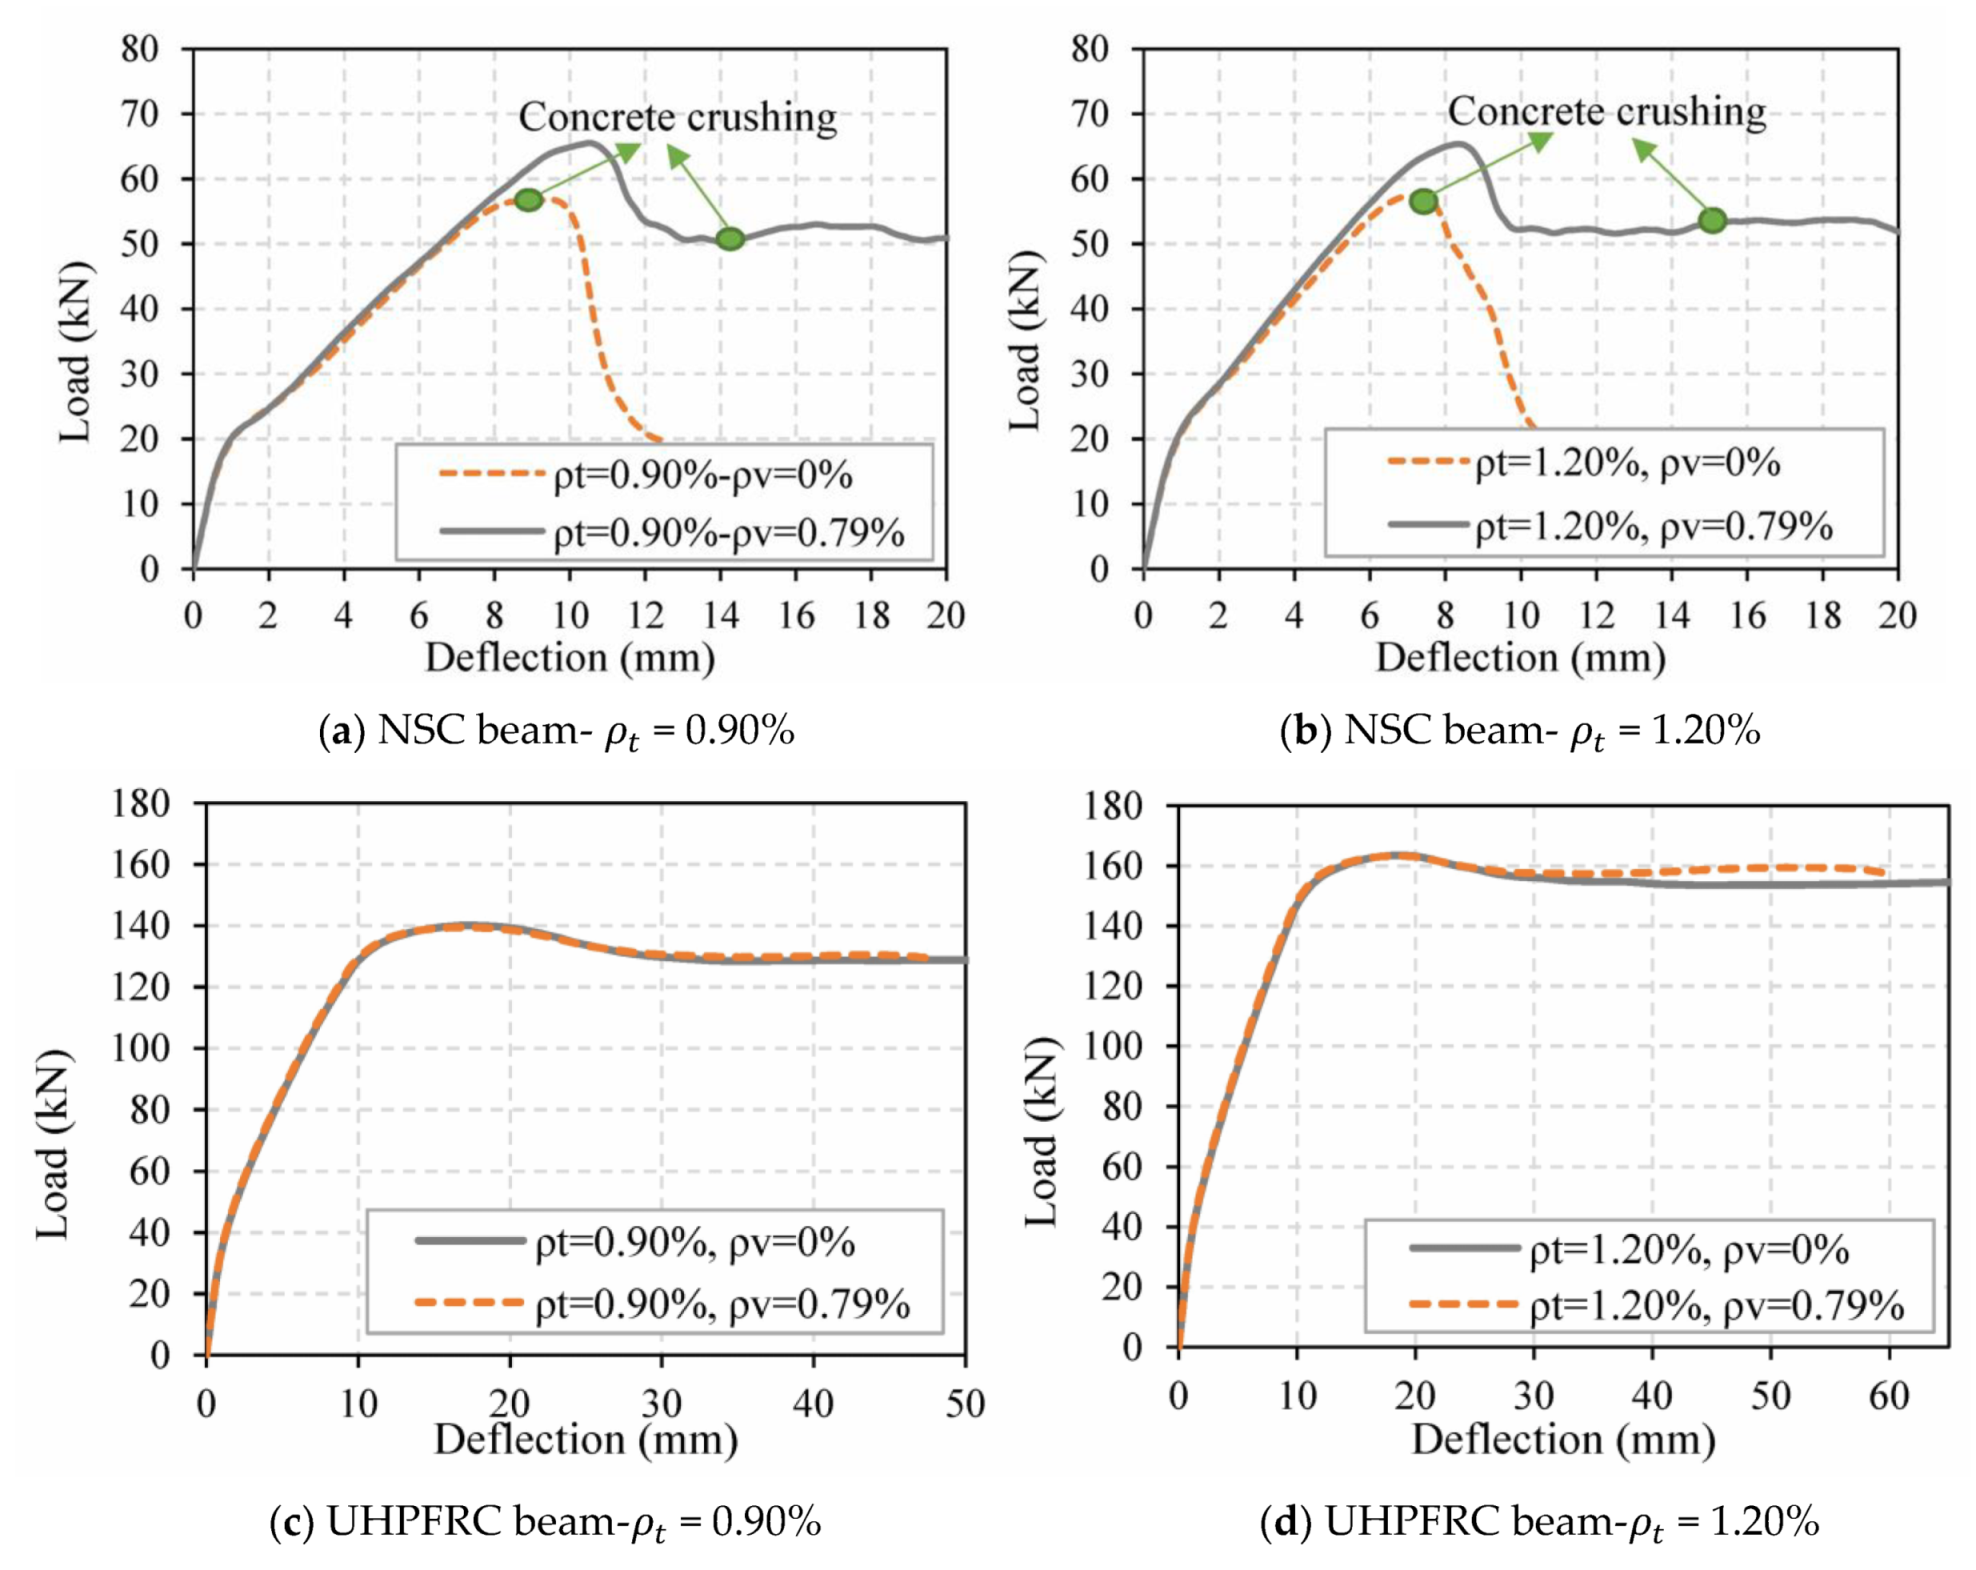
3.2.1. Load-Deflection Response

To establish the validity of the model, a number of UHPC and UHPFRC beams, as listed in Table 1, with different material characteristics, and tested under different loading conditions, were analyzed and load-deflection response of the beams are compared with measured data from experiments. Figure 6a,b shows the load-deflection response of beams U-B4 and U-B5 [17] with different reinforcement ratios tested under different loading configurations (dominant shear and flexure) while Figure 6c,d shows load deflection of beams ρ 0.94%-NF and B25 [11,34] with different fiber volume fractions (0, and 2.25%). It can be seen from the overall trends that the prediction from the numerical model compares well with the measured data in different stages i.e., elastic stage till tensile cracking initiation, post-cracking stage with propagation of cracks, yielding in steel reinforcing bars, and plastic deformation stage including softening until failure in both cases of UHPC and UHPFRC beams. It should be noted that similar comparisons were made for number of other beams tested by various researchers and very good comparisons were obtained (see Table 1).
Moreover, the developed model predicts response well for both UHPC and UHPFRC beams under different loading conditions i.e., flexural and dominant shear loading. Only, in post cracking stage, model predictions are slightly stiffer than the measured experimental data. This difference can be attributed to possible cracks developing in concrete due to dry shrinkage and environmental effects which resulted in softer response in tests. UHPFRC beams with higher reinforcement ratio as compared to similar beams with lower reinforcement ratio (beams U-B5 and U-B6 as compared to beams U-B3 and U-B4), exhibited higher strain hardening in experiments as compared to finite element model predictions. This can be attributed to slight variations in the stress–strain curve adopted for reinforcing steel, which gets more pronounced in load-deflection response at higher reinforcement ratios.
In addition to load-deflection response, the failure load of the beams, as predicted from FEA, is compared with the measured peak loads from experiments in Table 1. A ratio of unity (=1) indicates perfect agreement, while less than unity and higher than unity are conservative and unconservative predictions, respectively. Ratio of total load carrying capacity (P) from model to that of measured values in tests ranges from 0.90 to 1.03 for analyzed UHPC and UHPFRC beams, indicating good capability of the model to capture failure load.
The model is also capable of evaluating the bond developed in rebars at different stages of loading. The bond developed between steel reinforcement and concrete in beams U-B5 and U-B6 (subjected to flexural and dominant shear loading) is plotted in Figure 7. It can be seen that the bond stress increased from about 0.4 MPa, just prior to cracking initiated in the beams, to a stress of about 5.5 MPa at failure. The maximum bond stress in beams U-B5 and U-B6 developed at critical section of the beams i.e., under load points.

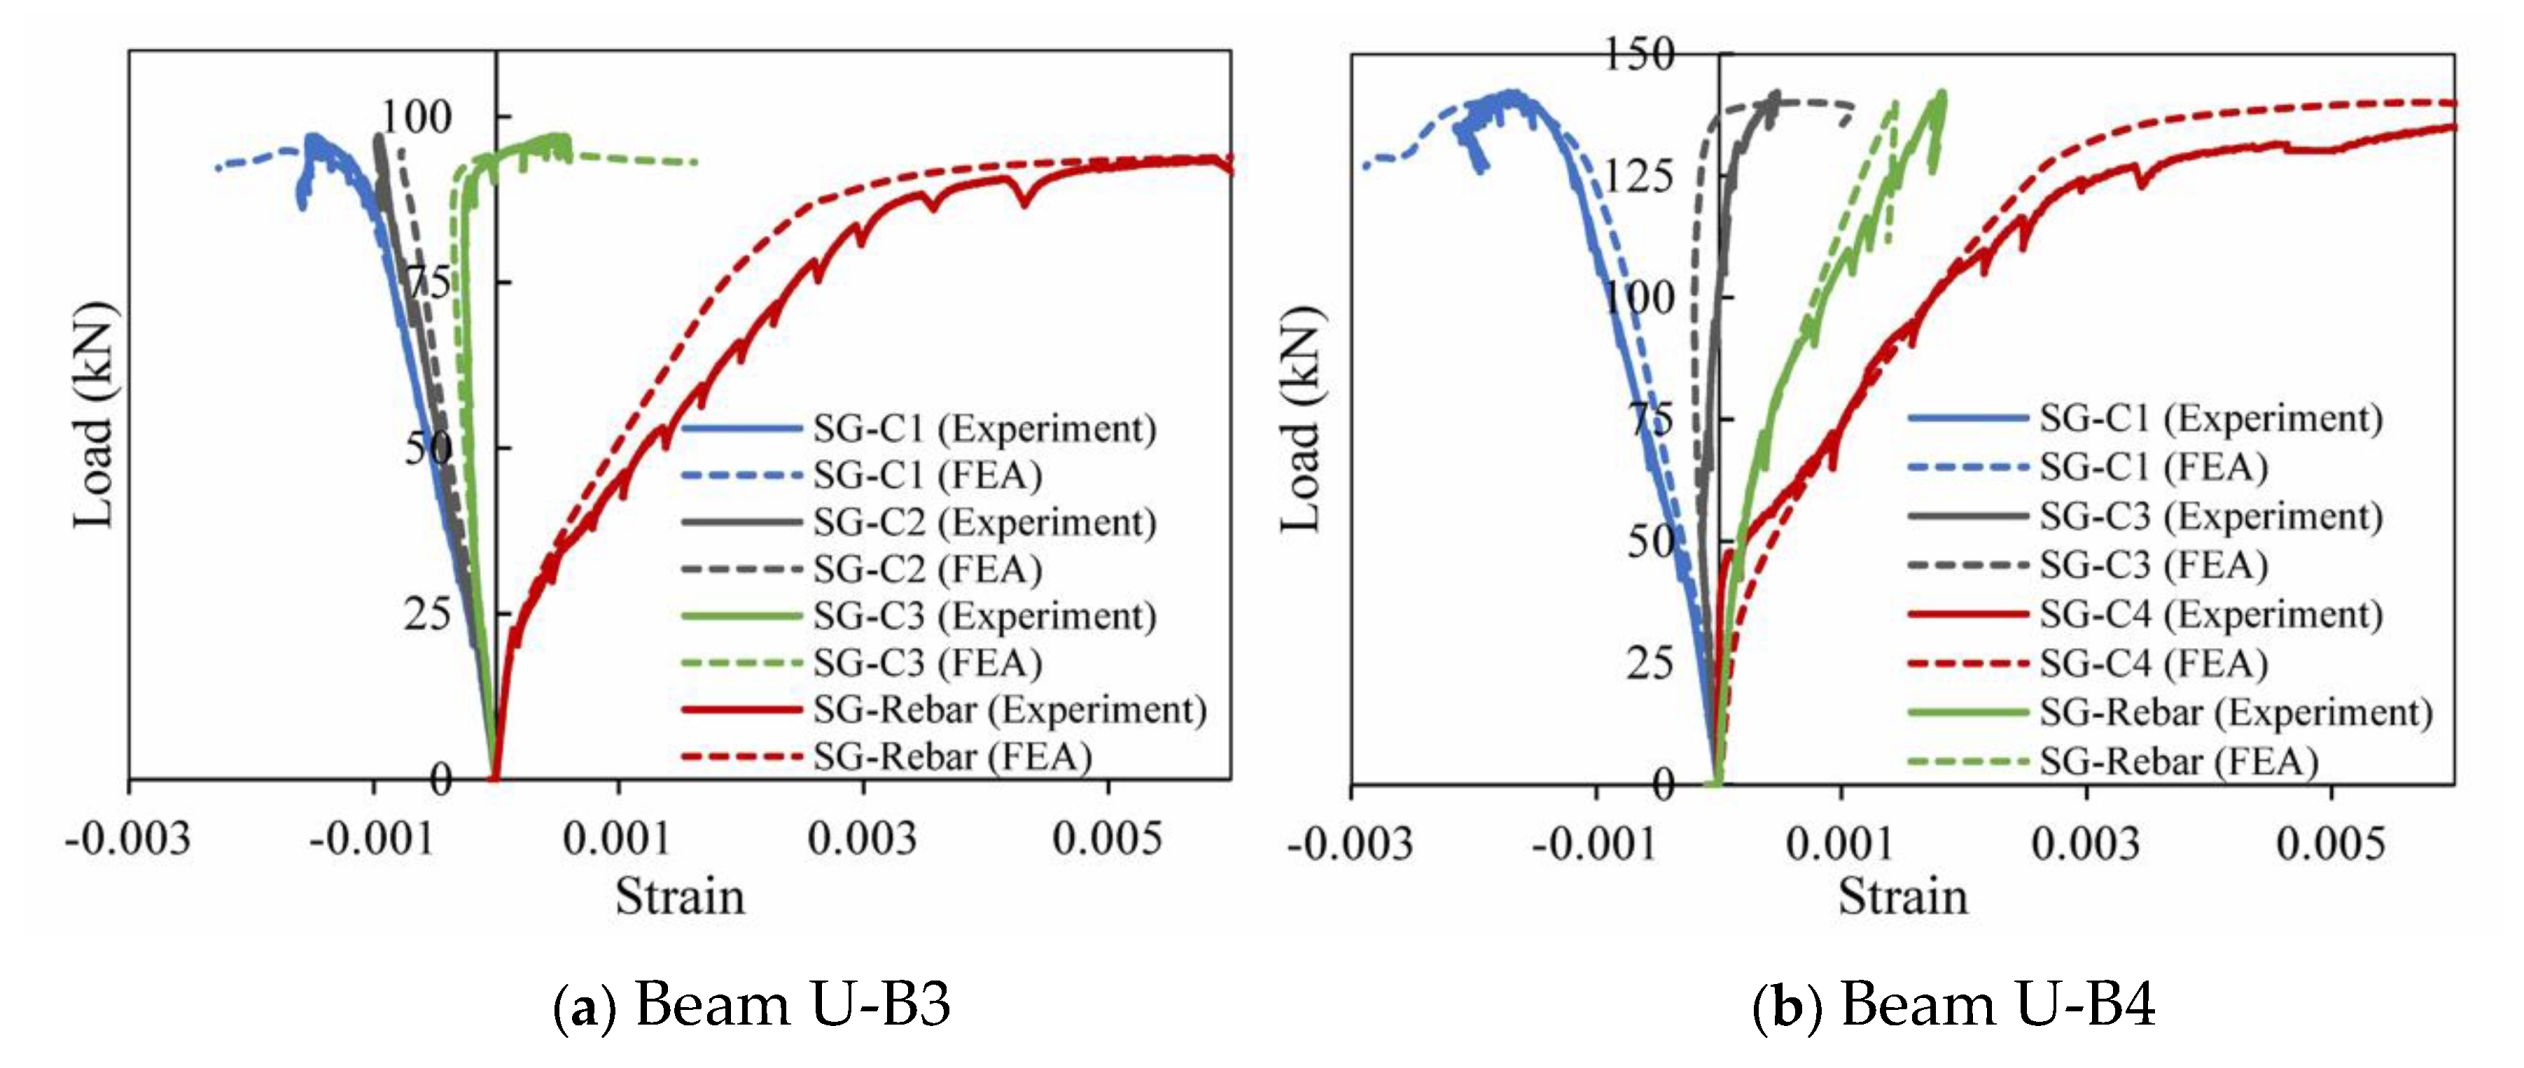
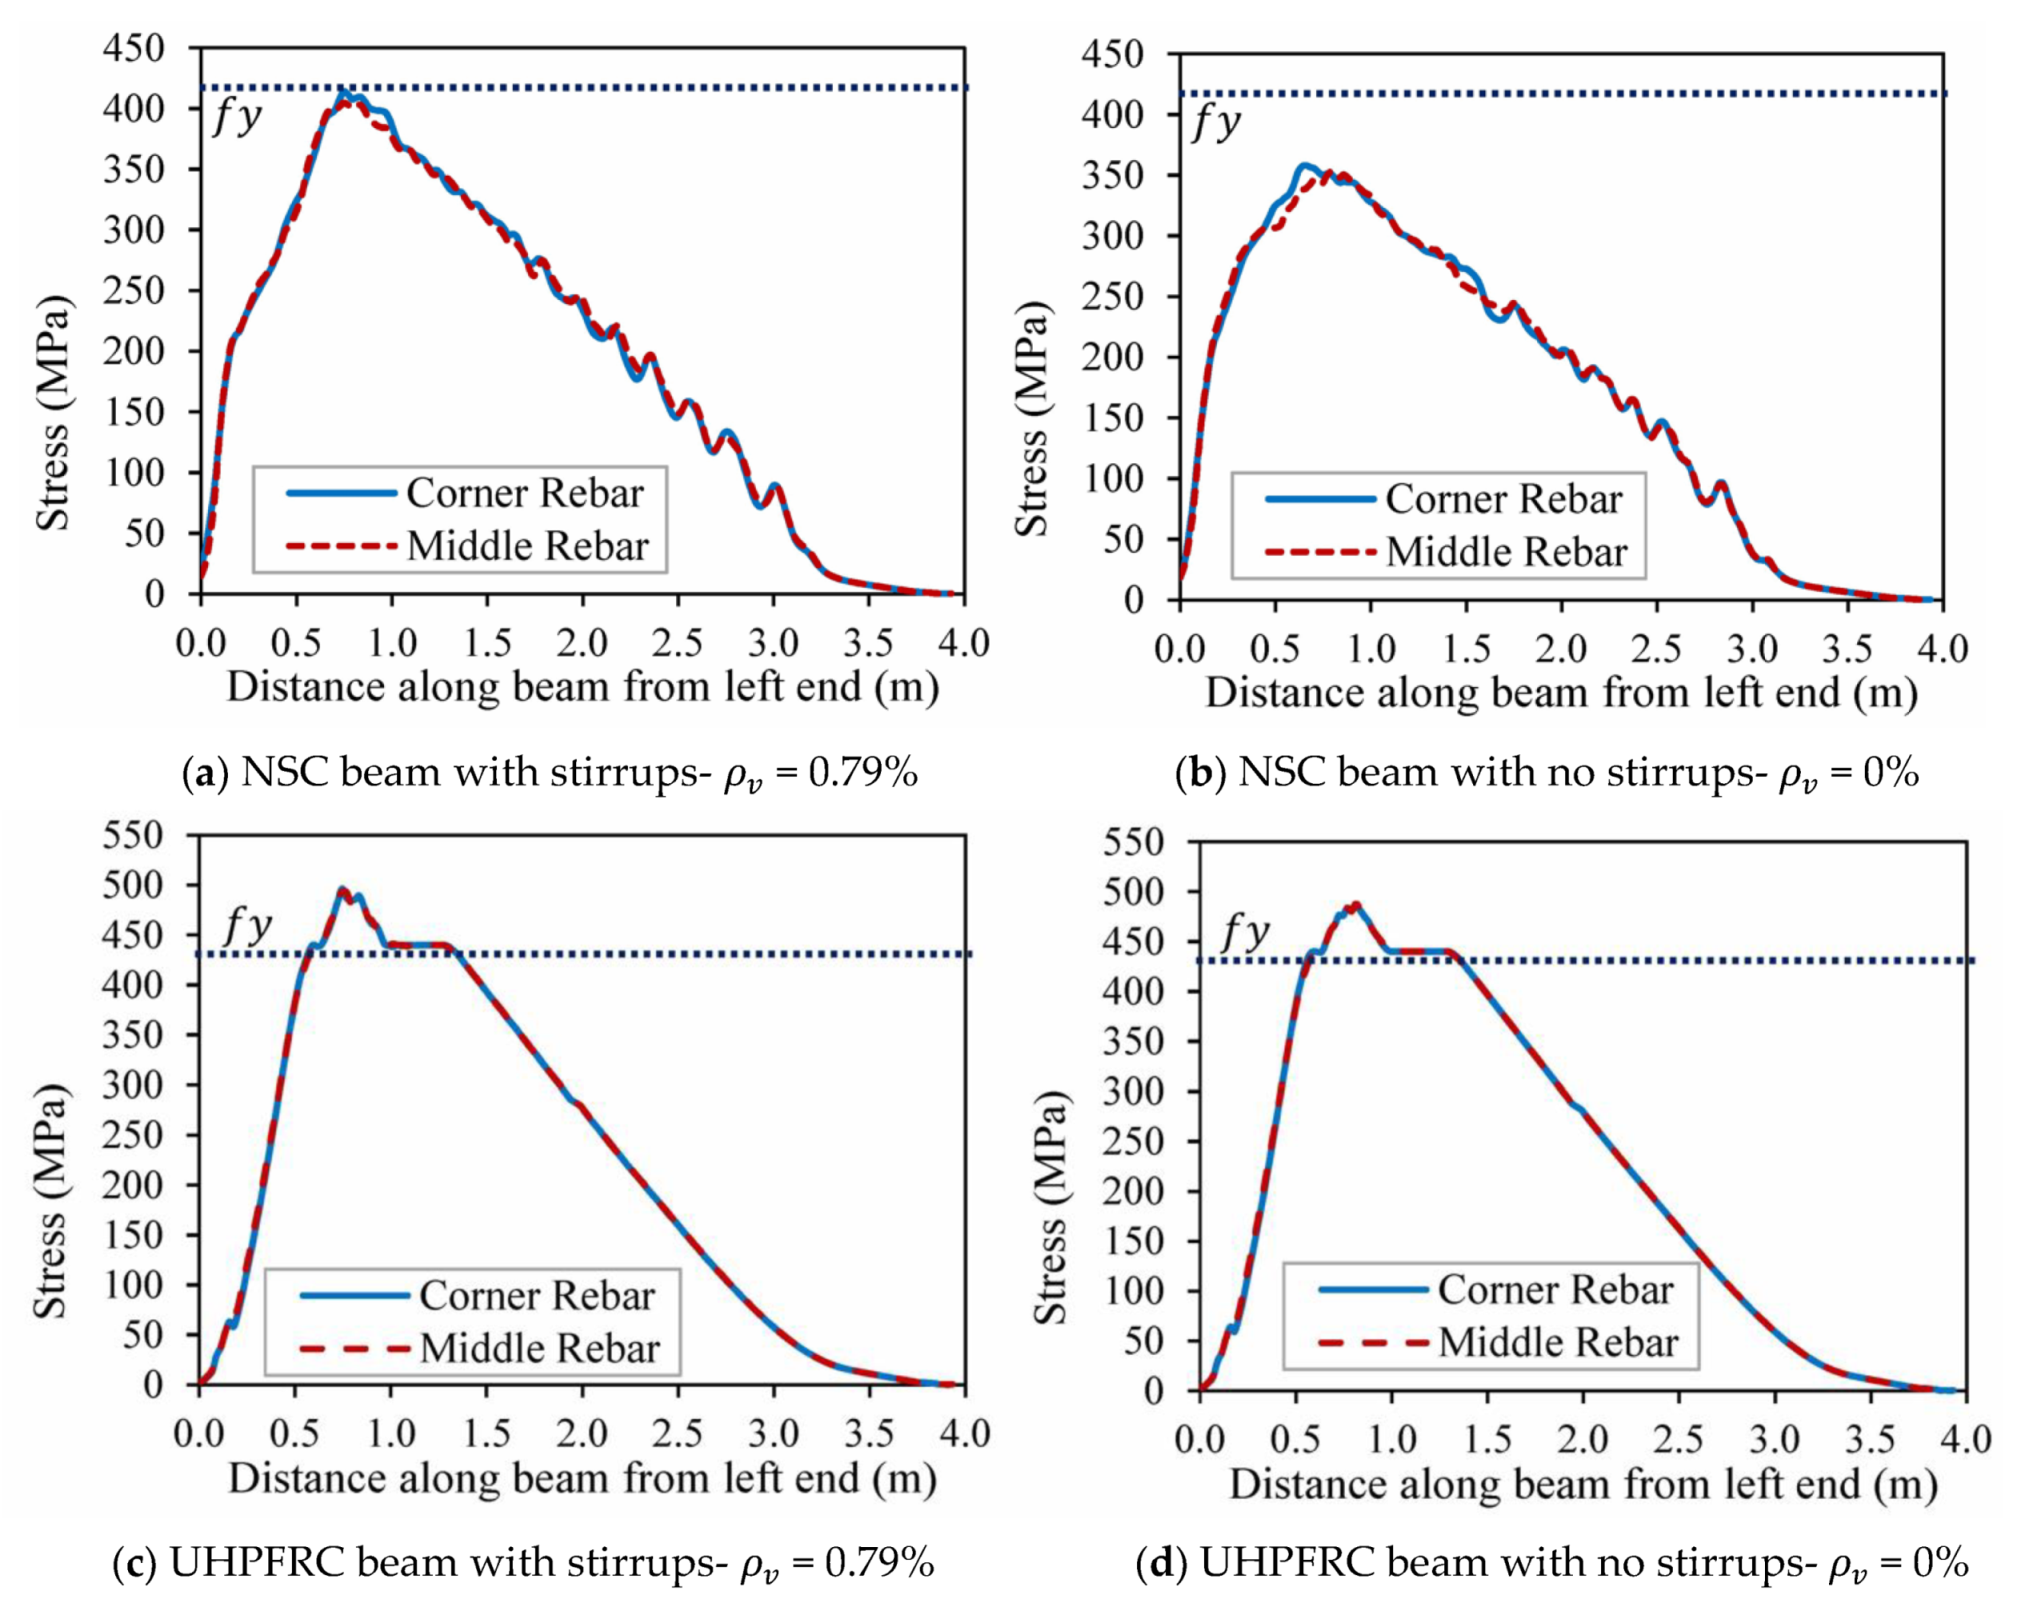
3.2.2. Load–Strain Response

To illustrate the capability of model in capturing the local behavior of UHPFRC beams, predicted load-longitudinal strains on reinforcing bar and concrete layers at critical section of beams U-B3 and U-B4 [17] are compared with the measured strains from tests in Figure 8. A negative strain in the figure indicates that the material is in compressive state while positive strain indicates the presence of tensile state. Strain predictions are plotted until strain gauges stopped recording strains reliably due to cracks developing at the location of the strain gauges. The trends in the plots show that predicted strains from the model are in good agreement with the measured strains from tests. However, predicted strain response in post cracking state is stiffer as compared to the measured experimental values. This difference between predictions from model and measured data from experiments can be due to variations resulting from difference in the material models, as well as any experimental discrepancies arising from bond level between concrete and strain gauges.

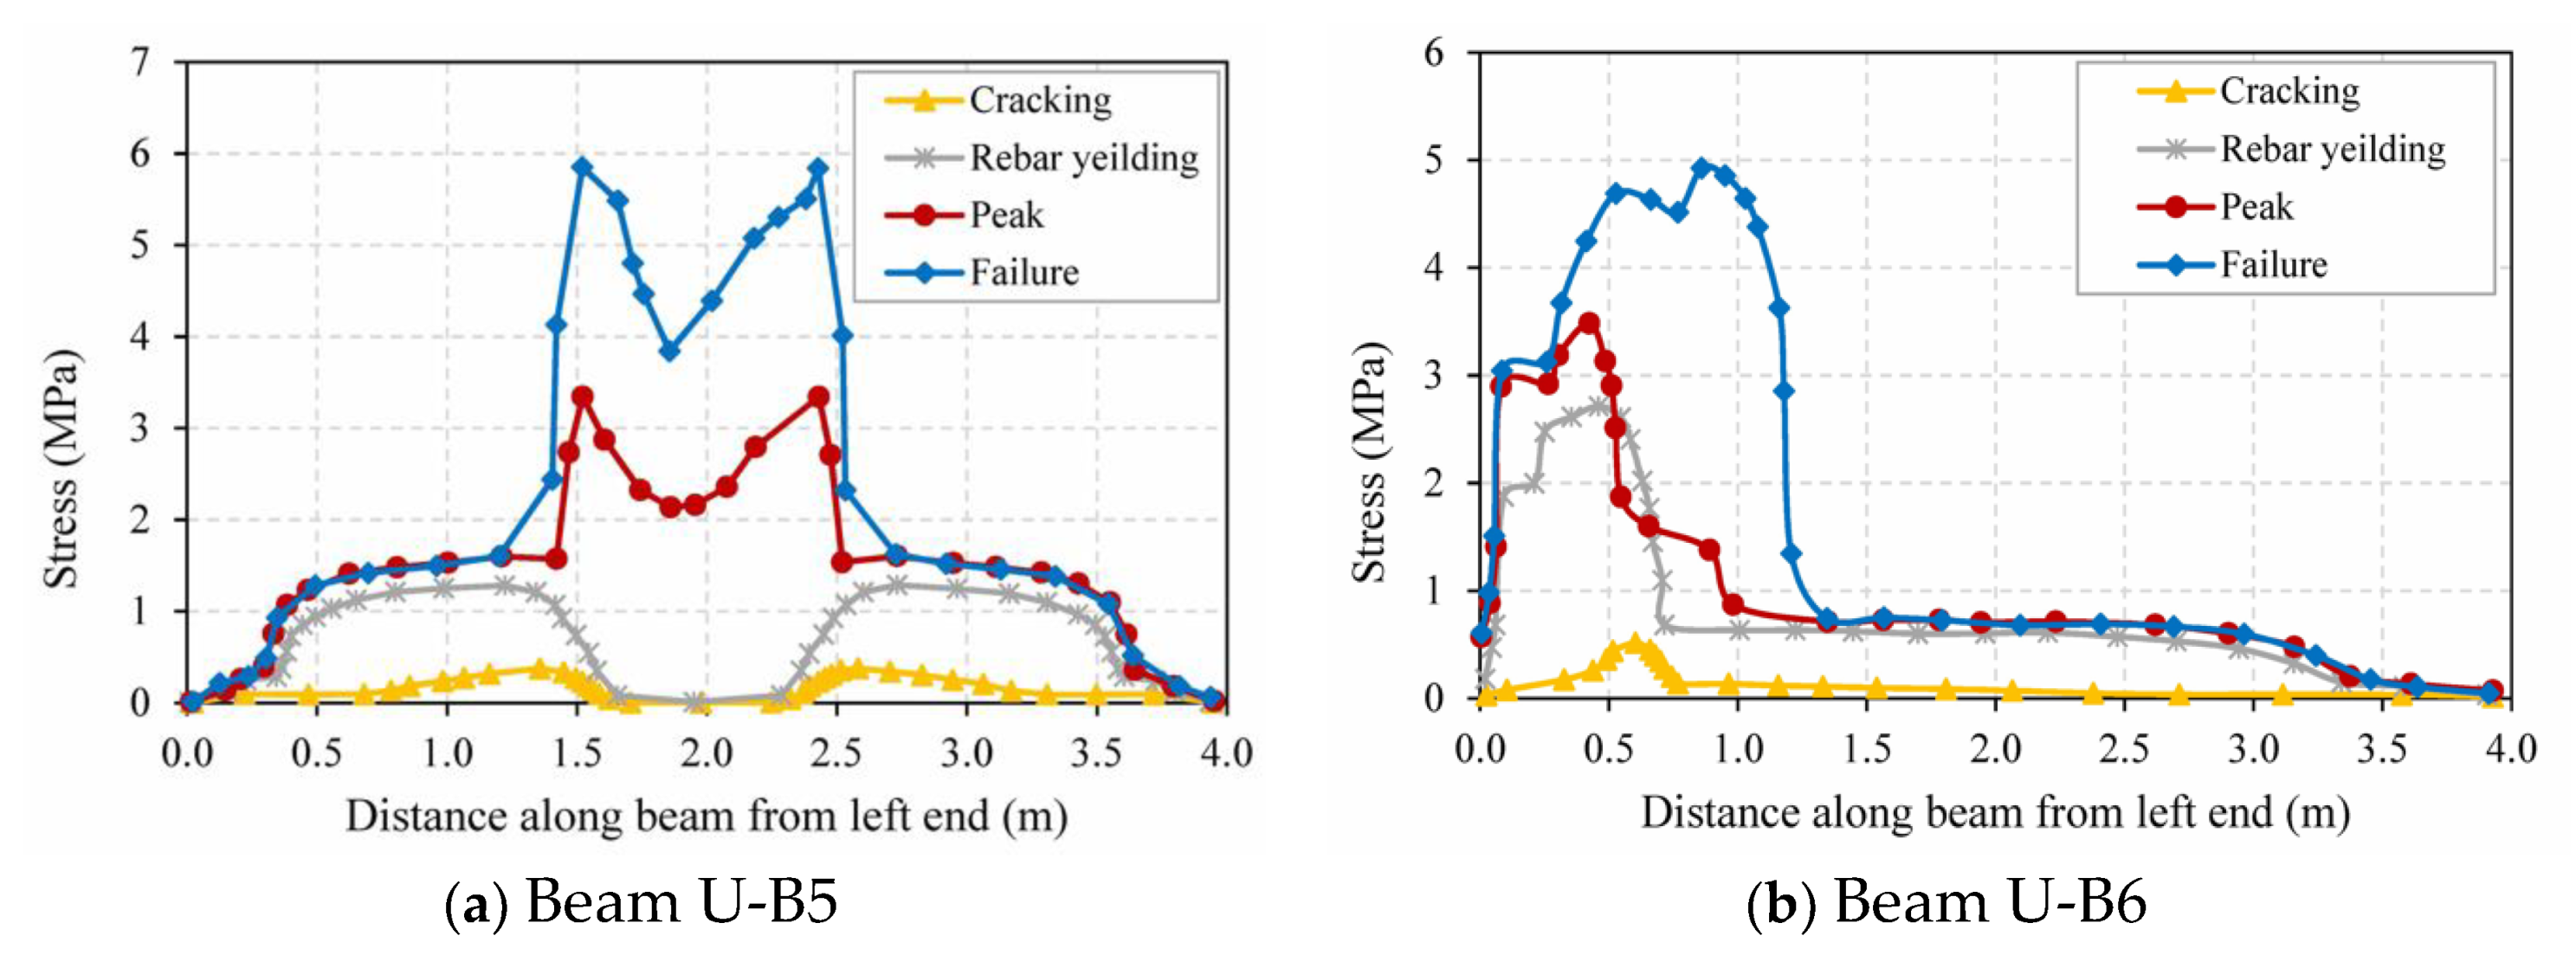
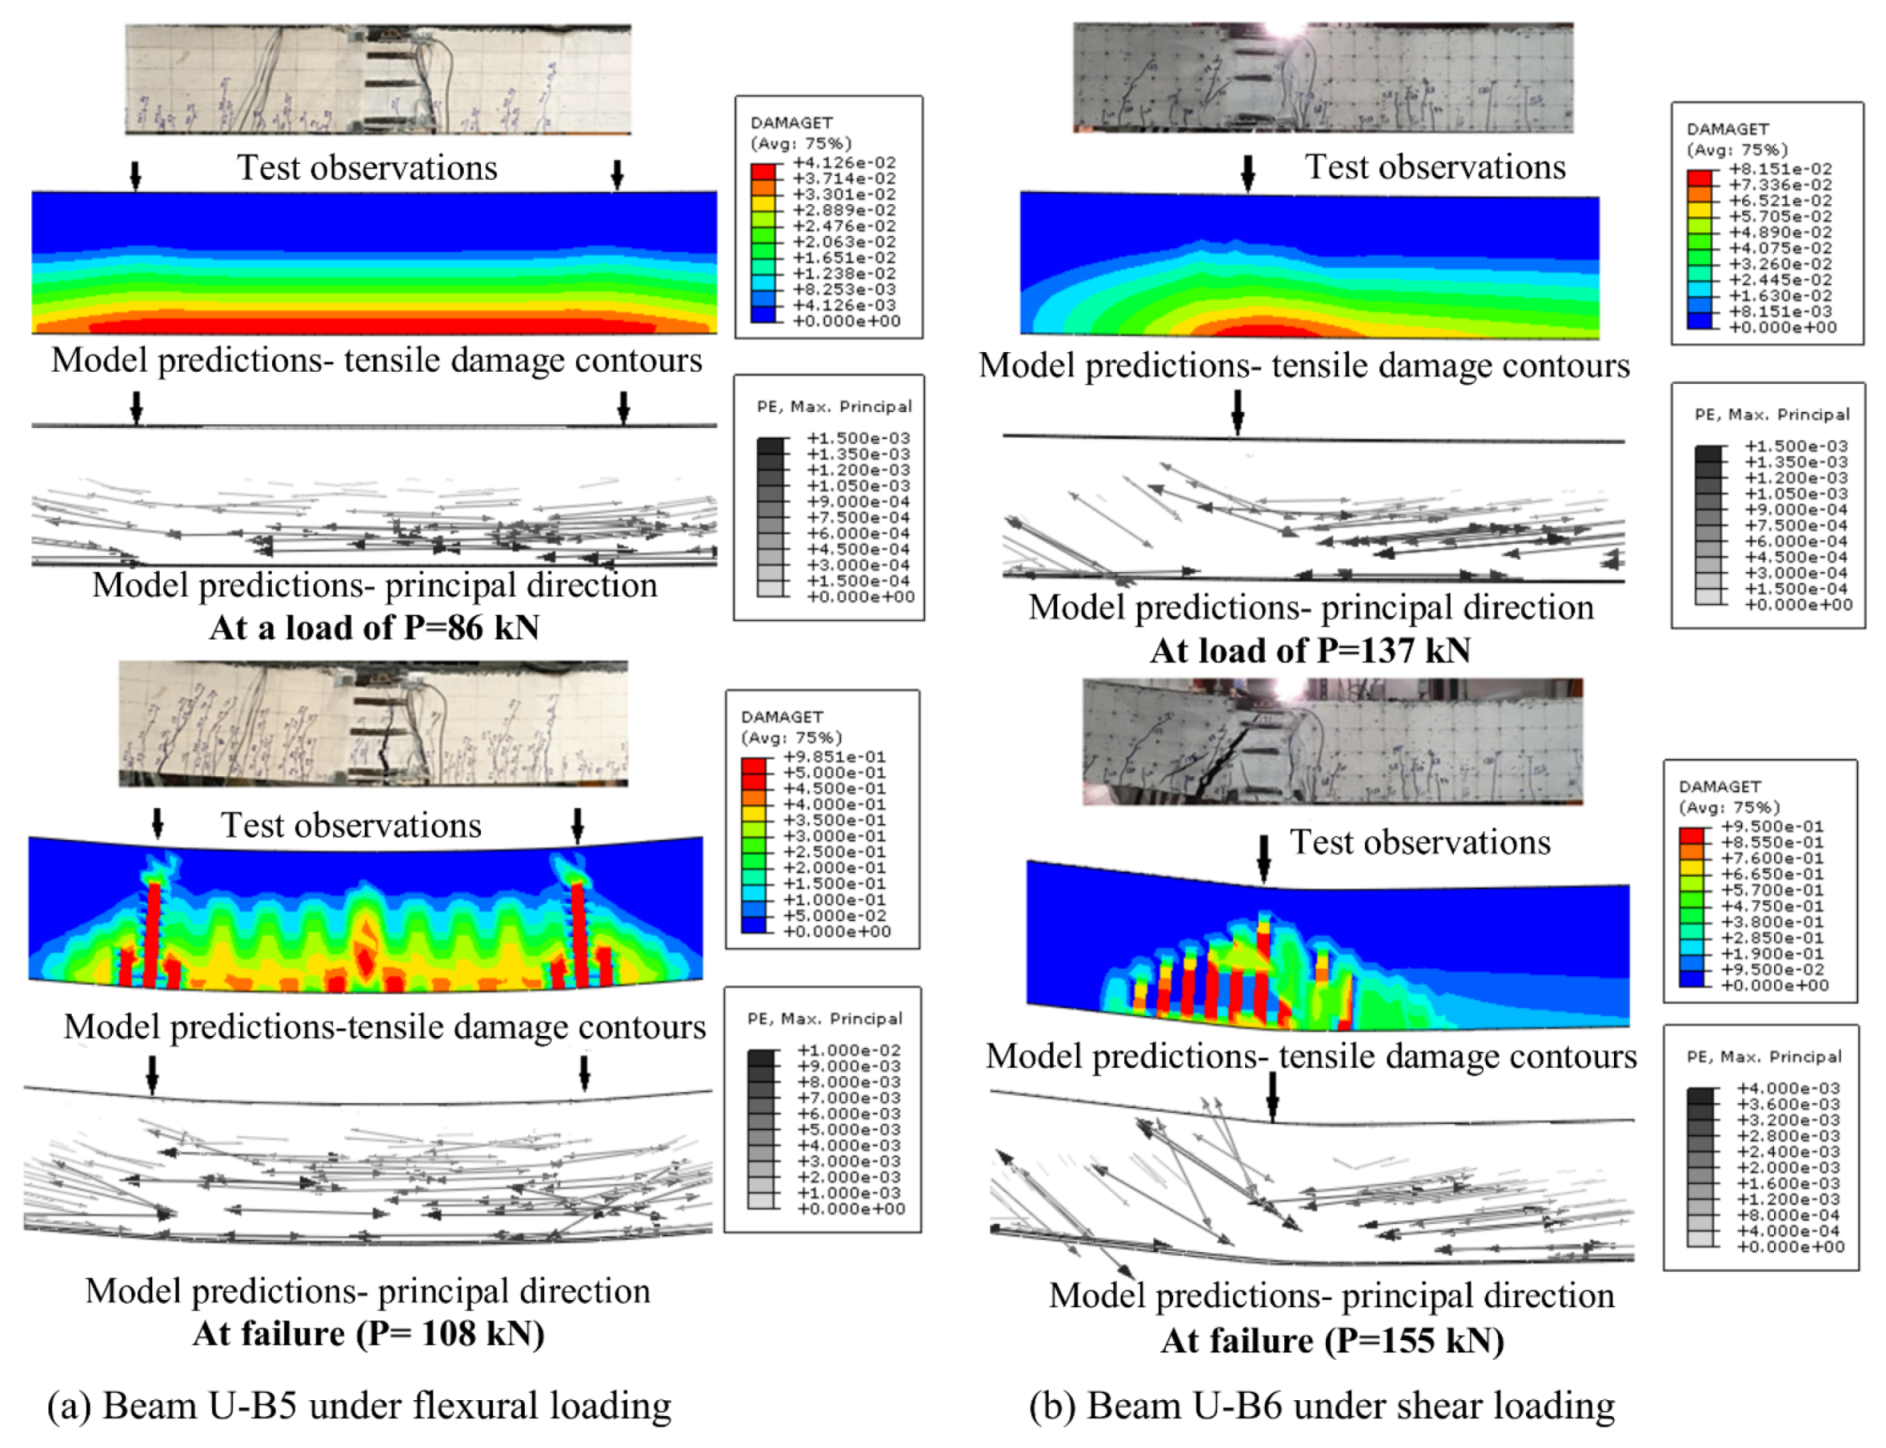
3.2.3. Crack Propagation and Failure Mode

The developed numerical model is also capable of capturing crack progression through tracing scalar tensile damage parameter. This damage parameter in tension gets activated after concrete attains its peak tensile stress. Therefore, damage contours indicate tensile cracking and the level of damage increases with increasing strains (crack widening) at higher load levels. In other words, tensile damage parameter of 0 (zero) represents no tension damage, while a value of 1 (unity) represents complete damage state. Direction of cracking can be represented using direction of principal strains being perpendicular to crack direction.
Tensile damage contours and crack direction obtained through FEA along with experimental results are shown in Figure 9 for beams U-B5 and U-B6, subjected to different loading configurations. In beam U-B5, subjected to flexural loading, flexural cracks initiated at load level of 28 kN at extreme tension fibers of the beam. These flexural cracks developed at the region between loading points being under bending. At a load level of 86 kN, this tensile damage propagated toward compression zone (till mid depth of the beam) as shown in Figure 9a. Direction of principal strain generated from the model confirms propagation of flexural cracks. This type of cracking behavior was observed in the experiment, also can be seen in Figure 9a. With increasing load, at P = 108 kN which is close to failure load, greater depth of the beam was subjected to tensile damage. This clearly infers propagation of cracking toward compression zone with increasing load as observed in the tests (Figure 9a). The tension damage contour generated through FEA illustrates that maximum tensile damage, close to failure, is concentrated at the critical section of the beam which matches with the progression of macro crack as observed during the experiment. It should be noted that a greater value of tensile damage parameter represents a greater level of damage and larger crack width.
In the case of UHPFRC beam U-B6, subjected to shear dominant loading, tensile damage got initiated at extreme tension fiber at a load level of 40 kN and this resulted from tensile stress exceeding the tensile strength of concrete. This initial tensile damage (cracking) was confined to the zone between the load point and mid-span and was mainly in the form of flexural cracks in lower depth of the beam. When the load on the beam increased to 137 kN, these flexural cracks propagated toward compression zone (upper depth). Further, additional flexural-shear cracks developed in the shear span as shown in Figure 9b. The tensile damage contour and principal direction shown in Figure 9b match well with the crack pattern observed during tests. As the load increased further to 155 kN (just prior to failure), shear stresses in the shear span increased significantly and shear cracks became much more predominant. In other words, maximum principal stresses in shear span exceeded the tensile capacity of UHPFRC. Model predictions also show that as the load level approached failure load, tensile damage propagated further toward compression zone and more cracks got initiated and propagated further into the shear span. The predicted tensile damage and principal direction in the shear span of the beam U-B6 (between left support and loading point) close to failure and cracking pattern observed in experiment are compared in Figure 9b. The predicted direction of principal strains in shear span matches well with the direction of the major diagonal tension crack (which is perpendicular to principal direction) observed in the experiment.

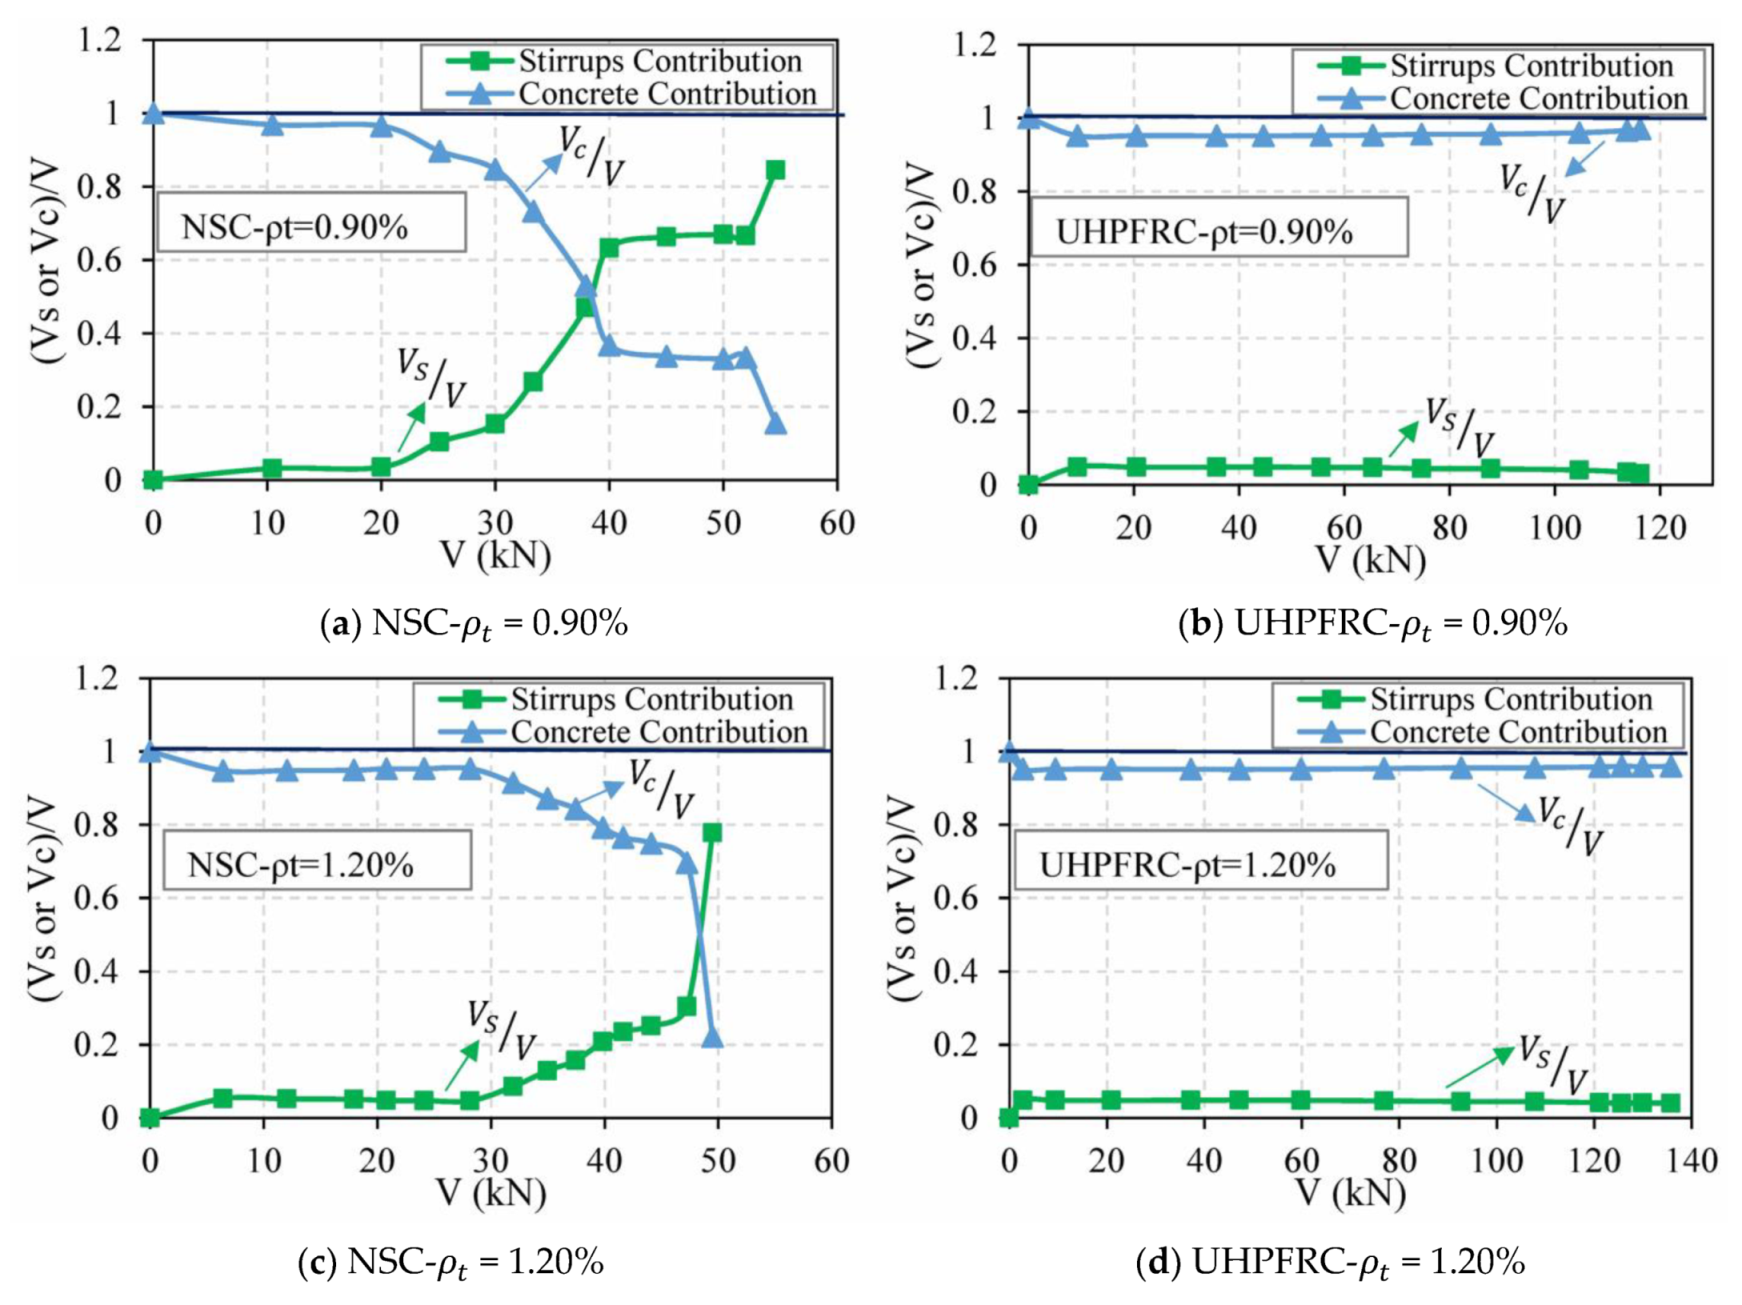
3.2.4. Concrete and Stirrups Contribution to Shear Capacity

UHPFRC possesses high tensile strength and ductile characteristics (high ultimate tensile strain), and this can be utilized to realize high shear capacity in UHPFRC beams. The developed model was applied to explore the feasibility of removing shear reinforcement in UHPFRC beams; specifically, the contribution of concrete and stirrups to shear resistance was quantified. Behavior of tested UHPFRC beams U-B4 and U-B6, provided with shear reinforcement, were analyzed under dominant shear loading using the above developed numerical model. Moreover, for comparative study, NSC beams with the same cross sectional details as U-B4 and U-B6, as shown in Figure 5, were modeled under dominant shear loading. The material model for NSC recommended in ABAQUS documentation [39] were incorporated into the model for analyzing NSC beams.
Predicted load-deflection response of NSC beams, with different longitudinal tensile reinforcement ratios (i.e., ρ t = 0.90% and ρ t = 1.20%) with and without stirrups, is shown in Figure 10a,b. As can be seen in the figure, the load carrying capacity in the NSC beams, with tensile reinforcement ratio of 0.90% and 1.20%, reduces by 14% and 15% when the stirrups are removed. In addition, NSC beams without shear reinforcement exhibited significant reduction of stiffness after reaching peak load, as compared to the beams provided with stirrups.
Moreover, stress distribution developed along the tensile reinforcement bars in NSC beams, with and without stirrups, at peak load level is shown in Figure 11a,b. The comparative trends indicate that reinforcing bars in NSC beam provided with stirrups, yielded as opposed to NSC beam with no stirrups; in other words, the beam with stirrups reached its ultimate moment capacity. However, NSC beam without stirrups failed in shear before reaching ultimate moment capacity (see Figure 11a,b).
The behavior of UHPFRC beams having same configurations as that of U-B4 and U-B6 was analyzed under two cases; one with stirrups and the other one without stirrups. The load-deflection response of UHPFRC beams with and without shear reinforcement are compared in Figure 10c,d. It can be seen that removing stirrups did not affect the overall structural response of the beams in terms of load-carrying capacity and ductility. This was also confirmed with experimental data generated from tests on beams U-B3 to U-B6. Beams U-B4 and U-B6, with no shear reinforcement reached their ultimate moment capacity under dominant shear loading.
The stress developed in longitudinal bars in UHPFRC beam (similar to U-B4) with and without stirrups is presented in Figure 11c,d. In both cases of UHPFRC beam with and without stirrups, bars yielded. In other words, unlike NSC beams, UHPFRC beams without stirrups do not experience abrupt failure before yielding in the reinforcing bars and this is owing to high tensile strength and ultimate strain of UHPFRC that develops due to bridging effect facilitated by presence of steel fibers.
The contribution of different components to shear capacity of NSC and UHPFRC beams was quantified to determine the extent of contribution from UHPFRC and stirrups. For this purpose, the stirrups crossing crack surface, which were in tension as compared to other stirrups, were identified. The contribution of stirrups to shear strength (Vs) was calculated using the tensile stress developed in the stirrups of two NSC and UHPFRC beams. In the case of a NSC beam contribution of stirrups to shear resistance, which was small till cracking, it increased after first cracking and reached to about 90% of total shear capacity at peak state (see Figure 12). However, in the case of a UHPFRC beam, shear resistance of the beam resulted mostly from contribution of concrete (Vc) and stirrups did not contribute to shear capacity of the beam as shown in Figure 12.
Contribution of concrete to shear strength comprises contribution of uncracked concrete in compression (from compression block of concrete), and resistance arising from fiber bridging and aggregate interlock across cracked concrete. It should be noted that in the case of slender steel fiber-reinforced concrete beams without stirrups, and under reinforced beams, dowel action contribution can be neglected [65].
Therefore, to quantify the contribution of uncracked concrete (Vcc) to shear resistance, model prediction is used to identify the region above the neutral axis which is in compression (see Figure 13). This region (compression block) is subjected to normal compressive and shear stresses. Therefore, the contribution of concrete to shear strength arising from compression block can be evaluated utilizing predicted shear stress in region above neutral axis. Once the contribution of uncracked concrete to shear capacity is determined, the remaining shear strength of concrete is attributed to interfacial shear resistance (Vi) which arises from aggregate interlock and fiber bridging as shown in Figure 13 [65].
In two UHPFRC beams without stirrups, U-B4 and U-B6, subjected to dominant shear loading, shear strength contribution from compression block (Vcc) and fiber bridging and aggregate interlock (Vi) is evaluated and presented in Table 2. The results show that 67% and 65% of shear capacity of these beams (U-B4 and U-B6) came from compression block (Vcc) at initial cracking stage. With increasing load level (at peak and failure load levels), cracks propagated more toward the compression zone. Therefore, the contribution of compression block to shear capacity decreased as smaller depth of concrete was in compression. As can be seen in Table 2, with decreasing contribution of compression block (Vcc/V), interfacial shear resistance (Vi/V) which is due to fiber bridging and aggregate interlock at cracks surfaces increased. The reduction in contribution of compression block to shear resistance was higher in case of beam U-B6 as compared to beam U-B4. This is attributed to higher applied load in beam U-B6 as compared to beam U-B4 due to higher reinforcement ratio. Therefore, cracks propagated more toward compression zone in beam U-B6, and smaller depth of the beam was uncracked (in compression).
In addition, contribution of compression block and aggregate interlock to shear strength of NSC beams, having the same cross sectional details as beams U-B4 and U-B6 is quantified (see Table 2). The results show that NSC beams did not exhibit significant reduction in compression block contribution to shear strength (Vcc/V) with increasing load till peak state. In other words, contribution of interfacial shear resistance to shear capacity (Vi/V) did not increase, as opposed to UHPFRC beams wherein interfacial shear resistance (Vi/V) increased due to activation of fiber bridging.
These analyses illustrate the usefulness of the developed model in determining the contribution of concrete and stirrups to shear capacity of beams. In UHPFRC beams, due to high tensile and compression strength of UHPFRC, concrete contribution to shear capacity is quite significant and until final stages of loading, stirrups do not play major role in resisting shear. Therefore, stirrups can be eliminated in many cases. This is in contrast to the shear response of NSC beams wherein contribution of concrete to shear capacity decreases after the onset of cracks in beams, and thus the presence of stirrups are critical in resisting shear beyond cracking load levels.

4. Conclusions

Based on the results presented in the paper the following conclusions can be drawn.
  • UHPC or UHPFRC exhibits significantly different mechanical properties as compared to conventional concrete. The proposed numerical model utilizing concrete damage plasticity model with adjusted parameters is capable of tracing the structural response of UHPC beams in the entire range of loading; from precracking stage till failure.
  • The numerical model presented here can accommodate various configurations in beams, including different loading patterns (flexure or shear), and different material characteristics such as presence of fibers, fibers volume fraction, and presence of shear reinforcement. Moreover, the model is capable of predicting contribution of stirrups and concrete (including compression block and interfacial shear resistance) to shear capacity of UHPFRC beams.
  • Tensile damage contour predictions along with principal direction, is an effective response parameter for tracing crack propagation zone and failure modes in UHPFRC beams.
  • Removing stirrups does not result in reduction of ductility or load carrying capacity of UHPFRC beams. In other words, UHPFRC beams without shear reinforcement, subjected to dominant shear loading, can attain ultimate moment capacity, without experiencing brittle failure before rebar yielding.

Author Contributions

R.S.: conceptualization, formal analysis, investigation, methodology, writing—original draft. V.K.; conceptualization, methodology, writing—review and editing, supervision. All authors have read and agreed to the published version of the manuscript.

Funding

This study was funded by U.S. Airforce Research Laboratory (AFRL) through Metna Company, and Michigan State University.

Institutional Review Board Statement

Not applicable.

Informed Consent Statement

Not applicable.

Data Availability Statement

All data, models, or code that support the findings of this study are available from the corresponding author upon reasonable request.

Acknowledgments

The authors wish to acknowledge the support of U.S. Airforce Research Laboratory (AFRL), Metna Company, and Michigan State University for undertaking this research. Any opinions, findings, conclusions, or recommendations expressed in this paper are those of the authors and do not reflect the position, policy, or views of the sponsors.

Conflicts of Interest

The authors declare that they have no conflict of interest.

References

  1. Kang, S.-T.; Lee, Y.; Park, Y.-D.; Kim, J.-K. Tensile Fracture Properties of an Ultra High Performance Fiber Reinforced Concrete (UHPFRC) with Steel Fiber. Compos. Struct. 2010, 92, 61–71. [Google Scholar] [CrossRef]
  2. Xu, M.; Wille, K. Fracture Energy of UHP-FRC under Direct Tensile Loading Applied at Low Strain Rates. Compos. Part B Eng. 2015, 80, 116–125. [Google Scholar] [CrossRef]
  3. Empelmann, M.; Teutsch, M.; Steven, G. Improvement of the Post Fracture Behaviour of UHPC by Fibres. In Proceedings of the Second International Symposium on Ultra High Performance Concrete, Kassel, Germany, 5–7 March 2008; p. 177. [Google Scholar]
  4. Yoo, D.-Y.; Banthia, N. Mechanical properties of ultra-high-performance fiber-reinforced concrete: A review. Cem. Concr. Compos. 2016, 73, 267–280. [Google Scholar] [CrossRef]
  5. Yang, I.-H.; Joh, C.; Kim, B.-S. Flexural Response Predictions for Ultra-High-Performance Fibre-Reinforced Concrete Beams. Mag. Concr. Res. 2011, 64, 113–127. [Google Scholar] [CrossRef]
  6. Graybeal, B.; Tanesi, J. Durability of an Ultrahigh-Performance Concrete. J. Mater. Civ. Eng. 2007, 19, 848–854. [Google Scholar] [CrossRef]
  7. Solhmirzaei, R.; Kodur, V.; Banerji, S. Shear Behavior of Ultra High Performance Concrete Beams without Stirrups. In Proceedings of the International Interactive Symposium on Ultra-High Performance Concrete, Albany, GA, USA, 2–5 June 2019; Iowa State University Digital Press: Albany, NY, USA, 2019; Volume 2. [Google Scholar]
  8. AFGC/SETRA. Ultra High Performance Fibre-Reinforced Concretes; French Civil Engineering Association: Bagneux, France, 2002. [Google Scholar]
  9. JSCE. Recommendations for Design and Construction of Ultra–High Strength Fiber Reinforced Concrete Structures; Japan Society of Civil Engineers: Shinjuku, Tokyo, 2004. [Google Scholar]
  10. KCI. Design Recommendations for Ultra-High Performance Concrete K-UHPC; Korea Concrete Institute: Seoul, Korea, 2012. [Google Scholar]
  11. Yoo, D.-Y.; Yoon, Y.-S. Structural Performance of Ultra-High-Performance Concrete Beams with Different Steel Fibers. Eng. Struct. 2015, 102, 409–423. [Google Scholar] [CrossRef]
  12. Yoo, D.-Y.; Banthia, N.; Yoon, Y.-S. Experimental and Numerical Study on Flexural Behavior of Ultra-High-Performance Fiber-Reinforced Concrete Beams with Low Reinforcement Ratios. Can. J. Civ. Eng. 2016, 44, 18–28. [Google Scholar] [CrossRef]
  13. Yang, I.H.; Joh, C.; Kim, B.-S. Structural Behavior of Ultra High Performance Concrete Beams Subjected to Bending. Eng. Struct. 2010, 32, 3478–3487. [Google Scholar] [CrossRef]
  14. Yang, I.-H.; Joh, C.; Kim, B.-S. Shear Behaviour of Ultra-High-Performance Fibre-Reinforced Concrete Beams without Stirrups. Mag. Concr. Res. 2012, 64, 979–993. [Google Scholar] [CrossRef]
  15. Voo, Y.L.; Poon, W.K.; Foster, S.J. Shear Strength of Steel Fiber-Reinforced Ultrahigh—Performance Concrete Beams without Stirrups. J. Struct. Eng. 2010, 136, 1393–1400. [Google Scholar] [CrossRef]
  16. Baby, F.; Marchand, P.; Toutlemonde, F. Shear Behavior of Ultrahigh Performance Fiber-Reinforced Concrete Beams. I: Experimental Investigation. J. Struct. Eng. 2014, 140, 4013111. [Google Scholar] [CrossRef]
  17. Kodur, V.; Solhmirzaei, R.; Agrawal, A.; Aziz, E.M.; Soroushian, P. Analysis of Flexural and Shear Resistance of Ultra High Performance Fiber Reinforced Concrete Beams without Stirrups. Eng. Struct. 2018, 174, 873–884. [Google Scholar] [CrossRef]
  18. Jankowiak, T.; Lodygowski, T. Identification of Parameters of Concrete Damage Plasticity Constitutive Model. Found. Civ. Environ. Eng. 2005, 6, 53–69. [Google Scholar]
  19. Oller, S.; Oñate, E.; Oliver, J.; Lubliner, J. Finite Element Nonlinear Analysis of Concrete Structures Using a “Plastic-Damage Model”. Eng. Fract. Mech. 1990, 35, 219–231. [Google Scholar] [CrossRef]
  20. Lee, D.H.; Hwang, J.-H.; Ju, H.; Kim, K.S.; Kuchma, D.A. Nonlinear Finite Element Analysis of Steel Fiber-Reinforced Concrete Members Using Direct Tension Force Transfer Model. Finite Elem. Anal. Des. 2012, 50, 266–286. [Google Scholar] [CrossRef]
  21. Özcan, D.M.; Bayraktar, A.; Şahin, A.; Haktanir, T.; Türker, T. Experimental and Finite Element Analysis on the Steel Fiber-Reinforced Concrete (SFRC) Beams Ultimate Behavior. Constr. Build. Mater. 2009, 23, 1064–1077. [Google Scholar] [CrossRef]
  22. Cedolin, L.; Dei Poli, S. Finite Element Studies of Shear-Critical R/C Beams. J. Eng. Mech. Div. 1977, 103, 395–410. [Google Scholar] [CrossRef]
  23. Jiang, J. Nonlinear Finite Element Analysis of Reinforced Concrete Structures. Xi’an Shanxi Sci. Technol. Press 1994, 24, 34. [Google Scholar]
  24. Barbosa, A.; Idelsohn, S.; Oñate, E.; Dvorkin, E. Analysis of Reinforced Concrete Structures Using ANSYS Nonlinear Concrete Model. In Computational Mechanics: New Trends and Applications; Centro Internacional de Métodos Numéricos en Ingeniería: Barcelona, Spain, 1998. [Google Scholar]
  25. Hawileh, R. Finite Element Modeling of Reinforced Concrete Beams with a Hybrid Combination of Steel and Aramid Reinforcement. Mater. Des. 2015, 65, 831–839. [Google Scholar] [CrossRef]
  26. Chi, Y.; Yu, M.; Huang, L.; Xu, L. Finite Element Modeling of Steel-Polypropylene Hybrid Fiber Reinforced Concrete Using Modified Concrete Damaged Plasticity. Eng. Struct. 2017, 148, 23–35. [Google Scholar] [CrossRef]
  27. Hu, H.-T.; Lin, F.-M.; Jan, Y.-Y. Nonlinear Finite Element Analysis of Reinforced Concrete Beams Strengthened by Fiber-Reinforced Plastics. Compos. Struct. 2004, 63, 271–281. [Google Scholar] [CrossRef]
  28. Foster, S.J.; Voo, Y.; Chong, K. FE Analysis of Steel Fiber Reinforced Concrete Beams Failing in Shear: Variable Engagement Model. Spec. Publ. 2006, 237, 55–70. [Google Scholar]
  29. Padmarajaiah, S.; Ramaswamy, A. A Finite Element Assessment of Flexural Strength of Prestressed Concrete Beams with Fiber Reinforcement. Cem. Concr. Compos. 2002, 24, 229–241. [Google Scholar] [CrossRef]
  30. Sinaei, H.; Shariati, M.; Abna, A.H.; Aghaei, M.; Shariati, A. Evaluation of Reinforced Concrete Beam Behaviour Using Finite Element Analysis by ABAQUS. Sci. Res. Essays 2012, 7, 2002–2009. [Google Scholar]
  31. Wang, T.; Hsu, T.T. Nonlinear Finite Element Analysis of Concrete Structures Using New Constitutive Models. Comput. Struct. 2001, 79, 2781–2791. [Google Scholar] [CrossRef]
  32. Seraj, S.; Kotsovos, M.; Pavlović, M. Three-Dimensional Finite-Element Modelling of Normal-and High-Strength Reinforced Concrete Members, with Special Reference to T-Beams. Comput. Struct. 1992, 44, 699–716. [Google Scholar] [CrossRef]
  33. Tysmans, T.; Wozniak, M.; Remy, O.; Vantomme, J. Finite Element Modelling of the Biaxial Behaviour of High-Performance Fibre-Reinforced Cement Composites (HPFRCC) Using Concrete Damaged Plasticity. Finite Elem. Anal. Des. 2015, 100, 47–53. [Google Scholar] [CrossRef]
  34. Singh, M.; Sheikh, A.; Ali, M.M.; Visintin, P.; Griffith, M. Experimental and Numerical Study of the Flexural Behaviour of Ultra-High Performance Fibre Reinforced Concrete Beams. Constr. Build. Mater. 2017, 138, 12–25. [Google Scholar] [CrossRef]
  35. Chen, L.; Graybeal, B.A. Modeling Structural Performance of Second-Generation Ultrahigh-Performance Concrete Pi-Girders. J. Bridge Eng. 2011, 17, 634–643. [Google Scholar] [CrossRef]
  36. Chen, L.; Graybeal, B.A. Modeling Structural Performance of Ultrahigh Performance Concrete I-Girders. J. Bridge Eng. 2011, 17, 754–764. [Google Scholar] [CrossRef]
  37. Bahij, S.; Adekunle, S.K.; Al-Osta, M.; Ahmad, S.; Al-Dulaijan, S.U.; Rahman, M.K. Numerical Investigation of the Shear Behavior of Reinforced Ultra-high-performance Concrete Beams. Struct. Concr. 2018, 19, 305–317. [Google Scholar] [CrossRef] [Green Version]
  38. Solhmirzaei, R.; Kodur, V. Modeling the Response of Ultra High Performance Fiber Reinforced Concrete Beams. Procedia Eng. 2017, 210, 211–219. [Google Scholar] [CrossRef]
  39. ABAQUS. Version 6.18 Documentation; Dassault Systems Simulia Corp: Providence, RI, USA, 2018. [Google Scholar]
  40. Kodur, V.; Agrawal, A. Effect of Temperature Induced Bond Degradation on Fire Response of Reinforced Concrete Beams. Eng. Struct. 2017, 142, 98–109. [Google Scholar] [CrossRef]
  41. Lubliner, J.; Oliver, J.; Oller, S.; Onate, E. A Plastic-Damage Model for Concrete. Int. J. Solids Struct. 1989, 25, 299–326. [Google Scholar] [CrossRef]
  42. Lee, J.; Fenves, G.L. Plastic-Damage Model for Cyclic Loading of Concrete Structures. J. Eng. Mech. 1998, 124, 892–900. [Google Scholar] [CrossRef]
  43. Mahmud, G.H.; Yang, Z.; Hassan, A.M. Experimental and Numerical Studies of Size Effects of Ultra High Performance Steel Fibre Reinforced Concrete (UHPFRC) Beams. Constr. Build. Mater. 2013, 48, 1027–1034. [Google Scholar] [CrossRef]
  44. Luaay Hussein Structural Behavior of Ultra High Performance Fiber Reinforced Concrete Composite Members. Ph.D. Thesis, Ryerson University, Toronto, ON, Canada, 2015.
  45. Speck, K. Concrete under Multiaxial Loading Conditions—A Constitutive Model for Short-Time Loading of High Performance Concretes. Doctoral Dissertation, Technische Universität Dresden, Dresden, Germany, 2007. (In German). [Google Scholar]
  46. Graybeal, B.A. Compressive Behavior of Ultra-High-Performance Fiber-Reinforced Concrete. ACI Mater. J. 2007, 104, 146. [Google Scholar]
  47. Ahmad, S.; Bahij, S.; Al-Osta, M.; Adekunle, S.; Al-Dulaijan, S. Shear Behavior of Ultra-High-Performance Concrete Beams Reinforced with High-Strength Steel Bars. ACI Struct. J. 2019, 116, 3–14. [Google Scholar] [CrossRef]
  48. Wu, Z.; Shi, C.; He, W.; Wu, L. Effects of Steel Fiber Content and Shape on Mechanical Properties of Ultra High Performance Concrete. Constr. Build. Mater. 2016, 103, 8–14. [Google Scholar] [CrossRef]
  49. Yoo, D.-Y.; Kang, S.-T.; Yoon, Y.-S. Effect of Fiber Length and Placement Method on Flexural Behavior, Tension-Softening Curve, and Fiber Distribution Characteristics of UHPFRC. Constr. Build. Mater. 2014, 64, 67–81. [Google Scholar] [CrossRef]
  50. Yoo, D.-Y.; Shin, H.-O.; Yang, J.-M.; Yoon, Y.-S. Material and Bond Properties of Ultra High Performance Fiber Reinforced Concrete with Micro Steel Fibers. Compos. Part. B Eng. 2014, 58, 122–133. [Google Scholar] [CrossRef]
  51. Yoo, D.-Y.; Lee, J.-H.; Yoon, Y.-S. Effect of Fiber Content on Mechanical and Fracture Properties of Ultra High Performance Fiber Reinforced Cementitious Composites. Compos. Struct. 2013, 106, 742–753. [Google Scholar] [CrossRef]
  52. Voit, K.; Kirnbauer, J. Tensile Characteristics and Fracture Energy of Fiber Reinforced and Non-Reinforced Ultra High Performance Concrete (UHPC). Int. J. Fract. 2014, 188, 147–157. [Google Scholar] [CrossRef]
  53. Graybeal, B.A.; Davis, M. Cylinder or Cube: Strength Testing of 80 to 200 MPa (11.6 to 29 Ksi) Ultra-High-Performance Fiber-Reinforced Concrete. ACI Mater. J. 2008, 105, 603–609. [Google Scholar]
  54. Benjamin, A. Graybeal Flexural Behavior of an Ultrahigh-Performance Concrete I-Girder. J. Bridge Eng. 2008, 13, 602–610. [Google Scholar]
  55. Van Gysel, A.; Taerwe, L. Analytical Formulation of the Complete Stress-Strain Curve for High Strength Concrete. Mater. Struct. 1996, 29, 529–533. [Google Scholar] [CrossRef]
  56. Fehling, E.; Leutbecher, T.; Bunje, K. Design Relevant Properties of Hardened Ultra High Performance Concrete. In Proceedings of the International Symposium on Ultra High Performance Concrete, Kassel, Germany, 13–15 September 2004; Volume 1, pp. 327–338. [Google Scholar]
  57. Wille, K.; El-Tawil, S.; Naaman, A. Properties of Strain Hardening Ultra High Performance Fiber Reinforced Concrete (UHP-FRC) under Direct Tensile Loading. Cem. Concr. Compos. 2014, 48, 53–66. [Google Scholar] [CrossRef]
  58. Wille, K.; Kim, D.J.; Naaman, A.E. Strain-Hardening UHP-FRC with Low Fiber Contents. Mater. Struct. 2011, 44, 583–598. [Google Scholar] [CrossRef]
  59. Priestley, M.N.; Seible, F.; Calvi, G.M.; Calvi, G.M. Seismic Design and Retrofit of Bridges; John Wiley & Sons: Hoboken, NJ, USA, 1996; ISBN 0-471-57998-X. [Google Scholar]
  60. Cosenza, E.; Manfredi, G.; Realfonzo, R. Analytical Modelling of Bond between FRP Reinforcing Bars and Concrete. In Non-Metallic (FRP) Reinforcement for Concrete StructuresÐProceedings of the Second International RILEM Symposium (FRPRCS-2); Taerwe, L., Ed.; E & FN Spon: London, UK, 1995; Volume 29, pp. 164–171. [Google Scholar]
  61. Crisfield, M. Accelerated Solution Techniques and Concrete Cracking. Comput. Methods Appl. Mech. Eng. 1982, 33, 585–607. [Google Scholar] [CrossRef]
  62. Keuser, M.; Mehlhorn, G. Finite Element Models for Bond Problems. J. Struct. Eng. 1987, 113, 2160–2173. [Google Scholar] [CrossRef]
  63. Solhmirzaei, R. Response of Ultra High Performance Fiber Reinforced Concrete Beams under Flexure and Shear; Michigan State University: East lansing, MI, USA, 2021; ISBN 9798569903368. [Google Scholar]
  64. Solhmirzaei, R.; Kodur, V.K. Structural Behavior of Ultra High Performance Concrete Beams without Stirrups. In Proceedings of the Transportation Research Board 97th Annual Meeting, Washington, DC, USA, 7–11 January 2018. [Google Scholar]
  65. Dinh, H.H.; Parra-Montesinos, G.J.; Wight, J.K. Shear Strength Model for Steel Fiber Reinforced Concrete Beams without Stirrup Reinforcement. J. Struct. Eng. 2010, 137, 1039–1051. [Google Scholar] [CrossRef]
Figure 1. Discretization of a beam in ABAQUS for finite element analysis, (a) typical beam, (b) discretization of a beam.
Modelling 02 00024 g001
Figure 2. (a) Approximation for compressive stress–strain behavior of UHPC and UHPFRC. (b) Comparison of the proposed equation for elastic modulus with test results.
Modelling 02 00024 g002
Figure 3. Comparison of the proposed compressive stress–strain approximation with test results. (a) Singh et al. experiments (data from [34]), (b) this study.
Modelling 02 00024 g003
Figure 4. Tensile stress–strain response of UHPFRC, (a) typical σ-ε response, (b) σ-ε response from test data.
Modelling 02 00024 g004
Figure 5. Test set-up, and cross sectional details of tested UHPFRC beams (data from [17]).
Modelling 02 00024 g005
Figure 6. Comparison of load deflection behavior of UHPFRC beams under different loading conditions and with different fiber volume fractions. (a) U-B4 under shear dominant loading. (b) U-B5 under flexural loading. (c) UHPC beam ( ρ = 0.94%-NF) data from [11]. (d) UHPFRC beam (B25) data from [34].
Modelling 02 00024 g006
Figure 7. Level of bond stress developed in beams U-B5 and U-B6 along the beam length.
Modelling 02 00024 g007
Figure 8. Comparison of load-strain response in bars and concrete at critical section of beams, as obtained from FEA and tests.
Modelling 02 00024 g008
Figure 9. Comparison of tensile damage contours and principal strain direction as predicted by FEA with test data.
Modelling 02 00024 g009
Figure 10. Load deflection response of NSC and UHPFRC beams (with cross section similar to U-B4 and U-B6) with reinforcement ratios of 0.90% and 1.20% with and without stirrups.
Modelling 02 00024 g010
Figure 11. Stress distribution in longitudinal reinforcing bars in NSC and UHPFRC beams (with cross section similar to U-B4-   ρ t = 0.90%) along the beam length.
Modelling 02 00024 g011
Figure 12. Concrete and stirrups contribution to shear capacity of NSC and UHPFRC beams with different reinforcement ratios ( ρ t = 0.90% and ρ t = 1.20%).
Modelling 02 00024 g012
Figure 13. Schematic of assumed strain distribution and internal stresses in shear span of a beam (adapted from [65]).
Modelling 02 00024 g013
Table 1. Details of the beams used for validation and comparison of load carrying capacity of UHPC beams as predicted by FEA with test data.
Beams V f ( % ) Width (mm)Depth (mm)Span (mm) ρ t ( % ) ρ c ( % ) ρ v ( % ) Loading ConditionPeak Load (kN)Ratio (1)/(2)
FEA (1)Test (2)
U-B3 1.518027036580.90004-point 94.997.10.98
U-B4 1.518027036580.90003-point 140.1142.10.99
U-B5 1.518027036581.20004-point 121.6126.60.96
U-B6 1.518027036581.20003-point 163.5177.10.92
B15-1 2.2515015013502.312.310.423-point 95.9106.40.90
B25 2.2525025032501.800.300.704-point 163.3171.70.95
R13 218027027000.90004-point 190.4188.91.01
R14 218027027001.20004-point 210.5205.21.03
ρ 0.94%-S13 215022022000.940.591.314-point 82.586.50.95
ρ 0.94%-NF 015022022001.500.591.314-point 64.062.61.02
ρ t ,   ρ c , and ρ v   are longitudinal tensile, longitudinal compressive, and shear reinforcement ratios. (1) and (2) are peak loads obtained from FEA and tests, respectively.
Table 2. Contribution of compression block and interface resistance to shear strength.
Beam First CrackingPeak StateUltimate State (before
Failure)
V (kN)Vcc/VVi/VV (kN)Vcc/VVi/VV (kN)Vcc/VVi/V
U-B4 ( ρ t = 0.90%)35.20.670.33116.70.650.35105.70.540.46
U-B6 ( ρ t = 1.20%)36.60.650.35163.50.540.46155.00.320.68
NSC ( ρ t = 0.90%) 17.10.670.3347.30.610.3930.90.550.45
NSC ( ρ t = 1.20%) 17.30.690.3147.80.740.2633.30.640.36
Publisher’s Note: MDPI stays neutral with regard to jurisdictional claims in published maps and institutional affiliations.

