Article

Delamination Behavior of Highly Stretchable Soft Islands Multi-Layer Materials

1
Chair of Solid Mechanics, University of Wuppertal, Gaußstr. 20, 42119 Wuppertal, Germany
2
Wuppertal Center for Smart Materials & Systems, University of Wuppertal, Rainer-Gruenter-Str. 21, 42119 Wuppertal, Germany
3
Chair of Large Area Optoelectronics, University of Wuppertal, Rainer-Gruenter-Str. 21, 42119 Wuppertal, Germany
*
Author to whom correspondence should be addressed.
Appl. Mech. 2023, 4(2), 514-527; https://doi.org/10.3390/applmech4020029
Submission received: 27 March 2023 / Revised: 18 April 2023 / Accepted: 23 April 2023 / Published: 26 April 2023
(This article belongs to the Special Issue Feature Papers in Material Mechanics)

Abstract

:
Stretchable electronics rely on sophisticated structural designs to allow brittle metallic conductors to adapt to curved or moving substrates. Patterns of soft islands and stable cracks in layered silver-PDMS composites provide exceptional stretchability by means of strain localization as the cracks open and the islands strain. To investigate the reliability and potential failure modes, we study the initiation and propagation of delamination in dependence of structure geometry and quality of the metal-polymer bonding. Our numerical experiments show a well-bonded metal film to be under no risk of delamination. Even weakly bonded metal films sustain moderate strains well above the limits of classical electronic materials before the onset of delamination in the soft islands structures. If delamination occurs, it does so in predictable patterns that retain functionality over a remarkable strain range in the double-digit percent range before failure, thus, providing safety margins in applications.

1. Introduction

Stretchable electronics that flex and move with the human body are key components in, e.g., biomedical applications [1,2], robotics [3,4] or human-machine-interfaces [5]. Due to the incompatible mechanical properties of rigid electronic components and biological materials or elastomeric substrates, these systems face unique challenges with respect to durability and multiaxial deformability [6,7]. In contrast to conventional rigid electronics, stretchable electronics must possess extreme stretchability in the double-digit percent range to allow biointegrated devices to adapt to curved and dynamic environments without fracture or loss of functionality.
In composites of flexible, biocompatible polymers and brittle conducting materials, stretchability is achieved by structural design, utilizing, for instance, Archimedean interconnects [8], wavy surface designs [9], ultra-flexible silver nanowires [10] or self-folding origami structures [11]. These structures sustain repeated controlled loading cycles by utilizing the metal’s flexibility over its stretchability.
One promising alternative approach to extreme stretchability is shielding the brittle conductors and devices completely from strains. By introducing controlled cracks in the UV-hardened surface layer of a polydimethylsiloxane (PDMS) substrate using a micropattern of soft island crack starters and stoppers, structures with outstanding strain relief capabilities are created [12]. Large applied strains are accommodated by the cracks and soft islands, leaving the large areas in between almost strain-free and usable to support microelectronic devices or be coated with a conducting material [13]. This design can prevent statistical cracking of a conductive silver thin film deposited on the hardened PDMS layer for macroscopic strains of up to 35% [12], whereas free-standing metallic thin films typically cannot withstand strains above 1% [14]. The extreme stretchability of soft islands structures with metal coatings can be attributed to the combination of strain-relieving structural features and good bonding between metal and polymer. If both layers are well-bonded, the extensibility of a metallic thin film drastically increases because the flexible polymer substrate inhibits strain localization within the metal [15].
In soft islands structures, stable cracks and embedded soft islands ensure low strains in the areas between, but they also result in inhomogeneities and areas with a large elastic mismatch in the structure. These points are likely to initiate delamination of the metal film, which has an inverse effect: the metal loses the polymer support and will become prone to rupture and catastrophic failure.
Failure by delamination is a common problem in stretchable electronics: the edges of islands or attached connectors and devices become the sources of stress and strain localization from which delamination in the multi-layer structures is initiated [16,17,18]. Even initially well-bonded structures may delaminate over time and repeated mechanical, electrical, or thermal loading, especially with large property mismatches between the layers.
Preventing catastrophic failure and increasing the lifespan of the structure is a major task in the development of any stretchable design. Modeling delamination in multi-layer systems, thus, is an invaluable tool aiding in predicting failure mechanisms and designing mitigation strategies [19,20]. The main focus of this work is to investigate the susceptibility of stretchable multi-layer composites based on soft islands-stable crack patterning [12,13] to delamination depending on its pattern design and interface properties. Using cohesive zone modeling and finite element analysis, we predict the onset and propagation of delamination as well as its influence on the extreme stretchability of the structures.

2. 3D Computational Model of Soft Islands Structures

A 3D numerical model accounting for controlled cracking based on [13] and delamination between the silver thin film and the hardened PDMS layer is generated to investigate the damage behavior of the multilayer composite. Nonlinear large strain simulations are run using the Abaqus/Standard FE package for implicit analysis.

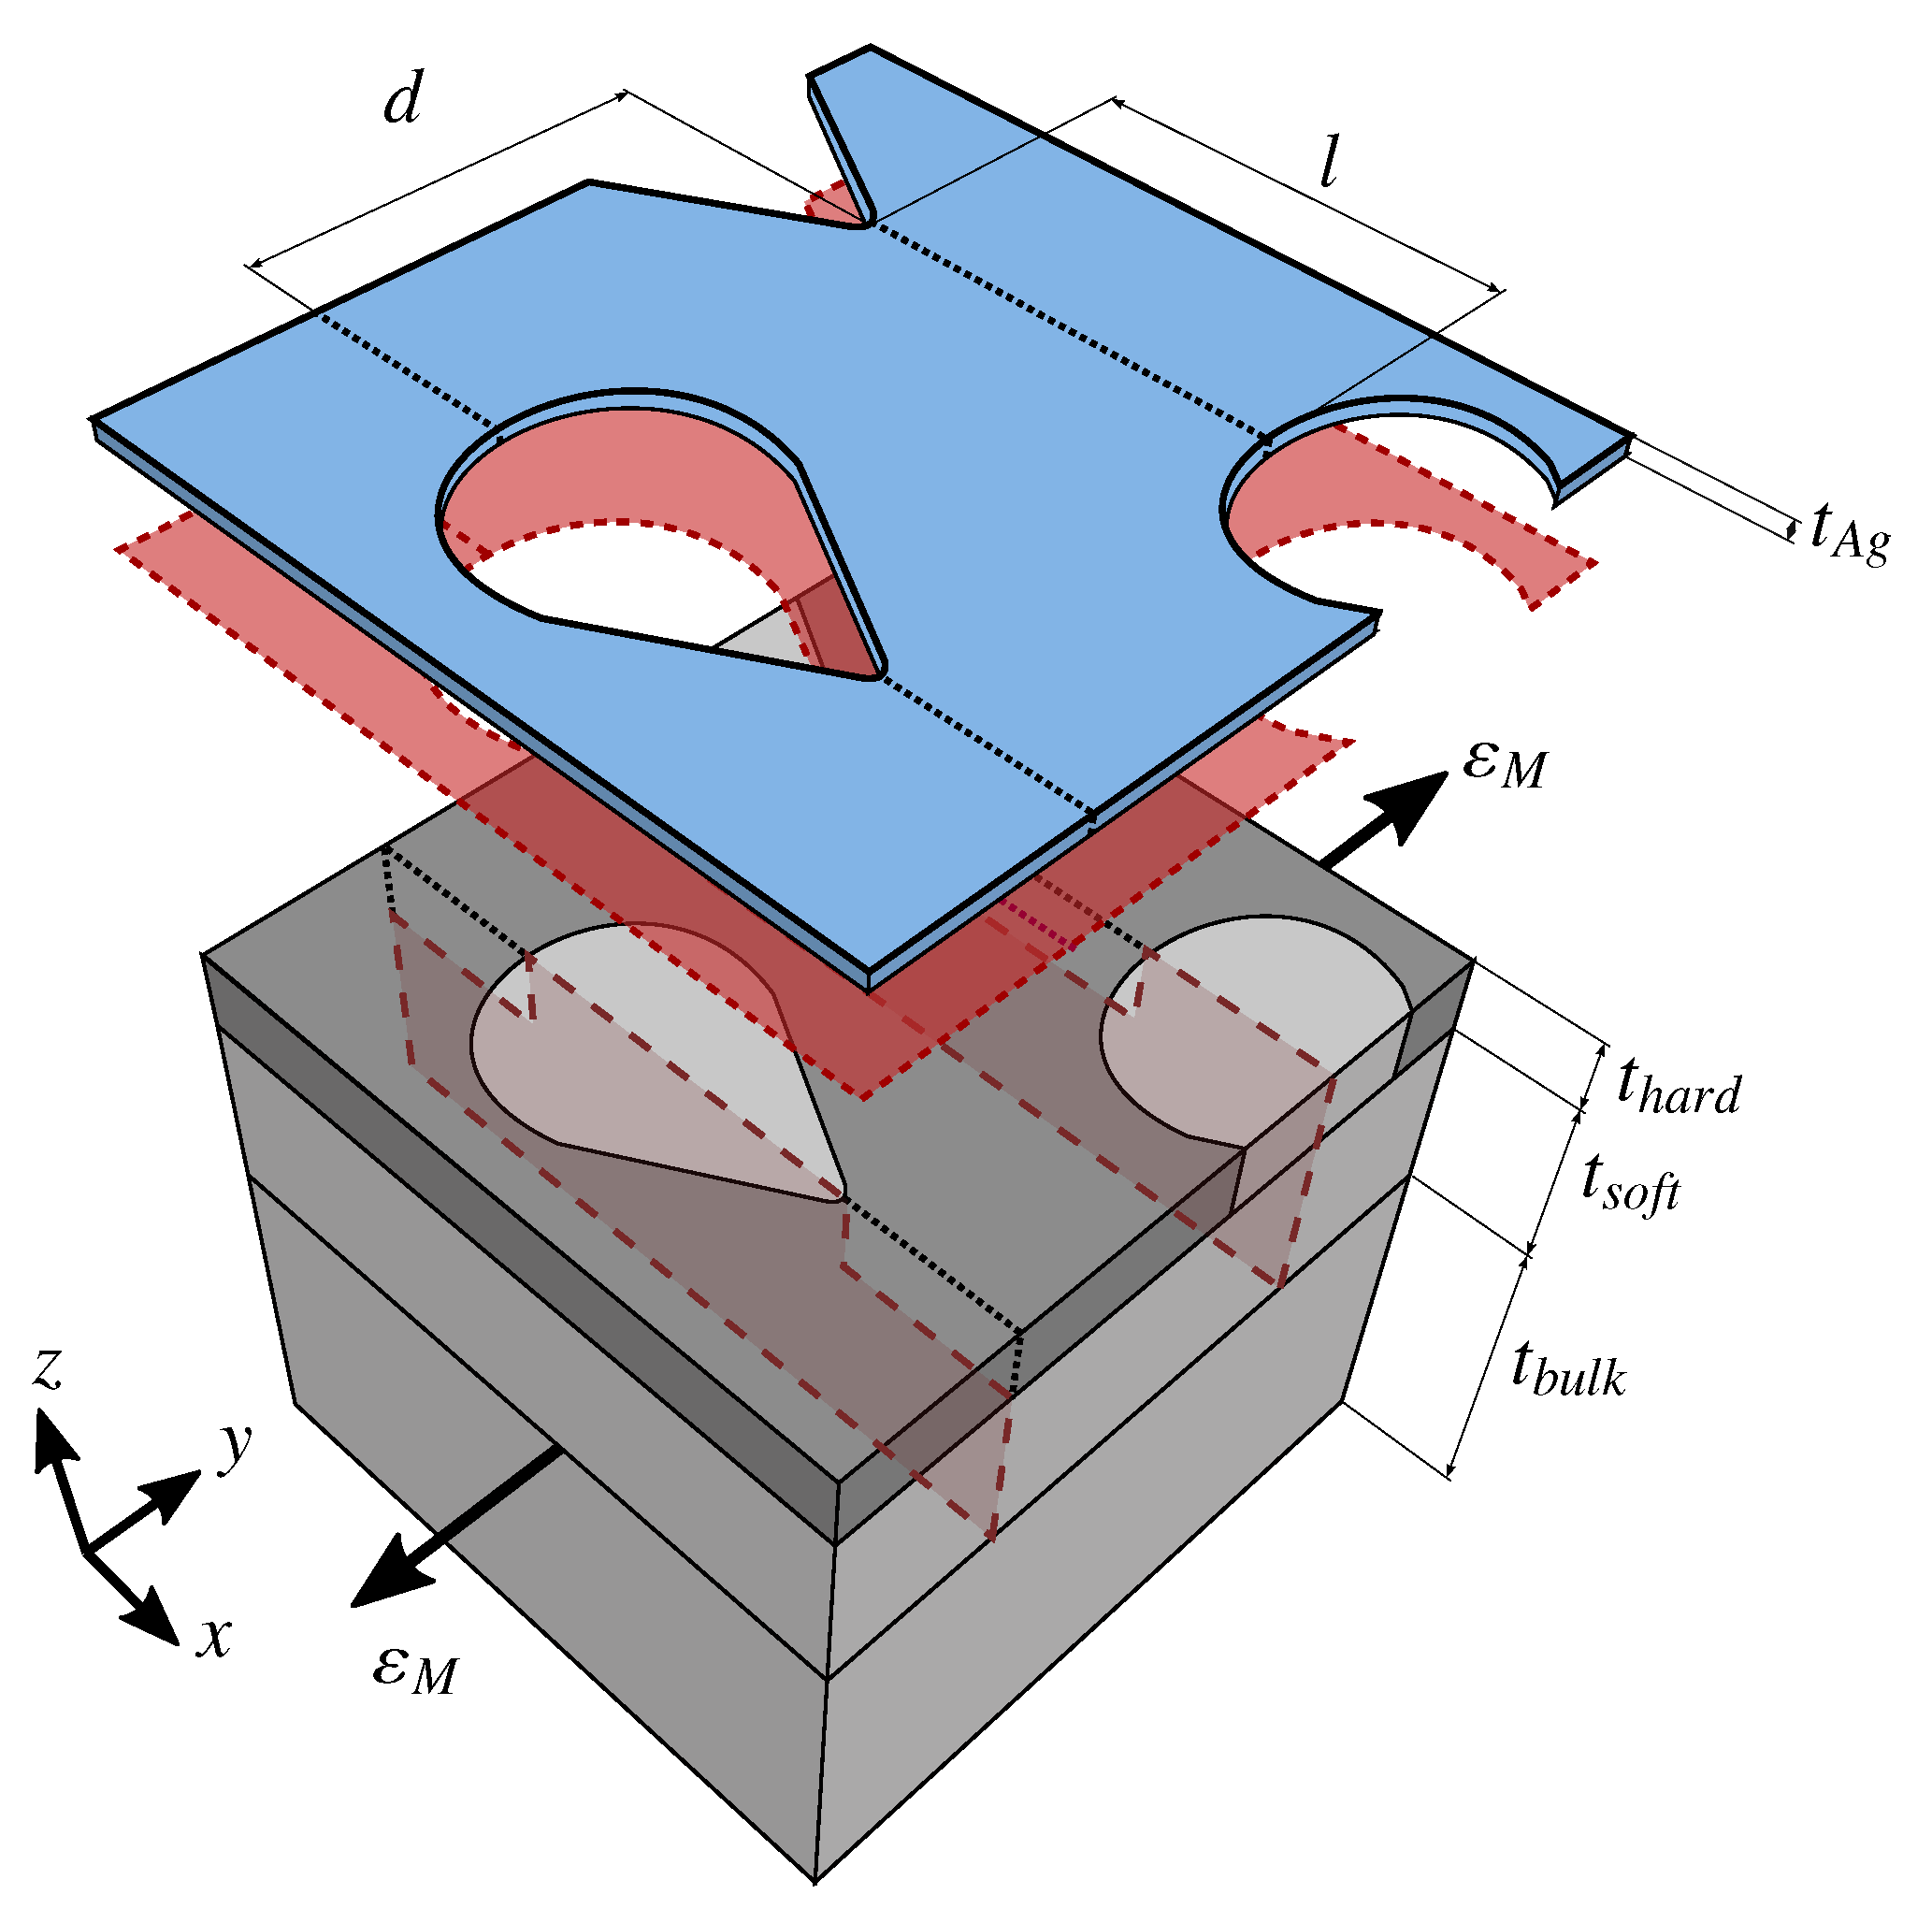
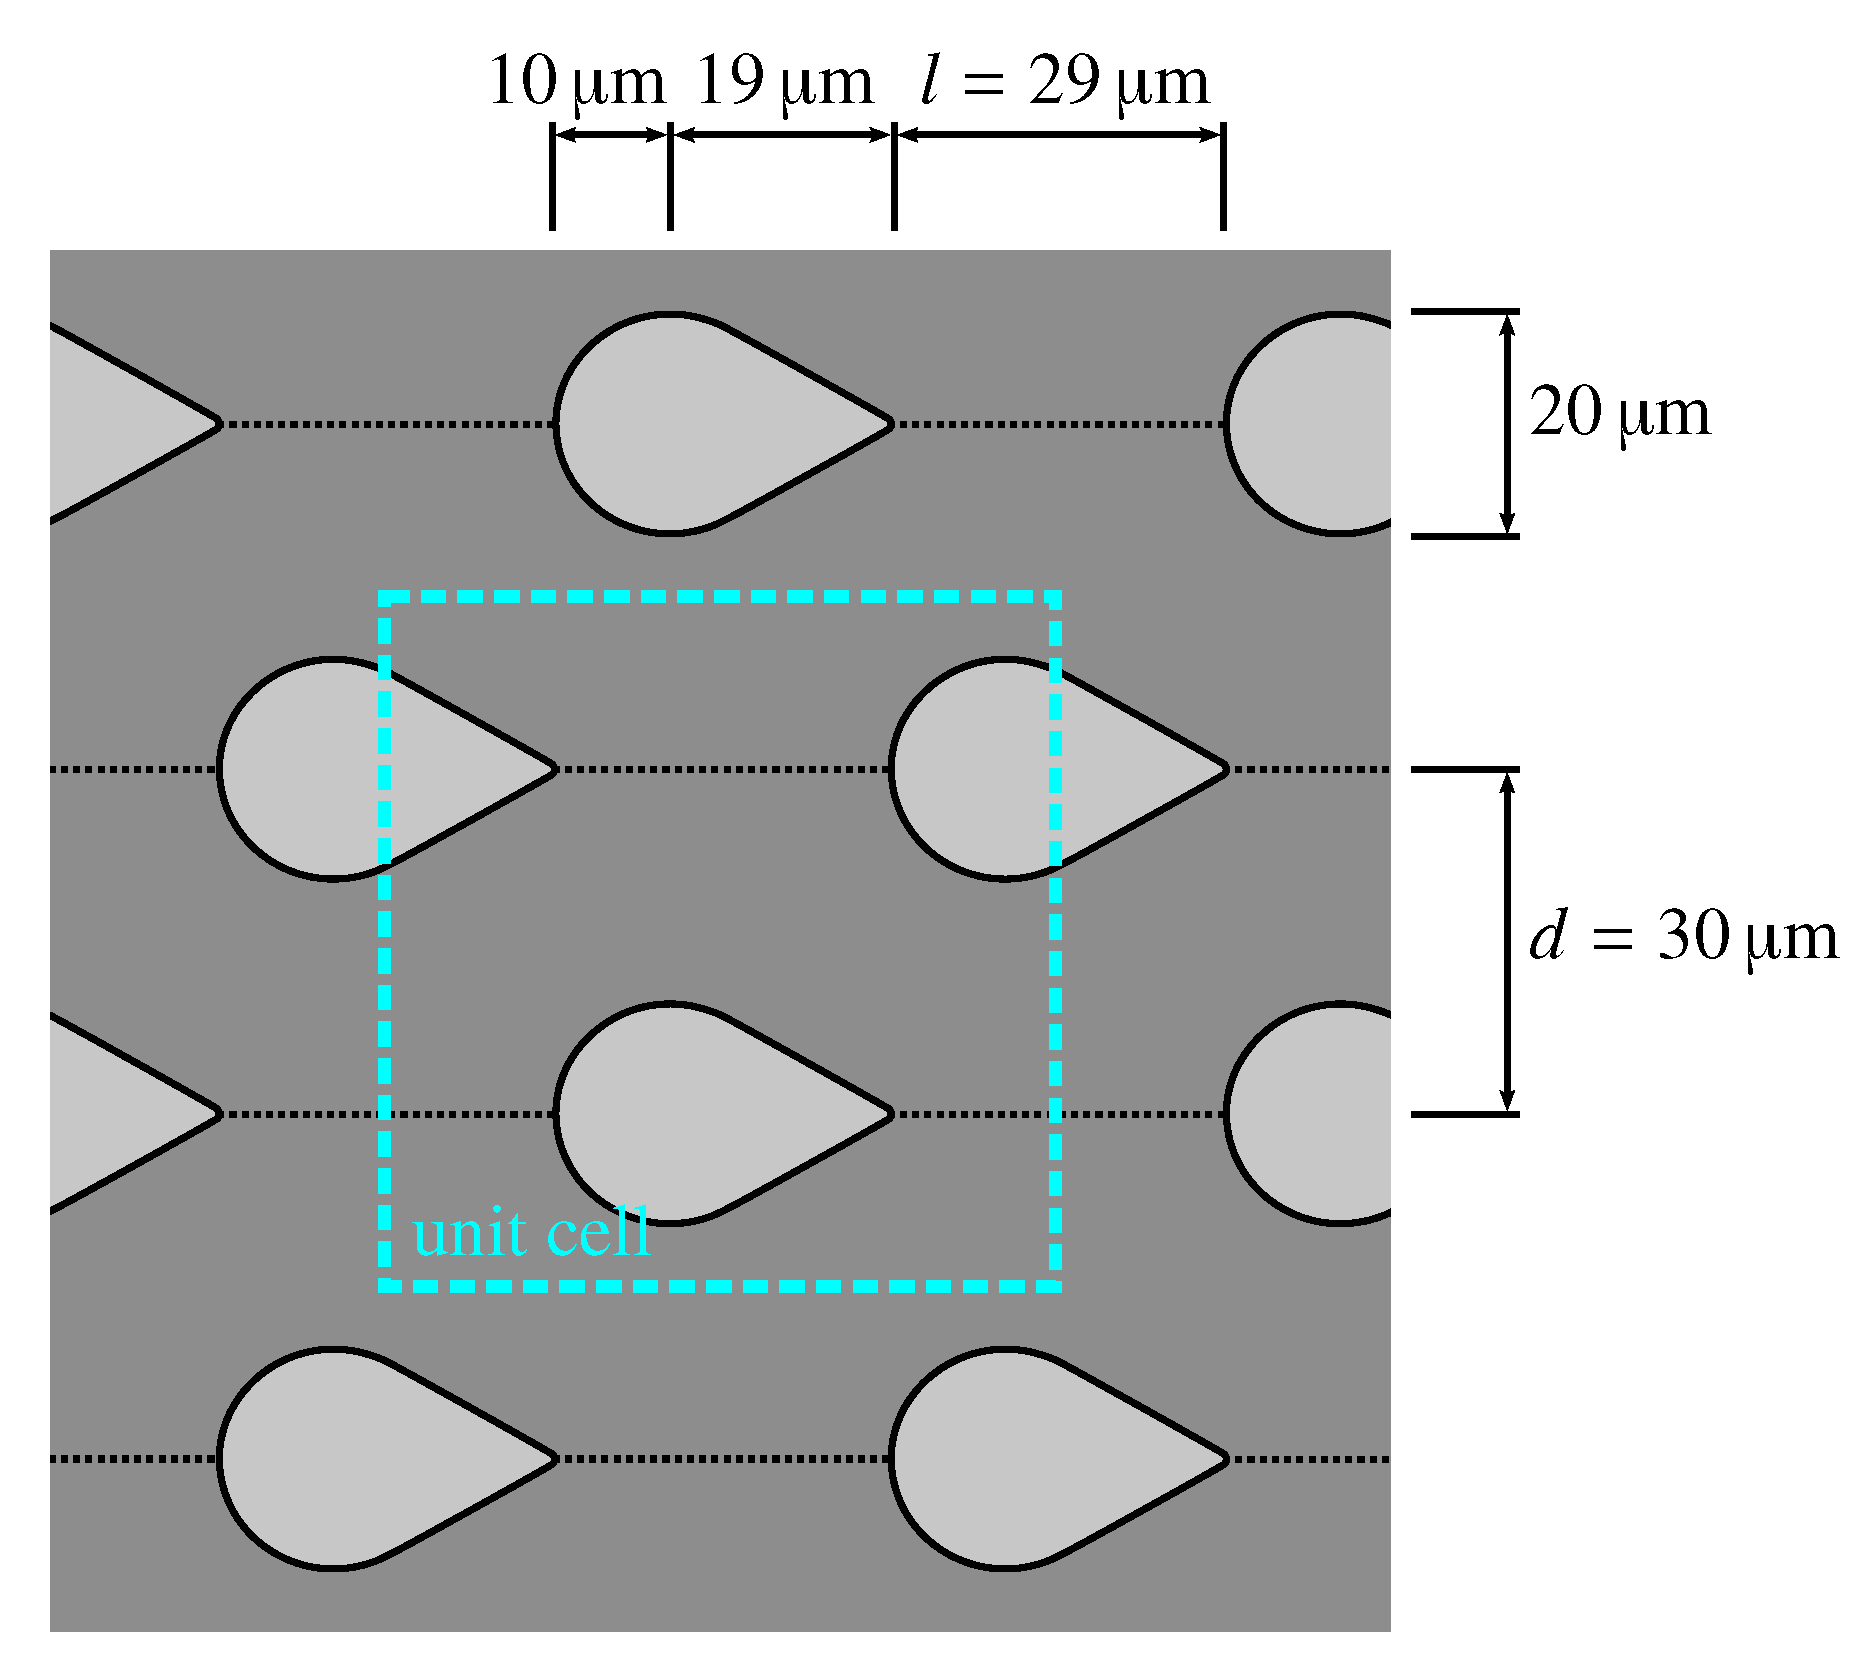
2.1. Representative Volume Element of Soft Island Composite

The periodicity of the soft islands pattern (compare Figure A1) allows us to consider a unit cell representative volume element (RVE) [21] as depicted in Figure 1 to simulate a continuous structure. The soft islands structure is composed of a soft PDMS substrate, a hardened PDMS layer with embedded soft islands, and a thin silver film. In the RVE, the soft PDMS substrate is divided into two domains with the same properties for computational purposes: The lower domain ( t b u l k = 8   μ m ) represents the supporting bulk polymer that is not affected by softening or damage effects closer to the structured interface. In the soft PDMS domain ( t soft = 10   μ m ) above it, softening and potential cracking may occur under loading. Above the soft material is a layer of UV-hardened PDMS ( t h a r d = 0.95   μ m ) in which soft islands in a teardrop shape (29 μ m by 20 μ m ) and stable cracks are embedded. The stable cracks continue through the thin silver film ( t A g = 0.1   μ m ), which covers the hardened surface and has openings above the soft islands. The distance between the soft islands determines the crack length l in x-direction and crack separation d in y-direction. Both can be varied in the composite to tailor the strain behavior [13].
The soft and hardened PDMS layers are modeled as isotropic incompressible Neo–Hookean solids with Poisson’s ratios of 0.48. The Young’s modulus of the soft PDMS is 2 M Pa [22]. The Young’s modulus of hardened PDMS depends on the hardening procedure. We use E hard = 200   MPa which falls into the middle of the moduli range (50 to 220 times larger than the soft material) identified in [23] to be susceptible to the desired cracking. The silver is modeled as a linear elastic solid with a Young’s modulus of 63 G Pa and Poisson’s ratio of 0.37 [14].
The structure is subjected to a macroscopic strain of ε M = 40 % along the y-direction. We apply periodic boundary conditions in x- and y-directions to simulate a continuous structure utilizing equation constraints in Abaqus. The upper surface is traction-free, and the lower x y -plane is fixed in z-direction.

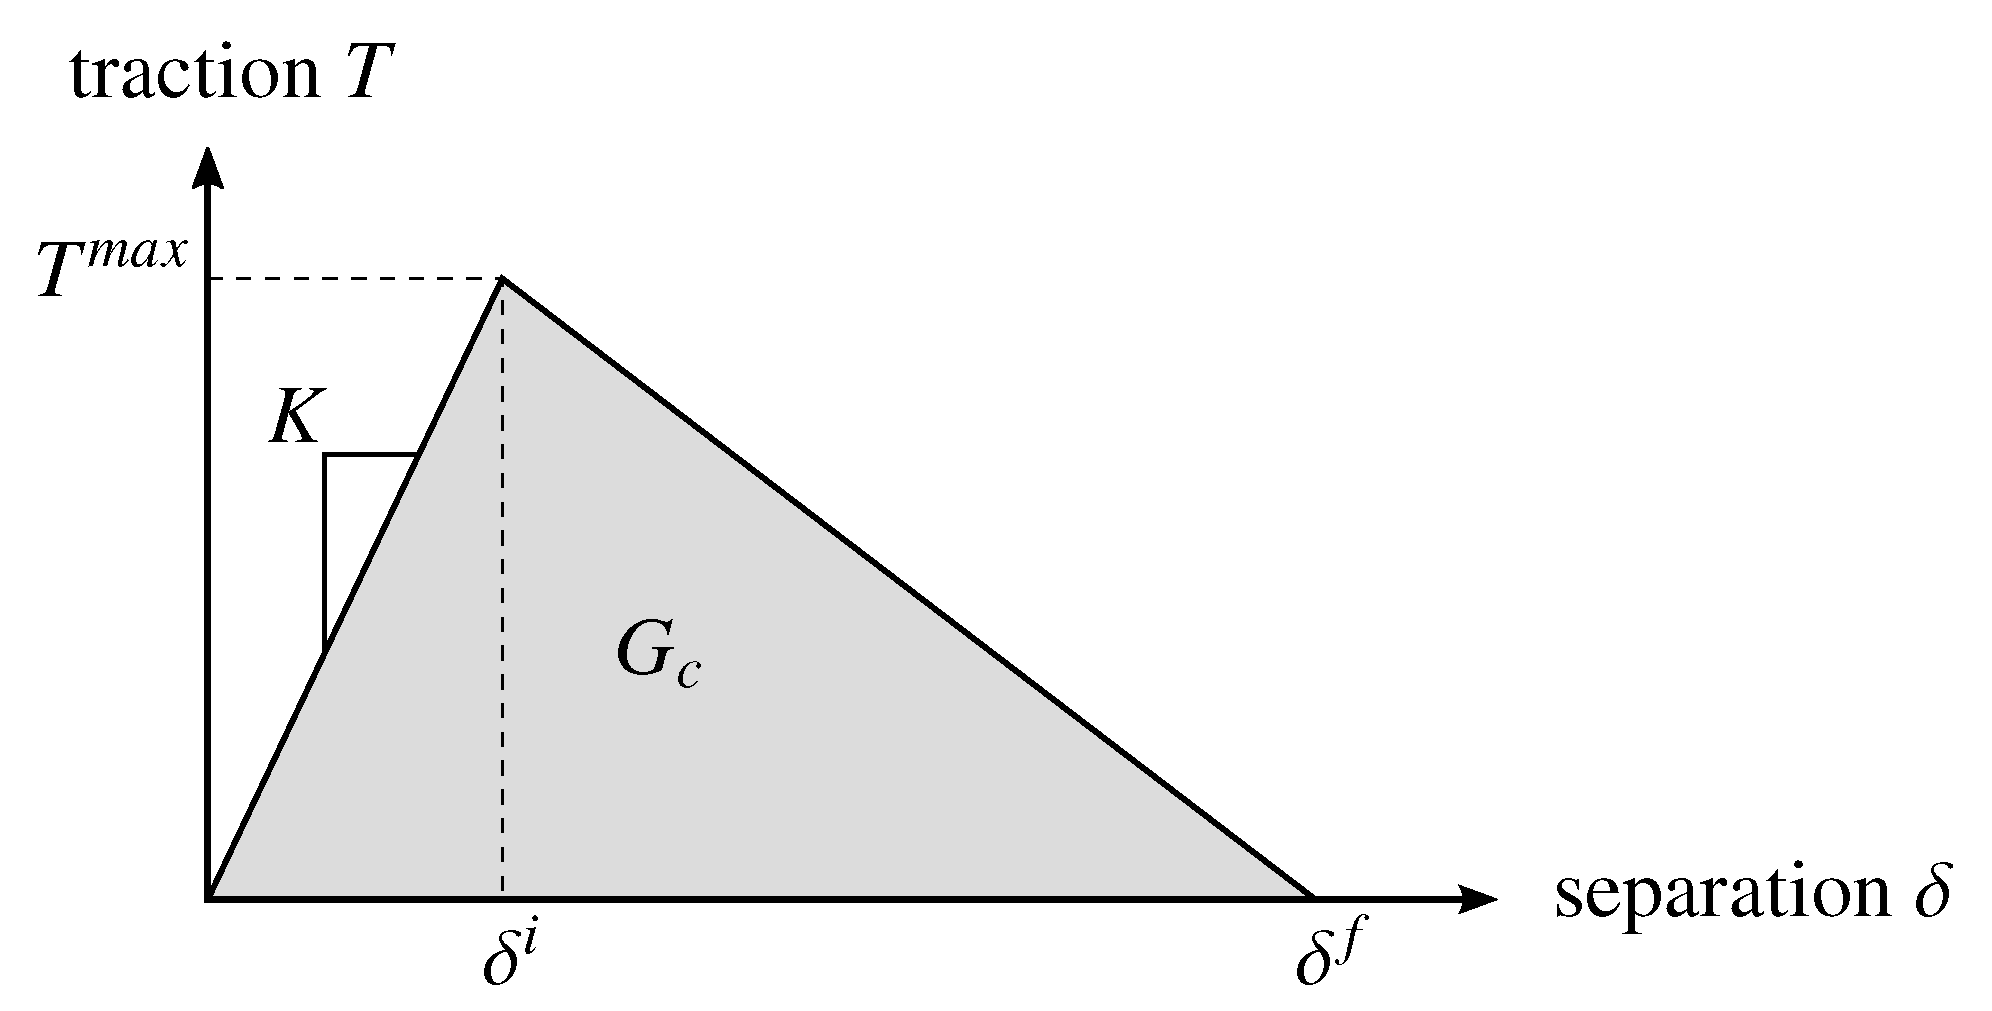
2.2. Cracking and Delamination

The stretchability of soft islands composites is based on the formation of a crack pattern in the hardened PDMS layer. Cracks originate from the tips of islands and are arrested in the next soft islands, resulting in a stable crack pattern. The majority of applied strains are accommodated by fopening of the cracks and stretching of the soft islands, so the rest of the hardened surface is shielded from straining and further uncontrolled cracking [12,13]. However, cracks in multi-layer composites may, as all discontinuities or imperfections, be the starting point for damage to the layers or delamination between layers [24,25]. In the considered setup, two types of damage are possible: (a) pre-formed cracks in the hardened surface destabilize and propagate further into the soft islands or the soft PDMS below, or (b) the conducting silver layer delaminates from the hardened PDMS. As the PDMS is hardened with UV-radiation, a gradual transition between the hardened and soft layers is achieved, and no debonding between the polymer layers occurs [9]. Both possible types of damage constitute a catastrophic failure of the structure.
To investigate conditions resulting in failure, we model crack propagation and delamination using cohesive zone modeling (CZM). This captures both damage initiation and evolving separation of the material. A detailed description of the employed cohesive zone model is given in Appendix A.
Destabilization of the pre-formed cracks and crack propagation are captured by cohesive zones embedded in the soft PDMS domain and soft islands in continuation of the established cracks (Figure 1). The cohesive behavior in the soft PDMS is modeled as in [13], with G c , soft = 34   J   m 2 [26] and T soft m a x = 1   MPa .
Between the thin silver film and the hardened PDMS, a cohesive zone is introduced to model delamination of the metal layer. In the cohesive zone model, all interface properties, such as the constituting materials, roughness, or quality of the bonding, are summed up in the separation law. The maximum interface traction T i m a x as the criterion for damage initiation represents the interface strength or, more precisely, the cohesive strength, while G c , i is related to the interface toughness, i.e., its resistance against the accumulation of damage and delamination. These properties can vary considerably with material composition, preparation, and employed production processes [27,28,29]. The delamination behavior of hardened PDMS and a metallic film has not been investigated so far. For soft PDMS, metal thin film delamination has been modeled with interface strengths ranging from 0.1   M Pa to 1.0   M Pa [27,29] while for other polymers such as epoxy or polyimide, interface strengths of a few megapascals [16,30] or even up to 36.8   M Pa [31] are considered. As the hardened PDMS layer is 100 times stiffer than the soft PDMS, a higher interface strength, i.e., a larger maximum traction, than in a soft PDMS-metal interface is expected, and we study a range of values from 0.5   M Pa to 3 M Pa to cover weak and strong interfaces.
The interface toughness of metals bonded with soft elastomers is often remarkably large due to surface roughness and patterning resulting in interlocking [27,30] or the occurrence of fibrillation [16], in which thin polymer fibrils develop and bridge the separation, maintaining load transfer over large strains. For the hardened and embrittled PDMS, fibrillation is unlikely to occur. Thus, brittle delamination with exceedingly low energy release rates is anticipated and studied here.

3. Results

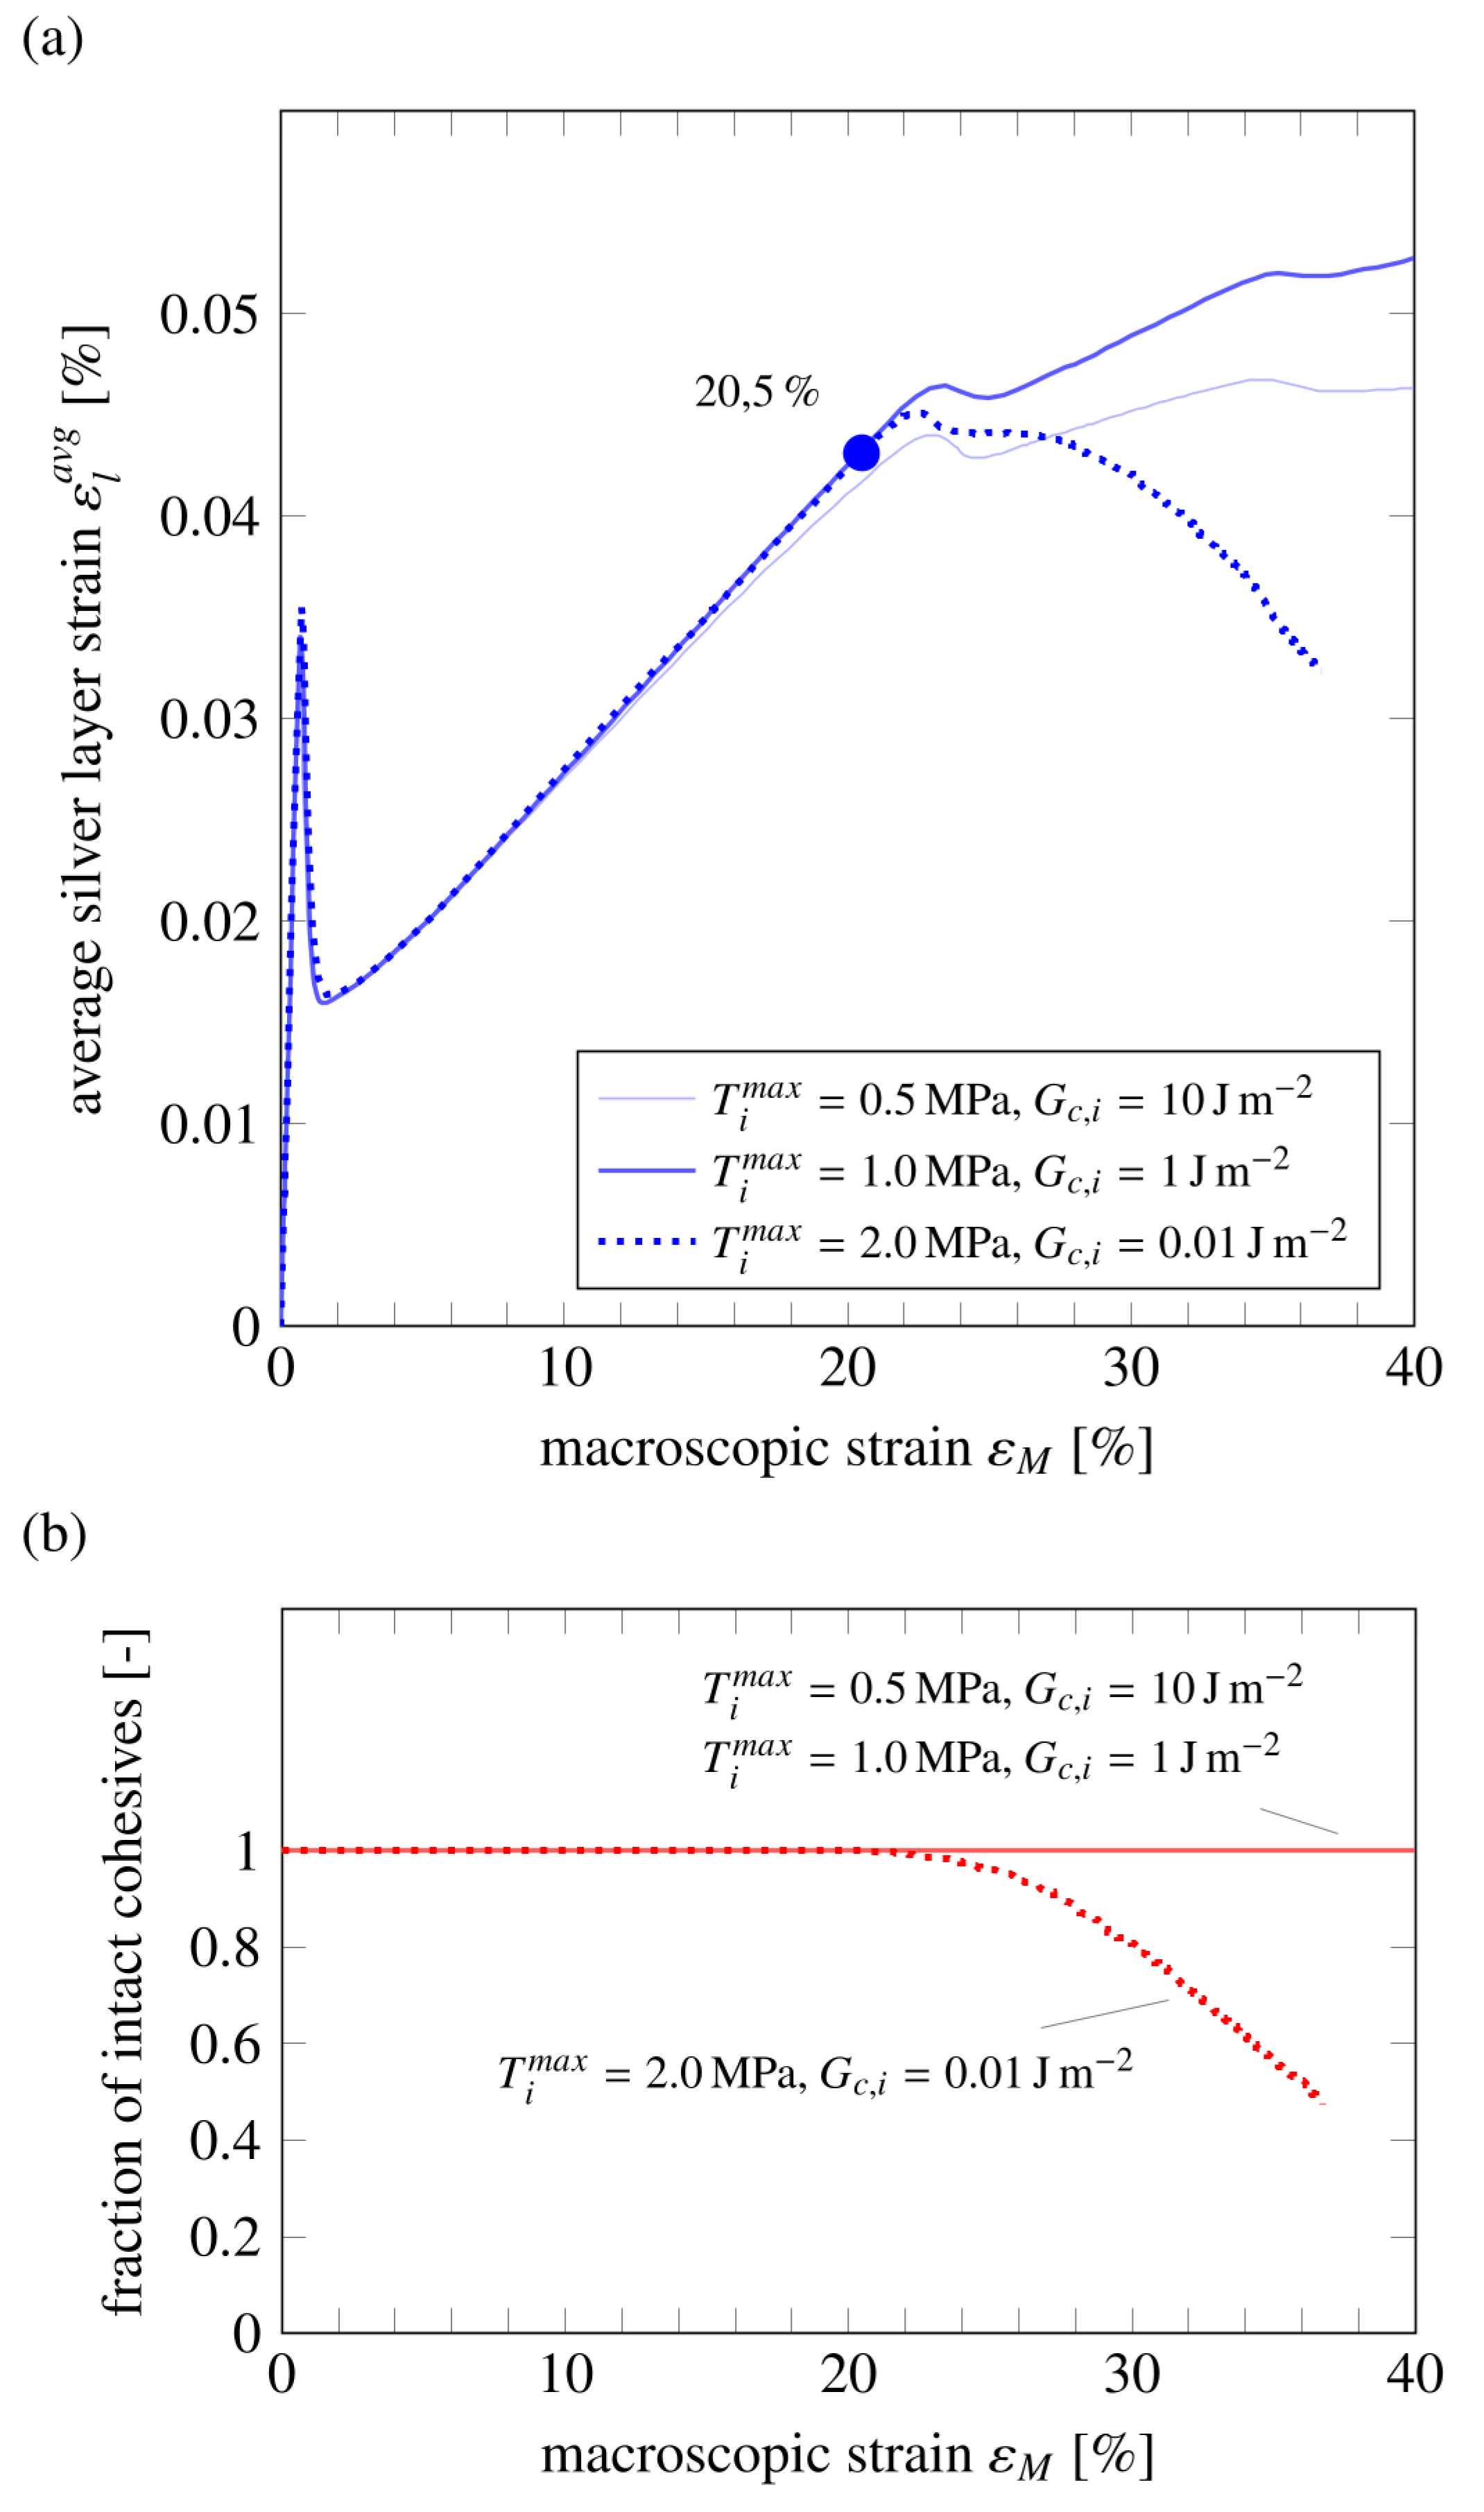
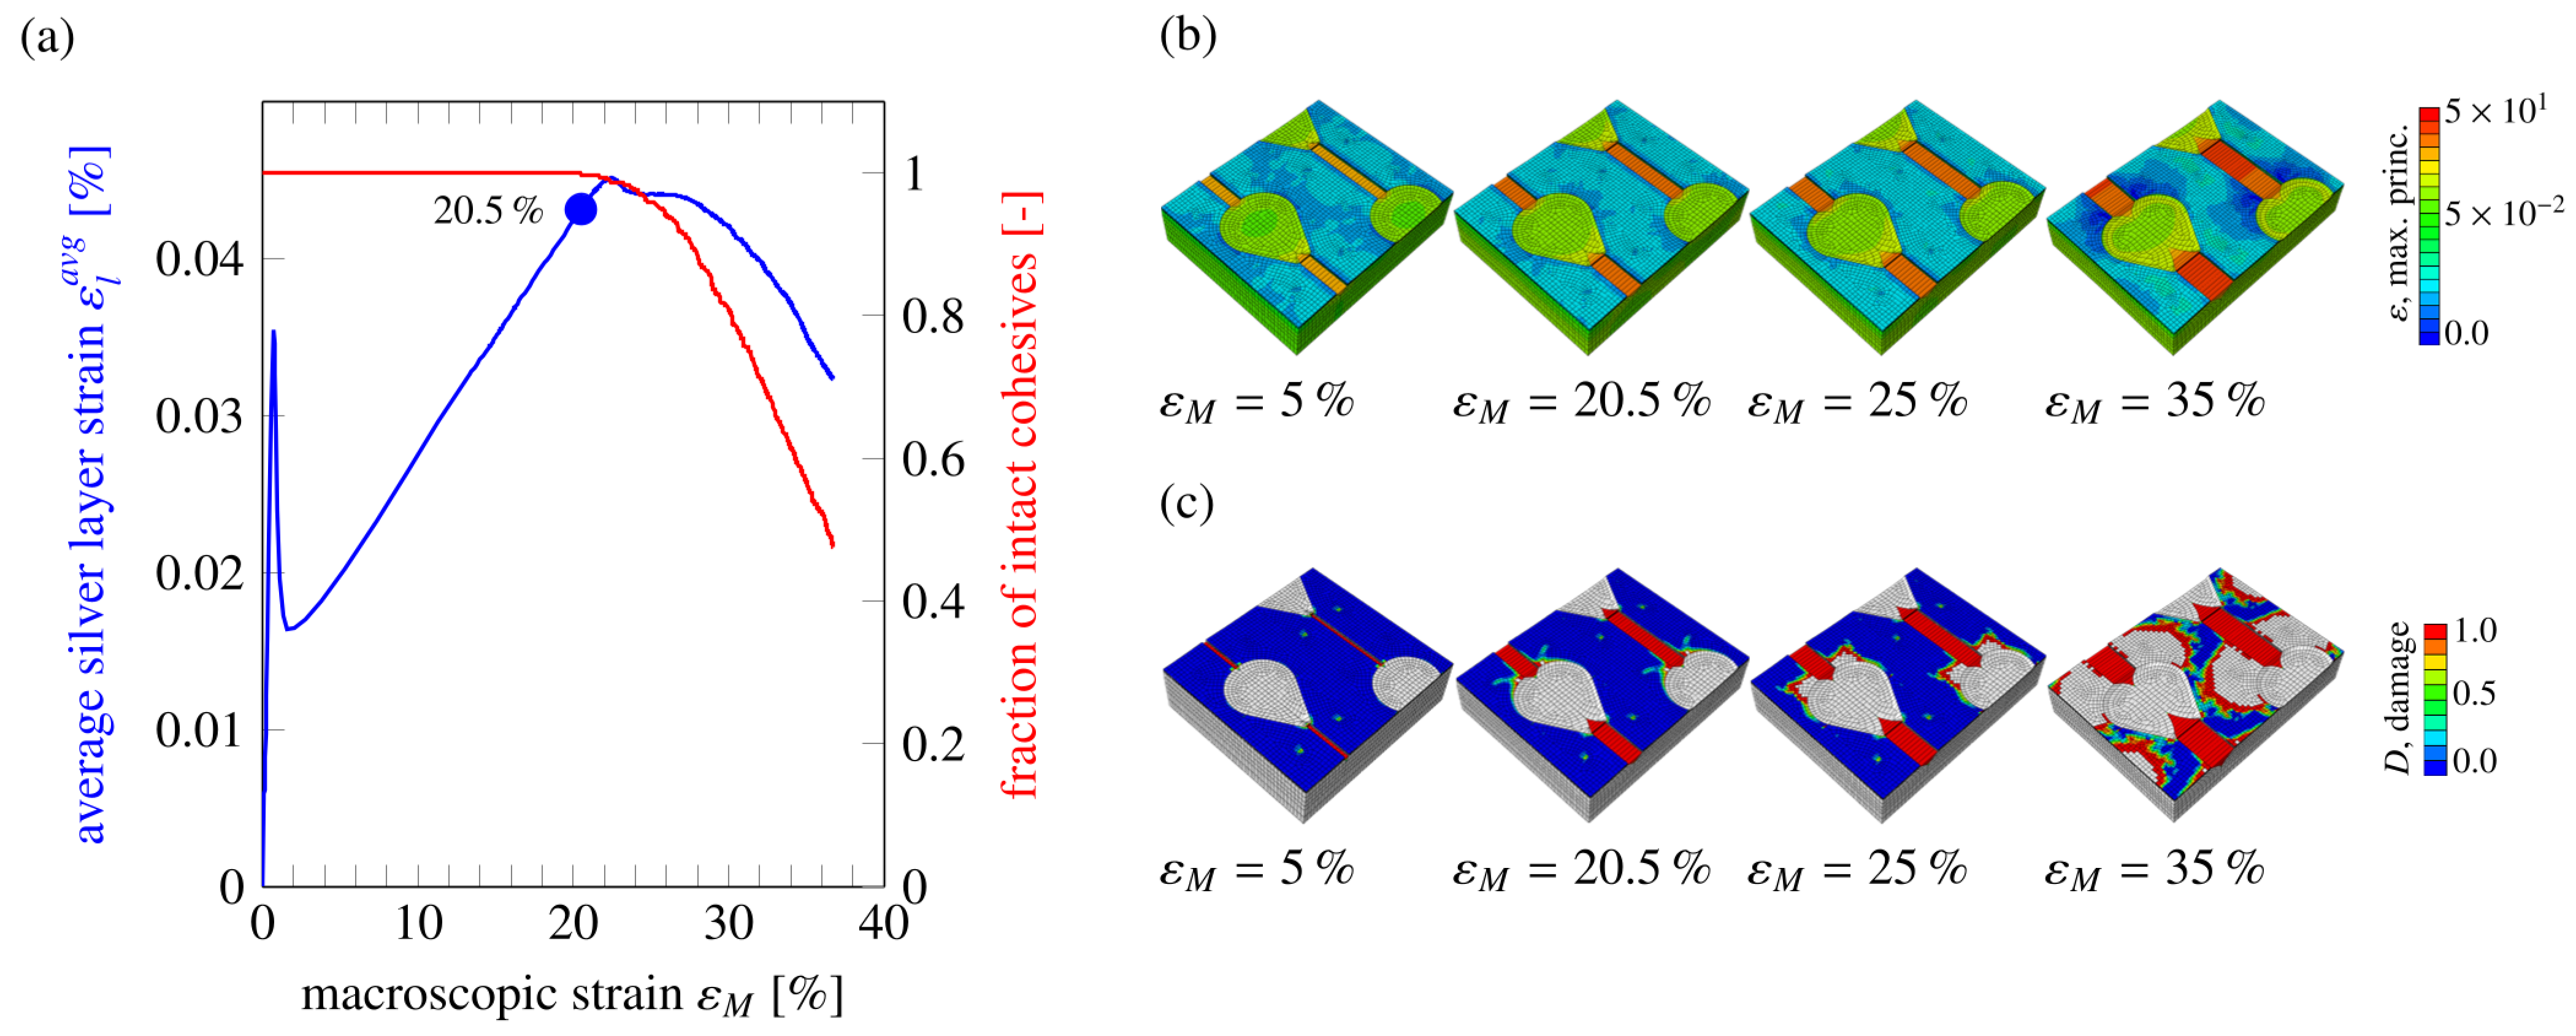
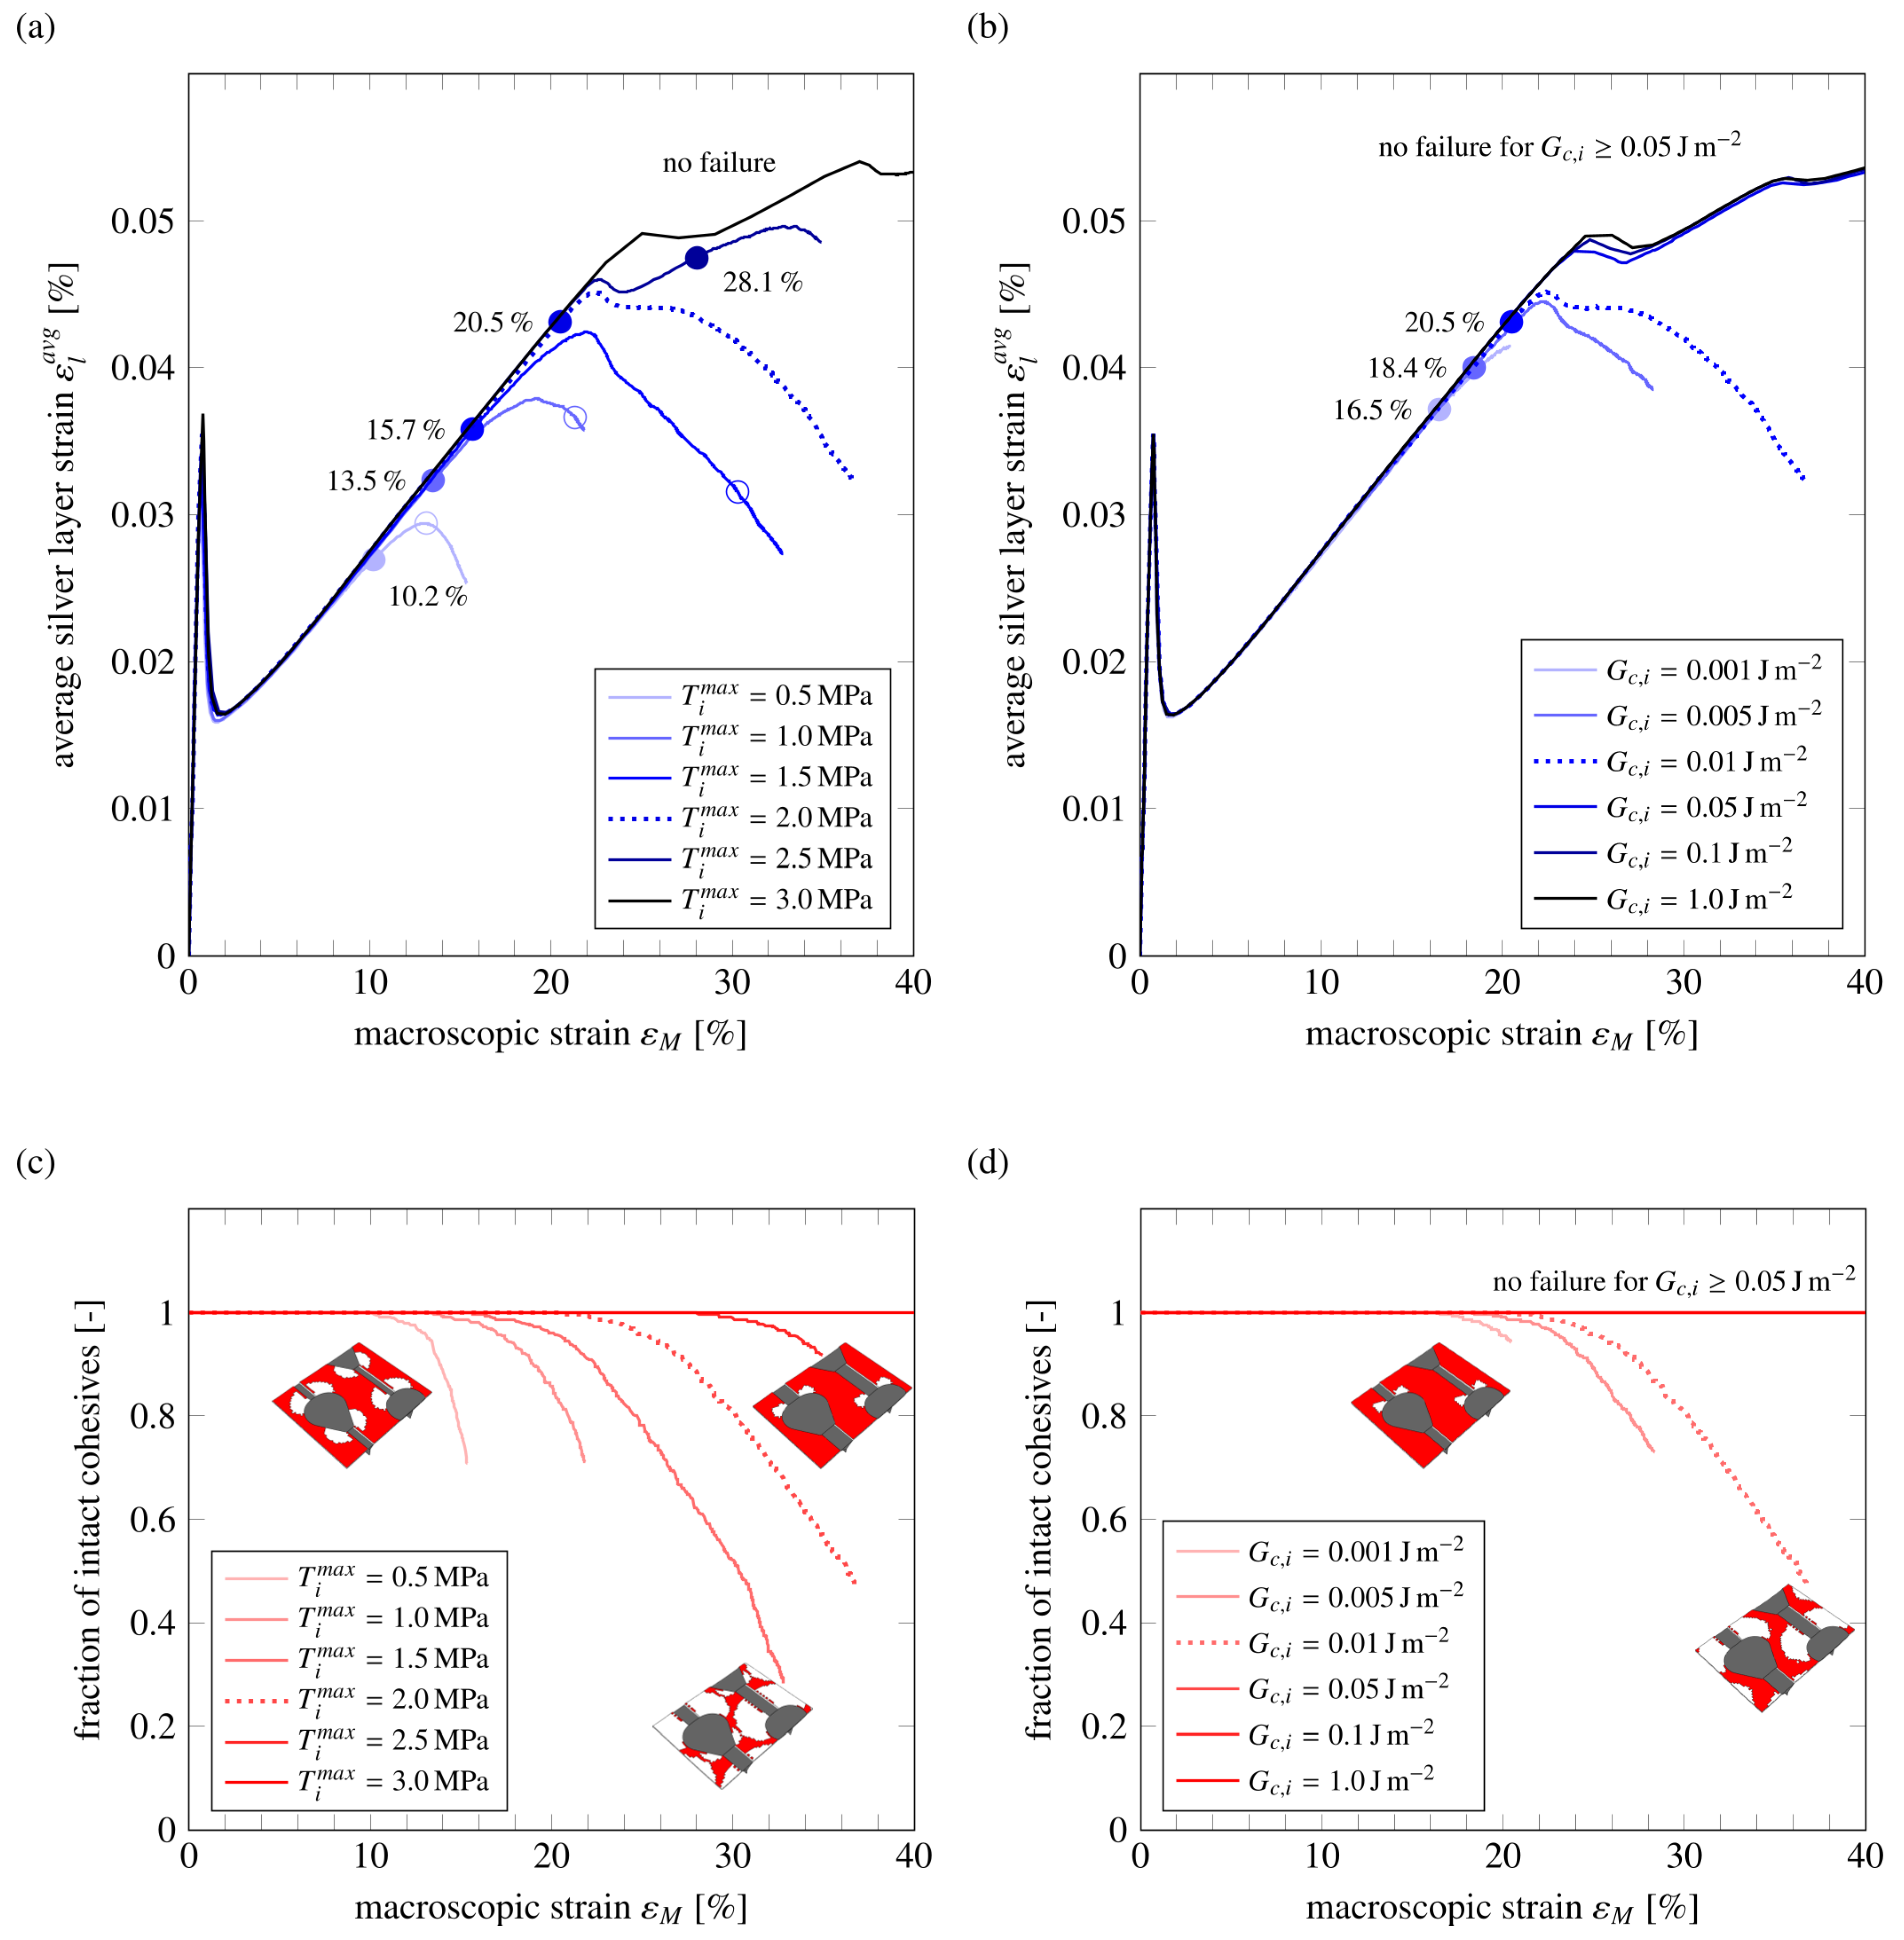
3.1. Delamination Behavior

To investigate the propagation of delamination under strain perpendicular to the stable cracks, we consider a structure with the parameters summarized in Table 1. The geometry investigated here corresponds to the default pattern in [13] and uses dimensions based on the experiments in [12]. The cohesive parameters represent a comparatively weakly bonded metal layer [32] with moderate strength and extremely low toughness. Interfaces with lower strength, but higher toughness, are not susceptible to delamination in the considered structures (Figure 2). We, thus, consider a worst-case scenario for reliability that could arise from less-than-optimal production conditions.
Up to an applied macroscopic strain of around 1%, stresses and strains increase linearly and then drop sharply (Figure 3a). The sharp drop occurs when the soft PDMS begins to soften at the ends of the crack and directly below it in response to the stress concentrations developing around the stable cracks. The softening of the PDMS around the crack provides further strain relief, and the crack tips are blunted, effectively preventing further propagation of the cracks. This initial steep strain increase is a reaction to the initial loading and would not occur in repeated stretching after unloading as the blunted cracks remain stable. In fact, no crack destabilization and propagation occurs in any of the studied configurations.
Further straining results in a slow increase in the average strains in the silver film while the soft PDMS and the cracks are strained considerably (Figure 3b). The strain-relieving capabilities of the stable crack pattern are evident over the whole strain range: the average strain in the silver remains below 0.05% at all times, and the maximum strain measured in the silver layer is below 0.08% (over 350 times lower than the applied macroscopic strain at that point). The elasticity mismatch and the stark difference in the strain at the soft islands’ tips and back arches result in stress concentrations and, consequently, the risk of failure due to delamination.
The back arch especially combines geometrical and material features that increase the risk of delamination: the large elastic mismatch at the interface between the soft island and the hardened surface facilitates stress localization around the island. At the back arch’s apex, high normal and shear stresses overlap along the direction of the macroscopic strain. Therefore, the highest stresses at the silver-PDMS interface arise at the point where a stable crack meets the island’s back arch, triggering delamination. At a macroscopic strain of 20.5%, the first cohesive element in the interface fails at the back arch of the soft island. From this point, delamination spreads outwards in a semicircle (Figure 3c). In Figure 3a, this is visible as a reduction of the average strain as the delaminated silver regions are relaxed while the strains in the still bonded metal film do not increase markedly. The strain relief provided by the controlled cracks thus remains effective even when delamination occurs.
The delaminated areas originating from different islands grow towards each other with further applied strain, and a characteristic zigzag pattern of still intact interface emerges between the stable cracks (Figure 3c).

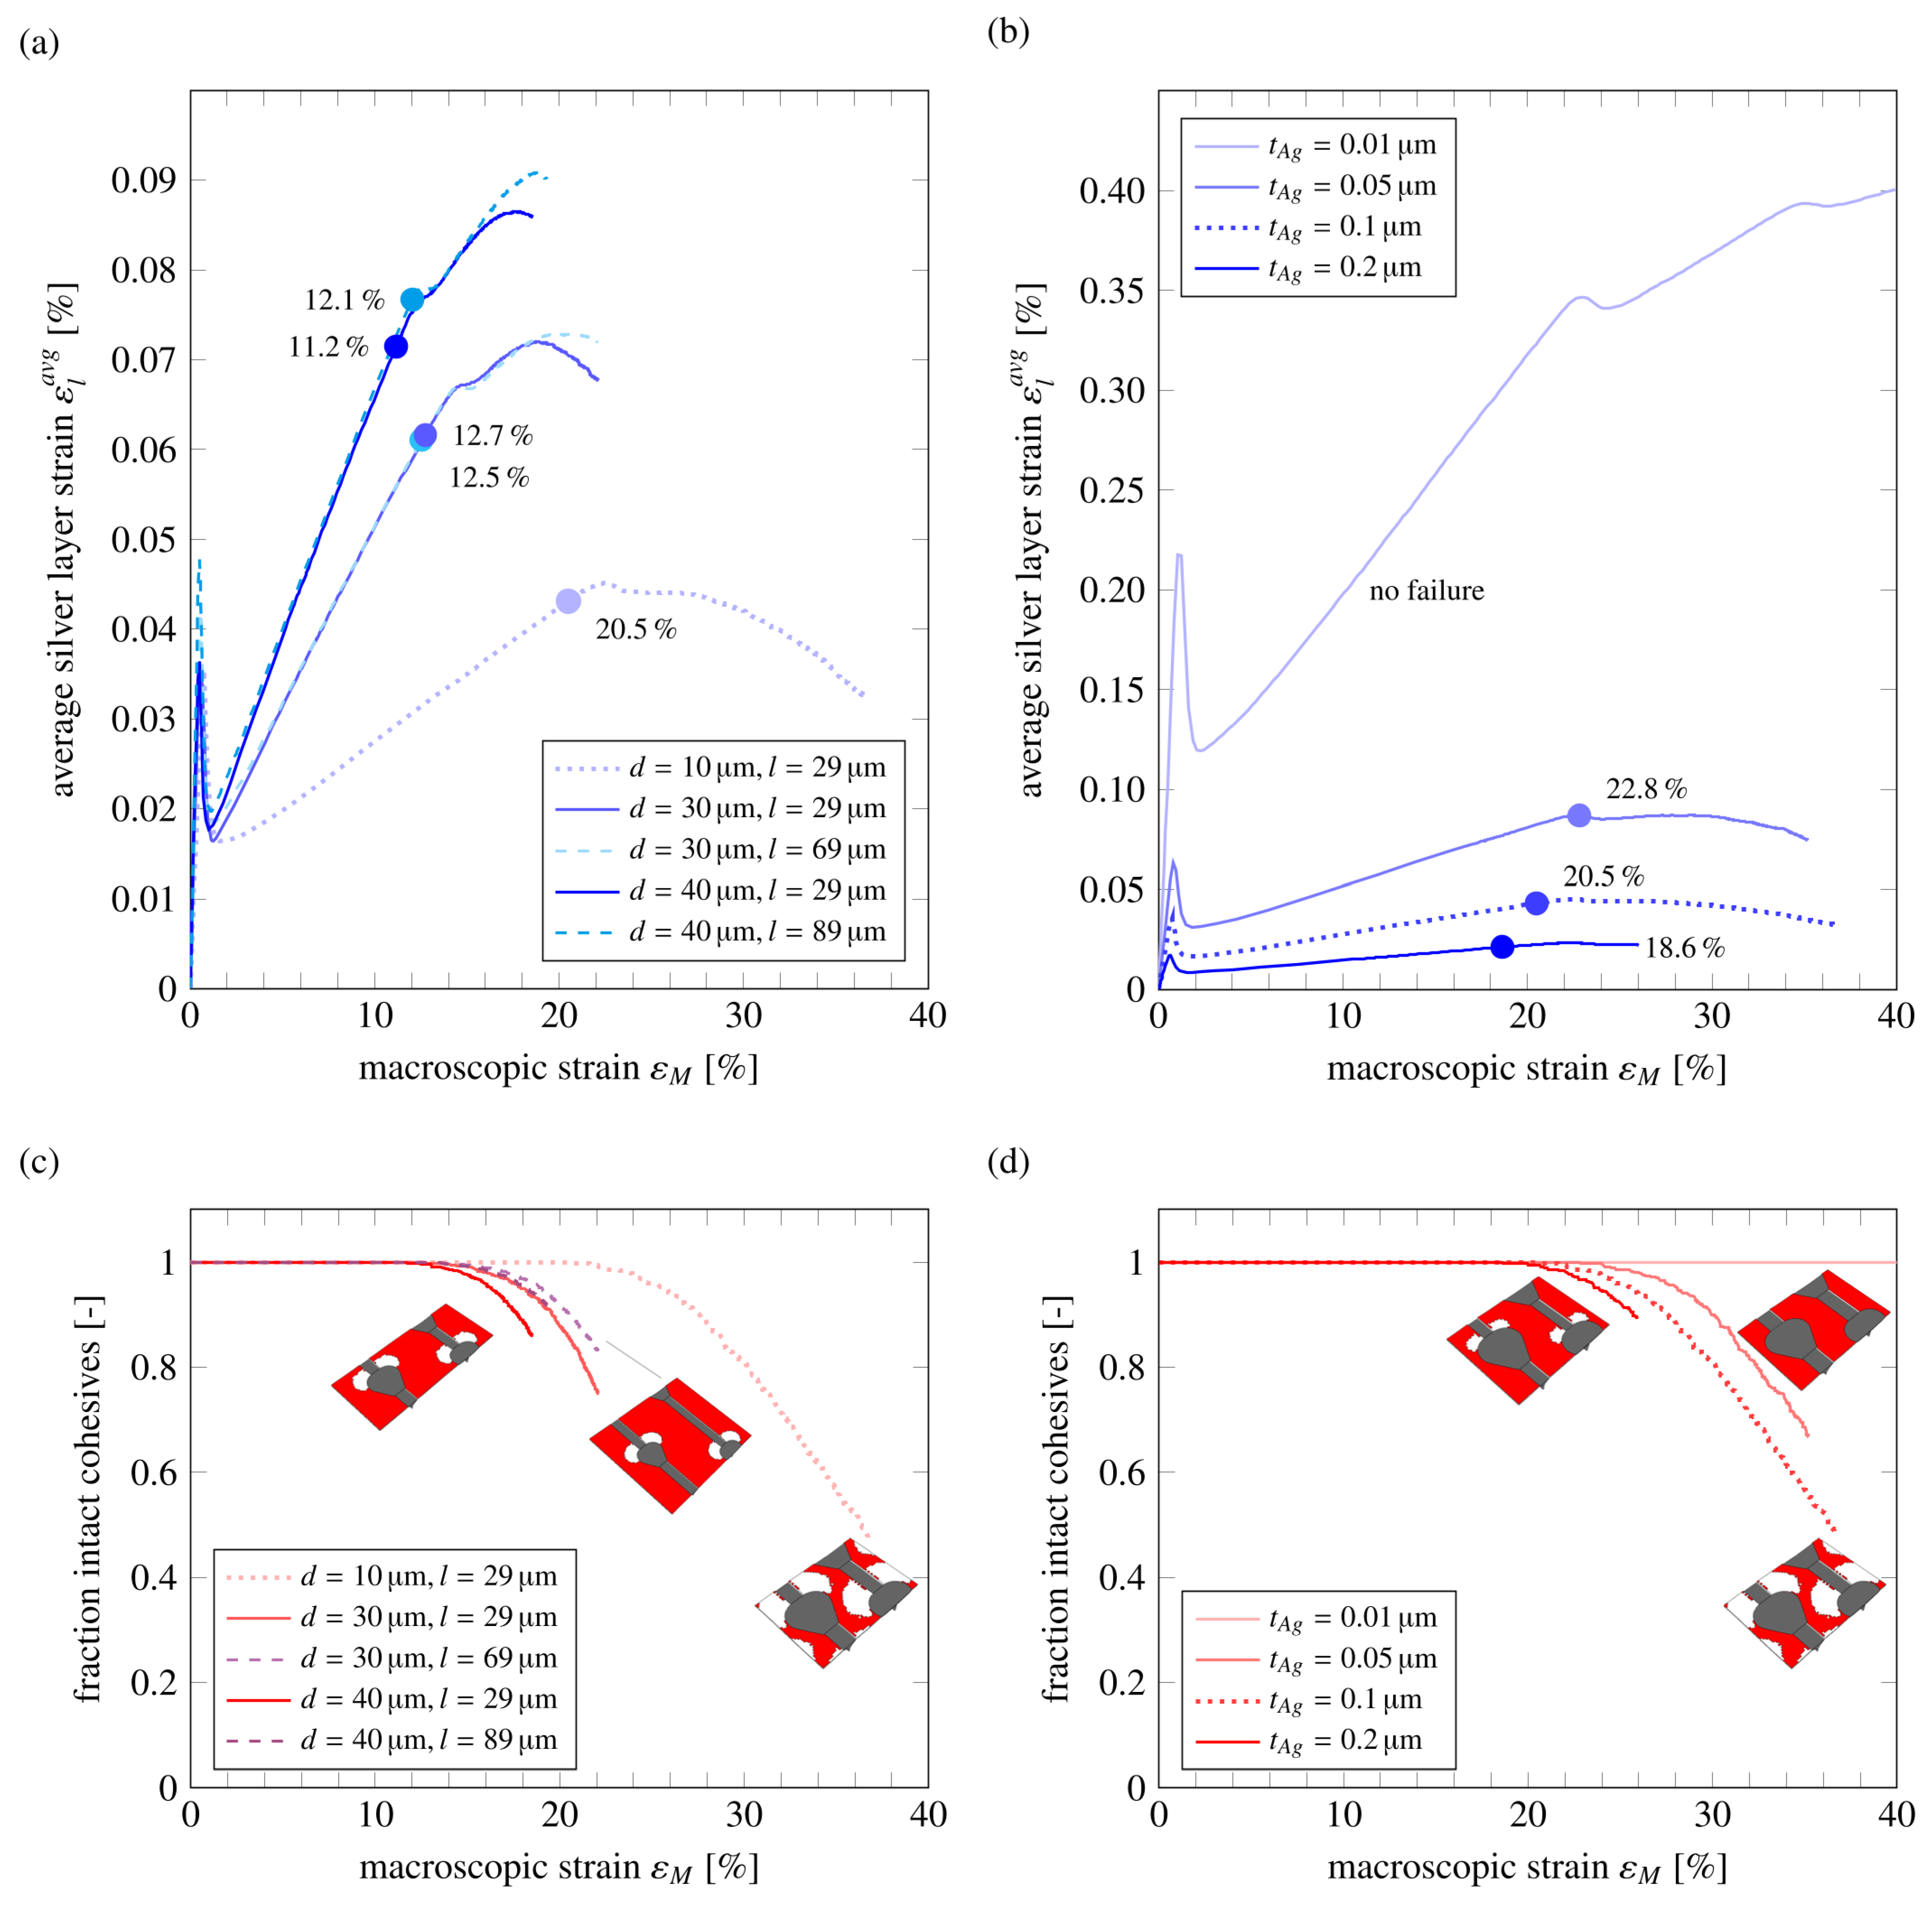
3.2. Influence of Structure on Delamination

Variations of the soft island pattern can be used to tailor the strain behavior of the composite to the requirements of different applications. The crack separation d, i.e., the distance between two parallel cracks, has been found to be the most important geometrical parameter in designing structures with efficient strain relief and a high resulting usable surface area [13]. Cracks that are closer to each other provide increased strain relief. This is also evident in the delamination behavior (Figure 4a). The smallest considered crack separation results in the lowest average strains in the silver layer and the latest onset of delamination. With increasing crack separation, average and maximum strains in the silver layer increase drastically, with the maximum strain reaching almost 0.15% for a separation of d = 40   μ m , which is still well below the silver film’s limit.
The increased strains and stresses, however, result in delamination initiation at significantly lower applied strains than with smaller separation. The characteristic zigzag pattern arises independently of the distance between the stable cracks (Figure 4c).
Deposition of a conducting silver layer on the soft island structure results in a stiffening of the whole composite and can further improve the structure’s strain relief capabilities. The thickness of the silver layer, therefore, strongly influences the deformation behavior and onset of delamination. Although delamination follows the same zigzag pattern independent of the silver layer thickness and is always initiated at the back arch of soft islands, it is initiated at lower applied strains for thicker silver layers (Figure 4b,d). For very thin layers ( t A g = 0.01   μ m ), delamination can be prevented entirely, even for the weakly bonded interface considered here. In contrast, the arising average and maximum strains in the silver layer are smaller the thicker it is. In the thickest silver layer ( t A g = 0.2   μ m ), the maximum local strain does not exceed 0.04%. Thus, a thicker silver layer reinforces the composite and further reduces the strains in the hardened PDMS.
Thin layers do not provide this reinforcement. They sustain much higher local stresses under the same applied macroscopic strain, and the resulting strains are larger and more evenly distributed over the silver layer. Consequently, strain and stress relief mechanisms are less effective in thin layers: the straining of the silver film is transferred to the polymer. Thus, strains and stresses are distributed uniformly over the structure, and no nearly unloaded regions develop. This more evenly distributed deformation, however, prevents the development of stress concentrations at the interface between the two layers. Therefore, thinner layers are less prone to delamination.
Although the average strains in the thinnest considered silver layer ( t A g = 0.01   μ m ) remain well below 0.1 % at macroscopic strains of 40 % , maximum local strains increase drastically, approaching 1 % . Increasing the silver layer thickness by a factor of five results in a sevenfold reduction of maximum strains and a fivefold reduction in average strains in the silver layer (Figure 4b). Extremely thin silver layers, thus, are more likely to fail by rupture of the silver thin film than by delamination.
This change in likely failure scenario depends on the silver layer thickness but not on the absolute amount of silver present, as is evident when comparing the straining and delamination behavior of composites with the same crack separation but different surface coverage, i.e., amount of surface covered by the silver layer (Figure 4a,c). The structure discussed in Section 3.1 has a silver surface coverage of 78%, which by increasing the crack separation is increased up to 88%. An increase in the crack length results in a further increased surface coverage. The average and maximum strains in the silver layer and the delamination behavior are largely unaffected by the surface coverage and crack length, as is evident from Figure 4a,c. For the largest crack separation and crack length, maximum strains increase by less than 0.01 percentage points. This difference is negligible compared to the changes caused by the silver thickness or the crack separation. The crack separation defines the delamination behavior even with additional variation in the crack length. This corresponds to [13], where we identified crack separation as the most influential parameter in soft islands structures.

3.3. Influence of Interface Bonding on Delamination

Modification of the interface properties and the quality of the bonding affects the strength and toughness of the interface, i.e., the maximum traction T i m a x and the critical strain energy release rate G c , i . We consider possible traction values ranging from weak ( T i m a x = 0.5   MPa ) to strong interfaces ( T i m a x = 3   MPa ).
The development of strains in the silver layer and the efficacy of the structure’s strain relief mechanisms before delamination are found to be completely independent of the interface properties (Figure 5a,b, also compare Figure 2). However, the cohesive strength drastically affects the pattern in which delamination propagates (Figure 5c). The reference structure (Section 3.1) has a moderate to high interface strength. With these properties, delamination is only initiated at the back arch of the soft islands and propagates from there, resulting in a characteristic zigzag pattern. For weaker interfaces, secondary delamination at the tips of the islands can be observed. In these cases, two delamination fronts are formed that rapidly propagate toward each other. Due to the low maximum interface traction, delamination is initiated already at applied strains of ca. 10% at the weakest interface, and the cohesive zones fail rapidly. Eventually, the delamination fronts meet between the soft islands with ‘pinched off’ areas of still bonded silver between the cracks that grow smaller as delamination progresses. In these areas, no strain increase in the silver is observed, and the silver remains protected from rupture due to strain relief provided by stable cracks and soft islands.
For larger T i m a x , secondary delamination initiation is shifted to much higher strains, and for moderately strong interfaces ( T i m a x 2   MPa ), no secondary delamination initiation occurs, and the zigzag pattern prevails. Further increase of the interface strength ( T i m a x = 3   MPa ) prevents delamination entirely in the considered applied strain range.
Due to the UV-hardening of the PDMS surface, a brittle interface between the polymer and the silver layer is expected. To investigate the effect of interface toughness on the delamination behavior, we consider a range of small energy release rates that correspond to a brittle interface. Interface toughness has no notable effect on the resulting damage pattern (Figure 5d) or the average strains developing in the silver layer during stretching. Thus, even structures with brittle interfaces maintain their functionality. Increasing the energy release rate shifts the onset of delamination failure towards higher applied macroscopic strains (Figure 5b). A still extremely low energy release rate of G c , i 0.05   J   m 2 prevents debonding entirely.

4. Conclusions

In stretchable electronics, stiff and brittle metallic conductors or electronic parts are deposited, printed, or attached to the surface of highly stretchable polymeric substrates. The considerable elastic mismatch between these two materials results in the localization of stresses and strains at the interfaces, which drastically increases the risk of debonding and delamination, compare, e.g., [17,18,33]. Delaminated metal films will lose their deformability and are prone to rupture and, thus, catastrophic failure.
A pattern of stable cracks and soft islands makes multi-layer composites capable of large macroscopic deformations while maintaining extremely small local strains in a deposited metal layer. Cracks and soft islands provide exceptional strain relief under an applied macroscopic strain, but they also introduce inhomogeneities and areas with a large elastic mismatch to the structure, effectively increasing the risk of delamination. Although no delamination was observed in the soft island structure tested in [12], an assessment of their reliability and risk for delamination is necessary before the adaptation of these structures in electronics applications. To this end, we investigated the influence of structure geometry and interface quality on the risk of delamination in soft islands composites.
Soft island structures with well-bonded or tough interfaces are found to not be susceptible to failure by delamination. However, structures with a large material contrast between soft and hardened polymer show improved strain relief but also embrittlement of the hardened polymer-metal interface. In structures with brittle interfaces, delamination becomes increasingly likely. Delamination initiation occurs at moderate to large applied macroscopic strains (around 20%) and can be shifted by variation of the structure geometry. Small crack separations reduce the risk of delamination of the deposited silver film due to the effectiveness of the strain relief mechanism, which increases with decreased crack separation [13]. However, very small crack separations reduce the usable area of the soft island patterned substrate and, therefore, should be avoided in practice. Decreasing the deposited metal film thickness also reduces the risk of delamination but drastically increases the risk of metal film rupture and, therefore, immediate loss of functionality.
If delamination occurs in the soft island structures, it is initiated at the boundaries of the soft islands due to the high elastic mismatch and resulting stresses in these regions. Even for brittle interfaces, reproducible delamination patterns emerge above a certain interface strength in which, over a remarkable strain range, undelaminated metal remains over the length of the structure. These areas show no decrease in the effectiveness of the strain relief provided by stable cracks and soft islands and maintain their functionality even after the onset of delamination. The silver domains remain connected and show a large usable surface fraction due to the characteristic delamination patterns. This provides additional safety in applications as no sudden, catastrophic rupture of the conducting metal film is to be expected. Furthermore, minor interface modifications resulting in higher interface stiffness or slightly improved toughness can prevent delamination entirely, even under large applied strains.

Author Contributions

Conceptualization, J.W., S.B. and P.G.; software, P.K.; formal analysis, P.K. and J.W.; investigation, P.K. and J.W.; writing—original draft preparation, P.K. and J.W.; writing—review and editing, S.B., P.G. and J.W.; visualization, P.K.; supervision, J.W. and S.B.; funding acquisition, J.W. All authors have read and agreed to the published version of the manuscript.

Funding

Funded by the Deutsche Forschungsgemeinschaft (DFG, German Research Foundation)—Projektnummer 449062206. Computations were carried out on the Pleiades cluster at the University of Wuppertal, which was supported by the Deutsche Forschungsgemeinschaft (DFG, GZ: INST 218/78-1) and the Bundesministerium für Bildung und Forschung (BMBF).

Data Availability Statement

The data presented in this study are available on request from the corresponding author.

Conflicts of Interest

The authors declare that they have no known competing financial interests or personal relationships that could have appeared to influence the work reported in this paper.

Appendix A. Finite Element Model Details and Cohesive Zone Model

Figure A1 shows the periodic soft islands and stable cracks pattern in the hardened PDMS layer and the unit cell chosen as the RVE (Figure 1). The periodicity of the structure in the x y -plane in combination with a perodic mesh facilitate usage of periodic boundary conditions that are implemented using Abaqus equation constraints. The silver layer, hardened layer, soft layer and soft islands are discretized using C3D8 full integration elements to prevent hourglassing. The PDMS bulk layer is modeled with C3D8R reduced integration elements. The cohesive layers in the soft layer and between the hardened and the silver layer are each modeled with a finite thickness of 0.001   μ m and a single row of cohesive elements (COH3D8).
Cohesive zone modeling (CZM) (e.g., [34,35]) defines a damage initiation criterion and a damage evolution law that describes fracture or delamination behavior. CZM has been widely used to study, e.g., controlled cracking in strechable multi-layer structures [13], damage mechanisms in dental enamel [36,37], delamination and cracking in flexible multi-layer materials [38], delamination in stretchable electronics systems [17], or inter-laminar cracking in laminated fiber-reinforced composites [39] and is subject to ongoing research and improvement [40].
Figure A1. 2D sketch of the periodic surface pattern of the soft islands microstructure with default geometry (compare Table 1). The blue dashed line shows the unit cell used to generate the RVE.
Applmech 04 00029 g0a1
Cohesive elements in Abaqus have a constitutive equation of the form
T = K · δ ,
with nominal surface traction vector T and its three components T n , T s and T t in local normal and in-plane directions, uncoupled stiffness matrix K and crack surface separations δ n , δ s and δ t . The material behaves linearly until it reaches a maximum traction T m a x at which damage is initiated through the uncoupled damage initiation criterion
max T n T n m a x , T s T s m a x , T t T t m a x = 1 ,
where pure compression does not lead to further damage, as x = max { 0 , x } . The linear damage evolution is described by the damage variable
D = δ e f δ e m a x δ e i δ e m a x δ e f δ e i ,
where
δ e = δ n 2 + δ s 2 + δ t 2
denotes the effective separation of crack faces. Here, δ e m a x is the maximum effective separation in load history, which makes damage irreversible. δ e i is the effective separation at damage initiation, and δ e f is the effective separation at failure, which are both calculated given the critical strain energy release rate and effective traction at damage initiation. The traction vector for damaged material is then calculated by
T = 1 D T ¯ .
Figure A2 shows the traction separation response of a cohesive zone, with linear behavior prior to damage initiation at T m a x . The cohesive zone then exhibits linear softening until it reaches the point of failure δ f which is defined by the critical strain energy release rate G c .
Figure A2. Bilinear traction-separation response of a cohesive zone. Fracture is initiated when the maximum traction T m a x is reached. The zone’s stiffness is reduced with further damaging until the zone fails completely at a maximum separation of δ f . Adapted from [13] with permission from Elsevier.
Applmech 04 00029 g0a2
Viscous regularization with a viscosity parameter of μ = 0.001 is employed to reduce numerical instabilities due to the nonlinearities introduced by cohesive elements [41]. The regularization equation is
D ˙ v = 1 μ D D v ,
where the regularized damage variable D v is solved for numerically and then substitutes D in the cohesive zone equations.

References

  1. Fallegger, F.; Schiavone, G.; Lacour, S.P. Conformable Hybrid Systems for Implantable Bioelectronic Interfaces. Adv. Mater. 2020, 32, 1903904. [Google Scholar] [CrossRef] [PubMed]
  2. Chung, H.U.; Rwei, A.Y.; Hourlier-Fargette, A.; Xu, S. Skin-interfaced biosensors for advanced wireless physiological monitoring in neonatal and pediatric intensive-care units. Nat. Med. 2020, 26, 418–429. [Google Scholar] [CrossRef] [PubMed]
  3. Byun, J.; Lee, Y.; Yoon, J.; Lee, B.; Oh, E.; Chung, S.; Lee, T.; Cho, K.J.; Kim, J.; Hong, Y. Electronic skins for soft, compact, reversible assembly of wirelessly activated fully soft robots. Sci. Robot. 2018, 3, eaas9020. [Google Scholar] [CrossRef] [PubMed]
  4. Yang, J.C.; Mun, J.; Kwon, S.Y.; Park, S.; Bao, Z.; Park, S. Electronic Skin: Recent Progress and Future Prospects for Skin-Attachable Devices for Health Monitoring, Robotics, and Prosthetics. Adv. Mater. 2019, 31, 1904765. [Google Scholar] [CrossRef]
  5. Kim, K.K.; Suh, Y.; Ko, S.H. Smart Stretchable Electronics for Advanced Human–Machine Interface. Adv. Intell. Syst. 2021, 3, 2000157. [Google Scholar] [CrossRef]
  6. Chitrakar, C.; Hedrick, E.; Adegoke, L.; Ecker, M. Flexible and Stretchable Bioelectronics. Materials 2022, 15, 1664. [Google Scholar] [CrossRef]
  7. Xue, Z.; Song, H.; Rogers, J.A.; Zhang, Y.; Huang, Y. Mechanically-Guided Structural Designs in Stretchable Inorganic Electronics. Adv. Mater. 2020, 32, 1902254. [Google Scholar] [CrossRef]
  8. Alcheikh, N.; Shaikh, S.; Hussain, M. Ultra-stretchable Archimedean interconnects for stretchable electronics. Extrem. Mech. Lett. 2018, 24, 6–13. [Google Scholar] [CrossRef]
  9. Polywka, A.; Jakob, T.; Stegers, L.; Riedl, T.; Görrn, P. Facile Preparation of High-Performance Elastically Stretchable Interconnects. Adv. Mater. 2015, 27, 3755–3759. [Google Scholar] [CrossRef]
  10. Yang, Y.; Duan, S.; Zhao, H. Advances in constructing silver nanowire-based conductive pathways for flexible and stretchable electronics. Nanoscale 2022, 14, 11484–11511. [Google Scholar] [CrossRef]
  11. Eda, A.; Yasuga, H.; Sato, T.; Sato, Y.; Suto, K.; Tachi, T.; Iwase, E. Large Curvature Self-Folding Method of a Thick Metal Layer for Hinged Origami/Kirigami Stretchable Electronic Devices. Micromachines 2022, 13, 907. [Google Scholar] [CrossRef] [PubMed]
  12. Polywka, A.; Stegers, L.; Krauledat, O.; Riedl, T.; Jakob, T.; Görrn, P. Controlled mechanical cracking of metal films deposited on polydimethylsiloxane (PDMS). Nanomaterials 2016, 6, 168. [Google Scholar] [CrossRef]
  13. Kowol, P.; Bargmann, S.; Görrn, P.; Wilmers, J. Strain relief by controlled cracking in highly stretchable multi-layer composites. Extrem. Mech. Lett. 2022, 54, 101724. [Google Scholar] [CrossRef]
  14. Huang, H.; Spaepen, F. Tensile testing of free-standing Cu, Ag and Al thin films and Ag/Cu multilayers. Acta Mater. 2000, 48, 3261–3269. [Google Scholar] [CrossRef]
  15. Xiang, Y.; Li, T.; Suo, Z.; Vlassak, J.J. High ductility of a metal film adherent on a polymer substrate. Appl. Phys. Lett. 2005, 87, 161910. [Google Scholar] [CrossRef]
  16. Hoefnagels, J.P.; Neggers, J.; Timmermans, P.H.; van der Sluis, O.; Geers, M.G. Copper-rubber interface delamination in stretchable electronics. Scr. Mater. 2010, 63, 875–878. [Google Scholar] [CrossRef]
  17. Kleinendorst, S.M.; Fleerakkers, R.; Cattarinuzzi, E.; Vena, P.; Gastaldi, D.; van Maris, M.P.; Hoefnagels, J.P. Micron-scale experimental-numerical characterization of metal-polymer interface delamination in stretchable electronics interconnects. Int. J. Solids Struct. 2020, 204–205, 52–64. [Google Scholar] [CrossRef]
  18. Li, K.; Shuai, Y.; Cheng, X.; Luan, H.; Liu, S.; Yang, C.; Xue, Z.; Huang, Y.; Zhang, Y. Island Effect in Stretchable Inorganic Electronics. Small 2022, 18, 2107879. [Google Scholar] [CrossRef]
  19. Li, H.; Wang, Z.; Lu, S.; Ma, Y.; Feng, X. Elastomers with Microislands as Strain Isolating Substrates for Stretchable Electronics. Adv. Mater. Technol. 2019, 4, 1800365. [Google Scholar] [CrossRef]
  20. Budzik, M.K.; Heide-Jørgensen, S.; Aghababaei, R. Fracture mechanics analysis of delamination along width-varying interfaces. Compos. Part B Eng. 2021, 215, 108793. [Google Scholar] [CrossRef]
  21. Bargmann, S.; Klusemann, B.; Markmann, J.; Schnabel, J.E.; Schneider, K.; Soyarslan, C.; Wilmers, J. Generation of 3D representative volume elements for heterogeneous materials: A review. Prog. Mater. Sci. 2018, 96, 322–384. [Google Scholar] [CrossRef]
  22. Johnston, I.D.; McCluskey, D.K.; Tan, C.K.; Tracey, M.C. Mechanical characterization of bulk Sylgard 184 for microfluidics and microengineering. J. Micromech. Microeng. 2014, 24, 035017. [Google Scholar] [CrossRef]
  23. Görrn, P.; Wagner, S. Topographies of plasma-hardened surfaces of poly(dimethylsiloxane). J. Appl. Phys. 2010, 108, 093522. [Google Scholar] [CrossRef]
  24. Mei, H.; Pang, Y.; Im, S.H.; Huang, R. Fracture, delamination, and buckling of elastic thin films on compliant substrates. In Proceedings of the 2008 11th Intersociety Conference on Thermal and Thermomechanical Phenomena in Electronic Systems, Orlando, FL, USA, 28–31 May 2008; pp. 762–769. [Google Scholar]
  25. Momodu, D.Y.; Tong, T.; Zebaze Kana, M.G.; Chioh, A.V.; Soboyejo, W.O. Adhesion and degradation of organic and hybrid organic-inorganic light-emitting devices. J. Appl. Phys. 2014, 115, 084504. [Google Scholar] [CrossRef]
  26. Genesky, G.D.; Cohen, C. Toughness and fracture energy of PDMS bimodal and trimodal networks with widely separated precursor molar masses. Polymer 2010, 51, 4152–4159. [Google Scholar] [CrossRef]
  27. Neggers, J.; Hoefnagels, J.; van der Sluis, O.; Sedaghat, O.; Geers, M. Analysis of the dissipative mechanisms in metal–elastomer interfaces. Eng. Fract. Mech. 2015, 149, 412–424. [Google Scholar] [CrossRef]
  28. Oyewole, O.K.; Yu, D.; Du, J.; Asare, J.; Oyewole, D.O.; Anye, V.C.; Fashina, A.; Zebaze Kana, M.G.; Soboyejo, W.O. Micro-wrinkling and delamination-induced buckling of stretchable electronic structures. J. Appl. Phys. 2015, 117, 235501. [Google Scholar] [CrossRef]
  29. Meng, Q.; Chang, M. Interfacial crack propagation between a rigid fiber and a hyperelastic elastomer: Experiments and modeling. Int. J. Solids Struct. 2020, 188–189, 141–154. [Google Scholar] [CrossRef]
  30. van der Sluis, O.; Remmers, J.J.; Thurlings, M.; Welling, B.; Noijen, S.P. The Competition between Adhesive and Cohesive Fracture at Amicro-Patterned Polymer-Metal Interface. Key Engineering Materials. In Advances in Fracture and Damage Mechanics XII; Trans Tech Publications Ltd.: Bäch, Switzerland, 2014; Volume 577, pp. 225–228. [Google Scholar]
  31. van Tijum, R.; Vellinga, W.P.; De Hosson, J.T.M. Adhesion along metal–polymer interfaces during plastic deformation. J. Mater. Sci. 2007, 42, 3529–3536. [Google Scholar] [CrossRef]
  32. Li, T.; Suo, Z. Ductility of thin metal films on polymer substrates modulated by interfacial adhesion. Int. J. Solids Struct. 2007, 44, 1696–1705. [Google Scholar] [CrossRef]
  33. Lucchini, R.; Cattarinuzzi, E.; Maraghechi, S.; Gastaldi, D.; Adami, A.; Lorenzelli, L.; Vena, P. Delamination phenomena in aluminum/polyimide deformable interconnects: In-situ micro-tensile testing. Mater. Des. 2016, 89, 121–128. [Google Scholar] [CrossRef]
  34. Cornec, A.; Scheider, I.; Schwalbe, K.H. On the practical application of the cohesive model. Eng. Fract. Mech. 2003, 70, 1963–1987. [Google Scholar] [CrossRef]
  35. Park, K.; Paulino, G.H. Cohesive Zone Models: A Critical Review of Traction-Separation Relationships Across Fracture Surfaces. Appl. Mech. Rev. 2013, 64, 060802. [Google Scholar] [CrossRef]
  36. Bargmann, S.; Scheider, I.; Xiao, T.; Yilmaz, E.; Schneider, G.A.; Huber, N. Towards bio-inspired engineering materials: Modeling and simulation of the mechanical behavior of hierarchical bovine dental structure. Comput. Mater. Sci. 2013, 79, 390–401. [Google Scholar] [CrossRef]
  37. Ma, S.; Scheider, I.; Bargmann, S. Anisotropic constitutive model incorporating multiple damage mechanisms for multiscale simulation of dental enamel. J. Mech. Behav. Biomed. Mater. 2016, 62, 515–533. [Google Scholar] [CrossRef]
  38. van der Sluis, O.; Engelen, R.; Timmermans, P.; Zhang, G. Numerical analysis of delamination and cracking phenomena in multi-layered flexible electronics. Microelectron. Reliab. 2009, 49, 853–860. [Google Scholar] [CrossRef]
  39. Asur Vijaya Kumar, P.; Dean, A.; Reinoso, J.; Paggi, M. A multi phase-field-cohesive zone model for laminated composites: Application to delamination migration. Compos. Struct. 2021, 276, 114471. [Google Scholar] [CrossRef]
  40. Daniel, P.M.; Främby, J.; Fagerström, M.; Maimí, P. An efficient ERR-Cohesive method for the modelling of delamination propagation with large elements. Compos. Part A Appl. Sci. Manuf. 2023, 167, 107423. [Google Scholar] [CrossRef]
  41. Niazi, M.S.; Wisselink, H.H.; Meinders, T. Viscoplastic regularization of local damage models: Revisited. Comput. Mech. 2013, 51, 203–216. [Google Scholar] [CrossRef]
Figure 1. Representative volume element of a soft islands structure consisting of soft and hardened PDMS (light and dark grey, respectively) and a thin silver film layer (blue). Dotted lines represent pre-existing, stable cracks. The interface between silver and PDMS (red) and the continuation of the cracks in the soft material (dark red) are modeled with cohesive zones. The structure is subjected to a uniaxial strain of ε M = 40 %.
Applmech 04 00029 g001
Figure 2. Average principal strain ε l a v g in the silver layer (a) and a fraction of intact cohesive elements between silver layer and hardened PDMS layer (b) against applied macroscopic strain ε M for different types of interface bonding.
Applmech 04 00029 g002
Figure 3. Delamination progression in a soft islands structure. (a) Average principal strain in the silver layer and fraction of intact cohesive interface for the reference structure. The dot indicates the first cohesive element failure. The evolution of the local strain distribution (b) and the damage variable D in the cohesive elements (c) are shown on the right-hand side. Delamination initiates at the back arch of the soft islands.
Applmech 04 00029 g003
Figure 4. Dependence of the delamination behavior on geometry parameters. (a,c) show the effect of crack separation d and crack length l on the average principal strains in the silver layer and the fraction of intact cohesive interface, respectively. (b,d) show the same properties in dependence of the silver layer thickness t A g . Strains at delamination initiation are indicated in the plots and marked with dots. Reduction of the crack separation d or the silver thickness t A g shift delamination initiation to higher applied macroscopic strains. The crack length l has no effect on the developing strains.
Applmech 04 00029 g004
Figure 5. Influence of interface strength (a,c) and interface toughness (b,d) on the average principal strain in the silver layer and fraction of remaining intact interface. Stronger (higher T i m a x ) and less brittle (higher G c , i ) interfaces can both prevent delamination initiation. Strains at delamination initiation are indicated in the plots and marked with dots. Secondary damage initiation is marked by circles. Dotted lines represent the default parameter configuration.
Applmech 04 00029 g005
Table 1. Geometry and delamination parameters of weakly bonded reference structure.
ParameterValue
dcrack separation30 μ m
lcrack length29 μ m
t A g silver layer thickness0.1 μ m
T i m a x maximum cohesive traction2 M Pa
G c , i critical strain energy release rate 0.01   J   m 2
Disclaimer/Publisher’s Note: The statements, opinions and data contained in all publications are solely those of the individual author(s) and contributor(s) and not of MDPI and/or the editor(s). MDPI and/or the editor(s) disclaim responsibility for any injury to people or property resulting from any ideas, methods, instructions or products referred to in the content.

