Article

Multi Scale Modelling of Friction Induced Vibrations at the Example of a Disc Brake System

1
IPEK—Institute of Product Engineering, Karlsruhe Institute of Technology (KIT), 76131 Karlsruhe, Germany
2
TECOSIM Technische Simulation GmbH, 65187 Wiesbaden, Germany
*
Author to whom correspondence should be addressed.
Appl. Mech. 2021, 2(4), 1037-1056; https://doi.org/10.3390/applmech2040060
Submission received: 26 October 2021 / Revised: 2 December 2021 / Accepted: 7 December 2021 / Published: 10 December 2021
(This article belongs to the Collection Fracture, Fatigue, and Wear)

Abstract

:
Friction induced vibrations such as brake squealing, or juddering are still challenging topics in product engineering processes. So far, this topic was particularly relevant for the automobile industry because they were the main market for disc brake systems. However, since mobility habits change, disc brake system are more often to be found on bikes or e-scooters. In all of these systems, vibrations are excited in contacts on the micro scale but affect the user comfort and safety on the macro scale. Therefore, the aim of this cross-scale method is to analyze a system on a micro scale and to transfer the excitation mechanisms on a macro scale system. To address both scales, the current work presents a finite element model on the micro scale for the determination of the coefficient of friction, which is transferred to the macro scale and used in a multi-body simulation. Finally, a finite element modal analysis is conducted, which allowed us to evaluate the brake system behavior on base of an excitation.

1. Introduction

Disc brake systems are components of, e.g., trains, cars, trucks, bikes, or e-scooters. Brake systems must ensure the safe stopping of a vehicle at any time. Especially at high speeds, emergency situations instantly occur and result in sudden high loads on vehicles. Brake systems must ensure safe working at high speeds; however, they also have to guarantee reliable working on daily loads, such as in front of traffic lights. Because of this high importance of the systems for the safety of the driver and pedestrians, these systems are specially focused on engineering processes. Therefore, any strange noise, such as squealing or juddering, unsettles drivers, who then mistrust the system. Consequently, they return the entire vehicle to the dealer, who has to fix the issue. The driver is dissatisfied, the dealer has many costs, and the engineering company must provide a solution. Hence, the engineering company has a great interest in the early validation of the product properties in terms of brake systems.
The topic of brake squealing is addressed in different research areas, such as technical engineering and physics or chemistry, because different subsystems on different scales influence its occurrence. Whereas physicists and chemists often take a close look at the friction interface and its properties, engineers focus on the entire brake systems and its implementation in the surrounding assembly in a car or a bike. The engineering process requires one to combine the views of different departments to consider influences from different scales. Hereby, the analysis of the friction interface is done with a micro scale focus and the assembly of the brake system requires a macro scale focus.
A comprehensive overview about brake squealing is given by Kinkaid et al. [1]. The authors present a detailed explanation of the complex brake system and the arising noises and vibrations. Further, they show that this topic is investigated with physical experiments and computations. Other references, which follow the approach of combining physical experiments and virtual computations, are from Cantoni et al. [2] and Papinniemi et al. [3]. In contrast to the split between experiments and computations, Oberst and Lai [4] distribute the brake squeal investigations to models on different scales. Thereby, pin-on-disc or beam-on-disc experiments are predominantly referred to on the micro scale, because the friction interface is focused on, whereas the model of a laboratory brake system is referred to on the macro scale, since macroscopic geometries are used.
Besides the investigation type and scope, the parts themselves are closely analyzed. The brake pad usually consists of many different materials with different deformation properties or different surface structures. This results in complex friction and wear properties, because the influence of a single ingredient cannot be clearly determined. Eriksson et al. [5] and Eriksson and Jacobson [6] show surface formations on a micro scale due to different wear rates of the brake pad ingredients. Plateaus of more wear resistant ingredients determine the friction behavior. They conclude that, with many small plateaus, a brake increasingly tends toward squealing [5]. Österle and Urban [7] present an even deeper surface analysis of brake pads. They conducted TEM-studies and EDX spectroscopy, which show the third bodies formation during contact interaction. Different analyses illustrate that these third bodies are a relevant element in pad–disc contact because they enable a steady coefficient of friction [8,9,10].
Besides physical analysis, computations are conducted for contact investigations. Minimal models, which consist of bodies, springs, dampers, and at least one contact, enable engineers and researchers to gain a basic understanding of the excitation mechanisms. Wagner et al. [11] present different minimal models for the investigation of excitation mechanisms. They argue that an instability of the friction force can induce vibrations. Different minimal models, with at least two degrees of freedom, are summarized and a new approach with a wobbling disc and two-point contacts is introduced. For the application of minimal models, Lyu et al. [12] present a minimal model and a method for the parameter determination. However, the model is on a macro scale and does not include distributed coefficients of friction or micro scale roughness, but does include constant values for the coefficient of friction. Furthermore, to increase the validation capabilities of minimal models, the combined use of a minimal model and an FE model is a suitable approach, as Úradníček et al. [13] have shown. Their investigation comprises a minimal model, an FE model and experimental tests for analyzing the influence of the material damping to the stability behavior of a brake.
FE models are another computational method for the investigation of brake squealing. They often include the real geometries, which are exported from the ideal CAD geometry. Therefore, these models take acceleration into account and allow precise deformation and modal analysis computations. Kim et al. [14] virtually disassemble a brake system and determine the influence of each component to the squeal behavior by assuming a constant coefficient of friction on which the system might squeal. Abu Bakar et al. [15] and Belhocine and Ghazaly [16] model an entire disc brake system and show the influence of wear [15] and the Young’s modulus [16] to squeal generation. Wenzhu et al. [17] model a brake system with an FE model and analyze the influence of the coefficient of friction, the rotation speed, the brake pressure and the rotor stiffness on the tendency of instability. A similar approach with a rotating disc is presented by Kang [18]. The methodology allows one to compute the stability with a fixed rotation angle; it thereby shows that the eigenvalues change with varying rotation angles. Even though Simone et al. [19] model the contact with various cylinders, each contact uses a constant coefficient of friction. Because of this, the model is not capable of depicting distributed coefficients of friction.
Especially with FE simulations, the amount of data that is generated is enormous; the interpretation is therefore often done graphically. For overcoming these barriers, Stender et al. [20] use neural networks for the analysis of system stability, arising frequencies and their cross dependencies. This data-driven approach is regarded as useful; however, since the frequencies are system dependent, more research is necessary for reliable results.
Besides discrete FE models, continuous models are used for modelling brake systems. Graf and Ostermeyer [21] depict the surface structure of a brake disc as additional masses on an ideal surface. The distribution of the masses represents wear plateaus (cf. [5,6]). The model shows that vibration excitation is not just dependent on the ingredients, but also on the third body formation in the contact interface. Another continuous approach by Hetzler and Willner [22] compares three different worn brake pads. They highlight that the microscopic contact properties have a significant influence on the squeal behavior.
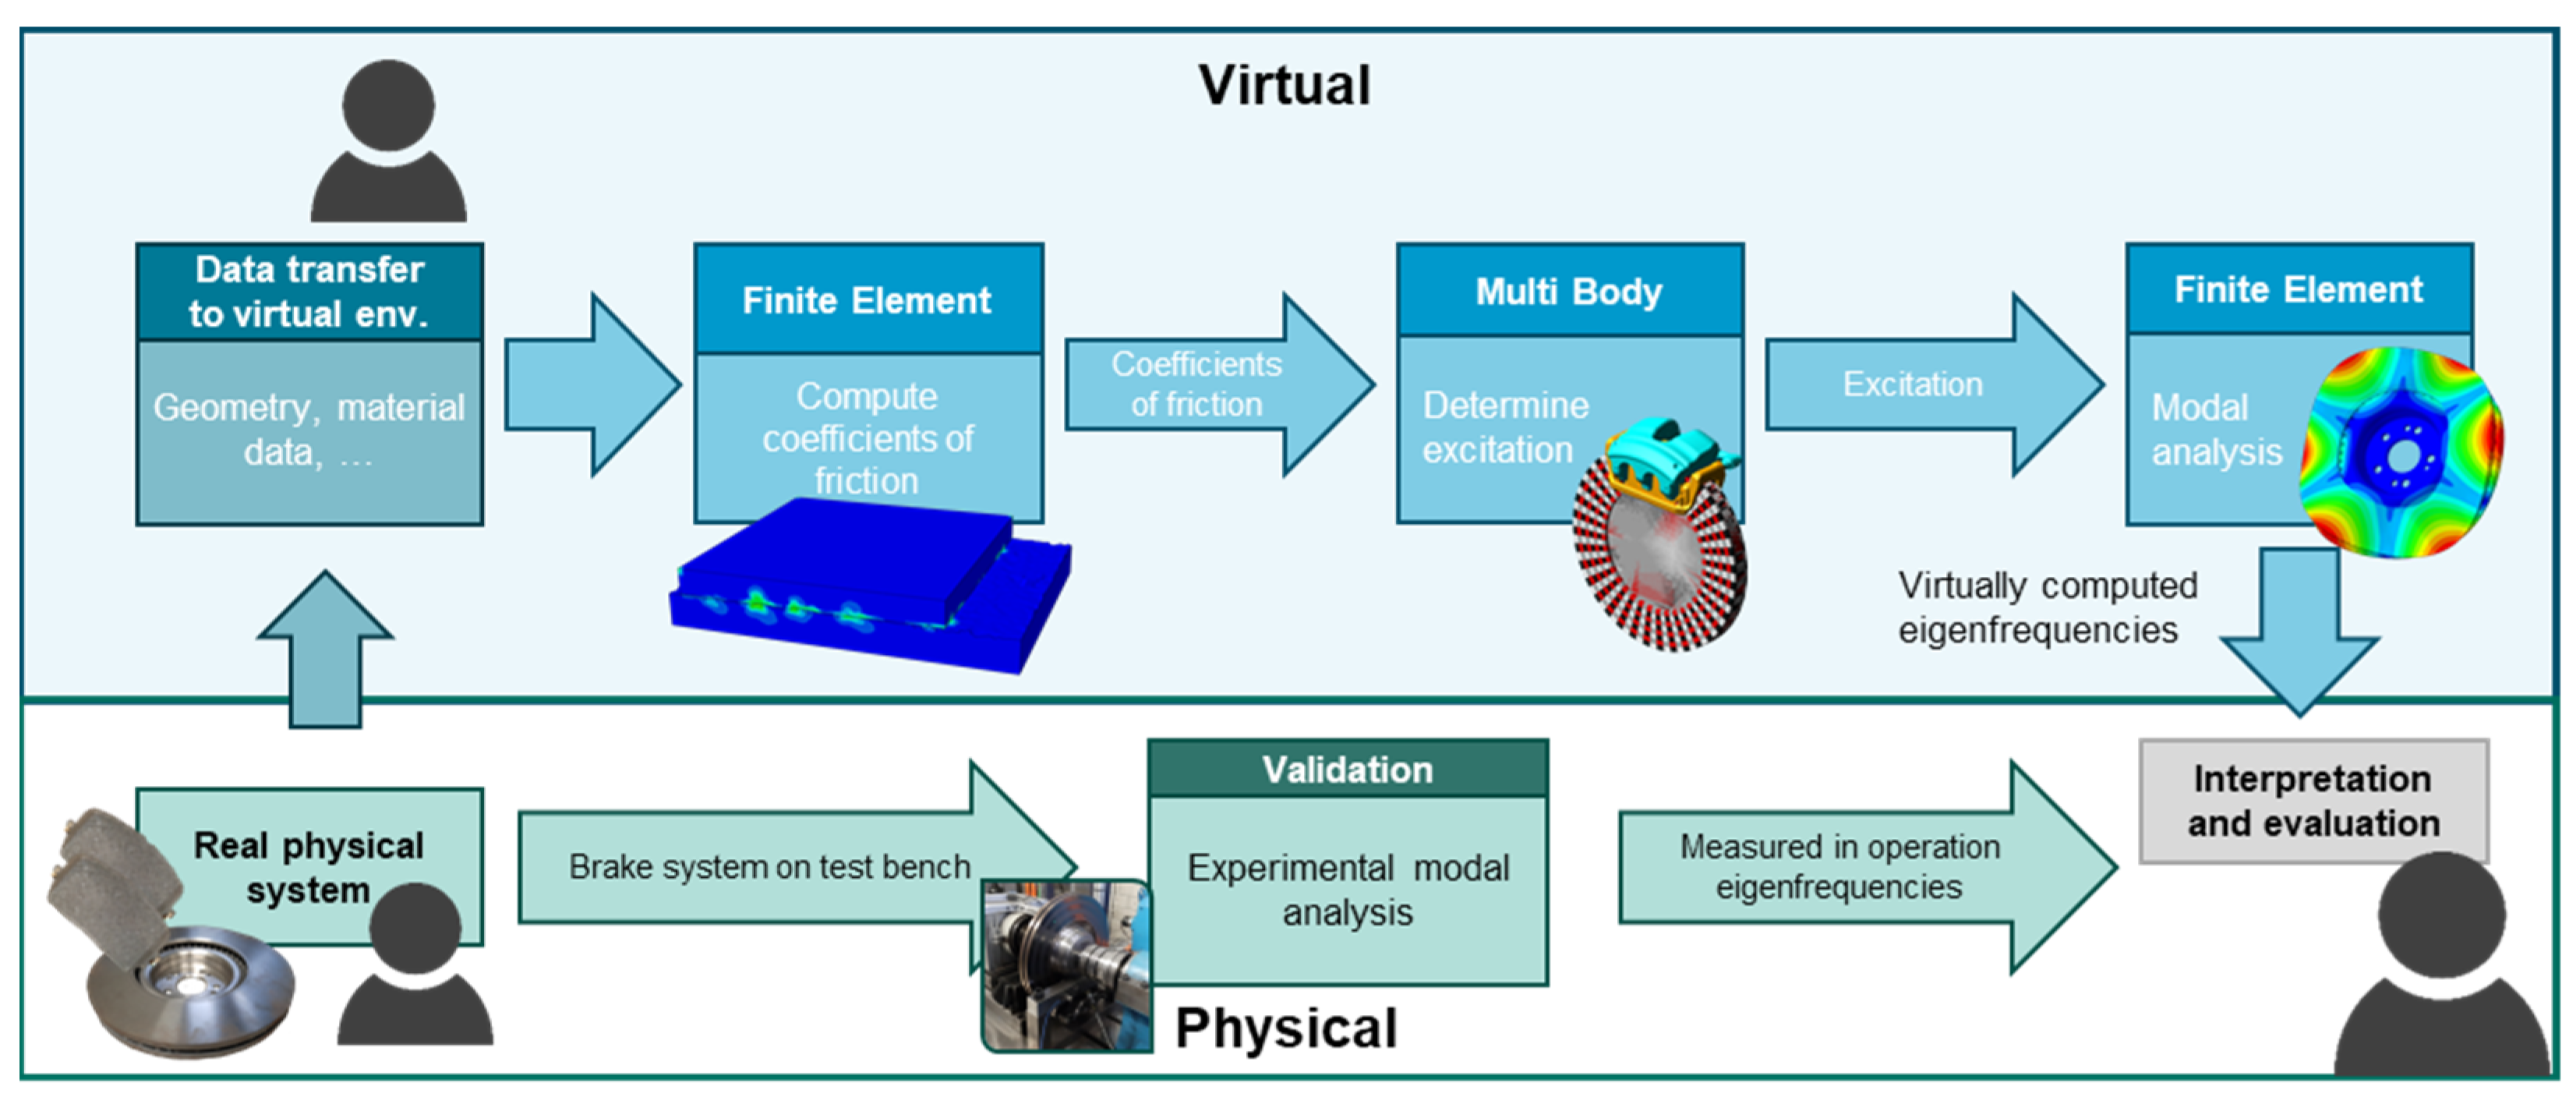
In the presented literature, squealing brake systems are analyzed on the one side physically and on the other side virtually. This split of the methods allows one to conduct individual research. However, since the literature shows that there are different influences from different scales and since different scales require different techniques, a cross-scale approach is a suitable next step for research projects. Therefore, this work aims to develop an approach for coupling different methods and different scales in one engineering method.
The coupling approach mainly addresses product developers, which face scale crossing challenges, such as brake development. Computer simulations allow an isolated investigation of the parameters on each scale. However, the final product is regarded on a macro scale and the transfer and implementation of the behavior, which is determined on lower scales, must be coupled to the macro scale. Since simulation models are always an abstraction of the real system, a physical prototype and physical experiments are mandatory for the validation.

2. Materials and Method

The method to be developed considers different engineering methods, because the multiple influences of this complex phenomena brake-squealing lie on different scales. On the microscale, a finite element simulation was used to observe the effects of the surface topography on the coefficient of friction. The model was used to compute coefficients of friction for different normal loads (res. pressures). The coefficients of friction were transferred to a macro scale multi-body model (MB model) for the computation of an excitation signal. The characteristic feature of this MB model is a discretized contact, which enabled the depiction of different local friction conditions between the inner and outer radius of the disc. The computed excitation signal was implemented in a finite element modal analysis to depict the factor that is relevant to considerations of human comfort: the audible frequency.
Parallel to the simulation work, two experimental modal analyses are conducted: an experimental static modal analysis and an experimental dynamic modal analysis. In the first static modal analysis, the eigenfrequencies of the disc were measured with a laser vibrometer. Subsequently, the entire brake system with disc, pad and caliper was assembled on a test bench. For the second dynamic modal analysis, the system was run at low speed and light pressures to excite audible vibrations. As before, a laser vibrometer was used for measuring the eigenfrequencies of the brake disc.

2.1. Virtual Environment

2.1.1. Finite Element Coefficient of Friction Computation

The start point of the coupled simulation method (Figure 1) is the real physical geometry of the brake system and the parts’ properties. On the micro scale, the surface topography is one influence factor and must be depicted in the simulation. To do so, the friction and wear simulation approach of Reichert et al. [23] (c.f., [24,25,26]) is used. In contrast to previous investigations, the approach is hereby used for a friction system, which focuses on the transfer of friction force. Previous applications considered sliding systems, which aim for the reduction and avoidance of friction forces. However, this micro scale model is used to determine local friction coefficients, which depend on locally distributed pressure and relative velocity between pad and slider. The micro scale simulations cover the operation points at three different rotational velocities and for three different brake pressures.
The modelling technique requires one to transfer the real surfaces to virtual simulations. Initially, the surfaces of a new brake disc and a new brake pad are scanned by a white light interferometer. The resulting point cloud data is processed by removing outliers and filling missing values. Afterwards, the surface data is primarily filtered to remove shape deviations. A Matlab (The Mathworks, Inc., Portola Valley, CA, USA) script generates vertically and horizontally splines through the data points and maps the real surface to a cuboid 3D solid (an iges file). Matlab is a broadly used software for solving mathematical problems and creating visualization graphs. This file is imported in regular CAD software for further processing. The processing step is the cut of the part to the desired size. The FE-Software Abaqus 2019 (Dassault Systèmes, Vélizy-Villacoublay, France) is used for this FE investigation. Abaqus is a standard software for FE computation in engineering departments. The software Abaqus allows engineers and researchers to create FE models with a graphical user interface and to solve the corresponding complex differential equation system with the aim of, e.g., determining the deformation or the eigenfrequencies of a system. The internal meshing algorithm has been used to mesh the iges files, which have been exported from the CAD software. At this point, two meshed bodies with the real surface of the brake disc and brake pad were available for assembling the FE model. A more detailed documentation of the transfer of real surfaces to virtual parts can be read in Joerger et al. [27].
The assembly (Figure 2) consists of the lower body (referred to as base), the upper body (referred to as slider) and a damping plate. The base comprises the surface geometry from the brake pad and the slider comprises the geometry from the brake disc. The damping plate is a shell body and is implemented for the reduction of oscillations. Such oscillations raise as a result of the dynamic explicit computation, which takes mass effect into account. Since these micro and macro scale models are connected by the coefficient of friction, these oscillations do not interfere with the subsequent computations. The choice of the explicit computation method has been made as the explicit contact computation is more robust and precise than implicit contact computations.
The FE simulation process starts with applying the normal force to the upper body. After the force is applied, the slider starts moving across the lower rough surface. Commonly used friction conditions comprise the specification of a coefficient of friction. Since the aim of this model is to compute the coefficient of friction, this type of specification is not suitable. Instead, a shear stress limit is used to determine the frictional behavior of both parts. This condition defines a shear stress limit for contacting nodes, below which no movement is possible. The value is set according to an investigation by Bowden and Tabor [28] (c.f., Abaqus Documentation 37.1.5) to τ m a x = σ e , d i s c / 3 . Thereby, this approach enables the computation of the coefficient of friction as quotient of shear and normal forces at the nodes.
Because the initial surface topography is only valid for the running-in phase, the approach requires a change of the surface topography throughout the simulation. The continuous change of the surface topography is affected by local wear at the contacting nodes. After one simulation run, a Python script computes, according to Archard’s wear law [29], the wear on each contacting node. Python is a universal coding language, which allows one to create easily readable code. Besides other user-friendly features, this results in a wide use of the language in engineering and research departments. The use of Matlab and Python was necessary because the relevant code for transferring surfaces has not yet been available in Python. This code is currently in development for reducing the number of necessary software.
Following this, each surface node is shifted by its wear distance to depict wear at the contacting nodes. The node adjustments continuously change the surface topography and result in new pressure distributions. Combined with the shear stress limit, this gives a coefficient of friction, which is dependent on the surface topography, the pressure distribution and the velocity of the slider. Since the model is of limited length, this slider is replaced after it gets to the end of the base and returned to the starting point for the next cycle. Thus, long-term simulations are possible. By this, the surface topography constantly changes and thereby considers continuous wear and enables the continuous computation of the coefficient of friction for different load and velocity stages.

2.1.2. Multi-Body Simulation with Distributed Contact

The MB model and the subsequent FE computations (two top right boxes in Figure 1) require comprehensive model preparations. For this reason, a sequential simulation workflow (Figure 3) has been set up in order to analyze the oscillating phenomena. The workflow consists of three CAE disciplines: finite element modal analysis (static), multi-body simulation (dynamic) and modal dynamic simulation. Data transfer in the workflow has been arranged with subroutines. The static modal analysis is the base of the workflow. The multi-body simulation may reproduce periodic oscillations of flexible parts in the system. Modal dynamic simulation may reproduce system modes triggered by external excitation.
The external excitation results from the MB simulations, which use the distributed coefficients of friction in the pseudo-discretized contact patches. Hence, the FE modal analysis with the excitation signal represents indirectly the distributed coefficients of friction.

2.1.3. Virtual Static Modal Analysis

The further preprocessing has comprised the computation of the eigenfrequencies of the brake system. These results are compared with the excited frequencies at the end of the process. To do so, a finite element model of the brake system consisting of disc, caliper, brake shoes, pistons, friction pads and nearly all attached mechanical small parts, such as springs, screws, shims, and damping pads, has been created. Materials like steel, casted iron and an orthotropic material for the friction pads have been allocated. This material has been chosen based on in-house experience. Due to non-disclosure agreements, the values cannot be published. Here, in a first static analysis, the contacts were initialized, and the screws were tightened. Hence, the subsequent modal analysis took account of the inner tension in the structure and the friction; effects of rotation have been compensated with a centrifugal force acting upon the disk. Since it is a static analysis, the disk is not rotating, only the effects of rotation are taken into account. The rotational velocity field causes dynamic friction in the brake and hampers grip. The nodes at the pad patch contact are only coupled in normal direction to the contact plane. Without this frictional model approach, the contact nodes would be coupled in all degrees of freedom, the contact would be tied, and relative movement would be impossible. The resulting real and complex eigenmodes provided insight into the system and unstable modes could be identified.

2.1.4. Real Static Modal Analysis

Besides the computational determination of the modes, an experimental static modal analysis of the brake disc was conducted. Since the main resonance body is the disc, the other parts were hereby neglected. The disc was fixed by a steel wire and excited by a shaker in the range between 0 Hz and 6.5 kHz. Figure 4 shows the hanging disc and the shaker. Its eigenfrequencies were measured with a Polytec PSV 400-3D scanning vibrometer (Polytec GmbH, Waldbronn, Germany).

2.1.5. Virtual Multi-Body Analysis

From the FE model, the brake disc, pads, and caliper were separated to create modal neutral files (MNFs), i.e., flexible bodies for the MB simulation. Special attention was dedicated to the contact interaction of friction pads and disc, since this contact is bound by the coefficients of friction, which vary temporarily and locally, as can be seen in the result of the friction computation (c.f., Figure 10). To transfer the local variation of the coefficient of friction to the multi-body model, the contact between friction pads and disks had to be divided to several contacts. This can be done by “pseudo-discretizing” one of the contact partners. Since the disc is much stiffer than the friction pads, the pads are modelled as MNF, and the disc is the rigid body. The original idea was to divide the friction pads. Since the pads are MNF, pseudo-discretization of the pads required us to create sub-MNFs to be coupled within the multi-body simulation. However, the pad as sum of sub-MNFs did not show the same characteristics in terms of eigenfrequencies and eigenmodes when compared with the undivided friction pad. Because of this finding, pseudo-discretization of the friction pads was rejected. Instead, the pseudo-discretization of the rigid body disc (Figure 5) proved to be successful. Hence, the disc has been divided into four sub-discs, pairwise coupled with a fixed joint at the axis. In this way, the contact surface of the disc could be modelled in a tessellated manner and the contact forces apply on each pseudo-discretized contact patch separately. Without pseudo-discretization, there would only exist one contact force for the entire contact area between pads and disc. The tessellated patches are not directly tied together. For each contact patch, a dedicated friction coefficient has been allocated in a subroutine loop as a function of the contact pressure and the relative velocity between the friction pad and the contact patch on the disc. The subroutine loop accesses the database of coefficients of friction, which were determined within the micro scale tribology modelling as described in Section 2.1. To one of the discs, a fixed rotation as boundary condition has been applied.
While the disc is rotating, the changing allocation of the coefficients of friction may represent the real topological situation with rough surfaces and cause excitation of the brake system. The response of the system is twofold: oscillating movements at the pads (the flexible body) and oscillating contact forces.

2.1.6. FE Virtual Dynamic Modal Analysis

The oscillating contact forces, resulting from the MB simulations, were transferred to a suitable input load data file for the subsequent modal dynamic analysis. The modal dynamic simulation uses the static model from the modal analysis; however, the MBS results relate to the MBS model and not to the FE model. Hence, a Python script was developed to allocate the MBS results (oscillating contact forces) to the FE nodes of the pad and disc of the FE modal dynamic model. Figure 6 shows the scripted flow to generate the load file for the FE modal dynamic simulation. Inputs are the MBS results and the node element information of the brake contact area.
In this way, the oscillating contact forces excited eigenmodes of the disc, which could be compared with experimental values.

2.2. Experimental Dynamic Modal Analysis on a Test Bench

The validation of the computed eigenfrequencies requires the experimental measurements of the eigenfrequencies of the brake system in operation. The system parts (disc, pads, and caliper) were mounted on a test bench at IPEK—Institute of Product Engineering. The brake disc was implemented in the tests bench’s drive. The caliper with both pads was bolted to the test bed below the brake disc. The entire drive system comprised a power unit, a torque meter, the brake disc, and a flywheel mass. The tests have been conducted at room temperature and humidity.
As initial test procedure, a constant brake pressure line between 4 bar and 8 bar and constant speeds between 10 km/h and 30 km/h were applied. Since no squealing was hearable or measurable, known stimulating methods, such as applying water to the disc, were unsuccessfully tried. However, the next attempt was a change of the loads. A sinusoidal pressure signal was applied and the drive power set constant. The result was a brake disc, which increased and decreased speed according to the frequency of the pressure signal (0.5 Hz). With these boundary conditions, the brake squealed within the increases and decreases of the rotational velocities. Simultaneously, the measuring of the oscillations was conducted with a PSV500 (Polytec GmbH, Waldbronn, Germany). Since the laser vibrometer comprises the optical measurement of the surface velocities, it must target an area onto the brake disc. In contrast to the experimental static modal analysis, the entire brake disc surface was not available, because some parts were hidden behind the shaft or the brake caliper (Figure 7). The measurement was conducted on a ring section on the disc. Figure 7 shows the experimental set up on the test bench. The green laser dot on the brake disc is the current measuring point of the laser vibrometer. The brake caliper was mounted below the shaft. Before the test runs, the disc was heated up by the testing load cycles to 150 °C. After two further test runs, the disc heated up to approx. 250 °C.

3. Results

The following sections present the results of the applied method (Figure 1). The start is the computation of the velocity and pressure dependent coefficients of friction by FE computations. These values are implemented in the MB model with the pseudo-discretized contact. The excitation, arising from this contact, is transferred to an FE modal analysis for computing frequencies. These frequencies are compared to the experimental measured values.

3.1. Finite Element Coefficient of Friction Computation

For the FE friction and wear simulation, the surfaces of the brake disc and the pad were scanned by a white light interferometer. Figure 8a depicts the real surface topography of the brake disc. Clearly visible are manufacturing marks and outbreaks, which result from the final turning process of the brake disc. Figure 8b depicts the surface of the brake pad. No clear structure is visible. Plateau shaped forms lie distributed within the entire surface. These forms are solid particles in the mixture of materials in the brake pad. The ingredients are kept together by resin. Both surfaces were transferred to solid parts, meshed, and assembled for the computation of the coefficients of friction.
During the simulation, both parts are pressed together, and the surface nodes are exposed to wear during sliding. Figure 9a shows the surface of the stationary part (brake pad) in a top view. In the left column, the surface after the first iteration has a respectively low number of contact spots. The maximum occurring wear in the entire simulation is 0.0074 µm. This wear is the distance by which a node is shifted to represent the wear after an iteration. The lower zoom-in figure shows asperities with contacts. In the right column, after 200 iterations more contact spots are visible. Below this, the zoom-in illustrates that the asperity’s heights have been strongly reduced in comparison to their heights in Figure 9c. The maximum wear, i.e., the maximum shifted distance of one surface node, was 6.115 µm. Remarkably more wear areas are visible, which correspond to the increasing real contact area.
The computations have been conducted with three different pressures and three different velocities. In comparison to the pressure dependence, different velocities turn out to have a smaller influence on the friction and wear behavior. Due to the depiction of the real surfaces of both parts, the real contact area differs from the nominal contact area. The graph in Figure 10a describes the evolution of the real contact area with an increasing sliding distance and increasing contact pressure. The pressures have been chosen in accordance with the real system and describe the pressure between disc and pad. At the beginning, with a contact pressure of 1 MPa, the real contact area is ca. 3%. The real contact areas for 2 MPa and 3 MPa are respectively larger. Due to the computed wear at the surface nodes, both surfaces flatten; as a consequence, the real contact area increases. Whereas, when the contact area increases about 2% at 1 MPa, a larger increase with higher pressures is observed.
As the computed wear is subtracted from the surface nodes, both parts approximate to each other during the simulation. The wear depth is the approximation of the average surface height of both bodies towards the beginning of the simulation. The graph in Figure 10b shows that, with a sliding distance of about 10,000 µm, both bodies approximate about 0.7 µm. Although the pressure difference is visible in the evolution of the real contact area, the pressure dependence is not noticeable in the evolution of the wear depth.
Figure 10c presents the evolution of the coefficient of friction. Since a critical shear stress is used as friction condition between both parts, the coefficient of friction is computed as the quotient of the summed-up shear and normal forces at the surface nodes. The coefficient of friction increases with increasing sliding distance. At the beginning, the difference between different pressures is approx. 0.05; however, it increases with the sliding distance to 0.1.
The last graph depicts the evaluation of the coefficients of friction. The x axis shows the contact pressure and the y axis the coefficient of friction. The lowest (blue) line presents the resulting coefficients of friction after a sliding distance of about 300 µm, the second line after 5000 µm and the upper line after about 10,000 µm sliding distance. All curves show that, with increasing pressure, the coefficients of friction slightly increase. A larger influence is given by the sliding distance, which strongly correlates with the real contact area. These three curves and the corresponding curve from the velocity variation represent the basis for the determination of the friction condition for the multi-body simulation. Thus, these values have been used to create the diagram in Figure 11.
This approach facilitates the computation of the coefficients of friction for the brake pad–disc system by using a micro scale FE model. The resulting values of the coefficient of friction refer to a specific brake pressure and velocity. These values are used as friction condition for brake disc–pad contact in the MB simulation.

3.2. Multi-Body-Simulation with Distributed Contact

Multi-body simulations have been executed with regard to the operating points, as described in Section 2.1.5. Due to the variation of the coefficients of friction as described in Section 2.1.2, the resulting friction forces triggered periodic movements of the pads, which were the flexible bodies in this contact pairing. Monitoring the center of gravity of the pads, there is an oscillation tangential to the rotation (X-direction, c.f. Figure 12). Further, the oscillation of the normal contact forces (the forces in the direction normal to the contact planes, Y-direction) have been monitored. The oscillation of the pads is not directly correlated to the oscillation of the normal contact forces. It is the stiffness of the caliper which determines the oscillation.
The computations are conducted for nine operation points with pressures between p 1 = 1   MPa and p 3 = 3   MPa and velocities between ω 1 = 8.5   rad / s and ω 3 = 12.0   rad / s . Since most of the results differ in their absolute values, the following evaluation concentrates on the operation points with the lowest and highest loads.
Figure 13 shows the oscillation of both pads (continuous and discontinuous) at the operation point p 1 = 1   MPa , ω 1 = 8.5   rad / s , which are in phase. Obviously, while braking, the oscillation is damped. Figure 14 shows the normal contact forces of the pseudo-discretized patches on the ridged disc. Only one side of the disc is displayed. The four colors represent the tessellated patches of the four sub discs (Figure 5). The contact forces act as soon as the pad covers the patch. They accumulate for each sub disc while the patches are passing the pad. The phase shift between the single patch signals is due to the rotation.
At operation point p3 = 3 MPa, ω3 = 12.0 rad/s altered behavior can be observed. The amplitude of the pad oscillation rises with applied pressure and is only partially damped (Figure 15). The oscillation reaches a critically stable mode, which may point to brake squealing. The normal contact forces at operation point 3 are increased due to the higher pressure (Figure 16).

3.3. Experimental and Virtual Static Modal Analysis

3.3.1. Experimental Static Modal Analysis

For the differentiation of the eigenfrequencies, an experimental modal analysis of the brake disc was conducted. The aim of the experiment was to determine if a later-found eigenfrequency belongs to the disc or other parts. The results of the experimental static modal analysis are depicted in Figure 17 and show the eigenfrequencies as spikes.

3.3.2. Dynamic Real Modal Analysis

As described in Section 2.2., the brake system started to squeal in case of a sinusoidal pressure signal. The squeal noise was not continuous; however, it occurred during high gradient pressure changes in a run. A PSV500 laser vibrometer (Polytec GmbH, Waldbronn, Germany) was used to measure the oscillations of the disc. The attending personal at the test bench described a strident noise, which was audible during the decrease of the rotational speed due to an increase of the pressure. The laser vibrometer measured the frequencies on a ring segment on the brake disc. Figure 18 illustrates the two measured resonance frequencies at ~16.6 kHz and ~17.8 kHz. The mode shape at 16.6 kHz.
The surfaces of a new and a used brake pad are displayed in Figure 19. The new brake pad has a rough surface with the multiple ingredients partly targeting out of the surface. The used pad shows that the surface has been worn and partially flattened. The metallic-looking plateaus might be formed by the ingredients of the pad and, since the amount of metallic-looking surface is much larger than at the new pad, formed further by wear particles of the disc. The comparison of the virtually worn and the experimentally worn surface shows differences. The simulation does not yet depict the amount of surface wear, which is visible in the evaluation of the worn brake pad. Moreover, the transfer of material between both bodies is not yet possible with the FE model. Further approaches or different elements are necessary for modelling this transfer.

3.3.3. Virtual Modal Analysis

As described above, the model for the dynamic modal simulation is based on the model for static modal simulation. Therefore, the first steps for contact initialization and tightening the screws had been executed only once in advance to the load cases at the various operation points. After calculating the real and complex eigenmodes, the modal dynamic simulation is executed with the excitation due to oscillating contact forces, the result of MB simulation. The dynamic eigenmodes compare well with the measured values from the experimental static modal analysis (Section 3.3). However, no explicit eigenfrequency was remarkably excited with including the transferred loads from the MB simulation. This means that either the excitation forces are too weak or the influence of the geometry of the parts is too large to be overcome by the hereby computed force excitations.
However, the comparison of the virtual and experimental static modal analysis shows good agreement. The shapes determined in the simulation are found in the experiment, too, as can be seen in Table 1 and Figure 20.
Moreover, the measured frequencies at 16.6 kHz and 17.8 kHz (complex eigenmodes of the complete system) were found in the virtual modal analyses. Especially with the mode shape at 16.6 kHz found on the disk, simulation and experiment show just small deviations as illustrated in Figure 21. A close comparison between the two figures reveals that the circumferential moving mode shape is appearing in the simulation and the experiment.

4. Discussion

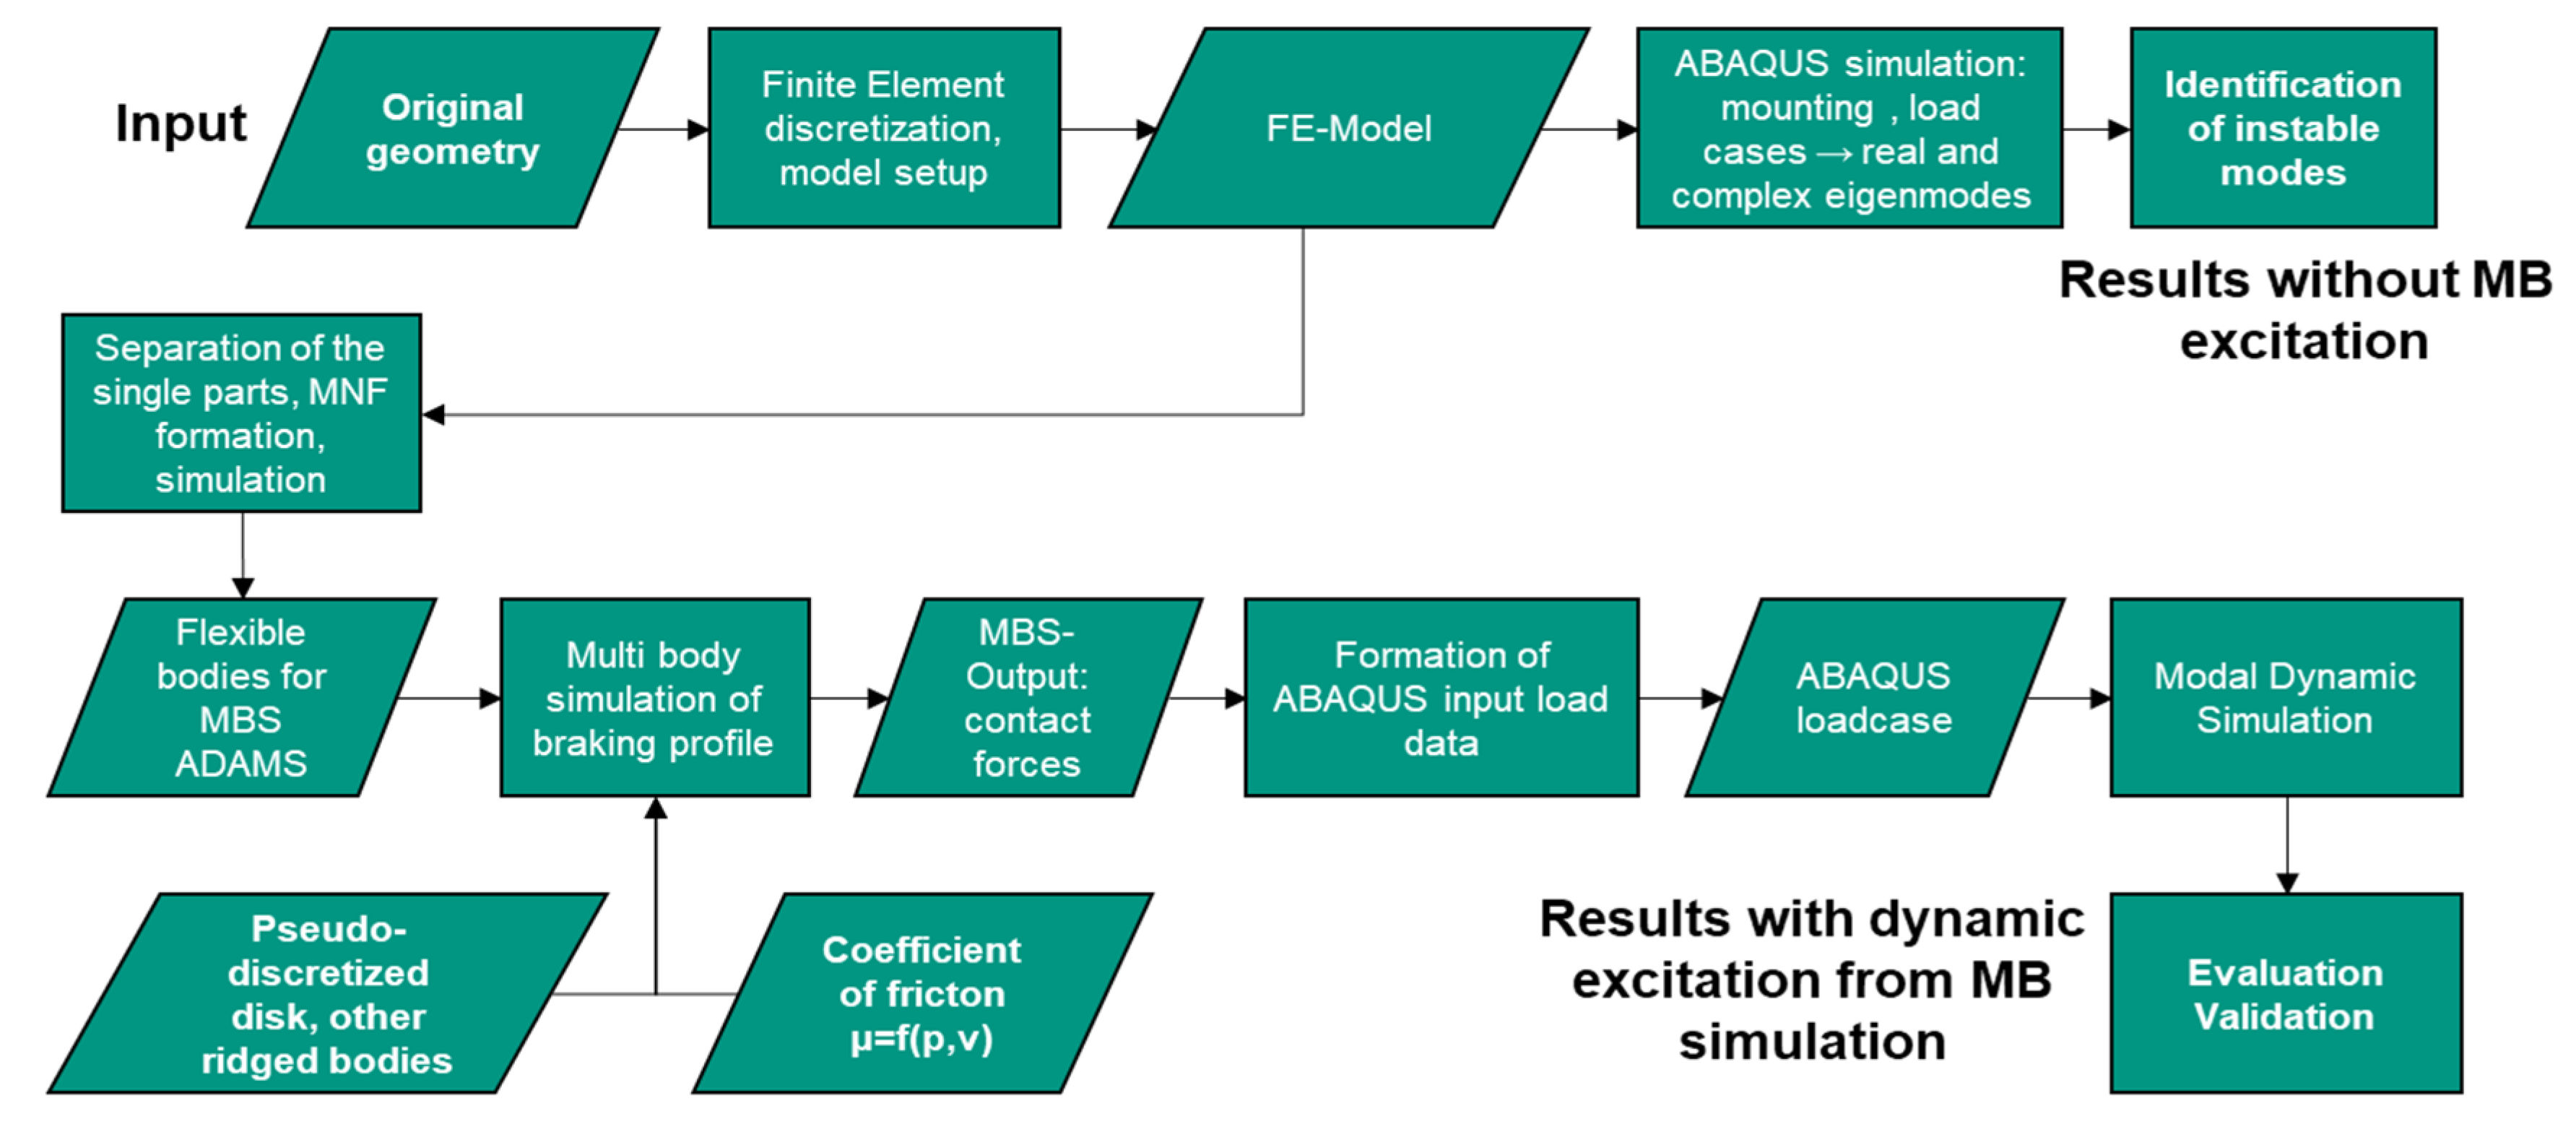
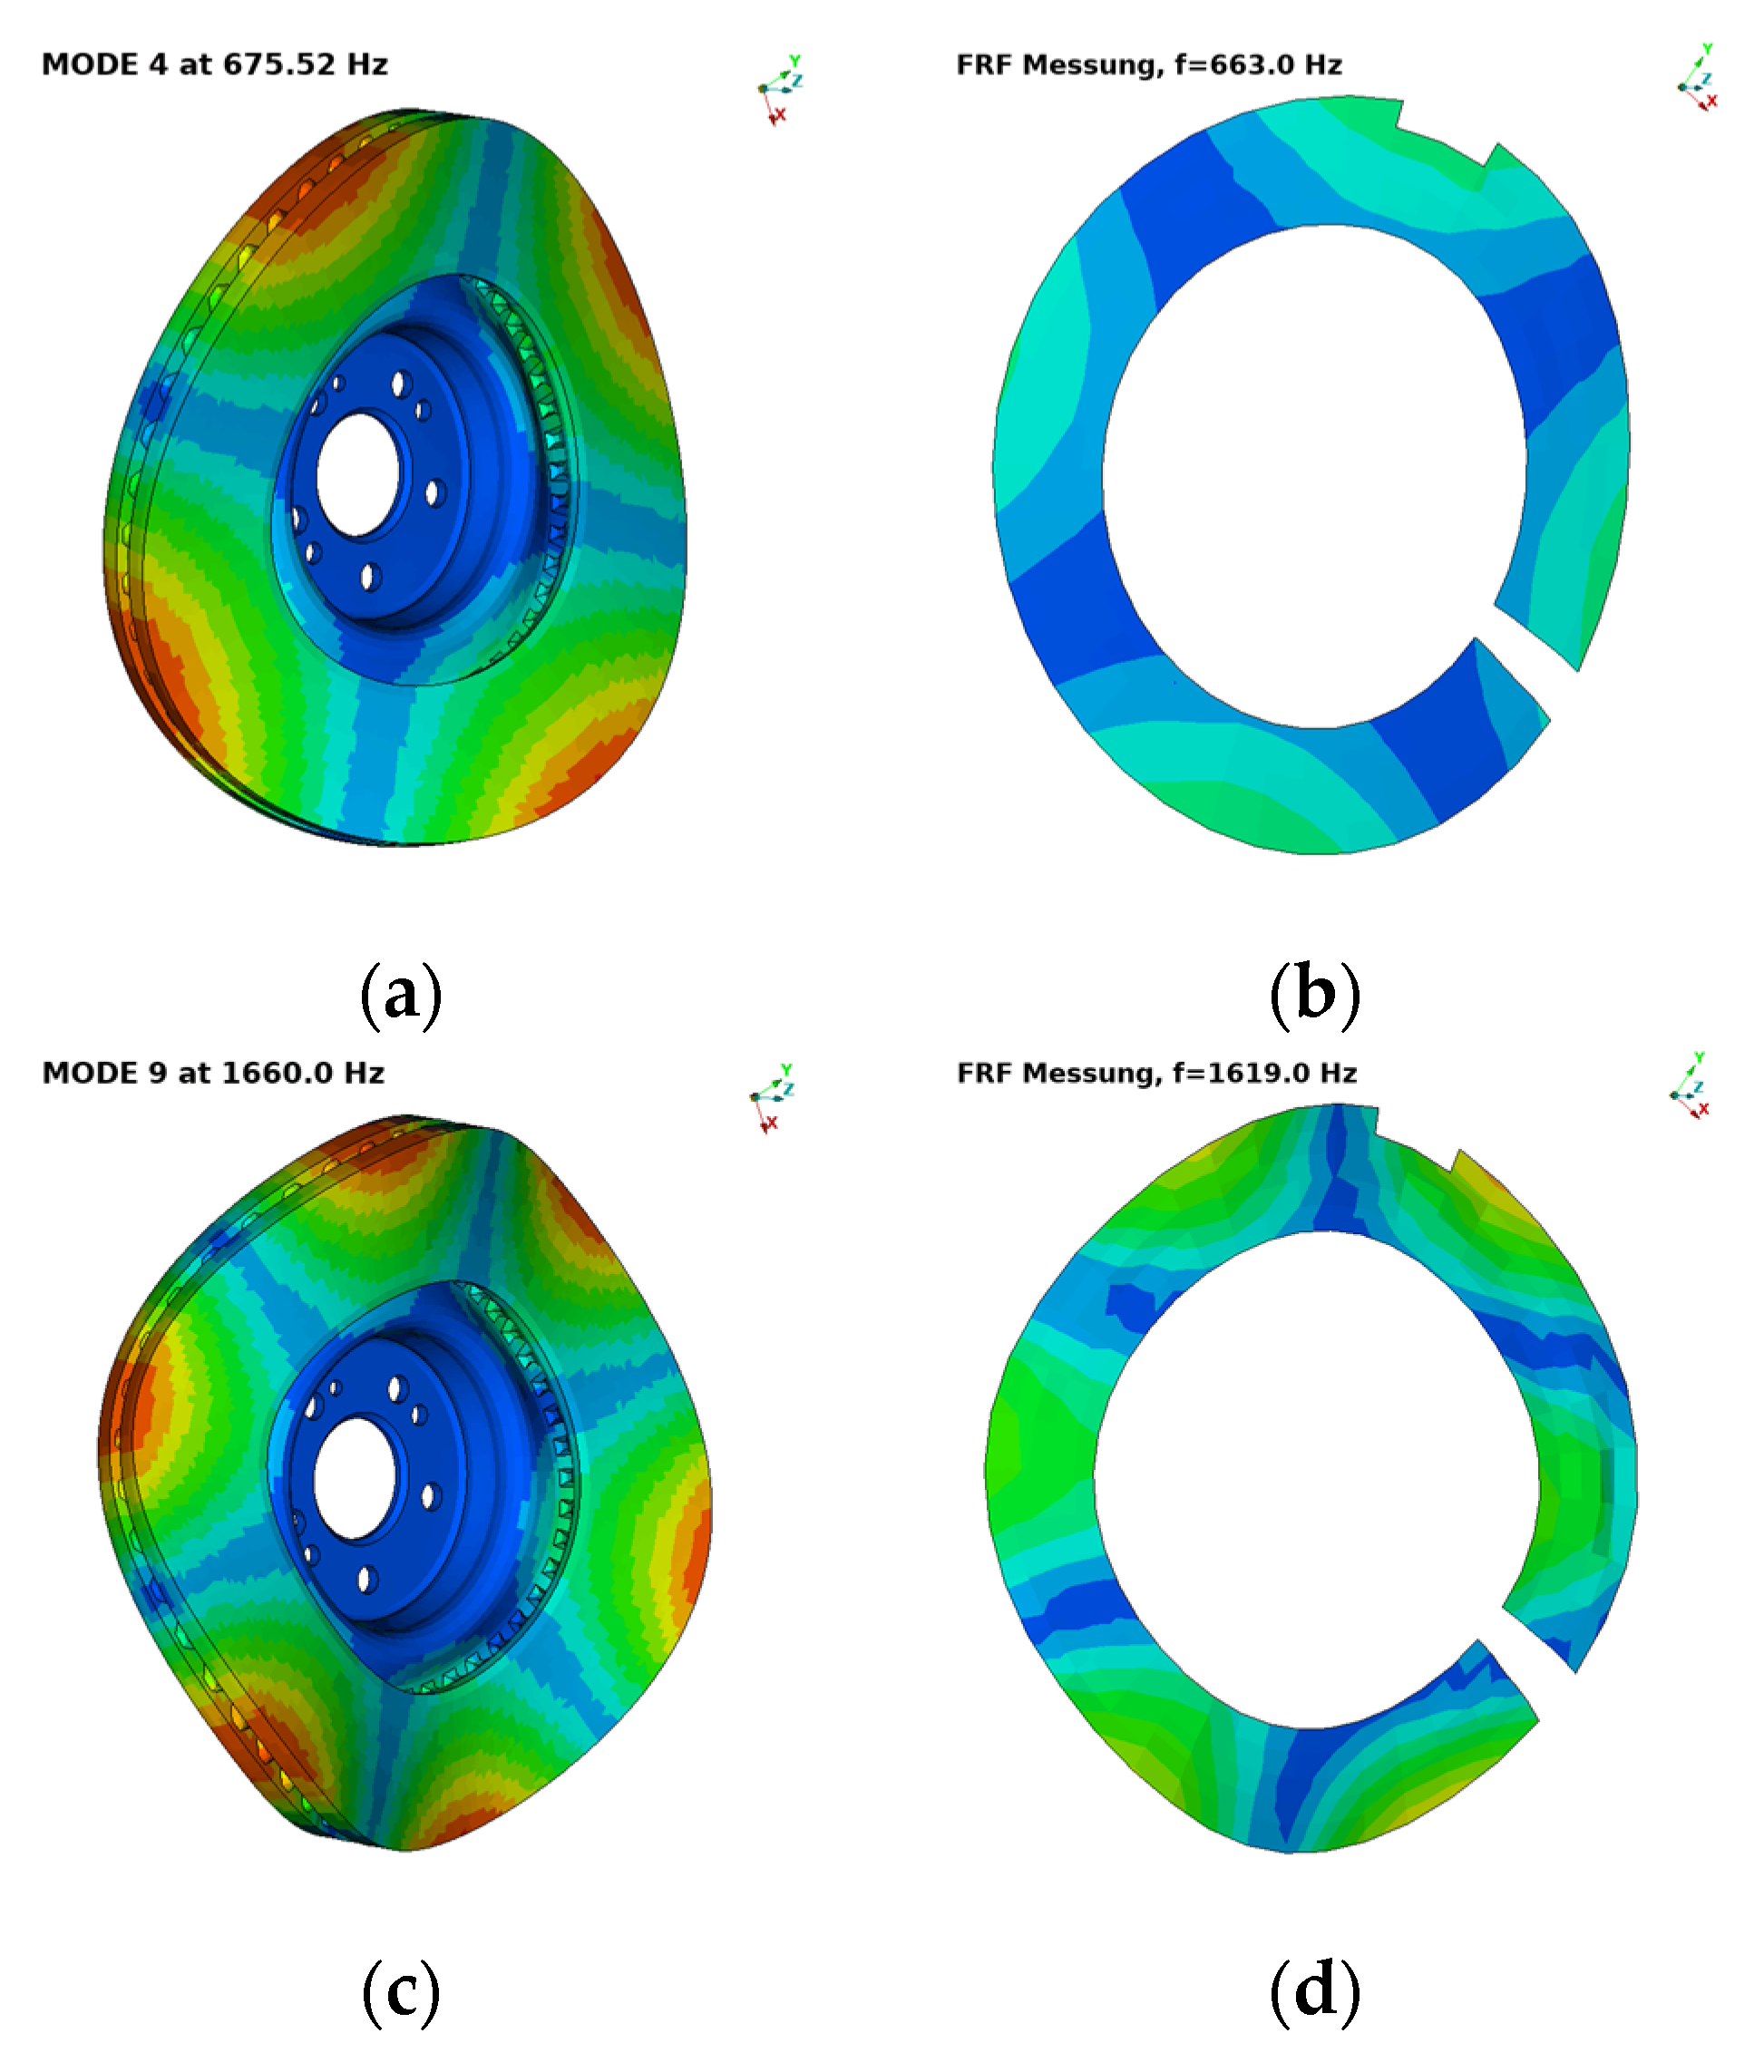
The previous sections present the results of the simulations and experiments. The simulations are conducted stepwise, and the final results are the eigenfrequencies of the loaded brake system. The conducted physical experiments show the difficult process of remodeling real system behavior on a test bench in a laboratory. However, the results of the modal analysis show that brake squealing can be modelled with modal analysis, but the approach presented here offers potential for further research and adaptions.
In the assembly of the FE friction model, the material data for the cast iron brake disc has been implemented as a common stress–strain curve. However, the material model and the material data for the brake pad have been quite challenging. No standards are available for measuring brake pad material, nor for transferring this to finite elements’ material behavior. The mixture of different ingredients of the brake pad material is often a secret of the manufacturer and generally not published. Hence, this parameter must be carefully taken into account in further simulations.
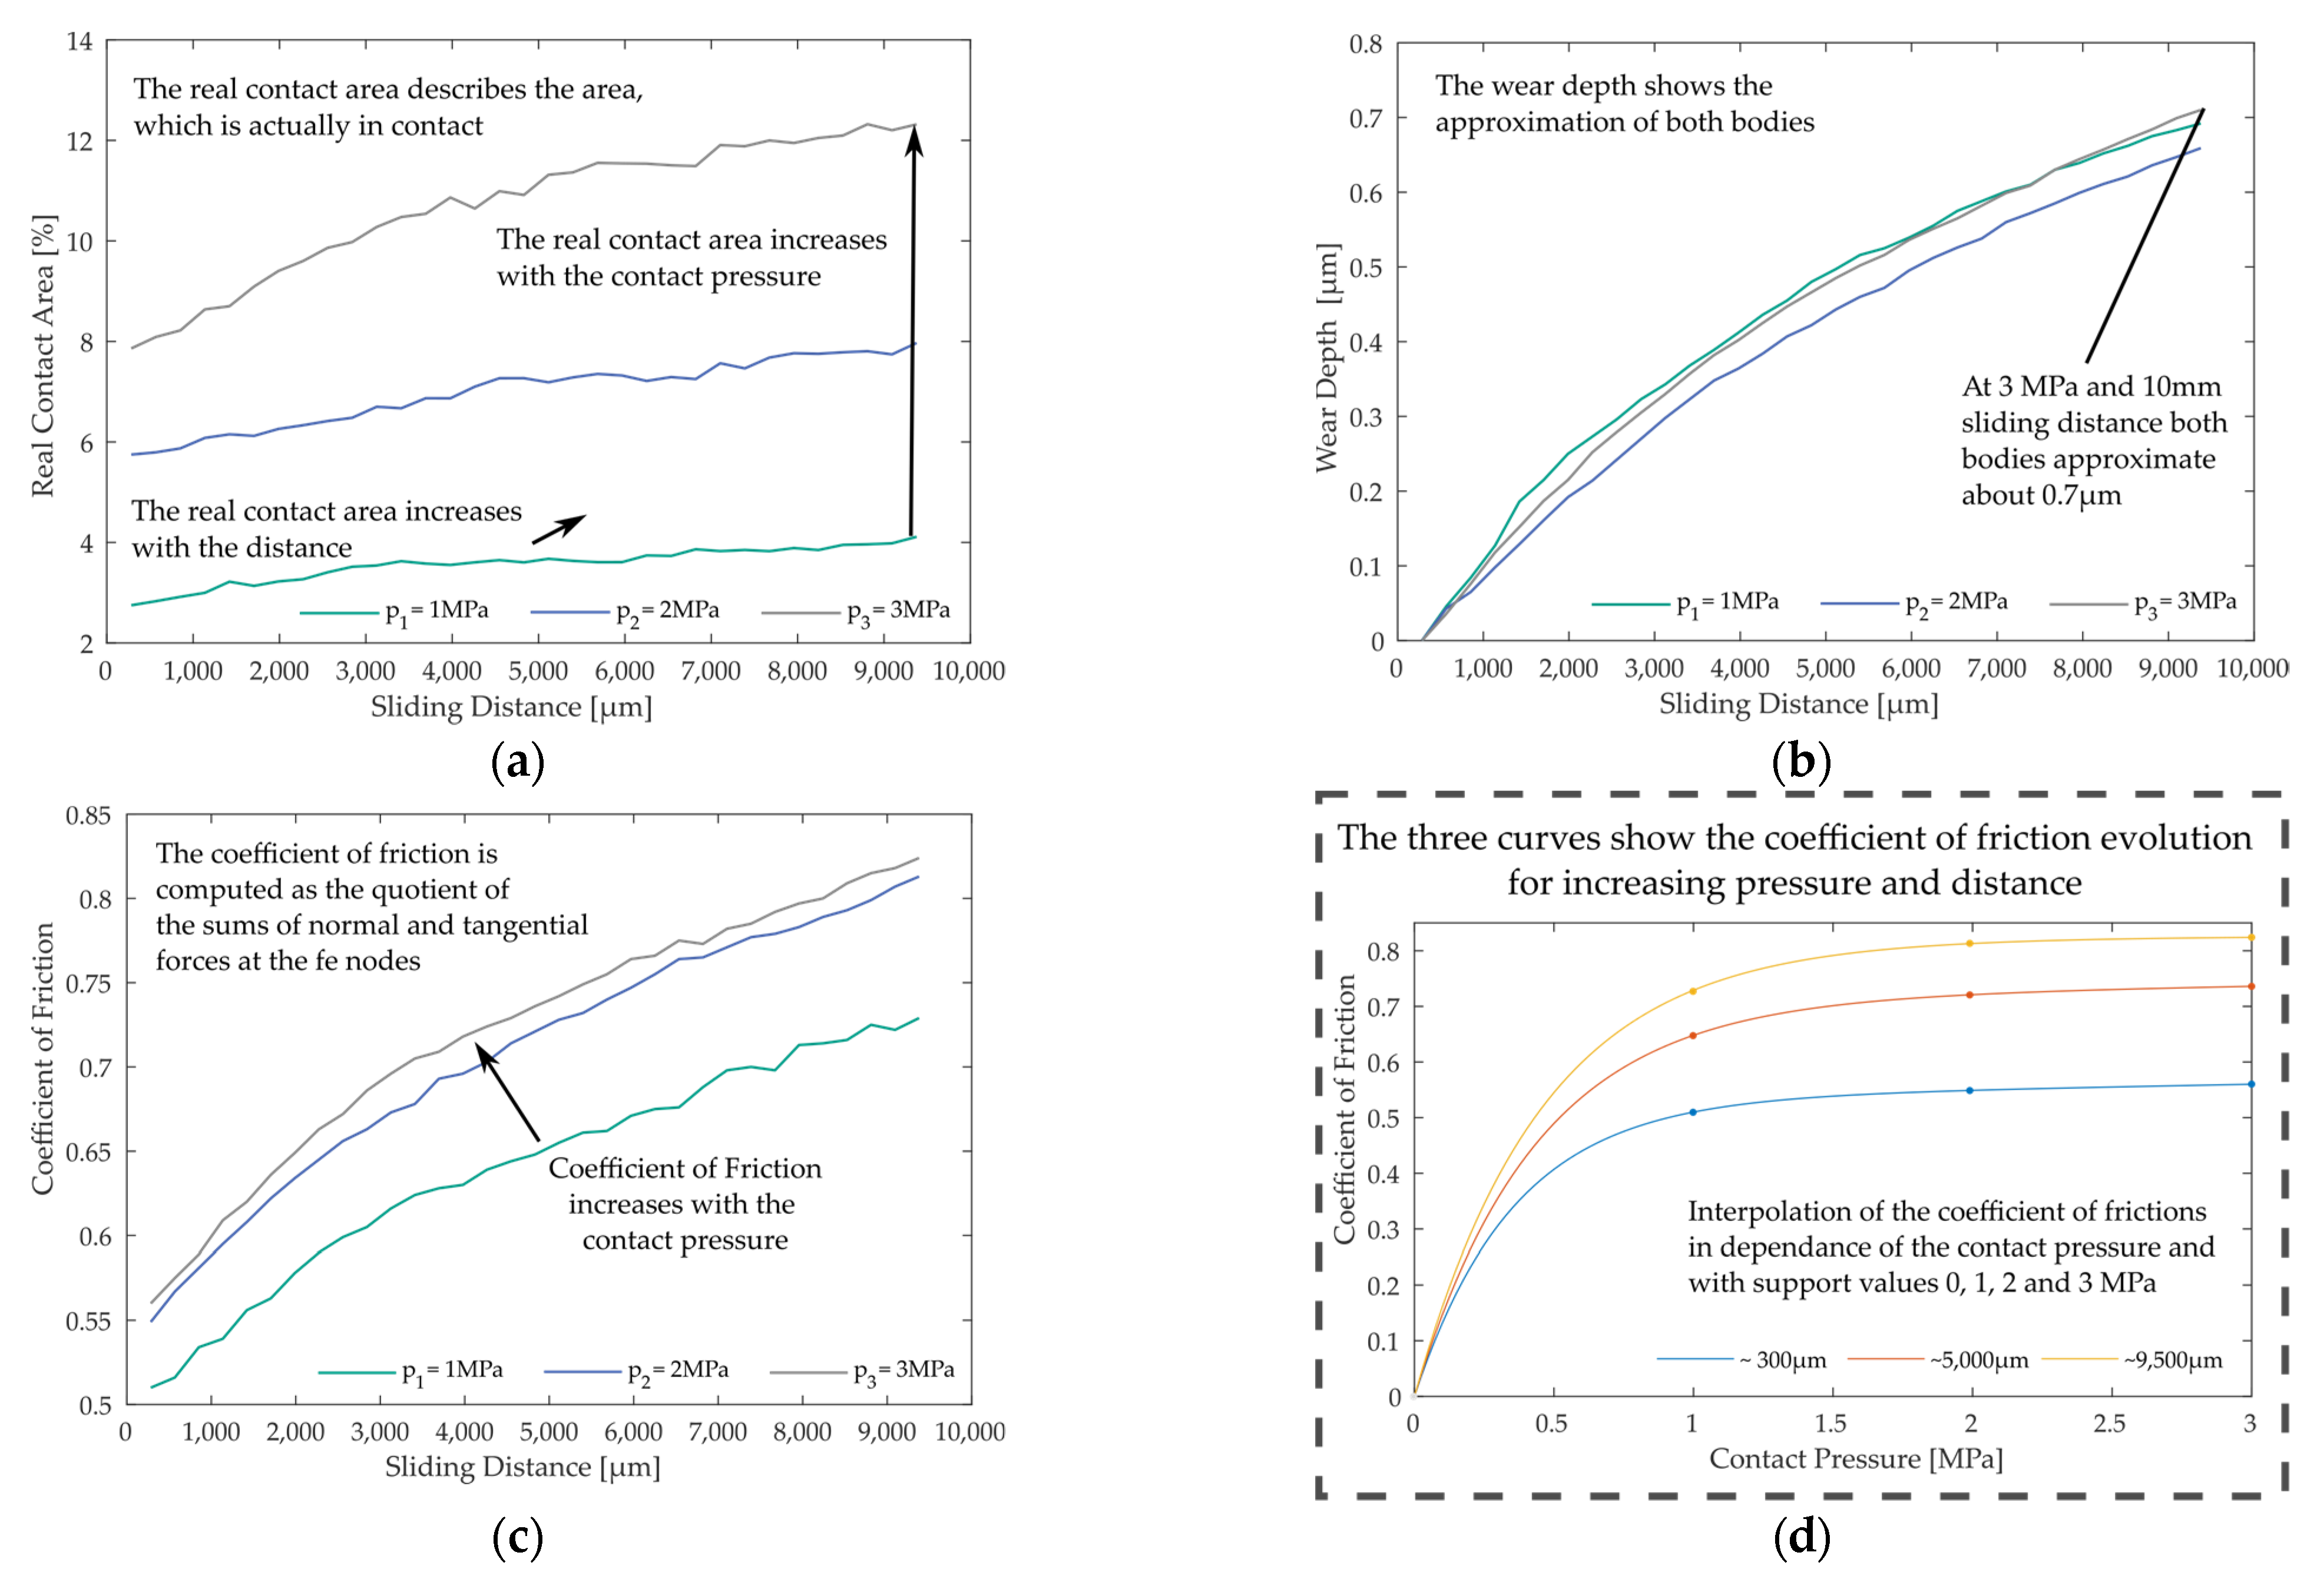
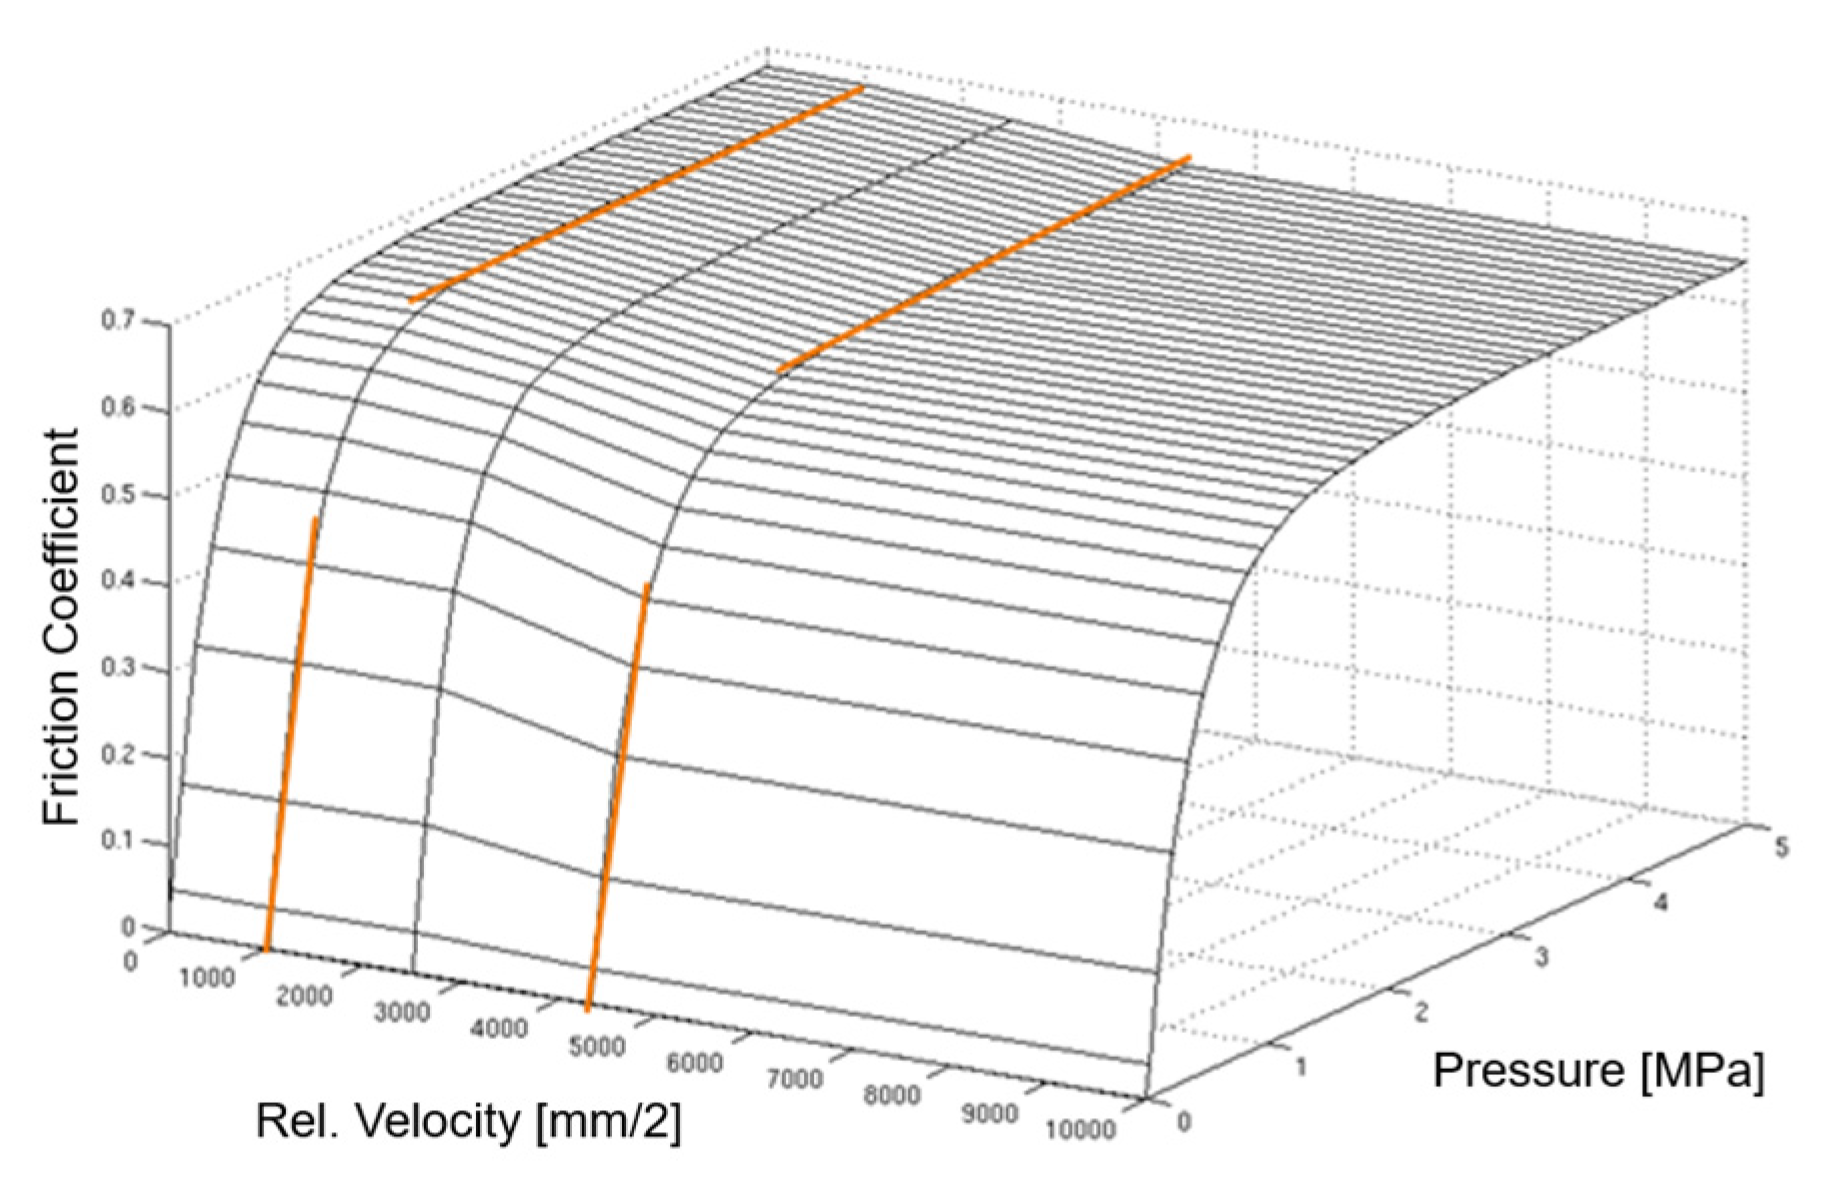
The coefficient of friction as a function of velocity and normal force is computed with the FE friction model. The computation comprises a shear stress limit as friction condition, which predominantly determines the occurring shear stresses. The resulting coefficient of friction lies between 0.4 and 0.6, which is in the upper range of friction for disc brake systems known from the literature. Since the coefficient of friction comprises the constant normal and the shear stress dependent tangential forces, the resulting value is strongly influenced by the shear stress limit. Computations with the same model and a lower shear stress limit follow in a lower coefficient of friction.
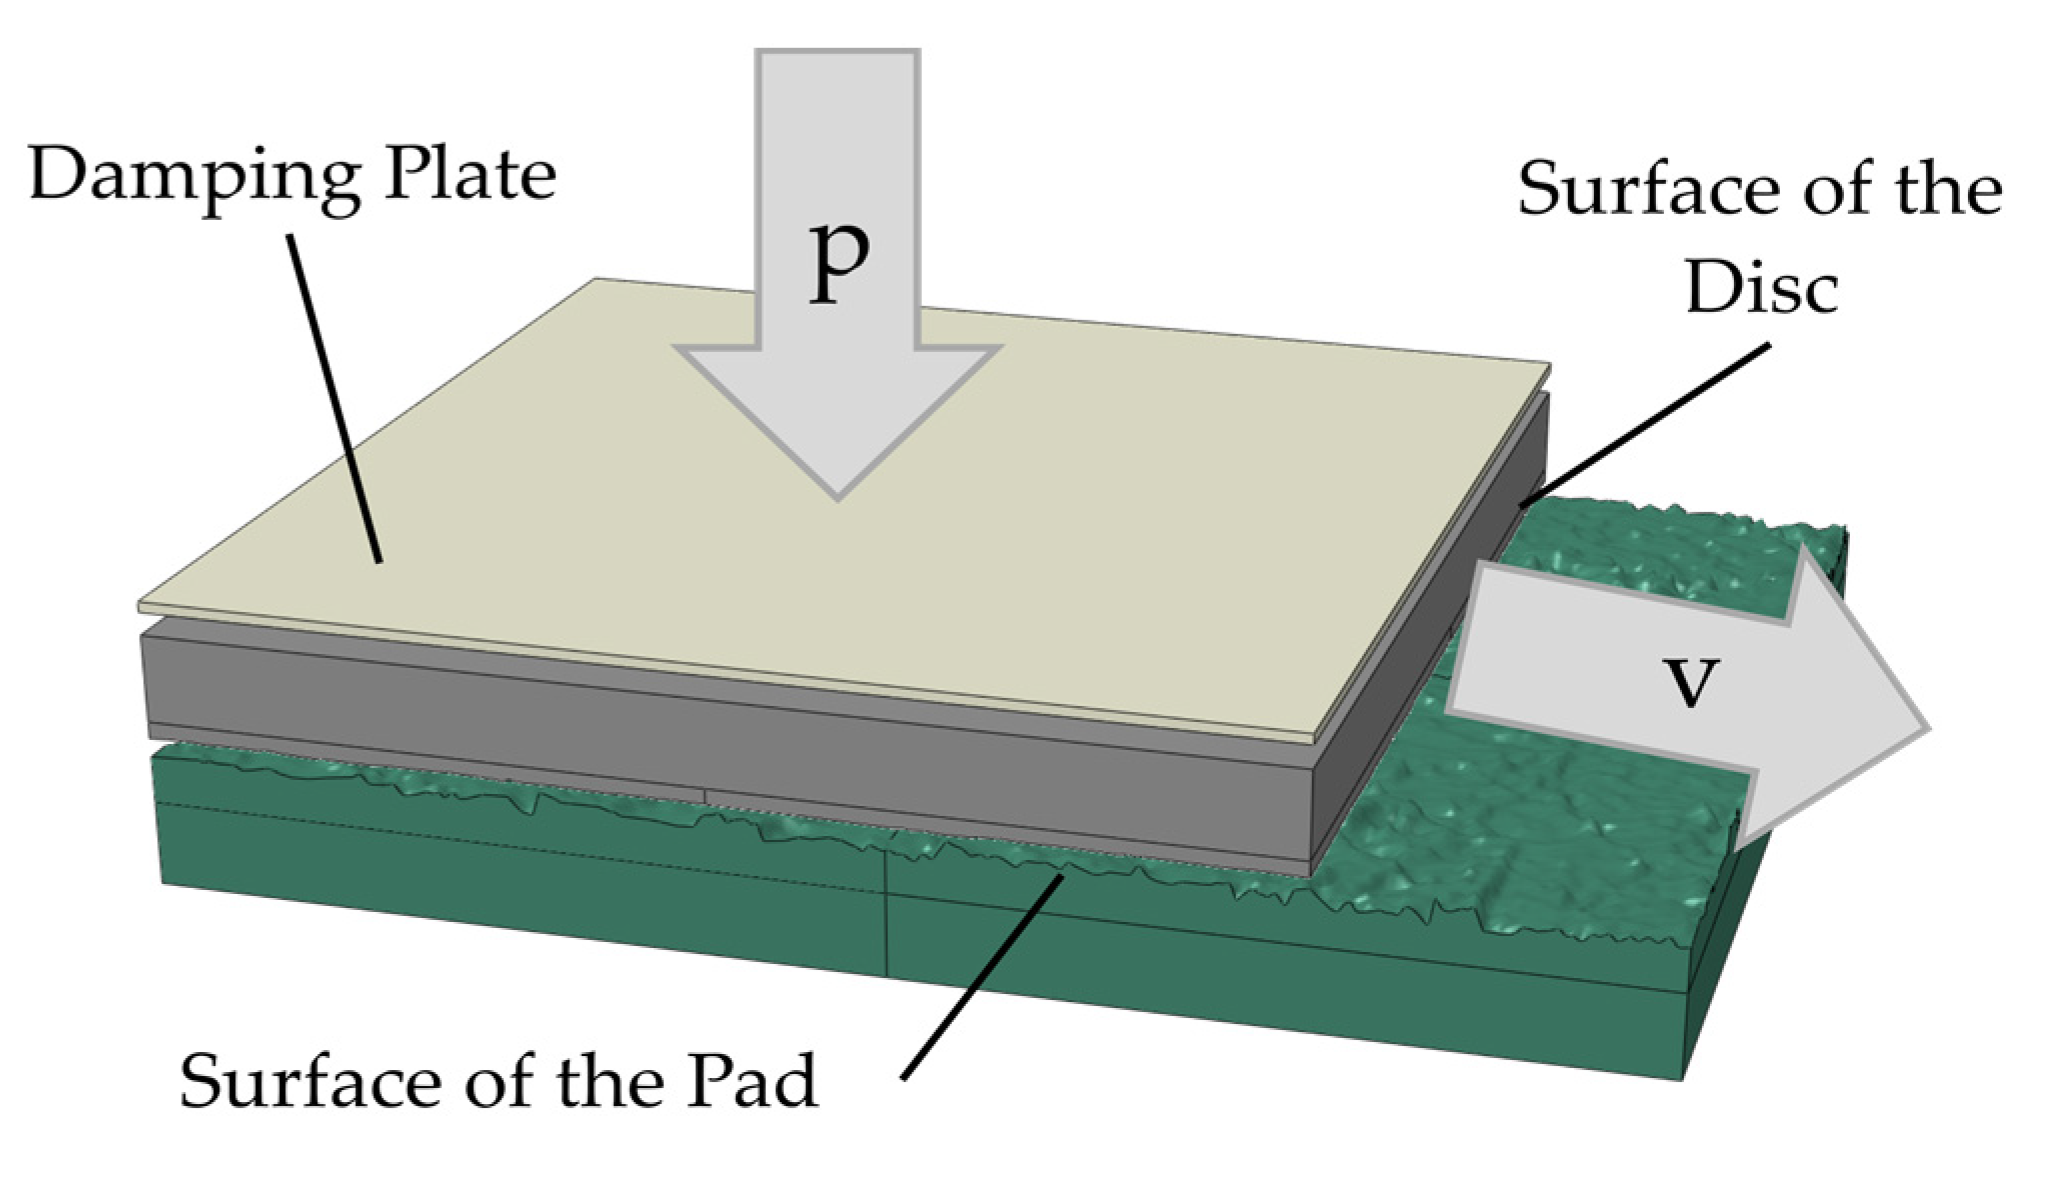
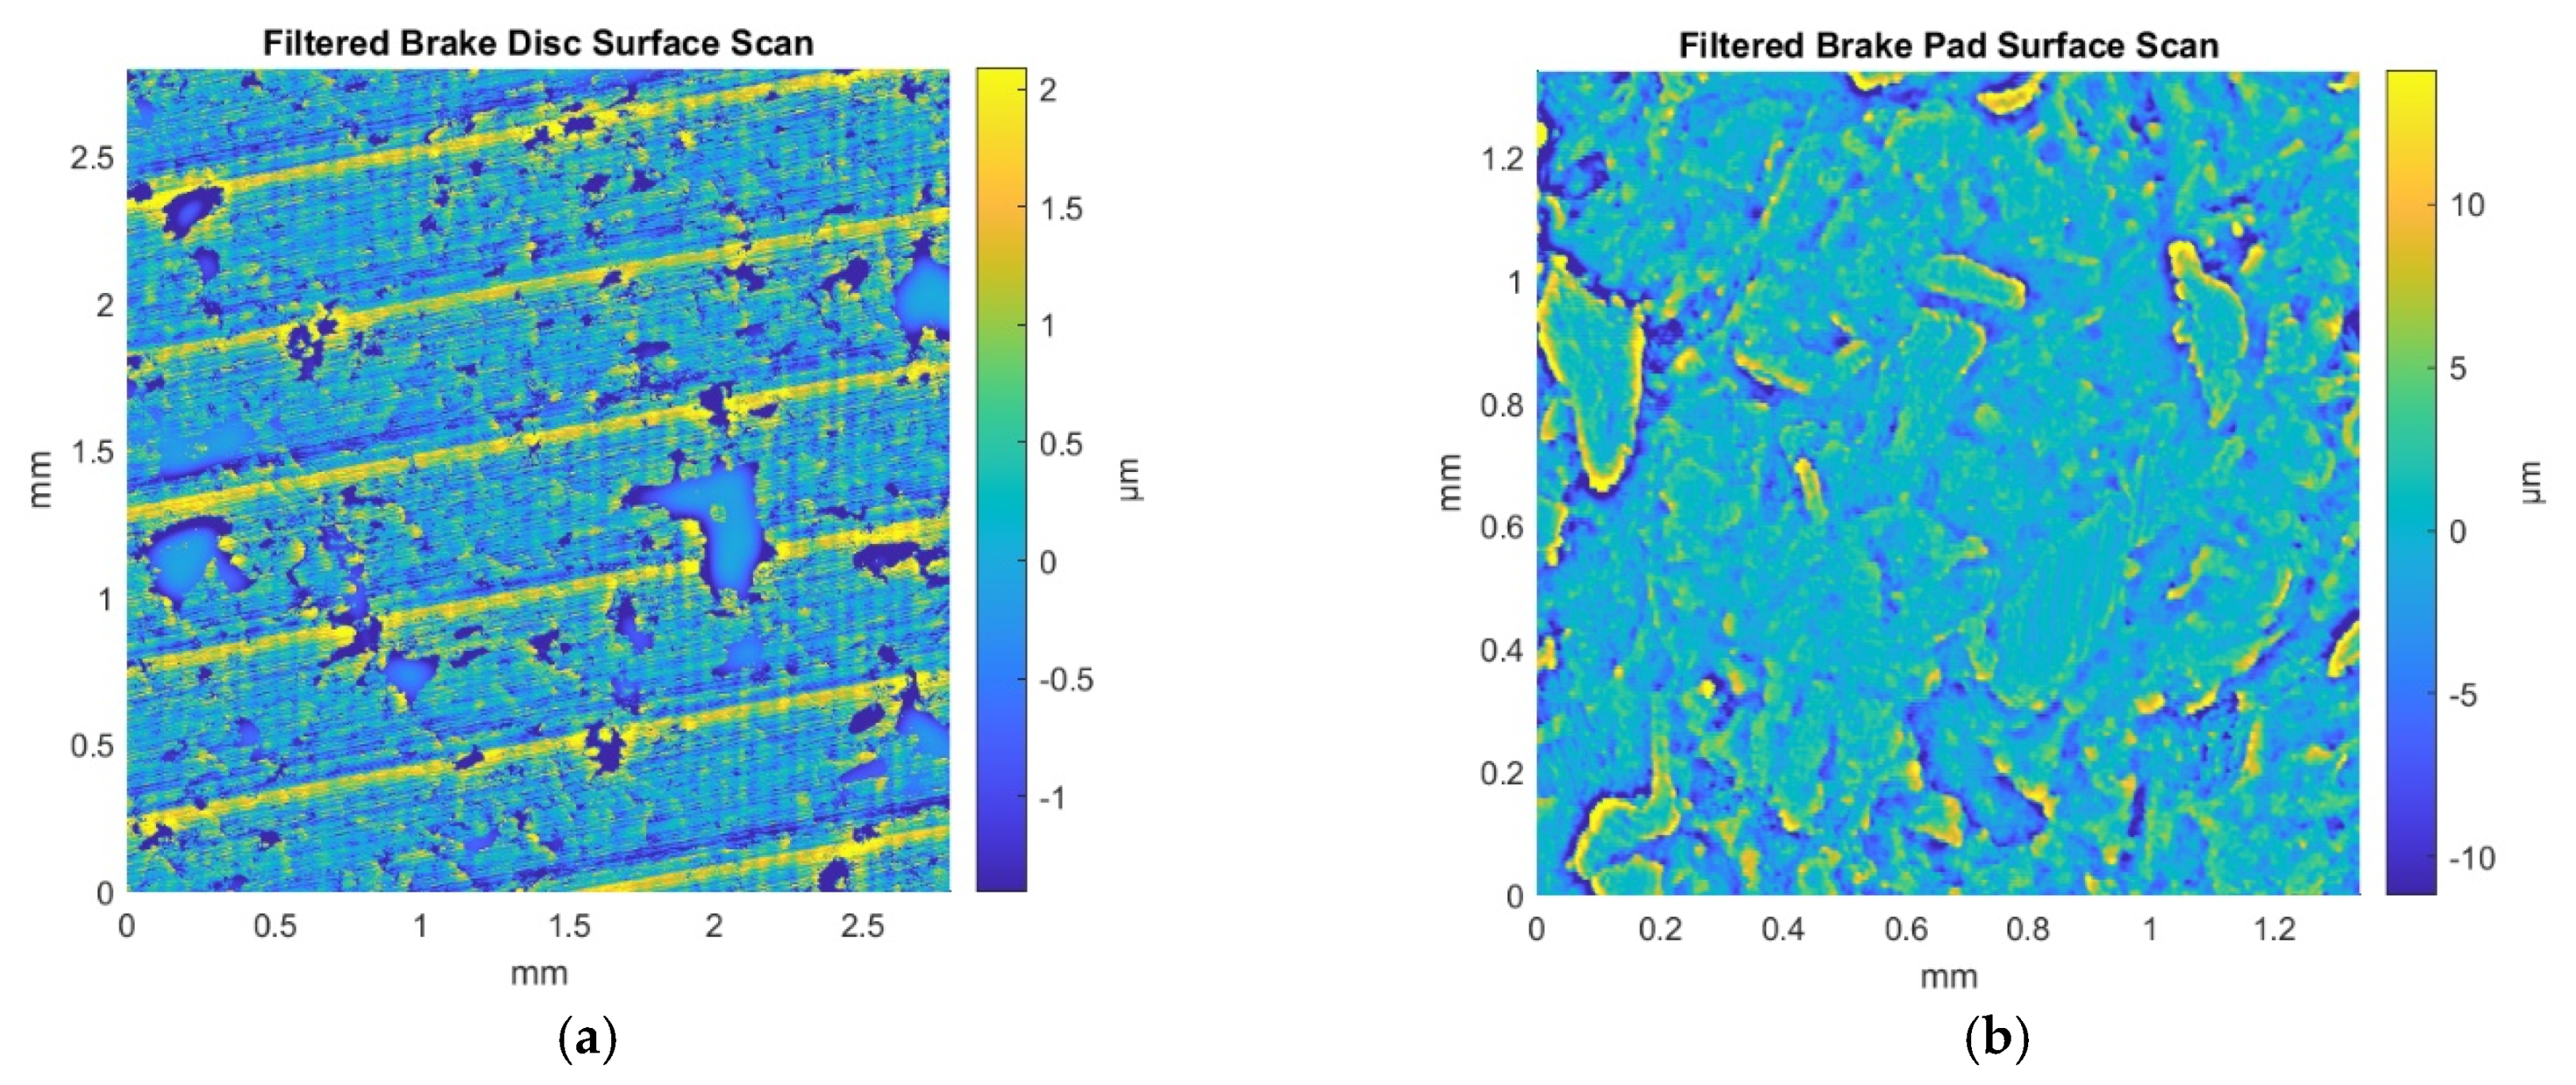
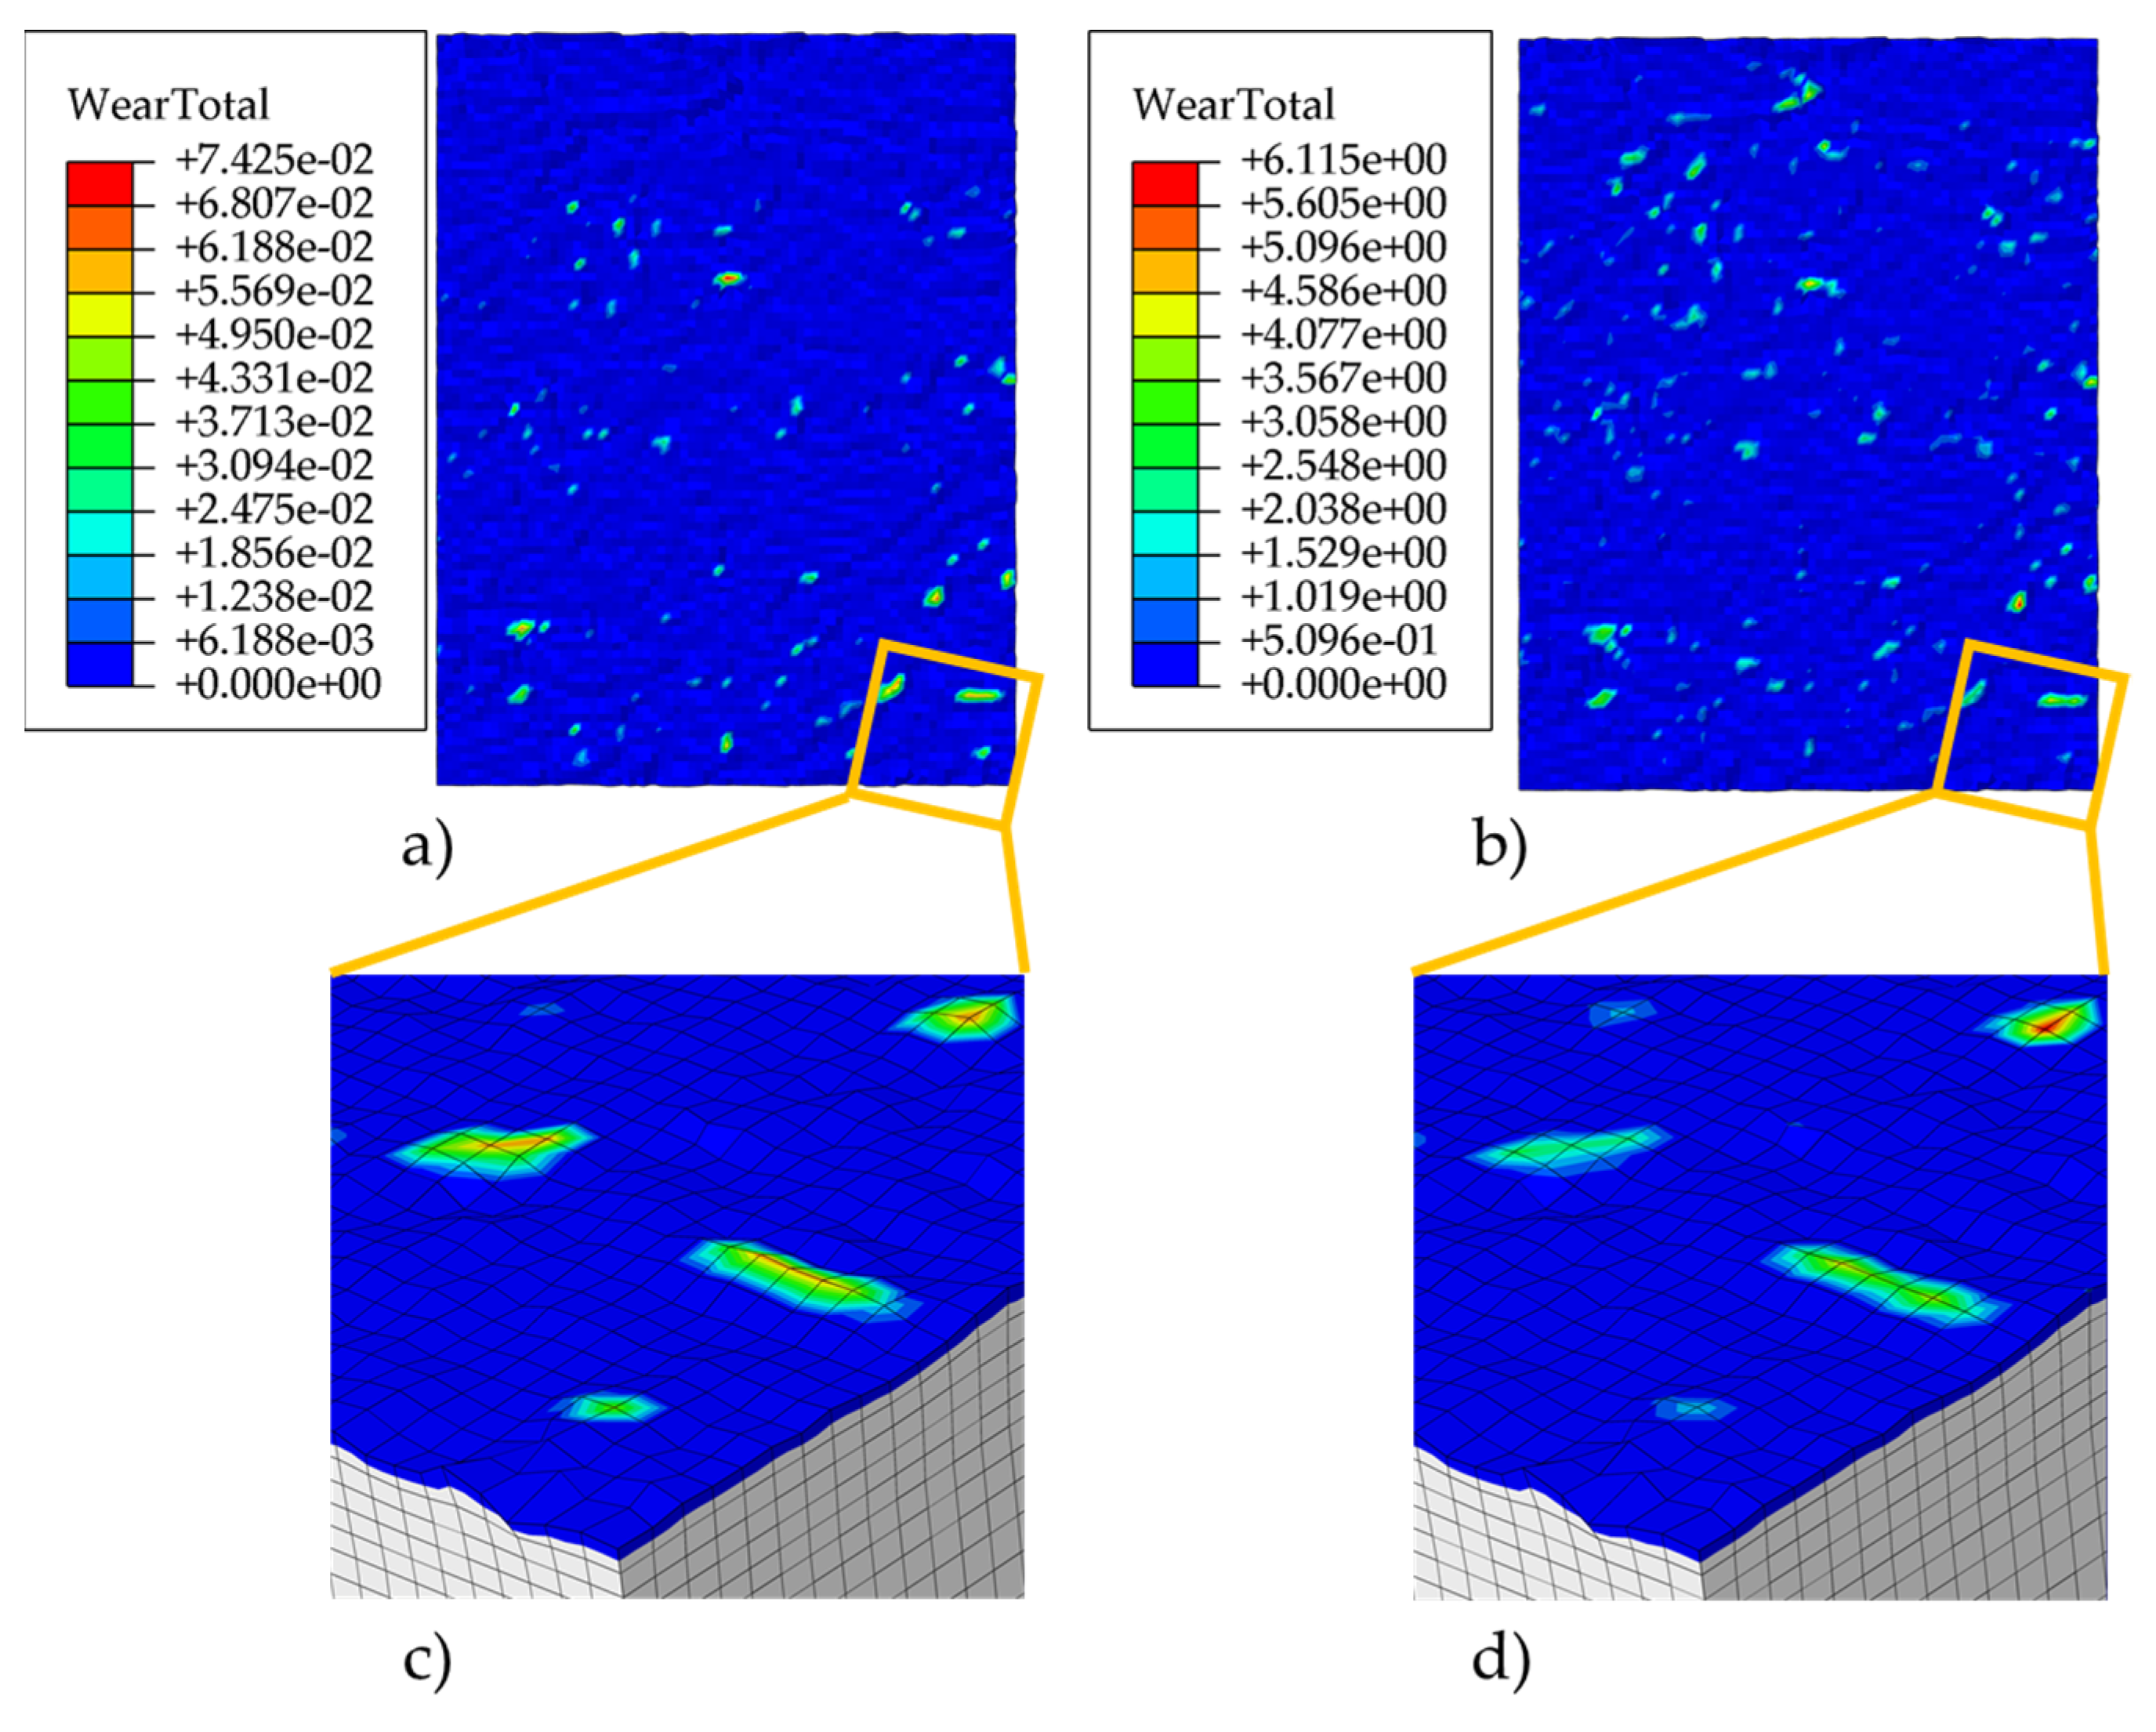
Besides the computation of the coefficient of friction, the FE model depicts the wear evolution by shifting the surface nodes. The distance by which a node is shifted (wear distance) is hereby computed with Archard’s wear law and uses the contact pressure, the wear coefficient, and the shifted distance. Heavily loaded nodes are strongly shifted whereas low loaded nodes are only slightly shifted. This continuous change of the surface topography results in new contact spots throughout the entire simulation and to the flattening of the surface. The results show that low wear appears during the simulation and that the wear is clearly dependent to the applied normal force (contact pressure). In further research, the evolution of the change of the surface topography can be assessed by, e.g., the roughness values or power spectrums.
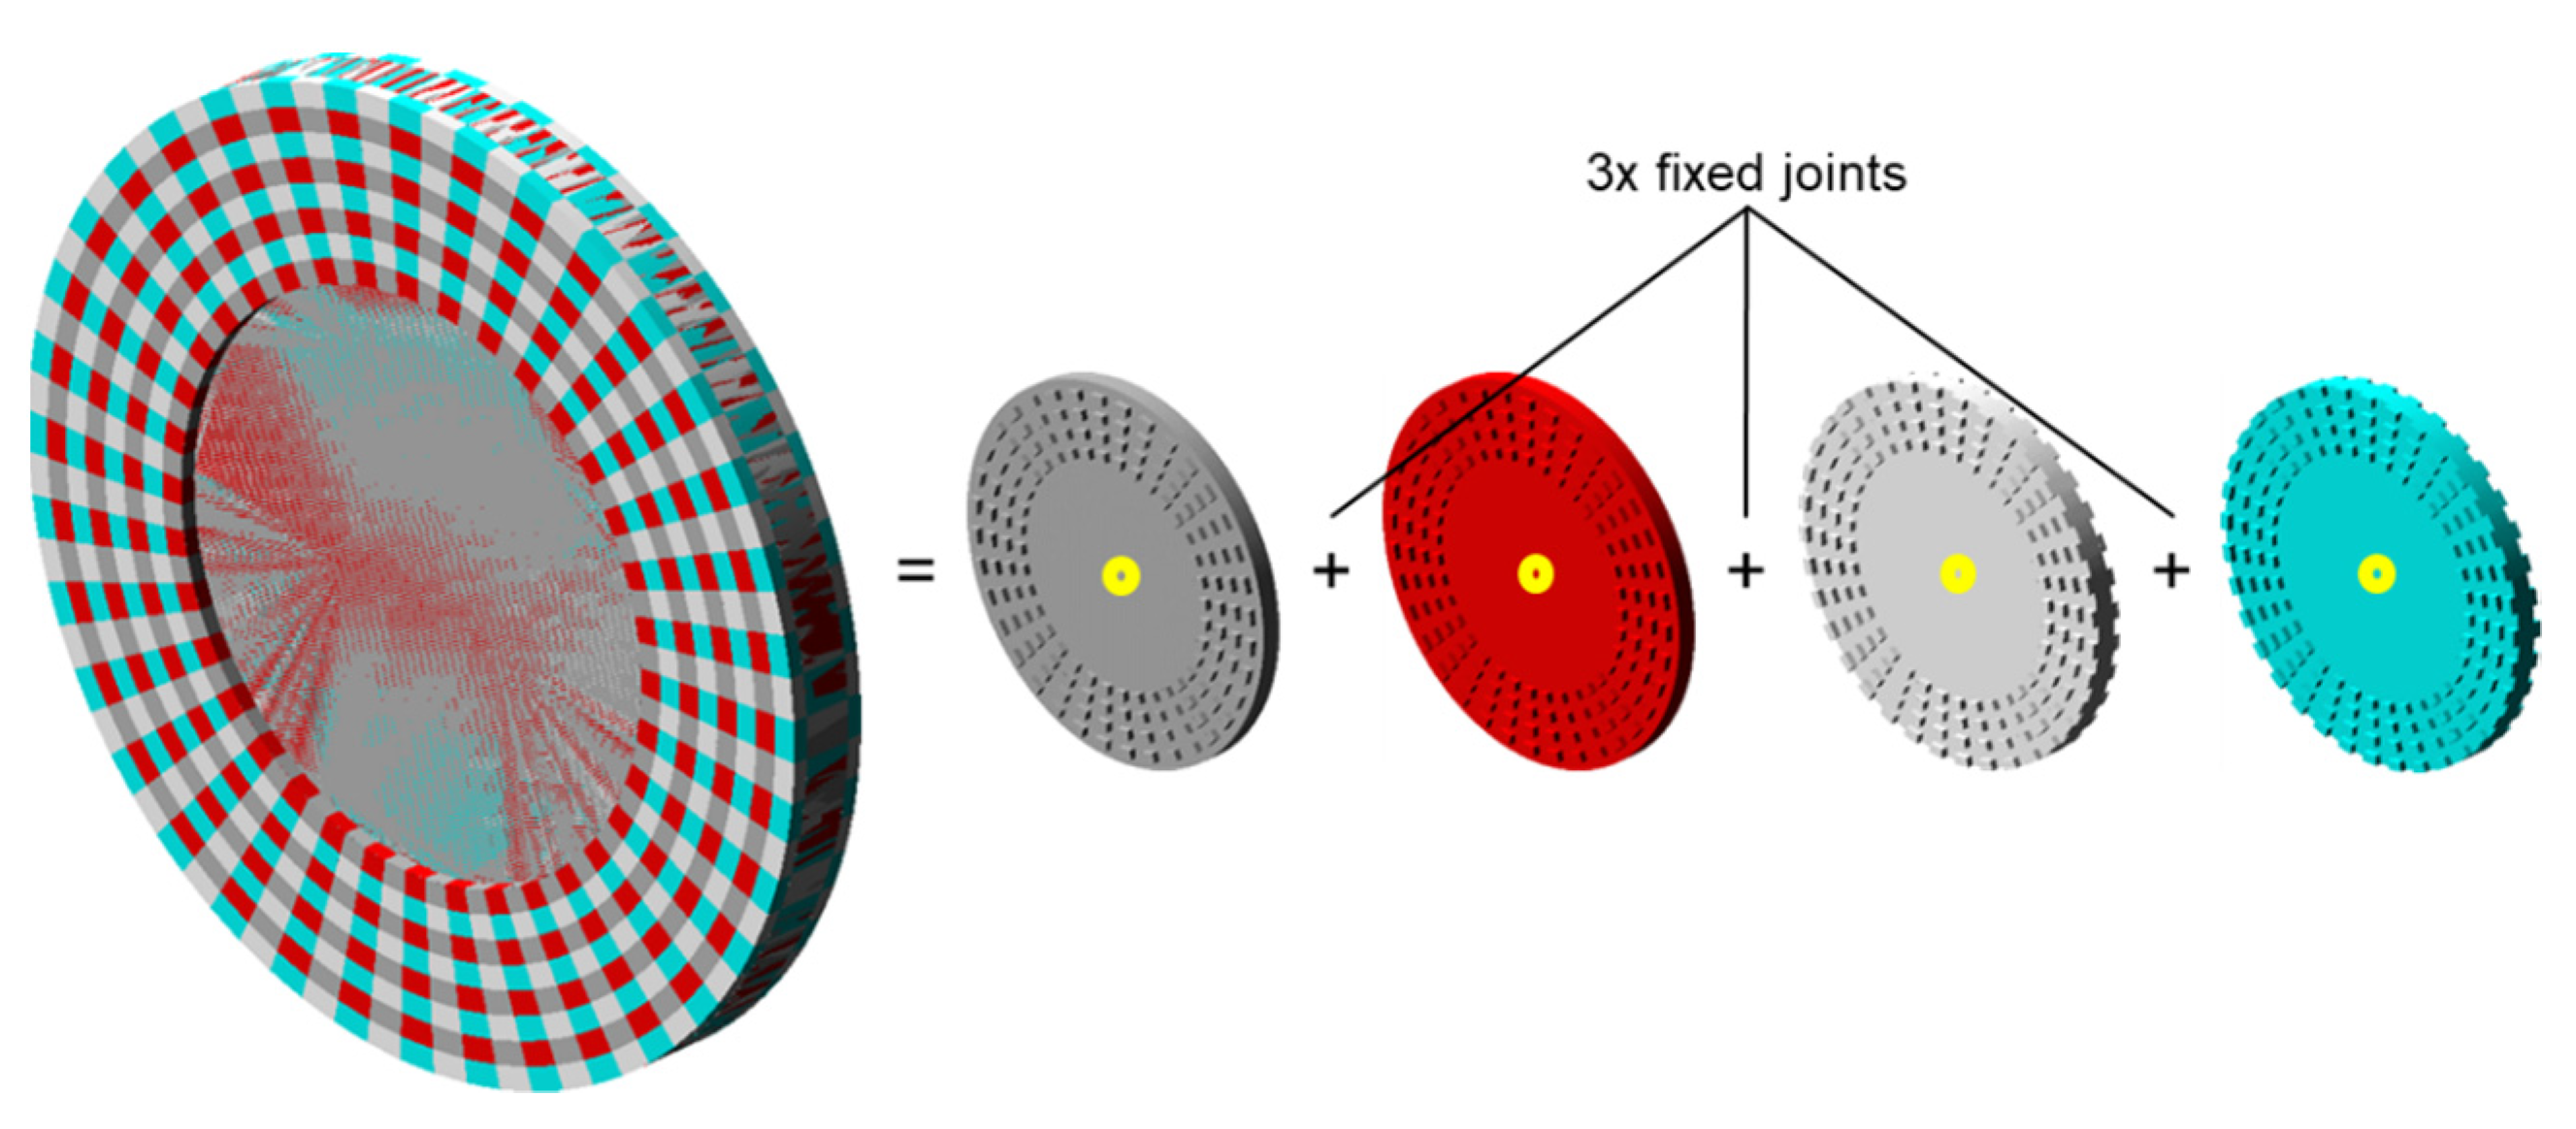
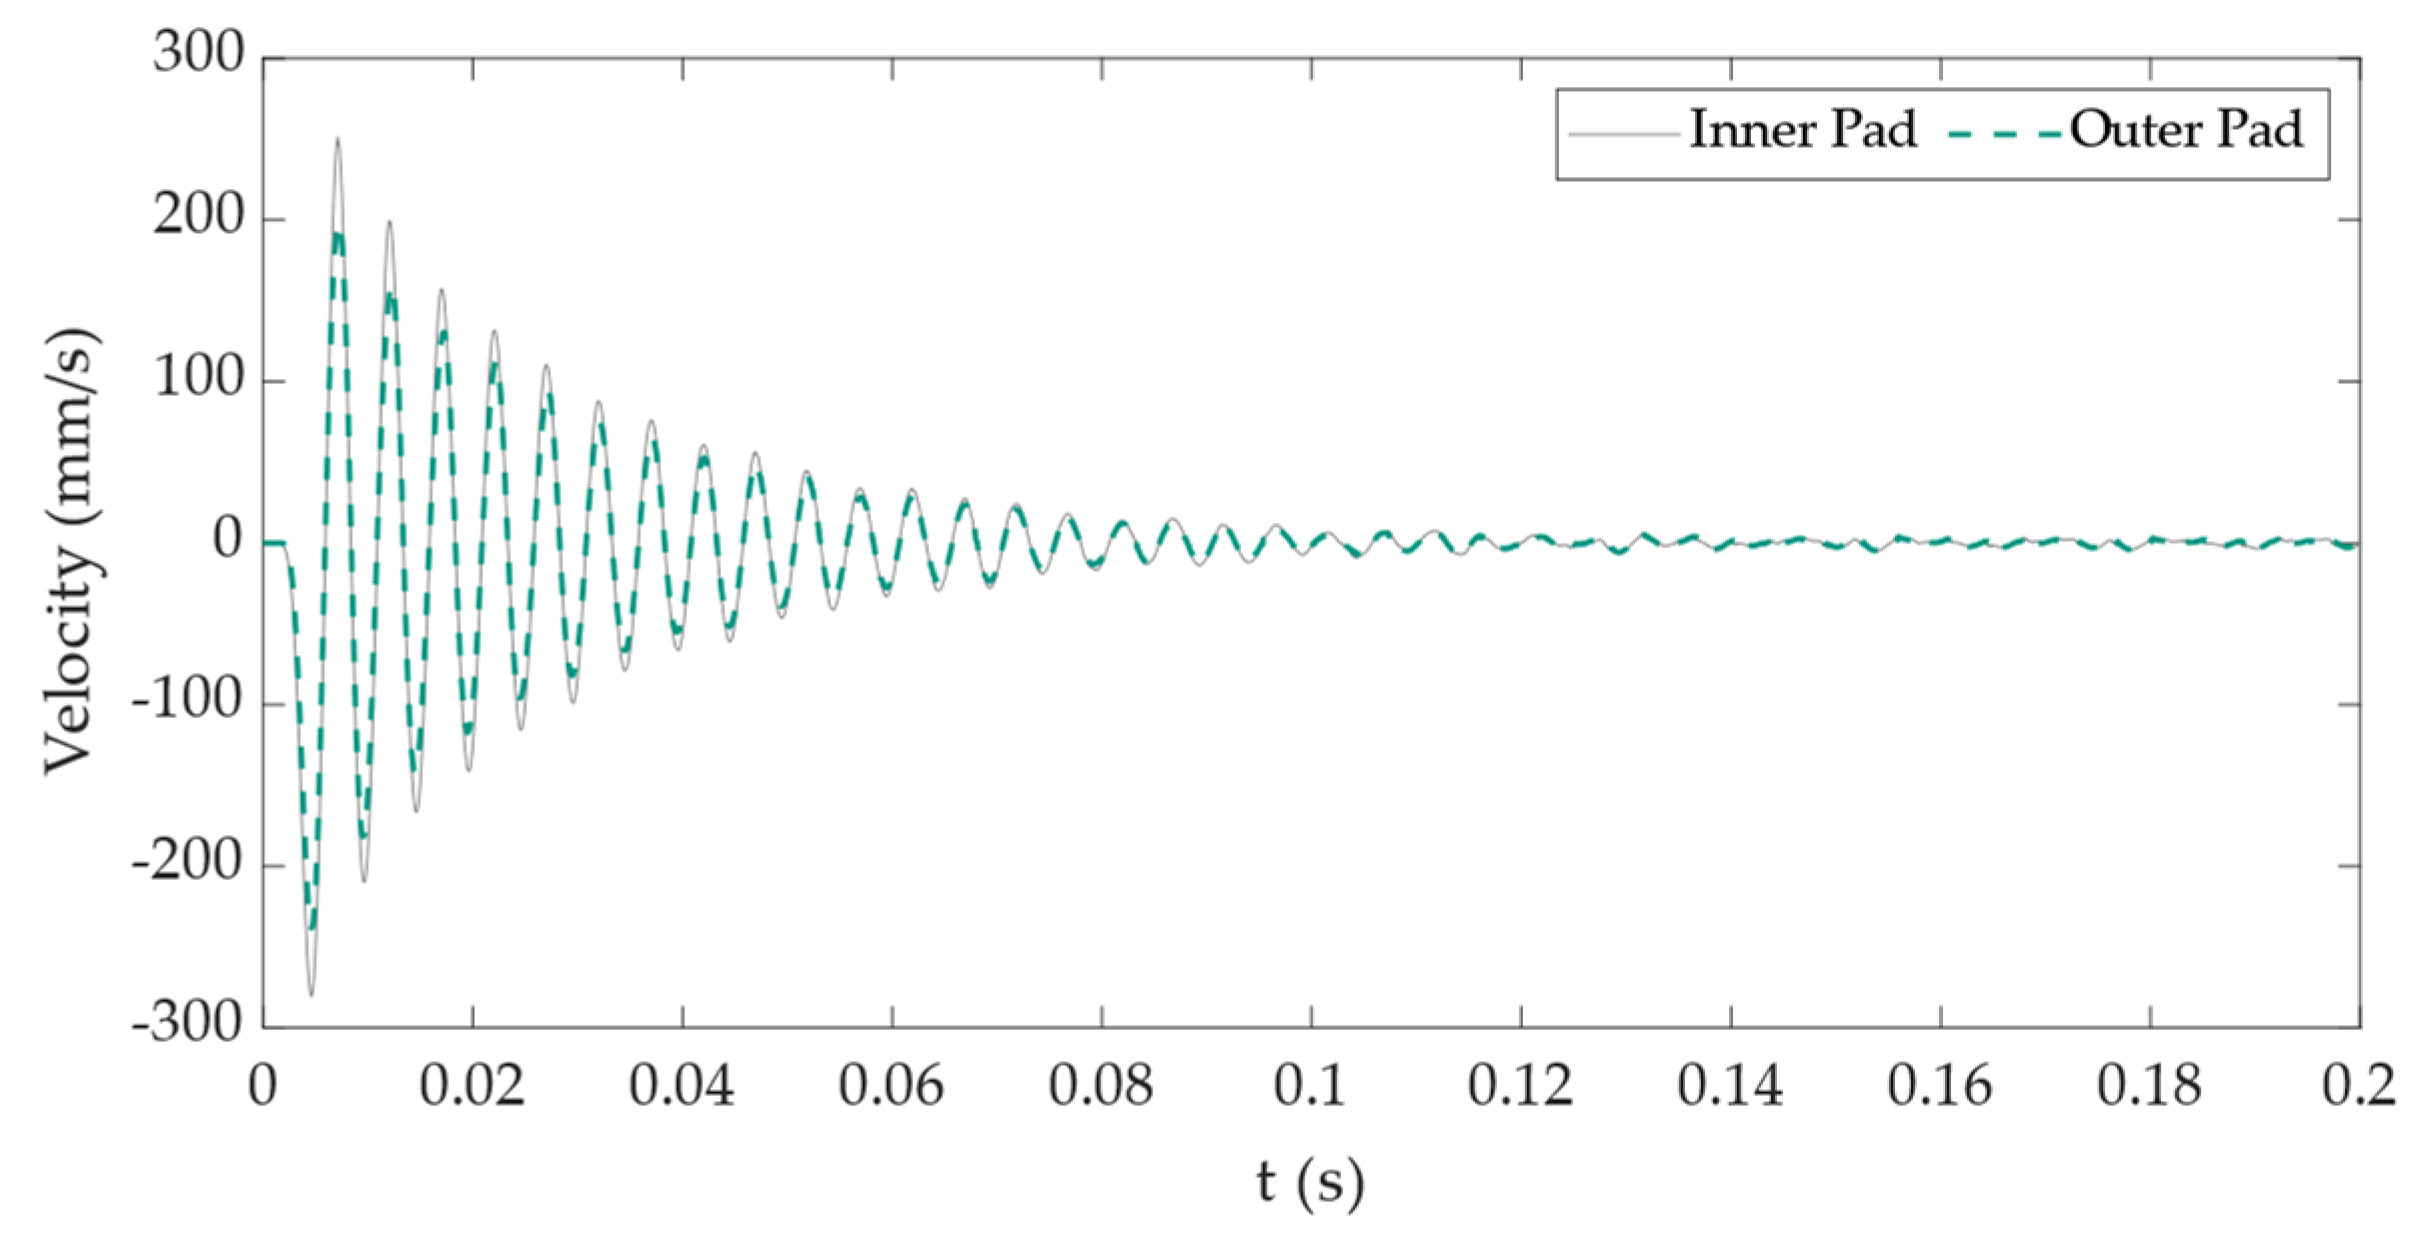
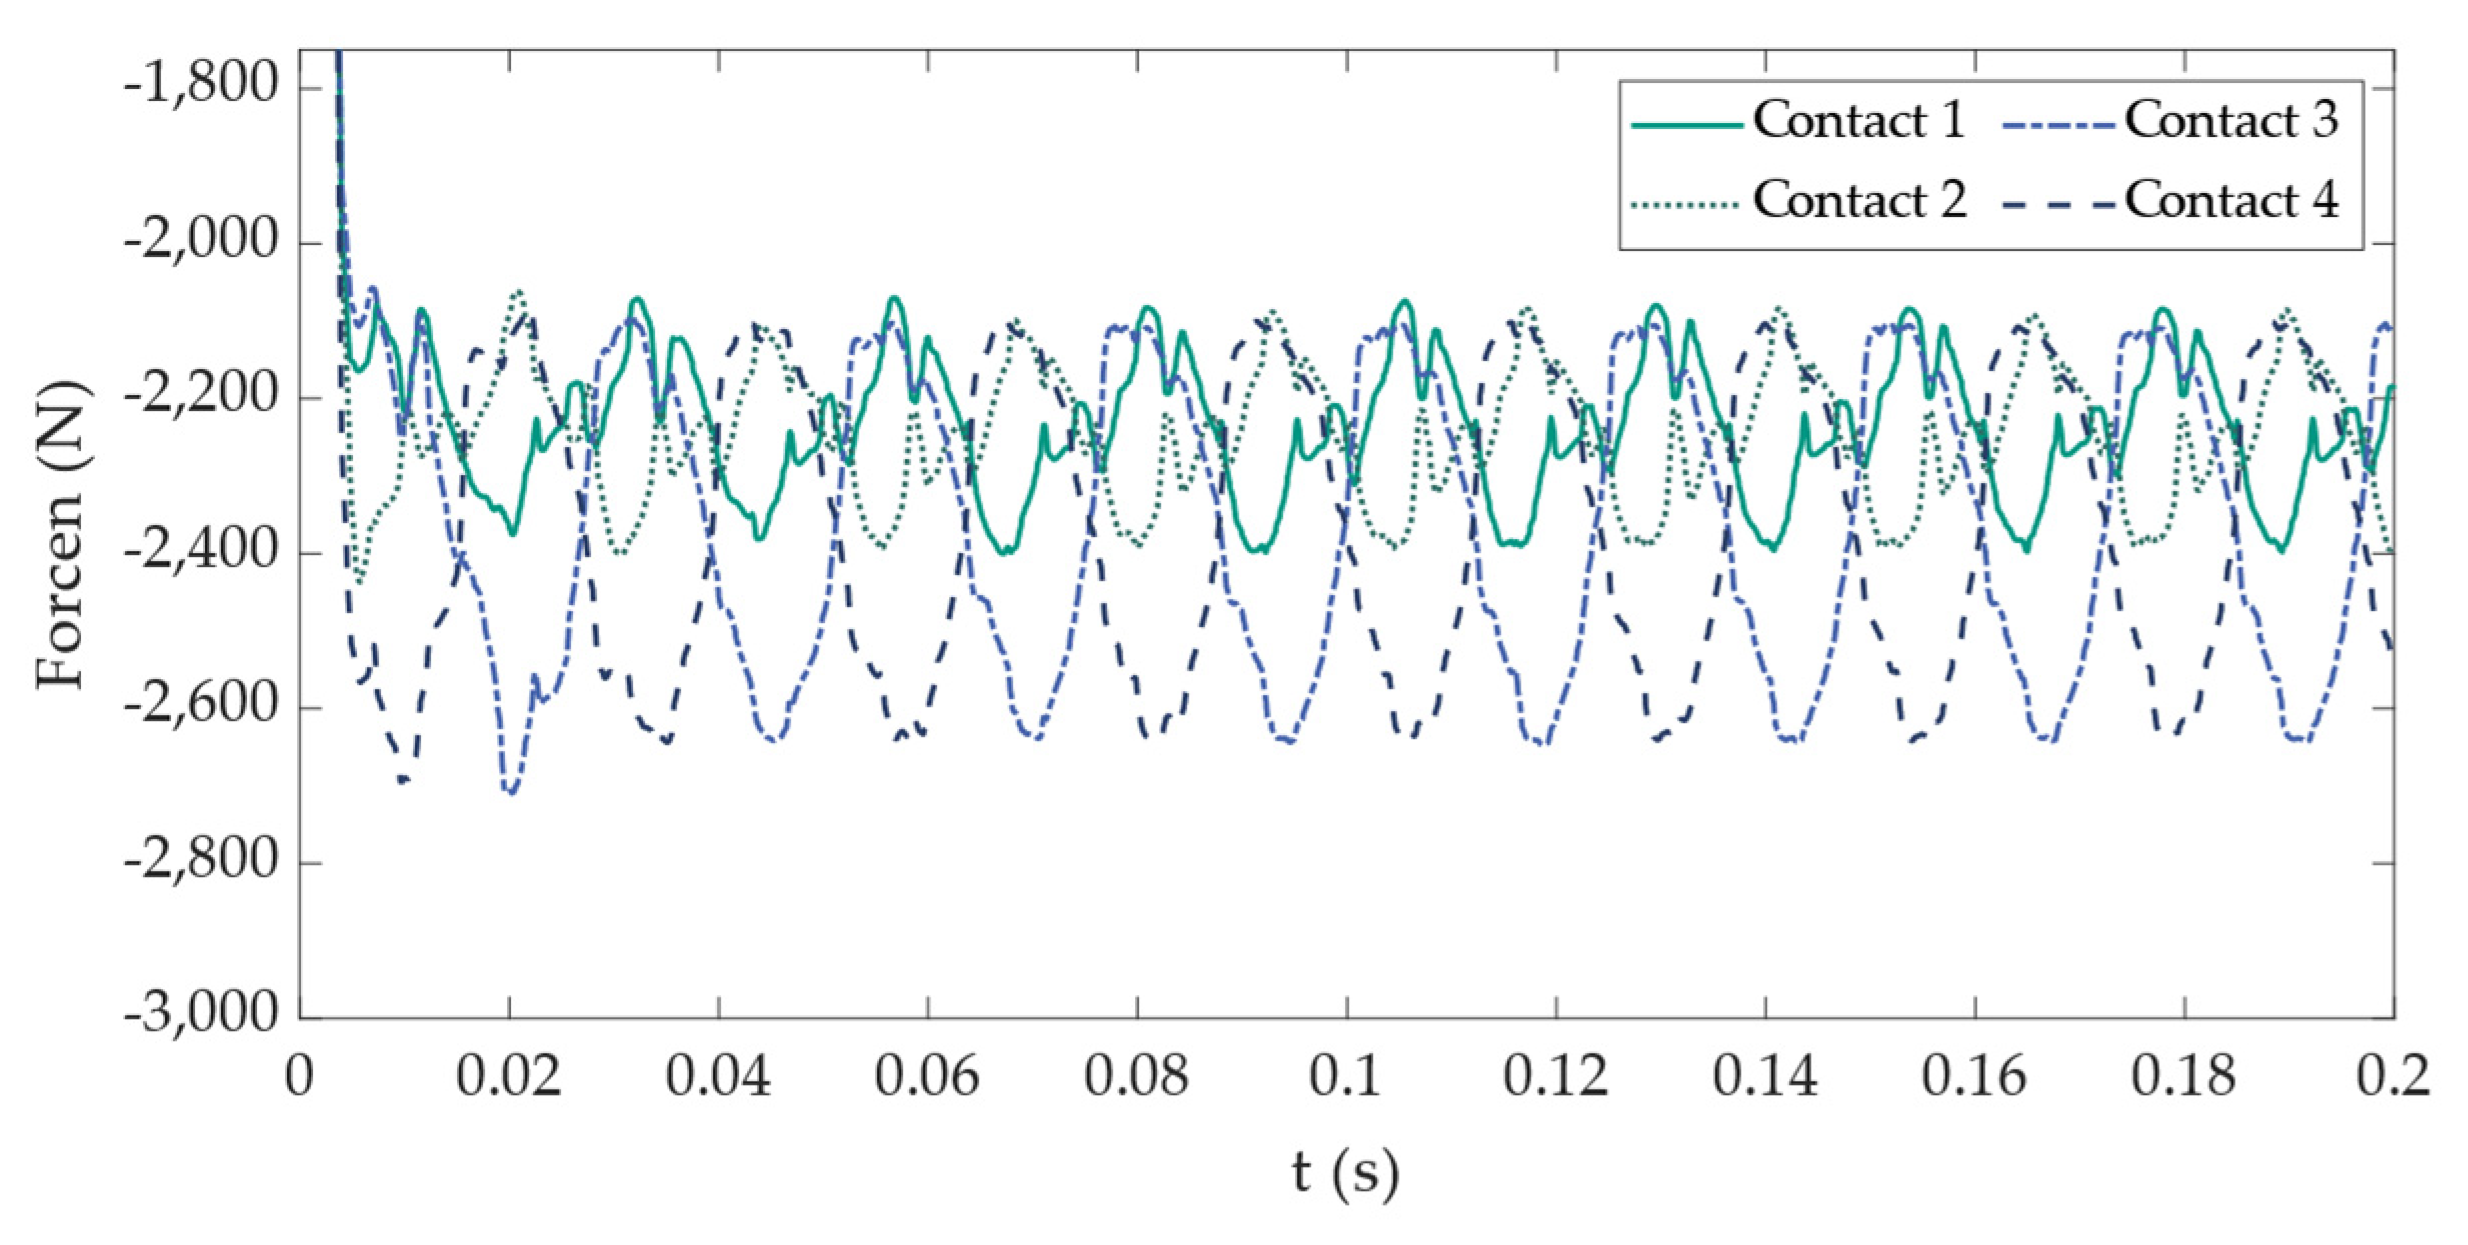
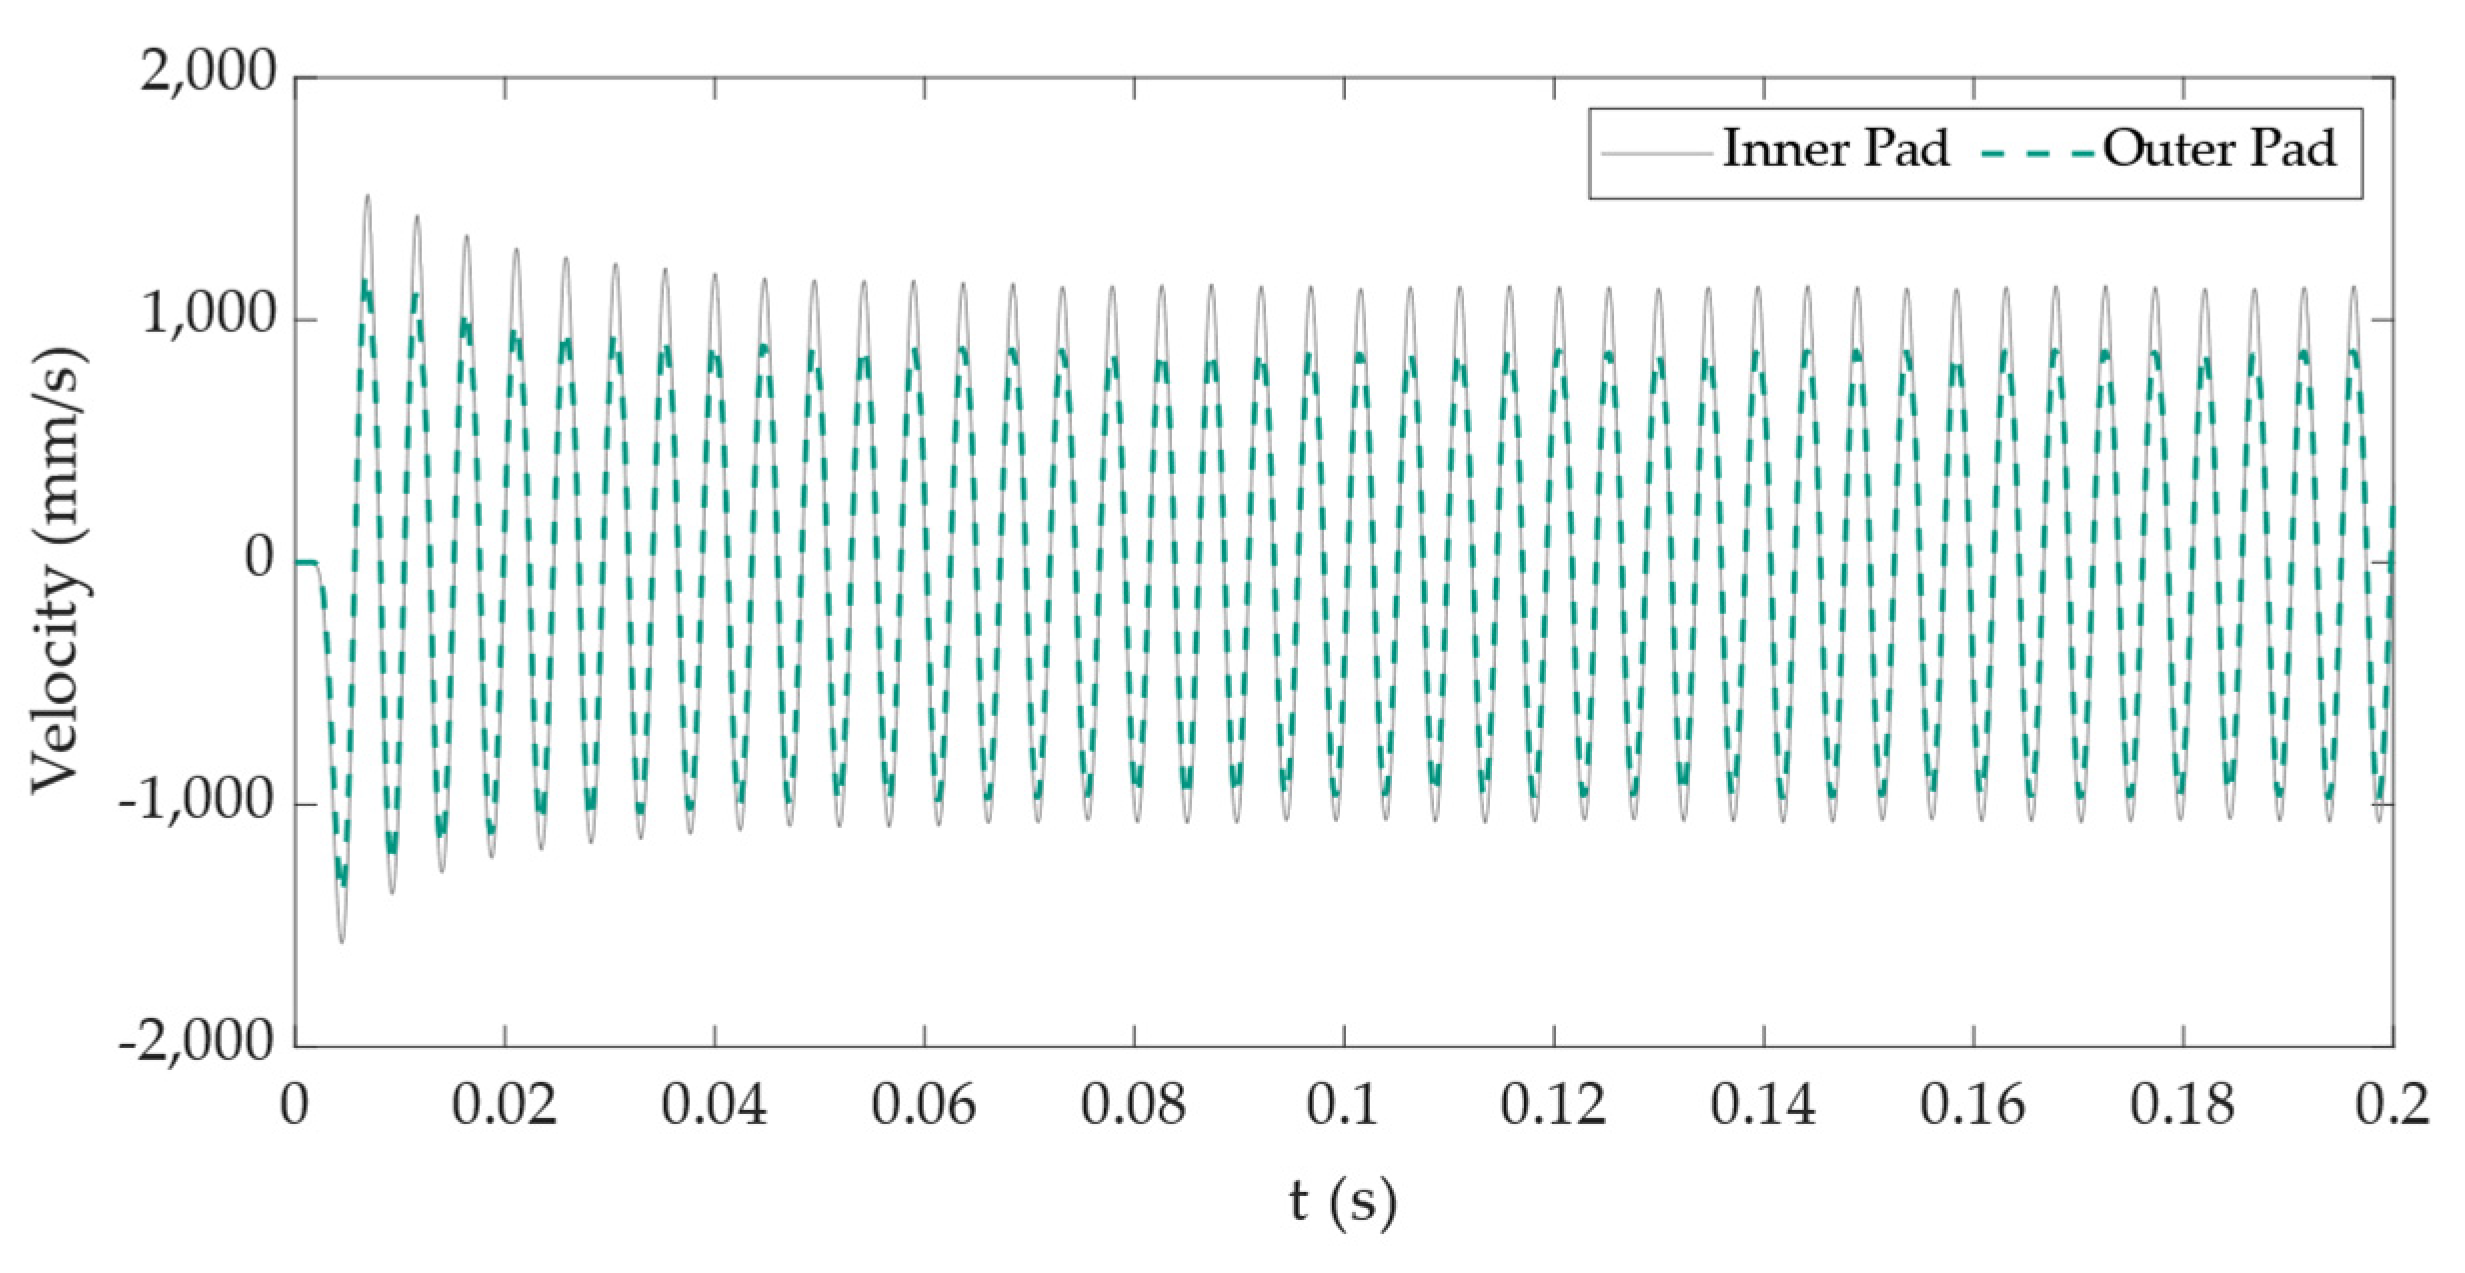
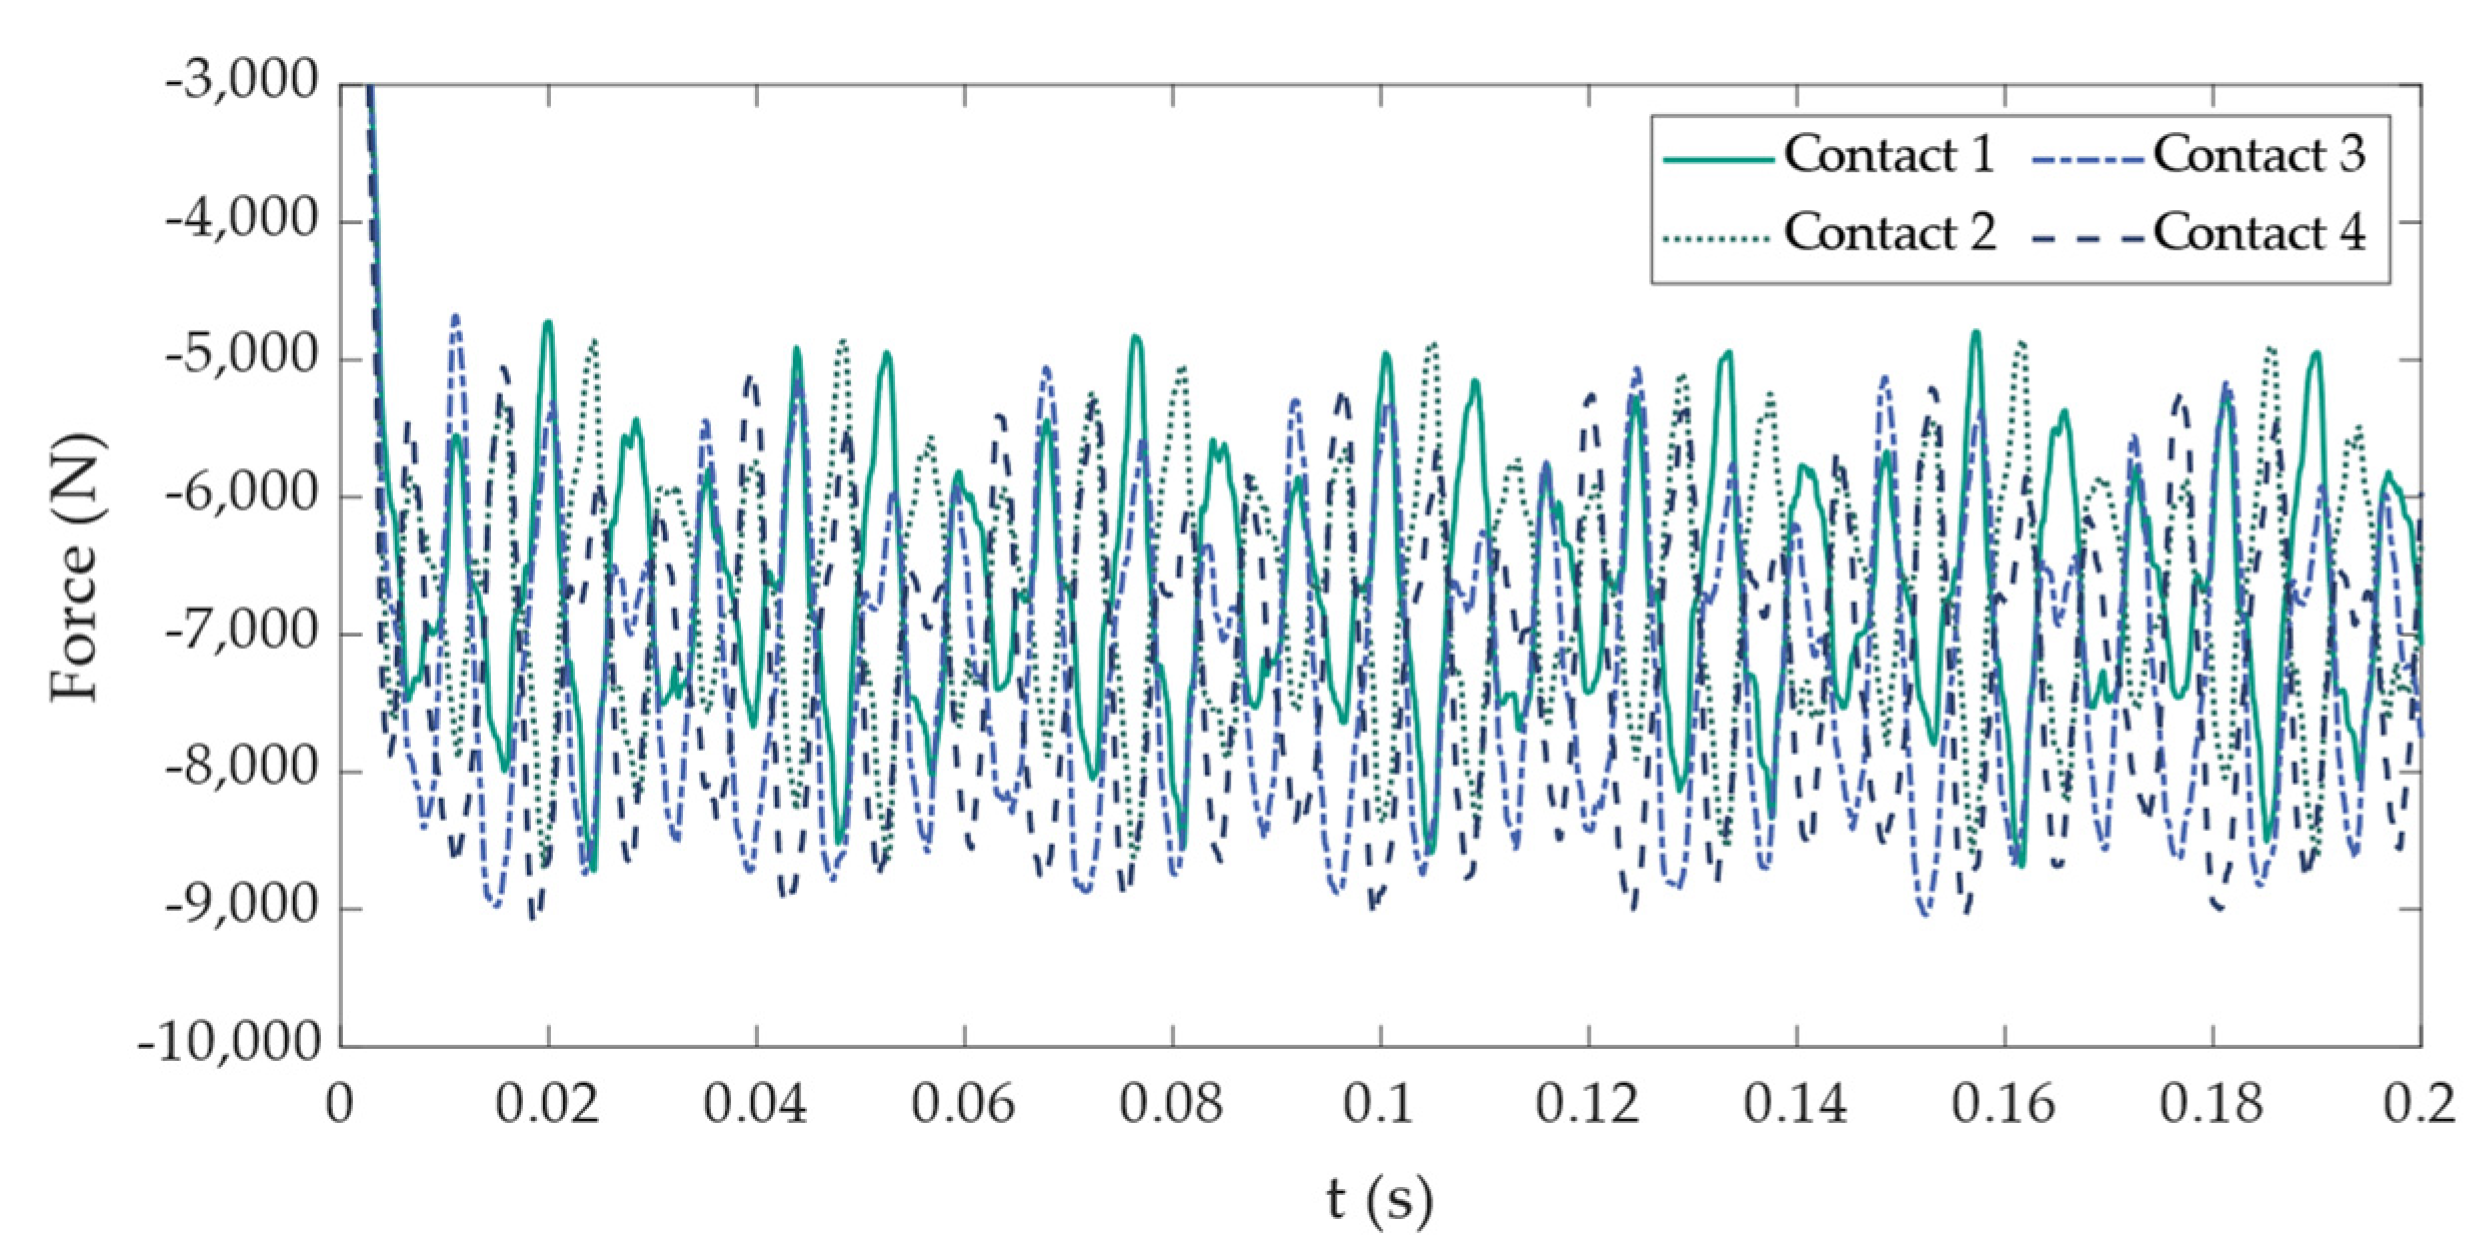
The FE based coefficients of friction were transferred to an MB simulation, which comprised a pseudo-discretized contact. The presented oscillations show that this method is capable of the depiction of distributed contact properties. But the behavior of the brake system is highly dependent on the operation condition. For lower velocities, increasing the pressure simply causes higher damping and the oscillations decrease very fast. However, there is a critical speed, from which the increase of pressure leads to critically stable oscillation modes. This finding corresponds well with theoretical stability charts in the velocity vs. pressure space.
In our case, the coefficient of friction distribution is less sensitive to velocity and depends mainly on pressure. At the critical speed, small changes in the coefficient of friction, in particular at higher operating pressure, may lead the system into a critical stable oscillation mode. Even with distributed contacts, the dynamic model is still sensible to the regular oscillations. So, the pseudo-discretization, the size of the tessellated patches, may play a role, since the tessellation determines the maximal number of different coefficients of friction per second that are seen from the contact in rotating mode. The first examination shows that the expected frequencies due to the pseudo-discretization and the speed of rotation do not correlate with the frequencies reported in Section 3.2. Thus, the oscillations in Section 3.2. are not a consequence to the pseudo discretization, but are a physical system response from the geometry.
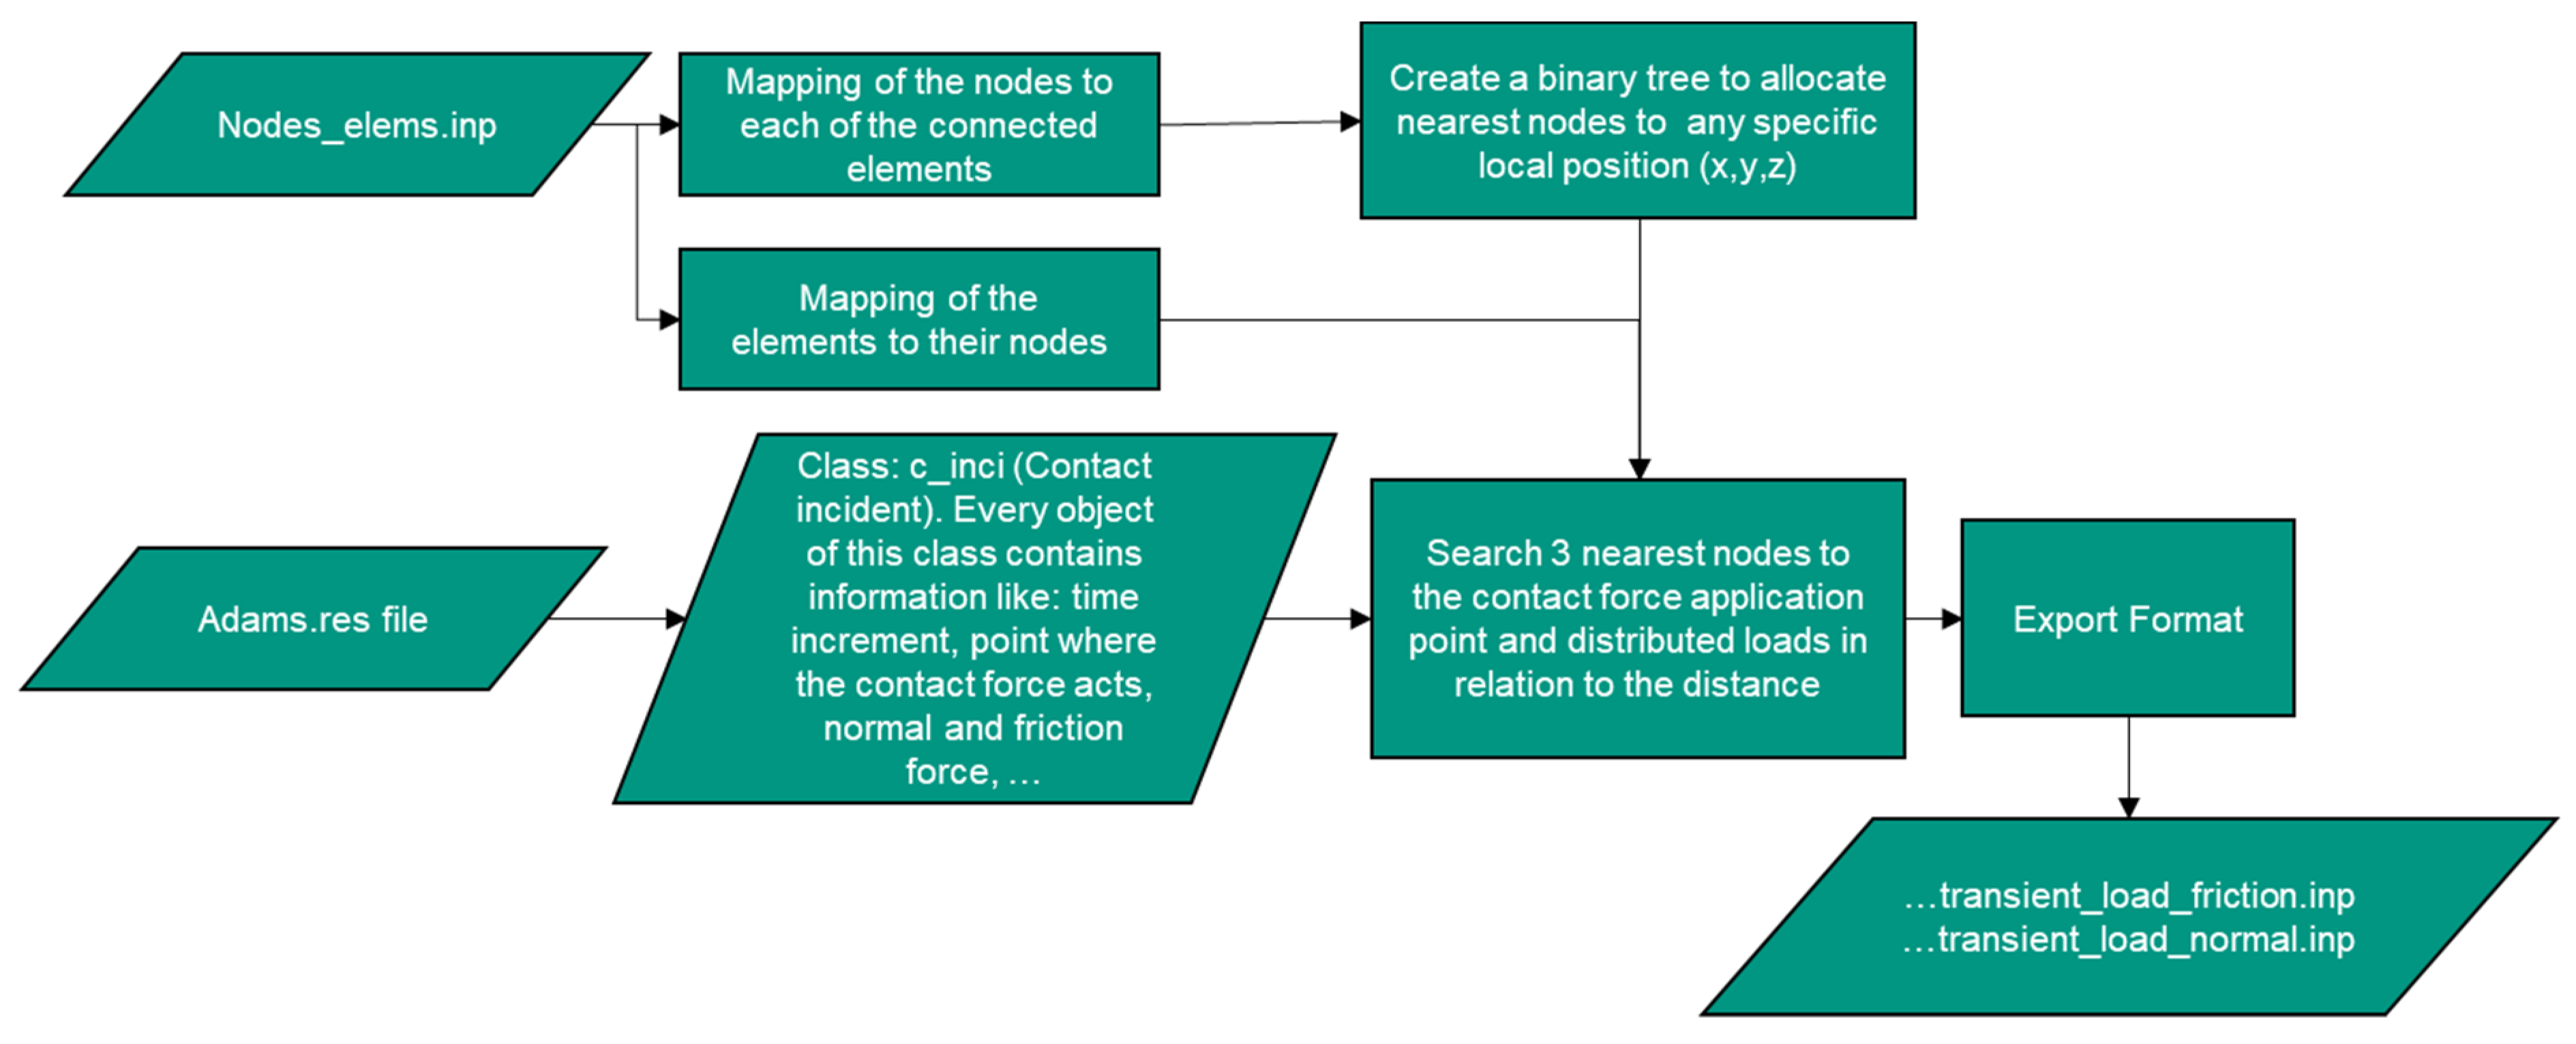
Here, further investigation is necessary to evaluate the impact of the pseudo-discretized approach. Certainly, for each system there will be an optimal pseudo-discretized resolution. However, the main impact should have the spread of the local pressure, which depends on the micro scale topology of the contact and the realization of this situation in the microscale tribological model. This method enables engineers to test different friction distributions even with considering the system geometry. However, the transfer of the results to FE software turned out to be demanding. An own written code was necessary to transfer the excitation to the subsequent modal analysis.
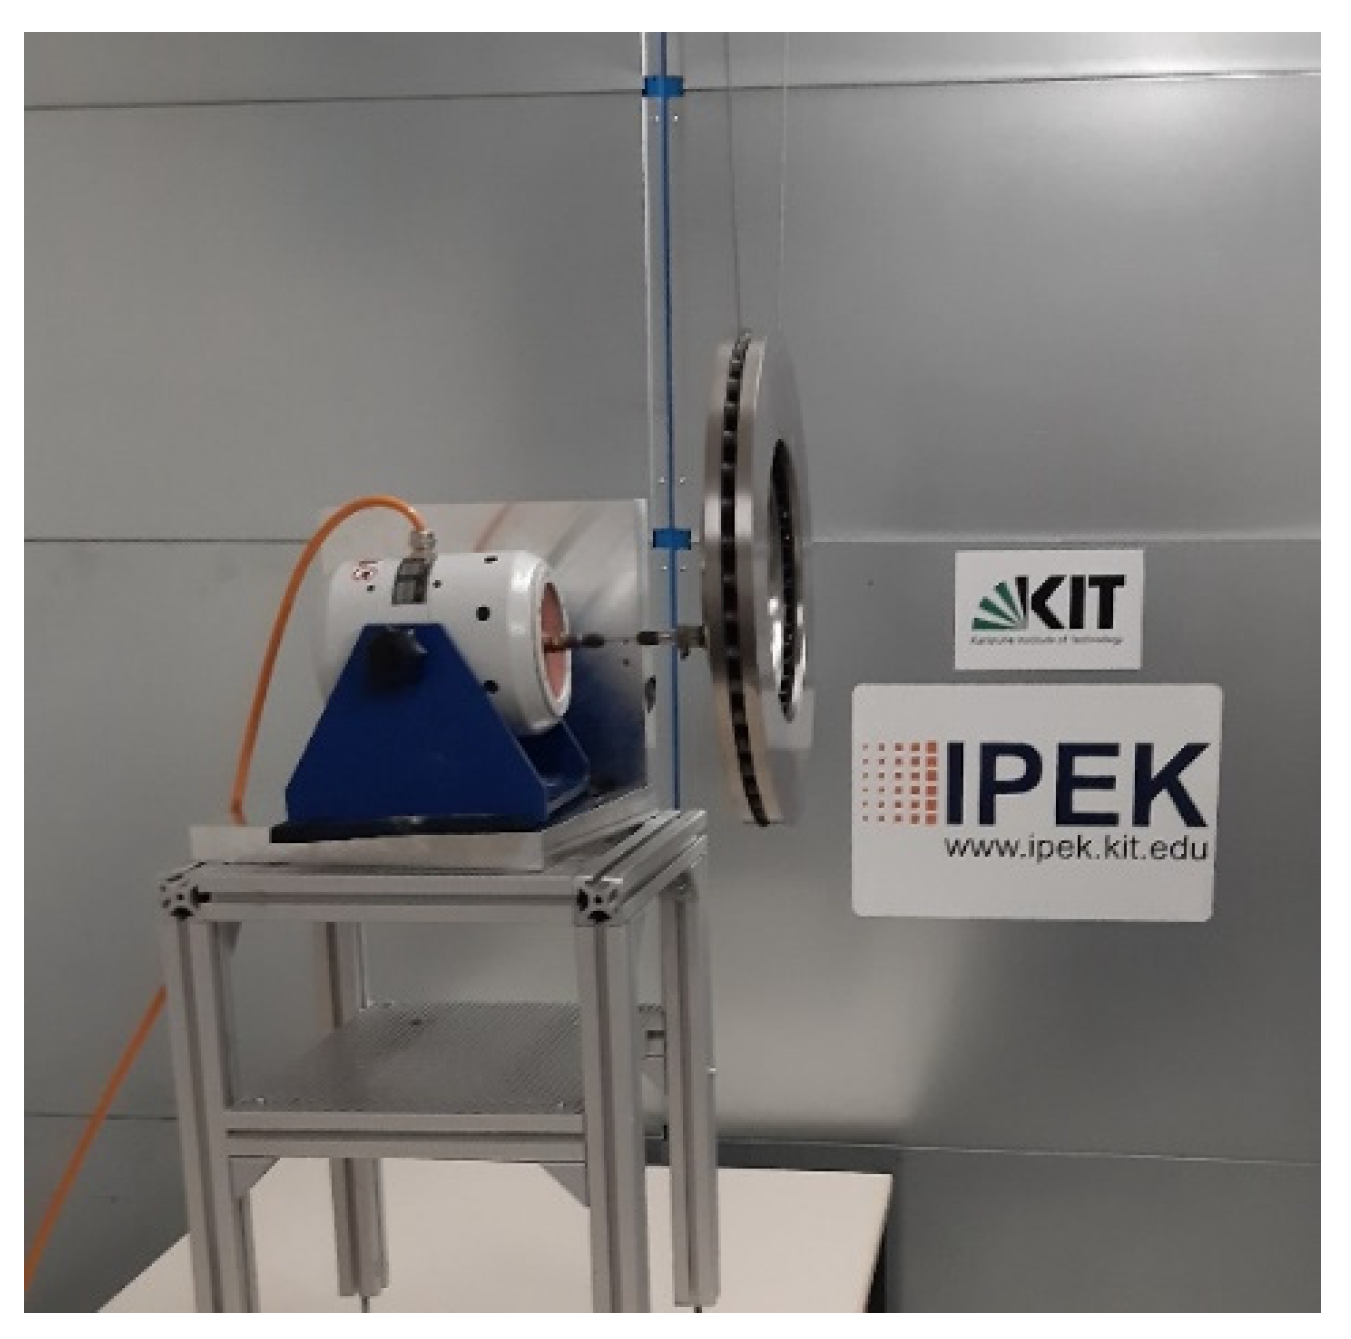
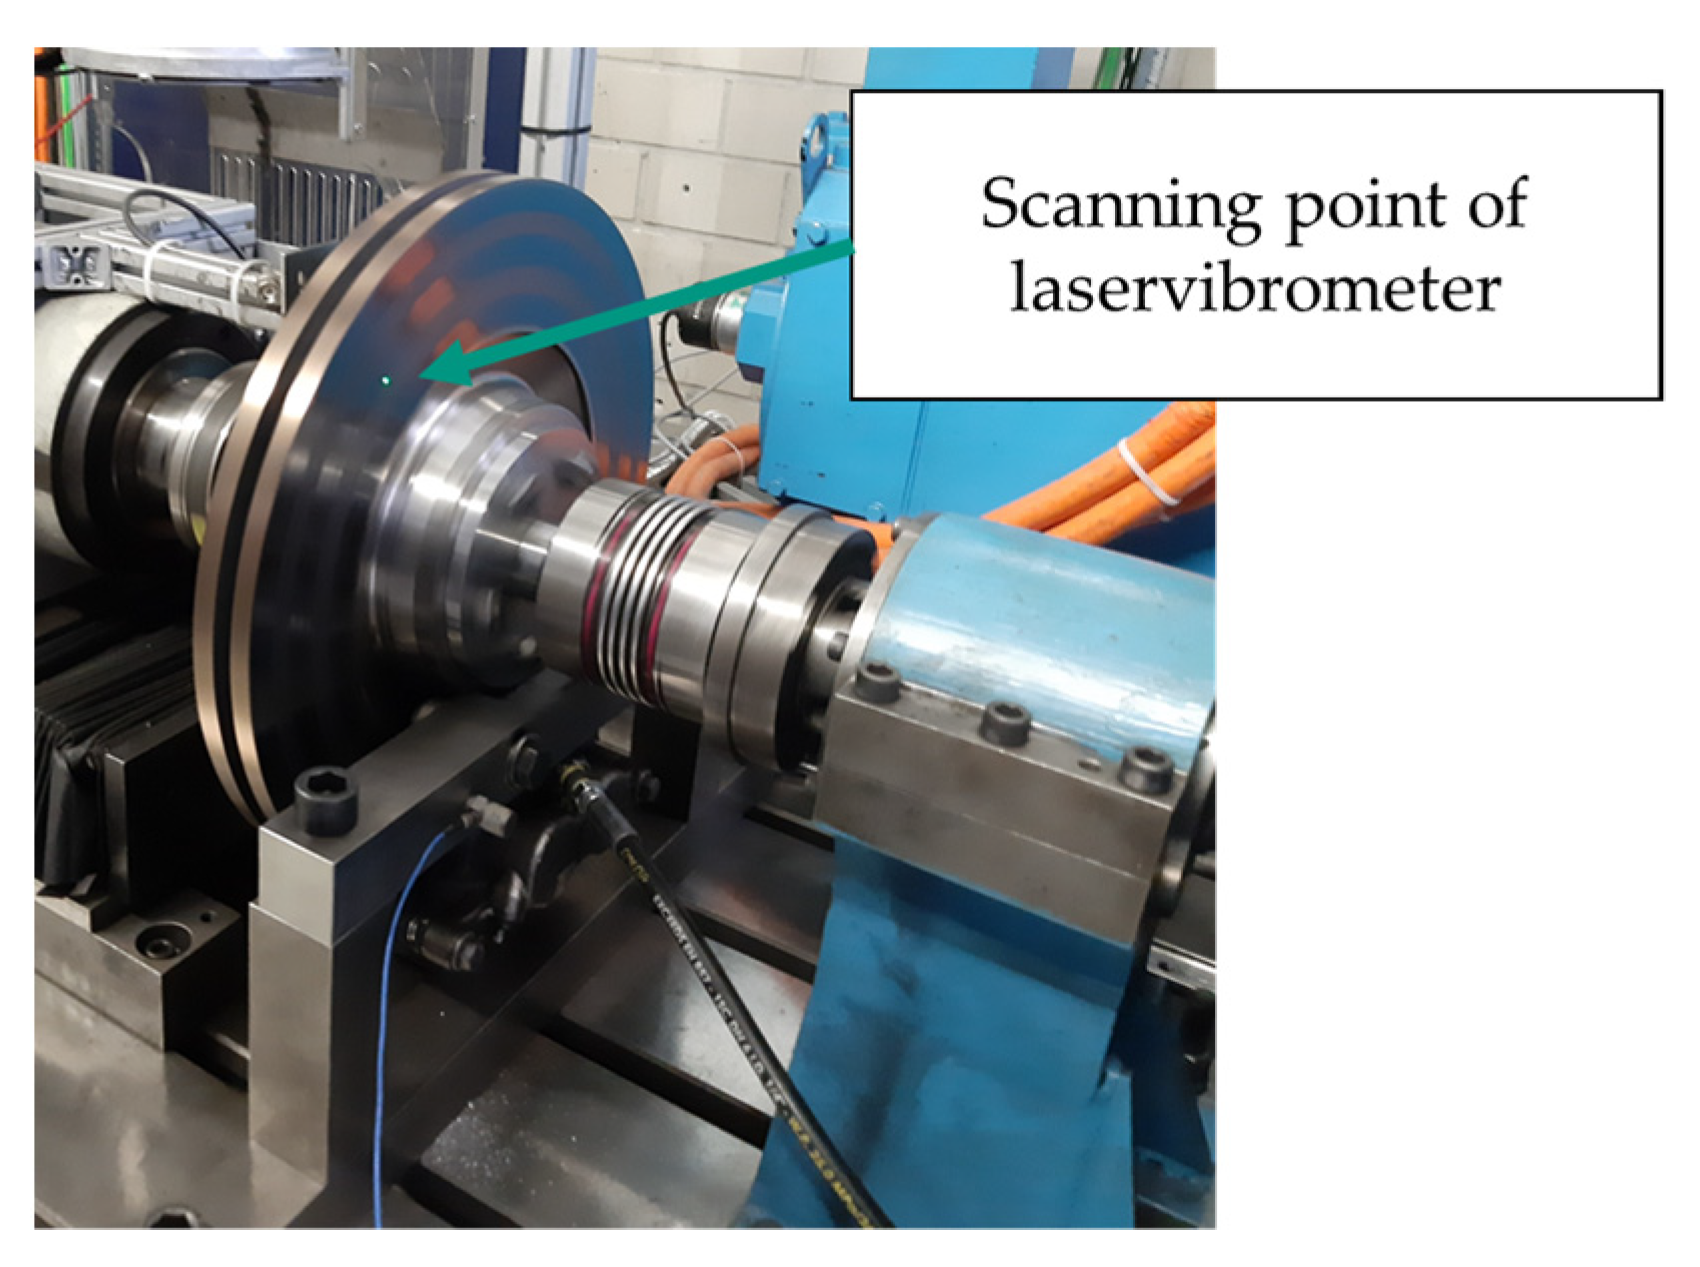
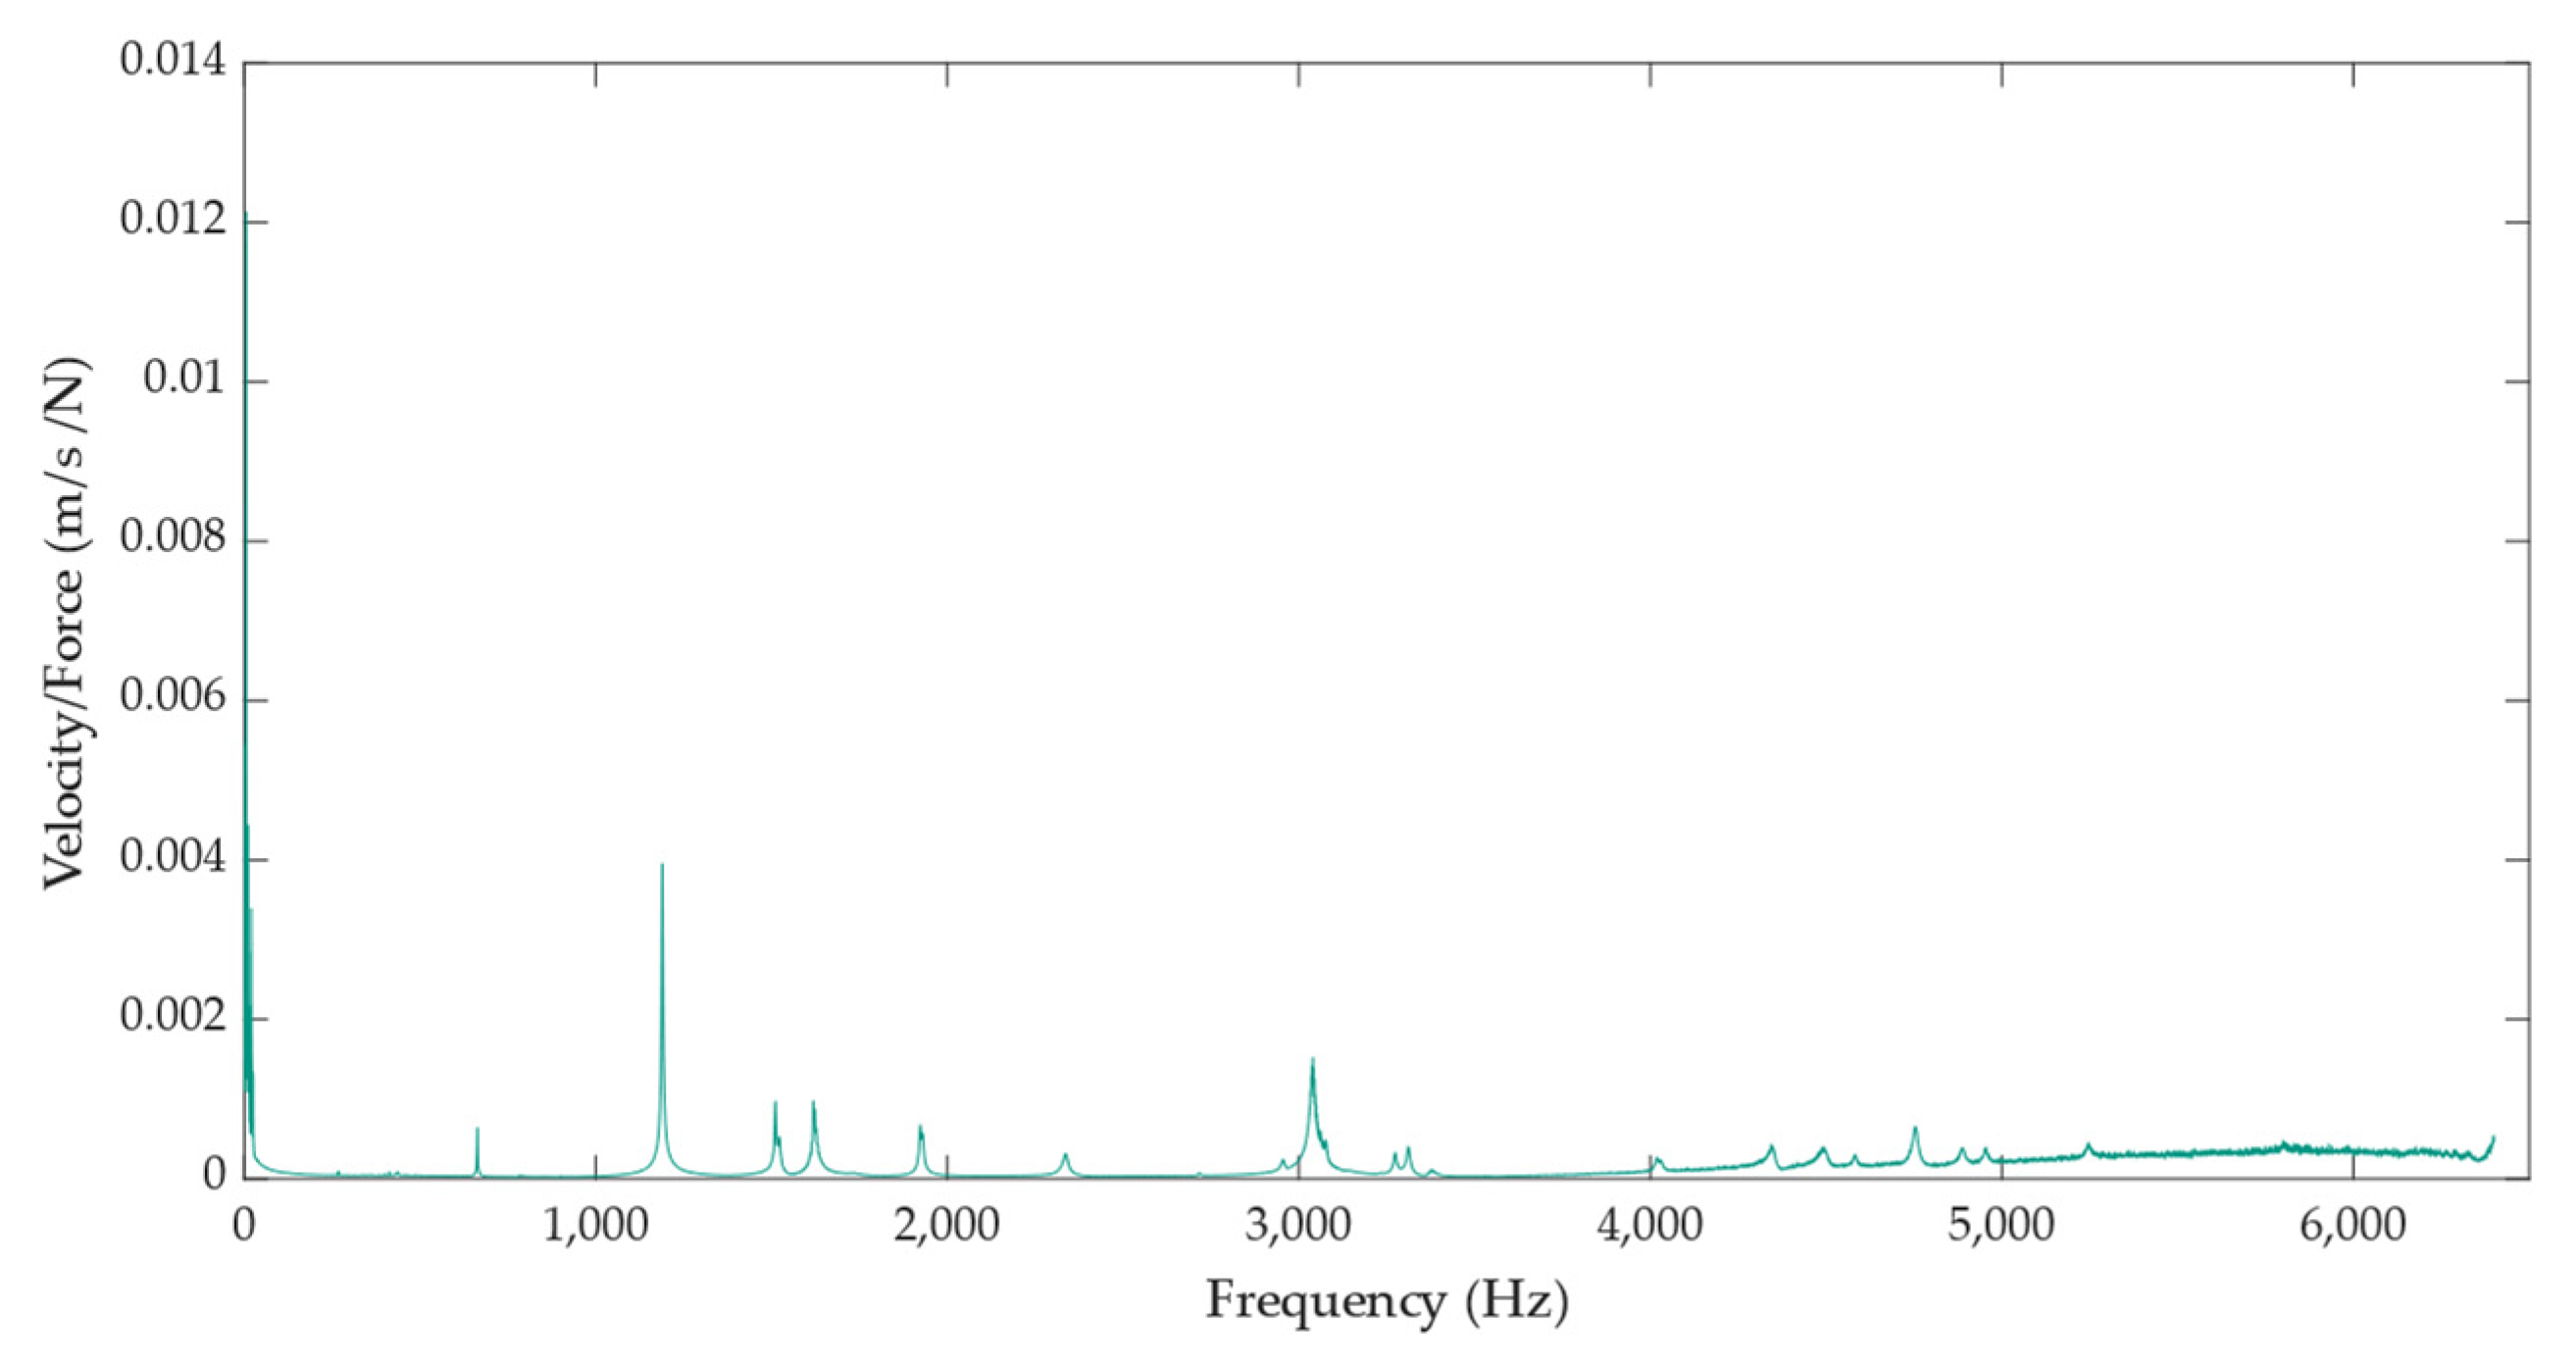
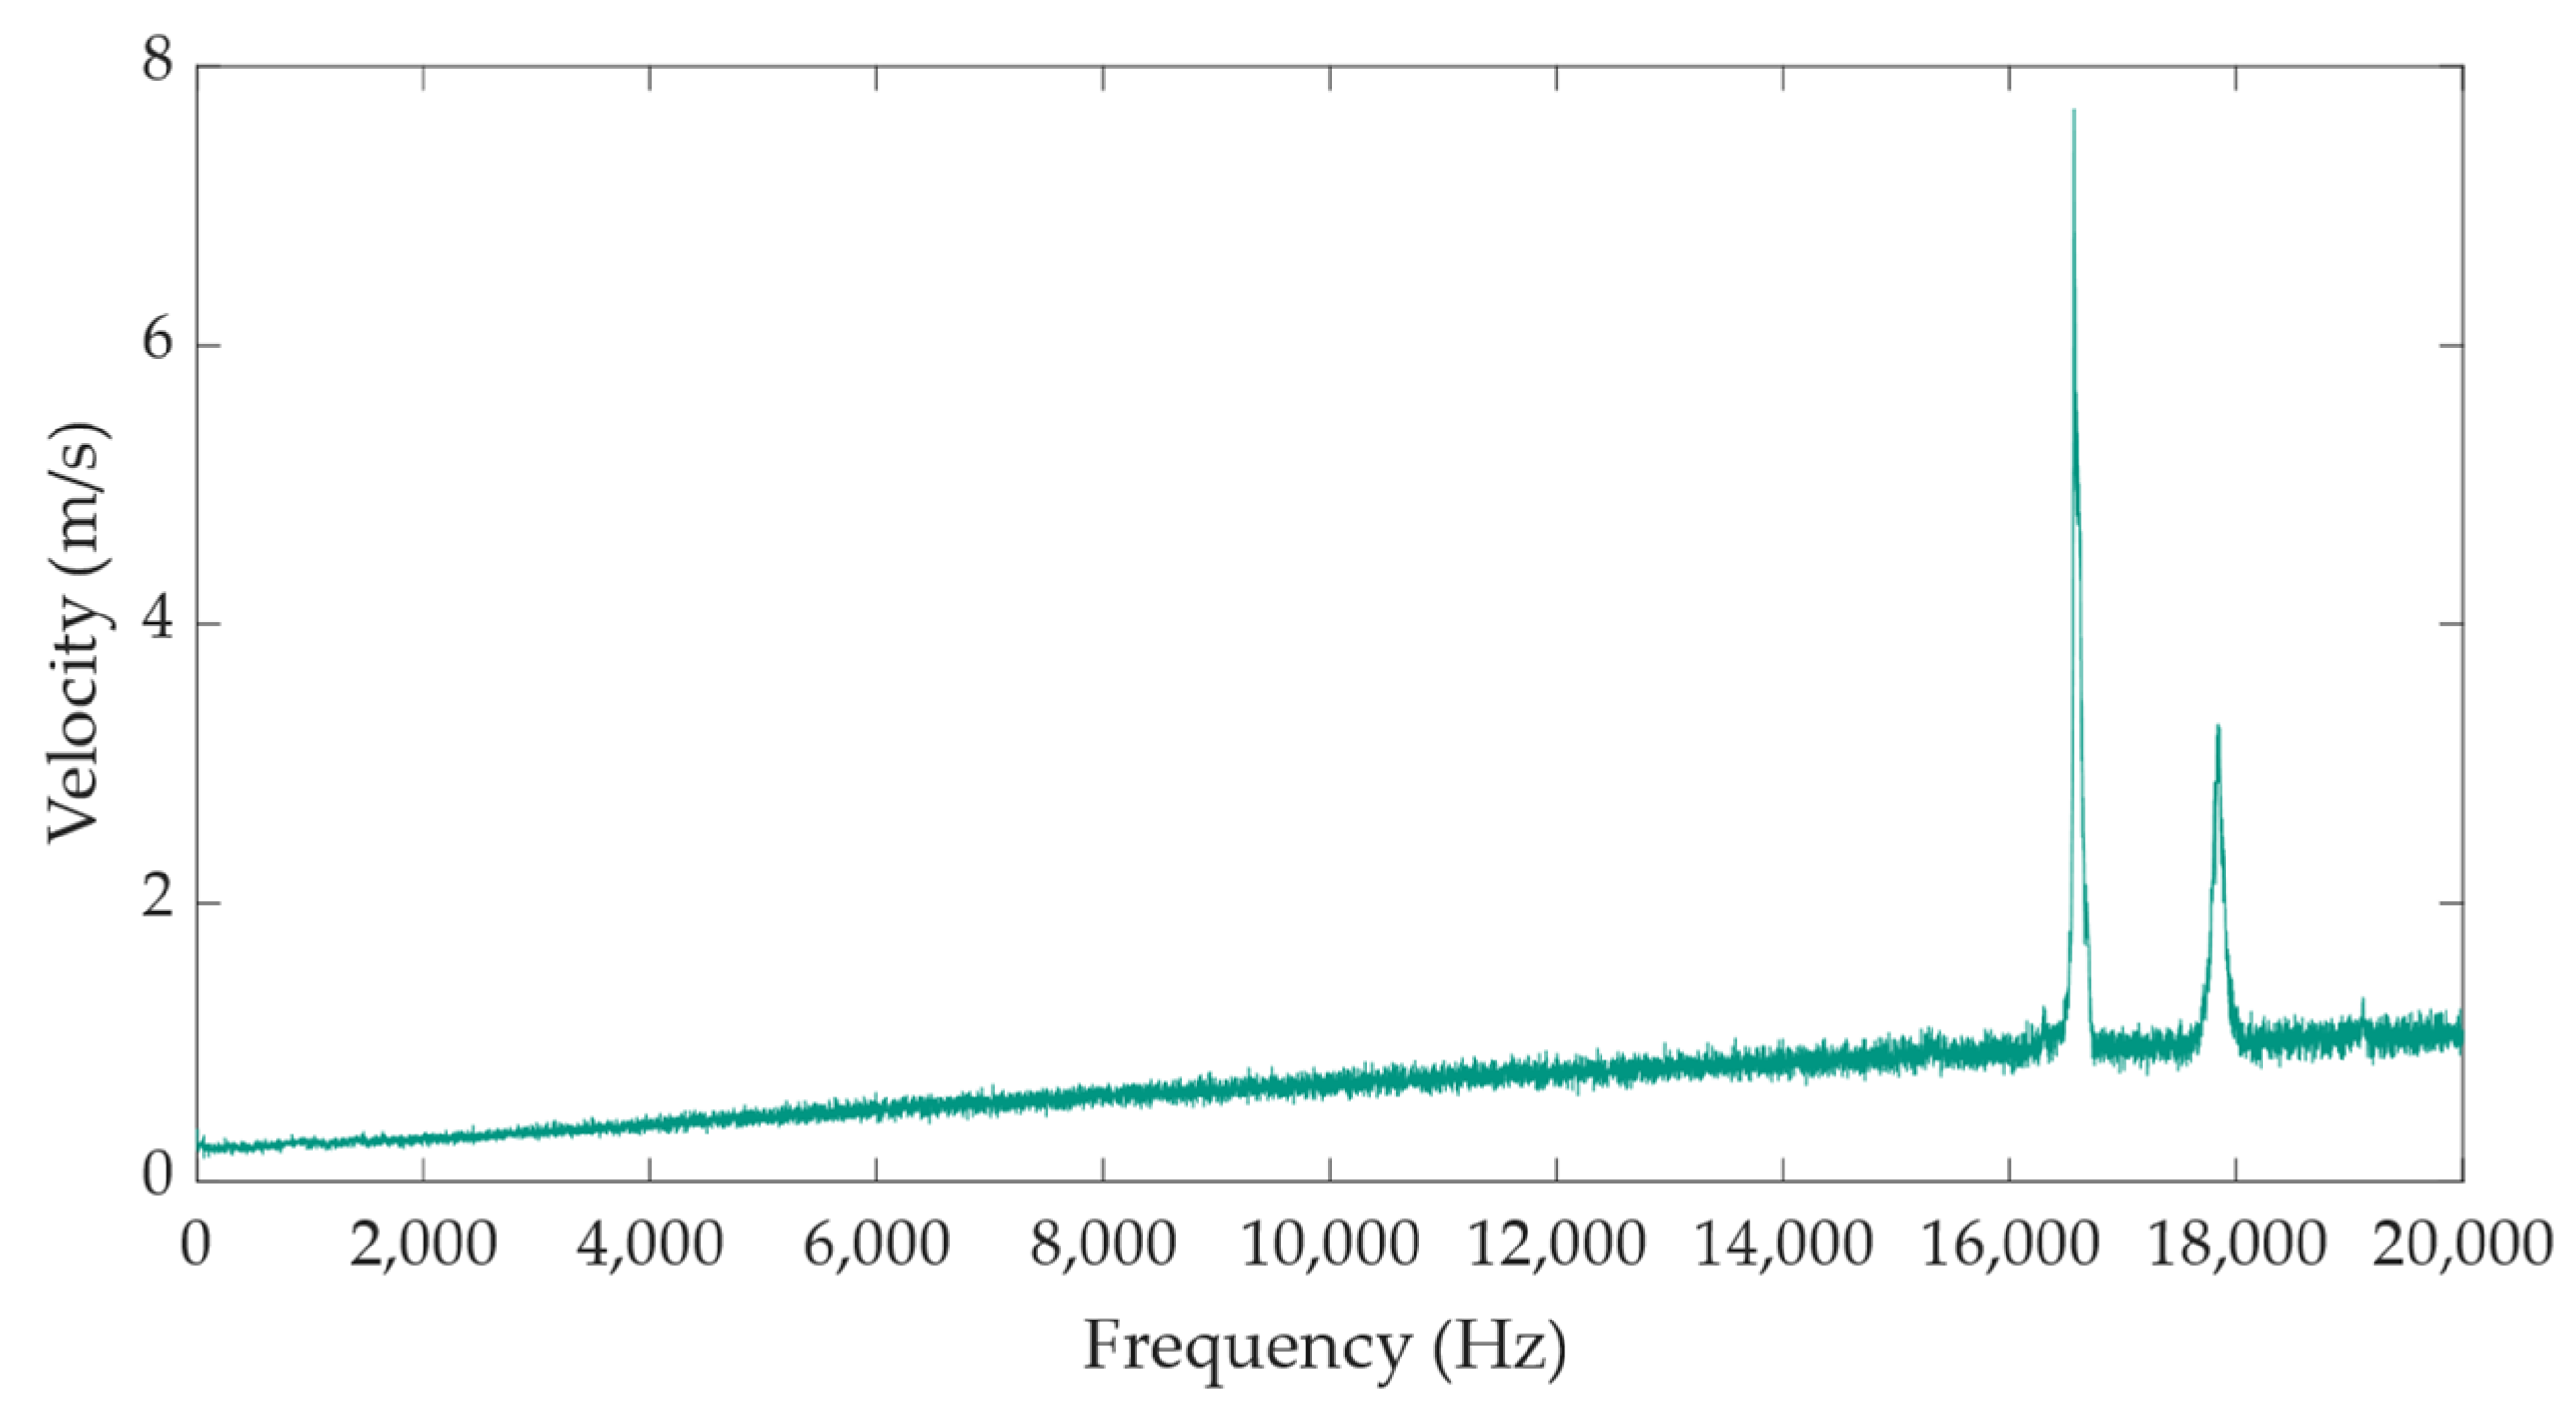
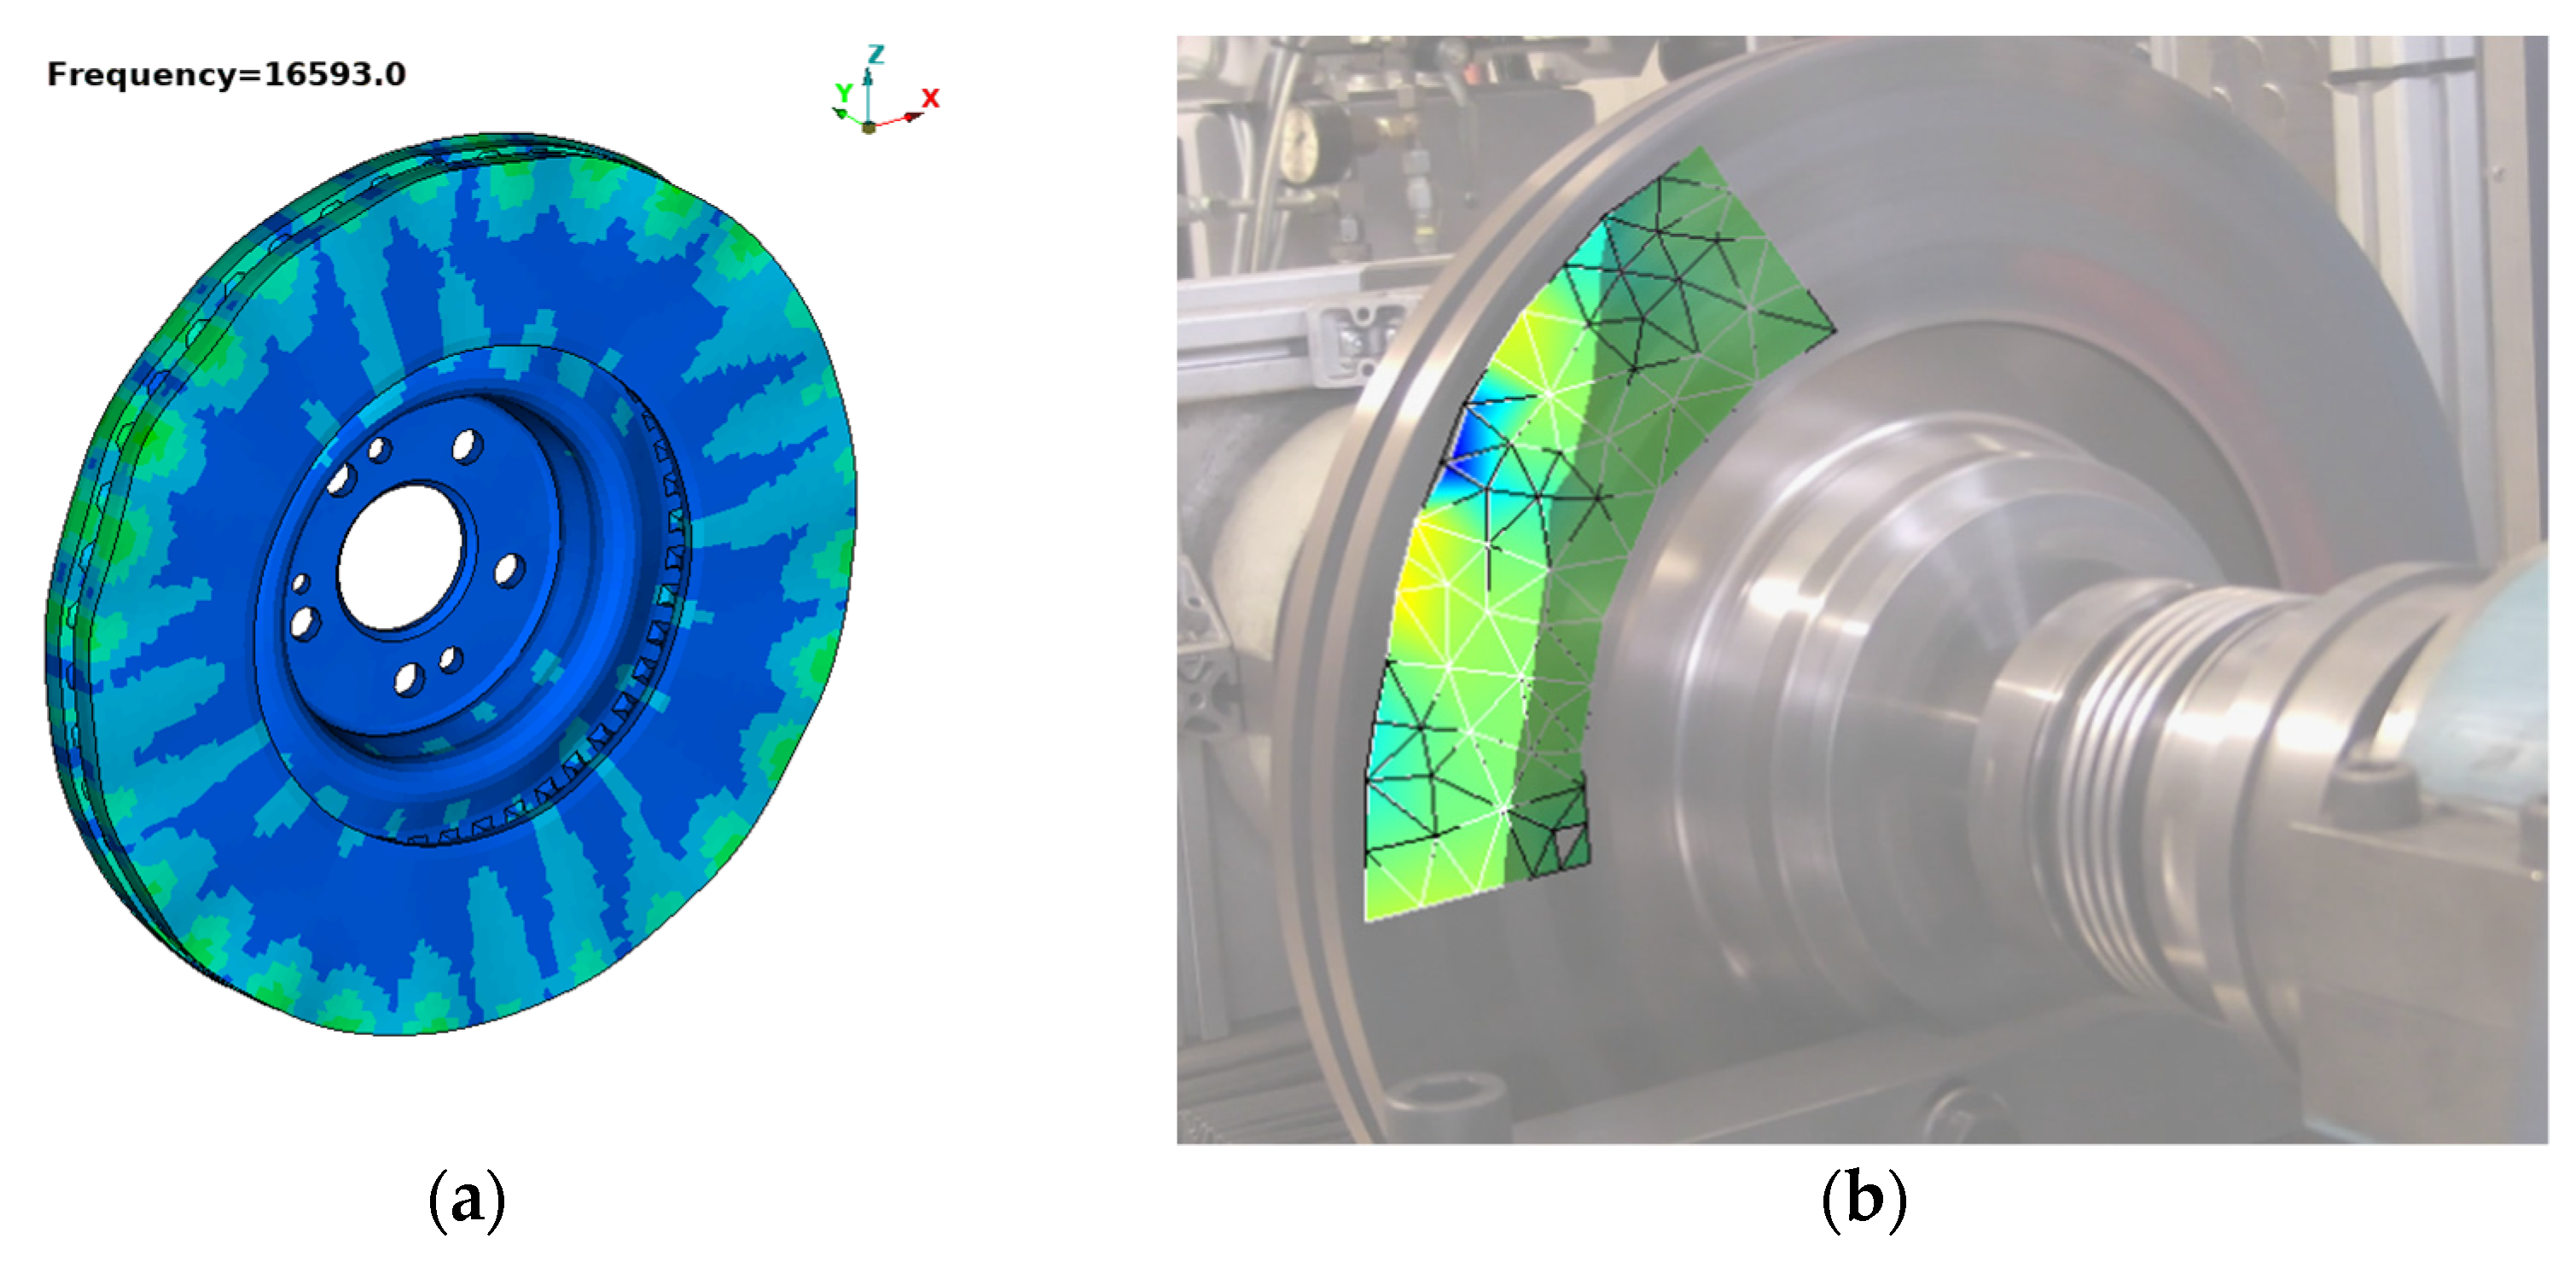
The experimental modal analyses were conducted with a laser vibrometer. The static analysis found eigenfrequencies of the brake disc. On the test bench, the statically determined eigenfrequencies were not measured, because they were not excited during the braking. With the experimental modal analysis on the test bench, two eigenfrequencies were measured. Both frequencies lie at the upper range of human hearing capability. Since the chosen brake system is known for squealing issues, the assumption has been made that the squealing occurs at lower frequencies at load stages, which were not excited by the used boundary conditions.

5. Conclusions

The FE friction model allows for the purposeful analysis of parameters, such as the velocity, the normal force or the surface roughness. However, more detail is to put on the material data because the deformations of the asperities of the underlying two solids determines the contact patches and, therefore, the resulting friction. Whereas the deformation of the cast iron is commonly available, the brake pad material must be further analyzed to depict its surface deformations. Furthermore, the coefficient of friction computation, which relies on the friction condition in the FE friction model, can be transferred to different technical or scientific systems. Such systems are regular journal bearing or different sliding systems, such as piston bearings. The shear stress dependent friction condition reliably defines the coefficient of friction for journal bearings. However, in the presented brake system, advanced friction conditions are necessary to get to the regular coefficients of friction for brake system. Possible extensions to the friction conditions are subroutines for FE simulations, which include, e.g., a contact area dependency.
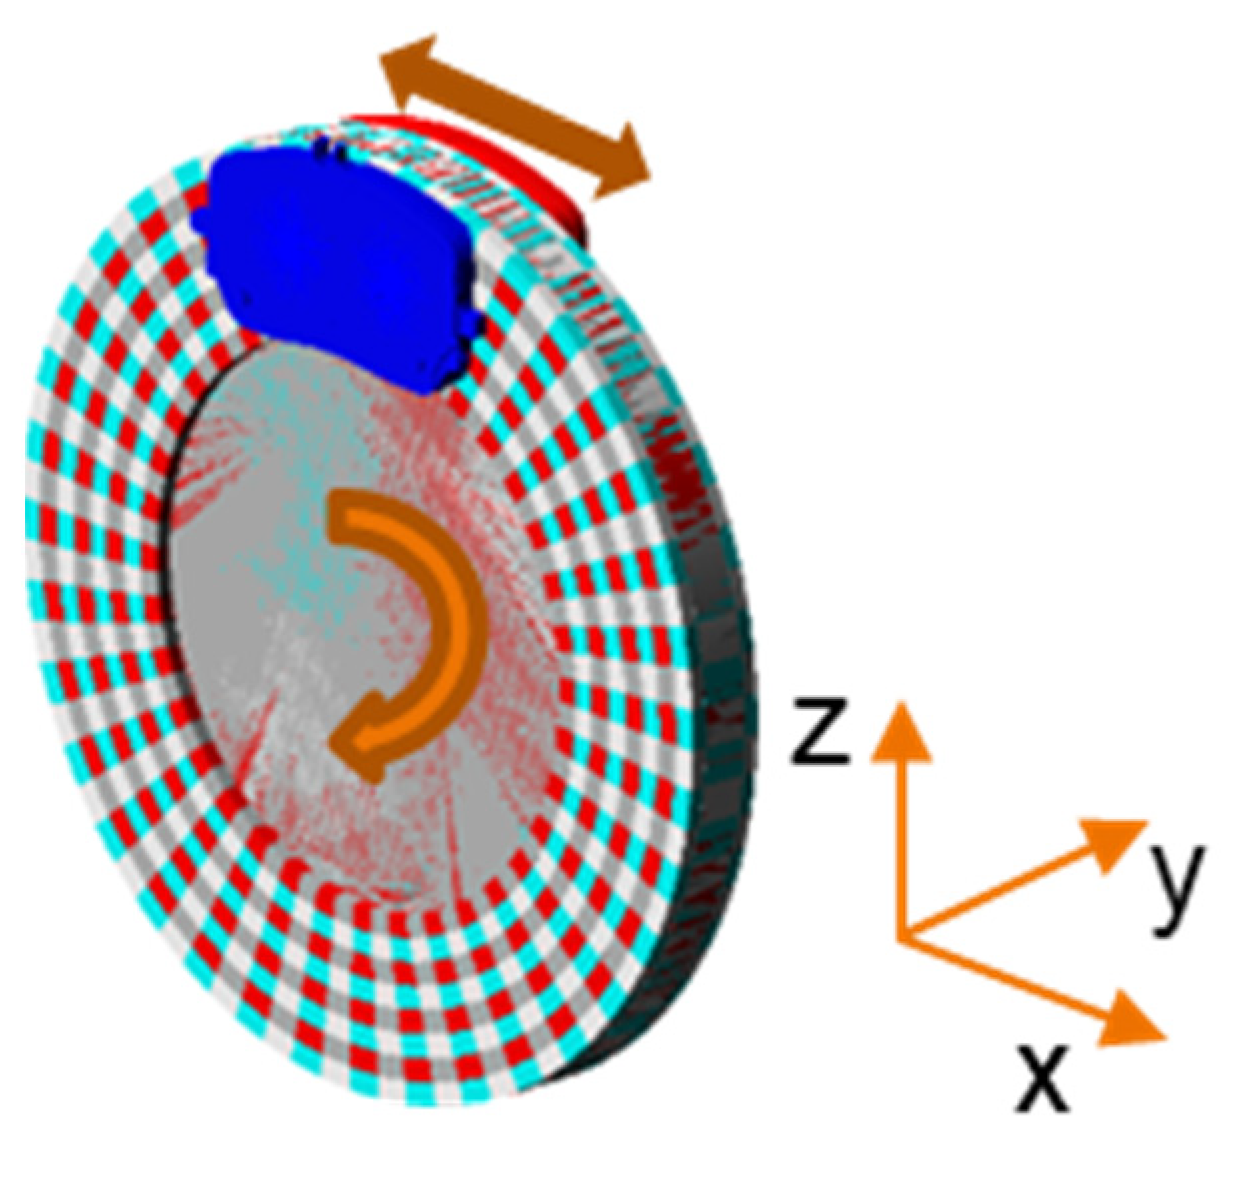
The consequent use of commercially available software enhances the transfer of this approach to different systems. Single elements of this approach, such as the FE friction model or the distributed MB simulation, can be used for analyzing different technical systems. The presented method helps engineers to test different surface topographies or geometries in engineering processes before creating prototypes. Further investigations comprise the transfer of rough surfaces, as well as the application of this method on clutch systems. These systems have in contrast to brake systems an entire ring-shaped contact area.
In conclusion, the application of this method shows that the connection of different simulation methods is still a great challenge and shows why many engineering processes comprise single isolated methods instead of coupled simulations. However, the presented approach shows that the connection of different scales and methods delivers comprehensive knowhow. In the context of brake squealing, the consideration of the entire relevant frequency range is important, so no audible noise is neglected. The FE modal analysis is an especially valuable tool for developing brake systems because it allows one to easily vary geometrical parameters and to consider excitations. Finally, the research has proven that, even though the computation is virtually conducted, real world input is an indispensable element for a simulation and is necessary for further validation.

Author Contributions

Conceptualization, A.J., I.S., R.D. and A.A.; methodology, A.J., R.D. and I.S.; software, A.J. and I.S.; validation, A.J. and I.S.; writing—original draft preparation, A.J.; writing—review and editing, A.J., I.S., R.D. and A.A.; funding acquisition, A.A. and R.D. All authors have read and agreed to the published version of the manuscript.

Funding

The authors would like to thank the Bundesministerium für Wirtschaft und Energie (German Federal Ministry for Economic Affairs and Energy, BMWi) for support in the project “Entwicklung einer Dienstleistung zur skalenübergreifenden numerischen Analyse und Bewertung von reibinduzierten Schwingungen” (ZF4045709MS8 and ZF4233004MS8) as part of the Central Innovation Program for SMEs (ZIM). We acknowledge support by the KIT-Publication Fund of the Karlsruhe Institute of Technology. Applmech 02 00060 i001

Acknowledgments

The authors would like to thank F.W.E. GmbH & Co. KG for advice, support, and the provision of the test parts. The authors would like to thank Polytec GmbH for advice, support, and the providing the laser vibrometer measuring equipment.

Conflicts of Interest

The authors declare no conflict of interest.

References

  1. Kinkaid, N.M.; O’Reilly, O.M.; Papadopoulos, P. Automotive disc brake squeal. J. Sound Vib. 2003, 267, 105–166. [Google Scholar] [CrossRef]
  2. Cantoni, C.; Cesarini, R.; Mastinu, G.; Rocca, G.; Sicigliano, R. Brake comfort—A review. Veh. Syst. Dyn. 2009, 47, 901–947. [Google Scholar]
  3. Papinniemi, A.; Lai, J.; Zhao, J.; Loader, L. Brake squeal: A literature review. Appl. Acoust. 2002, 63, 391–400. [Google Scholar] [CrossRef]
  4. Oberst, S.; Lai, J. Chaos in brake squeal noise. J. Sound Vib. 2011, 330, 955–975. [Google Scholar] [CrossRef]
  5. Eriksson, M.; Bergman, F.; Jacobson, S. Surface characterisation of brake pads after running under silent and squealing conditions. Wear 1999, 232, 163–167. [Google Scholar] [CrossRef]
  6. Eriksson, M.; Jacobson, S. Tribological surfaces of organic brake pads. Tribol. Int. 2000, 33, 817–827. [Google Scholar] [CrossRef]
  7. Österle, W.; Urban, I. Friction layers and friction films on PMC brake pads. Wear 2004, 257, 215–226. [Google Scholar] [CrossRef]
  8. Godet, M. The third-body approach: A mechanical view of wear. Wear 1984, 100, 437–452. [Google Scholar] [CrossRef]
  9. Jacko, M.; Tsang, P.; Rhee, S. Wear debris compaction and friction film formation of polymer composites. Wear 1989, 133, 23–38. [Google Scholar] [CrossRef]
  10. Ostermeyer, G.P. Friction and wear of brake systems. Forsch. Ingenieurwesen 2001, 66, 267–272. [Google Scholar] [CrossRef]
  11. von Wagner, U.; Hochlenert, D.; Hagedorn, P. Minimal models for disk brake squeal. J. Sound Vib. 2007, 302, 527–539. [Google Scholar] [CrossRef]
  12. Lyu, H.; Walsh, S.J.; Chen, G.; Zhang, L.; Qian, K.; Wang, L. Analysis of Friction-Induced Vibration Leading to Brake Squeal Using a Three Degree-of-Freedom Model. Tribol. Lett. 2017, 65, 105. [Google Scholar] [CrossRef]
  13. Radníček, J.; Musil, M.; Gašparovič, L.; Bachratý, M. Influence of Material-Dependent Damping on Brake Squeal in a Specific Disc Brake System. Appl. Sci. 2021, 11, 2625. [Google Scholar] [CrossRef]
  14. Kim, C.; Kwon, Y.; Kim, D. Analysis of Low-Frequency Squeal in Automotive Disc Brake by Optimizing Groove and Caliper Shapes. Int. J. Precis. Eng. Manuf. 2018, 19, 505–512. [Google Scholar] [CrossRef]
  15. Abu Bakar, A.R.; Ouyang, H.; James, S.; Li, L. Finite element analysis of wear and its effect on squeal generation. Proc. Inst. Mech. Eng. Part D J. Automob. Eng. 2008, 222, 1153–1165. [Google Scholar] [CrossRef]
  16. Belhocine, A.; Ghazaly, N.M. Effects of Young’s Modulus on Disc Brake Squeal using Finite Element Analysis. Int. J. Acoust. Vib. 2016, 21, 292–300. [Google Scholar] [CrossRef]
  17. Wenzhu, W.; Gang, L.; Mianhong, C. Prediction and Influence Factors Analysis of Disc Brake Squeal. SAE Tech. Pap. 2018. [Google Scholar] [CrossRef]
  18. Kang, J. Automotive brake squeal analysis with rotating finite elements of asymmetric disc in time. J. Sound Vib. 2017, 393, 388–400. [Google Scholar] [CrossRef]
  19. De, S.; Rivera, Z.; Guida, D. Finite element analysis on squeal-noise in railway applications. FME Trans. 2018, 46, 93–100. [Google Scholar] [CrossRef] [Green Version]
  20. Stender, M.; Tiedemann, M.; Spieler, D.; Schoepflin, D.; Hoffmann, N.; Oberst, S. Deep learning for brake squeal: Brake noise detection, characterization and prediction. Mech. Syst. Signal Process. 2020, 149, 107181. [Google Scholar] [CrossRef]
  21. Graf, M.; Ostermeyer, G.-P. Instabilities in the sliding of continua with surface inertias: An initiation mechanism for brake noise. J. Sound Vib. 2011, 330, 5269–5279. [Google Scholar] [CrossRef]
  22. Hetzler, H.; Willner, K. On the influence of contact tribology on brake squeal. Tribol. Int. 2012, 46, 237–246. [Google Scholar] [CrossRef]
  23. Reichert, S.; Lorentz, B.; Albers, A. Influence of flattening of rough surface profiles on the friction behaviour of mixed lubricated contacts. Tribol. Int. 2016, 93, 614–619. [Google Scholar] [CrossRef]
  24. Albers, A.; Reichert, S. On the influence of surface roughness on the wear behavior in the running-in phase in mixed-lubricated contacts with the finite element method. Wear 2017, 376-377, 1185–1193. [Google Scholar] [CrossRef]
  25. Lorentz, B.; Albers, A. A numerical model for mixed lubrication taking into account surface topography, tangential adhesion effects and plastic deformations. Tribol. Int. 2013, 59, 259–266. [Google Scholar] [CrossRef]
  26. Reichert, S.; Lorentz, B.; Heldmaier, S.; Albers, A. Wear simulation in non-lubricated and mixed lubricated contacts taking into account the microscale roughness. Tribol. Int. 2016, 100, 272–279. [Google Scholar] [CrossRef]
  27. Joerger, A.; Reichert, S.; Wittig, C.; Sistanizadeh Aghdam, N.; Albers, A. An Approach for the Transfer of Real Surfaces in Finite Element Simulations. Lubricants 2021, 9, 77. [Google Scholar] [CrossRef]
  28. Bowden, F.P.; Tabor, D. The Friction and Lubrication of Solids; Oxford University Press: New York, NY, USA, 2008. [Google Scholar]
  29. Archard, J.F. Contact and Rubbing of Flat Surfaces. J. Appl. Phys. 1953, 24, 981–988. [Google Scholar] [CrossRef]
Figure 1. Coupled method for analyzing brake squealing on different scales. The method starts with the real physical system. The upper path comprises virtual simulations to depict influences on different scales. The lower path considers the physical validation of the measured vibrations of a brake system on a test bench. A key element in the entire engineering process is the product developer, who interprets and assesses the data from each method.
Applmech 02 00060 g001
Figure 2. FE assembly model with two bodies with real surfaces. The lower body (base) has the real surface from the brake pad and the upper body (slider) has the real surface of the brake disc. The damping plate is implemented to reduce oscillations, which are induced by applying the normal force and by the contact computation.
Applmech 02 00060 g002
Figure 3. Flowchart of the simulation process. The coefficient of friction only influences the input to the MBS and is related to the oscillating contact force signal, which is the output from the MBS and serves as excitation to the modal dynamic simulation. This contact force signal is not acoustics, and the excitation frequencies are not acoustic frequencies. It is the vibrational system answer of the FE modal analysis to this excitation, which should correlate to acoustics.
Applmech 02 00060 g003
Figure 4. Experimental set-up of the static modal analysis of the brake disc.
Applmech 02 00060 g004
Figure 5. Pseudo-discretized disc (rigid body), divided into 4 sub discs with three fixed joints at the axis. Tessellated contact surface.
Applmech 02 00060 g005
Figure 6. Flowchart of the load case generation for the modal dynamic analysis.
Applmech 02 00060 g006
Figure 7. Brake system on the test bench. The green dot on the brake disc was the laser dot from the laser vibrometer.
Applmech 02 00060 g007
Figure 8. Surfaces of the brake disc (a) and brake pad (b). The disc’s surface shows manufacturing marks and grain outbreaks. The pad’s surface shows an unstructured surface with plateaus.
Applmech 02 00060 g008
Figure 9. (a) Wear at surface nodes of lower part after the first computation. (b) Wear at surface of lower part after 200 iterations. (c) Focus on surface after first computation. (d) Focus on surface after 20 iterations. The comparison of (c) and (d) shows that the surface is flattened at the colored areas. The flattening was computed according to Archard’s wear law.
Applmech 02 00060 g009
Figure 10. Results of the FE computation of the coefficients of friction. (a) Real contact area evolution. (b) Wear depth evolution. (c) Coefficient of friction evolution. (d) Evaluation of coefficient of friction at different pressures and distances.
Applmech 02 00060 g010
Figure 11. Coefficient of friction distribution between pad and disc as a function of relative velocity and contact pressure. The orange lines indicate where the values are determined with microscale simulation. Outside of the measured area, the values have been extrapolated as constant values.
Applmech 02 00060 g011
Figure 12. Definition of directions.
Applmech 02 00060 g012
Figure 13. In phase oscillation of both brake pads tangential to the rotation. Operation point: p 1 = 1   MPa , ω 1 = 8.5   rad / s .
Applmech 02 00060 g013
Figure 14. Oscillation of normal contact forces at the pseudo-discretized patch-pad pairing. Operation points 1: p 1 = 1   MPa , ω 1 = 8.5   rad / s .
Applmech 02 00060 g014
Figure 15. Oscillation of both brake pads tangential to the rotation, critically stable mode. Operation points 3: p 3 = 3   MPa , ω 3 = 12.0   rad / s .
Applmech 02 00060 g015
Figure 16. Oscillation of normal contact forces at the pseudo-discretized patch-pad pairing. Operation points 3: p 3 = 3   MPa , ω 3 = 12.0   rad / s .
Applmech 02 00060 g016
Figure 17. Results of the experimental static modal analysis.
Applmech 02 00060 g017
Figure 18. Results of the experimental dynamic modal analysis.
Applmech 02 00060 g018
Figure 19. (a) Surface of the new brake pad (b) Surface of the used brake pad.
Applmech 02 00060 g019
Figure 20. Mode shape comparison between simulation (a,c) and experiment (b,d).
Applmech 02 00060 g020
Figure 21. Mode shapes at 16.6 kHz (a) Computed (b) Experimentally measured. On the circumference lie multiple oscillating spikes, which are visible in the simulation the experiment.
Applmech 02 00060 g021
Table 1. Comparison of the first eigenfrequencies of the brake disc in simulation and test.
Mode (FEM)Freq. [Hz] SimulationFreq. [Hz] TestDeviation [%]
1/2256.2/257.62674.1
3436.64321.1
4/5675.5/676.56632.0
6729.8
7/8910.9/914.5
9/101660.0/1662.516192.7
11/121915.3/1915.7
132005.5233814.2
14/152435.9/2445.9
16/172844.0/2848.427164.9
18337.3307515
Publisher’s Note: MDPI stays neutral with regard to jurisdictional claims in published maps and institutional affiliations.

