Article

A Patient-Specific Algorithm for Lung Segmentation in Chest Radiographs

by
Manawaduge Supun De Silva
1,*,
Barath Narayanan Narayanan
1,2 and
Russell C. Hardie
1
1
Department of Electrical and Computer Engineering, University of Dayton, 300 College Park, Dayton, OH 45469, USA
2
Sensors and Software Systems Division, University of Dayton Research Institute, 1700 South Patterson Blvd., Dayton, OH 45409, USA
*
Author to whom correspondence should be addressed.
AI 2022, 3(4), 931-947; https://doi.org/10.3390/ai3040055
Submission received: 31 October 2022 / Revised: 14 November 2022 / Accepted: 14 November 2022 / Published: 18 November 2022
(This article belongs to the Special Issue Feature Papers for AI)

Abstract

:
Lung segmentation plays an important role in computer-aided detection and diagnosis using chest radiographs (CRs). Currently, the U-Net and DeepLabv3+ convolutional neural network architectures are widely used to perform CR lung segmentation. To boost performance, ensemble methods are often used, whereby probability map outputs from several networks operating on the same input image are averaged. However, not all networks perform adequately for any specific patient image, even if the average network performance is good. To address this, we present a novel multi-network ensemble method that employs a selector network. The selector network evaluates the segmentation outputs from several networks; on a case-by-case basis, it selects which outputs are fused to form the final segmentation for that patient. Our candidate lung segmentation networks include U-Net, with five different encoder depths, and DeepLabv3+, with two different backbone networks (ResNet50 and ResNet18). Our selector network is a ResNet18 image classifier. We perform all training using the publicly available Shenzhen CR dataset. Performance testing is carried out with two independent publicly available CR datasets, namely, Montgomery County (MC) and Japanese Society of Radiological Technology (JSRT). Intersection-over-Union scores for the proposed approach are 13% higher than the standard averaging ensemble method on MC and 5% better on JSRT.

1. Introduction

1.1. Background

Chest radiography is a simple and relatively low-cost and low-dose imaging modality for the detection and diagnosis of lung disease and related conditions. Computer-aided detection (CADe) and computer-aided diagnosis (CADx) using chest radiographs (CRs) have been popular areas of research in recent years [1,2,3]. Lung segmentation in CRs is a prerequisite step in most such algorithms. Lung boundaries limit the attention of these algorithms to the lung region to prevent non-salient information from impacting the subsequent lung analysis. Lung segmentation can provide a spatial limit on CADe outputs such as lung nodule boundaries, infections, atelectasis, etc. Furthermore, accurate lung boundaries can be used to provide estimates of lung volume and size.
Many different automated lung segmentation methods for CRs have been proposed in the literature [4,5]. These include rule-based methods [6,7,8], pixel classification [9], active shape models [1,10,11,12], hybrid methods [13,14,15], and deep learning methods [16,17,18,19,20]. Recently, deep learning methods using convolutional neural networks (CNNs) have emerged as among of the best performing approaches for lung segmentation in CRs. U-Net [21] and DeepLabv3+ [22] are among the popular CNNs for many semantic segmentation tasks in medical image analysis, including lung segmentation in CRs.

1.2. Ensemble Methods for Lung Segmentation

While individual CNNs can often generate accurate lung segmentation results in CRs, the presence of lung disease or certain differences among patients can cause lung segmentation results that are poor. Different networks (including variations of the same network) may perform better on some patients than others. For this reason, researchers have explored ensemble methods, whereby several networks are run in parallel on a given CR and the results are then fused to add robustness [23].
The ensemble segmentation model proposed in [24] generates five segmentation masks and uses a majority voting technique to form the final segmentation mask. The individual masks are generated by five U-Nets with two backbone architectures (EfficientNet v0 and v7 [25]). In [23], the probability scores provided by U-Net and DeepLabv3+ (by assigning each pixel a label of ‘lung’ or ‘not lung’) were averaged and thresholded at 0.5 to generate a final lung segmentation mask. The ensemble methods introduced in [26] use probability scores from DeepLabv3+ models, with Xception and InceptionResnetV2 as the backbone architectures. The fusion of the probability scores was similar to [23]. Another approach for fusing the probability scores generated by U-Net and DeepLabv3+ was shown in [27]. Each of the score maps is multiplied by weighting values. The weights are calculated based on the validation set’s error rate for the corresponding model. In order to produce a final segmentation, the softmax activation function is applied to decide the pixels in the target segmentation area [27].
An earlier ensemble approach used for lung segmentation, presented in [28], uses the summation of an AlexNet CNN [29] and ResNet CNN lung mask. A reconstruction step is used with a ResNet-based CNN to generate a final lung mask. In [30], fusion was implemented at the feature level, prior to reaching the final probability map. The overall network has an encoder–decoder structure. However, multiple networks (SqueezeNet [31], ShuffleNet [32], and EfficientNet-B0 [25]) encode the input CR. Fusion of the encoded features is performed as a depth-wise concatenation and used as the input to the decoder.

1.3. Contributions

One of the challenges with ensemble methods is that an individual segmentation with low accuracy can corrupt the fusion result. For any specific patient image, certain networks may perform adequately, while others may break down. Therefore, in this paper, we propose a selector-based ensemble fusion method. First, a collection of networks based on U-Net and DeepLabv3+ were individually trained for lung segmentation. We then introduce a new deep learning selector network to classify the outputs as ‘selected’ or ‘not selected’. Only the selected outputs are fused by averaging their segmentation probability maps. During the training phase for the selector network, a training label of ‘selected’ is assigned to a segmentation mask known to have an intersection over union (IoU) score greater than or equal to 0.90. Our selector network architecture is a ResNet18 CNN trained using transfer learning to initialize. During the testing phase, the selector network examines each individual lung segmented CR and predicts which have a truth with an IoU greater than or equal to 0.9. Only these selected outputs are fused. Thus, a custom combination of networks is applied to each input image. In this sense, the proposed method provides a patient-specific ensemble fusion that seeks to combine only those networks that are suitable for the given patient.
We used publicly available data to train and test the proposed method and two benchmark methods. One dataset was used exclusively for training, and the other two for testing, and the testing data were completely independent from the training data. The testing data contained CRs with a mix of normal cases, cases with tuberculosis (TB), and cases with lung nodules. This allowed us to study the robustness of the proposed method. Furthermore, in order to demonstrate how improved lung segmentations can be used to enhance CADe, we conducted a TB detection experiment using the same datasets. In particular, we studied the performance of a TB detection algorithm [33] with different segmentation masks. We compared TB detection performance using images limited by three ensemble lung-segmentation methods, including the proposed selector-ensemble lung segmentation method.

1.4. Paper Organization

The next sections of this paper are organized as follows. Section 2 contains descriptions of the datasets used. The proposed selector ensemble lung segmentation method is presented in detail in Section 3. Next, the experimental results are presented in Section 4. These results include a lung segmentation performance analysis and an analysis of TB detection using various lung segmentation methods. Finally, Section 5 provides a discussion of the methods and results. Here, we offer our conclusions. Table 1 shows the list of acronyms and the corresponding definitions used throughout the paper.

2. Materials

The primary databases used to train and test our proposed system were formulated from three publicly available datasets that are widely used in CADe and CADx systems that detect and diagnose pulmonary diseases. The databases were the Shenzhen chest X-ray set [34], Montgomery County (MC) chest X-ray set [34], and Japanese Society of Radiological Technology (JSRT) database [35]. Figure 1 shows examples from each database. A 400-image partition of the Shenzhen dataset was used to train the individual lung segmentation networks. The selector network was trained using the remaining 166 images in the Shenzhen dataset. The other two datasets were used exclusively for testing the final segmentation performance and for testing the TB detection network. The CRs in all three datasets were zero-padded symmetrically as needed to create a square aspect ratio and then resized through bicubic interpolation to 256 × 256 to match the input layers of the lung segmentation networks.

2.1. Shenzhen Dataset

One of the datasets made public in [34] is the Shenzhen dataset gathered by the US National Library of Medicine in collaboration with Shenzhen No. 3 People’s Hospital, Guangdong Medical College, Shenzhen, China. There are a total of 662 CRs in the Shenzhen dataset with and without manifestations of TB. The patients’ age range in the Shenzhen dataset starts from pediatric cases. The images are published in grayscale and approximately 3000 × 3000 in size. The original radiographs of this dataset were captured by a Philips DR DigitalDiagnost system. Manually segmented lung masks for 566 of these CRs were used as ground truth similar to [36,37,38].

2.2. MC Dataset

The MC dataset was created by the US National Library of Medicine using CRs collected from the Department of Health and Human Services, Montgomery County, Maryland, USA. The MC dataset consists of posteroanterior CRs, with the disease focus on pulmonary TB. The radiographs in the dataset were captured by a Eureka stationary X-ray machine. The MC set contains 138 frontal CRs as grayscale images of sizes 4020 × 4892 or 4892 × 4020 pixels. The MC dataset and the corresponding ground truth for this dataset are publicly available [34].

2.3. JSRT Dataset

The JSRT database is a publicly available dataset described in [35]; it consists 247 posteroanterior CRs collected from 14 medical centers. A total of 154 of the radiographs contain lung nodules, and the rest do not. From the 154 cases, 14 cases with juxtapleural nodules were omitted to match the dataset used in [23], which we used as a benchmark to compare our results. The published CRs are grayscale and 2048 × 2048 pixels in size. There are both male and female radiographs included in approximately equal numbers. The ages of the patients range from 21 to over 71 years old. We used manual segmentations available from [10] as ground truth.

2.4. Dataset Usage

Table 2 summarizes the use of each dataset for algorithm training and testing. A 400-image partition of the Shenzhen dataset was used to train each of the seven lung segmentation networks (versions of U-Net and DeepLabv3+), as shown in Column 2. A separate 166-image partition was used to validate the lung segmentation networks during training. The training and testing of the selector network classifier were performed using the 166 CR partition, as shown in Column 3. All segmentations produced by the seven lung segmentation networks for the 166 CR partition formed a dataset of 1162 segmented lung images, which was randomly split into 72%, 8%, and 20% for training, validation, and testing, respectively. The final segmentations were evaluated using independent datasets, as shown in Column 4. The last two columns in Table 2 refer to the data used during TB detection. Note that these datasets were used with and without segmentations generated by our method for training and testing to compare the results.

3. Methods

3.1. Overview

We propose an ensemble approach for lung segmentation that uses a novel selective method to select lung segmentation networks that produce the best segmentations for a given CR. To create the collection of networks to select from, we used U-Nets with depths varying from 1–5 and DeepLabv3+ with two base networks, ResNet18 and ResNet50. The Shenzhen dataset was separated into a 400-image partition and a 166-image partition to train the collection of lung segmentation networks. All images were zero-padded to become square images and resized to 256 × 256 to match the inputs of the networks. The length of the third dimension of the input was maintained at 1 for U-Net and at 3 by duplicating the same image three times for DeepLabv3+ networks.
The introduced selective method is a deep learning model that classifies whether a certain lung segmentation network is ‘selected’ or ‘not selected’, indicating whether the segmentation produced by that network is accurate/has a high IoU with the true lung mask. Therefore, the lung segmentations generated by all seven networks for the 166 CR partition were re-labeled based on the resulting lung mask’s IoU with the true lung mask: ‘not selected’ if IoU < 0.9 and ‘selected’ if IoU 0.9 
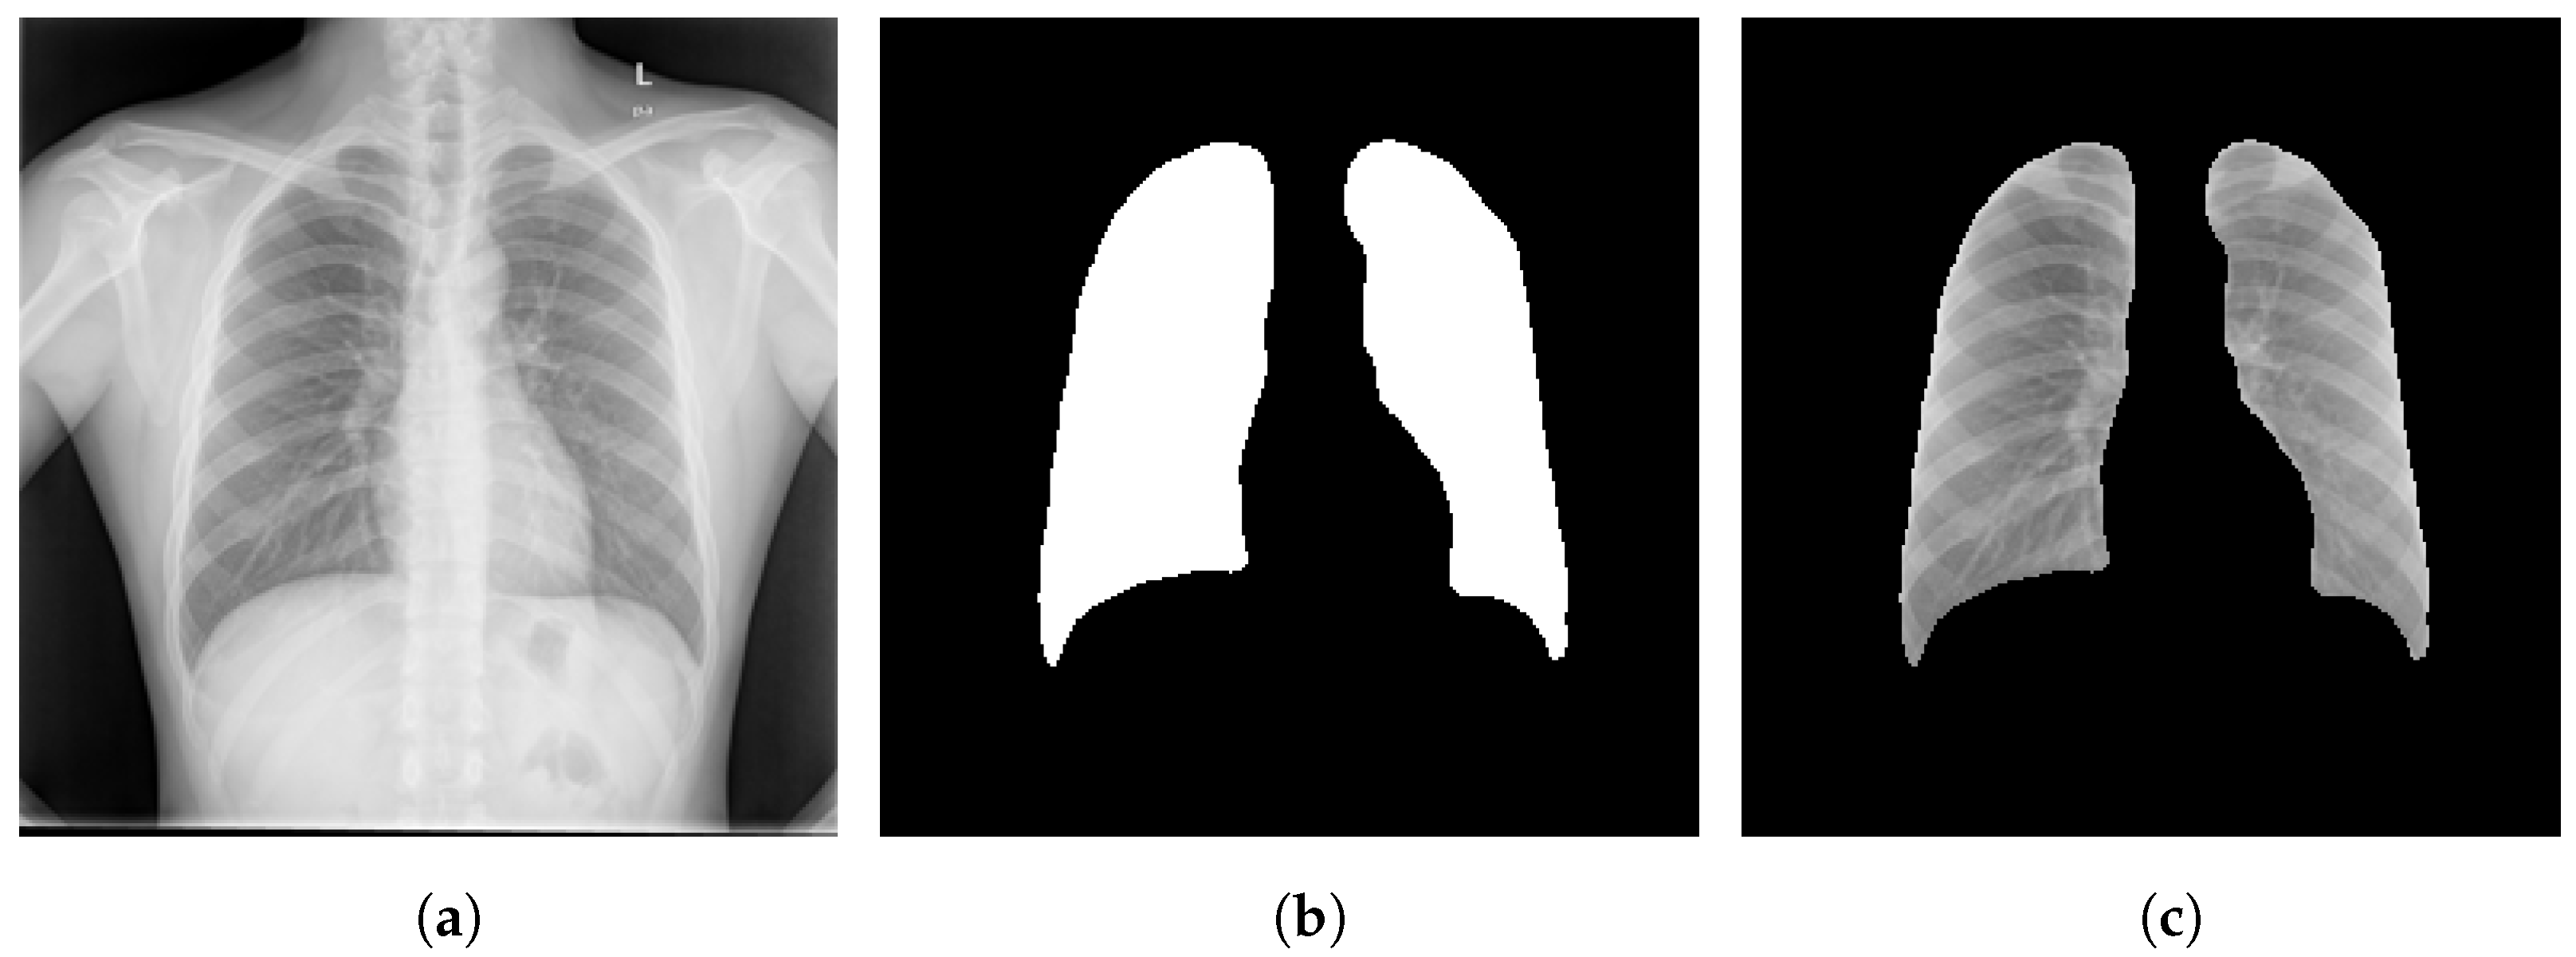
. This labeled dataset formed using the 166 CR partition was used to train the selective model, which is referred to as the selector network classifier throughout this paper. It is important to note that the segmentation masks generated by all the above-mentioned networks are applied to the original image, as shown in the example in Figure 2, to reform the 166 CR partition to be used as training and testing sets for this selector network. The example in Figure 2 shows a CR, a lung mask with an IoU 0.9 generated by DeepLabv3+ with ResNet50 for this CR, and the CR segmented using the mask. Then, this dataset was divided into training (72%), validation (8%), and test (20%) datasets to fine-tune a ResNet18 [39] pre-trained on ImageNet [40] that classifies between ‘selected’ and ‘not selected’ images.
We identified which network(s) generated segmentations for a test case ‘selected’ using the selector network classifier. The test case was then segmented using the identified networks to generate ‘selected’ segmentations, the pixel scores were averaged, and a threshold (<0.5) was applied to generate a binary mask. If none of the networks generated ‘selected’ segmentations, the corresponding test case was considered to not meet the necessary standards. For such a case, the algorithm does not proceed to output a segmentation. Therefore, the performance was solely estimated based on the cases that are selected.

3.2. U-Net Lung Segmentation Network Architectures

U-Net is a network that is popular in segmenting tasks related to medical images. The U-Net architecture starts with a contracting path that is similar to a convolutional network architecture and targets capturing the context of an input to the network [21]. The context is captured by downsampling within the contracting path. The contracting path is followed by an expanding path that upsamples the captured context similar to a decoder and performs a precise localization [21]. The feature maps on expanding path concatenate with feature maps from the contracting path via skip connections, regaining information that may have been lost during downsampling.
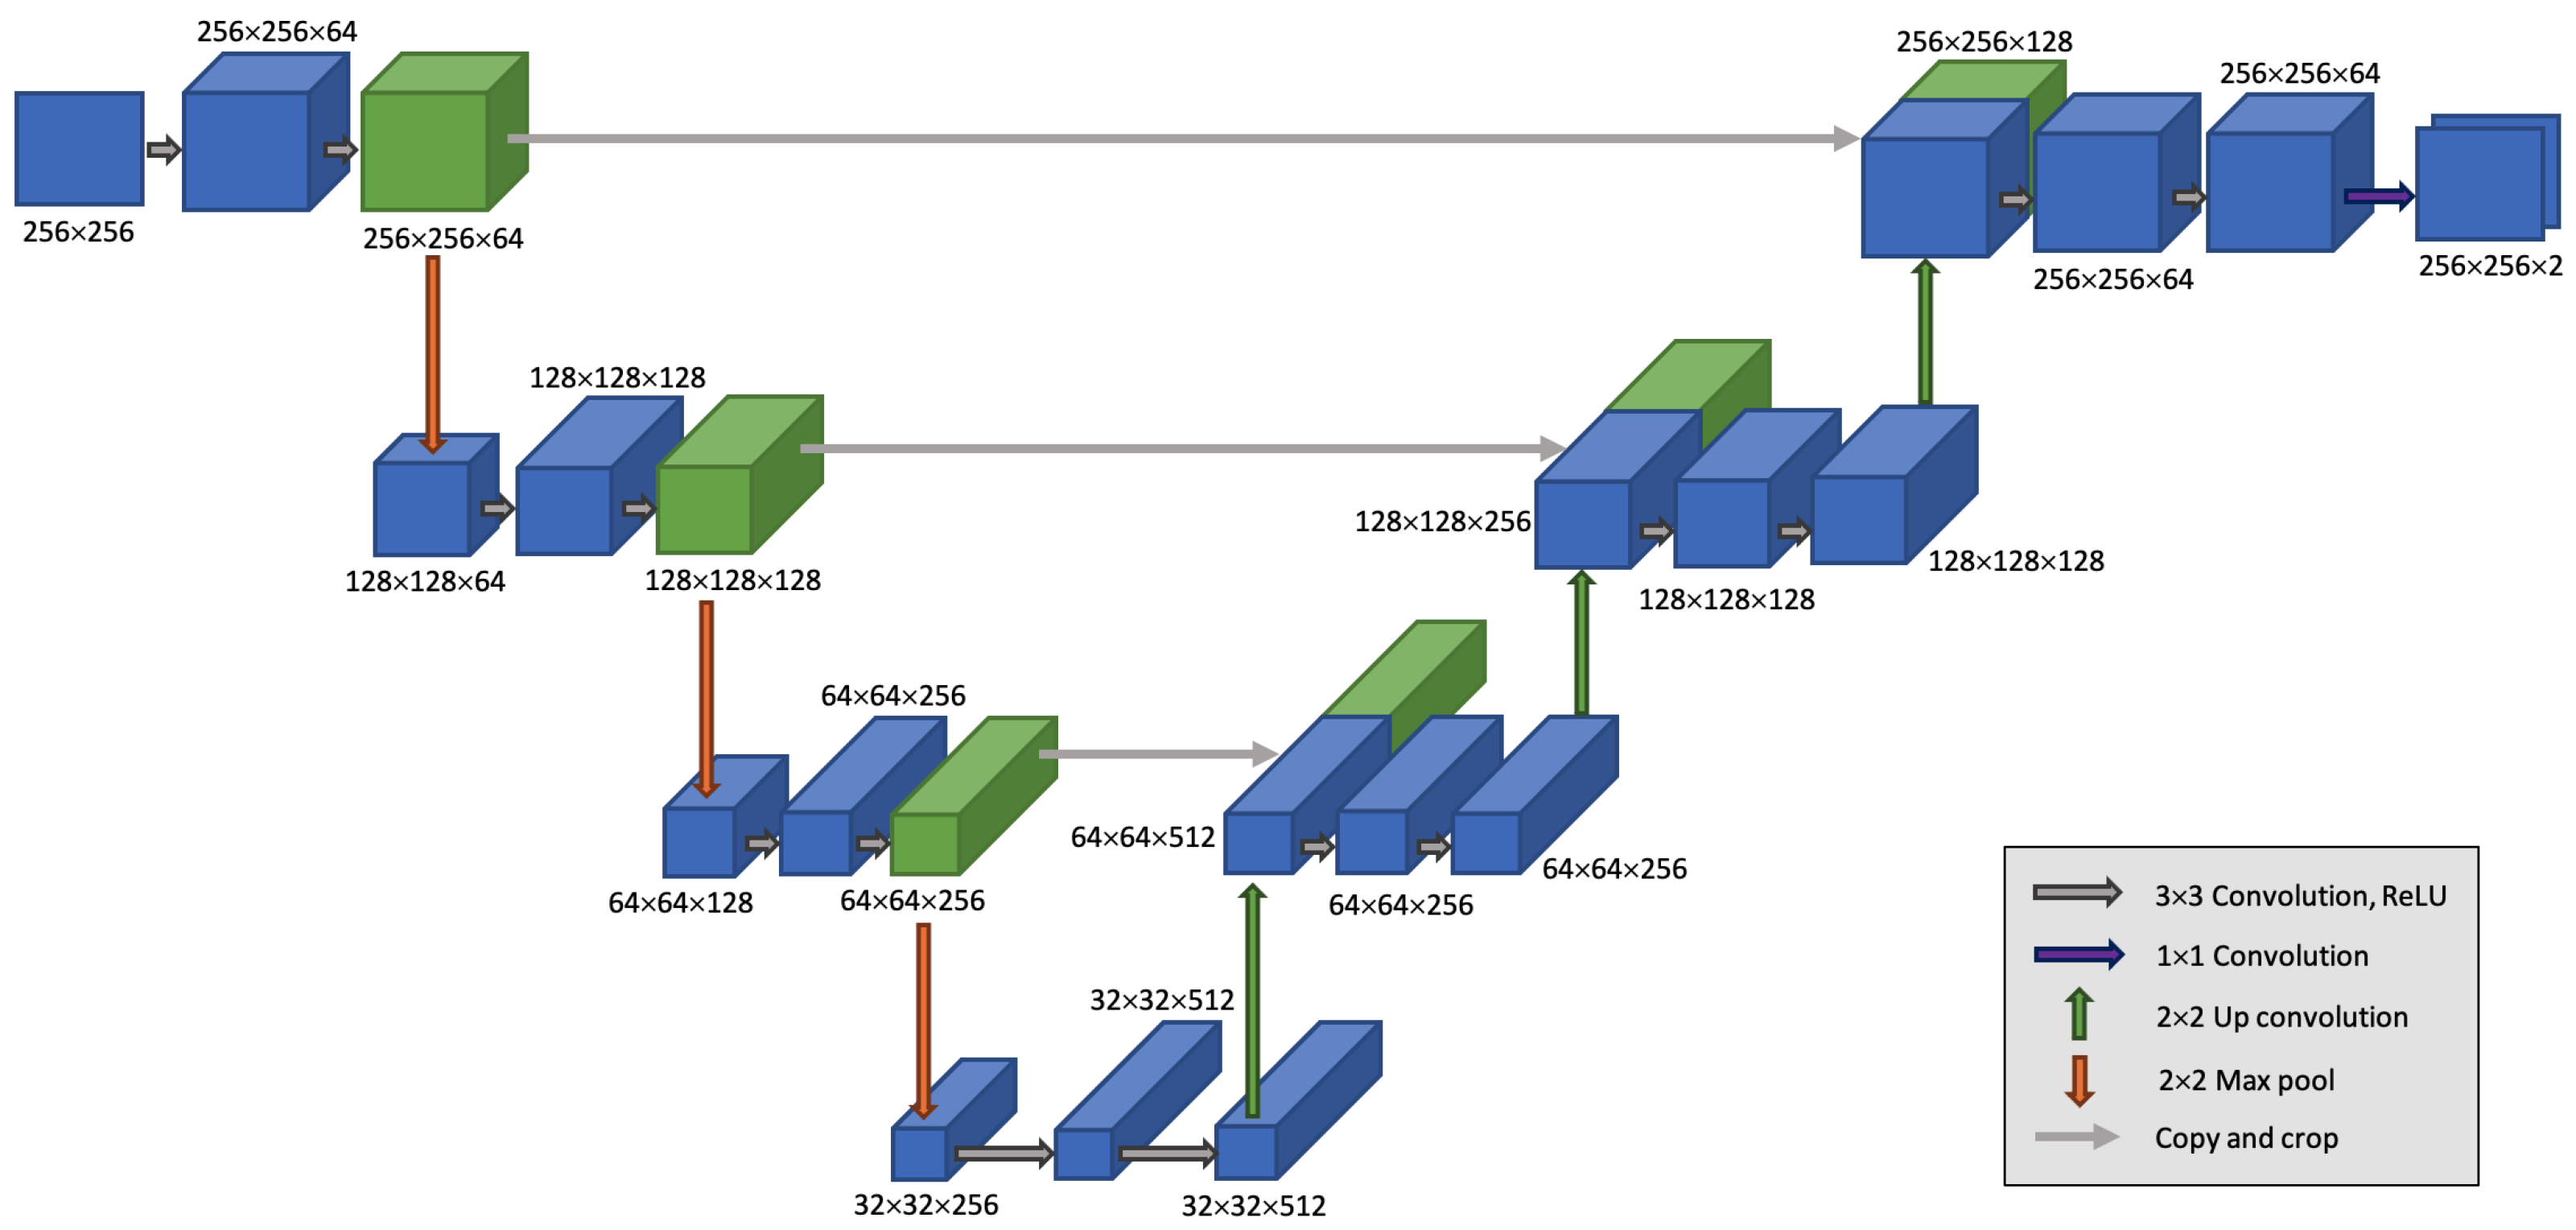
The basic building block of a downsampling step in the contracting path consists of two 3 × 3 convolutions without padding, each followed by a ReLU layer, and a 2 × 2 max pooling layer with a stride of 2 [21]. Figure 3 shows an example U-Net architecture that exhibits each step of this path. In the expanding path, a block starts with a 2 × 2 up-convolution. This is followed by concatenation with the contracting path’s feature maps and two 3 × 3 convolutions (each followed by a ReLU layer) [21]. The depth of a U-Net can be changed based on the number of such blocks used in the contracting (encoder) path of the architecture; the same number of blocks on the expanding path decodes the encoded features. After the contracting path, the third dimension of the feature vector is mapped to the number of classes using a 1 × 1 convolution. We used five U-Net architectures with depths from 1 to 5 in the collection of initial networks considered by the selector network classifier. The example U-Net architecture in Figure 3 has a depth of 3, where the lowest resolution reaches 32 × 32 pixels.

3.3. DeepLabv3+ Lung Segmentation Network Architectures

DeepLabv3+ is another encoder–decoder structure-based deep convolutional network that is widely used for semantic segmentation of medical images. It uses Atrous Spatial Pyramid Pooling (ASPP) to encode the contextual information at multiple scales, and the decoding path effectively recovers the boundaries of the object being segmented [22]. In the DeepLabv3+ architectures used to generate results for the proposed method, pre-trained ResNet18 and ResNet50 CNN models were used as the underlying feature extractors during encoding.

3.4. Selector Network Classifier Architecture

An image subjected to the proposed method proceeds to a network classifier that predicts which of the seven initial networks (five U-Net and two DeepLabv3+ versions) outputs the best segmentations. The selection of the best network is made by a pre-trained ResNet18 model that predicts one out of the ‘selected’ or ‘not selected’ classes as the output corresponding to each network. Therefore, the ResNet18 architecture was altered to classify between two classes. During training, the Adam optimizer was used along with other training parameters, with a mini-batch size set to 16, initial learn rate of 1 × 10 4 , and validation enabled to select a model. The training and validation data were shuffled at each epoch and before each network validation at 50 iterations. The training continued until reaching 30 epochs or three occurrences where loss on validation was larger than or equal to the previously smallest loss. We call this classifier network the selector network classifier.
It is important that the segmented portion of the CR is extracted, similar to the image in Figure 2c, for use in the training set or in testing. The labels of the training set for this network classifier are based on the IoU between the segmentation masks produced by seven initial networks and the true lung mask; a threshold of 0.9 for the IoU decides whether a segmentation is acceptable. When a segmented CR is tested with the selector network classifier, the posterior probabilities predicted for the ‘selected’ class are observed and a threshold of 0.5 is applied to decide whether the segmentation belongs in the ‘selected’ class.

3.5. Fusion Technique

For a given CR, the segmentation masks produced by the networks selected by the selector network classifier are fused to obtain a final segmentation mask of the lungs. The scores assigned to each pixel on the semantic segmentations generated by each selected network are averaged to obtain a single score distribution for the image. Then, the averaged score distribution is binarized by applying a threshold of 0.5 such that the possible lung area is assigned a binary value of 1. Morphological operations are applied following the binarization to fill any holes within objects and to select the largest two objects within the image.
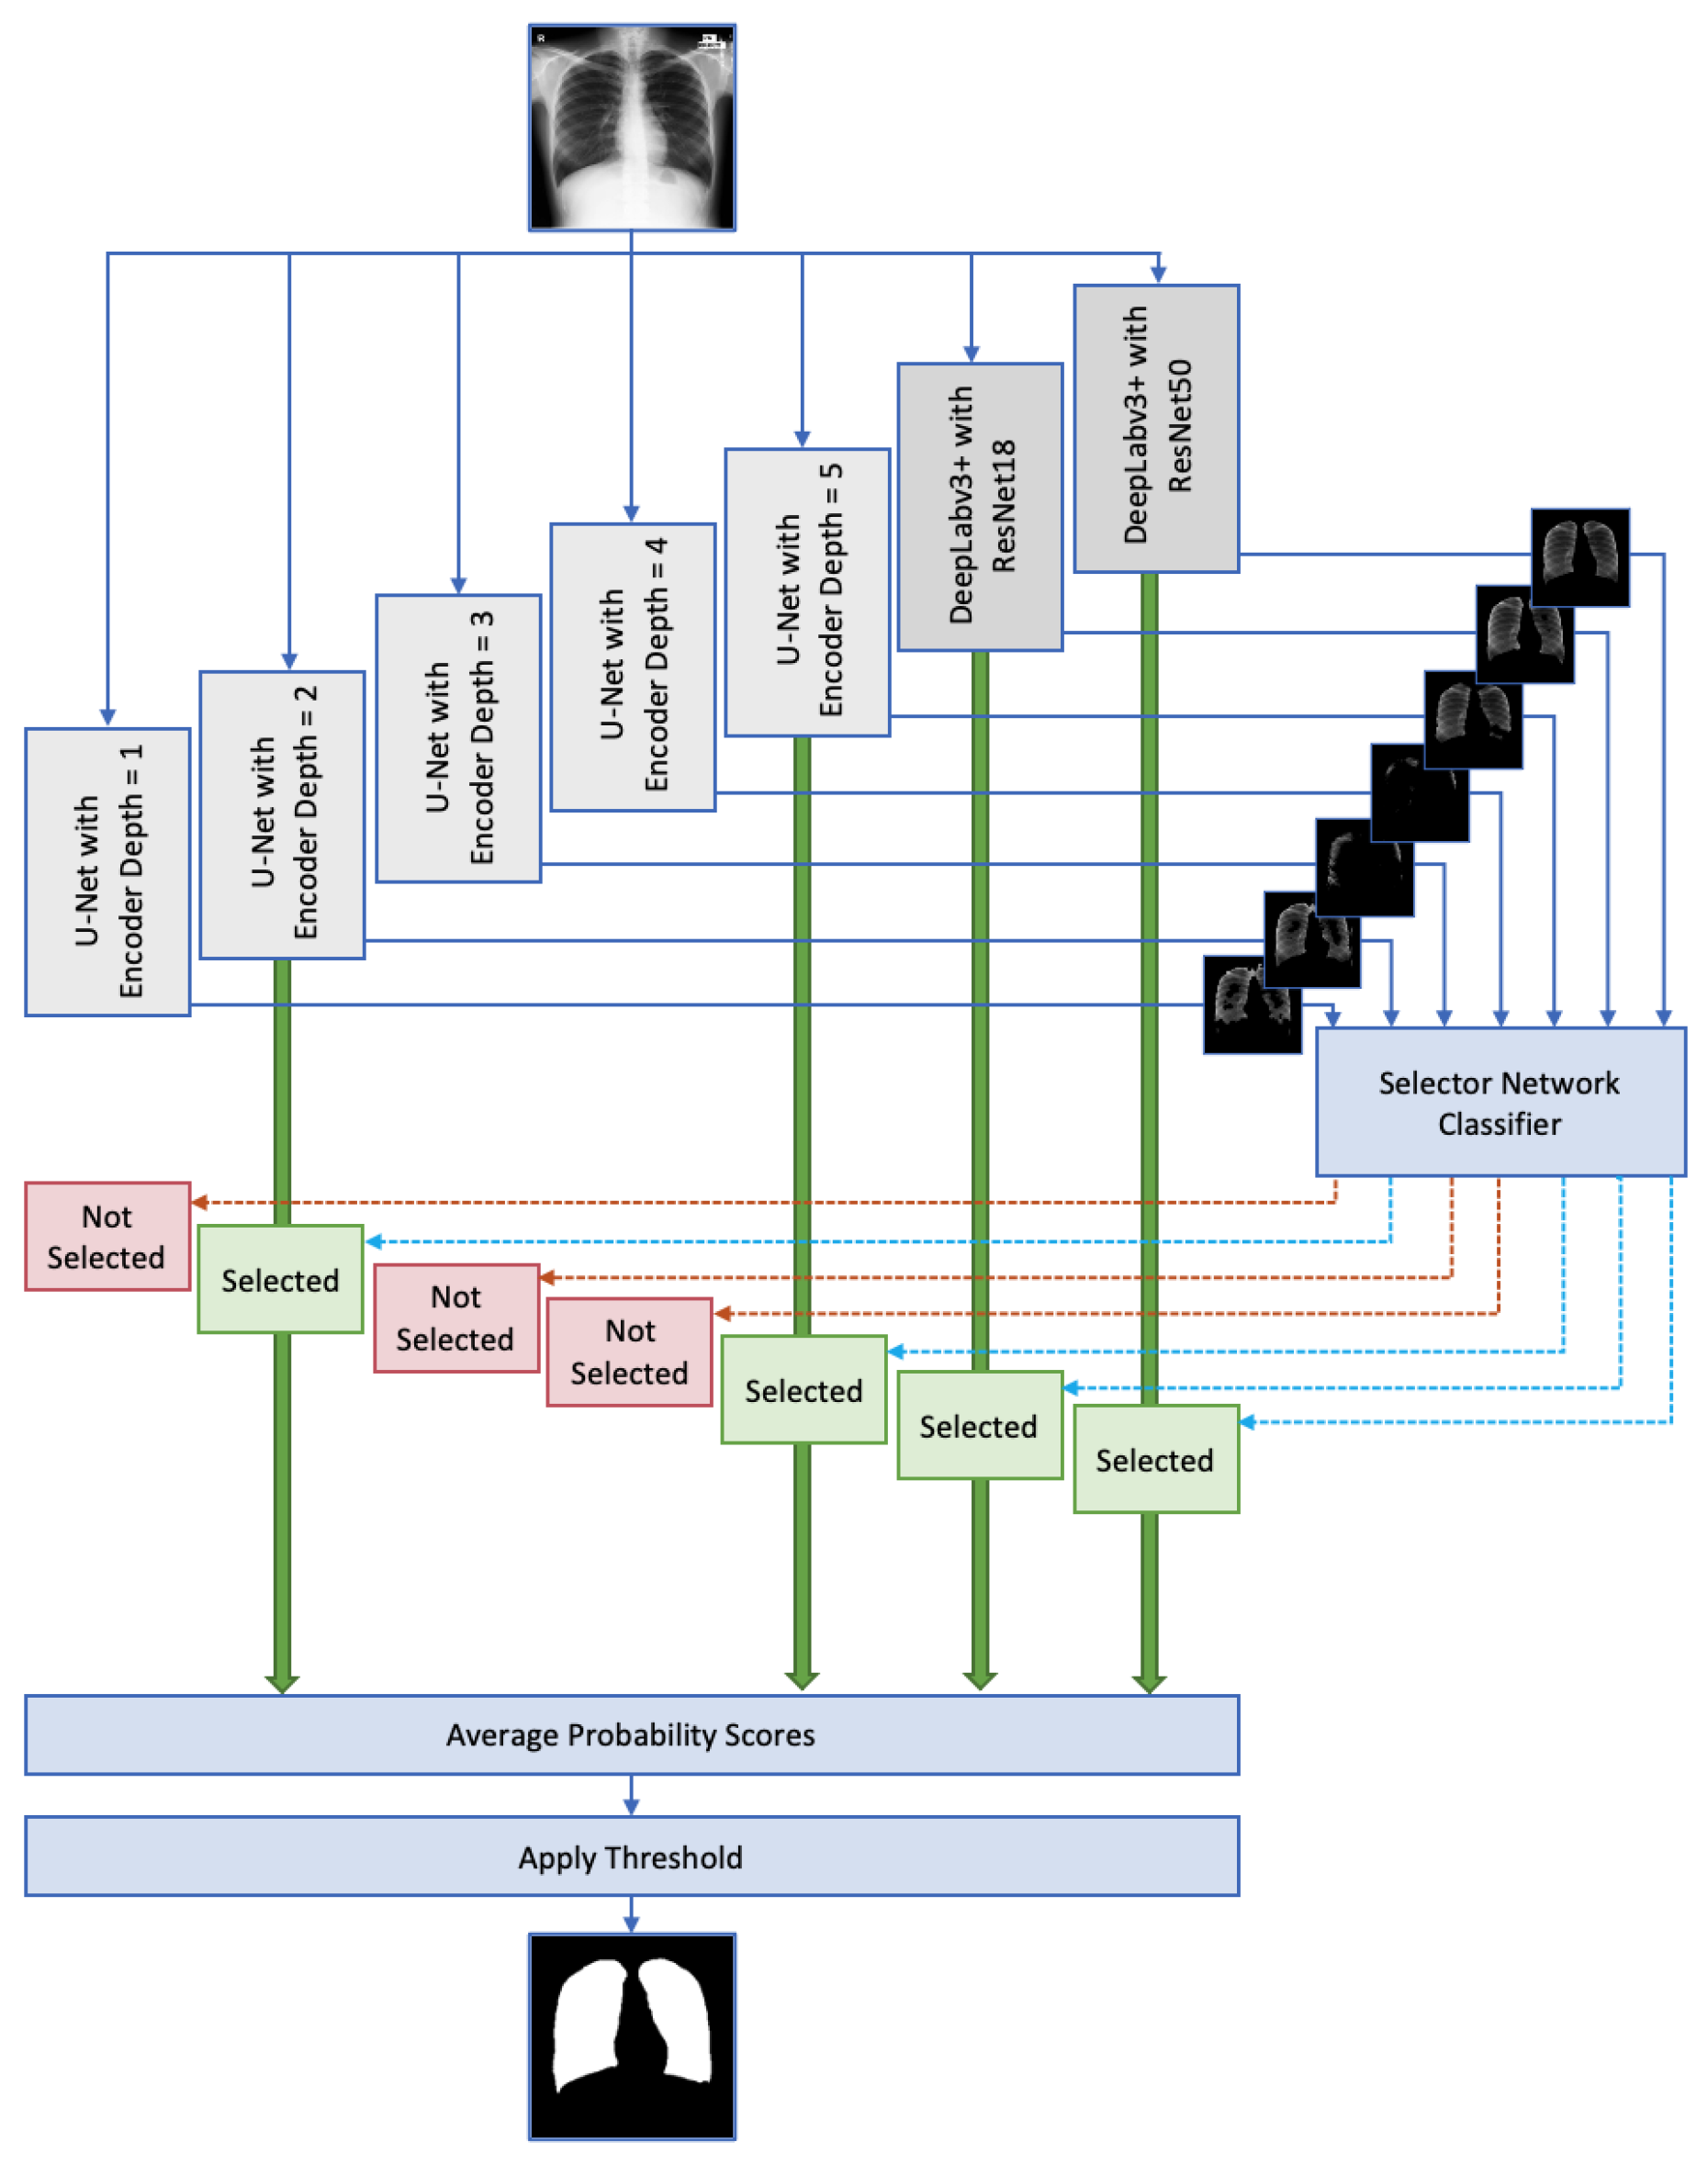
Figure 4 shows the block diagram for the overall system. A CR is segmented by 7 initial networks, and each one of them is classified as ‘selected’ or ‘not selected’ by the selector network classifier. The networks are shown at the top of Figure 4, and the selector network classifier is shown below to the right of them, while the inputs to are indicated by arrows. The arrows that exit the selector network classifier are shown in two colors to represent ‘selected’ and ‘not selected’ predictions. Note that the set of predictions shown in Figure 4 is an example that can be output by the selector network classifier. Then, networks corresponding to the ‘selected’ cases are averaged and a threshold is applied to produce a binary segmentation mask. The large green arrows shown as inputs to the ‘Average Probability Scores’ block in Figure 4 represents the probability score distributions output from ‘selected’ networks. The input arrow to the ‘Apply Threshold’ block represents the average probability distribution produced for the image. The arrow that exits this block shows the final binary lung mask after a threshold is applied.

4. Results

In this section, the results obtained by the proposed method are presented in detail, along with any intermediate results that lead to the final outcome. The performance of the proposed approach is observed for different datasets, as mentioned in Section 2, with respect to the mean IoU values of the segmentations. Furthermore, the performance evaluation only considers CRs that are predicted to have segmentations with an IoU larger than or equal to 0.9 produced by one or more of the seven initial networks (five U-Net and two DeepLabv3+ architectures). In order to exhibit robustness and generalizability, the complete experiment was run ten times, with results recorded at each trial in addition to the use of different datasets. We ensured that a different set of random initial weights were generated for each trial. The effectiveness of the proposed method is shown by comparing the results with two traditional methods extracted based on current popular ensemble methods in producing segmentations using an ensemble of networks. Moreover, the segmentations were used in an application where a deep learning algorithm detects TB in CRs.

4.1. Training Initial Networks

U-Net models with depths varying from 1 to 5 were trained with Shenzhen’s two-image partitions, then tested on the 166 CR partition. The mean IoU for the lung segmentation masks generated by the five U-Nets for the 166 CR partition for each trial is shown in Table 3. Note that the best performance value for each trial is marked in bold. During the majority of the trials, the best performance appears to be shown by the U-Nets with encoder depths of 4 and 5.
Trained DeepLabv3+ models with ResNet18 and ResNet50 as backbone networks for the encoder were tested using the 166 CR partition. The mean IoU of the corresponding lung segmentations generated in each trial are shown in Table 4, with the best performance values marked in bold. Except in Trial 9, DeepLabv3+ with ResNet50 shows the best performance, though the difference with ResNet18 is very slight in comparison.
In general, the performance values in both Table 3 and Table 4 are high, indicating that both the U-Net and DeepLabv3+ architectures generate state-of-the-art results in segmenting CRs. Therefore, these two types of networks are justifiable selections for the initial collection of networks needed to test the proposed method.

4.2. Categorization for Selector Network Classifier

The 166 CR partition extracted from the Shenzhen dataset was prepared for use as the training set for the selector network classifier. Therefore, the images were segmented by the initial seven networks, labeled as ‘selected’ and ‘not selected’ according to the IoU values, and sent as training data to the selector network classifier. From each network, the number and the appearance of ‘selected’ and ‘not selected’ cases are observed. The distribution of labeled cases for Trial 1 is shown in Table 5. The first five rows show the distribution for the U-Nets, while the last two rows show the label distribution for DeepLabv3+ models. The rows corresponding to U-Net with encoder depth 4 and DeepLabv3+ with ResNet50 are marked in bold because they are the models that displayed the best performances among the collection of networks.
According to Table 5, U-Net with encoder depth 4 selects a majority of the cases, while depths 1–3 and 5 do not show many cases as ‘selected’. The observation of the number of cases ‘selected’ for a network implies that the network has produced acceptable lung segmentations for these cases. It is clear that U-Net with depth 4 does a better job of generating segmentations with higher accuracy. Similarly, both DeepLabv3+ models show a high and almost the same number of ‘selected’ cases.
Figure 5 shows a set of randomly-picked example lung segmentations produced by the U-Nets and DeepLabv3+ models. The corresponding labels are shown in the caption of the figure. All ‘selected’ cases in Figure 5a exhibit the overall correct boundary of the lungs in contrast to the ‘not selected’ cases in Figure 5b.

4.3. Selector Network Classifier Performance

The performance of the selector network classifier in classifying between ‘selected’ and ‘not selected’ was analyzed by observing the corresponding confusion matrix and the receiver operating characteristic (ROC) curve. The confusion matrix generated for the selector network classifier trained during Trial 1 of the experiments is shown in Figure 6. The test set considered for the performance evaluation is 20% of the segmentations generated by all seven lung segmentation networks, as shown in the second row of Table 2. According to Figure 6, 71 and 122 segmentations are correctly classified as ‘not selected’ and ‘selected’, respectively. Only nine of the ‘selected’ cases are incorrectly classified as ‘not selected’, which accounts for 3.9% of all data. Thirty cases, corresponding to 12.9% of all cases, are incorrectly classified as ‘selected’.
Out of all ‘selected’ cases, 70.3% are classified correctly, while 93.1% of cases are correctly predicted for ‘not selected’ cases. Among ‘not selected’ predictions, 88.8% are correct. Out of all predictions that are classified as ‘selected’, 80.3% are correct. Considering all predictions, 83.2% are correctly classified.
The ROC curve shows the true positive rate (sensitivity) versus the false positive rate (1-specificity) during prediction by a particular model. Observing the ROC curve allows the user to customize a classification threshold based on the prediction probabilities by considering a point on the curve with high sensitivity and specificity (i.e., a lower false positive rate and a higher detection rate). As a single quantitative measure of performance, we use the area under the ROC curve (AUC). The AUC is equal to the probability of a model ranking a random positive case higher than a random negative case [41]. The AUC is a value between 0 and 1, where an AUC of 1 represents a perfect classifier. The ROC curve shown in Figure 7 generated for the selector network classifier shows an AUC of 0.9016.

4.4. Performance Comparison

We compared our method with other existing ensemble techniques. In general, we identified two approaches traditionally used to select and fuse results from several networks. The first traditional approach is taken from [23]; it combines the best-performing networks from each network type by averaging scores and applying a threshold of 0.5 to generate a single binary segmentation mask. We refer to this approach as the average-of-two ensemble (AoTE) method throughout the rest of this paper. The other traditional approach, hereinafter named the average-of-all ensemble (AoAE) method, follows the approach in [26], combining results from all considered networks. The AoAE method combines results from all the networks by averaging the scores and applying a threshold of 0.5 to obtain a segmentation mask. Thus, the proposed patient-specific selective approach or the selector ensemble (SE) is compared with the two identified traditional approaches with regard to the performance results for MC and JSRT datasets. The performance evaluation for these test datasets was carried only considering the cases ‘selected’ by the selector network classifier, that is, cases predicted to have at least one of the networks generate a segmentation mask with an IoU higher than or equal to 0.9. Table 6 and Table 7 shows the mean IoU values and the corresponding 95% confidence intervals (CIs) obtained for the MC and JSRT datasets, respectively. Note that testing was performed for ten trials, with the average performance across all trials shown as the performance. The best performance is marked in bold.
In Table 6, SE and DeepLabv3+ with ResNet18 show the same performance, which is the highest. This performance similarity can be expected, as DeepLabv3+ showed the best performance according to Table 3 and Table 4. It is clear that the proposed SE method selected the best-performing networks to produce the highest performance.
In all trials except for Trial 2, the proposed SE method outputs mean IoU values higher than 0.9, which is the threshold used to categorize ‘selected’ cases for the selector network classifier (refer to Table A1). The averages of mean IoU values over all trials are 0.80, 0.80, and 0.93 for AoTE, AoAE, and the proposed methods, respectively. Taking these average values into account, the proposed algorithm shows a 13% average increase in performance compared to the AoTE and AoAE. If the performance of all methods in Table 6 is considered, the proposed SE shows a 21% increase in performance.
According to Table 7, the proposed algorithm shows the best performance for the JSRT dataset. The lower end of the corresponding 95% CI range, 0.86, is higher than the upper CI limits of most of the other methods. This confirms that the performance of the proposed SE approach is better than the individual networks and the two traditional methods considered for comparison.
In all trials (refer Table A2), the proposed algorithm shows values close to 0.9, though not higher, which may be the result of the heterogeneity of chest X-rays taken from the different datasets. On average, the selected cases of the JSRT dataset are segmented the best by the proposed algorithm, with a mean IoU of 0.88, which is 3% and 5% higher than the mean IoU values of AoTE and AoAE, respectively. Compared to all methods listed, the proposed SE method shows a 9% average performance increase. Therefore, it is clear that the proposed selective approach does the best job of segmenting the lung areas on the JSRT database.

4.5. Impact of Lung Segmentation on TB Detection

In order to show the effectiveness of segmentation, we further tested the segmentations by performing a TB detection experiment. One of the networks used for TB detection in [33] is ResNet. We trained this network on the CR partitions derived from the Shenzhen dataset, while the MC dataset was used as the test set. Note that this network classifies between ‘normal’ and ‘TB’ because Shenzhen and MC datasets are only labeled for ‘normal’ and ‘TB’. Furthermore, only the cases that included at least one ‘selected’ lung segmentation by our selector network were utilized from both datasets. The the same lung segmentation approach was applied to the ‘selected’ CRs for use in training, validation, and testing. The performance was studied by observing the AUC of the ROC curve generated for TB detection. Figure 8 shows the TB detection ROC curves obtained with and without applying lung segmentations to the CRs. It is clear that the curve corresponding to the proposed method in Figure 8 shows a higher sensitivity at a higher specificity (low false positive rate) compared to the other curves. Table 8 shows the AUC values for each curve.
According to the AUC values in Table 8, the AUC with the proposed algorithm is 0.8, while the traditional approaches and the use of raw images show values that are lower than 0.8. Therefore, it is clear that TB detection by training, validating, and testing on segmentations that are segmented by the proposed algorithm shows the highest performance.

5. Discussion and Conclusions

In this paper, we have proposed using a novel selective step for ensemble techniques used for lung segmentation in CRs. A selective process was developed to permit a deep learning network to predict the best-performing networks for a given case; hence, the selection is patient-specific. The introduced deep learning network is referred to in the scope of this research as the selector network classifier. Seven variations of U-Net and DeepLabv3+, which are networks known to perform exceptionally well in semantically segmenting lung fields on CRs, are considered for testing the selector network classifier. The encoder depth of the U-Net is varied from 1 through 5 to generate five of the seven networks. The other two networks are DeepLabv3+ with ResNet18 and ResNet50 as backbone architectures, respectively. Technically, the function of the selector network classifier is to predict which of the seven networks generates segmentation masks with an IoU higher than or equal to 0.9 for a given CR. The 166 CR partition of the Shenzhen dataset is used as the training data to train the selector network classifier. The data used to train the selector network classifier contain information within the lung areas detected by each network, which is ensured by multiplying each segmentation mask by the original CR image. Therefore, the features within the segmented lungs are visible, and the rest of the image pixels are assigned a value of zero.
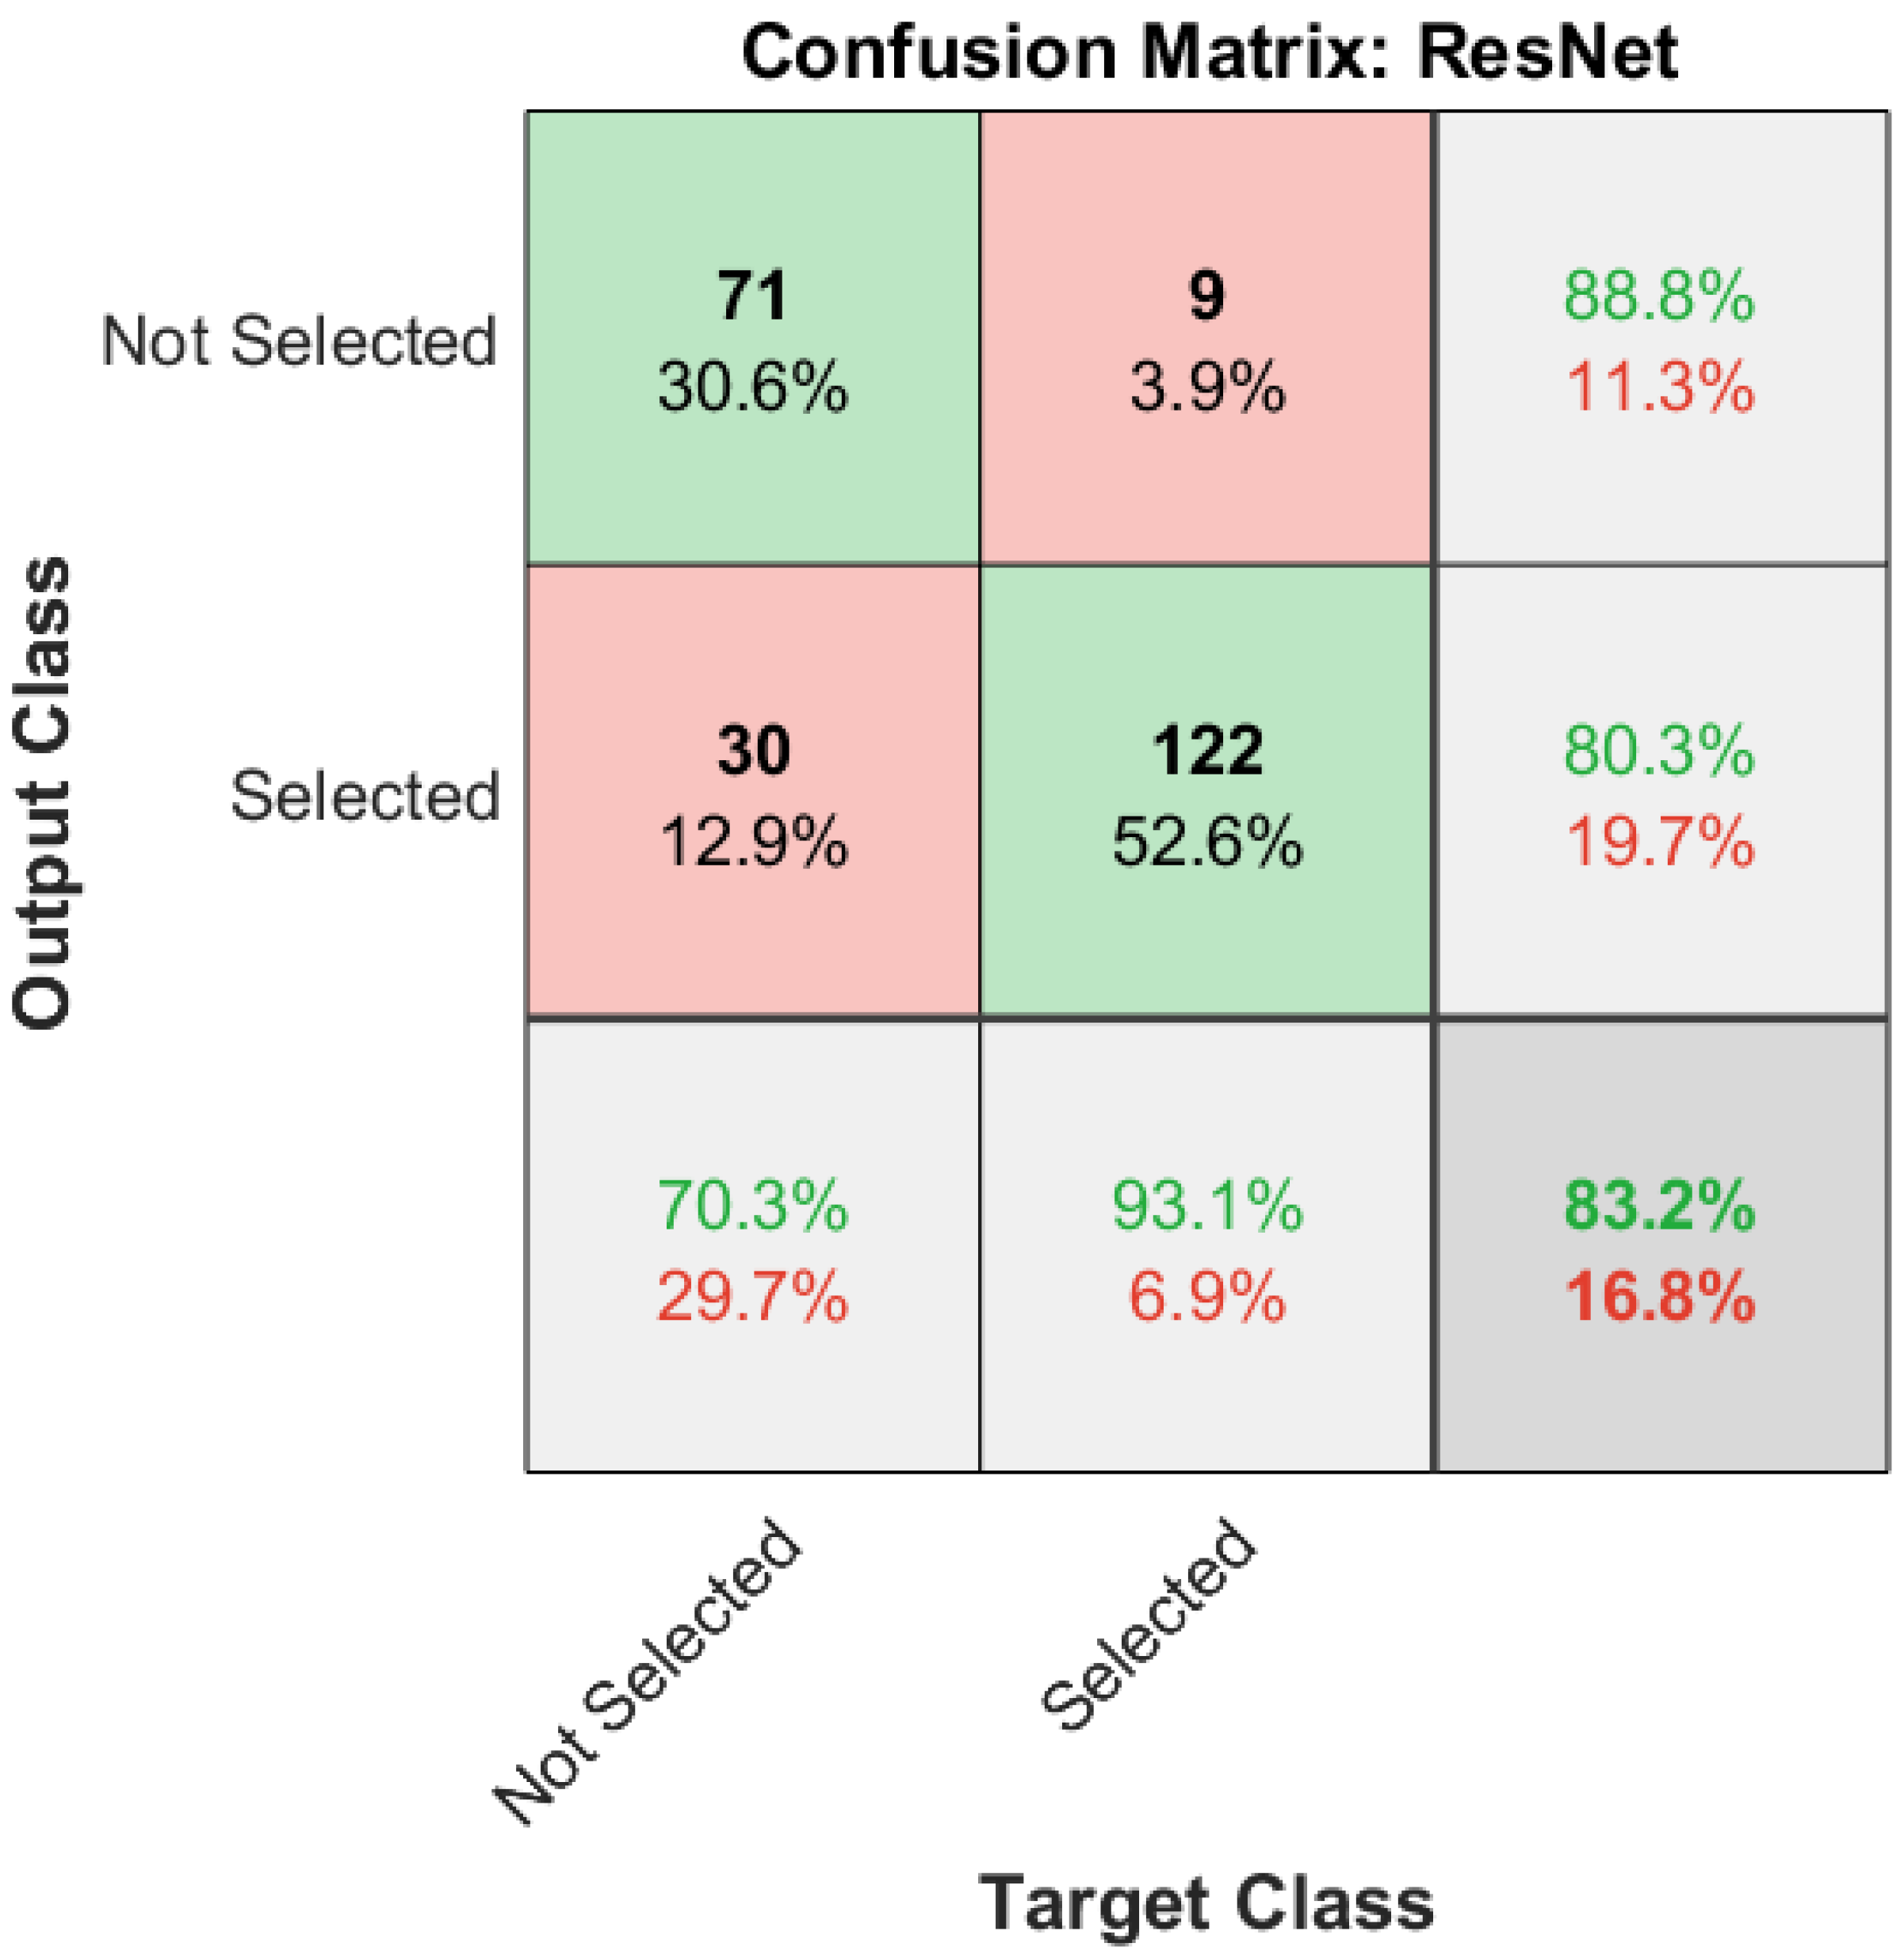
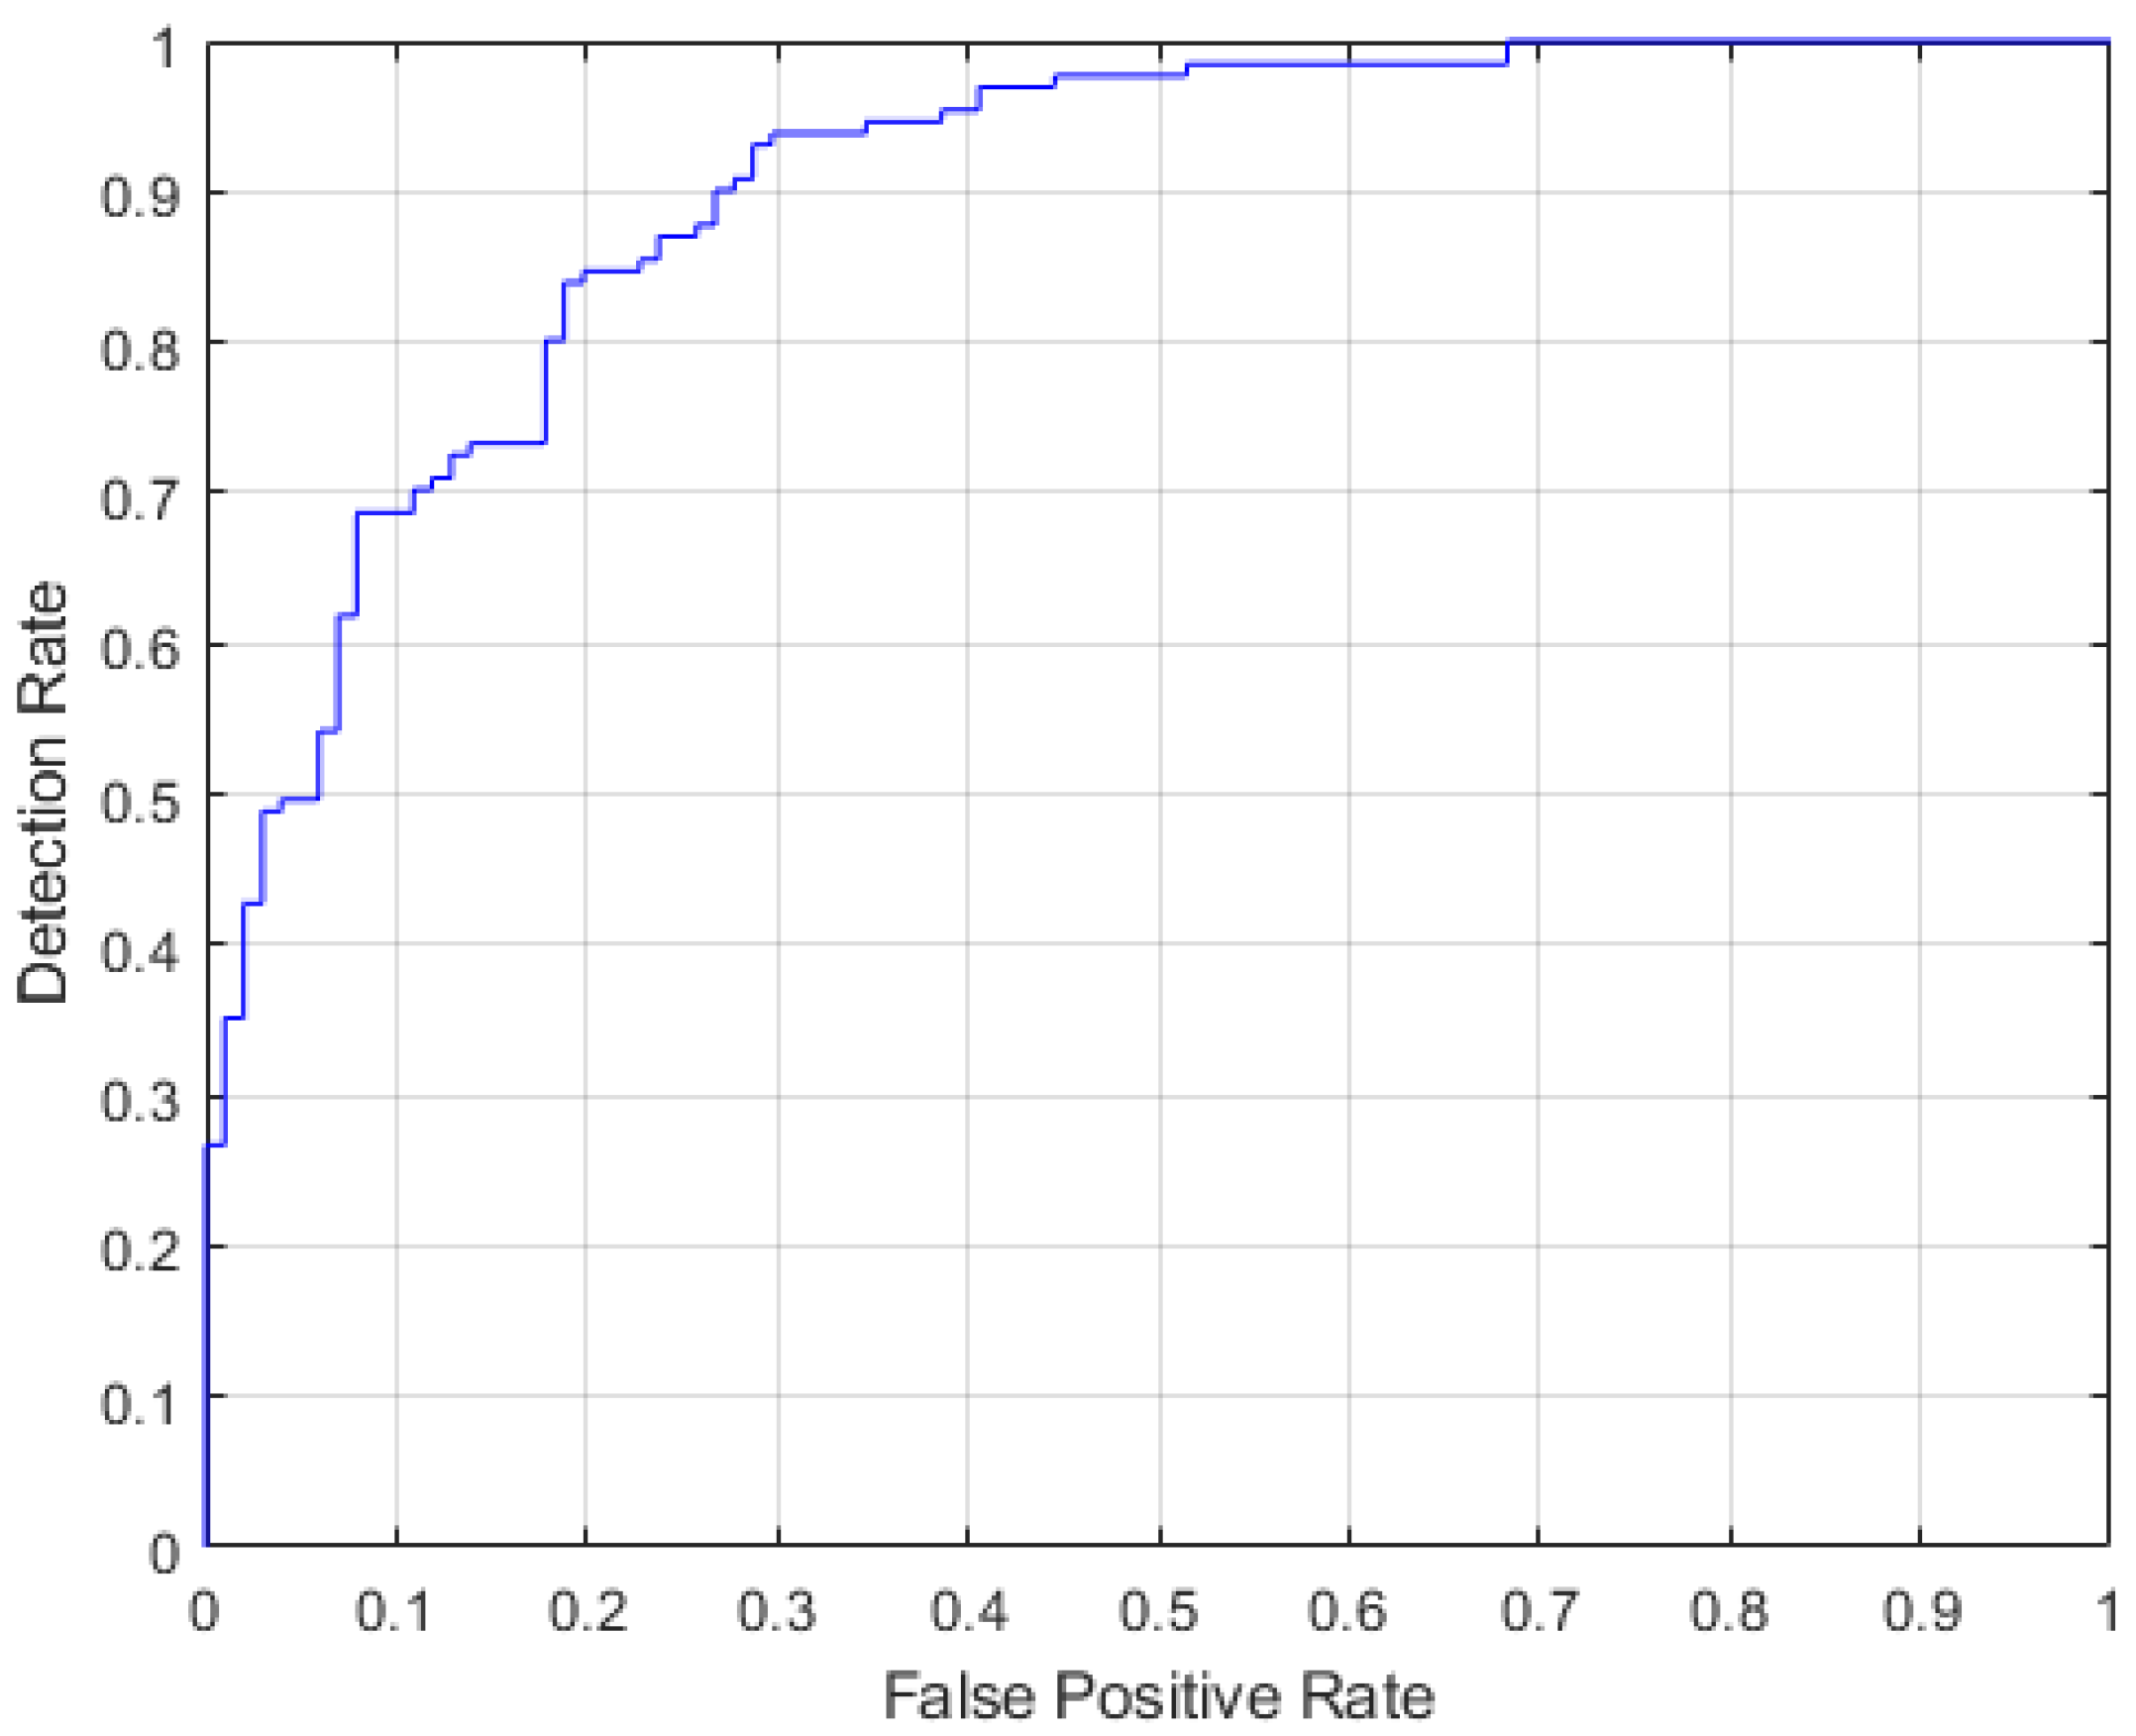
The proposed selector network classifier follows the ResNet18 model, a widely used transfer learning technique. The model is pre-trained on ImageNet and altered to output two classes. As described in Section 4.3, the fine-tuned ResNet18 model performs well in predicting whether a network generates segmentations with an IoU higher than or equal to 0.9. The selector network classifier shows acceptable performance, making 83.2% of all predictions correctly and with an AUC of 0.9016 for the ROC curve.
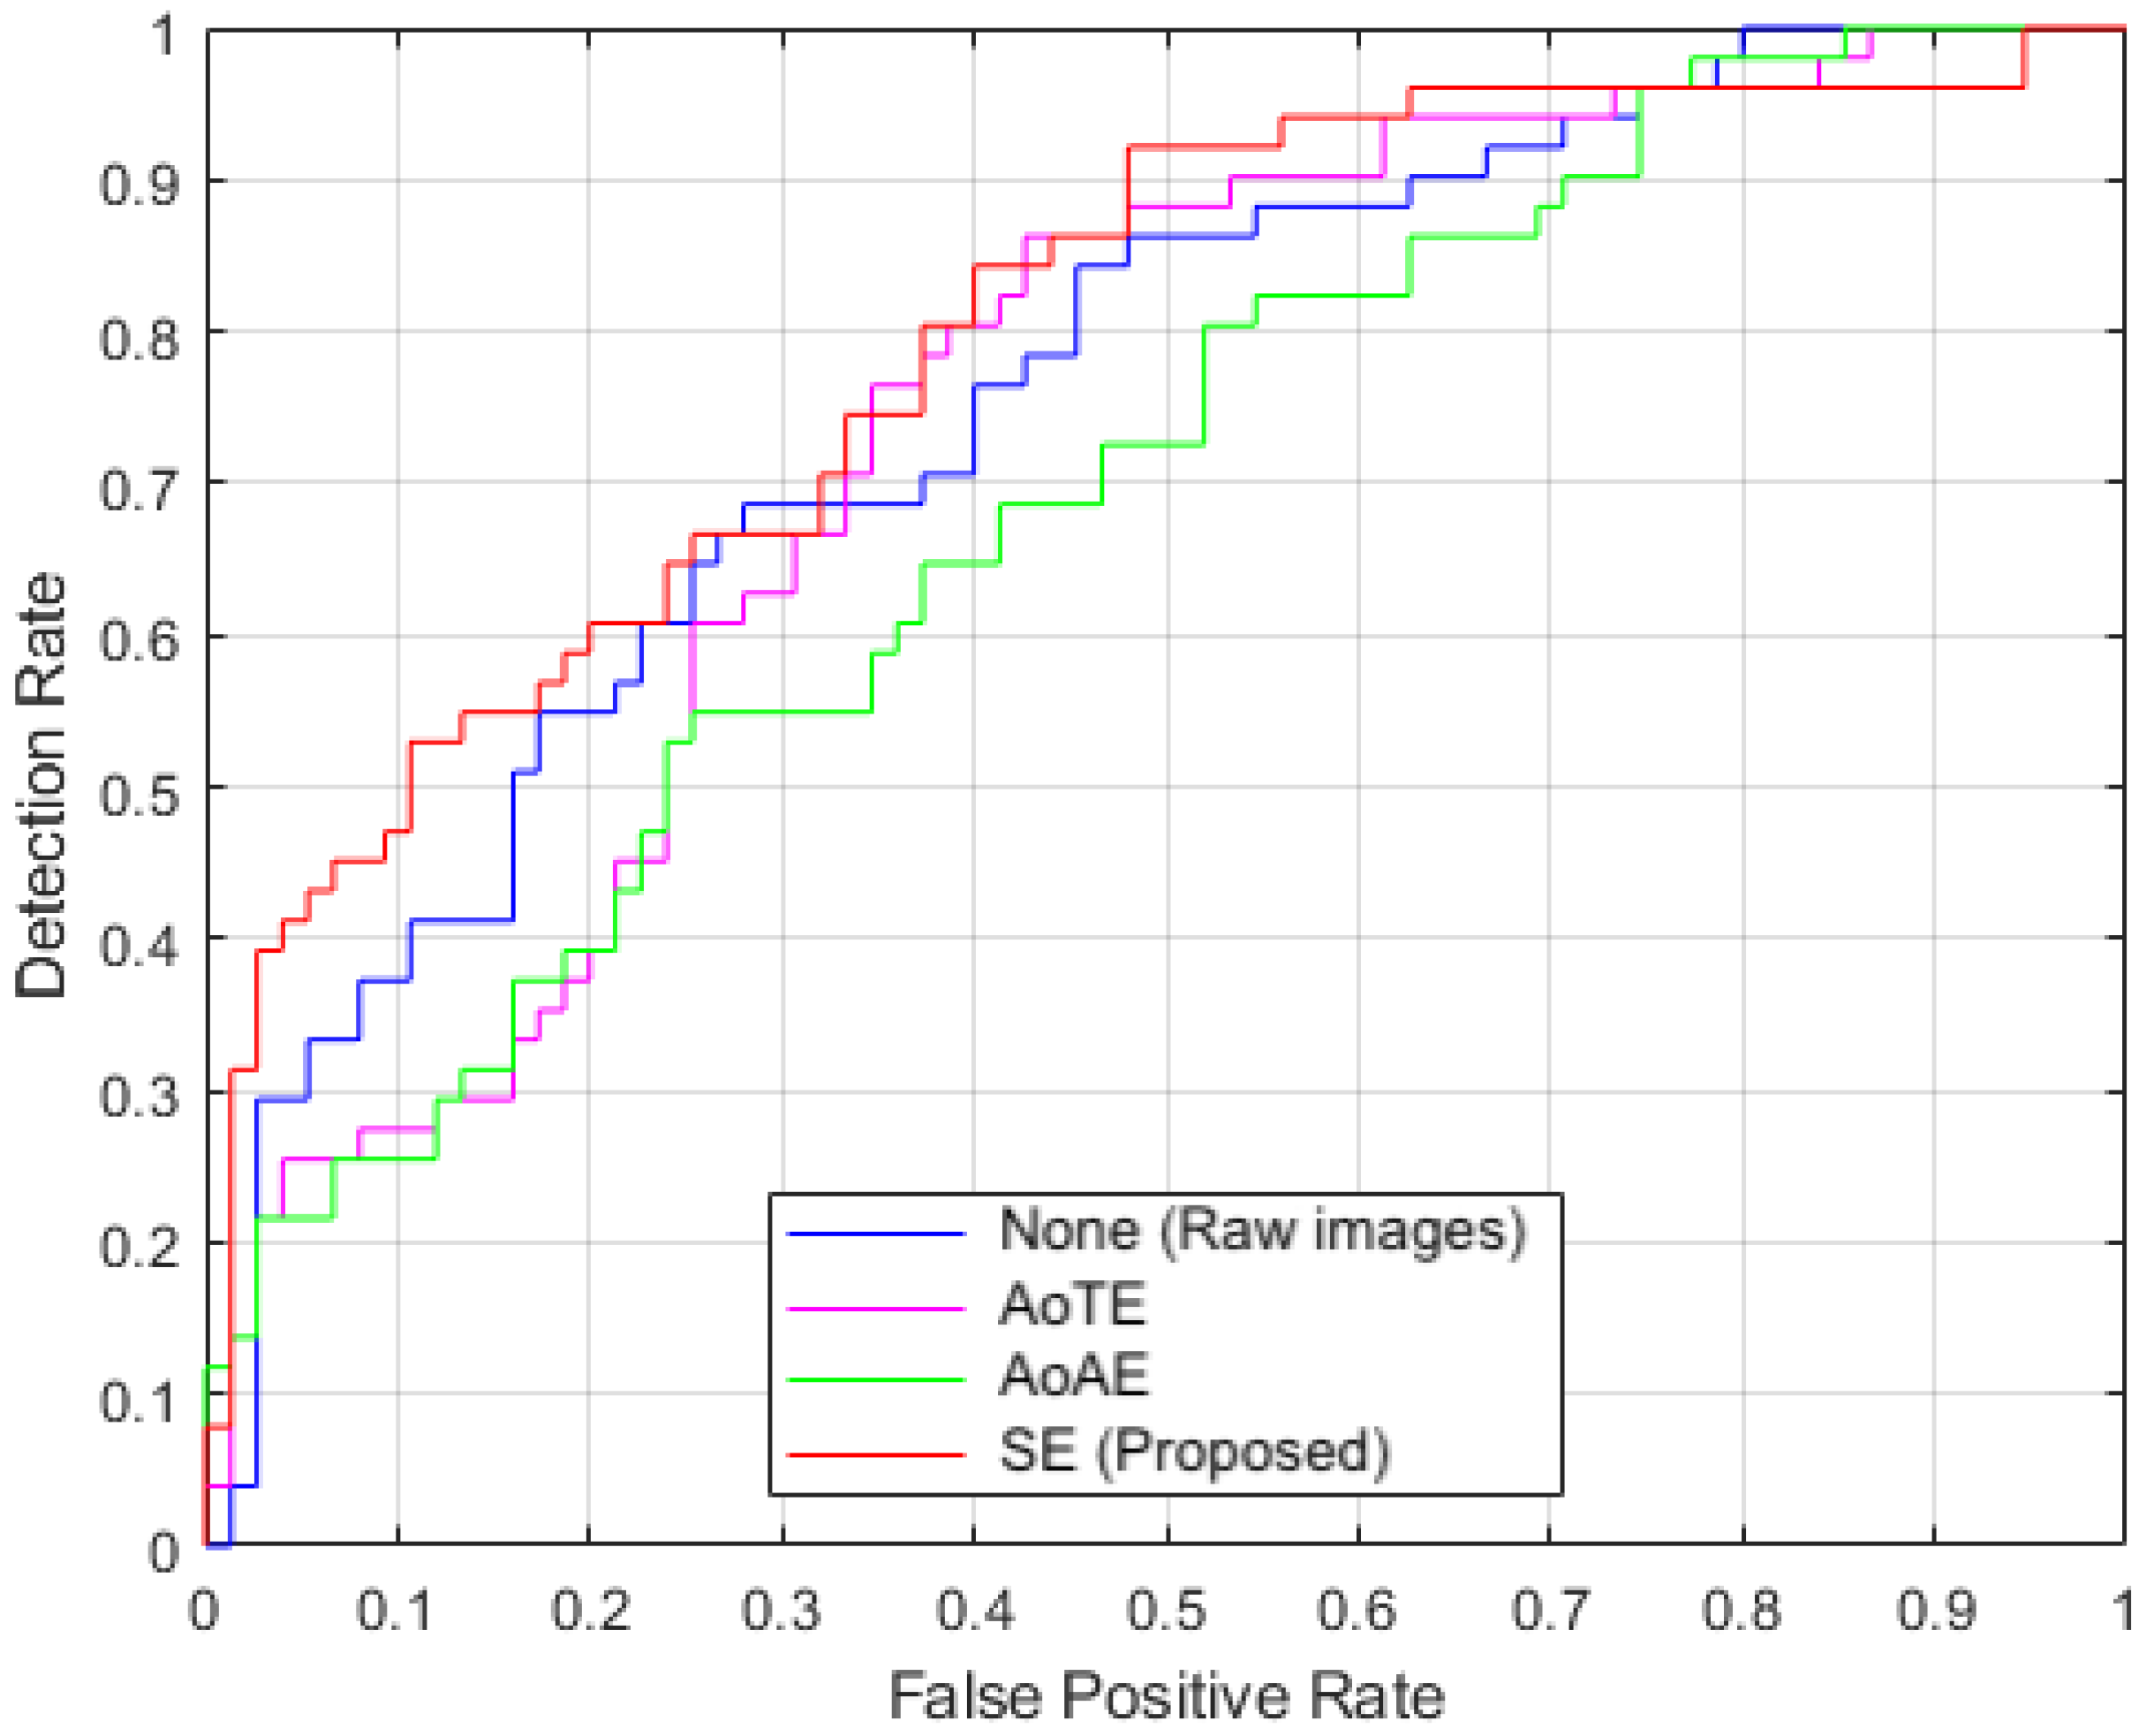
With the selector network classifier in place, the ensemble effort towards generating lung segmentations displays performance that exceeds that of individual lung segmentation networks and traditional ensemble methods. Evaluations over ten trials on two public datasets, MC and JSRT, revealed that the proposed method shows a higher mean IoU than the traditional methods. The MC and JSRT datasets exhibit 13% and 3% increases in mean IoU for the AoTE approach, while showing 13% and 5% increases for the AoAE approach. Compared to all methods, test performance on the MC and JSRT datasets show 21% and 9% increases. In addition, the mean IoU values produced by the proposed method for the MC dataset were higher than 0.9 during nine out of ten trials, with the exception a selected case considered with regard to the IoU during the labeling of the training data. Another key factor of note is the similar disease focus of TB in the training set (Shenzhen) and the MC dataset. The presence of a particular disease is a major factor that varies the features within a specific patient’s lung region on a chest X-ray. JSRT, on the other hand, has a different disease focus, namely, lung nodules; nonetheless, the proposed method shows a mean IoU very close to 0.9, and an improvement compared to the traditional methods. To consider the presence of a disease, further performance analysis using segmentations generated by the proposed algorithm in TB detection are performed, as shown in Section 4.5. The use of our approach shows the highest AUC of 0.8 for the corresponding ROC compared to both the traditional approaches and direct use of raw images. This shows the effectiveness of our approach in detecting disease on a CR.
In general, most of the cases in the MC dataset are ‘selected’, while most cases in JSRT are classified as ‘not selected’. The images that are ‘not selected’ do not produce a segmentation mask, and are classified as images that do not meet the requirements for the algorithm. Therefore, the system does not have an output if none of the lung segmentation networks are predicted to produce a segmentation mask with an IoU 0.9 for an input CR. This is a limitation of the proposed system. The major potential requirement with respect to such images is preprocessing, which opens up the possibility of future research. In addition, the performance of the proposed system for a given CR is limited by the best-performing lung segmentation network. If the selector network classifier selects multiple networks, the fusion of their multiple probability scores could lead to a slight performance improvement. Another limitation of the SE method is the inability to segment an abnormally shaped lung region. The selector network classifier is trained with lung segmentations produced for lung regions that are normally shaped. Moreover, the selective method is not trained for pediatric CRs, which are different from adult CRs with respect to the shape and presence of other organs that are not present or differently shaped in an adult CR.
In addition to image quality improvements via preprocessing, there are other important aspects of this research that can stand as benchmarks for future research. The proposed SE method can be extended to incorporate any number of lung segmentations any time a new lung segmentation algorithm is introduced. The studied main component, that is, the selector network classifier, can be implemented as another transfer learning method, and has the potential to be used for other applications. More training data could be added to train the selector network classifier. Furthermore, it can be improved to function as a grader instead of a classifier in order to predict a weight corresponding to each lung segmentation. Then, the final fusion is a combination of weighted probability scores instead of an average. As ensemble methods have been introduced in the literature for other applications, both medical and non-medical, and for different types of image types other than CRs, the selector network classifier proposed in this paper can be extended accordingly. In addition, the IoU threshold used to categorize the selector network classifier training data can be adjusted in keeping with the expected accuracy.
As our results suggest, the selective ensemble method proposed in this paper shows a performance improvement over traditional ensemble methods in lung segmentation in CRs. We believe the selective approach helps to overcome a performance drop caused by the possible incorporation of inapplicable segmentations during an ensemble approach. This paper sets a compelling benchmark for many potential future works and applications of the proposed method.

Author Contributions

Conceptualization, M.S.D.S., B.N.N. and R.C.H.; methodology, M.S.D.S., B.N.N. and R.C.H.; software, M.S.D.S. and B.N.N.; validation, M.S.D.S., B.N.N. and R.C.H.; writing—original draft preparation, M.S.D.S.; writing—review and editing, M.S.D.S., B.N.N. and R.C.H.; supervision, B.N.N. and R.C.H. All authors have read and agreed to the published version of the manuscript.

Funding

This research received no external funding.

Institutional Review Board Statement

Not applicable.

Informed Consent Statement

Not applicable.

Data Availability Statement

Publicly available datasets were analyzed in this study. The Shenzhen and MC datasets are available at https://lhncbc.nlm.nih.gov/, accessed on 14 November 2022. Ground truth lung masks for the Shenzhen dataset are available at https://www.kaggle.com/yoctoman/shcxr-lung-mask, accessed on 14 November 2022. The JSRT dataset can be found at http://db.jsrt.or.jp/eng.php, accessed on 14 November 2022. Manually segmented lung masks for JSRT are available at https://www.isi.uu.nl/Research/Databases/SCR/, accessed on 14 November 2022.

Conflicts of Interest

The authors declare no conflict of interest.

Appendix A

Table A1 and Table A2 show the mean IoU values obtained on the MC and JSRT datasets, respectively. Note that the testing was carried out with respect to the cases ’selected’ from the selector network classifier. The performance for seven individual lung segmentation networks, namely, AoTE, AoAE, and the proposed SE are shown in Table A1 and Table A2 for ten trials.
Table A1. Mean IoU values of the final lung segmentations obtained during testing with the ’selected’ cases out of 138 chest radiographs from the MC dataset.
NetworkFinal Segmentation Testing Performance (Mean IoU)
Trial 1Trial 2Trial 3Trial 4Trial 5Trial 6Trial 7Trial 8Trial 9Trial 10
U-Net with Encoder Depth:10.700.600.730.780.560.810.800.700.800.75
U-Net with Encoder Depth:20.750.440.630.360.430.520.430.430.800.71
U-Net with Encoder Depth:30.410.550.410.400.670.410.650.710.730.65
U-Net with Encoder Depth:40.410.490.730.660.530.760.690.420.370.75
U-Net with Encoder Depth:50.730.420.800.450.720.600.540.630.470.85
DeepLabv3+ with ResNet180.920.930.930.920.920.930.790.910.920.90
DeepLabv3+ with ResNet500.940.920.930.930.940.940.940.930.930.94
Average-of-Two Ensemble0.540.500.880.850.790.830.910.920.910.88
Average-of-All Ensemble0.780.640.870.700.690.780.860.830.920.91
Selector Ensemble (Proposed)0.940.880.930.940.940.930.930.930.940.93
Table A2. Mean IoU values of the final lung segmentations obtained during testing with the ’selected’ cases out of 140 chest radiographs from the JSRT dataset.
NetworkFinal Segmentation Testing Performance (Mean IoU)
Trial 1Trial 2Trial 3Trial 4Trial 5Trial 6Trial 7Trial 8Trial 9Trial 10
U-Net with Encoder Depth:10.730.730.730.810.600.690.800.820.880.79
U-Net with Encoder Depth:20.840.530.700.510.710.570.660.690.900.87
U-Net with Encoder Depth:30.710.840.690.550.720.700.910.820.750.75
U-Net with Encoder Depth:40.780.850.890.810.760.870.840.760.580.80
U-Net with Encoder Depth:50.850.810.910.790.920.870.620.840.790.86
DeepLabv3+ with ResNet180.880.750.840.860.830.810.790.860.810.83
DeepLabv3+ with ResNet500.870.750.790.830.850.880.800.870.860.80
Average-of-Two Ensemble0.860.780.840.830.900.880.860.870.850.80
Average-of-All Ensemble0.850.790.830.810.810.810.820.850.840.85
Selector Ensemble (Proposed)0.890.840.910.860.920.880.890.880.890.84

References

  1. Hardie, R.C.; Rogers, S.K.; Wilson, T.; Rogers, A. Performance analysis of a new computer aided detection system for identifying lung nodules on chest radiographs. Med. Image Anal. 2008, 12, 240–258. [Google Scholar]
  2. Coppini, G.; Miniati, M.; Monti, S.; Paterni, M.; Favilla, R.; Ferdeghini, E.M. A computer-aided diagnosis approach for emphysema recognition in chest radiography. Med. Eng. Phys. 2013, 35, 63–73. [Google Scholar]
  3. Sogancioglu, E.; Murphy, K.; Calli, E.; Scholten, E.T.; Schalekamp, S.; Van Ginneken, B. Cardiomegaly detection on chest radiographs: Segmentation versus classification. IEEE Access 2020, 8, 94631–94642. [Google Scholar]
  4. Candemir, S.; Antani, S. A review on lung boundary detection in chest X-rays. Int. J. Comput. Assist. Radiol. Surg. 2019, 14, 563–576. [Google Scholar]
  5. Agrawal, T.; Choudhary, P. Segmentation and classification on chest radiography: A systematic survey. Vis. Comput. 2022, 1–39. [Google Scholar] [CrossRef]
  6. Duryea, J.; Boone, J.M. A fully automated algorithm for the segmentation of lung fields on digital chest radiographic images. Med. Phys. 1995, 22, 183–191. [Google Scholar]
  7. Wan Ahmad, W.S.H.M.; Zaki, W.W.; Ahmad Fauzi, M.F. Lung segmentation on standard and mobile chest radiographs using oriented Gaussian derivatives filter. Biomed. Eng. Online 2015, 14, 20. [Google Scholar]
  8. Shamna, P.; Nair, A.T. Detection of COVID-19 Using Segmented Chest X-ray. In Intelligent Data Communication Technologies and Internet of Things; Springer: Berlin/Heidelberg, Germany, 2022; pp. 585–598. [Google Scholar]
  9. Tsujii, O.; Freedman, M.T.; Mun, S.K. Automated segmentation of anatomic regions in chest radiographs using an adaptive-sized hybrid neural network. Med. Phys. 1998, 25, 998–1007. [Google Scholar]
  10. Van Ginneken, B.; Stegmann, M.B.; Loog, M. Segmentation of anatomical structures in chest radiographs using supervised methods: A comparative study on a public database. Med. Image Anal. 2006, 10, 19–40. [Google Scholar]
  11. Juhász, S.; Horváth, Á.; Nikházy, L.; Horváth, G. Segmentation of anatomical structures on chest radiographs. In Proceedings of the XII Mediterranean Conference on Medical and Biological Engineering and Computing 2010, Chalkidiki, Greece, 27–30 May 2010; Springer: Berlin/Heidelberg, Germany, 2010; pp. 359–362. [Google Scholar]
  12. Giv, M.D.; Borujeini, M.H.; Makrani, D.S.; Dastranj, L.; Yadollahi, M.; Semyari, S.; Sadrnia, M.; Ataei, G.; Madvar, H.R. Lung Segmentation using Active Shape Model to Detect the Disease from Chest Radiography. J. Biomed. Phys. Eng. 2021, 11, 747. [Google Scholar]
  13. Van Ginneken, B.; ter Haar Romeny, B.M. Automatic segmentation of lung fields in chest radiographs. Med. Phys. 2000, 27, 2445–2455. [Google Scholar]
  14. Peng, T.; Wang, Y.; Xu, T.C.; Chen, X. Segmentation of lung in chest radiographs using hull and closed polygonal line method. IEEE Access 2019, 7, 137794–137810. [Google Scholar]
  15. Peng, T.; Gu, Y.; Wang, J. Lung contour detection in chest X-ray images using mask region-based convolutional neural network and adaptive closed polyline searching method. In Proceedings of the 2021 43rd Annual International Conference of the IEEE Engineering in Medicine & Biology Society (EMBC), Virtual Conference, 1–5 November 2021; pp. 2839–2842. [Google Scholar]
  16. Novikov, A.A.; Lenis, D.; Major, D.; Hladůvka, J.; Wimmer, M.; Bühler, K. Fully convolutional architectures for multiclass segmentation in chest radiographs. IEEE Trans. Med. Imaging 2018, 37, 1865–1876. [Google Scholar]
  17. Kalinovsky, A.; Kovalev, V. Lung Image Ssgmentation Using Deep Learning Methods and Convolutional Neural Networks; Publishing Center of BSU: Minsk, Belarus, 2016. [Google Scholar]
  18. Dai, W.; Liang, X.; Zhang, H.; Xing, E.; Doyle, J. Structure Correcting Adversarial Network for Chest X-rays Organ Segmentation. U.S. Patent 11,282,205, 30 June 2022. [Google Scholar]
  19. Çallı, E.; Sogancioglu, E.; van Ginneken, B.; van Leeuwen, K.G.; Murphy, K. Deep learning for chest X-ray analysis: A survey. Med. Image Anal. 2021, 72, 102125. [Google Scholar]
  20. Narayanan, B.N.; Hardie, R.C. A computationally efficient u-net architecture for lung segmentation in chest radiographs. In Proceedings of the 2019 IEEE National Aerospace and Electronics Conference (NAECON), Dayton, OH, USA, 15–19 July 2019; pp. 279–284. [Google Scholar]
  21. Ronneberger, O.; Fischer, P.; Brox, T. U-net: Convolutional networks for biomedical image segmentation. In Proceedings of the International Conference on Medical Image Computing and Computer-Assisted Intervention, Munich, Germany, 5–9 October 2015; Springer: Berlin/Heidelberg, Germany, 2015; pp. 234–241. [Google Scholar]
  22. Chen, L.C.; Zhu, Y.; Papandreou, G.; Schroff, F.; Adam, H. Encoder-decoder with atrous separable convolution for semantic image segmentation. In Proceedings of the European Conference on Computer Vision (ECCV), Munich, Germany, 8–14 September 2018; pp. 801–818. [Google Scholar]
  23. Narayanan, B.N.; De Silva, M.S.; Hardie, R.C.; Ali, R. Ensemble Method of Lung Segmentation in Chest Radiographs. In Proceedings of the NAECON 2021—IEEE National Aerospace and Electronics Conference, Dayton, OH, USA, 16–19 August 2021; pp. 382–385. [Google Scholar]
  24. Kim, Y.G.; Kim, K.; Wu, D.; Ren, H.; Tak, W.Y.; Park, S.Y.; Lee, Y.R.; Kang, M.K.; Park, J.G.; Kim, B.S.; et al. Deep learning-based four-region lung segmentation in chest radiography for COVID-19 diagnosis. Diagnostics 2022, 12, 101. [Google Scholar]
  25. Tan, M.; Le, Q. Efficientnet: Rethinking model scaling for convolutional neural networks. In Proceedings of the International Conference on Machine Learning, Long Beach, CA, USA, 9–15 June 2019; pp. 6105–6114. [Google Scholar]
  26. Ali, R.; Hardie, R.C.; Ragb, H.K. Ensemble lung segmentation system using deep neural networks. In Proceedings of the 2020 IEEE Applied Imagery Pattern Recognition Workshop (AIPR), Washington, DC, USA, 13–15 October 2020; pp. 1–5. [Google Scholar]
  27. Zhang, J.; Xia, Y.; Zhang, Y. An ensemble of deep neural networks for segmentation of lung and clavicle on chest radiographs. In Proceedings of the Annual Conference on Medical Image Understanding and Analysis, Liverpool, UK, 24–26 July 2019; Springer: Berlin/Heidelberg, Germany, 2019; pp. 450–458. [Google Scholar]
  28. Souza, J.C.; Diniz, J.O.B.; Ferreira, J.L.; da Silva, G.L.F.; Silva, A.C.; de Paiva, A.C. An automatic method for lung segmentation and reconstruction in chest X-ray using deep neural networks. Comput. Methods Programs Biomed. 2019, 177, 285–296. [Google Scholar]
  29. Krizhevsky, A.; Sutskever, I.; Hinton, G.E. Imagenet classification with deep convolutional neural networks. Adv. Neural Inf. Process. Syst. 2012, 25, 1097–1105. [Google Scholar]
  30. Öksüz, C.; Urhan, O.; Güllü, M.K. Ensemble-LungMaskNet: Automated lung segmentation using ensembled deep encoders. In Proceedings of the 2021 International Conference on INnovations in Intelligent SysTems and Applications (INISTA), Kocaeli, Turkey, 25–27 August 2021; pp. 1–8. [Google Scholar]
  31. Iandola, F.N.; Han, S.; Moskewicz, M.W.; Ashraf, K.; Dally, W.J.; Keutzer, K. SqueezeNet: AlexNet-level accuracy with 50x fewer parameters and <0.5 MB model size. arXiv 2016, arXiv:1602.07360. [Google Scholar]
  32. Zhang, X.; Zhou, X.; Lin, M.; Sun, J. Shufflenet: An extremely efficient convolutional neural network for mobile devices. In Proceedings of the IEEE Conference on Computer Vision and Pattern Recognition, Salt Lake City, UT, USA, 18–22 June 2018; pp. 6848–6856. [Google Scholar]
  33. Narayanan, B.N.; De Silva, M.S.; Hardie, R.C.; Kueterman, N.K.; Ali, R. Understanding deep neural network predictions for medical imaging applications. arXiv 2019, arXiv:1912.09621. [Google Scholar]
  34. Jaeger, S.; Candemir, S.; Antani, S.; Wáng, Y.X.J.; Lu, P.X.; Thoma, G. Two public chest X-ray datasets for computer-aided screening of pulmonary diseases. Quant. Imaging Med. Surg. 2014, 4, 475. [Google Scholar]
  35. Shiraishi, J.; Katsuragawa, S.; Ikezoe, J.; Matsumoto, T.; Kobayashi, T.; Komatsu, K.i.; Matsui, M.; Fujita, H.; Kodera, Y.; Doi, K. Development of a digital image database for chest radiographs with and without a lung nodule: Receiver operating characteristic analysis of radiologists’ detection of pulmonary nodules. Am. J. Roentgenol. 2000, 174, 71–74. [Google Scholar]
  36. Jaeger, S.; Karargyris, A.; Candemir, S.; Folio, L.; Siegelman, J.; Callaghan, F.; Xue, Z.; Palaniappan, K.; Singh, R.K.; Antani, S.; et al. Automatic tuberculosis screening using chest radiographs. IEEE Trans. Med. Imaging 2013, 33, 233–245. [Google Scholar]
  37. Candemir, S.; Jaeger, S.; Palaniappan, K.; Musco, J.P.; Singh, R.K.; Xue, Z.; Karargyris, A.; Antani, S.; Thoma, G.; McDonald, C.J. Lung segmentation in chest radiographs using anatomical atlases with nonrigid registration. IEEE Trans. Med. Imaging 2013, 33, 577–590. [Google Scholar]
  38. Stirenko, S.; Kochura, Y.; Alienin, O.; Rokovyi, O.; Gordienko, Y.; Gang, P.; Zeng, W. Chest X-ray analysis of tuberculosis by deep learning with segmentation and augmentation. In Proceedings of the 2018 IEEE 38th International Conference on Electronics and Nanotechnology (ELNANO), Kyiv, UKraine, 24–26 April 2018; pp. 422–428. [Google Scholar]
  39. He, K.; Zhang, X.; Ren, S.; Sun, J. Deep residual learning for image recognition. In Proceedings of the IEEE Conference on Computer Vision and Pattern Recognition, Las Vegas, NV, USA, 26 June–1 July 2016; pp. 770–778. [Google Scholar]
  40. Russakovsky, O.; Deng, J.; Su, H.; Krause, J.; Satheesh, S.; Ma, S.; Huang, Z.; Karpathy, A.; Khosla, A.; Bernstein, M.; et al. Imagenet large scale visual recognition challenge. Int. J. Comput. Vis. 2015, 115, 211–252. [Google Scholar]
  41. Bradley, A.P. The use of the area under the ROC curve in the evaluation of machine learning algorithms. Pattern Recognit. 1997, 30, 1145–1159. [Google Scholar]
Figure 1. Example CRs from three databases: (a) radiograph from the Shenzhen database [34], (b) radiograph from the MC database [34], (c) radiograph from the JSRT database [35].
Ai 03 00055 g001
Figure 2. Original image, a segmentation mask, and image with mask applied for CHNCXR_0024_0 in 166 CR partition: (a) Original image; (b) segmentation produced by DeepLabv3+ with ResNet50; (c) mask in (b) applied to (a).
Ai 03 00055 g002
Figure 3. U-Net architecture with a depth of 3 and lowest resolution of 32 × 32 pixels.
Ai 03 00055 g003
Figure 4. Block diagram of the proposed selector network ensemble lung segmentation approach.
Ai 03 00055 g004
Figure 5. Example lung segmentations selected from the segmentations generated by the U-Net and DeepLabv3+ models with assigned labels: (a) labeled as ‘selected’ and (b) labeled as ‘not selected’.
Ai 03 00055 g005
Figure 6. Testing performance of the selector network classifier as a confusion matrix. The diagonal cells represent the correctly predicted number of cases and the percentages.
Ai 03 00055 g006
Figure 7. ROC curve with an AUC of 0.9016 generated for the testing performance of the selector network classifier.
Ai 03 00055 g007
Figure 8. ROC curves generated for TB detection on CRs with different lung segmentations applied. The Raw Images result is for no lung segmentation. The other curves correspond to lung segmentation using the listed ensemble method.
Ai 03 00055 g008
Table 1. List of acronyms used in the paper.
AcronymDefinitionAcronymDefinition
AoAEAverage-of-all ensembleCRChest radiographs
AoTEAverage-of-two ensembleIoUIntersection over union
ASPPAtrous Spatial Pyramid PoolingJSRTJapanese Society of Radiological Technology
AUCArea under the curveMCMontgomery County
CADeComputer-aided detectionROCReceiver operating characteristic
CADxComputer-aided diagnosisSESelector ensemble
CIConfidence intervalTBTuberculosis
CNNConvolutional neural networks
Table 2. List of datasets used for different algorithm tasks. Note that the training tasks were carried out with the Shenzhen data, while the other two independent datasets were used for testing tasks.
Task
Dataset: # CRsLung Segmentation TrainingSelector Network Training and TestingLung Segmentation TestingTB Detection TrainingTB Detection Testing
Shenzhen Partition: 400X X
Shenzhen Partition: 166XX X
MC: 138 X X
JSRT: 140 X
Table 3. Mean IoU values of the lung segmentations obtained for the 166 CR partition using U-Net. The highest IoU for each trial is marked in bold.
Encoder DepthLung Segmentation Performance for the 166 CR Partition (Mean IoU)
Trial 1Trial 2Trial 3Trial 4Trial 5Trial 6Trial 7Trial 8Trial 9Trial 10
10.92790.89640.84150.89280.86710.93260.90120.92110.88360.8494
20.93120.58110.94190.51120.94920.88110.94410.90160.86890.8874
30.92300.95520.93200.68880.91740.89290.94470.84500.85380.8980
40.95220.95590.95530.94880.94860.94060.93710.89810.55530.9544
50.93280.95610.94970.93340.95270.93660.64240.90720.87640.9382
Table 4. Mean IoU values of the lung segmentations obtained for the 166 CR partition using DeepLabv3+. The highest IoU for each trial is marked in bold.
Base NetworkLung Segmentation Performance for the 166 CR Partition (Mean IoU)
Trial 1Trial 2Trial 3Trial 4Trial 5Trial 6Trial 7Trial 8Trial 9Trial 10
ResNet180.95520.95600.95670.95650.95700.95550.95730.95640.95780.9556
ResNet500.95940.95840.95740.95850.95720.95780.95960.95860.95760.9589
Table 5. Distribution of labeled 166 CR partition used to train the selector classifier for Trial 1. The rows corresponding to each type of network that performed the best during Trial 1 are marked in bold.
NetworkNumber of ‘Selected’ CasesNumber of ‘Not Selected’ Cases
U-Net with Encoder Depth:18185
U-Net with Encoder Depth:27888
U-Net with Encoder Depth:356110
U-Net with Encoder Depth:411650
U-Net with Encoder Depth:57492
DeepLabv3+ with ResNet1812442
DeepLabv3+ with ResNet5012739
Table 6. Averaged mean IoU values of the final lung segmentations obtained during testing with the ‘selected’ cases out of 138 CRs from the MC dataset. The highest performance value is marked in bold.
Network/Ensemble MethodFinal Segmentation Testing Performance (Mean IoU)95% CI
U-Net with Encoder Depth:10.720.66–0.79
U-Net with Encoder Depth:20.550.44–0.66
U-Net with Encoder Depth:30.560.46–0.66
U-Net with Encoder Depth:40.580.47–0.69
U-Net with Encoder Depth:50.620.51–0.73
DeepLabv3+ with ResNet180.910.88–0.94
DeepLabv3+ with ResNet500.930.93–0.94
Average-of-Two Ensemble0.800.69–0.91
Average-of-All Ensemble0.800.73–0.87
Selector Ensemble (Proposed)0.930.92–0.94
Table 7. Averaged mean IoU values of the final lung segmentations obtained during testing with the ‘selected’ cases out of 140 CRs from the JSRT dataset. The highest performance value is marked in bold.
Network/Ensemble MethodFinal Segmentation Testing Performance (Mean IoU)95% CI
U-Net with Encoder Depth:10.760.70–0.81
U-Net with Encoder Depth:20.700.60–0.80
U-Net with Encoder Depth:30.740.67–0.81
U-Net with Encoder Depth:40.790.73–0.86
U-Net with Encoder Depth:50.830.77–0.89
DeepLabv3+ with ResNet180.830.80–0.85
DeepLabv3+ with ResNet500.830.80–0.86
Average-of-Two Ensemble0.850.82–0.87
Average-of-All Ensemble0.830.81–0.84
Selector Ensemble (Proposed)0.880.86–0.90
Table 8. TB detection results with different lung segmentation methods. Detection performance is measured with AUC values for the ROC curves for each method. The row corresponding to the highest AUC value is marked in bold.
Lung Segmentation MethodAUC
None (Raw images)0.75
Average-of-Two Ensemble0.74
Average-of-All Ensemble0.74
Selector Ensemble (Proposed)0.80
Publisher’s Note: MDPI stays neutral with regard to jurisdictional claims in published maps and institutional affiliations.

