Article

Color Stability, Physical Properties and Antifungal Effects of ZrO2 Additions to Experimental Maxillofacial Silicones: Comparisons with TiO2

1
Department of Restorative Dental Science, College of Dentistry, King Saud University, Riyadh 11545, Saudi Arabia
2
Research Service, VA Nebraska-Western Iowa Healthcare System, Omaha, NE 68105, USA
3
Department of Adult Restorative Dentistry, College of Dentistry, University of Nebraska Medical Center, Lincoln, NE 68583, USA
4
Department of Oral Biology, College of Dentistry, University of Nebraska Medical Center, Lincoln, NE 68583, USA
5
School of Veterinary Medicine and Biomedical Sciences, Center for Biotechnology, University of Nebraska-Lincoln, Lincoln, NE 68588, USA
6
Department of Prosthodontics, School of Dentistry, National and Kapodistrian University of Athens, 11527 Athens, Greece
*
Author to whom correspondence should be addressed.
Prosthesis 2023, 5(3), 916-938; https://doi.org/10.3390/prosthesis5030064
Submission received: 1 August 2023 / Revised: 29 August 2023 / Accepted: 4 September 2023 / Published: 8 September 2023
(This article belongs to the Special Issue Novel Zirconia Materials Applied in Dental Prostheses)

Abstract

:
(1) Background: Color changes, physical degradation, and fungal infections are challenges to the longevity of maxillofacial polydimethylsiloxane (PDMS) elastomers. This study aimed to evaluate color changes, physical properties, and antifungal properties of PDMS loaded with ZrO2 and TiO2 submicron- and nano-sized particles. (2) Methods: A 1% weight of 40 nm or 200 nm diameter ZrO2 or TiO2 nanoparticles was mixed into PDMS with 2% functional intrinsic yellow pigment and polymerized. Control materials contained 13% weight 200 nm silica. Samples were exposed to 3000 h of UVB radiation (200 µW/cm2) or darkness. Color parameters L*a*b* and ∆Eab*, ultimate tensile strength, strain, elastic modulus, and Shore A hardness were measured. Candida albicans growth was measured using XTT and confocal microscopy, and data were analyzed with the Dunnett test (p < 0.01). (3) Results: TiO2 200 nm showed the least color change after 3000 h of UVB radiation, followed by TiO2 40 nm (p < 0.05). The silica-containing control group was superior in all physical property measurements due to higher additive content (p < 0.05). TiO2-containing materials exhibited significantly lower C. albicans growth (p < 0.01) than those loaded with ZrO2 or SiO2. (4) Conclusions: TiO2 nanoparticles of 40 nm and 200 nm, when added to pigmented PDMS at 1% weight, provided the best resistance to color change and significantly lowered C. albicans activity compared to silica- and zirconia-filled elastomers. Particle size differences rendered minor differences for most properties. The incorporation of low-level submicron- and nano-sized TiO2 particles has the potential to improve color stability and antifungal activity in silicones designated for maxillofacial prostheses and may be extended to denture reline applications.

1. Introduction

Extra-oral maxillofacial prostheses are essential treatment options for patients with significant facial structure defects. These defects can result from trauma, disease, burns, or as a congenital anomaly leading to psychological and social trauma. Patients with such defects require multidisciplinary therapeutic care involving a team effort among the maxillofacial surgeon, prosthodontist, and reconstructive surgeon, as well as follow-up psychological therapy [1]. Prosthetic rehabilitation provides psychological and functional benefits, enhancing aesthetics, speech, swallowing, self-esteem, and overall quality of life. Since 1960, silicon-based elastomers have been used to fabricate maxillofacial prostheses due to their flexible mechanical and translucent optical properties. However, common clinical problems of these materials include color loss and degradation of physical properties over time in a service environment.
Discoloration and physical property deterioration of a facial prosthesis arise from a myriad of factors, including environmental exposure, cosmetics application, and contact with sebum and cleaning solvents. Of the environmental components, ultraviolet radiation is considered a key factor in decomposing the elastomer’s optical and physical properties. Another major challenge is the susceptibility to fungal infection on the tissue side of the prosthesis. Similar observations have been reported for silicones serving as resilient denture soft liners [2,3,4,5].
Previous research has demonstrated positive results with the addition of nano-sized particles to silicon elastomers regarding physical, optical, and antifungal properties [6,7,8,9,10]. Nano-sized oxide particles are characterized by their small size, large surface area, and strong interactions with the organic polymer. Therefore, they can improve the optical and physical properties of the polymer, as well as its resistance to environmental stress-induced cracking and aging [11]. TiO2, when added to commercial maxillofacial silicones, has been shown to enhance color stability and certain mechanical properties and promote reduced microbial activity [7,8,9]. However, it also acts as an opacifier, which reduces translucency, increases color value, and lessens a facial prosthesis’s life-like appearance. Zirconia is considered a potential alternative nano-additive, as it possesses high flexural strength, fracture toughness, and hardness. Its potential for enhancing material performance has been suggested through a limited number of studies, where mechanical properties of a room-temperature vulcanizing silicone have been shown to increase with nano-ZrO2 additions [12], and resistance to ultraviolet radiation has been demonstrated when nano-ZrO2/SiO2 sols have been used to coat textiles [13].
Past research has enlisted commercial products that differ in elastomer chemistries and silica fillers, as well as the amount of nano-oxides added by the investigators [6,7,10,12,14,15,16,17,18,19,20,21,22]. One study measured the mechanical properties of three additives incorporated into A-2000 and A-2006 [20]. The additives affected Durometer hardness and tensile properties differently for each elastomer system, illustrating the dependence of physical behavior on the polymer system, as well as additive type, amount, and particle size. Consequently, this makes difficult the comparisons of results among different studies where elastomer ingredients differ. Needed are comparisons among formulations where the components are well controlled. This research employs a series of experimental formulations where different sizes of ZrO2 and TiO2 particles are incorporated into a common elastomer system and optical, physical, and antifungal properties are compared.
This research aim is to incorporate ZrO2 and TiO2 particles into pigmented polydimethyl siloxane (PDMS) elastomers and assess changes in color, physical, and antifungal properties based on differences in particle composition and size. The null hypotheses tested are that color stability, hardness, and tensile properties of silicon elastomers are no different for ZrO2 or TiO2 nanoparticles and that there are no differences with their submicron-sized counterparts. A second null hypothesis is that antifungal activity is the same for silicon elastomers with or without ZrO2 and TiO2 nanoparticles and submicron-sized particles.

2. Materials and Methods

The experimental groups, property tests, and sample sizes for this project are presented in Table 1. Four test groups and one control group were analyzed for changes in color, Durometer hardness, and tensile properties. For antifungal properties, the same test groups were combined with two negative material control groups. A positive biological group (one without materials) was included to verify the test was conducted properly.

2.1. Sample Preparation

Experimental pigmented elastomers were constructed by combining unpolymerized polydimethyl siloxane, nanoparticles, pigment, crosslinker, and catalyst and polymerizing the mixture under heat. Two particle sizes, with an eightfold size difference, of ZrO2 and TiO2 particles were chosen for this project. Four experimental ZrO2 and TiO2 groups, one SiO2 group representing a maxillofacial elastomer formulation, and two Ag groups used as negative material control groups in antifungal experiments are shown in Table 2.
For elastomer preparation, ZrO2 or TiO2 particles were mixed with vinyl-terminated polydimethyl siloxane (PDMS) (V-2K, MW 23,000, polydispersity 2.5, Mat no. 057077, Momentive Materials, Tarrytown, NY, USA) so that the total content, including crosslinker and pigment, was 1% by weight. One percent was chosen based on research reported by Hussein and Hassan [12], whereby 1% nano-ZrO2 could be well dispersed into PDMS, but 1.5% produced numerous agglomerates. The submicron- and nano-sized particles were incorporated using a rotary mixer (Model ME-100L, Charles Ross and Sons, Hauppage, NY, USA) at 3000 rpm for five minutes. An ultrasonic mixer (Hielscher ultrasound processor model UP200S, Teltow, Germany) with a S3 Sonotrode at 100% amplitude (460 W/cm2) was used to burst nanoparticle agglomerates and disperse them into the vinyl-terminated PDMS. The ultrasonic mixer was housed in a sound box to minimize noise during mixing, and the mixture was contained in a stainless-steel malt cup that was cooled in an ice bath to protect the polymer from overheating. Ultrasonic mixing proceeded for ten minutes. Then, each mixture was rotary remixed with a Cowles disperser (Charles Ross and Sons, Hauppage, NY, USA) for ten minutes at 5000 rpm to disperse the burst agglomerates. Two weight percent functional intrinsic yellow pigment (FI-202, lot no. DL101606, Factor II, Inc., Lakeside, AZ, USA) was added and rotary mixed at 5000 rpm for five more minutes. This yellow pigment was chosen because it was known to undergo a substantial color change when subjected to environmental weathering [23,24].
For polymerization, equimolar ratios of the nanoparticle-containing vinyl-terminated PDMS were combined with polymethyl hydrogen siloxane (V-XL crosslinker, batch no. HVDD112906, Momentive Performance Materials, Friendly, WV, USA) and 10 ppm platinum catalyst (VCAT-RT, lot no. 502L031798, OSi Specialties Inc., Sistersville, WV, USA). The mixtures were mechanically spatulated in a paper cup for two minutes with a wooden tongue depressor, and air bubbles were removed under 5 × 10⁻³ torr constant vacuum by a high vacuum pump (Welch Vacuum Technology, Skokie, IL, USA) attached to a bell chamber. Bubble removal was ascertained visually, and it typically required fifteen minutes. The mixtures were poured slowly into mold assemblies to allow the air from pouring to escape. A lid under load was placed on the molds to extrude excess material. The mold assemblies were placed into an 84 °C forced-air convection oven for sixty minutes for polymerization. For the control group, 13% loading weight of fumed silica (to follow what is used currently in maxillofacial prosthetics) was added to a vinyl-terminated polydimethyl-siloxane (PDMS) under 2000 rpm rotary mixer until fully dissolved, followed by 15–20 min of rotary mixing at 7000 rpms to ensure particle dispersion. No ZrO2 or TiO2 particles were added to control materials.
Test samples with different geometries were used for color, mechanical, and antifungal activity measurements. Disk-shaped molds were used to fabricate samples for color change measurements and Durometer (Shore A) hardness. Mold assemblies consisted of polyvinyl chloride (PVC) pipes cut into 6 mm thick sections and secured with medium-body polyvinyl siloxane (PVS) impression material to a gypsum slab to mimic what is used in dental labs fabricating maxillofacial prosthesis. The mixture was poured slowly from one side into the mold, and a glass slab was placed to extrude any excess material. Vice clamps secured the glass slab with approximately 2–5 kg of load. The resultant polymerized discs had a diameter of 38 mm and a thickness of 6 mm. Five discs per group were made, as previous studies showed significant differences in color changes could be detected at an alpha level of 0.01 with a power of 0.8 [25].
For tensile properties, elastomer mixtures were poured onto gypsum molds and covered with a clear polycarbonate sheet (13″ × 10″ × 0.5″, USP Plastic Corporation, Lima, OH, USA). The polycarbonate was secured with four-inch vice clamps, and tightened to deliver approximately 2–5 kg of load to extrude excess materials. The resultant elastomer sheets were 254 mm length × 165 mm width × 2 mm thickness. Dumbbell-shaped samples were cut from these elastomer sheets using a die cutter that conformed to die C for ASTM Standard D412 [26]. For each experimental and control group, twelve dumbbells were constructed. This sample size was chosen based on previous research, where a significant difference (p < 0.05) of 100% breaking strain between two groups was detected with 80% power [27]. A Nikon measure scope (MM-11U) with computer software (Quadra-check 200) was used to measure the width and depth of each sample at the dumbbell gauge length. This information was used to calculate cross-sectional areas, which were necessary for computing stress during the generation of stress–strain curves.

2.2. Exposure to Ultraviolet Radiation

Each dumbbell or disc was placed on a reflective surface inside a plywood enclosure beneath four 36-inch bulbs (UVB Broadband Lamp, FS40T12, National Biological Corp., Twinsburg, OH, USA) delivering UVB radiation with wavelength range from 290 to 315 nm. The enclosure was housed in an environmental chamber with controlled temperature and humidity throughout the experiment. Samples were placed 12 inches directly below the bulbs, and the surrounding environment was maintained at 25 °C and 30% relative humidity. Under these conditions, radiation was delivered at 0.2 mW/cm2, equivalent to 720 mJ/cm2/hour, and the sample surface temperature did not exceed 0.5 °C above the surrounding environment, as measured by a thermocouple. This UVB output represented the solar UVB irradiance reported at 30° latitude during summer months [28]. Light output was monitored continuously throughout the experiment using a light sensor and a data logger (UVB sensor, PMA 2100 logger, Solar Light Co., Philadelphia, PA, USA). The temperature was set at 25 °C with 30% relative humidity.
In addition to ultraviolet radiation exposure, materials containing each particle type were stored in a weathering control environment (darkness, 25 °C, 30% relative humidity). This provided an assessment of potential material changes occurring over time without a weathering stimulus. Color change measurement times were set at 600, 1800, and 3000 h, representing eight-hour daily exposures for 2.5, 7.5, and 12.5 months, respectively. Durometer hardness was measured at baseline and after 3000 h of environmental storage to determine material hardening over the test period. For mechanical testing, an extra set of test samples was constructed to establish baseline values since the tensile tests were destructive. For this same reason, mechanical tests could not be conducted at intermediate time intervals, making obtaining mechanical property values only at baseline and 3000 h necessary.

2.3. Color Measurements

Color measurements were made using a color reflectance spectrophotometer (CM-2002, Konica Minolta Corp., Ramsey, NJ, USA) with computer software (SpectraMagic NX, Konica Minolta Corp., Ramsey, NJ, USA). Color measurements were made on each disc at 0, 600, 1800, and 3000 h according to the CIE L*a*b* system (Commission Internationale de l’Eclairge, 2004). The spectrophotometer determined color according to ASTM D2244 [29]. Three axes defined the color space: L* was the white-black axis, a* was the red-green axis, and b* was the yellow-blue axis. At the beginning of each session, the spectrophotometer was calibrated with black and white backgrounds. Black calibration was conducted with background lights turned off, and white calibration was achieved with a white calibration plate. All measurements were made with samples resting on a standard white background plate (no. 21633347, Konica Minolta Corp., Ramsey, NJ, USA) using 50 gram weight with background lights turned on. Each disc was labeled with a randomized code using permanent ink scribed on the side (along the thickness dimension). Color measurements were made on the disc face above the top of the scribed code. The spectrophotometer was placed with the measuring port facing upward, and three tongue plates were placed underneath the body so that the device was parallel to the floor. Each disc was oriented with the code placed in the same position at each time interval so that color measurements would be taken at the same location. Once color measurements were completed, UVB samples were immediately returned to the weathering chamber, and control samples were placed in the control environment. After recording L*, a*, and b* values, color differences ( L*, a*, and b*) were calculated for each sample at each time interval. Total color change ( Eab*) was calculated from the equation:
ΔEab* = [(ΔL*)2 + (Δa*)2 + (Δb*)2]1/2

2.4. Physical Properties Measurements

2.4.1. Tensile Properties

For tensile testing, a universal testing machine (Instron 1123-5500R, Instron Corp., Boston, MA, USA) and computer software (M-Bluehill-K2-EN Revision A) were used to perform the tests and record data. Dumbbell-shaped samples (n = 12 per group) were measured for thickness and width, loaded into grips, and a long-travel extensometer with a 25 mm gauge length was attached. Each dumbbell was elongated at a rate of 500 mm/min, and stress versus strain data were graphically charted and digitally recorded until failure. Three properties were determined: ultimate tensile strength, total strain at failure, and modulus of elasticity. Ultimate tensile strength was the maximum stress the test sample could withstand, which usually occurred at failure. Maximum strain at break was a measure of the total amount of extension a material could withstand prior to failure. The modulus of elasticity was calculated as the slope of a linear portion of the stress–strain curve between 50% and 100% strain. Tensile testing was performed at baseline and after 3000 h of exposure to control and UVB environments.

2.4.2. Shore A Hardness

For Durometer hardness tests, the same discs as for color measurements were used (n = 5 per group). A shore A hardness tester (Instron Durometer Type A, Model DRCL, ASTM D2240, Instrument & Manufacturing Company Inc., Freepost, NJ, USA) was used to measure hardness at baseline (zero) and 3000 h of storage in control or UVB environments. Hardness measurements were taken on the opposite face from those used to obtain color measurements. This procedure was followed because the Durometer indenter could deform the elastomer and affect color measurements, which were taken during the same session. Hardness measurements were made following ASTM D2240 protocol [30]; five measurements were made at random locations and the average of these readings was considered the representative hardness value. Baseline hardness was subtracted from hardness at 3000 h to determine the change in hardness over time.

2.5. Antifungal Activity

2.5.1. Candida albicans and Growth Conditions

C. albicans wild-type strain (CA42) was grown aerobically in yeast nitrogen base (YNB) medium (Difco Laboratories, Detroit, MI, USA) on fresh Sabouraud Dextrose Agar plate (Difco Laboratories, Detroit, MI, USA). The plate was incubated for 24 h at 37 °C on a shaker at 60 rpm (model classic C25, New Brunswick Scientific, Edison, NJ, USA). Cells were harvested and washed three times with 0.15 M phosphate-buffered saline (Gibco PBS; pH 7.4, Ca+2 and Mg+2 free, Life Technologies, Grand Island, NY, USA). Cells were resuspended in 10 mL PBS, counted with a hematocytometer, and used within 24 h.

2.5.2. Biofilm Formation

Test samples consisted of circular disks stamped from the remnants of silicon elastomer sheets used to make dumbbell-shaped samples for tensile tests. A circular punch (9-Piece Hollow Punch Set, SKU No. P3838, Central Forge, Pittsburg, PA, USA) was used to create these disks with 2 mm thickness and 12.7 mm diameter. Twelve disks per group were created for the four experimental groups (ZrO2, TiO2), the positive material control group (silica), and two negative material control groups (Ag). The sample size was determined from a power analysis of prior data where α = 0.05, effect size was 0.55, and power was 0.85, which determined at least 9 test samples per group were required. Silver nanoparticles were added to PDMS at 1 µg/mL (1 ppm). This concentration was chosen due to its potential antifungal activity while remaining below potential toxicity (30 µg/mL) [31]. Disks were sterilized in an autoclave at 120 °C and 16 psi for 30 min.
The biofilm formation protocol used in this study followed that described by Kuhn et al. [32]. All discs were preconditioned with fetal bovine serum (Gibco FBS; Life Technologies, Grand Island, NY, USA) in a 96-well tissue culture plate (Falcon Microtest Tissue culture Plate, 96 well, Flat Bottom with Low Evaporation Lid, Becton Dickinson Labware, Franklin Lakes, NJ, USA) and incubated at 37 °C for 24 h. FBS was removed and gently washed with 0.15 M PBS to remove residual FBS. Then, 200 µL of fresh YNB medium was added to each well, followed by 200 µL of C. albicans cell suspension in a concentration of 1 × 10⁵ cells/mL, which yielded 20,000 cells per well. The plate was incubated for 90 min in 5% CO2 at 37 °C on a rocker table at 60 rpm to develop the adhesion phase of the C. albicans biofilm. Samples were washed with PBS to remove unattached cells, covered with 200 µL of YNB, and incubated for 48 h in 5% CO2 at 37 °C on a rocker table at 60 rpm to provide a suitable environment for the biofilm maturation phase.
In addition to positive and negative material control groups, which consisted of silica and silver nanoparticles, a positive biological control group was included, which entailed constructing wells containing YNB and C. albicans without elastomer. Two methods were performed to measure antifungal activity: XTT colorimetric assay and confocal laser scanning microscopy (CLSM).

XTT Colorimetric Assay

C. albicans biofilm formation on test samples was quantified using a tetrazolium salt-based 2,3-bis (2-methoxy-4-nitro-5-sulfophenyl)-5-([phenyl amino] carbonyl)-2H-tetrazolium hydroxide (XTT) colorimetric assay, as described by Chandra et al. [33]. This method measures enzyme activity that reduces XTT dye to water-soluble formazan dye. The XTT assay is rapid, reproducible, non-invasive, and non-destructive, and requires minimal post-processing of samples [34]. The reduction of XTT to formazan crystals can only occur in the presence of viable cells and the necessary reductase enzymes. Therefore, the XTT assay measures the optical density of formazan crystals in solution to indicate the metabolic activity of viable C. albicans cells. Immediately after biofilm maturation, YNB was removed, test samples were washed with PBS, and samples were transferred to a new 96-well tissue culture plate. Then, 200 μL PBS, 50 μL XTT (1 mg/mL in PBS), and 4 μL menodine solution (1 mmol/L in acetone) were added to each well in the new 96-well plate for test groups, and to the old 96-well plate for control groups. Plates were incubated in darkness at 37 °C for 5 h. The suspension was then measured spectrophotometrically (ELx808 Absorbance Microplate Reader, BioTek, Winooski, VT, USA) at 492 nm. At this wavelength, the absorbance of the water-soluble orange formazan dye end-product can be measured.

Confocal Laser Scanning Microscopy (CLSM)

Biofilm formation was also evaluated qualitatively using confocal laser scanning microscopy. The protocol used was described previously by Chandra et al. [33]. Two samples of each group were transferred carefully to preserve biofilms to a 12-well culture plate and incubated for 45 min at 37 °C in 2 mL PBS containing the fluorescent stain FUN-1 (lot # 745237, excitation wavelength = 488 nm, and emission wavelength = 505 nm, Invitrogen, Molecular Probes, Eugene, OR, USA), which emits green fluorescence when diffused into the cytoplasm and is converted over time by metabolically active enzymes into orange-red cylindrical intravascular structures. After incubation, silicon elastomer discs were turned over and placed on a 35 mm diameter glass-bottom petri dish (MatTech Corp., Ashland, MA, USA). Confocal micrographs were taken using Olympus Fluoview Software of an Olympus FV500 system on an IX81 inverted microscope (with 40× lens, and the 488 nm excitation/522 nm emission mode), from different areas of each sample to evaluate the architecture of C. albicans biofilm growth on elastomer discs, at the Microscopy Core Research Facility of the Center for Biotechnology of University of Nebraska-Lincoln.

2.6. Data Analyses

Color measures for control and UVB groups were pooled to compare baseline color among the different formulations. Group means and standard deviations were calculated for dependent variables L*, a*, and b*. Normality was assessed with the Shapiro–Wilk W test [35] and a one-way analysis of variance assessed color parameter differences. If significant (p < 0.05), pairwise comparisons were accomplished with a Tukey–Kramer post hoc test [36]. Group means and standard deviations were calculated for dependent variables ∆L*, ∆a*, ∆b*, and ∆Eab*for color analysis over time. Independent variables influencing color were weathering environment (control and UVB), particle (13% silica, 1% TiO2 200 nm, 1% TiO2 30–40 nm, 1% ZrO2 200 nm, and 1% ZrO2 40 nm), and time (600, 1800, and 3000 h). The null hypothesis that color and hardness changes were not affected by nanoparticle addition, weathering exposure, and time was tested by a three-way analysis of variance (ANOVA) with full interaction, followed by a Tukey–Kramer post hoc test for pairwise comparisons at a (p < 0.05) level of confidence.
Baseline Shore A hardness measurements were compared using the same protocol as described for baseline color. To compare changes in hardness among materials after 3000 h, mean ± s.d. delta Shore A values were computed and assessed for differences with one-way ANOVA/Tukey (p < 0.05). The null hypothesis tested was that the change in hardness was not different for materials containing any particle type.
Group means and standard deviations for ultimate tensile strength, strain at break, and modulus of elasticity were calculated as dependent variables for tensile properties. Independent variables were test condition (immediate (baseline), 3000 h control, and 3000 h UVB) and particle (13% silica (control), 1% TiO2 200 nm, 1% TiO2 30–40 nm, 1% ZrO2 200 nm, and 1% ZrO2 40 nm). Following the Shapiro–Wilk-W test, a two-way analysis of variance (ANOVA), followed by a Tukey–Kramer post hoc test for pairwise comparisons at a (p < 0.05) confidence level, was used to test the null hypothesis that tensile properties of PDMS elastomers were not affected by particle type.
A linear least square model was constructed for antifungal activity, followed by a Dunnett adjustment to compare group means and standard deviations of XTT absorbance to the positive control group at a (p < 0.01) confidence level. The null hypothesis tested was that particle type did not affect the antifungal activity of PDMS elastomer.

3. Results

3.1. Color Measurements

All experimental groups passed normality tests for baseline and color difference measurements (p ≥ 0.05). Results from the one-way ANOVA indicated that significant differences among materials were present at baseline for color parameters L* and b* (p < 0.05), but not a* (p ≥ 0.05). Results from the three-way ANOVA for color differences demonstrated significant differences existed for all main effects (materials, environment, and time) (p < 0.001) and two-way interactions (p < 0.02), but not the three-way interaction (p ≥ 0.05) for color parameters L*, b* and Eab*. For a *, all were significant (p < 0.01) except for the material × time two-way interaction and the three-way interaction (p ≥ 0.05). Specific differences among groups are addressed in the following subsections.

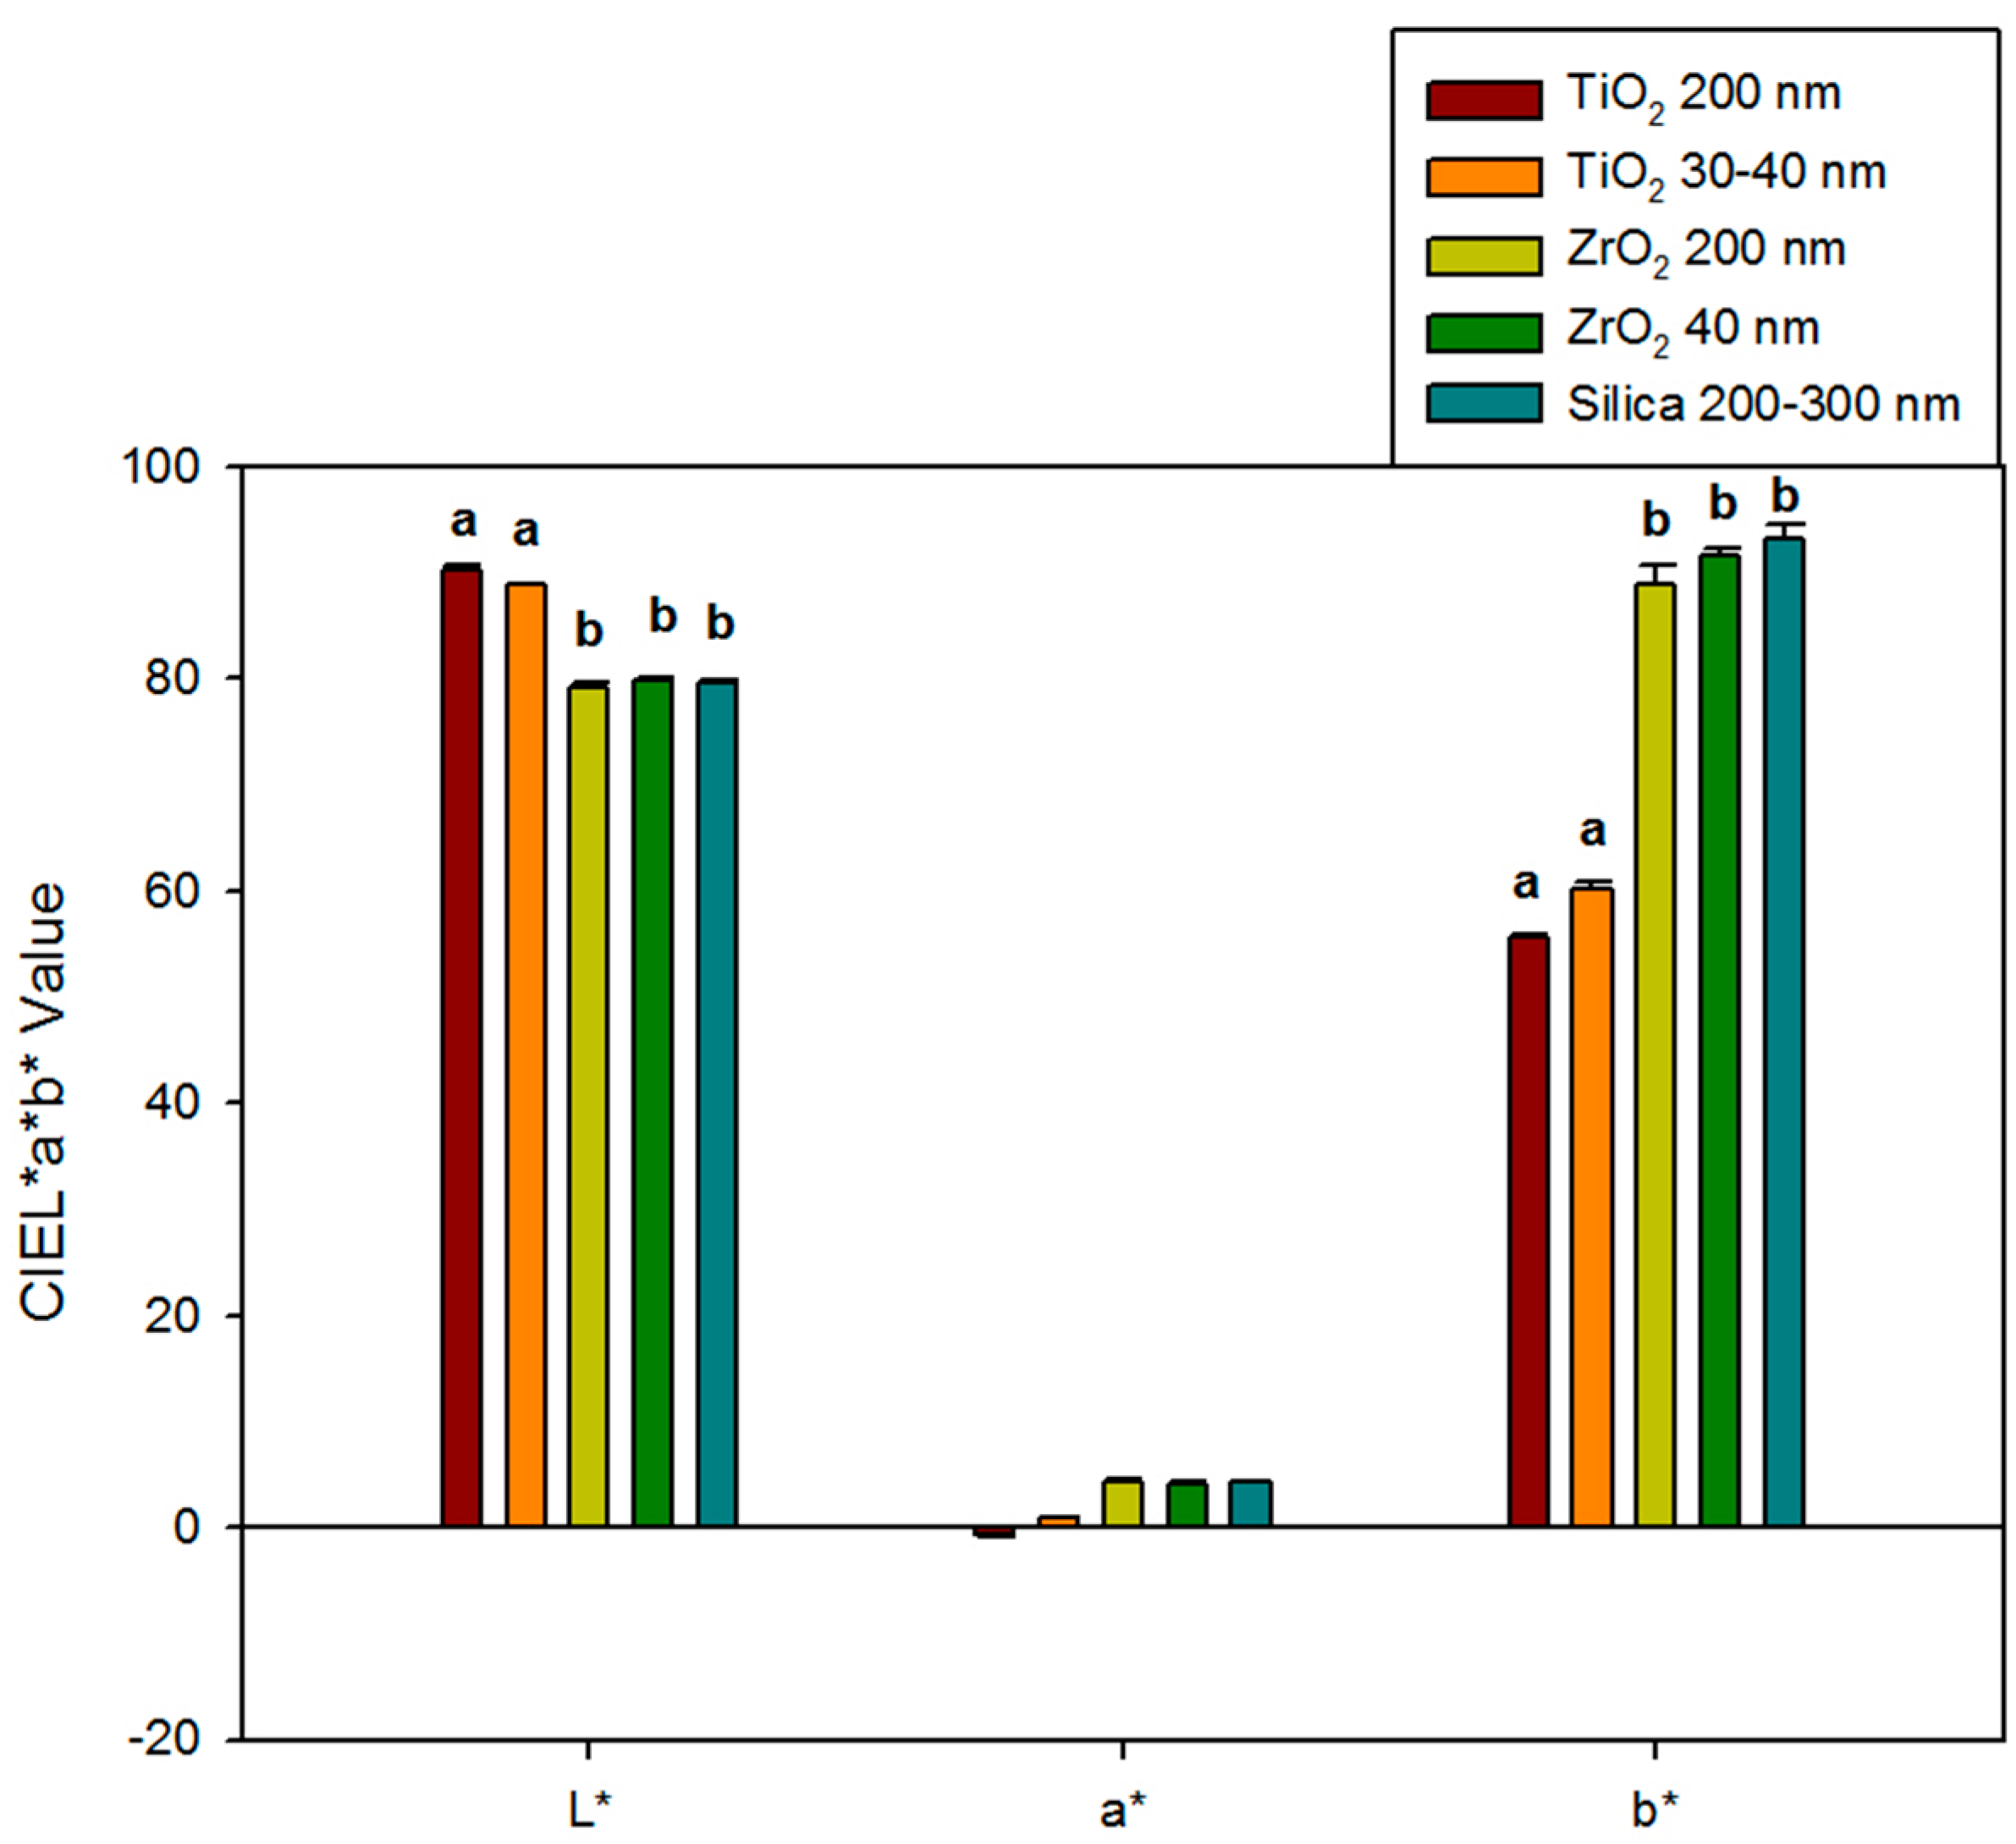
3.1.1. Baseline Color Measurements

Baseline color measurements (L*, a*, and b*) for each group are presented in Figure 1. Additions of ZrO2 to the yellow elastomers produced materials similar in color to the control materials for L*, a*, and b* color parameters (p ≥ 0.05). However, TiO2 additions produced whiter and less yellow materials than those filled with zirconia or silica, as L* values were 9.0 to 11.1 units higher, and b* values were 28.7 to 37.6 units lower (p < 0.05). Differences in red-green color were lower, as the maximum difference among all material groups was 5.0 units, as observed between 200 nm TiO2 and control groups (p ≥ 0.05). Baseline color was not significantly affected by particle size for either ZrO2- or TiO2-containing materials (p ≥ 0.05).

3.1.2. ΔE*ab Color Changes after 600 h Exposure to Control and UVB Environments

Color measurements obtained after 600, 1800, and 3000 h were used to determine color differences with baseline measurements, and ΔEab was calculated from Equation (1). Figure 2 shows ΔEab color changes over time for the ZrO2-, TiO2-, and SiO2-filled materials.
After 600 h, the overall color change ( E*ab) was lowest for the 30–40 nm TiO2 and material control groups in the control weathering environment (p < 0.05, Figure 2, significance not shown). Both were below the 50:50% perceptible color difference threshold of 1.1 for maxillofacial skin replications, as reported by Paravina et al. [37]. All control groups were below the 50:50% threshold for the acceptable color difference of 3.0 for light-colored specimens. For UVB exposure, 200 nm TiO2 demonstrated the lowest color change, followed by 30–40 nm TiO2 group (p < 0.05). All groups were well above the 50:50% acceptability threshold of 3.0 except for 200 nm TiO2, with a Eab* of 2.63.

3.1.3. ΔE*ab Color Changes after 1800 h Exposure to Control and UVB Environments

After 1800 h, the mean E*ab value of 0.9 units for 30–40 nm TiO2 stored in control conditions (darkness) was significantly lower than all other groups. It overlapped with the control group (p < 0.05, Figure 2, significance not shown). The 200 nm ZrO2 group underwent the highest color change at 3.5 E*ab units, the only formulation above the 3.0-unit threshold for acceptable color change. With exposure to UVB radiation, the 200 nm TiO2 group experienced the least E*ab color change at 5.1 units, which was followed by 30–40 nm TiO2 (7.2 units), 40 nm ZrO2 (12.4 units), 200 nm ZrO2 (13.6 units), and the silica control group (14.7 units). All groups were well above the color difference threshold for acceptability ( E*ab > 3.0), and the two TiO2 groups underwent significantly less color change than the ZrO2- or SiO2-containing elastomers (p < 0.001, not shown in Figure 2). For both ZrO2- and TiO2-containing materials exposed to UVB radiation, the 200 nm particles imparted significantly better resistance to color change than the 40 nm particles (p < 0.05). However, the E*ab differences between 200 nm- and 40 nm-containing materials were 1.3 and 2.1 units for ZrO2- and TiO2-containing materials, respectively, falling within the acceptable limit of 3.0 units.

3.1.4. ΔL*, Δa*, Δb*, and ΔE*ab Color Changes after 3000 h Exposure to Control and UVB Environments

Table 3 presents CIELab color changes occurring after 3000 h exposure to the control environment or UVB radiation. ΔL*, Δa*, and Δb* parameters are included to illustrate the nature of color change occurring within the pigmented elastomers over time.
L* values were negative for all materials after 3000 h of storage in control conditions, indicating that darkening occurred. Although materials filled with TiO2 and silica were shown to undergo significantly less darkening statistically, the maximum difference between any two groups was 1.1 units. With UVB radiation exposure, remarkable darkening was observed, with L* values ranging from −3.1 units for 20 nm TiO2 to −10.8 units for the control. The L* values for ZrO2-containing elastomers were double that of TiO2 materials, and although statistically significant differences were noted between particle sizes for both fillers, the maximum difference was 0.8 units, as observed between 200 nm and 30–40 nm TiO2-filled materials.
The red-green color parameter, a*, showed no significant differences among groups subjected to control weathering conditions, with mean value magnitudes at 0.4 units or less (p ≥ 0.05). For UVB exposure, the control group showed the highest a* value (most red, suggesting green fading), but no statistical significance was demonstrated among the groups. No statistical differences between particle sizes were noted for ZrO2 or TiO2. Categorically, standard deviations were large for a*.
Negative b* values were observed after 3000 h for all materials exposed to both control and UVB environments, indicating that the yellow pigment faded, even when stored in darkness. The best resistance to fading was observed in TiO2-containing elastomers, as their b* values were approximately one-third to one-half of their ZrO2- and SiO2-filled counterparts under either control or UVB conditions. Again, no significant differences were noted between submicron and nano-sized particles for either ZrO2 or TiO2.
No statistically significant differences were identified among groups in observing the overall color change (∆Eab*) after 3000 h under control conditions. However, ZrO2- and SiO2-filled materials exceeded the 50:50% acceptable threshold for color change. Following 3000 h of UVB weathering, the 200 nm TiO2 group showed the lowest color change, which was significant when compared to both the ZrO2 and control groups (p < 0.05). All groups possessed Eab* values well above the acceptable threshold of color change.

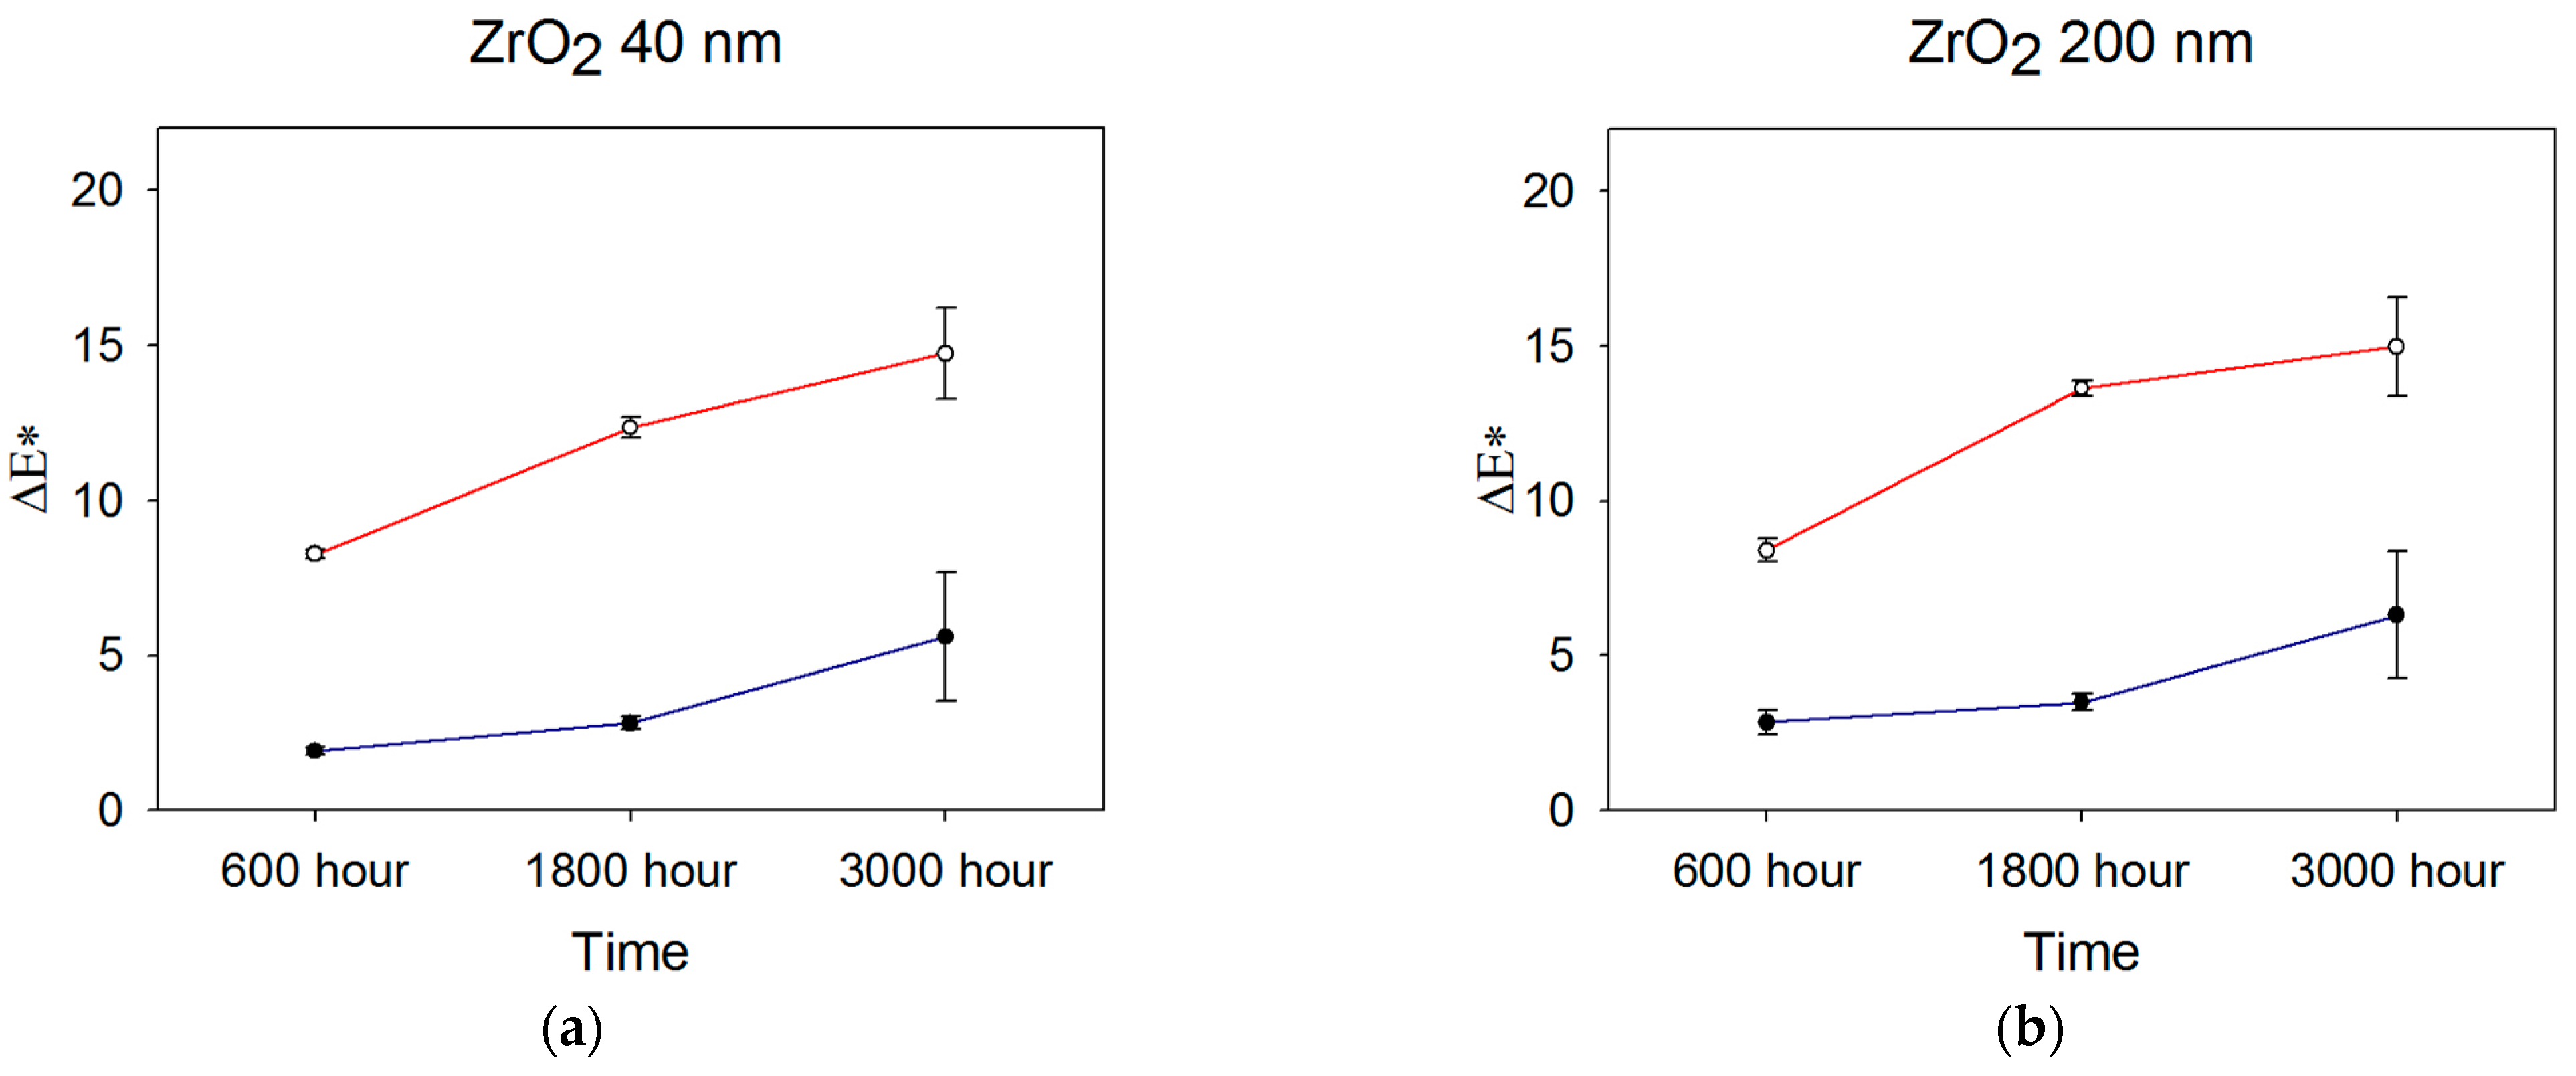
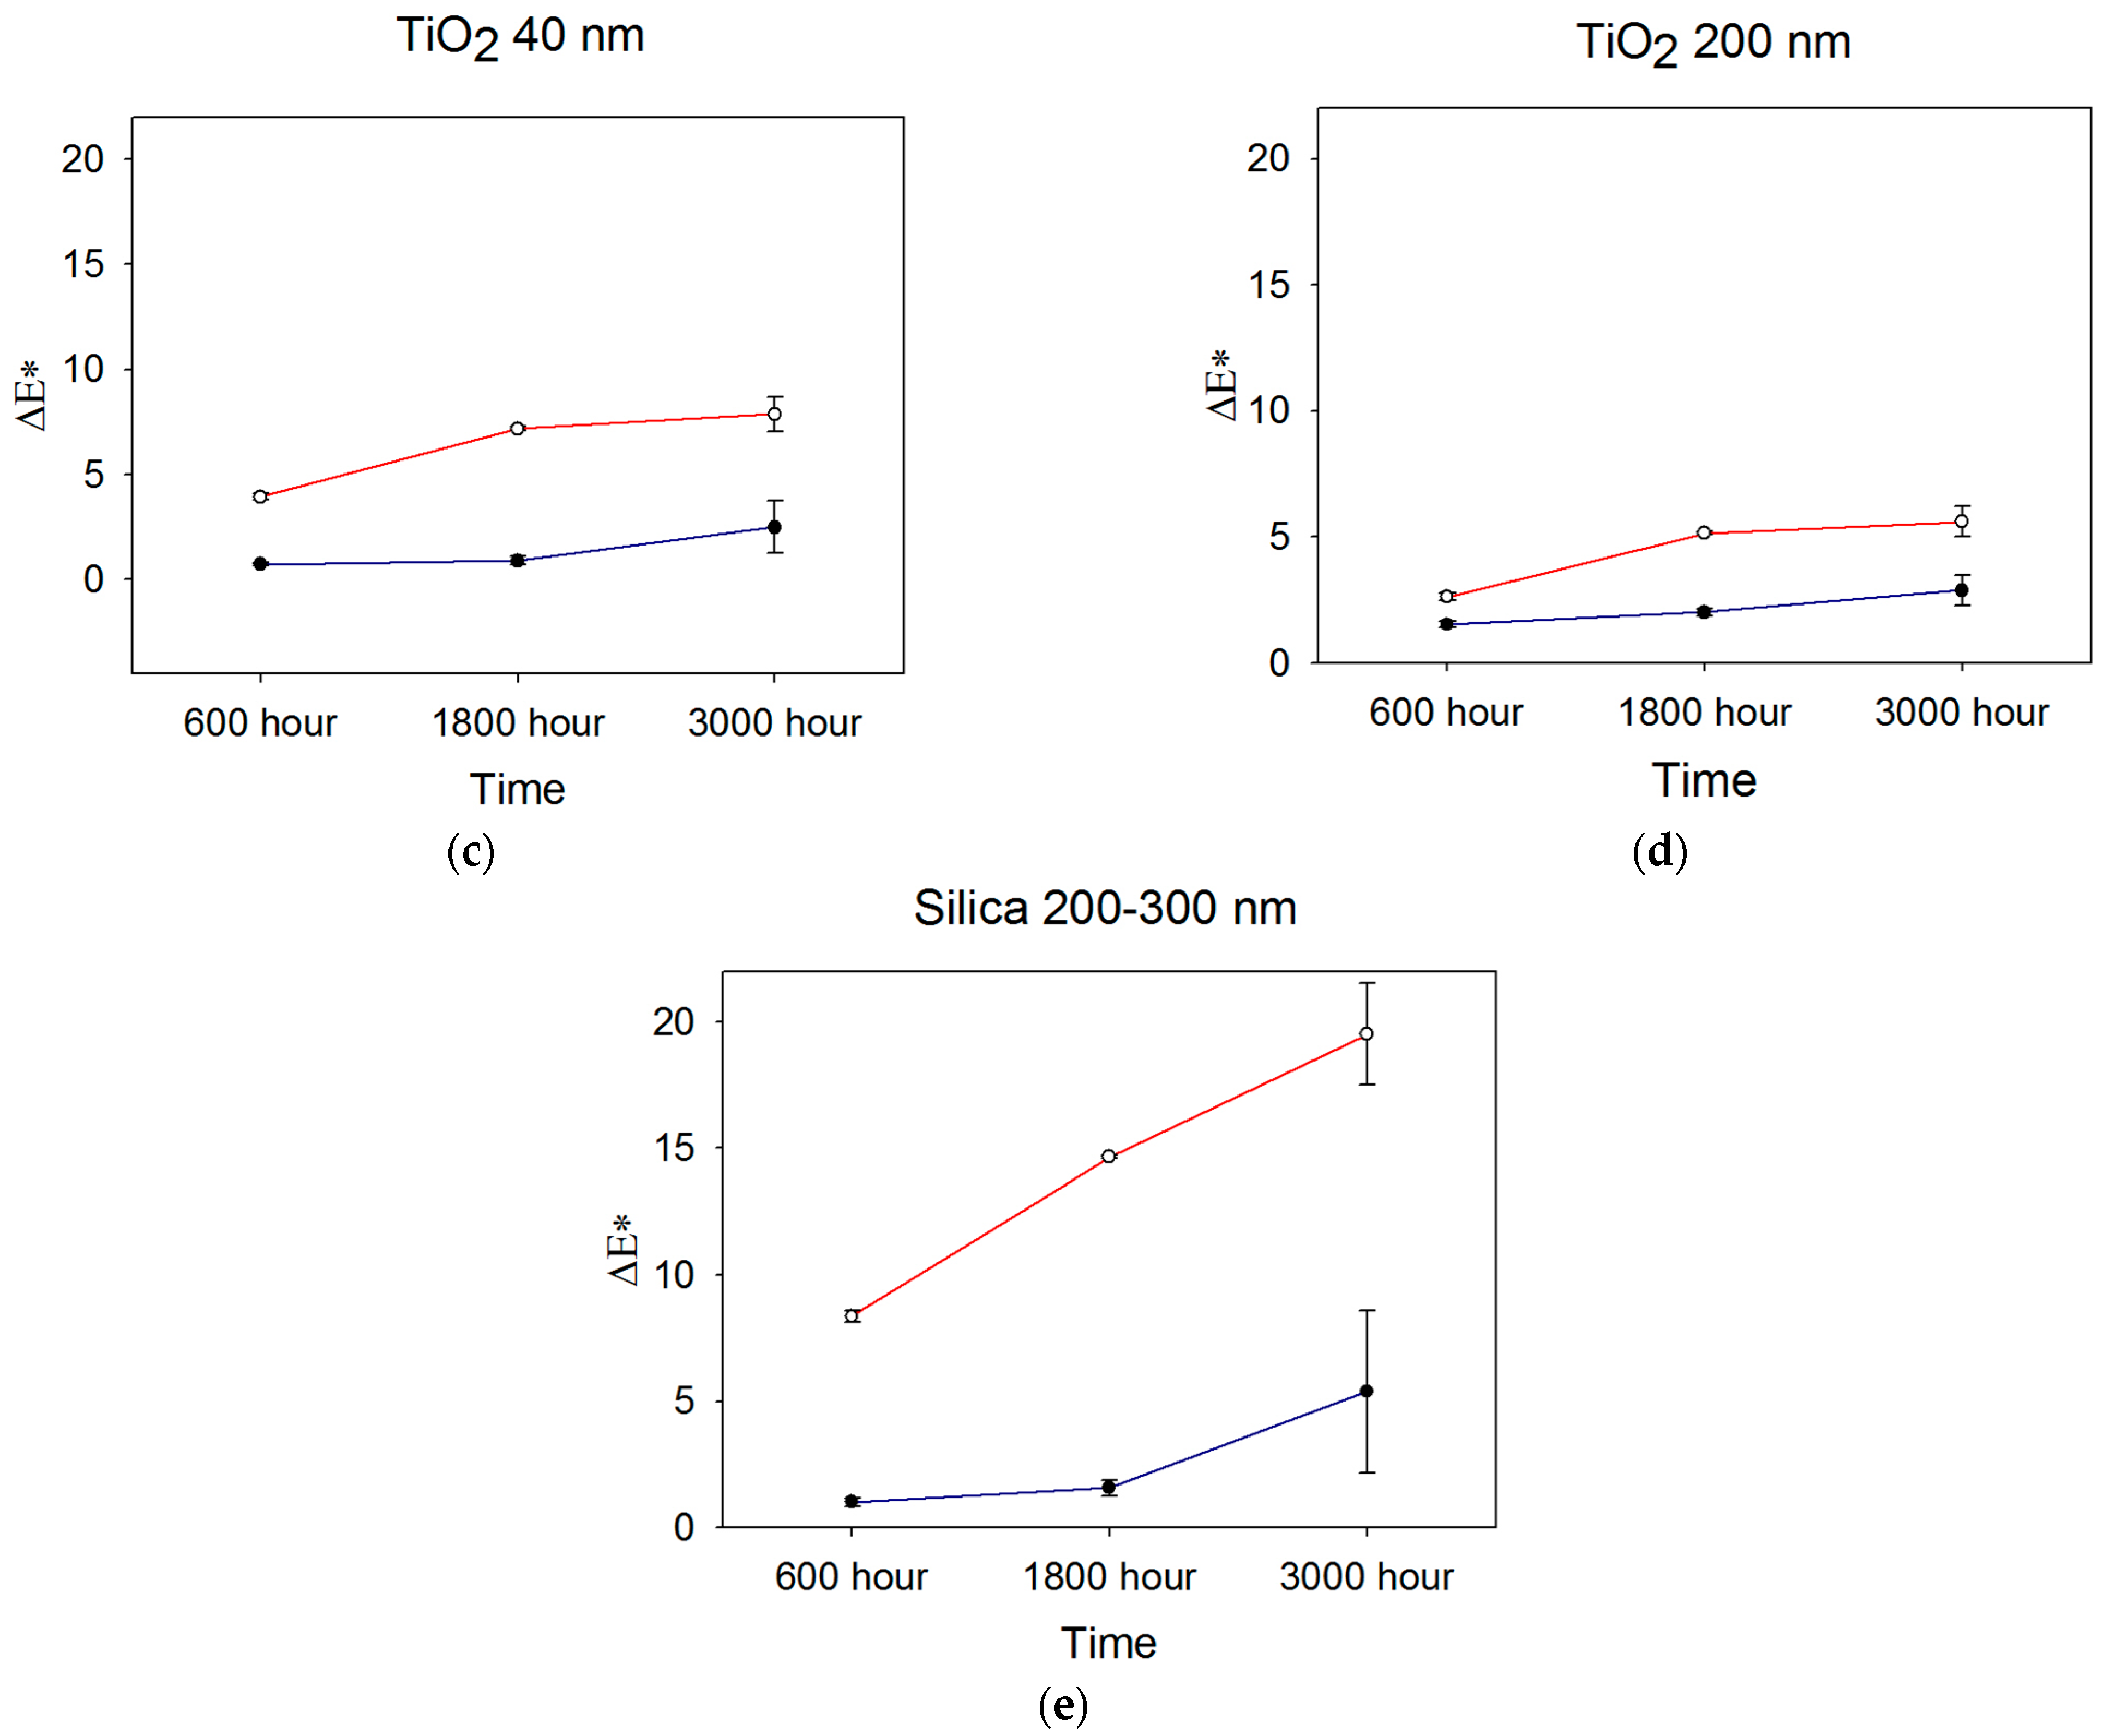
3.1.5. Color Changes over Time

Generally, color change increased over time, as UVB induced more color change for all groups at 600 h, 1800 h, and 3000 h compared to storage in darkness (p < 0.05, not shown in Figure 2). The TiO2 200 nm group displayed the lowest color change, and the control group displayed the highest color change in both the control and UVB environments. For all materials, Eab* color changes under control conditions were at similar levels at 600 h and 1800 h, then increased at 3000 h. The changes were statistically significant for ZrO2 and SiO2 materials (p < 0.02). UVB exposure increased color change from 600 h to 1800 h for all materials (p < 0.05), where TiO2 materials underwent the least change. Much larger changes were noted for ZrO2- and SiO2-containing materials (p < 0.01), which were similar. At 3000 h, significant discoloration continued for SiO2- and ZrO2-containing materials (p < 0.05), but TiO2 materials showed non-significant changes from 1800 h. Interestingly, error bars were larger for all materials at 3000 h, suggesting increased material instability at that time point.

3.2. Shore A Hardness

Baseline shore A hardness values ranged from 18 to 22 for the 1% filled ZrO2- and TiO2-containing materials. ANOVA/Tukey results showed significantly higher hardness for the 200 nm ZrO2 materials (p < 0.05), with non-significant differences noted among the 40 nm ZrO2 and two TiO2 groups. A total of 3000 h aging in either the control or UVB environment rendered little change in hardness for any ZrO2 or TiO2 formulation. The SiO2-containing elastomers, with thirteen times more filler, were significantly harder and underwent more change over time (p < 0.05), but the mean change was no greater than 1.5 Shore A units. Numerical results are presented in Table 4.

3.3. Tensile Properties

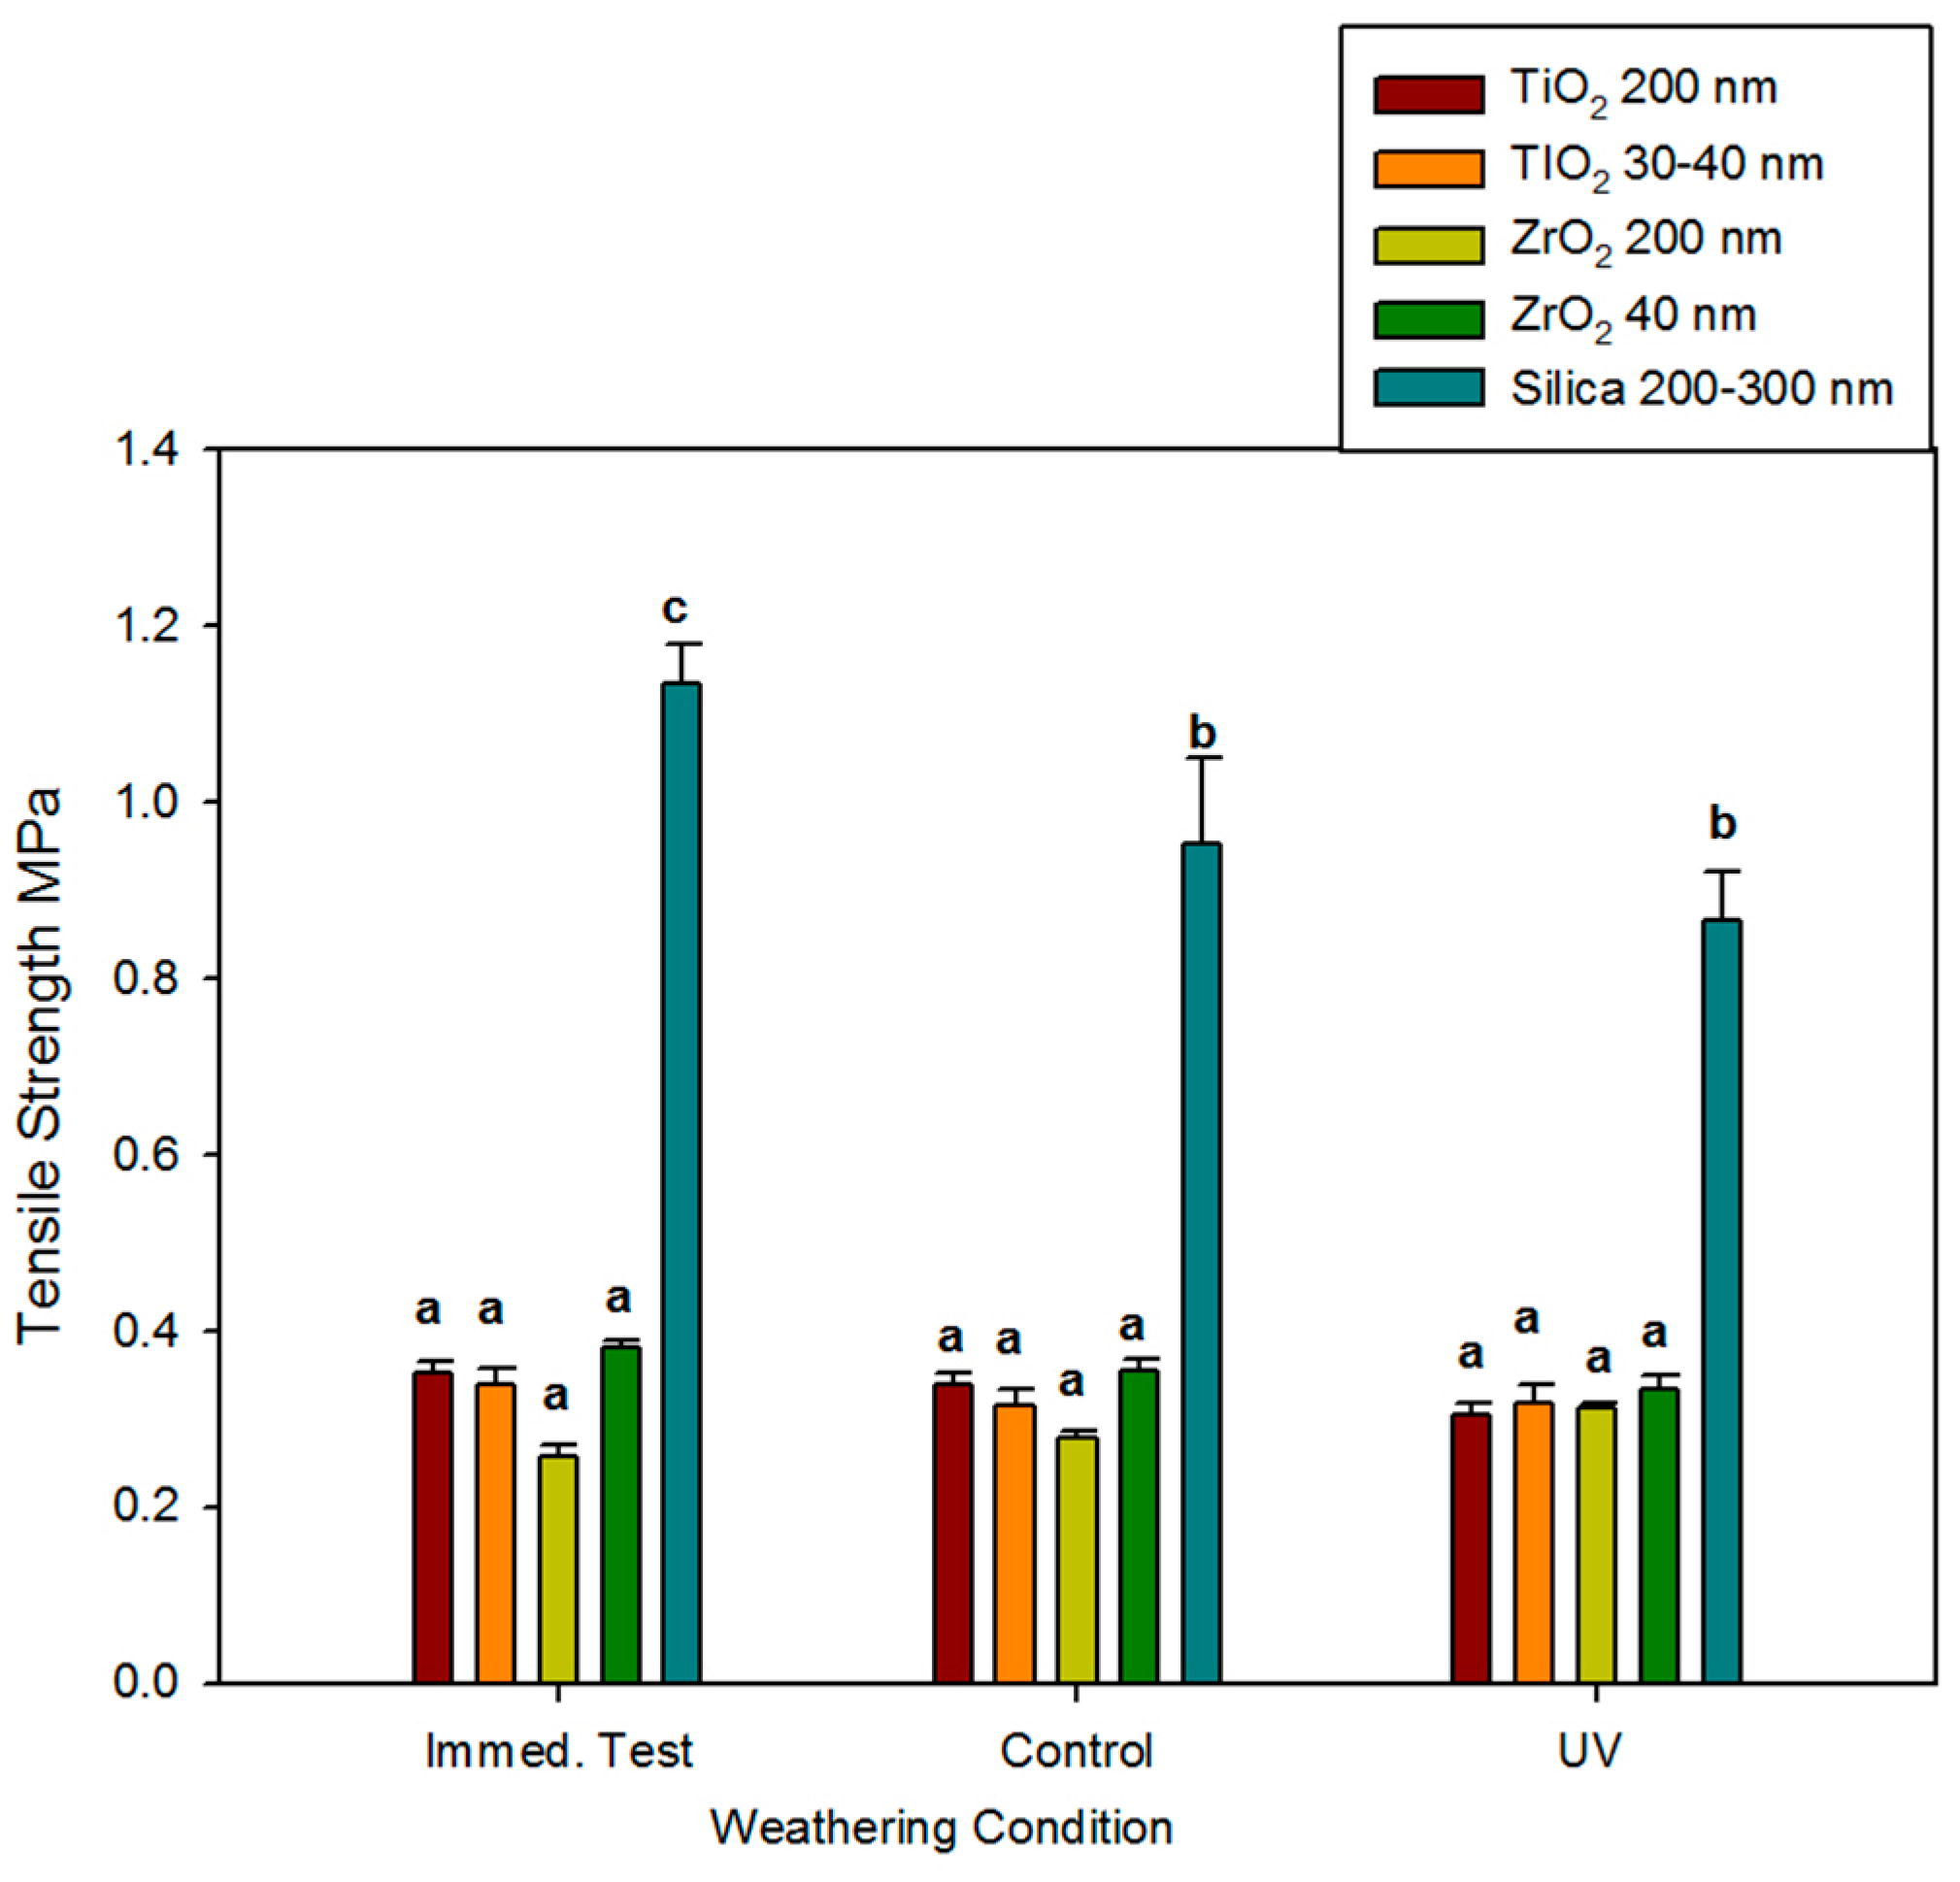
3.3.1. Ultimate Tensile Strength

Mean tensile strength measured immediately for the 1%-filled ZrO2 and TiO2 elastomers ranged from 0.26 MPa to 0.38 MPa and did not significantly change over 3000 h, regardless of storage environment (p ≥ 0.05). No differences were noted between ZrO2 and TiO2 materials, nor were differences identified based on particle size (Figure 3). The control elastomers were approximately three times stronger and declined in strength by 15% to 25% after 3000 h.

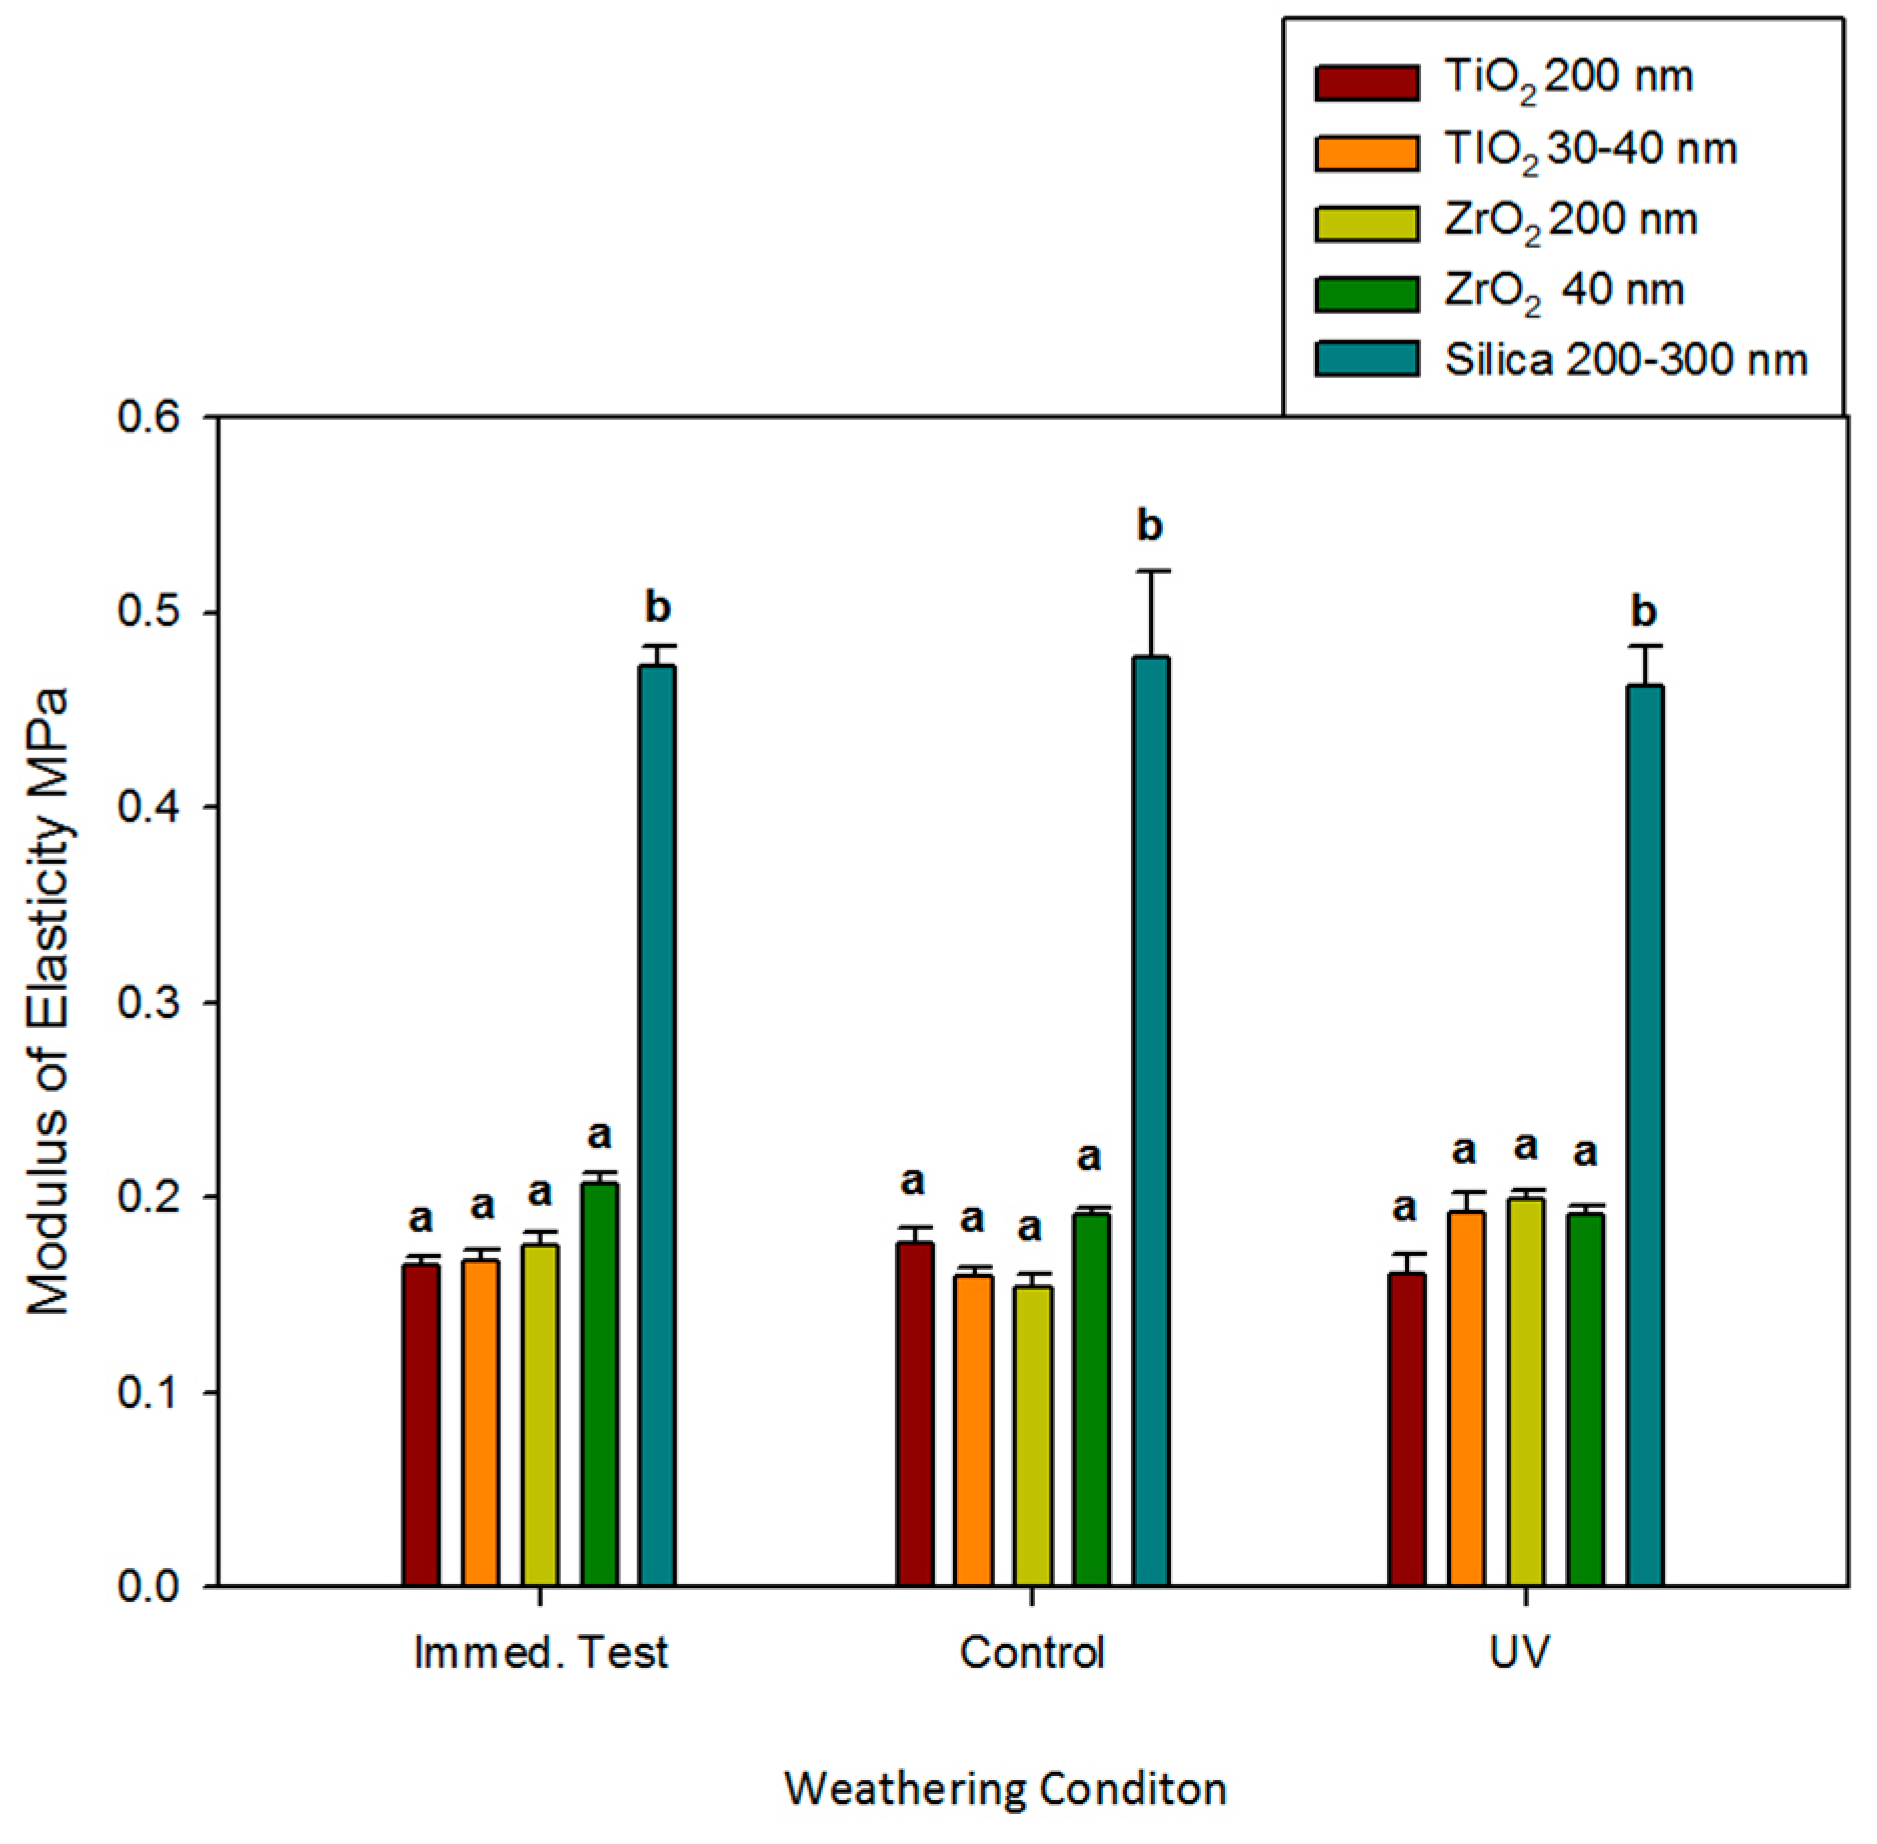
3.3.2. Modulus of Elasticity

Modulus of elasticity followed a similar trend for tensile strength, as ZrO2 and TiO2 moduli were not different and were not affected by time, environmental exposure, or particle size (p ≥ 0.05). Silica-filled controls were two to three times stiffer, and no significant differences were noted for materials stretched immediately and following 3000 h of darkness or UVB exposure (p ≥ 0.05, Figure 4).

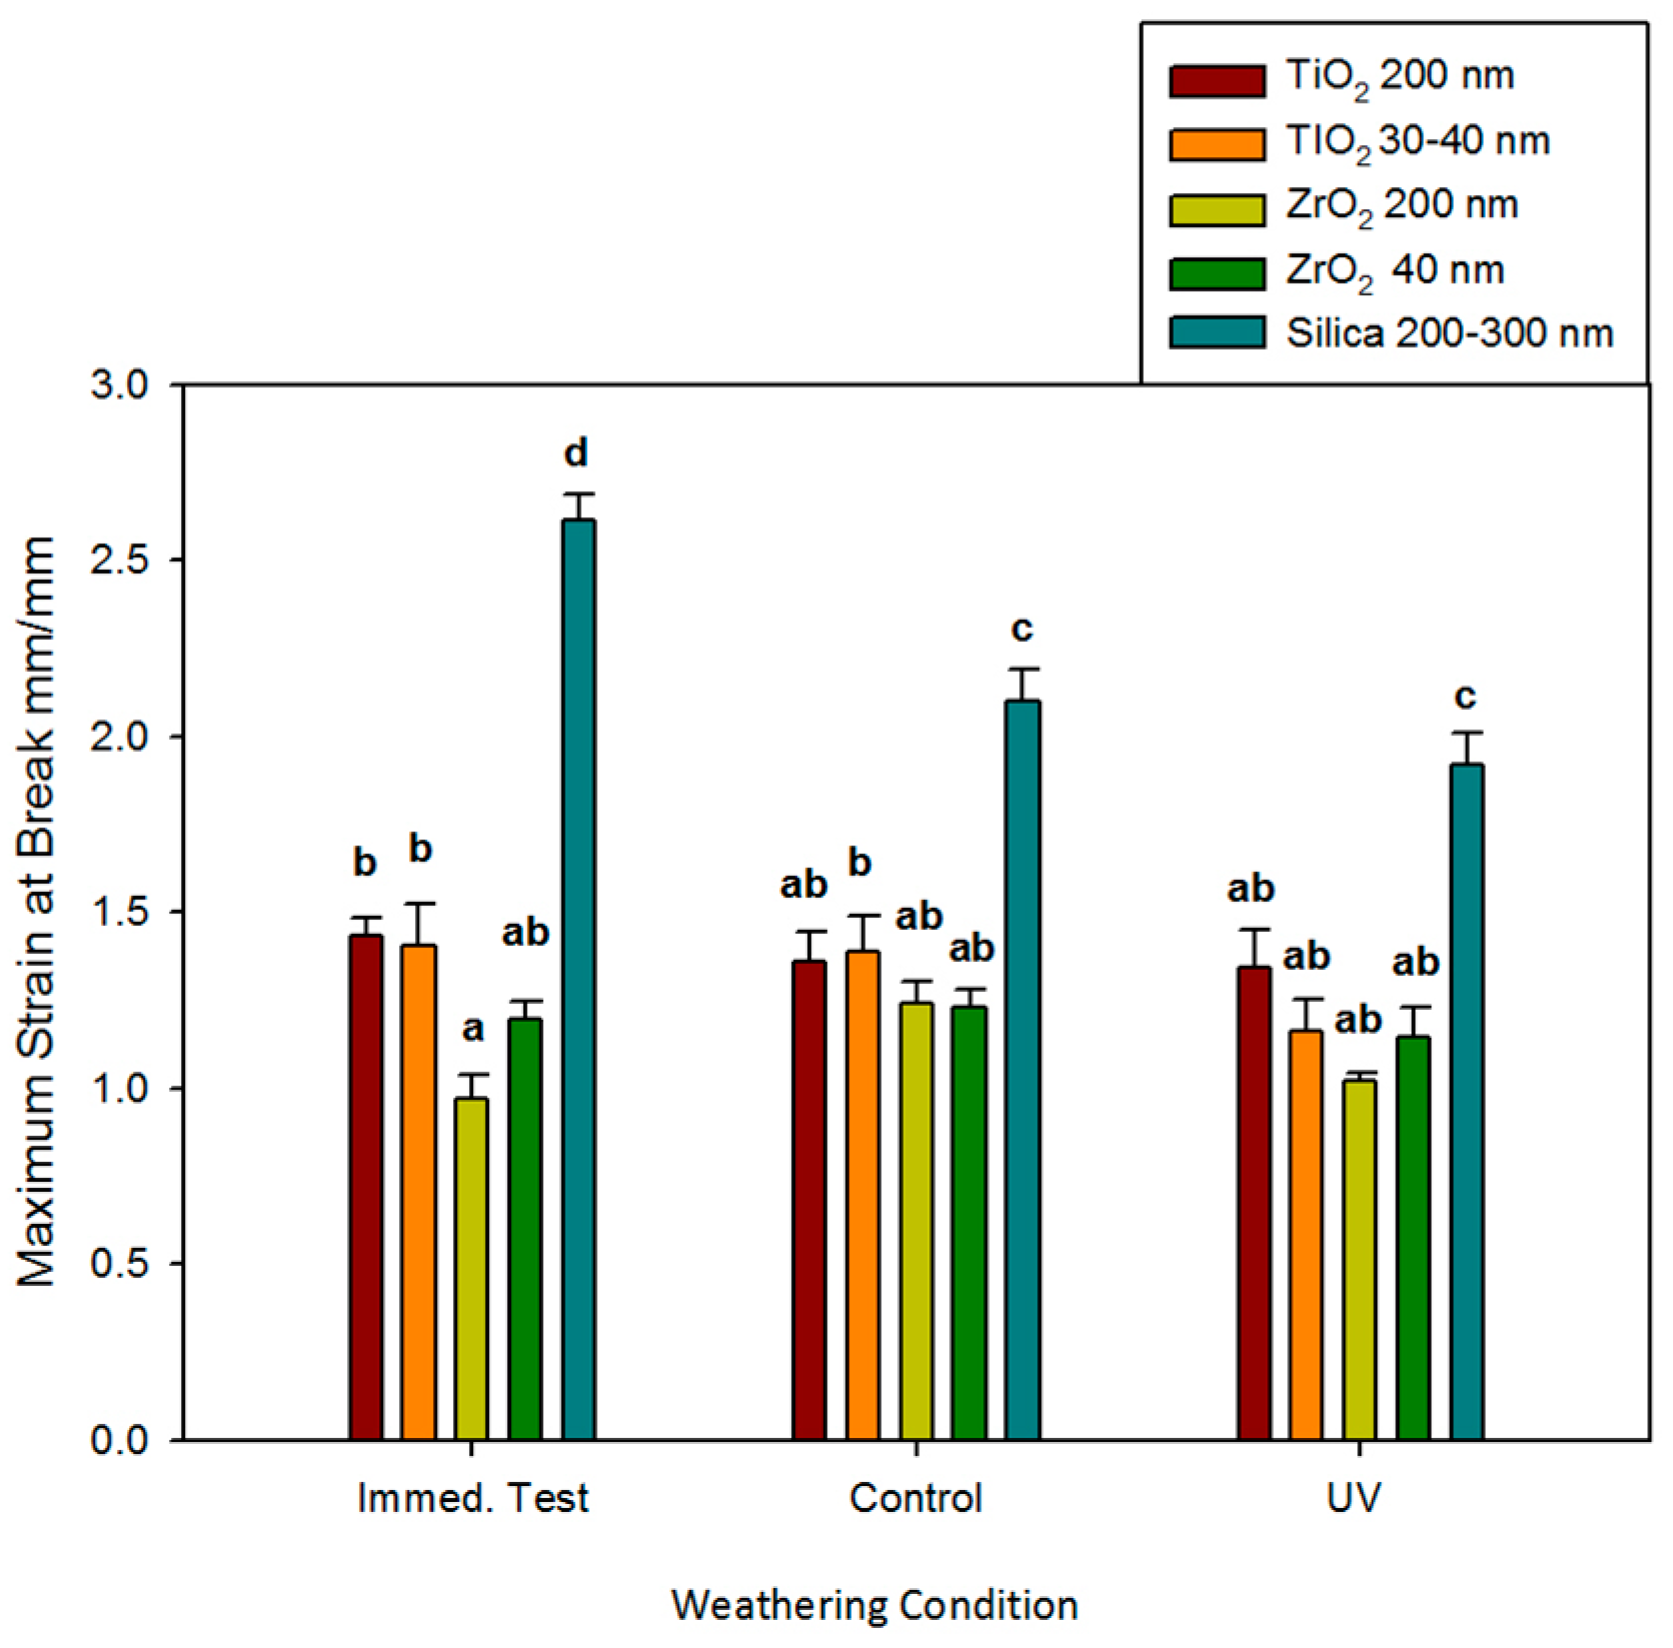
3.3.3. Strain at Break

As observed for other tensile properties, no significant changes in breaking strain occurred due to storage conditions or the passage of time for any ZrO2 or TiO2 material (p ≥ 0.05, Figure 5). ZrO2 and TiO2 elastomers were not different from one another, with one exception. The immediate mean value of strain at break for the ZrO2 200 nm materials was significantly lower than both TiO2-containing materials (p < 0.05) but was in the same statistical grouping as the ZrO2 40 nm materials. The mean breaking strain for control elastomers was 1.8 to 2.7 times higher than ZrO2 and TiO2 elastomers at baseline (immediate) testing. It decreased after 3000 h of storage in control and UVB environments (p < 0.05). With 3000 h of UVB exposure, control materials were only 1.4 to 1.7 times higher than materials containing ZrO2 and TiO2.

3.4. Antifungal Activity

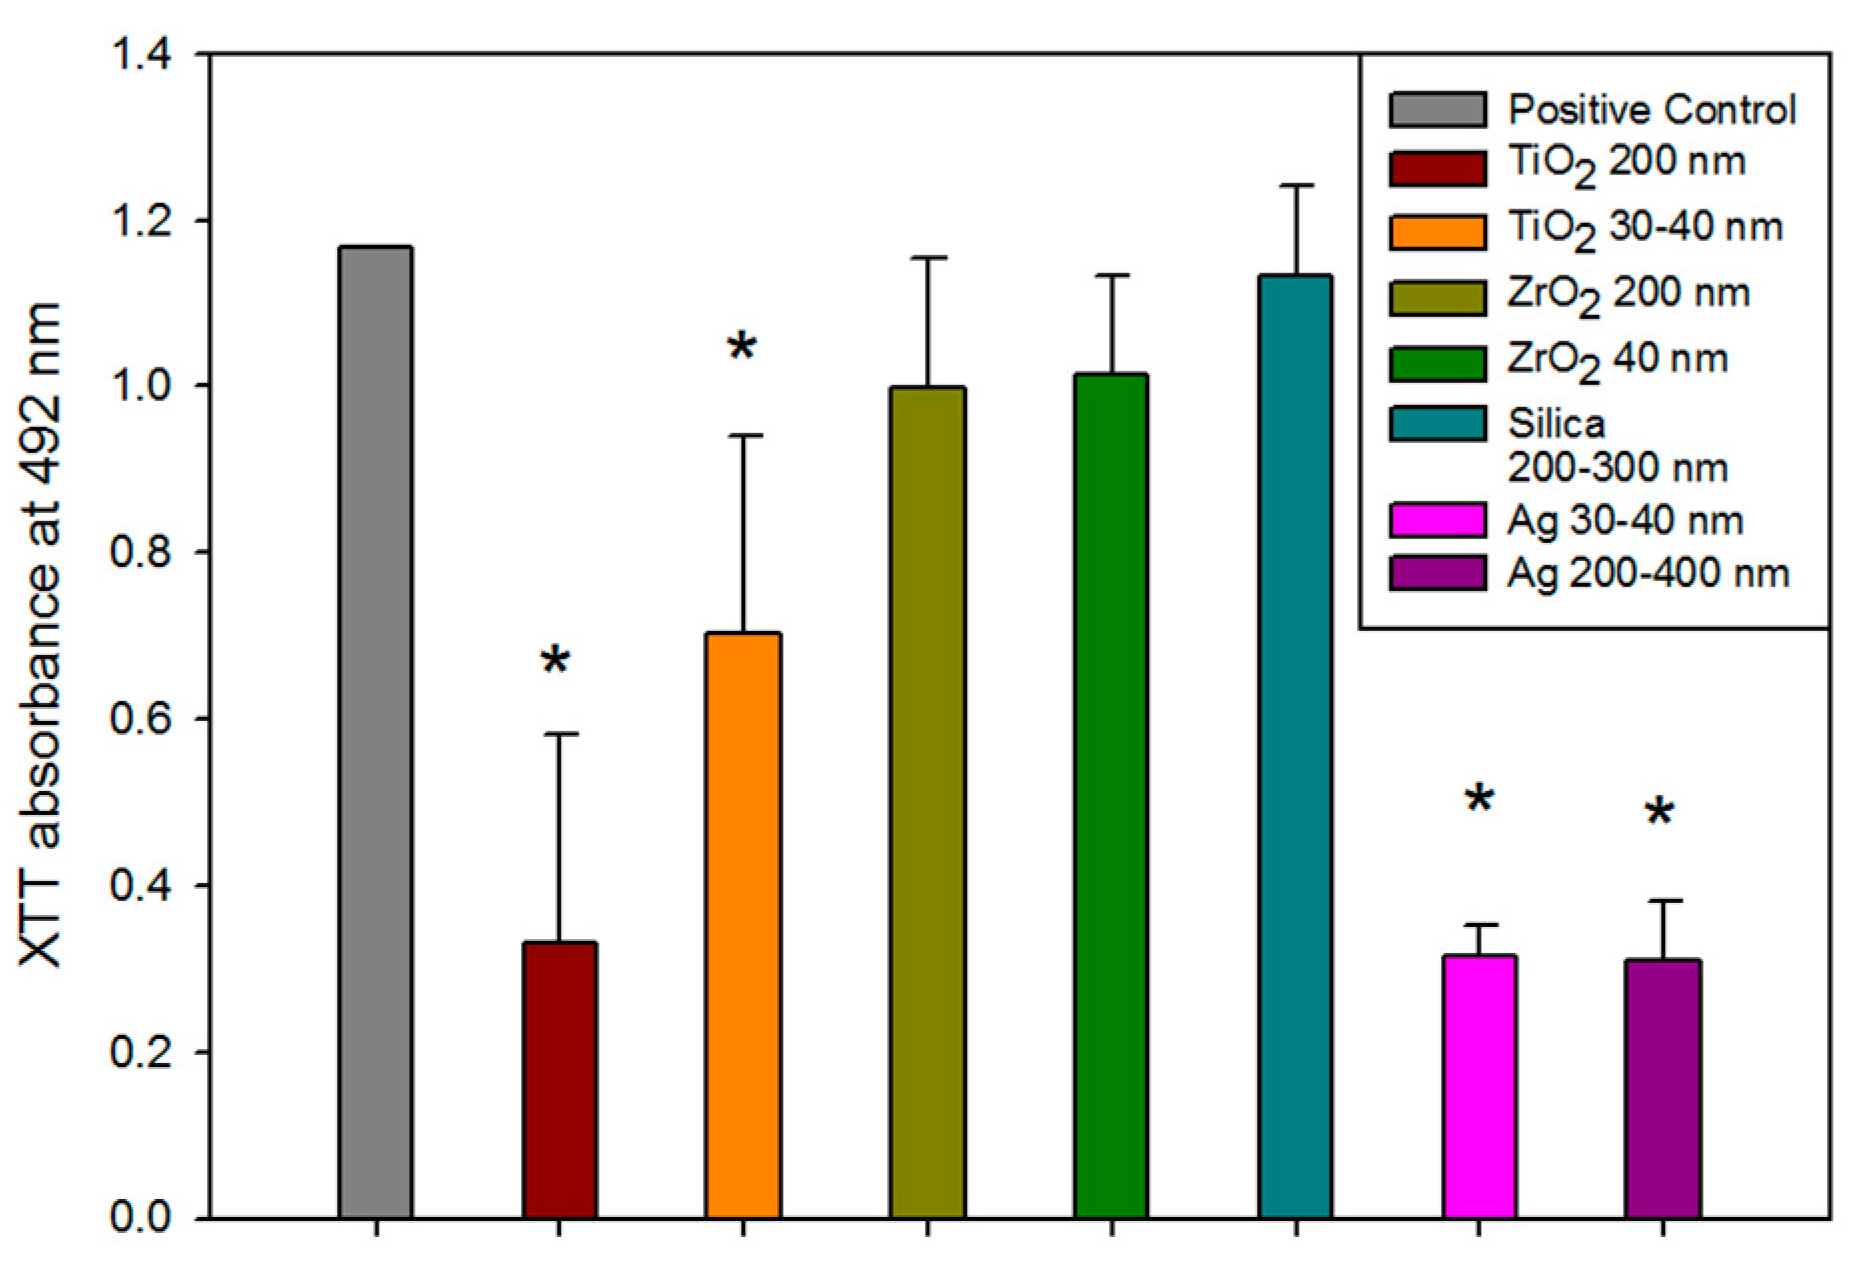
3.4.1. XTT Colorimetric Assay

The optical density of formazan crystal formation in solution was measured spectrophotometrically at 492 nm after 48 h of exposure to C. albicans. This was a measure of metabolic activity (Figure 6). C. albicans incubated with Ag- and TiO2-containing silicones showed significantly lower metabolic activity than wells containing only growth medium, which served as a biological positive control (p < 0.01). The ZrO2 and positive material control (silica) groups were not significantly different than the biological positive control group (p ≥ 0.05).

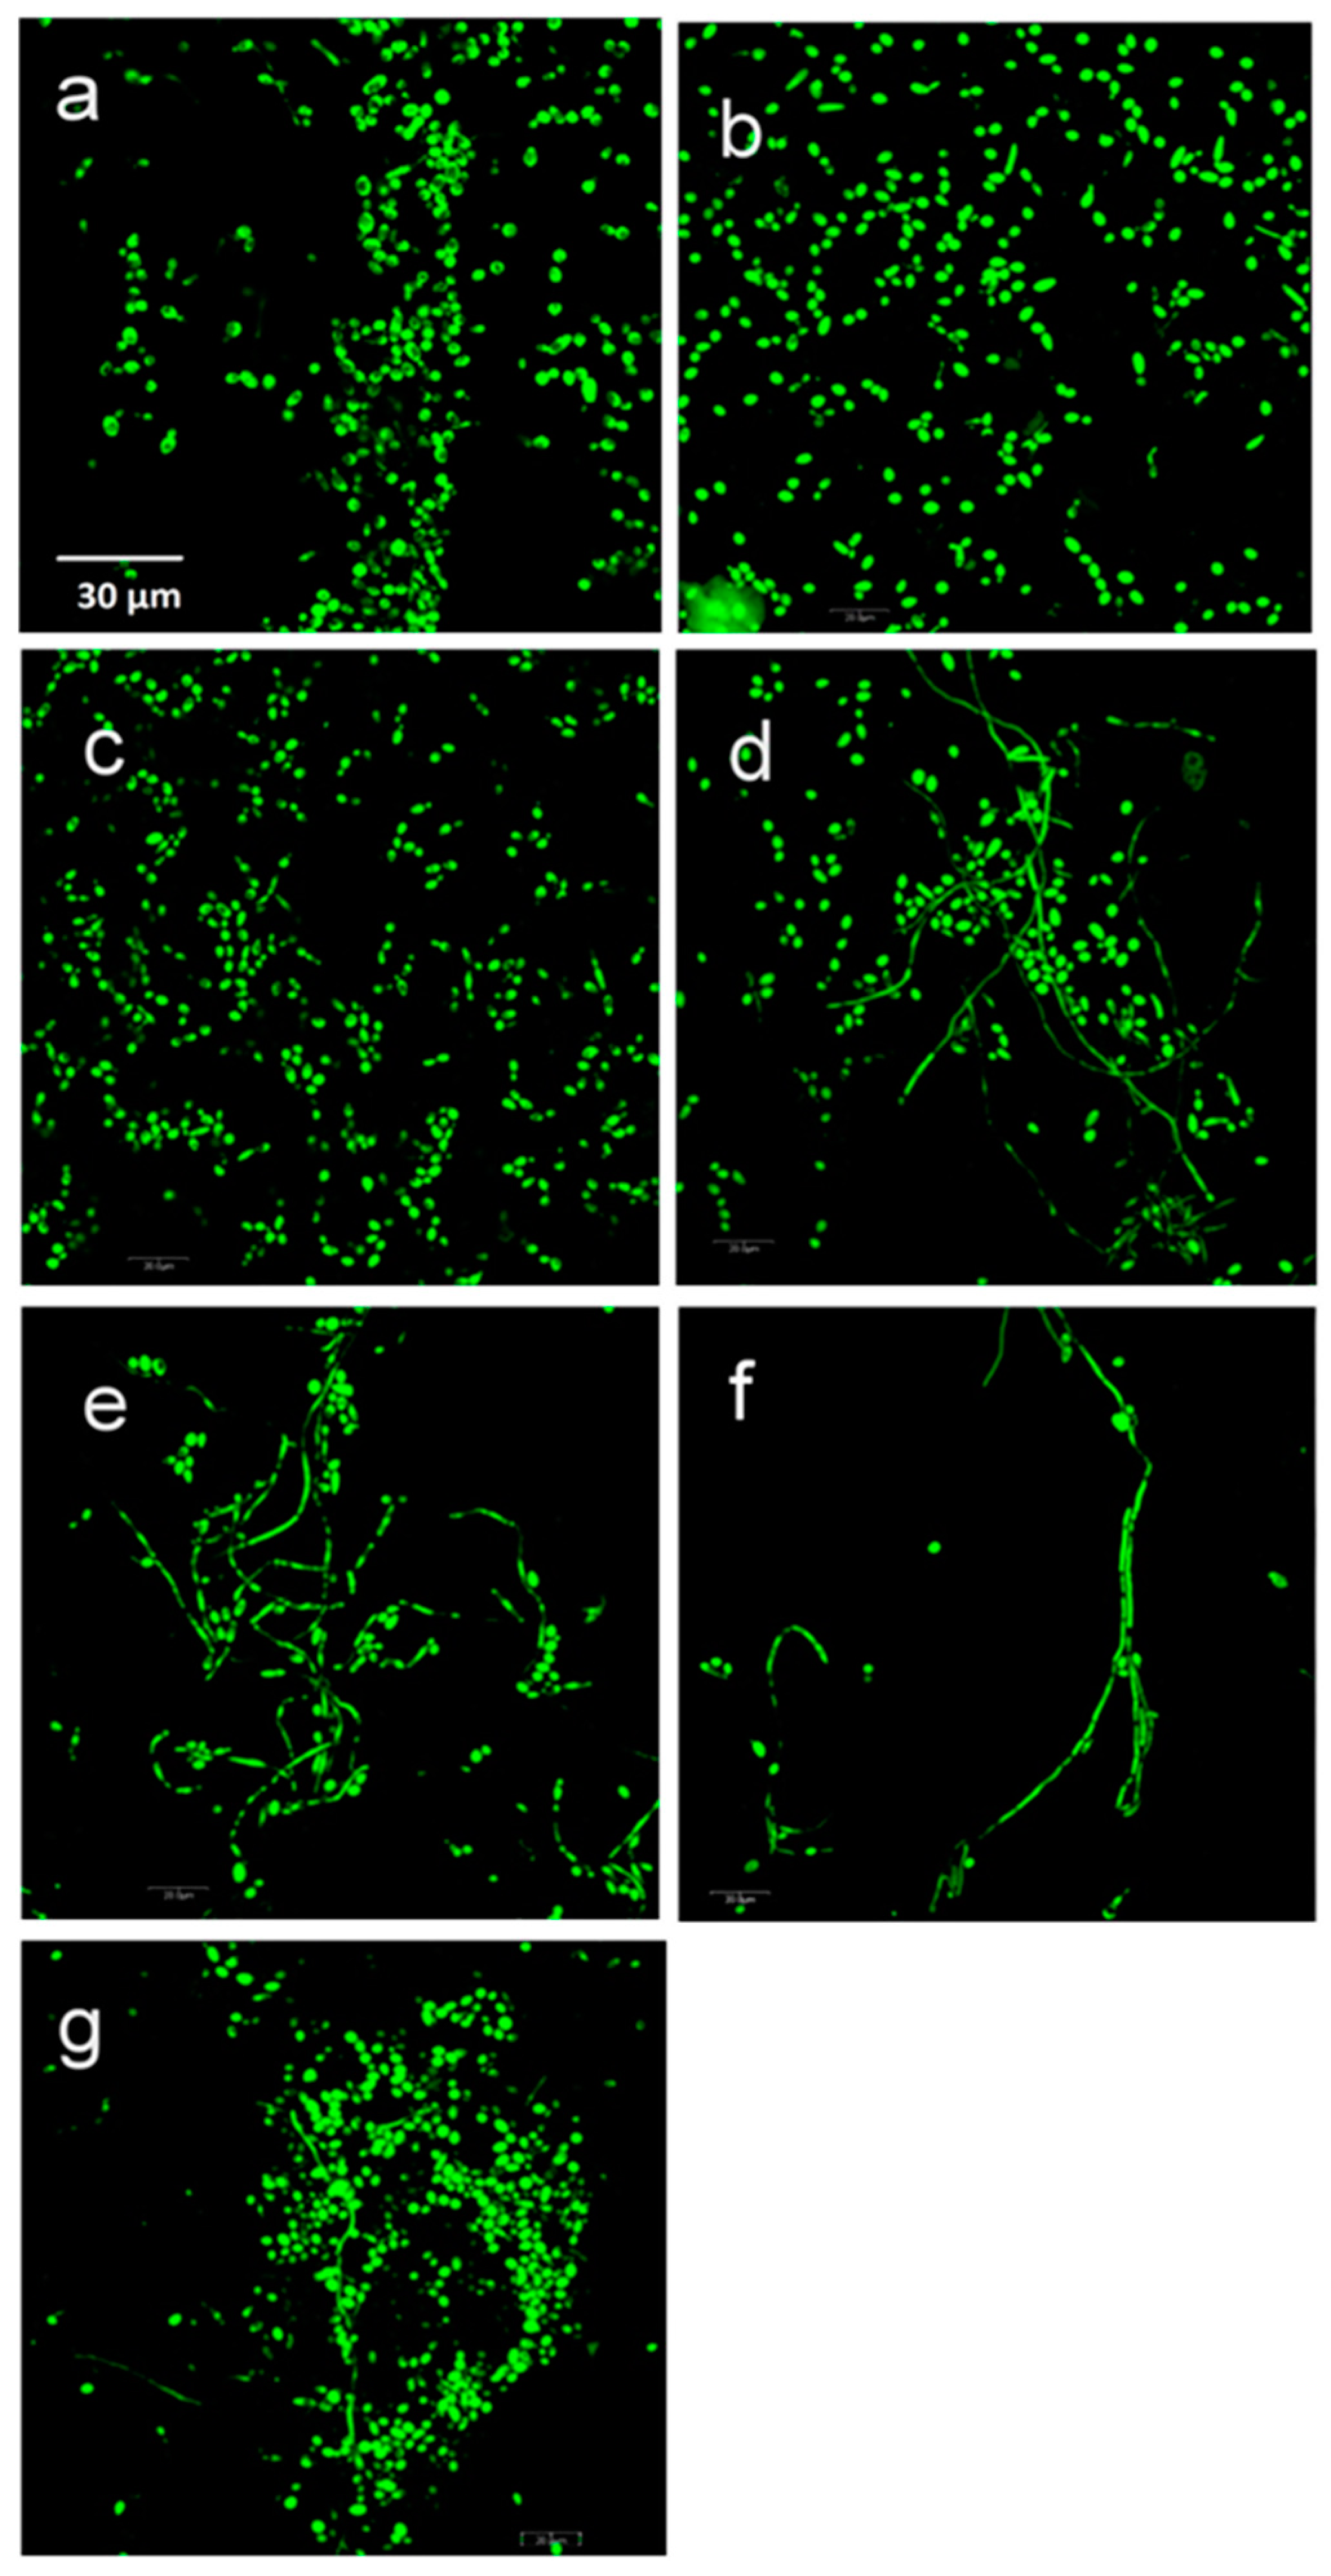
3.4.2. Confocal Laser Scanning Microscopy (CLSM)

Fun-1 staining showed that C. albicans biofilm formation is a complex phenomenon. The biofilm was multiple thick cell layers consisting mainly of yeast and hyphae. Adjacent to the silicon elastomer disc surface, yeast cells were densely embedded in an extracellular matrix. In both Ag groups and TiO2 200 nm groups, confocal laser microscopy images showed yeast cells scattered and attached to the elastomer discs with no hyphae formation detected. Pseudohyphae and more yeast cells with extracellular networks were detected in TiO2 30–40 nm group images, and more dense and thick mature hyphae process formations were noticed in ZrO2 and positive material control (silica) groups (Figure 7).

4. Discussion

This study tested the null hypotheses that adding TiO2 and ZrO2 nanoparticles to pigmented PDMS elastomers would not improve color stability and physical properties when subjected to controlled dosages of ultraviolet radiation. The results of this investigation demonstrated that TiO2 nanoparticles improved color stability, but ZrO2 did not. When added at 1% by weight, neither nanoparticle enhanced physical properties to the same level as those measured for the 13%-filled silica control elastomers. The second null hypothesis was that C. albicans growth on the surface of pigmented PDMS elastomers would not be reduced by the addition of TiO2 and ZrO2 nanoparticles. The results demonstrated that TiO2 nanoparticles permitted less biofilm growth than silica particles, but ZrO2 did not. Interpretations of the results are presented in the following subsections.

4.1. UV-Induced Damage

Ultraviolet radiation is a well-known contributor to prosthetic material degradation, and as facial prostheses are worn on highly sun-exposed areas of the body, strategies to protect against UV-induced deterioration of pigments, polymers, and fillers are critical to enhancing prosthesis longevity.
PDMS does not absorb radiation above 300 nm, but it degrades upon exposure to daylight, and UVB is considered a primary contributor to its chemical instability. Except for the Si-O bond, which has a dissociation energy of 443–530 kJ/mol and is considered relatively strong, the remaining bonds are weak, with dissociation energies reported as 271–360 for Si-C, 280–340 for Si-Si, and 325–376 kJ/mol for Si-H [38]. UV photons, with energies greater than molecular bond strengths, degrade the polymer through radiolysis [39]. The absorption of UV photons degrades the molecule and produces smaller polymer chains with volatile degradation products. Due to the presence of free radicals, competition occurs among initiation, propagation, and termination [40]. This polymerization disturbance produces changes within the molecular weight distribution, which negatively affects the material’s physical and chemical properties [22].
The compositions of functional pigments are proprietary and, therefore, not disclosed by the manufacturer. However, a combination of dyes or metal oxides/sulfides is likely dispersed into a functional silicone fluid capable of bonding with the polydimethyl siloxane polymer. Degradative changes imposed by UV exposure are likely to occur most rapidly within the organic dyes, whereas inorganic metal oxides are expected to degrade slowly. Metal oxides are insoluble and express low reactivity in oxidizing and photoreactive environments and therefore are expected to undergo degradation slowly, if at all. However, metal sulfides, particularly Ni, Cr, Co, Cd, and Fe, are prone to oxidation, as they permit high diffusion rates due to a large concentration of lattice defects [38].

4.2. Potential Benefits of ZrO2 and TiO2 Nanoparticle Additions

Nanoparticles are those with approximate sizes of 1 to 100 nm, with shapes that can be spherical, cubic, or needle-like [41]. As particle size is reduced from micrometer to nanometer, the ratio of the number of surface atoms to the number of bulk atoms becomes significantly larger, producing enormous surface areas [42,43]. Due to this increased ratio, the higher number of unsaturated valence atoms in nanoparticles leads to higher chemical reactivities. The increased surface area is expected to better stabilize the polymer against various weathering components, including UV radiation [38].
Metal oxide nanoparticles impart mechanical properties desired from metal, and the decreased size imparts reduced opacity and improved overall optical properties. When incorporated into a polymer system, metal oxide nanoparticles show combined desired properties such as strength, hardness, elasticity, electrical conductivity, and improved optical performance [44,45].
A number of nano-sized metal oxides have been studied as polymer additives for gaining improvements in physical, mechanical, and optical properties. Titanium dioxide is one, and it has found applications as a pigment, adsorbent, and catalyst (particularly photocatalyst) [46]. Titanium dioxide is polymorphic and exists in anatase, rutile, and brookite. The anatase crystalline phase exhibits the highest photocatalytic activity due to its large band gap energy of 3.2 eV, and it is used in solar energy conversion because of its high photoactivity [47]. Rutile-TiO2 is called the “white pigment”, and it protects from ultraviolet radiation through its semiconductive properties that produce UV absorption. Its band gap (3.0 eV) between its low-energy valence and high-energy conduction bands allows it to absorb photons from high-energy light (UV), excite electrons across the gap, and produce pairs of electrons and holes. Also, because rutile is denser than anatase, its band gap is narrower and has a higher probability of electron-hole recombination than for catalyzing activity [48]. This explains the UV-blocking capabilities of rutile TiO2 particles. As a result, additions of nano-TiO2 to maxillofacial silicones enhance color retention in the face of various weathering environments [7,10,49,50]. In addition to optical and UV-blocking capabilities, TiO2 nanoparticle additions have been shown to improve mechanical properties. Adding one weight percent to resin-based composite restorative materials increases microhardness by approximately 60% and flexural strength by 16% compared to unfilled composite [51]. Various addition amounts to medical silicones have delivered increases in tensile strength, tear strength, and Durometer hardness [6,9].
Zirconia is a metal oxide ceramic known for superior mechanical properties, excellent optical properties, and biocompatibility. Zirconia use has remarkably increased in dental restorative and prosthetic treatments [52]. It is not soluble in water, is non-cytotoxic [53], does not enhance bacterial adhesion [54], is opaque, and possesses low corrosion potential [52]. Zirconia is polymorphic and allotropic, existing in three crystalline configurations at different temperatures: cubic, tetragonal, and monoclinic. During cooling, the tetragonal phase transforms into a stable monoclinic phase. This is accompanied by a 4–5% crystal volume increase, which leads to internal compressive stress and potential cracking. It is often combined with other cubic oxides, notably MgO, CaO, Y2O3, and CeO2, to prevent the transformation and stabilize zirconia [55]. Zirconia, when used as a core material for single crowns and fixed partial dentures, enjoys a success rate of 93% over three years [56]. For maxillofacial applications, 1.5% weight additions of nano-ZrO2 to an RTV silicone have shown increases in tear strength by 4.8 MPa, tensile strength by 1.3 MPa, and hardness by 1 Shore A unit [12].

4.3. Color Change

4.3.1. Color Changes at Baseline

TiO2 nanoparticle additions caused noticeable visual color change at baseline, compared to silica controls. TiO2 produced samples that were lighter in color compared to silica controls (L* values ranging from 88 to 90 for TiO2 and 79 for control). On the other hand, ZrO2 groups produced samples with similar L* values compared to silica-filled control samples (both near L* = 79). Color results from the interaction of the pigment color, nanoparticle size, and the relative difference between the refractive indices of the nanoparticle and the polymer. The refractive index of TiO2 is more than 2.6, ZrO2 is approximately 2.1, Silica is about 1.5, and PDMS is around 1.4. Light is bent more, travels shorter paths, and penetrates less deeply in materials with higher refractive indices. Therefore, samples containing TiO2 are more efficient at preventing light transmission than the other groups, leaving smaller amounts of light to be absorbed by the polymer and the pigment. The scattering effect of TiO2 nanoparticles gives the samples a whiter appearance, thereby explaining higher L* values. Small, non-significant changes were measured in a* (red-green), which was expected since the pigment was yellow. For b* values, silica-filled control samples produced the highest yellow color (b* = 93.18), which was statistically grouped with ZrO2 samples (b* values were 88.76 for ZrO2 200 nm and 91.48 for ZrO2 40 nm samples). The whiteness contributed by TiO2 presumably masked the yellow color and yielded lower b* values (55.60 for TiO2 200 nm and 60.06 for TiO2 30–40 nm).
Even though nano-sized particles were more numerous and produced a higher total surface area within the polymer than submicron particles, baseline color was not significantly different between particle sizes for either ZrO2 or TiO2. This may partly be explained by the expected higher translucency of nano-sized particles, which may compensate for their increased particle numbers. The relatively low 1% loading level also merits consideration, as it may produce particle numbers for both particle sizes below a minimum threshold needed to detect color differences with a reflectance spectrophotometer.

4.3.2. Color Changes in Control Environment

In the control environment (darkness, 25 °C, and 30% relative humidity), more overall color change was noticed for ZrO2 groups and the control samples after 3000 h of storage, as compared to TiO2-containing materials (p < 0.05). This may be attributed to pigment breakdown, detachment of additive particles, degradation of the lower molecular weight silicon fluid used to disperse the platinum catalyst, presence of impurities, or continued matrix crosslinking. Additional crosslinking occurs when unreacted chains continue to polymerize with time, thereby changing the refractive index of the polymer. Elastomers containing both TiO2 sizes underwent a mean color change below the visual threshold of acceptable color change ( E* < 3). The lower overall color change noticed with TiO2 may be due to its higher specific heat, allowing more heat transmission to the polymer, inducing more polymerization during the curing process, and reducing post-curing polymerization. Post-curing polymerization may have produced the color changes noted for silica and zirconia. However, the true underlying mechanism is unknown.

4.3.3. Color Changes Caused by Ultraviolet Radiation

Early studies demonstrated that ultraviolet radiation negatively impacted optical and mechanical properties in maxillofacial prosthetic materials [25,57]. A common explanation for these changes is that oxygen, when present, induces photo-oxidative degradation of the polymer network and UV-susceptible pigments. This study’s results from UVB exposure showed that TiO2 200 nm samples demonstrated the least color change over time, followed by TiO2 30–40 nm samples. This suggests that 200 nm TiO2 nanoparticles functioned as more efficient UVB blockers, reducing ultraviolet transmission and scattering to surrounding pigment and polymer molecules. The findings of Yang et al. support this [48]. In their study of thin polymer films, TiO2 strongly absorbed UV light in the 290–350 nm band, with submicron-sized TiO2 demonstrating stronger absorption than nano-TiO2. Conversely, UV’s lower reflectance (i.e., scattering) was measured for submicron TiO2-containing films. Although the Eab* value for 200 nm TiO2 was 5.6 units after 3000 h of UVB exposure and above the acceptable threshold of color change ( E = 3.0), this degree of color change may not be unacceptable to certain observers.
Materials containing ZrO2 and SiO2 underwent substantial color change throughout the 3000 h. This is partly explained by their indices of refraction being closer to PDMS than TiO2. As a result, more UV radiation was delivered to the pigment and polymer via transmission and/or scattering. This, in turn, produced more of the Eab* color change. This phenomenon was particularly acute for SiO2, where its index of refraction was close to that for PDMS (1.5 versus 1.4, respectively), and its Eab* at 3000 h was 3.5 times higher than 200 nm TiO2 materials.
Based on our results, the best improvements in color stability were obtained by adding 1% weight TiO2 nanoparticles to silicon elastomers exposed to UVB radiation. This is consistent with the findings reported by Han et al. for 1% nano-TiO2 incorporated into Silicone A-2186 with yellow pigments and exposure to artificial solar radiation (450 kJ/m2) [7]. In that study, Eab*color change was lower for 1% nano-TiO2 when compared to materials containing 1% nano-ZnO or nano-CeO2.

4.4. Shore A Hardness

Baseline Shore A hardness showed that the silica-containing controls were significantly higher than all other groups (Table 3). This was expected, as thirteen times more filler weight was incorporated into PDMS than were materials containing TiO2 or ZrO2 additives. Of the test groups, 200 nm ZrO2 elastomers were significantly harder than those with 40 nm ZrO2, 30–40 nm TiO2, or 200 nm TiO2 materials, which were statistically grouped together. No significant differences were observed between the two TiO2 particle sizes, but the two particle sizes were significantly different for ZrO2, which lacks explanation.
After 3000 h, there were few differences in Shore A hardness observed among the materials, as the change in hardness was close to zero for ZrO2 and TiO2 stored in the control and UVB environments (Table 3). Only control elastomers demonstrated appreciable hardening from UVB exposure (p < 0.05, Table 3). However, the maximum increase was 1.5 Shore A units, which may be clinically insignificant, as it may not be detected when handling a prosthesis.

4.5. Tensile Properties

Compared to the TiO2- and ZrO2-added samples, ultimate tensile strength (UTS), maximum strain at break, and modulus of elasticity were significantly greater for the silica-filled controls at all time points for both the control and UVB environments (roughly 2–3 times greater UTS, 2 times maximum strain, and 2–3 times greater modulus, see Figure 3, Figure 4 and Figure 5). This was attributed to the higher particle loading for silica-containing controls (13%), high particle surface area (225 m2/g), and silica’s ability to form hydrogen bonds with the Si and CH2 groups in the siloxane polymer. This bonding allows particle adsorption to the polymer, hence improving reinforcement under load [58]. UTS and maximum strain at break were significantly decreased by time passage (darkness control) and UVB radiation (p < 0.05), but the differences between the control and UVB groups at 3000 h were non-significant. This implies that natural aging, possibly through free radical generation during post-curing, caused the polymer network to undergo crosslinking and chain scission. Also, any breakdown of pigment and decoupling between silica and polymer would reduce reinforcement and consequently lower tensile strength.
It was considered possible that for nanoparticles, with their five to seven times smaller particle size and surface area/weight ratio being 1–2 orders of magnitude higher, the lower loading level may produce properties comparable to materials loaded with larger particles and in larger quantities. Results from this research indicate that 1% nanoparticle loading did not produce tensile properties comparable to 13% submicron particle loadings. Although a different elastomer system was studied, findings by Han et al. for nano-oxide additions to a commercial elastomer showed that the incorporation of 0.5%, 1%, and 1.5% TiO2, ZnO, and CeO2 did not improve tensile strength, tear strength, and percentage elongation, whereas 2.0–2.5% loading fractions significantly increased those properties [7]. This suggests a threshold amount of nano-oxide addition may be required to gain substantial improvement in mechanical properties.

4.6. Antifungal Activity

Candida albicans are opportunistic fungi of the microbiome that take advantage of a dysfunctional host’s immune system to produce disease. Its ability to change from yeast cells to hyphal cells is known to be one of its virulent factors. C. albicans biofilm development is characterized by three distinct phases. The first is the adherence of C. albicans to its substrate (≈0 to 11 h). In the intermediate phase, cell proliferation and microcolony formation deposit an extracellular matrix (≈12 to 14 h). Finally, forming a dense network of filamentous forms (pseudohyphae and hyphae) encased in an exopolymeric matrix is considered the maturation phase (≈24 to 72 h) [59,60]. For this reason, C. albicans were incubated for 48 h before conducting the XTT colorimetric assay and confocal laser scanning microscopy experiments to allow biofilm formation to reach its maturation phase.
Results from the XTT colorimetric assay showed that TiO2 groups demonstrated similar antifungal activity to Ag (negative material control) with significantly less C. albicans growth compared to the positive control. The results herein agree with a recent study that showed the TiO2–NPs had antifungal properties against several pathogenic Candida species, including C. albicans, at different concentrations [8]. Research reported by Cevik et al. suggests additional protection may be secured by combining nano-TiO2-containing silicone with disinfectants [61]. In their study, a combination of 10% nano-TiO2-filled silicone with 4% chlorhexidine gluconate completely eliminated biofilms containing S. aureus, E. coli, and C. albicans from silicone surfaces.
The precise mechanism by which Ag and TiO2 may control the growth of C. albicans is not fully understood. Early studies have shown that Ag ions block microbial DNA replication, inactivate vital enzymes necessary for ATP production and oxidation of glucose, and damage microbial cell walls, resulting in cell death [62]. Similar effects have been suggested for TiO2, as it oxidates the microorganism’s cell membrane and alters Coenzyme A-dependent enzyme activities, thereby producing a biocidal effect. The proposed mechanism forms reactive oxygen species from Ti-O surface bonds produced by mismatches between bulk and surface electronic properties [63]. Recently, TiO2-NPs’ ability to generate reactive oxygen species has been suggested as a way to exert anticancer activity [64].
No significant differences were noticed between ZrO2 and silica groups compared to the biological positive control. Consequently, C. albicans grew and formed more hyphae on ZrO2- and silica-containing discs, as seen in confocal images. The poor antifungal activity of ZrO2 and silica could be due to the lack of ability to produce free reactive radicals that can attack Candida cell walls and essential enzymes. However, it is also possible that a threshold amount may be required to impart antifungal activity, as it was reported that 1% and 3% weight additions of nano-ZrO2 to a 3D-printed polymer imparted non-significant differences in C. albicans activity over a 0% control, whereas 5% addition significantly reduced C. albicans activity [65]. Interestingly, Jangra et al., in their study of ZrO2 nanoparticles and Zr(IV) complexes with different amino acids as ligands, found that anti-bacterial and anti-fungal activities were crystal plane dependent. The authors speculated that ZrO2 nanoparticles with similar surface areas but different shapes will exhibit different antimicrobial activities [66].

4.7. Study Limitations

Results from this study are limited to the polymer system, additives, equipment, test sample preparation conditions, and testing protocols.

5. Conclusions

Within the limits of this in vitro study, it can be concluded that 1% additions of nano- and submicron-sized ZrO2 and TiO2 particles to PDMS provided better resistance to UVB-induced color change after 3000 h as compared to control materials, with the lowest color change observed for 200 nm TiO2 particles. Materials containing ZrO2 and TiO2 additives did not show differences in tensile properties from one another after 3000 h of storage in control or UVB environments. In contrast, silica-filled control materials were significantly lower in tensile strength and breaking strain in both environments. When exposed to Candida albicans, TiO2-containing silicones and negative controls significantly reduced fungal activity compared to positive biological controls, but ZrO2- and silica-containing materials did not. Compared to 40 nm particles, materials with 200 nm particles exhibited superior color stability and antifungal activity for TiO2 and Shore A hardness for ZrO2. However, few differences were noted between the two particle sizes for the remaining properties. The incorporation of 1% submicron- and nano-sized TiO2 has the potential for improving color stability and antifungal activity in silicones designated for maxillofacial prostheses and may find further applications as resilient denture reline materials.

Author Contributions

Conceptualization, M.W.B. and G.P.; methodology, M.W.B., F.A. and G.P.; validation, M.A., M.W.B., F.A., B.S., T.M.P. and Y.Z.; formal analysis, M.W.B.; investigation, M.A., B.S. and Y.Z.; resources, M.W.B. and B.S.; data curation, M.A., M.W.B. and B.S.; writing—original draft preparation, M.A. and M.W.B.; writing—review and editing, all coauthors; visualization, M.A., M.W.B. and Y.Z.; supervision, M.W.B., F.A., B.S. and D.F.; project administration, M.W.B., F.A., T.M.P., Y.Z. and D.F.; funding acquisition, M.W.B. and F.A. All authors have read and agreed to the published version of the manuscript.

Funding

This research received no external funding.

Institutional Review Board Statement

Not applicable.

Informed Consent Statement

Not applicable.

Data Availability Statement

The data presented in this study are available on request from the corresponding author.

Acknowledgments

This work was supported with resources and the use of facilities at the Omaha, Nebraska, VA Medical Center.

Conflicts of Interest

The authors declare no conflict of interest. The contents of this manuscript do not reflect the views of the VA or the United States government.

References

  1. Lemon, J.C.; Kiat-amnuay, S.; Gettleman, L.; Martin, J.W.; Chambers, M.S. Facial prosthetic rehabilitation: Preprosthetic surgical techniques and biomaterials. Curr. Opin. Otolaryngol. Head. Neck Surg. 2005, 13, 255–262. [Google Scholar]
  2. Udagama, A. Urethane-lined silicone facial prostheses. J. Prosthet. Dent. 1987, 58, 351–354. [Google Scholar]
  3. Nikawa, H.; Jin, C.; Makihira, S.; Egusa, H.; Hamada, T.; Kumagai, H. Biofilm formation of Candida albicans on the surfaces of deteriorated soft denture lining materials caused by denture cleansers in vitro. J. Oral. Rehabil. 2003, 30, 243–250. [Google Scholar] [CrossRef]
  4. Nowakowska-Toporowska, A.; Malecka, K.; Raszewski, Z.; Wieckiewicz, W. Changes in hardness of addition-polymerizing silicone-resilient denture liners after storage in artificial saliva. J. Prosthet. Dent. 2019, 121, 317–321. [Google Scholar] [CrossRef]
  5. Wyszynska, M.; Bialozyt-Bujak, E.; Chladek, G.; Czelakowska, A.; Roj, R.; Bialozyt, A.; Gruca, O.; Nitsze-Wierzba, M.; Kasperski, J.; Skucha-Nowak, M. Analysis of Changes in the Tensile Bond Strenght of Soft Relining Material with Acrylic Denture Material. Materials 2021, 14, 6868. [Google Scholar] [CrossRef]
  6. Han, Y.; Kiat-amnuay, S.; Powers, J.M.; Zhao, Y. Effect of nano-oxide concentration on the mechanical properties of a maxillofacial silicone elastomer. J. Prosthet. Dent. 2008, 100, 465–473. [Google Scholar] [CrossRef]
  7. Han, Y.; Zhao, Y.; Xie, C.; Powers, J.M.; Kiat-amnuay, S. Color stability of pigmented maxillofacial silicone elastomer: Effects of nano-oxides as opacifiers. J. Dent. 2010, 38 (Suppl. S2), e100–e105. [Google Scholar] [CrossRef]
  8. Ahmadpour Kermani, S.; Salari, S.; Ghasemi Nejad Almani, P. Comparison of antifungal and cytotoxicity activities of titanium dioxide and zinc oxide nanoparticles with amphotericin B against different Candida species: In vitro evaluation. J. Clin. Lab. Anal. 2021, 35, e23577. [Google Scholar] [CrossRef]
  9. Wang, L.; Liu, Q.; Jing, D.; Zhou, S.; Shao, L. Biomechanical properties of nano-TiO2 addition to a medical silicone elastomer: The effect of artificial ageing. J. Dent. 2014, 42, 475–483. [Google Scholar] [PubMed]
  10. Zarrati, S.; Safi, M.; Mohammad Rezaei, S.M.; Shadan, L. Effect of nano-oxides on the color stability of maxillofacial silicone elastomers. J. Prosthet. Dent. 2022, 127, 362–367. [Google Scholar] [CrossRef] [PubMed]
  11. Liu, G.; Li, Y.; Yan, F.; Zhao, Z.; Zhou, L.; Xue, Q. Effect of nanoscale SiO2 and TiO2 as the fillers on the mechanical properties and aging behavior of linear low-density polyethylene/low-density polyethylene blends. J. Polym. Environ. 2005, 13, 339–348. [Google Scholar] [CrossRef]
  12. Hussein, I.E.; Hasan, R.H. Effects of nano zirconium oxide addition on the strength, hardness, and microstructure of maxillofacial silicone material. Int. Med. J. 2021, 28, 54–57. [Google Scholar]
  13. Dhineshbabu, N.R.; Manivasakan, P.; Yuvakkumar, R.; Prabu, P.; Rajendran, V. Enhanced functional properties of ZrO2/SiO2 hybrid nanosol coated cotton fabrics. J. Nanosci. Nanotechnol. 2013, 13, 4017–4024. [Google Scholar] [CrossRef]
  14. Yu, R.; Koran, A., 3rd; Craig, R.G. Physical properties of maxillofacial elastomers under conditions of accelerated aging. J. Dent. Res. 1980, 59, 1041–1047. [Google Scholar] [CrossRef]
  15. Haug, S.P.; Andres, C.J.; Munoz, C.A.; Okamura, M. Effects of environmental factors on maxillofacial elastomers: Part III—Physical properties. J. Prosthet. Dent. 1992, 68, 644–651. [Google Scholar] [CrossRef]
  16. Haug, S.P.; Andres, C.J.; Munoz, C.A.; Bernal, G. Effects of environmental factors on maxillofacial elastomers: Part IV—Optical properties. J. Prosthet. Dent. 1992, 68, 820–823. [Google Scholar] [CrossRef]
  17. Polyzois, G.L. Color stability of facial silicone prosthetic polymers after outdoor weathering. J. Prosthet. Dent. 1999, 82, 447–450. [Google Scholar] [CrossRef]
  18. Kiat-Amnuay, S.; Lemon, J.C.; Powers, J.M. Effect of opacifiers on color stability of pigmented maxillofacial silicone A-2186 subjected to artificial aging. J. Prosthodont. Off. J. Am. Coll. Prosthodont. 2002, 11, 109–116. [Google Scholar]
  19. Mohammad, S.; Wee, A.; Rumsey, D.; Schricker, S. Maxillofacial Materials Reinforced with Various Concentrations of Polyhedral Silsesquioxanes. J. Dent. Biomech. 2010, 2010, 701846. [Google Scholar] [CrossRef]
  20. Cevik, P.; Eraslan, O. Effects of the Addition of Titanium Dioxide and Silaned Silica Nanoparticles on the Mechanical Properties of Maxillofacial Silicones. J. Prosthodont. Off. J. Am. Coll. Prosthodont. 2017, 26, 611–615. [Google Scholar] [CrossRef]
  21. Akay, C.; Cevik, P.; Karakis, D.; Sevim, H. In Vitro Cytotoxicity of Maxillofacial Silicone Elastomers: Effect of Nano-particles. J. Prosthodont. Off. J. Am. Coll. Prosthodont. 2018, 27, 584–587. [Google Scholar] [CrossRef]
  22. Eleni, P.N.; Krokida, M.; Polyzois, G.; Gettleman, L.; Bisharat, G.I. Effects of outdoor weathering on facial prosthetic elastomers. Odontology 2011, 99, 68–76. [Google Scholar] [CrossRef] [PubMed]
  23. Gary, J.J.; Smith, C.T. Pigments and their application in maxillofacial elastomers: A literature review. J. Prosthet. Dent. 1998, 80, 204–208. [Google Scholar] [CrossRef] [PubMed]
  24. Kiat-amnuay, S.; Beerbower, M.; Powers, J.M.; Paravina, R.D. Influence of pigments and opacifiers on color stability of silicone maxillofacial elastomer. J. Dent. 2009, 37 (Suppl. S1), e45–e50. [Google Scholar] [CrossRef] [PubMed]
  25. Beatty, M.W.; Mahanna, G.K.; Dick, K.; Jia, W. Color changes in dry-pigmented maxillofacial elastomer resulting from ultraviolet light exposure. J. Prosthet. Dent. 1995, 74, 493–498. [Google Scholar] [CrossRef]
  26. ASTM. D412-16 Standard Test Methods for Vulcanized Rubber and Thermoplastic Elastomers-Tension; ASTM: West Conshohocken, PA, USA, 2016. [Google Scholar] [CrossRef]
  27. Willett, E.S.; Beatty, M.W. Outdoor weathering of facial prosthetic elastomers differing in Durometer hardness. J. Prosthet. Dent. 2015, 113, 228–235. [Google Scholar] [CrossRef]
  28. Wuttke, S.; El Naggar, S.; Bluszcz, T.; Schrems, O. Ship-borne measurements of erythemal UV irradiance and ozone content in various climate zones. Photochem. Photobiol. Sci. 2007, 6, 1081–1088. [Google Scholar] [CrossRef]
  29. ASTM. D2244-21 Standard Practice for Calculation of Color Tolerances and Color Differences from Instrumentally Measured Color Coordinates; ASTM: West Conshohocken, PA, USA, 2021. [Google Scholar] [CrossRef]
  30. ASTM. D2240-15 Standard Test Method for Rubber Property—Durometer Hardness; ASTM: West Conshohocken, PA, USA, 2015. [Google Scholar] [CrossRef]
  31. Panacek, A.; Kolar, M.; Vecerova, R.; Prucek, R.; Soukupova, J.; Krystof, V.; Hamal, P.; Zboril, R.; Kvitek, L. Antifungal activity of silver nanoparticles against Candida spp. Biomaterials 2009, 30, 6333–6340. [Google Scholar] [CrossRef]
  32. Kuhn, D.M.; Chandra, J.; Mukherjee, P.K.; Ghannoum, M.A. Comparison of biofilms formed by Candida albicans and Candida parapsilosis on bioprosthetic surfaces. Infect. Immun. 2002, 70, 878–888. [Google Scholar] [CrossRef]
  33. Chandra, J.; Mukherjee, P.K.; Ghannoum, M.A. In vitro growth and analysis of Candida biofilms. Nat. Protoc. 2008, 3, 1909–1924. [Google Scholar] [CrossRef]
  34. Ramage, G.; Mowat, E.; Jones, B.; Williams, C.; Lopez-Ribot, J. Our current understanding of fungal biofilms. Crit. Rev. Microbiol. 2009, 35, 340–355. [Google Scholar] [CrossRef]
  35. Shapiro, S.S.; Wilk, M.B. An analysis of variance test for normality (complete samples). Biometrika 1965, 52, 591–611. [Google Scholar] [CrossRef]
  36. Sokal, R.R.; Rolf, F.J. Biometry: The Principles and Practice of Statistics in Biological Research, 2nd ed.; W.H. Freeman and Co.: San Francisco, CA, USA, 1981. [Google Scholar]
  37. Paravina, R.D.; Majkic, G.; Del Mar Perez, M.; Kiat-Amnuay, S. Color difference thresholds of maxillofacial skin replications. J. Prosthodont. Off. J. Am. Coll. Prosthodont. 2009, 18, 618–625. [Google Scholar] [CrossRef] [PubMed]
  38. Wypych, G. Handbook of Material Weathering, 4th ed.; Chemtech: Toronto, ON, Canada, 2008; p. 810. [Google Scholar]
  39. Cottin, H.; Gazeau, M.C.; Doussin, J.F.; Raulin, F. An experimental study of the photodegradation of polyoxymethylene at 122, 147 and 193 nm. J. Photochem. Photobiol. A Chem. 2000, 135, 53–64. [Google Scholar] [CrossRef]
  40. Rabek, J.F. Polymer Photodegradation: Mechanisms and Experimental Methods; Springer: Amsterdam, The Netherlands, 2012; p. 664. [Google Scholar]
  41. Cushing, B.L.; Kolesnichenko, V.L.; O’Connor, C.J. Recent advances in the liquid-phase syntheses of inorganic nanoparticles. Chem. Rev. 2004, 104, 3893–3946. [Google Scholar] [CrossRef] [PubMed]
  42. Rao, K.; Mahesh, K.; Kumar, S. A strategic approach for preparation of oxide nanomaterials. Bull. Mater. Sci. 2005, 28, 19–24. [Google Scholar] [CrossRef]
  43. Mohseni, G.; Negahdary, M.; Malekzadeh, R.; Manoochehri, J.; Hadaegh, A.; Sayad, A.; Akbari-dastjerdi, H.; Fazilati, M.; Rezaei-Zarchi, S. Direct electron transfer of cytochrome c on ZrO2 nanoparticles modified glassy carbon electrode. Int. J. Electrochem. Sci. 2012, 7, 7033–7044. [Google Scholar] [CrossRef]
  44. Abdelsayed, V.; Alsharaeh, E.; El-Shall, M.S. Catalyzed radical polymerization of styrene vapor on nanoparticle surfaces and the incorporation of metal and metal oxide nanoparticles within polystyrene polymers. J. Phys. Chem. B 2006, 110, 19100–19103. [Google Scholar] [CrossRef]
  45. Maiti, M.; Bhattacharya, M.; Bhowmick, A. Elastomer nanocomposites. Rubber Chem. Technol. 2008, 81, 384–469. [Google Scholar] [CrossRef]
  46. Khanna, P.K.; Singh, N.; Charan, S. Synthesis of nano-particles of anatase-TiO2 and preparation of its optically transparent film in PVA. Mater. Lett. 2007, 61, 4725–4730. [Google Scholar] [CrossRef]
  47. Xu, A.W.; Gao, Y.; Liu, H.Q. The preparation, characterization, and their photocatalytic activities of rare-earth-doped TiO2 nanoparticles. J. Catal. 2002, 207, 151–157. [Google Scholar] [CrossRef]
  48. Yang, H.; Zhu, S.; Pan, N. Studying the mechanisms of titanium dioxide as ultraviolet-blocking additive for films and fabrics by an improved scheme. J. Appl. Polym. Sci. 2004, 92, 3201–3210. [Google Scholar] [CrossRef]
  49. Kiat-Amnuay, S.; Mekayarajjananonth, T.; Powers, J.M.; Chambers, M.S.; Lemon, J.C. Interactions of pigments and opacifiers on color stability of MDX4-4210/type A maxillofacial elastomers subjected to artificial aging. J. Prosthet. Dent. 2006, 95, 249–257. [Google Scholar] [CrossRef] [PubMed]
  50. Akash, R.N.; Guttal, S.S. Effect of Incorporation of Nano-Oxides on Color Stability of Maxillofacial Silicone Elastomer Subjected to Outdoor Weathering. J. Prosthodont. Off. J. Am. Coll. Prosthodont. 2015, 24, 569–575. [Google Scholar] [CrossRef] [PubMed]
  51. Xia, Y.; Zhang, F.; Xie, H.; Gu, N. Nanoparticle-reinforced resin-based dental composites. J. Dent. 2008, 36, 450–455. [Google Scholar] [CrossRef]
  52. Denry, I.; Kelly, J.R. State of the art of zirconia for dental applications. Dent. Mater. Off. Publ. Acad. Dent. Mater. 2008, 24, 299–307. [Google Scholar] [CrossRef]
  53. Dion, I.; Bordenave, L.; Lefebvre, F.; Bareille, R.; Baquey, C.; Monties, J.R.; Havlik, P. Physico-chemistry and cytotoxicity of ceramics: Part II, cytotoxicity of ceramics. J. Mater. Sci. Mater. Med. 1994, 5, 18–24. [Google Scholar] [CrossRef]
  54. Rimondini, L.; Cerroni, L.; Carrassi, A.; Torricelli, P. Bacterial colonization of zirconia ceramic surfaces: An in vitro and in vivo study. Int. J. Oral. Maxillofac. Implant. 2002, 17, 793–798. [Google Scholar]
  55. Zarone, F.; Russo, S.; Sorrentino, R. From porcelain-fused-to-metal to zirconia: Clinical and experimental considerations. Dent. Mater. Off. Publ. Acad. Dent. Mater. 2011, 27, 83–96. [Google Scholar] [CrossRef]
  56. Ortorp, A.; Kihl, M.L.; Carlsson, G.E. A 3-year retrospective and clinical follow-up study of zirconia single crowns performed in a private practice. J. Dent. 2009, 37, 731–736. [Google Scholar] [CrossRef]
  57. Beatty, M.W.; Mahanna, G.K.; Jia, W. Ultraviolet radiation-induced color shifts occurring in oil-pigmented maxillofacial elastomers. J. Prosthet. Dent. 1999, 82, 441–446. [Google Scholar] [CrossRef] [PubMed]
  58. Liu, J.; Wu, S.; Zou, M.; Zheng, X.; Cai, Z. Surface modification of silica and its compounding with polydimethylsiloxane matrix: Interaction of modified silica filler with PDMS. Iran. Polym. J. 2012, 21, 583–589. [Google Scholar] [CrossRef]
  59. Chandra, J.; Kuhn, D.M.; Mukherjee, P.K.; Hoyer, L.L.; McCormick, T.; Ghannoum, M.A. Biofilm formation by the fungal pathogen Candida albicans: Development, architecture, and drug resistance. J. Bacteriol. 2001, 183, 5385–5394. [Google Scholar] [CrossRef] [PubMed]
  60. Alsalleeh, F.; Williams, S.; Jaber, H. Interaction of Candida albicans with periodontal ligament fibroblasts limits biofilm formation over elastomer silicone disks. Arch. Oral. Biol. 2016, 63, 47–52. [Google Scholar] [CrossRef] [PubMed]
  61. Cevik, P.; Akca, G.; Asar, N.V.; Avci, E.; Kiat-Amnuay, S.; Yilmaz, B. Antimicrobial effects of nano titanium dioxide and disinfectants on maxillofacial silicones. J. Prosthet. Dent. 2023, in press. [Google Scholar] [CrossRef]
  62. Allaker, R.P. The use of nanoparticles to control oral biofilm formation. J. Dent. Res. 2010, 89, 1175–1186. [Google Scholar] [CrossRef]
  63. Longo, V.M.; Picon, F.C.; Zamperini, C.; Albuquerque, A.R.; Sambrano, J.R.; Vergani, C.E.; Machado, A.L.; Andrés, J.; Hernandes, A.C.; Varela, J.A.; et al. Experimental and theoretical approach of nanocrystalline TiO2 with antifungal activity. Chem. Phys. Lett. 2013, 577, 114–120. [Google Scholar] [CrossRef]
  64. Jafari, S.; Mahyad, B.; Hashemzadeh, H.; Janfaza, S.; Gholikhani, T.; Tayebi, L. Biomedical Applications of TiO(2) Nanostructures: Recent Advances. Int. J. Nanomed. 2020, 15, 3447–3470. [Google Scholar] [CrossRef]
  65. Aati, S.; Shrestha, B.; Fawzy, A. Cytotoxicity and antimicrobial efficiency of ZrO(2) nanoparticles reinforced 3D printed resins. Dent. Mater. Off. Publ. Acad. Dent. Mater. 2022, 38, 1432–1442. [Google Scholar] [CrossRef]
  66. Jangra, S.L.; Stalin, K.; Dilbaghi, N.; Kumar, S.; Tawale, J.; Singh, S.P.; Pasricha, R. Antimicrobial Activity of Zirconia (ZrO2) Nanoparticles and Zirconium Complexes. J. Nanosci. Nanotechnol. 2012, 12, 7105–7112. [Google Scholar] [CrossRef]
Figure 1. Bar graph displaying means and standard deviations (error bars) of baseline color parameters L*, a*, and b* for different groups (n = 10). Means with the same lowercase letters are not significantly different (p ≥ 0.05). No statistical difference was detected in a* of any materials.
Prosthesis 05 00064 g001
Figure 2. Mean ΔEab color changes occurring over time for (a) 40 nm ZrO2, (b) 200 nm ZrO2, (c) 40 nm TiO2, (d) 200 nm TiO2, and (e) 200–300 nm SiO2 (n = 5). Blue line denotes storage in darkness (control), and red line denotes UVB radiation exposure. Error bars represent standard deviations; those not visible are contained within the limits of the symbols.
Prosthesis 05 00064 g002aProsthesis 05 00064 g002b
Figure 3. Bar graph displaying means and standard deviations (error bars) of ultimate tensile strength at baseline and after 3000 h of weathering (n = 12). Means with the same lowercase letters are not significantly different (p ≥ 0.05).
Prosthesis 05 00064 g003
Figure 4. Bar graph displaying means and standard deviations (error bars) of modulus of elasticity at baseline and after 3000 h of weathering (n = 12). Means with the same lowercase letters are not significantly different (p ≥ 0.05).
Prosthesis 05 00064 g004
Figure 5. Bar graph displaying means and standard deviations (error bars) of strain at the break at baseline and after 3000 h of weathering (n = 12). Means with the same lowercase letters are not significantly different (p ≥ 0.05).
Prosthesis 05 00064 g005
Figure 6. Bar graph displaying means and standard deviations (error bars) of C. albicans optical density measured spectrophotometrically at 492 nm after 48 h (n = 12). Asterisk denotes a significant difference from the positive control (p < 0.01).
Prosthesis 05 00064 g006
Figure 7. Representative confocal micrographs of C. albicans stained with FUN-1: (a) Ag 200–400 nm. (b) Ag 30–40 nm. (c) TiO2 200 nm. (d) TiO2 30–40 nm. (e) ZrO2 200 nm. (f) ZrO2 40 nm. (g) Silica 200–300 nm. Scale bar = 30 µm (for all images).
Prosthesis 05 00064 g007
Table 1. Experimental Groups, Tested Properties, and Sample Sizes.
Experimental GroupsPropertySample Size
1% 20–40 nm ZrO2Color5
1% 200–300 nm ZrO2Durometer Hardness5
1% 30–40 nm TiO2Tensile Strength12
1% 200 nm TiO2Tensile Modulus12
13% 200–300 nm SiO2 (control)Tensile Breaking Strain12
1% 20–40 nm ZrO2Antifungal12
1% 200–300 nm ZrO2
1% 30–40 nm TiO2
1% 200 nm TiO2
13% 200–300 nm SiO2 (positive material control)
1 ppm 30–50 nm Ag (negative material control)
1 ppm 200–400 nm Ag (negative material control)
Medium + C. albicans only (positive biological control)
Table 2. Nanoparticles Tested.
Nanoparticle TypeSizeLot No.Company
ZrO240 nm
20–40 m2/g
USHT03US Research Nanomaterials
Houston, TX, USA
200–300 nm
10–15 m2/g
5970-061503Nanostructured and Amorphous Materials
Houston, TX, USA
TiO2
(Rutile)
30–40 nm
35–40 m2/g
54885-040108Nanostructured and Amorphous Materials
Houston, TX, USA
200 nm
19 m2/g
TI07193RUT11Inframat Advanced Materials
Manchester, CT, USA
Ag30–50 nm
16–20 m2/g
USHW09US Research Nanomaterials
Houston, TX, USA
200–400 nm
5 m2/g
0124-030413Skyspring Nanomaterials
Houston, TX, USA
SiO2200–300 nm
225 m2/g
TS-530Cabot Corporation
Boston, MA, USA
Table 3. CIELab Color Changes after 3000 h Storage in Control Environment or UVB Radiation (mean (s.d.), n = 5) 1.
NanoparticleΔL*Δa*Δb*ΔE*ab
Control
1% ZrO2 40 nm−1.4 (0.08) fg−0.2 (0.66) a−5.2 (2.10) b5.6 (2.06) a
1% ZrO2 200 nm−1.7 (0.06) f−0.4 (0.66) a−5.8 (2.10) ab6.3 (2.05) a
1%TiO2 30–40 nm−0.6 (0.07) h0.06 (0.42) a−2.2 (1.26) b2.5 (1.24) a
1%TiO2 200 nm−1.1 (0.14) gh−0.3 (0.38) a−2.5 (0.63) b2.9 (0.59) a
13% SiO2 200 nm−1.0 (0.08) h0.4 (0.90) ab−5.0 (3.20) b5.4 (3.21) a
UVB
1% ZrO2 40 nm−8.0 (0.10) c1.6 (0.65) ab−11.9 (2.04) ab14.7 (1.47) bc
1% ZrO2 200 nm−8.5 (0.12) b1.7 (0.52) ab−11.5 (2.57) ab15.0 (1.61) bc
1% TiO2 30–40 nm−4.3 (0.07) d1.3 (0.50) ab−6.3 (1.02) ab7.9 (0.81) ab
1% TiO2 200 nm−3.1 (0.01) e1.2 (0.25) ab−4.3 (0.84) b5.6 (0.59) a
13% SiO2 200 nm−10.8 (0.13) a3.2 (1.01) b−15.1 (3.03) a19.5 (2.01) c
1 Group means with the same superscript letter are insignificant at the 0.05 confidence level. Superscript letters are arranged from lowest mean value to highest. Comparisons are vertical.
Table 4. Baseline Shore A Hardness and Change in Hardness after 3000 h Storage in Control and UVB environments (mean (s.d.), n = 5) 1.
ParticleBaseline Shore A
(n = 10)
3000 h Change
Control (n = 5)
3000 h Change UVB
(n = 5)
1% ZrO2 40 nm18 (1.5) a−0.1 (0.3) a−0.2 (0.7) a
1% ZrO2 200 nm22 (0.5) b−0.2 (0.4) a0.0 (0.1) a
1% TiO2 30–40 nm19 (0.8) a−0.2 (0.3) a−0.3 (0.5) a
1% TiO2 200 nm18 (1.4) a0.0 (0.2) a0.2 (0.2) a
13% SiO2 200 nm27 (0.7) c1.0 (0.6) b1.5 (0.4) b
1 Group means with the same superscript letter are insignificant at the 0.05 confidence level. Superscript letters are arranged from lowest mean value to highest. Comparisons are vertical.
Disclaimer/Publisher’s Note: The statements, opinions and data contained in all publications are solely those of the individual author(s) and contributor(s) and not of MDPI and/or the editor(s). MDPI and/or the editor(s) disclaim responsibility for any injury to people or property resulting from any ideas, methods, instructions or products referred to in the content.

