Article

Assessment of Battery–Supercapacitor Topologies of an Electric Vehicle under Real Driving Conditions

by
Michele Pipicelli
1,2,3,*,
Bernardo Sessa
2,
Francesco De Nola
2,
Alfredo Gimelli
3 and
Gabriele Di Blasio
1,*
1
Institute of Sciences and Technologies for Sustainable Energy and Mobility (STEMS), National Research Council, Viale Marconi 4, 80125 Naples, Italy
2
Teoresi S.P.A., 10152 Torino, Italy
3
Department of Industrial Engineering, University of Naples Federico II, 80126 Naples, Italy
*
Authors to whom correspondence should be addressed.
Vehicles 2023, 5(2), 424-445; https://doi.org/10.3390/vehicles5020024
Submission received: 9 February 2023 / Revised: 28 March 2023 / Accepted: 3 April 2023 / Published: 5 April 2023
(This article belongs to the Special Issue Advanced Storage Systems for Electric Mobility)

Abstract

:
Road transport is shifting towards electrified vehicle solutions to achieve the Conference of the Parties of the United Nations Framework Convention on Climate Change (COP27) carbon neutrality target. According to life cycle assessment analyses, battery production and disposal phases suffer a not-negligible environmental impact to be mitigated with new recycling processes, battery technology, and life-extending techniques. The foundation of this study consists of combining the assessment of vehicle efficiency and battery ageing by applying supercapacitor technology with different topologies to more conventional battery modules. The method employed here consists of analysing different hybrid energy storage system (HESS) topologies for light-duty vehicle applications over a wide range of operating conditions, including real driving cycles. A battery electric vehicle (BEV) has been modelled and validated for this aim, and the reference energy storage system was hybridised with a supercapacitor. Two HESSs with passive and semi-active topologies have been analysed and compared, and an empirical ageing model has been implemented. A rule-based control strategy has been used for the semi-active topology to manage the power split between the battery and supercapacitor. The results demonstrate that the HESS reduced the battery pack root mean square current by up to 45%, slightly improving the battery ageing. The semi-active topology performed sensibly better than the passive one, especially for small supercapacitor sizes, at the expense of more complex control strategies.

1. Introduction

The European Union, in June 2022, took a preliminary decision to allow the commercialisation of only zero carbon emission light- and medium-duty vehicles starting from 2035. Even though turnaround and modification can still be considered by 2026, governments and industries are investing significantly in the transport sector, promoting the diffusion of electric vehicles (EVs) [1]. This action should be contextualised in the 2022 Conference of the Parties of the United Nations Framework Convention on Climate Change (COP27), which has set carbon neutrality with the main goal of limiting the global temperature rise to 1.5 °C by 2050 [2].
The assessment of EVs’ environmental impact is very complex. It depends on numerous factors varying continuously over years and scenarios. Many works have analysed the impact of EVs through the life cycle analysis (LCA) and compared them to internal combustion engine vehicles (ICEVs). Despite the differences among these studies, the following points appear to be generally accepted: first, the production phase of xEVs is more carbon-intensive than ICEVs mainly due to the battery production; second, by adopting the global warming potential (GWP) as a key performance indicator (KPI) in the LCA, there is a break-even point in terms of the distance travelled for which the GHG emissions of xEVs and ICEVs are the same. For greater distances, the xEVs are less carbon-intensive. That threshold strongly depends on the fuel used in the ICEVs and the energy mix adopted to produce the electricity used to charge the BEVs [3]. Zheng et al. [4], assuming a case study China, suggested that due to the high carbon-intensive energy mix, it is hard to make the BEVs’ impact less than that of ICEVs’ in three decades. According to Kawamoto et al. [5], the production impact of BEV can be roughly double that of ICEVs in terms of the GWP, mainly due to the high-voltage battery pack (BP). The BP share can reach up to 20% of the LCA greenhouse gases (GHG) emissions if a battery pack replacement is made during the vehicle operating life. A viable solution to mitigate the impact of the latter could be: on the one hand, encouraging battery recycling and remanufacturing as a short-term response; on the other hand, finding new battery recycling technologies and materials as a long-term one [6]. In this context, battery ageing plays a relevant role. If an appropriate battery life extension is reached, it is possible to avoid battery replacement during the vehicle operating life. The battery lifetime relates to the battery operating conditions such as the state of charge (SoC), deep-of-discharge (DoD), current (Amperes or C-rating), and temperature [7]. Other than the GWP, the LCA evaluates other resource utilisation and environmental impact indicators. Helmers et al. [8] depicted a complex and not fully clear BEVs environmental impact using other indicators along with GWP, mainly due to the acidification potential linked to the adoption of elements such as Ni, Cu, and Co used in battery and electronic components.
Energy storage systems (ESS) could be classified according to power and energy density. Supercapacitors (SC) belong to the category of high-power density ESS, while lithium-based batteries to the high energy density ESS. A comparison of the ESS in terms of energy and power density at different integration levels (cell, module, and pack) is reported in Figure 1. The data shown were collected from many manufacturers and technical resources. It is possible to distinguish that the mass-related specific power and energy decreased passing from the cell to the module and from this to the pack level. Comparing the BP and SC modules, the first offered about a 35-times greater specific energy and 20-times lower specific power.
For EV applications, the combination of a battery and a supercapacitor in a hybrid energy storage system (BS-HESS) can potentially improve the battery pack life, regenerative braking efficiency, and acceleration performances of the vehicles [9]. SCs have a long operative life, with a negligible ageing effect compared to batteries [10]. Moreover, they are also characterised by a wide operating temperature range and low internal resistance [11]. Notwithstanding the BS-HESS topology that can potentially improve the overall energy storage system performances, a cost–performance trade-off is required to assess the increasing cost of such systems. Moreover, increasing the number of energy sources complicates the development and management of the vehicle powertrain [12]. Chong et al. [13] investigated different BS-HESS topologies for a photovoltaic system, demonstrating that passive topology has a lower cost but with a negligible improvement and uncontrollable behaviours. Song et al. [14] analysed the semi-active topology against the battery cost and temperature variation, concluding that BS-HESS is a cost-effective solution for vehicles considering at least a ten-year lifetime of the system. Both the semi-active and active topologies require more complex control strategies to manage the power split among the multiple sources. Many control strategies have been studied, developed and analysed in this framework. These range from those characterised by a low computational burden and ease of deployment to a new generation of multi input multi output (MIMO) controllers capable of exploiting vehicle data (i.e., from sensors and connectivity). Among the latter, Model Predictive Control (MPC) has to be considered one of the most relevant in the near future to improve the comfort, safety, and energy consumption [15]. Azad et al. have successfully used a nonlinear MPC to cope with the energy management problems on a BS-HESS system [16]. However, they analyse only one driving cycle and one BS-HESS topology, and compare only the battery currents. Although the increase in the vehicle onboard computational power has made the online use of MPC in automotive applications possible, the actual online applications usually adopt rule-based controllers or look-up tables [17]. So, in the future, an increase in the MPC and more advanced controller use in the transport sector can be expected.
Many works in the literature have addressed specific aspects of the BS-HESS, including modelling, topologies, energy management, and thermal effects [18]. Carter et al. [19] focused on the impact on the BP current when the SC was used. Zhu et al. developed a framework for the optimal sizing of the BS-HESS, minimising the lifetime vehicle costs [20]. A comparison of different topologies has been reported, testing the system through a dynamometer driving cycle of a small EV showing the superior performance of semi-active topology [21]. Other experimental activities have compared different control strategies for an active topology on a real driving cycle in terms of the performance and ease of tuning and implementation [22]. Additionally, many studies focus on developing control strategies ranging from optimal offline ones to simple look-up tables for a fixed BS-HESS topology [23]. However, finding quantitative comparisons among different BS-HESS topologies in different driving conditions is difficult.
In this context, this manuscript aims to assess numerically different topologies under various real driving conditions while considering battery ageing and cost. There is little information on the combined analysis of the real driving cycle and BS-ESS topology on the vehicle energy consumption and battery ageing in the specific literature. To the authors’ knowledge, the methodology and the joint comparison of different aspects of BS-HESS proposed in this manuscript is a novelty. In particular, two BS-HESS system topologies have been analysed using a multiphysics vehicle model and an empirical battery ageing model. The proposed configurations have been tested under different driving cycles covering a wide range of vehicle operating conditions. A rule-based, or finite state machine, is developed for the energy management strategy (EMS). This approach is widely adopted in the automotive industry, although optimal control-theory-based strategies are gaining more attention recently [24]. To summarise, the presented work focuses on:
  • Modelling and validation of a light-duty BEV starting from the available literature data needed to assess the performance of the BS-HESS topologies;
  • Assessment of two different BS-HESS topologies, passive and semi-active, in many different testing conditions, and SC size sensitivity analysis;
  • Development of a causal rule-based controller, which is more suitable for online applications of the semi-active topology;
  • Comparison of the battery ageing through a semi-empirical model, among different BS-HESS topologies and driving cycles;
  • Comparative cost assessment of the BS-HESS topologies.

2. Materials and Methods

This section describes the main steps, assumptions and data adopted for the modelling activity of the vehicle, HESS, and control strategy. A proper model was developed to assess the influence of BS-HESS on xEVs’ vehicles adequately. In particular, the commercial multiphysics software GT-SUITE v2022 (Gamma Technologies, Westmont, IL, USA) was used for the vehicle modelling, while the controller was implemented in MATLAB/Simulink. The battery, supercapacitors, and electric motor were modelled using electromagnetic templates. The baseline model used for the validation was representative of the Volkswagen e-Golf of 2015. The main data used for the modelling are reported in Table 1.
A schematic view of the vehicle model architecture analysed is presented in Figure 2. All the developed controllers shared the same input and output interface layer to ensure flexibility, rapid comparison, and modification. The GT-Suite and Simulink co-simulation was realised by compiling the Simulink model in a “.dll” library file and then importing it into the vehicle model. The adopted methods and tools are compatible with the typical processor-in-the-loop validation procedure for the vehicle control unit “v-cycle” development [27].
An extensive validation process was carried out using online available data from the Argonne National Laboratory (ANL) database [13], whose selected driving cycle is summarised in Table 2. The driving cycles included steady-state driving, passing manoeuvre, high road slope, and different vehicle configurations (e.g., closed/open windows). The terminology adopted is aligned with the ANL one.
In all tested conditions, the accomplishment of the target driving cycle speed was within ± 2 km/h, according to standard regulations frameworks [28]. The remaining part of this section discusses the most relevant topics for model generation.

2.1. Battery Pack

To correctly assess the vehicle efficiency and battery ageing, it is essential to predict the current and voltage of the BP accurately. The BP OCV curve is often unavailable from vehicle data, as in this case. So, the open-circuit voltage (OCV) was fitted post-processing the experimental vehicle data. In particular, the operating points characterised by very low C-ratings were selected from the current and voltage traces during the tests. This procedure can help to improve the current prediction of BPs. In the region of interest (i.e., SoC between 20% and 90%), the experimental data were fitted with the following formula proposed by Yu et al. [29].
O C V = a b S o C c · S o C + d · ln S o C + e · l n ( 1 S o C )
The fitting parameters are the coefficients a, b, c, d, and e. The adopted OCV curve is reported in Figure 3, which shows the experimental data relative to two different battery pack temperatures and the fitting curve used in the models.
The battery cycle ageing was included in the model as an empirical relationship assuring good prediction capabilities and low computational requirements, avoiding detailed Electrochemical–Thermal–Mechanical models. The drawback of this approach is that a lot of experimental data are required for generating the regression curve [30]. For this specific case, due to a lack of data on the specific cells adopted for the real vehicle, the parameters of the ageing model adopted were relative to a 26550-type cell. In fact, the reference vehicle had a battery pack with 264 cells with an 88s3p configuration (i.e., 88 groups of 3 parallel cells were linked in series) with a rated 323 V nominal voltage and 75 Ah capacity [31]. However, there were no specifications on the adopted cell type. The following equation describes the cycle ageing model.
L q = g S o C h T c e l l f q d q ,
where g , h , and f are the penalty functions relative to the state-of-charge (SoC), the cell temperature, and the charge, respectively. L q is the capacity loss. The penalty functions are defined as follows:
g S o C = A g + B g · S o C C g
h T c e l l = 0.01 · e x p ( A h / ( B h · T ) )
f q = A f + B f · ( q / 3 ) C f
A g , B g . C g , A f , B f . C f , A h , and B h are model constants to be fitted as preliminaries with experimental data. In this work, the values used in the model were extrapolated from experimental data and correlations by Onori et al. [32], and then converted as requested by the model. The regression of available experimental data for battery ageing was divided into three terms, each linked to a specific dependent factor. The adopted values are reported in Table 3.

2.2. Regenerative Braking

It is worth highlighting that, as demonstrated in various works, the use of SCs can improve the efficiency of the regenerative braking system. Jin et al. demonstrated this advantage on a passenger car under hard braking and FTP-75 cycles [33], while Zou et al. on a heavy truck [34]. Other experimental assessments have demonstrated achieving about 70% of the regenerative braking efficiency [35]. From this point of view, the developed model was limited because of the lack of integration of a detailed regenerative braking system. Consequently, the efficiency calculated in the following sections could be slightly underestimated depending on the driving cycle.

2.3. Test Driving Cycles

After the model validation, additional driving cycles were included in the analysis to assess the BS-HESS performance in different real driving scenarios. The speed traces were derived from experimental acquisitions via onboard diagnostic tools on a class B vehicle. The driving cycle profiles are reported in Figure 4, where they are referred to with prefix ‘EXP’ followed by a progressive number.
The characteristic parameters describing a driving cycle [36] are reported in Table 4 for both the validation and experimental driving cycles. In particular, the time-based percentage of the driving cycle in which the vehicle is in idling (Pi), cruising (Pc), accelerating (Pa), and decelerating (Pd) are reported. The classification of each operating time for one of the conditions is based on the vehicle speed and acceleration. According to the literature, the adopted thresholds are 1.389 m/s for the speed and 0.1389 m/s2 for the acceleration [37]. For a fair comparison, it is essential to use real driving cycles, since it is known that the homologation ones are often not representative of the battery ageing in real driving conditions [38].

2.4. Supercapacitor and BS-HESS

The use of SCs was investigated through the evaluations of two system topologies. The SC was modelled using an equivalent electrical circuit with one Thévenin branch. In particular, the OCV vs. SoC characteristic curve of the single SC module is reported in Figure 5.
Many topologies can be designed to exploit the SC and BP, such as passive, semi-active HESSs and full-active ones, with an increased complexity and cost but with higher potential in terms of the operational flexibility and management [39]. An overview of the potential configurations is reported in Figure 6. The first three are investigated in this work.
Regarding the cost, the battery cost ranges from about 3.2 to 4.6 k€, and the specific cost ranges from 130 to 190 €/kWh [39]. For the sake of complexity, the full-active control strategy was not considered because an additional DC/DC converter should have been used with a dedicated control unit. Instead, the specific cost of a DC/DC converter is 20–30 €/kWh, resulting, for the power range considered (100 kW), in a total cost of 2–3 k€ [40]. So, for a full-active topology requiring two separate DC/DC converters, the cost of the needed converters is similar to the battery one. So, its results are economically less sustainable for light-duty applications and is therefore excluded from the assessment in the current study. The passive and semi-active topologies do not require additional converters, but the latter requires dedicated EMS development. Instead, the passive topology does not require a control strategy since it is impossible to control its operation actively, which is also its major drawback. In this case, the charging and discharging of the SC were only dictated by the electrical characteristics of the component chosen in the BS-HESS design phase as the battery internal resistance, and SC resistance and capacitance [41]. The SCs, in this case, acted as a low-pass filter. The BPs and SCs were connected electrically in parallel, with the first showing mainly a resistive behaviour and the latter a capacitive one. So, this topology makes an RC branch in the first approximation. The semi-active topology, instead, does not require an additional converter and can ensure better performance [42]. In the following, the configuration nomenclature reported in Figure 6 was adopted.

2.5. Energy Management Strategy

It is worth highlighting that only the semi-active CFG3 topology requires an EMS control strategy. In fact, for the other topologies, there is only one way for the ESS to fulfil the power request from the vehicle (i.e., no degree of freedom to control) since there is only one energy source onboard that can satisfy the requested electric power. A rule-based controller was developed for the CFG3 to assess the BS-HESS performance because of its low computational burden, which made it easily deployable on standard onboard control units. In this preliminary assessment, the thermal effects are neglected, and the temperature was considered constant. The rule-based controller was implemented as a finite state machine in MATLAB/Simulink using Stateflow. In the following, the developed controller is discussed.
The requested electrical power is a function of the vehicle speed, acceleration and configuration (i.e., window position, A/C and auxiliary systems operation), and road slope. Since the gear ratio of the transmission is fixed for a given vehicle speed and acceleration, from which can be determined the tractive force, the motor operating point is defined. The electrical motor power can be expressed as reported in the following:
P E M = A + B V + C V 2 + m a + m g sin α V η m o t Ω m o t , T m o t
where A, B, and C are the coast-down road load coefficients, V the vehicle speed, a the acceleration, g the gravity, α the grade slope, η m o t Ω m o t , T m o t the motor efficiency defined by the rotational speed Ω m o t , and T m o t the torque. The coast-down load coefficients were adopted from the ANL data. The total requested electrical power, including the auxiliary system power P a u x , can be expressed as:
P E L = P E M + P a u x
The schematic drawing in Figure 7 shows the feasible system operating mode.
In both traction (PEM > 0) and braking mode (PEM < 0), the following relation holds.
P E L = P S C + P B P
P a u x trace is characterised by a high characteristic time (i.e., low frequency), which makes it reasonable to draw the auxiliary power from the BP. With this hypothesis, it is possible to introduce a power-split ratio of the exchanged power by the BP, γ B P [ 0 , 2 ] , as follows:
P B P = γ B P P E M + P a u x
The power exchanged by the SC is the complementary part γ S C = 1 γ B P P E M . However, in traction mode, it is possible to consider a recharge from the BP to the SC with a correlated power defined as P S C , c h a r g e , while the BP also provides the electric motor (EM) power. In this case γ B P > 1 . When the vehicle is in braking mode, γ B P > 1 does not make sense. In fact, in this condition, the EM should charge the BP, and then the BP should recharge the SC, which produces a double exchange dissipating more energy than using part of the EM energy to charge the BP and the remaining for the SC. Additionally, this behaviour is not allowed due to the energy buffer nature of the SC and its limited capacity.
A rule-based controller (i.e., a finite state machine) was implemented to control the behaviour of the HESS. The finite-state machine is represented in Figure 8. Four states were defined:
  • BP only, characterised by γ B P = 1 .
  • Regenerative braking, characterised by γ B P = 0 . It is applied when P E L < 0 , and the SCs’ SoCs have a value allowing its recharge.
  • Mixed SC and BP operations, characterised by γ B P [ 0 , 1 ] .
  • SC charging from BP operations, characterised by γ B P > 1 .
The transition rules allow the change from one state to another. As an example, if the vehicle is in braking condition, the recharge of the SC should be a priority if SC SoC is lower than its maximum threshold. The full definition of the transition rules is reported in Figure 8. The proper definitions of the transition rules guarantee that only feasible HESS operations are achieved, according to Figure 7. The transition rules are defined based on some threshold levels that can be tuned to change and optimise the controller behaviour. The adopted thresholds are listed in the following:
  • SOCSC,min: SC SoC minimum threshold, set to 0.35. Lower SoC values should be avoided as the OCV is almost linear with SOC (Figure 5) since the efficiency of the DC/DC schematically presented in the CFG3 of Figure 6 could be heavily affected [43].
  • SOCSC,max: SC SoC maximum threshold, set to 0.95 to ensure safe SC operation [44].
  • TP: Power threshold under which the use of only the BP is preferred.
  • TP,max: Power threshold over which the use of SC is preferred.
  • PSC,charging: Target power to be drawn from the BP to recharge the SC.
The tuning parameter values used in this work are reported in Table 5. These values were obtained as a result of a heuristic optimisation for an SC size of 2.8 kWh. The SC size was chosen according to literature results in which the supercapacitor characteristics are mostly around 10% of the BP energy capacity [45]. It is worth underlining that the tuning parameters (Table 5) of the controller must be recalculated for each use case [46].
To clarify, the developed rule-based EMS instantaneously defines the discharging rate of the SC coherently with its goal. It depends on the actual requested power from the vehicle and the SC’s SoC. The charging rate of the SC depends on the system status. In particular, it can be charged from the BP or during regenerative braking. In the first case, the charging power is a tuning parameter of the EMS, while in the second one, it is linked to the electrical power produced during this phase.
A moving average filter has been used for the output of Stateflow to achieve a smoother control law.

2.6. Test Methodology

The developed model has been used to investigate the topology and driving cycle effect on the efficiency and battery ageing. The workflow of the analysis carried out is graphically reported in Figure 9. The main steps of the work have been articulated as follows.
  • Base configuration development and validation.
  • Battery ageing and current estimation for the base BEV configuration in standard and real driving cycles.
  • Integration of the supercapacitors in passive and semi-active topologies.
  • Sensitivity analysis of the SC size versus battery ageing, current peaks, and root mean square (RMS) value reduction.
  • Cost analysis of the explored BS-HESS solutions.

3. Results

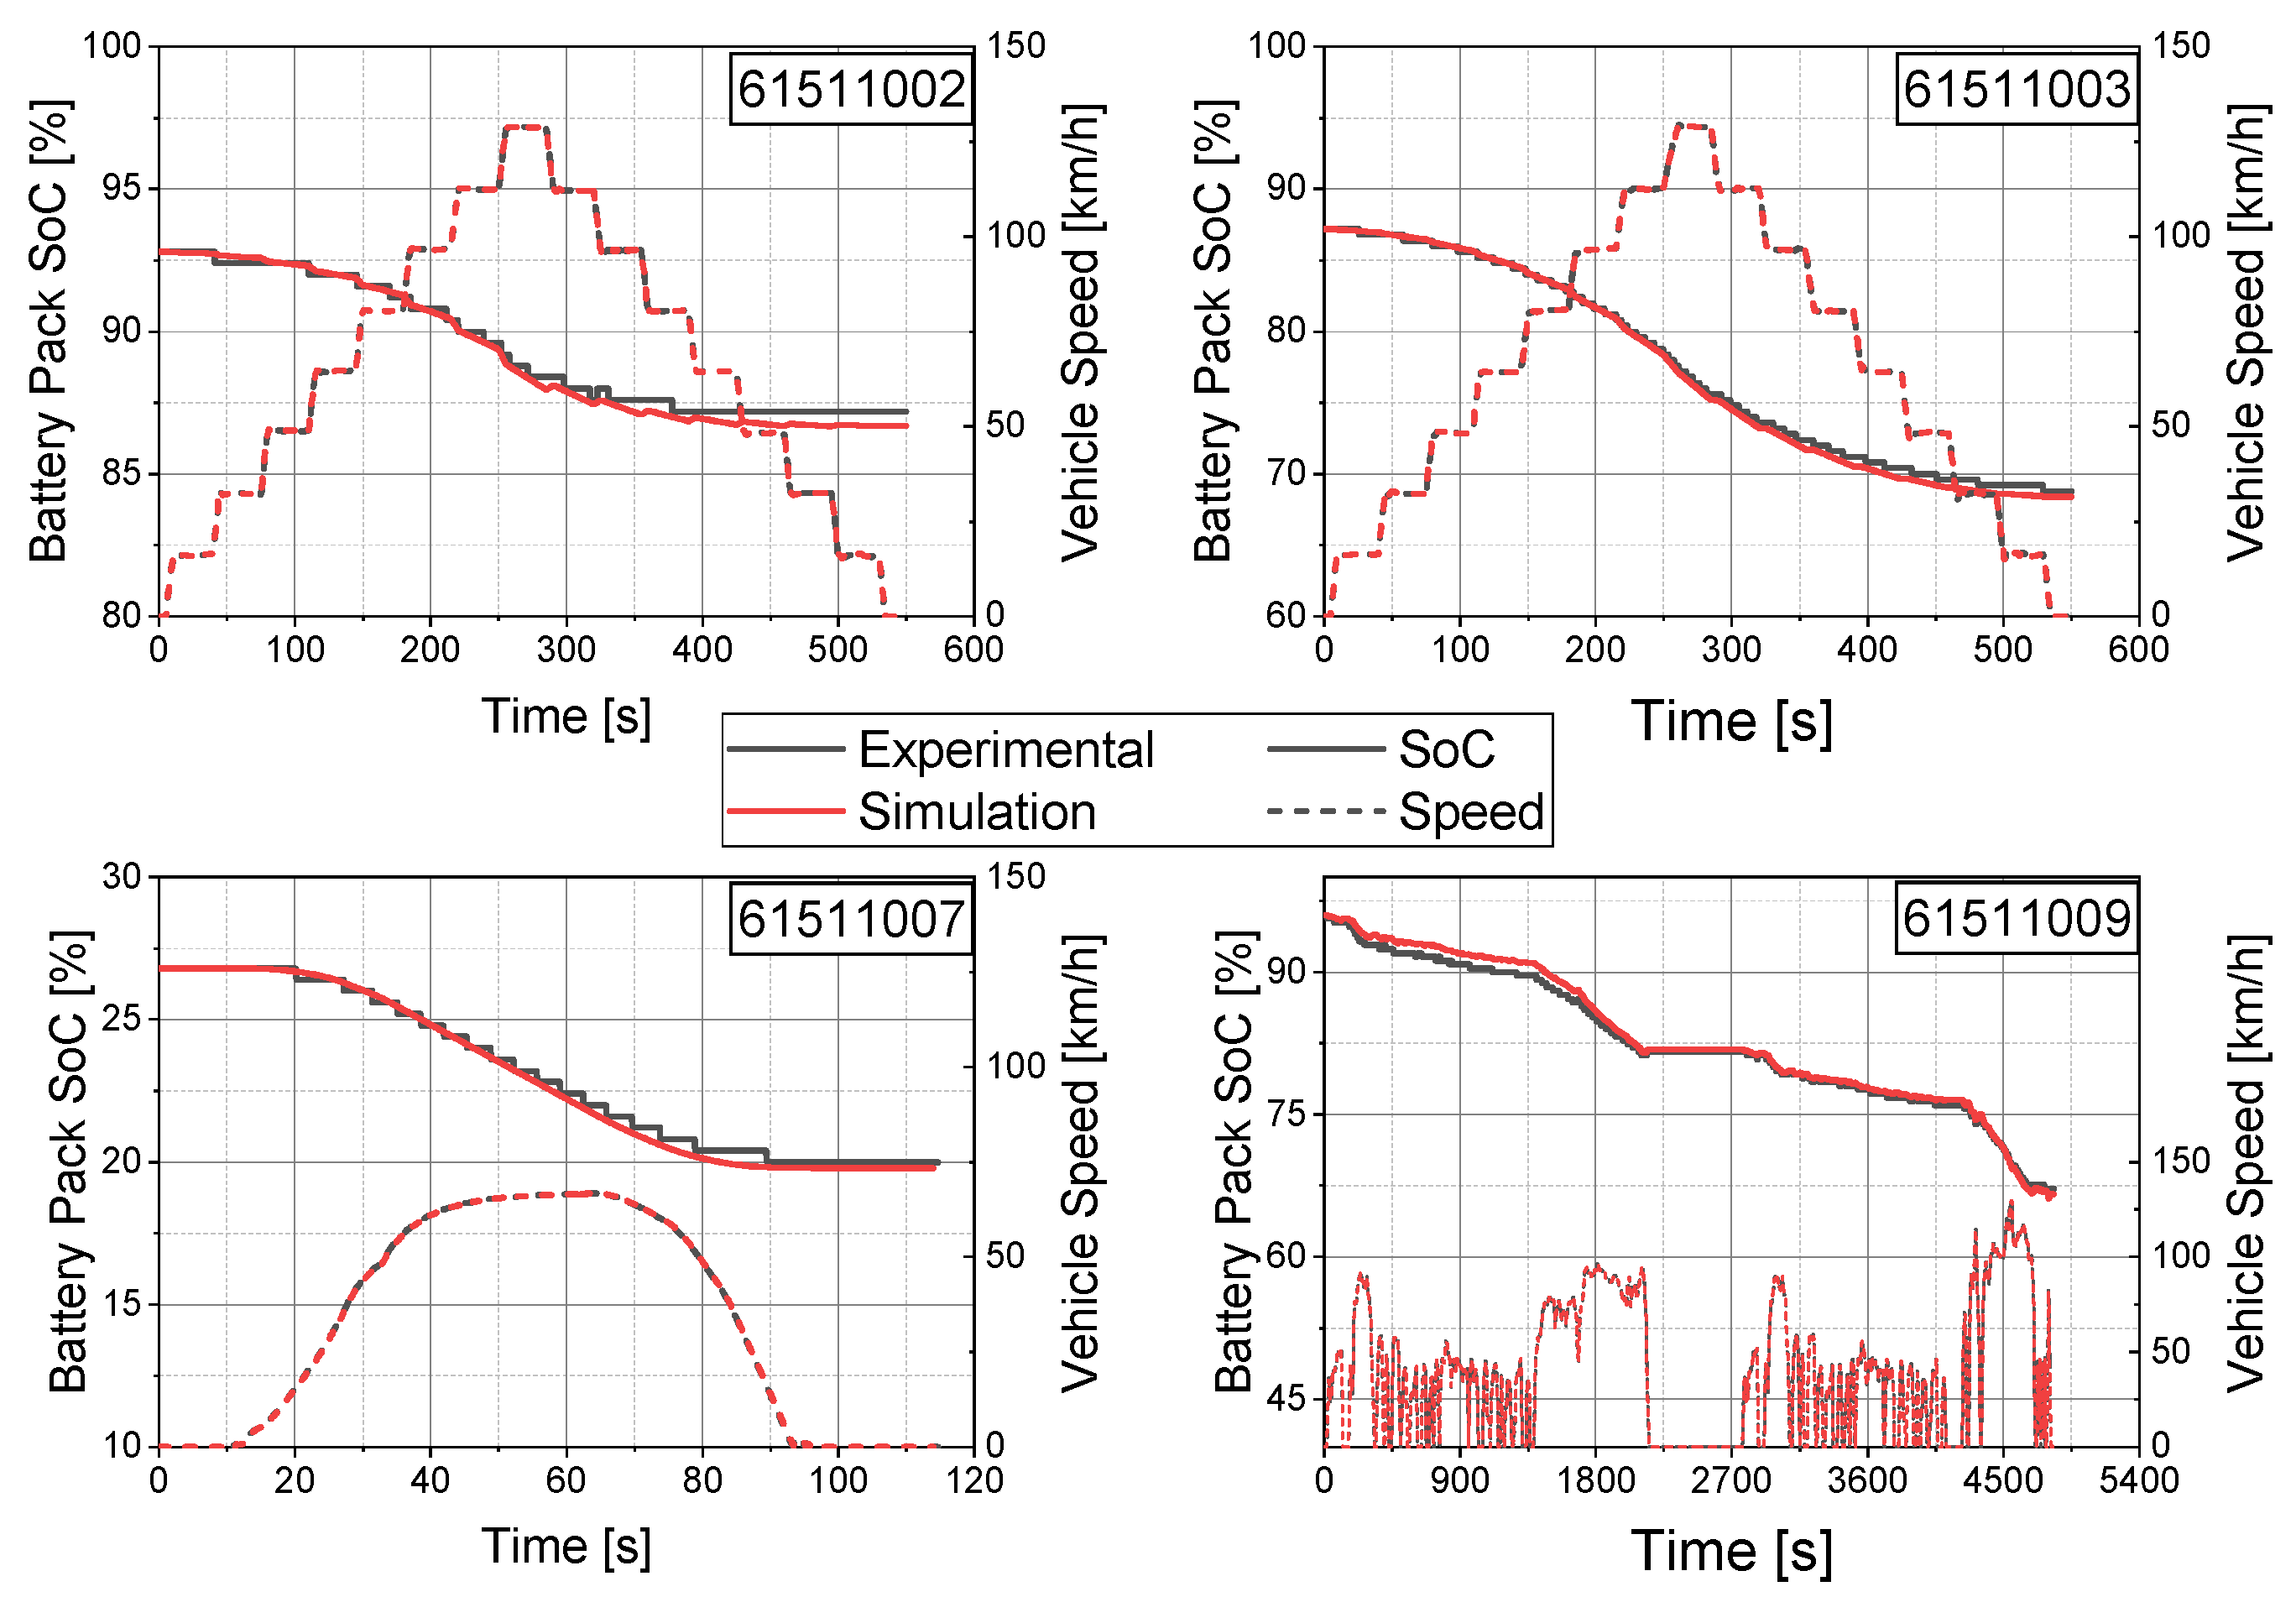
This section reports and discusses the main results obtained by the numerical investigations. First, the results of the base model validation are presented. Then, the performances and cost assessment of the two investigated BS-HESS systems are compared to the base configuration without the SC.

3.1. Validation

A summary of the main validation results is reported in Table 6. The experimental SoC data are discretised with a resolution of 0.4%. A good prediction capability over a wide range of operating conditions was reported with a mean error for the SoC and energy consumption of less than 5%. In Figure 10, instead are reported the driving cycle and the SoC curve among the experimental and simulation data. The figure shows that the model response was coherent with experimental data, with similar SoC trends.
A globally good numerical and experimental data agreement was achieved in standard conditions. In less usual conditions, in the driving cycle 61511010, characterised by a higher average speed, the energy error grew to 5.1%. Indeed, it was reasonable to assume that the adopted efficiency map had lower values than the real one in the high-speed region. Additionally, the lack of detailed modelling of auxiliary systems should be considered. The energy errors could be further improved by using a more accurate EM map, which is unavailable in this specific case. The EM efficiency map is presented in Figure 11. The light green area covers the EM operating regions for which experimental data were available. It is worth emphasising that instead of using an EM map model, future activities will be finalised using a model with higher fidelity for the proposed analyses, which can further improve the reliability of the results. However, as is known, high-fidelity modelling will be subordinated to the availability of experimental data, which is often a prerogative of manufacturers only.
The previous activities demonstrated the goodness of the proposed model and approach, due to the good match with experimental data. In the following, further numerical analyses are carried out on new vehicle configurations exploiting the BS-HESS.

3.2. BS-HESS Investigation

This section compares two BS-HESS topologies in terms of ageing using metrics such as the capacity and ohmic losses, maximum, minimum, and RMS BP currents, and costs.
As is known, the ESS hybridization effectiveness depends on many factors, such as the BP and SC characteristics, EMS, and mission profiles [
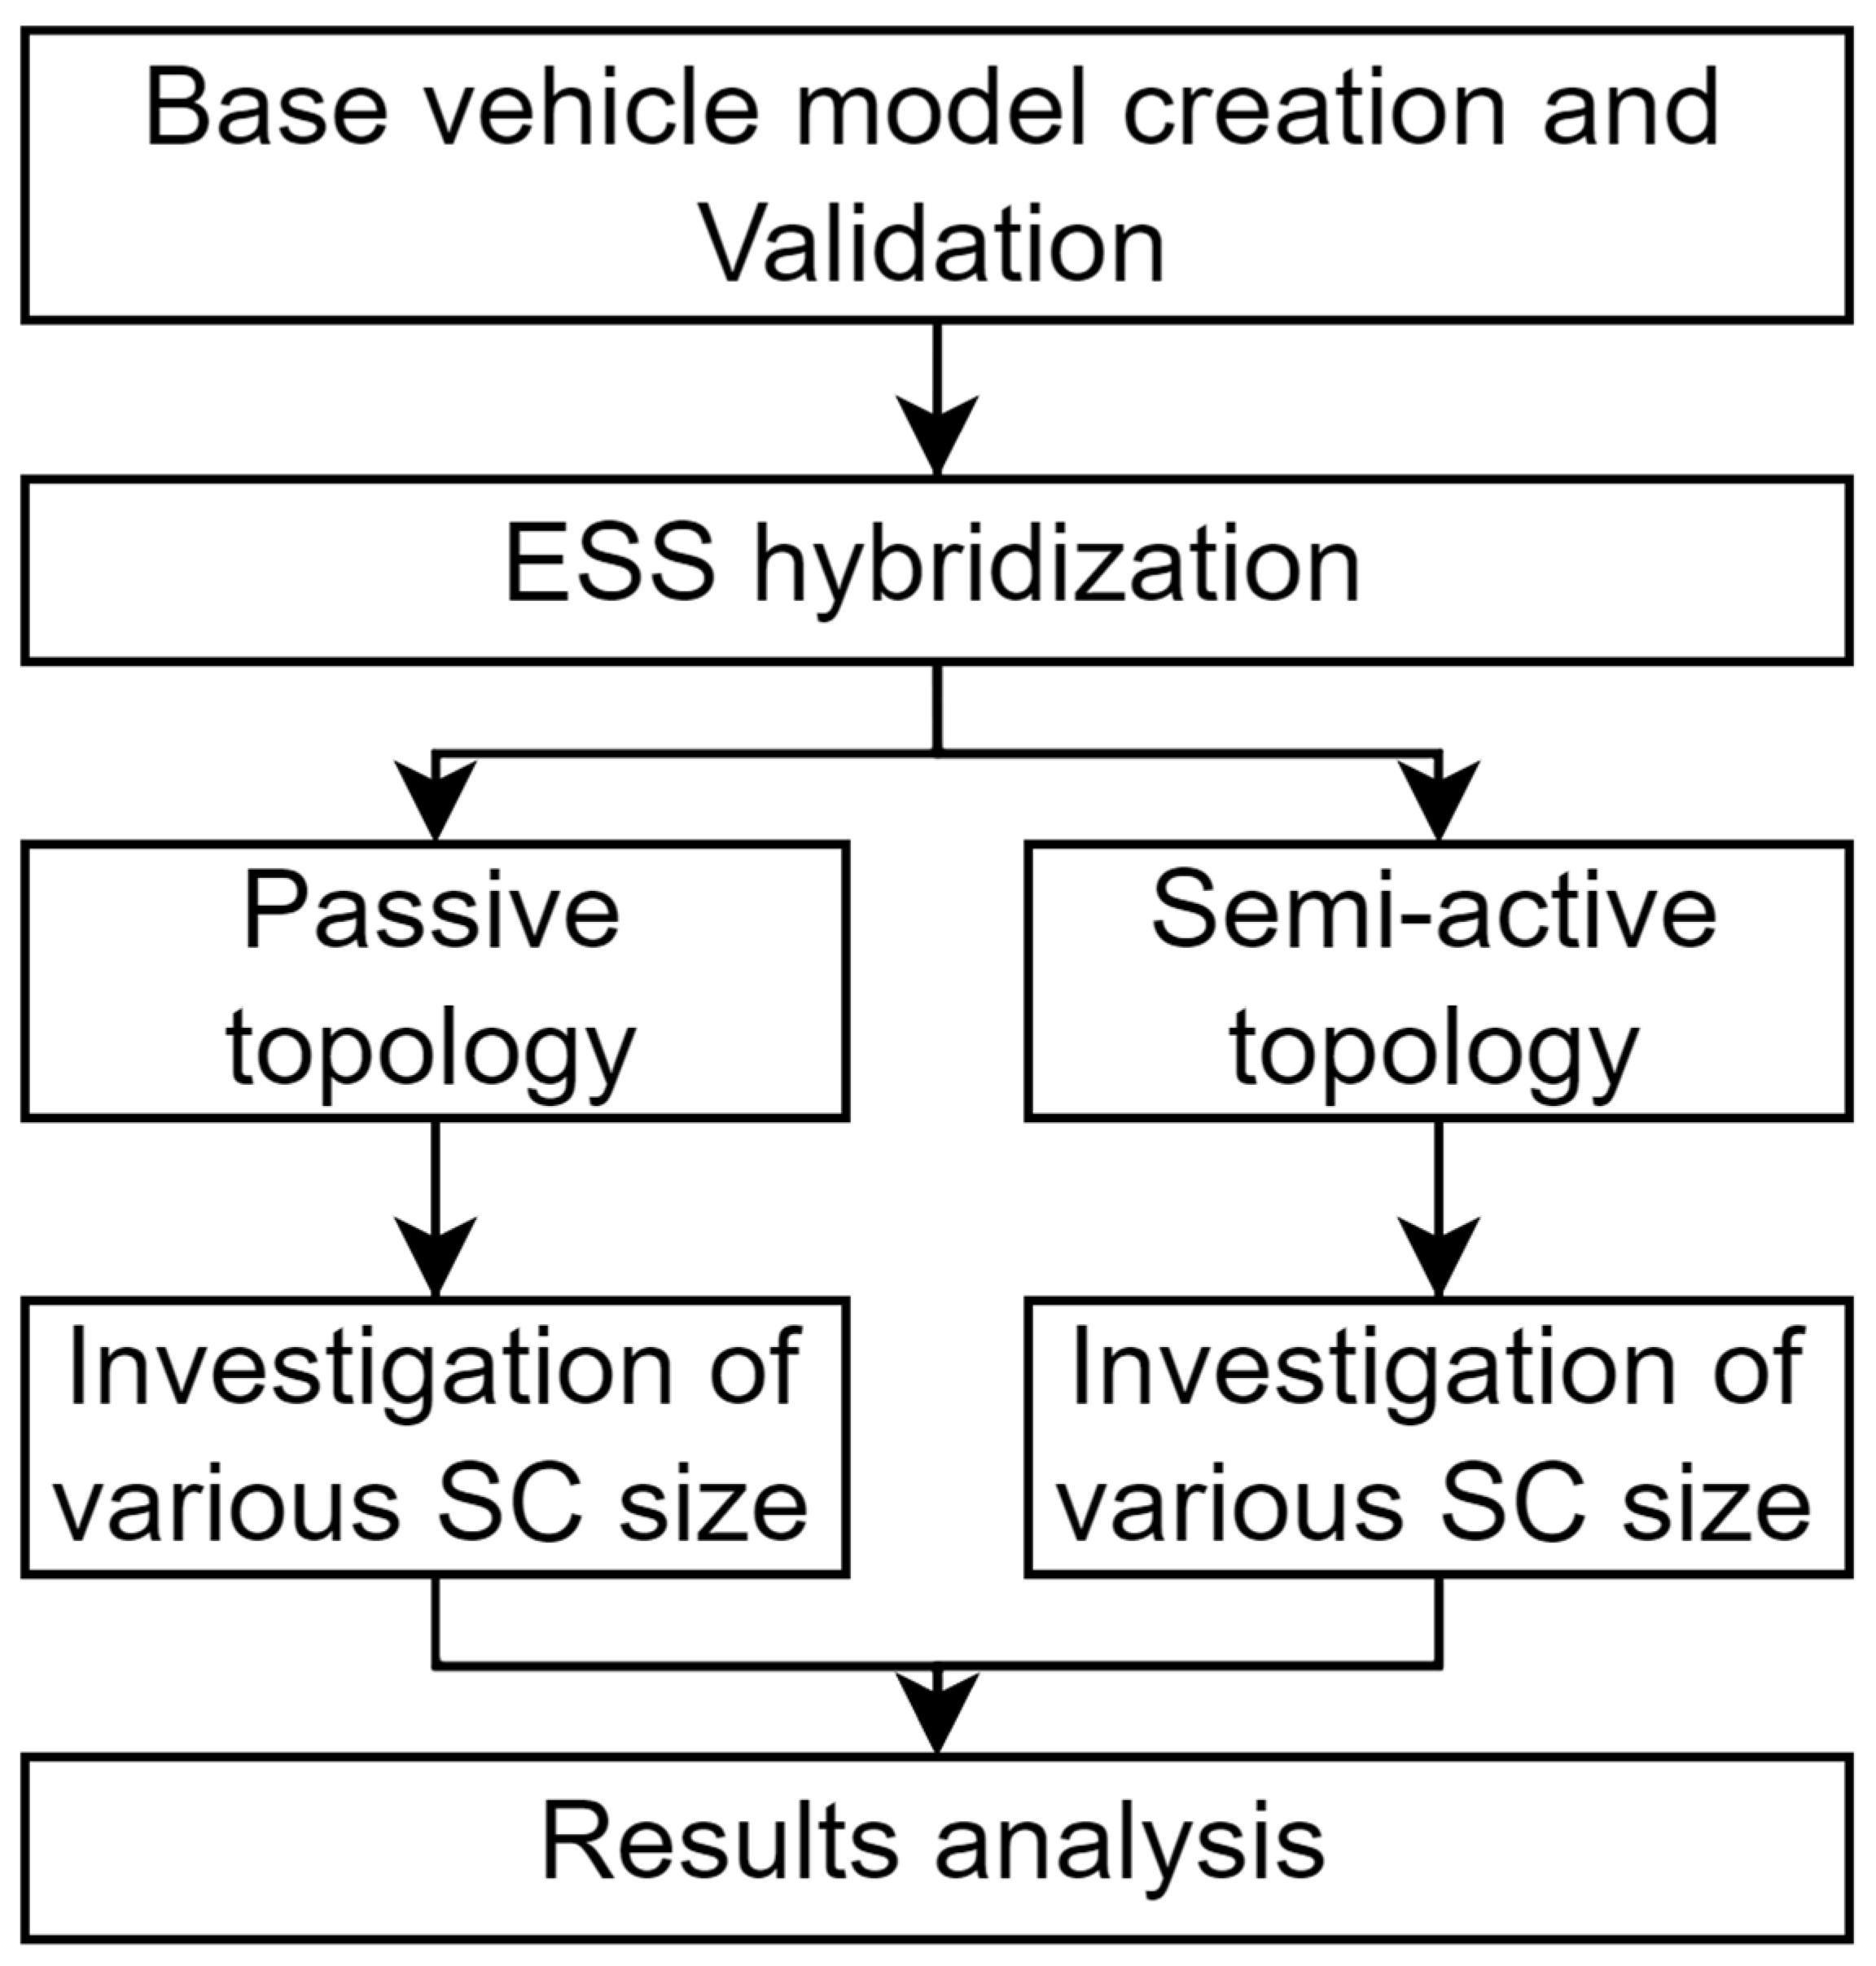
47]. Different driving cycles have been tested to assess the mission profile influence, characterised by high slope conditions, passing manoeuvres, and real driving cycles. A sweep of the SC size from 0.05 to 6.8 kWh was carried out at constant BP capacity. The BP and EMS tuning parameters were kept constant, while the SC characteristics were varied, assuming that the size increase was achieved by increasing the capacitance.
Regarding the predicted capacity loss, the sweep results are reported in 
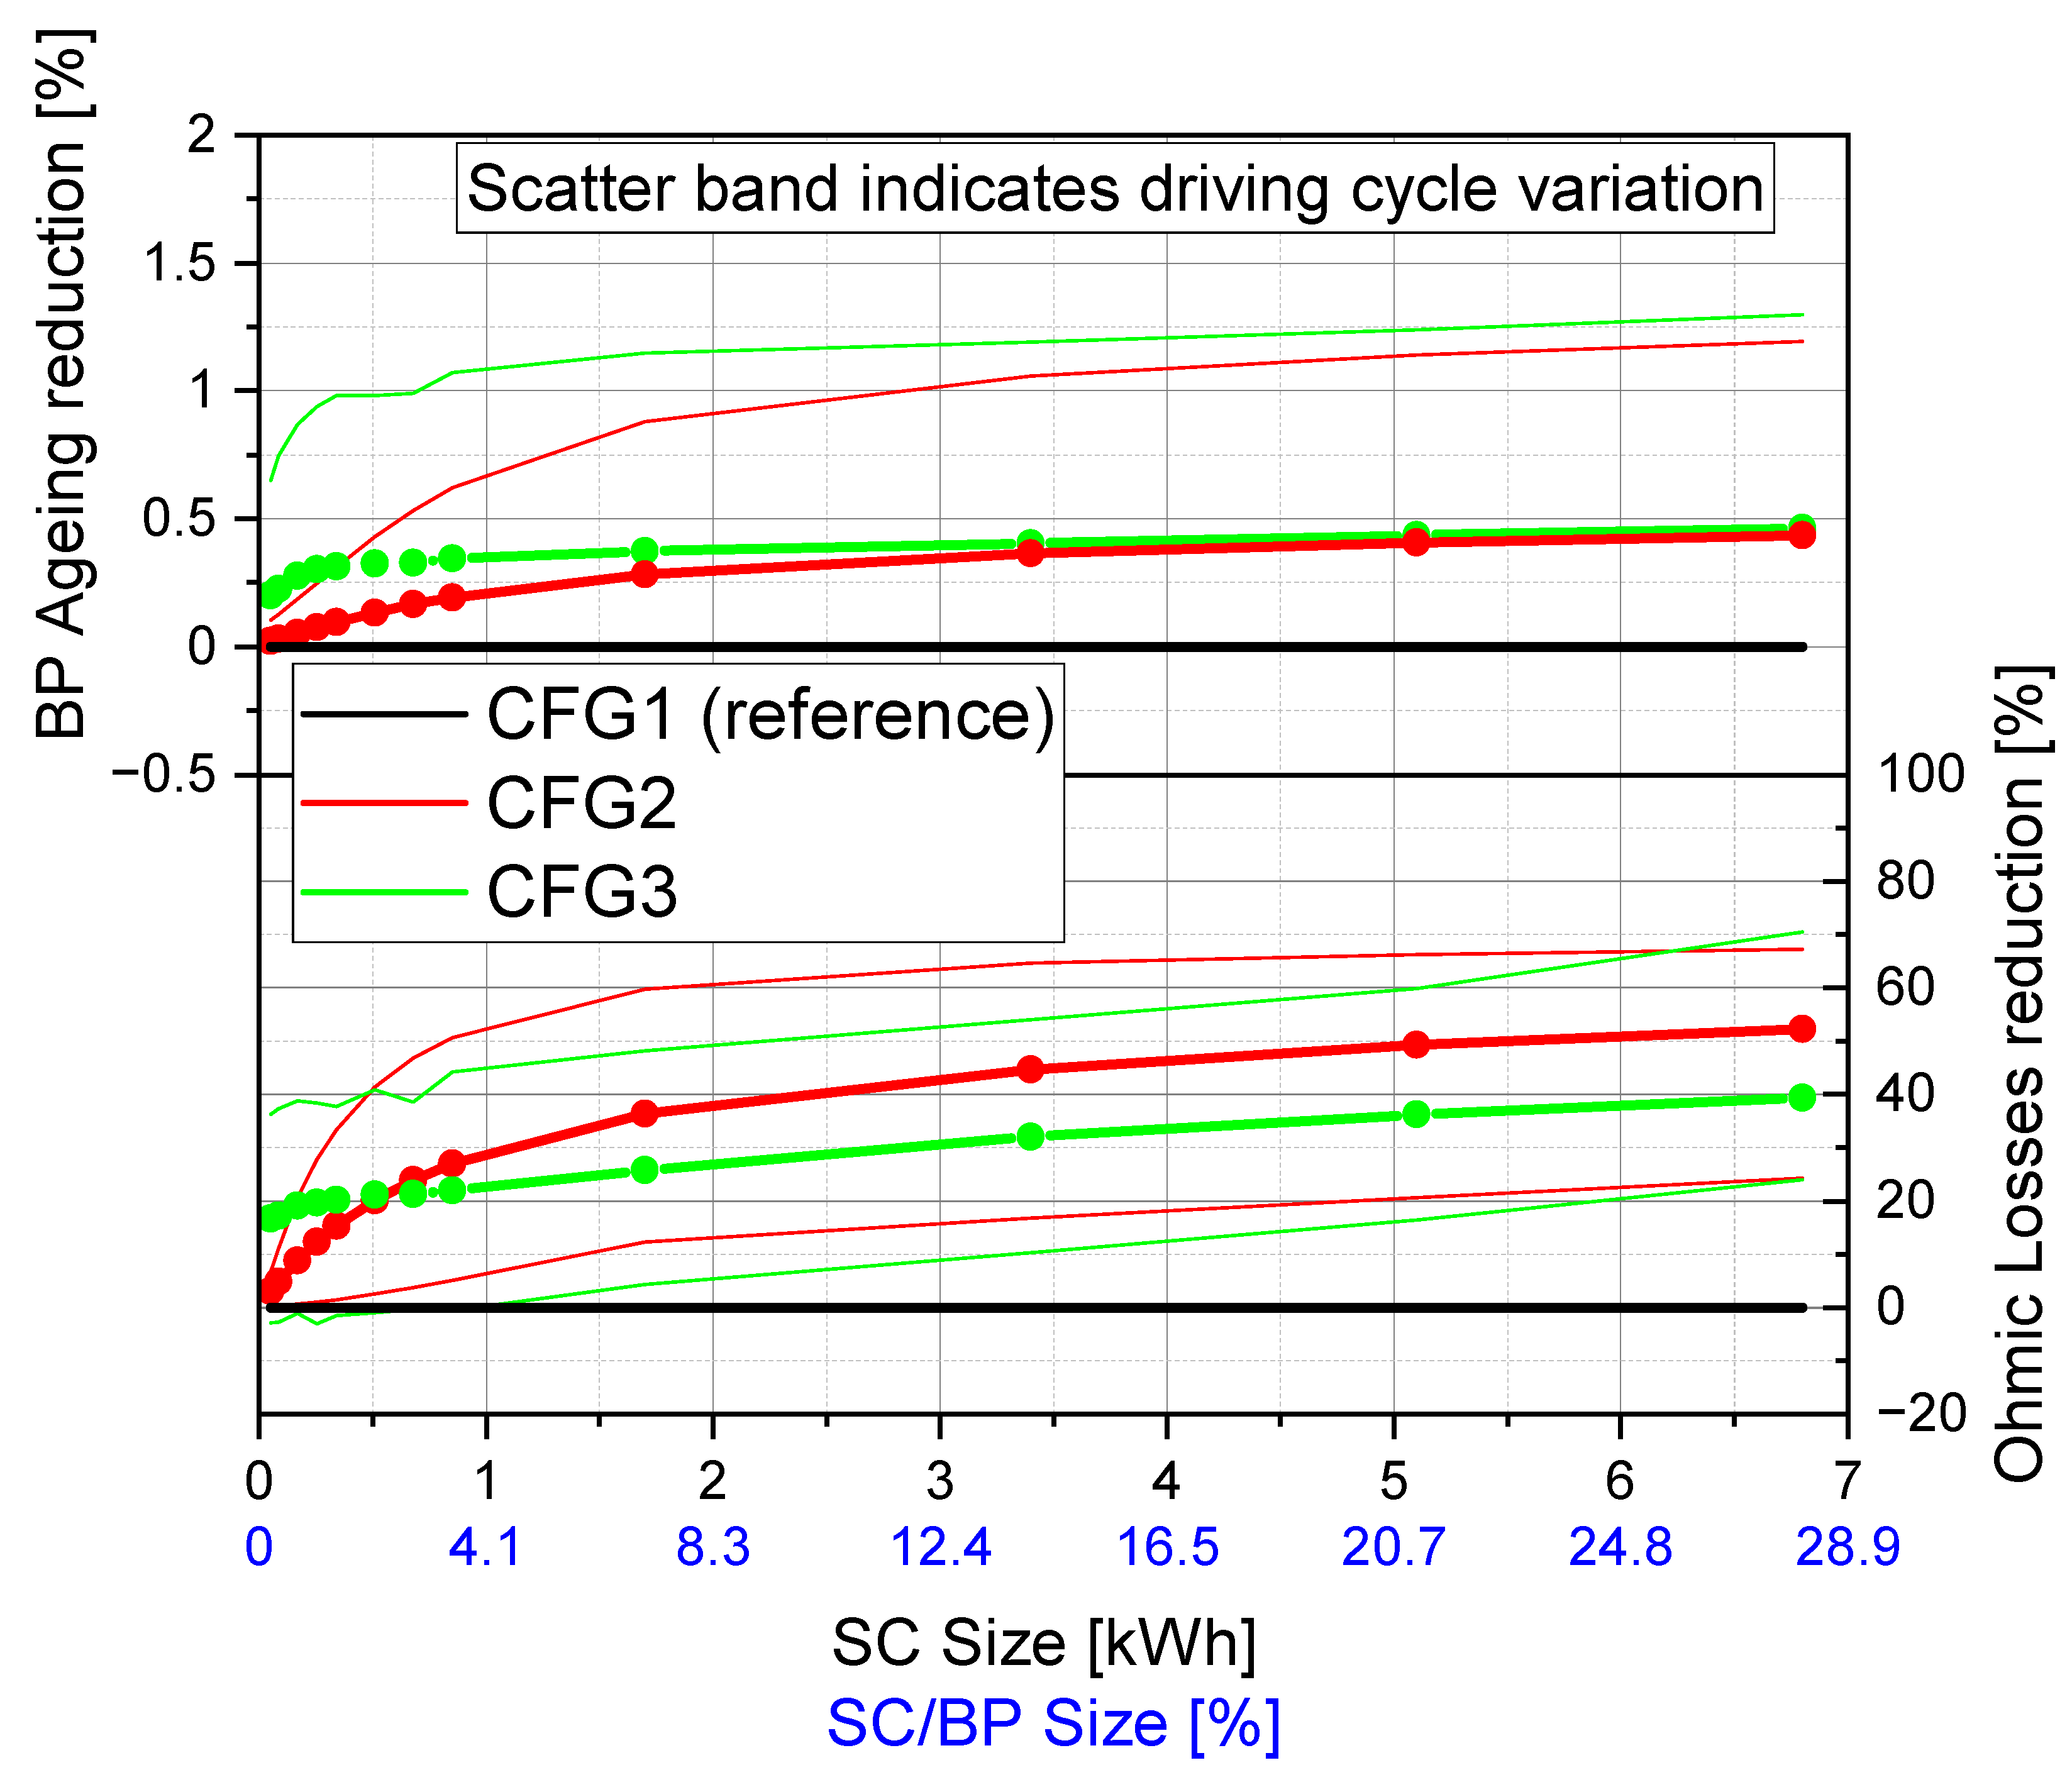
Figure 12. The continuous line is the mean value, while the scatter band indicates the variation among driving cycles, showing the minimum and the maximum values obtained. A reduction in up to 1.25% on a specific driving cycle and 0.5% on average were achieved with high SC capacities, while a 0.25% capacity loss reduction was achieved in the most interesting area, characterised by a SC size less than 1 kWh. The displayed trend was expected to be a “U” shaped function of the SC size [20]. However, for the particular case adopted, linked to the electrical properties of the HESS, the found average had a decreasing trend, but the slope tended to become flatter.
The sweep of the SC size was stopped around a value of 7 kWh (about one-third of the BP size) since a higher value seems unreasonable for a BS-HESS system since the main energy source should be the BP.
The best ageing reduction performance is shown by CFG3, as shown by analysing the trends in Figure 11. For both configurations, as soon as the SC capacity overcame 8–10% of the BP one, the trend was quite flat, and no further improvements were expected by increasing the SC size, and the optimisation goal should have only been oriented to the performances. In this regard, Ostadi et al., found that the optimal energy share of an SC system is 17% from an optimisation of the sizing of SC and BP [45]. The CFG3, especially in the region of small SC sizes of less than 3 kWh, showed a longer battery life. For further smaller SC sizes lower than 0.5 kWh, the battery ageing was reduced by about one order of magnitude compared to CFG2.
This is an important aspect considering that in recent years the cost reduction in the BP has been higher than the SC ones. Thus, the optimal SC/BP size ratio has to be defined through the cost/efficiency trade-off.
As seen in Figure 12, the HESS can reduce the BP ohmic losses, assuring a reduction in the energy consumption [48]. A comparison of the CFG2 energy consumption reduction in comparison to CFG1 was evaluated. Reductions of −1.1%, −1.5%, and −2.4% can be achieved on average, with SC sizes of 0.34, 0.68, and 1.7 kWh, respectively. The lower energy consumption was mainly linked to the reduction in the ohmic losses of the battery, which, for the presented SC sizes, varied between 25% and 42%, in line with literature results [49]. It is worth highlighting that the ohmic losses were proportional to the square of the current and were directly proportional to the internal resistance, and the SCs have an order of magnitude smaller internal resistance, with a consequent ohmic losses reduction. Regarding the driving cycle influence, the BS-HESS in the real driving cycle conditions was less effective than its operation under 61511009 and 61511020 tests, composed of UDDS, HWY, and US06 homologation driving cycles.
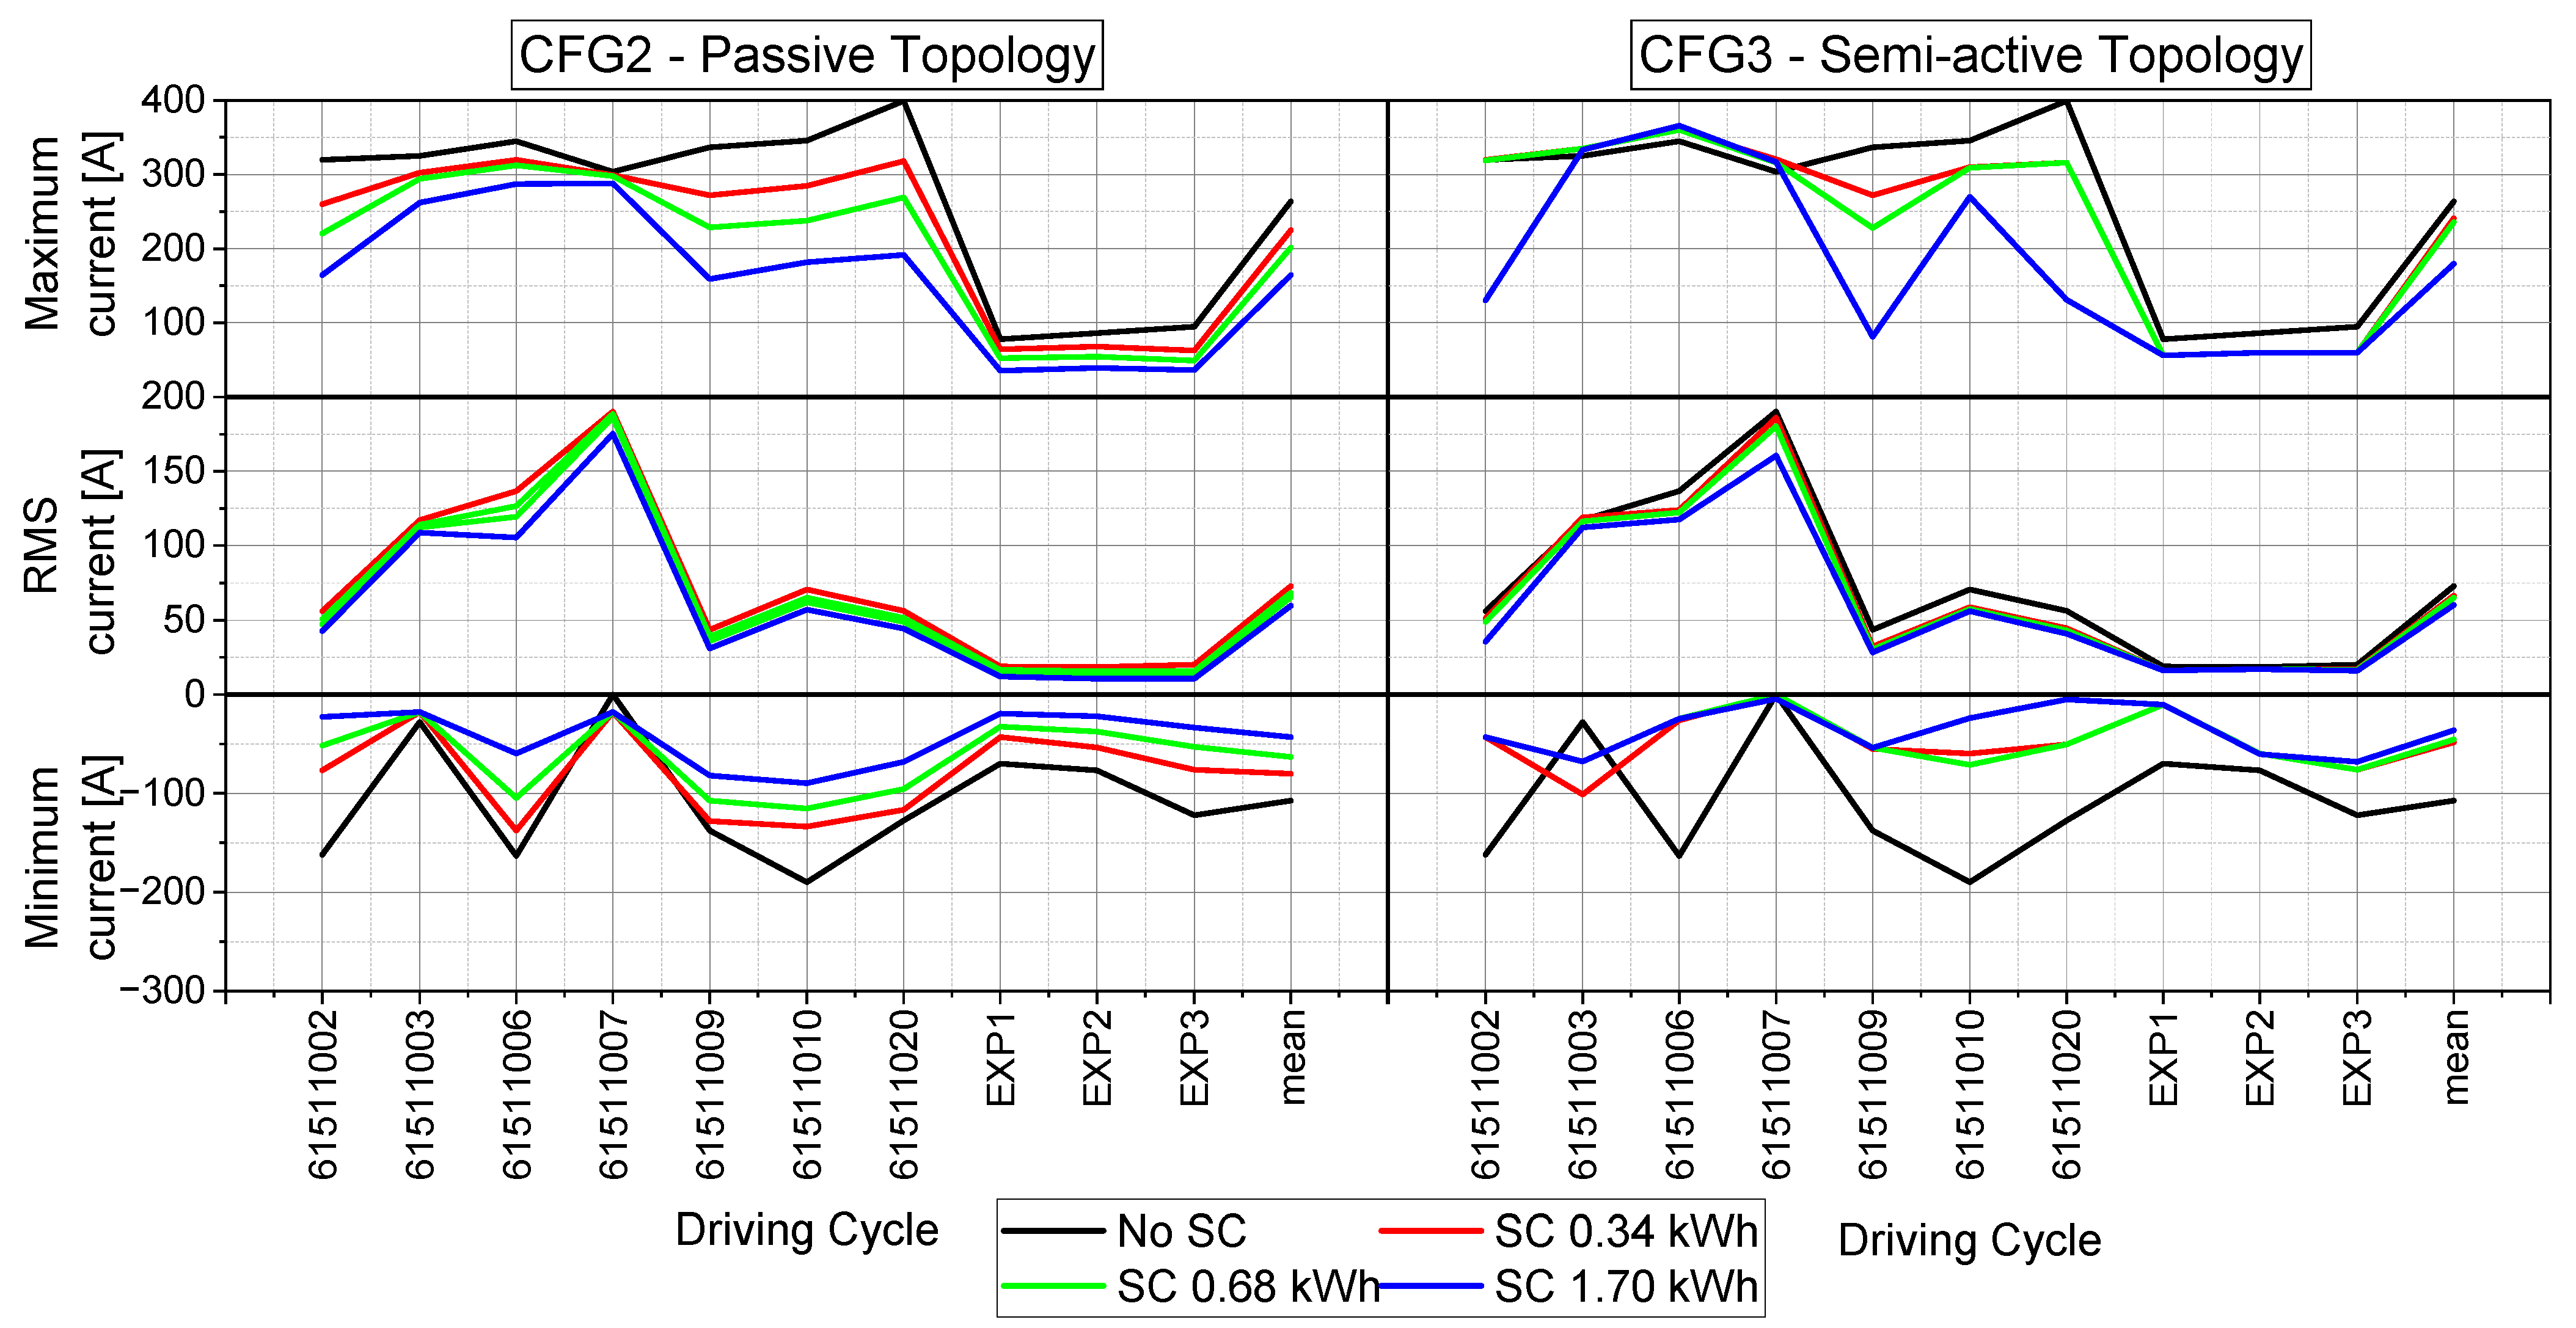
Looking at smaller SC sizes, the SC capacity of about 1.5%, 3%, and 7% have been investigated for the following analyses. In the following, currents exchanged from the BP are analysed. As is known, they are strictly involved in cycling ageing [43]. In this regard, the maximum, minimum, and RMS BP currents for each driving cycle are reported in Figure 13 for both CFG2 and CGF3.
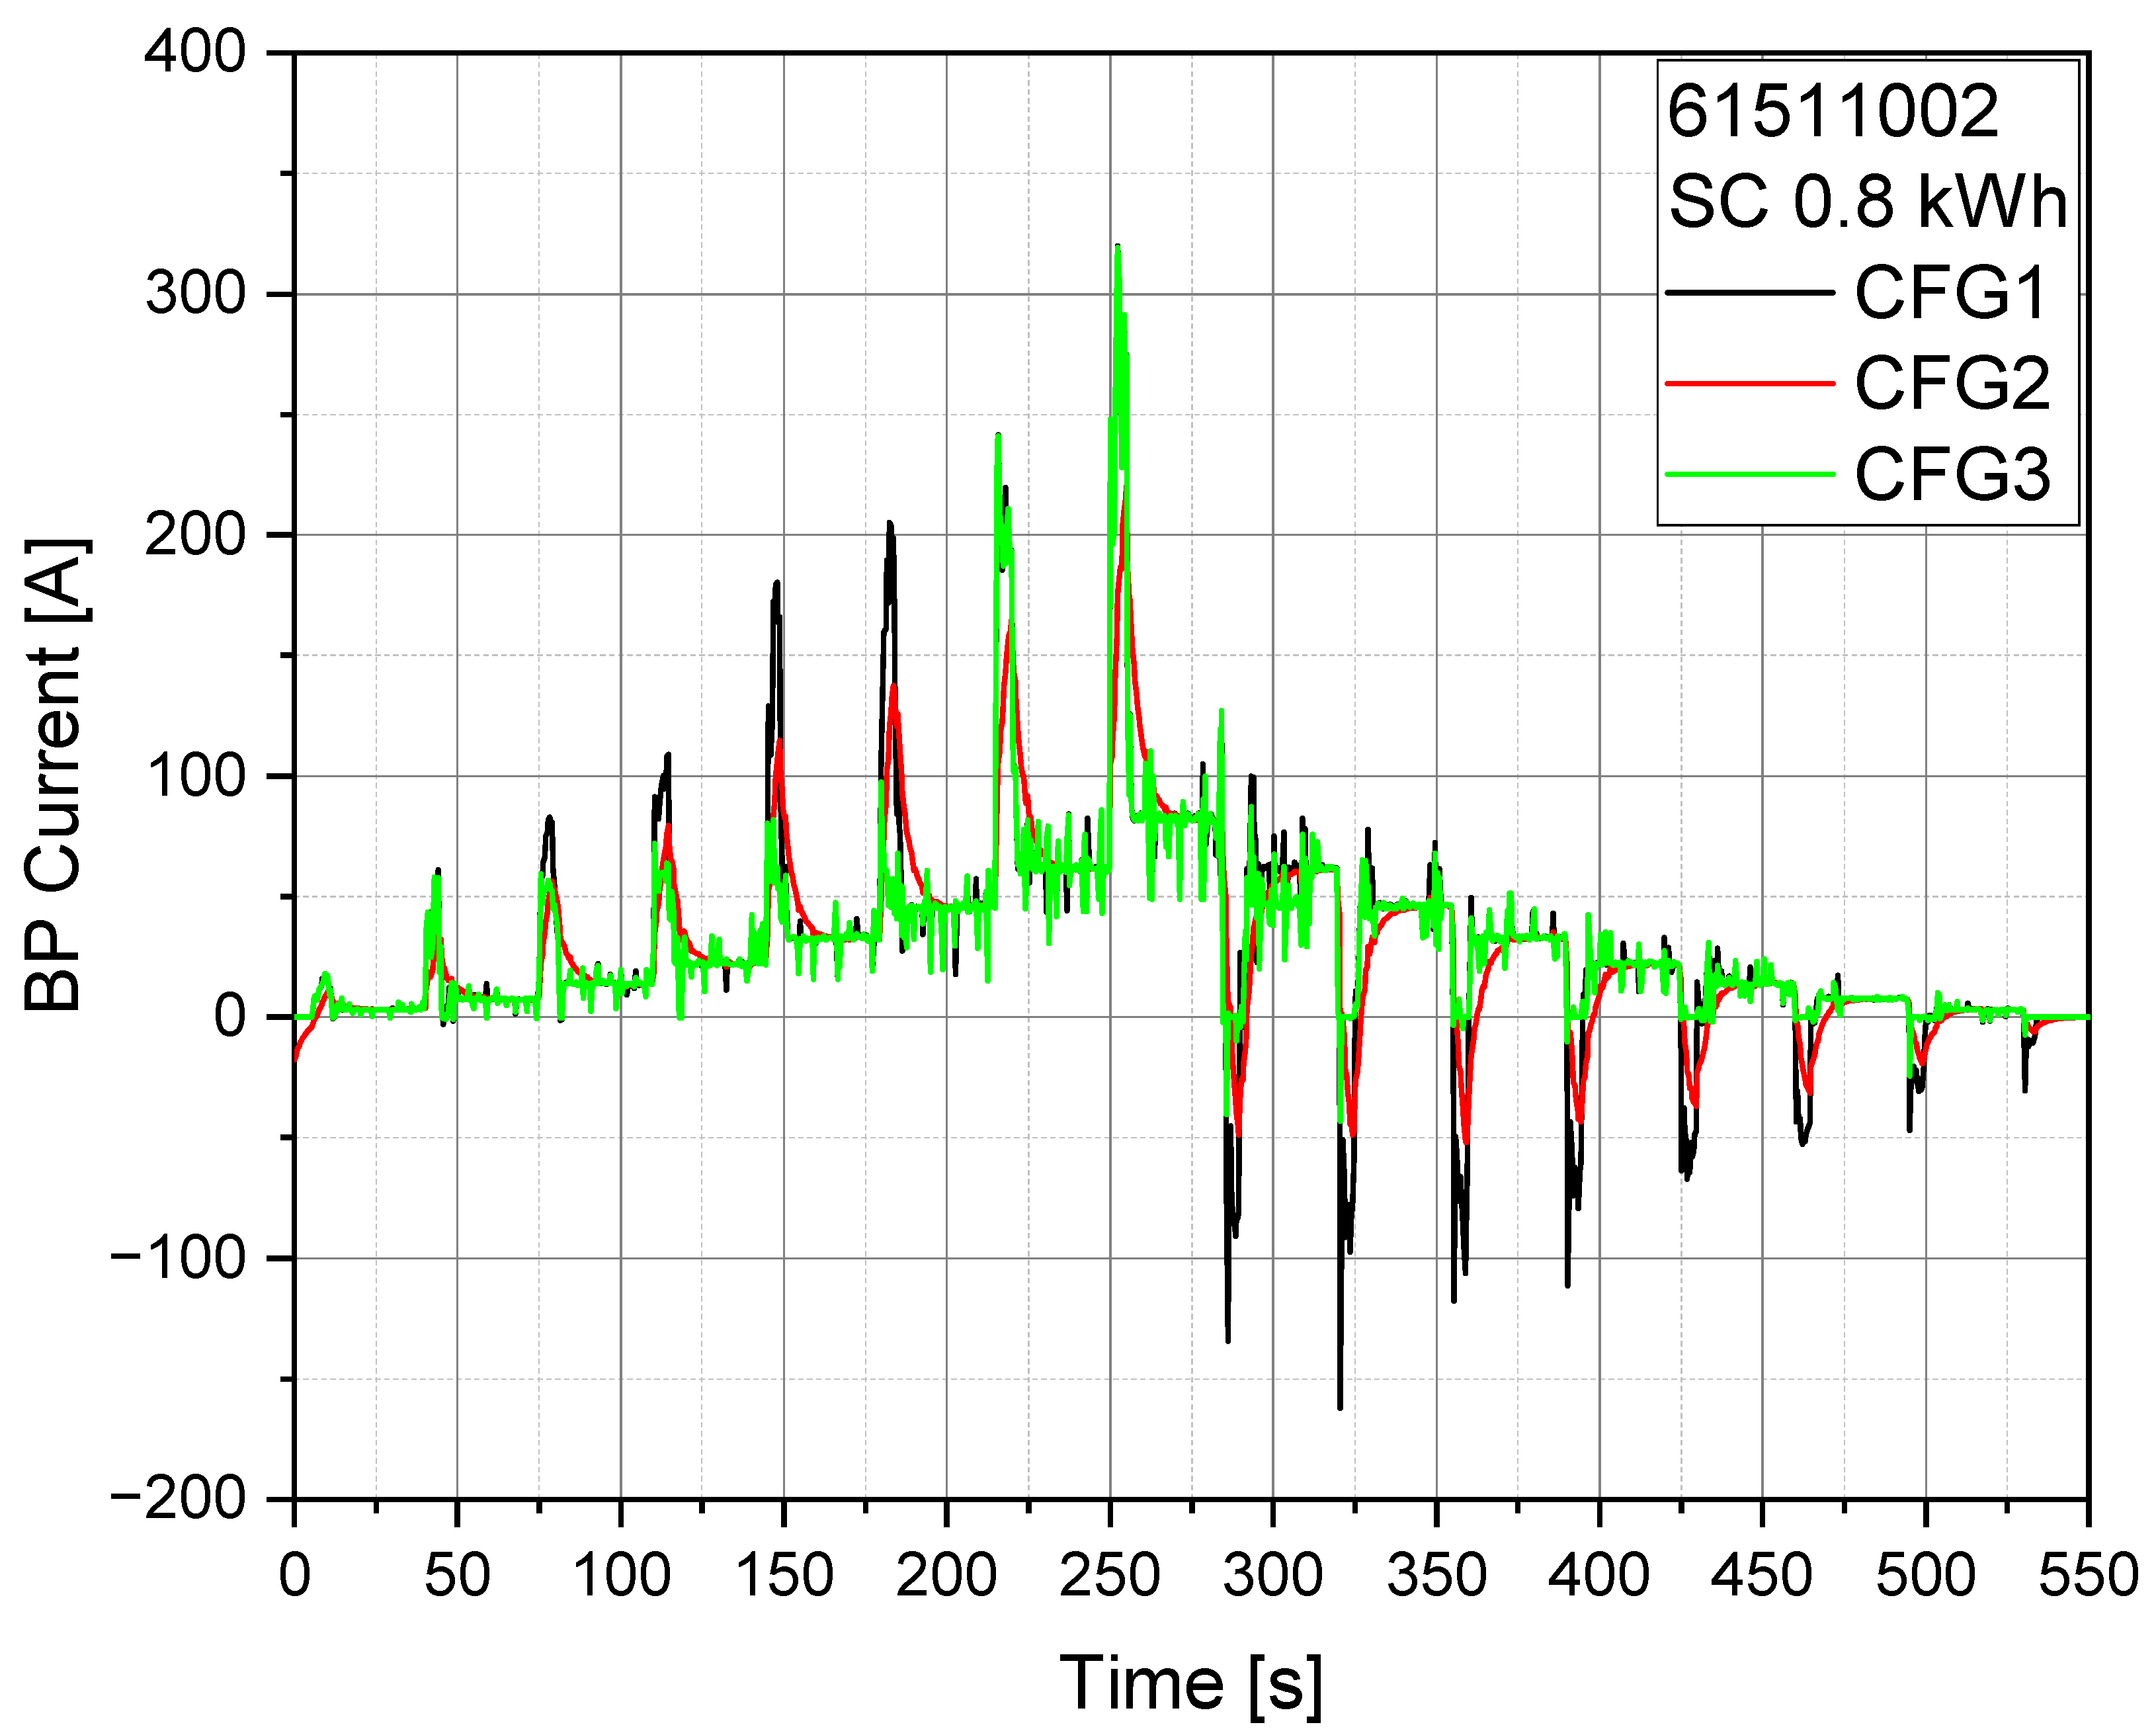
The maximum current was effectively reduced using CFG2, reaching mean values of about −16%, −27%, and −41% for each size considered. This trend was due to the reduced cut-off frequency of the BS-HESS. In fact, increasing the SC capacity size and keeping the internal resistance constant reduced the cut-off frequency of the SC, acting as a low-pass filter. The reduction was irrelevant in test 61611007 due to the high slope conditions, which required high power and were characterised by a very low-frequency current. In fact, the power request was high in this test condition, with fewer current peaks, and the HESS was less effective. The BP current related to driving cycle 61511002 and an SC of 0.8 kWh are reported in Figure 14. The CFG3 reduced the current peak of the battery actively, at least until the SCs had enough residual SoC. At a time of 250 s, the CFG3 was ineffective at reducing the peak due to the discharged SC, while the CFG2, which acted as a low-pass filter, did not suffer this problem. The trend was still valid for all the tested driving cycles. It is reasonable that a further optimised control strategy can effectively improve the performance of CFG3.
Regarding CFG3, the non-optimal nature of the rule-based BS-HESS EMS failed in some conditions in avoiding the current peaks. In particular, in some cases, the EMS-chosen discharge rate was such that the SC had already been discharged when the EM requested high power. This phenomenon led to lower peak reduction performances of the CFG3 and explained the non-uniform behaviour of the maximum current shown in 
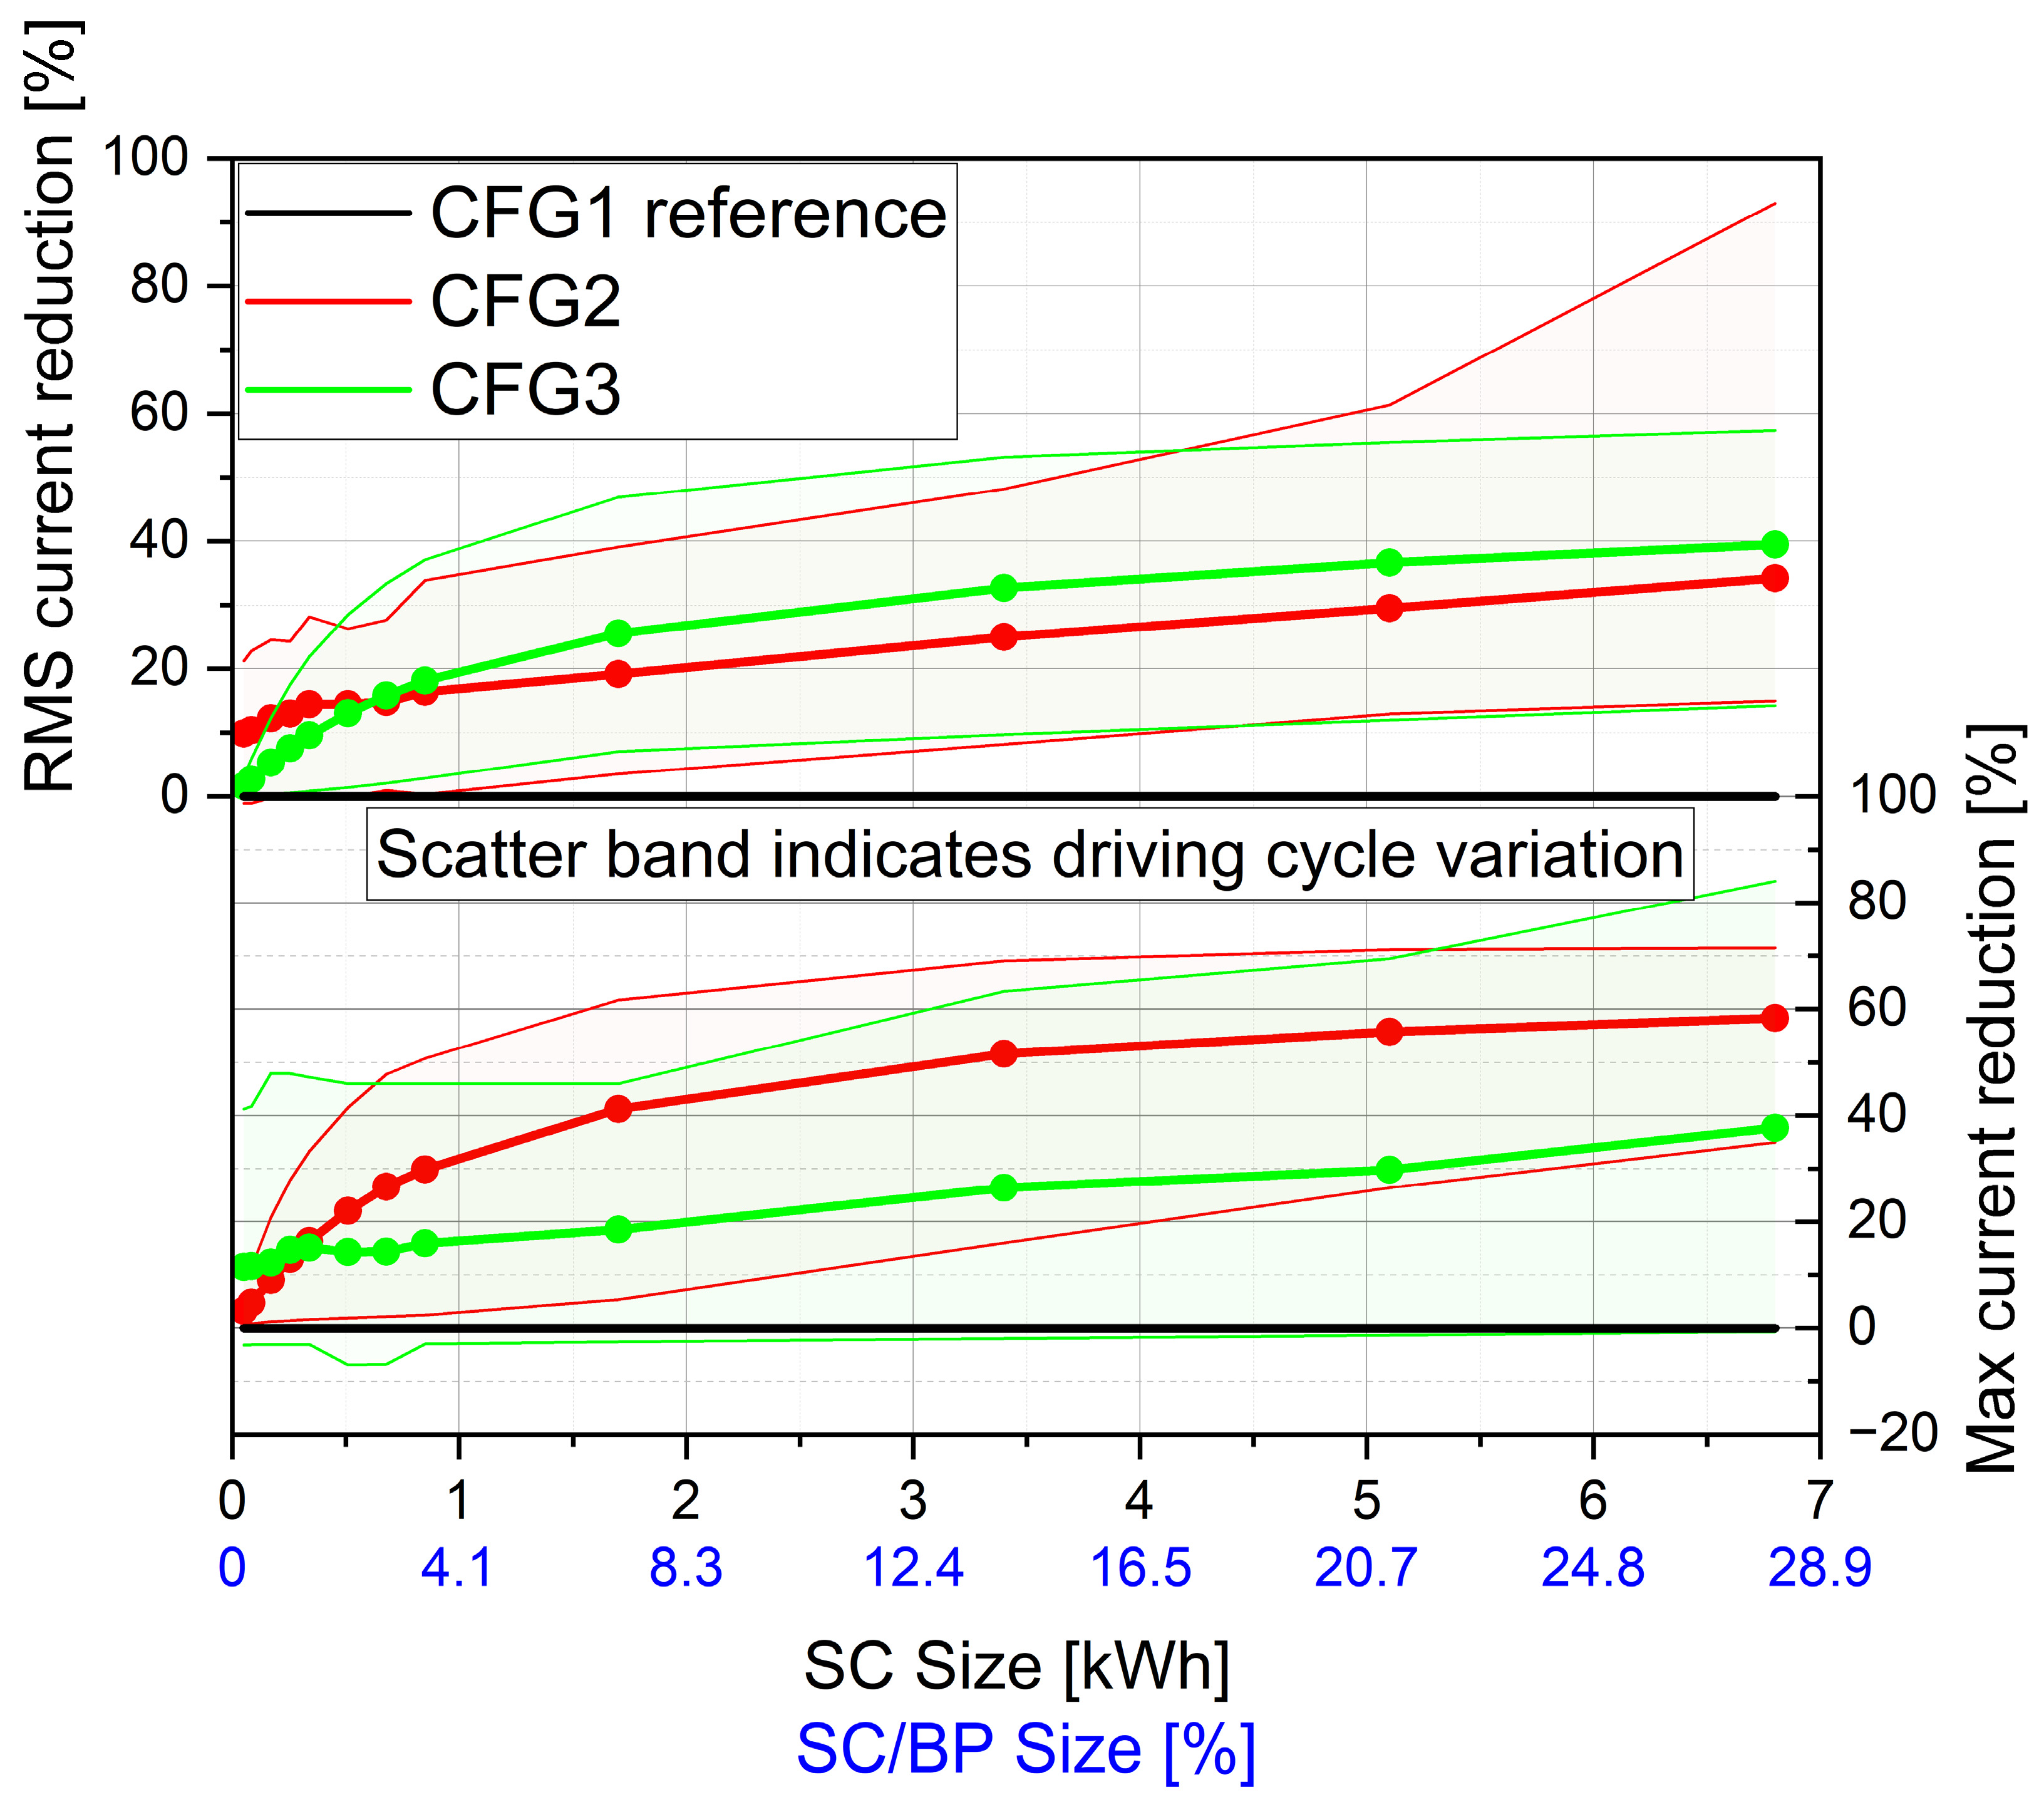
Figure 13. The non-optimality of the EMS was also confirmed by the average maximum current that varied with the SC size in Figure 15, in which for SCs greater than 0.7 kWh, the CFG2 performed better.
The minimum current (i.e., BP charging) in Figure 13 shows that the proposed EMS had higher minimum values with respect to CFG2. The minimum currents were linked to regenerative breaking conditions, so the CFG3 was more effective at recharging the SC when the EM was in braking mode. As previously discussed, this can effectively improve the vehicle energy efficiency. However, the more irregular trend of CFG3 is again a suggestion that the proposed strategy can be improved.
The RMS current parameter was typically assessed for performance evaluation in the case of HESS [50]. Figure 15 shows the trends of the mean RMS and peak current reductions for both topologies. The trends between the two configurations were similar. The CFG2, due to its uncontrolled behaviour, had a smoother trend, while CFG3 showed some discontinuities. These were due to adopting the same tuning parameters for all the investigated SC sizes adopted, which could result in a non-optimal SC use. The CFG2 avoided the BP current peaks for all the explored SC ranges in every condition. The differences were negligible for SC sizes smaller than 0.3 kWh. For larger SC sizes and above 6.8 kWh, the average peak reduction was 56% and 37% for CFG2 and CFG3, respectively.
The RMS reduction for CFG3 was usually higher than for CFG2. However, for some specific SC sizes, the CFG2 performed better. This was due to the rule-based strategy of CFG3, which was not based on optimal control theory. Reductions of 33% and 46% were achieved for CFG2 and CFG3, respectively, aligned with the literature results. In fact, Vulturescu reported that the RMS current of the BP was reduced from 40 A to about 15 A (i.e., 63%) under the Artemis driving cycle [42].
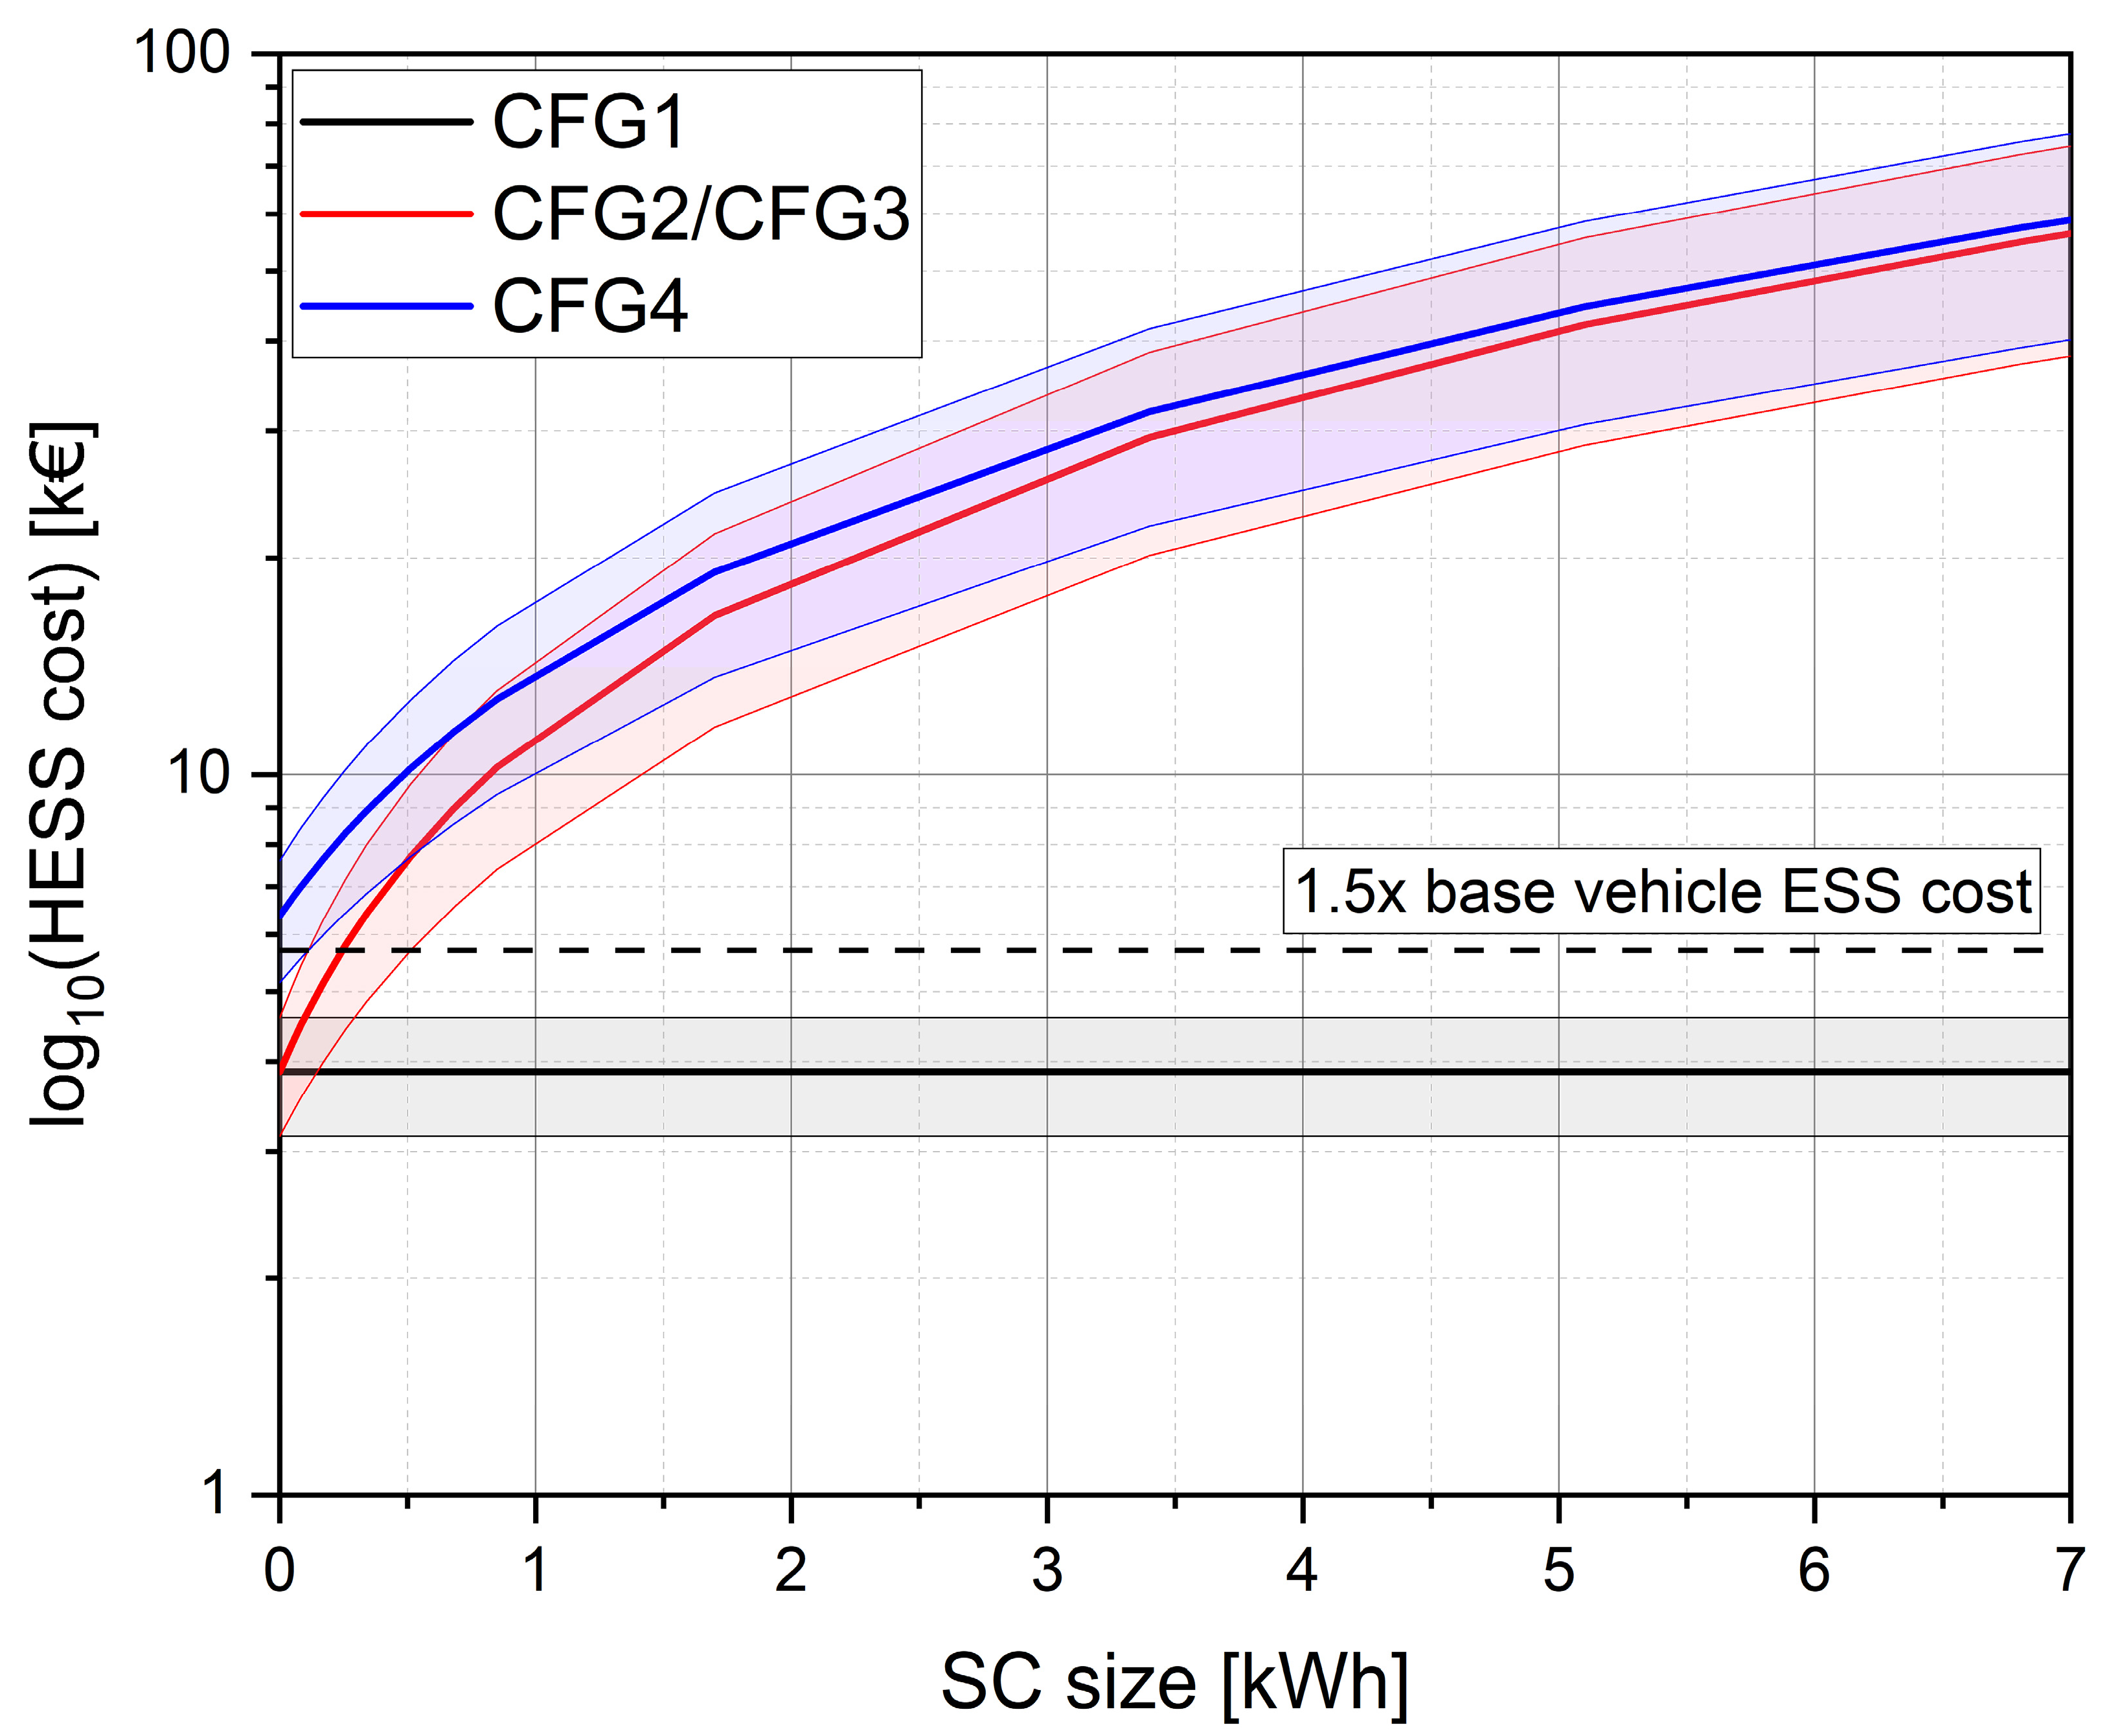
Finally, a cost assessment was carried out and reported in Figure 16. The analysis shown relied on the assumption of converter and battery pack costs discussed in Section 2 and a cost of SC in the range of 5–10 k€ [51]. The control unit development and integration cost were not included. A logarithmic scale was used on the y-axis to better highlight the cost differences with smaller SC sizes. The scatter band indicated the uncertainty interval linked to the cost range assumed for the various components of the HESS system.
As discussed, a fully active HESS costs at least double the BP cost for a passenger car application. Limiting the cost of the HESS to 1.5 times the BP one, both for the passive and semi-active topologies, the maximum capacity of the SC could be 0.25 kWh, adopting the cost limit for one. However, as reported in Figure 12, the latter assures about a seven times better battery ageing and three times Ohmic loss reductions. At the same time, it also has some margin for improvement with more sophisticated control strategies. So, in conclusion, from the analysis carried out, it is possible to assert that CFG2 is preferable to CFG1 due to better performances from both the battery ageing, energy loss, and cost perspectives.

4. Conclusions

Two BS-HESS topologies were investigated and compared to a reference BEV platform. A vehicle model was developed and validated based on the literature-available experimental data. The validation procedure showed that the results lay within a tolerance band of ±5% with reference to the experimental data. The obtained results referred to a generic BS-HESS-equipped vehicle. More tailored submodels and data for their validation should be available in the case of more specific applications or case studies. Thus, attention should be paid in the case that slight improvements are expected only. The tests included a wide range of vehicle missions. Key parameters were analysed and compared in terms of the current, battery ageing, and energy consumption. The main outcomes are:
  • Real driving conditions showed a higher battery ageing with respect to homologation driving cycles;
  • Passive topology with the largest SC (6.8 kWh) mitigated the battery ageing by about 0.5%. Passive topology with a lower SC size (0.17 kWh) reduced the vehicle energy consumption by about 2.5% and mitigated the battery ageing by about 0.3%;
  • Semi-active topology with a rule-based control strategy and SC size in the range of 1–4% of the BP reduced the RMS current by up to 20% compared to the baseline and reduced up to 10 times the ageing compared to the passive topology;
  • The semi-active topology assured higher performances, also setting a cost limit of the BS-HESS due to the better utilisation of small SCs. The passive one was more effective at reducing the maximum peak currents.
The passive topology did not perform better in terms of the performance and performance-to-cost ratio, but its application was easier. The performance of the semi-active topology can be further improved by adopting optimal control-based strategies. However, their adoption is limited by the costs of the SC. Future developments will assess the BS-HESS performance by implementing a more detailed battery ageing model and advanced control strategies under development, such as, the MPC.

Author Contributions

Conceptualisation, M.P. and G.D.B.; methodology, M.P. and B.S.; software, M.P.; validation, M.P.; formal analysis, M.P. and B.S.; investigation, M.P.; data curation, M.P.; writing—original draft preparation, M.P. and B.S.; writing—review and editing, M.P. and G.D.B.; visualisation, M.P.; supervision, F.D.N., A.G. and G.D.B.; project administration, A.G. and G.D.B. All authors have read and agreed to the published version of the manuscript.

Funding

This research received no external funding.

Institutional Review Board Statement

Not applicable.

Informed Consent Statement

Not applicable.

Data Availability Statement

The data presented in this study are available on request from the corresponding author.

Acknowledgments

The authors would like to thank Teoresi Group for providing technical details for the model development.

Conflicts of Interest

Authors declare no conflict of interest.

Abbreviations

ANL Argonne National Laboratory
BEVsBattery Electric Vehicles
BP Battery Pack
BS-HESS Battery Supercapacitor Hybrid Energy Storage System
COP27Conference of the Parties of the United Nations Framework Convention on Climate Change
DoDDeep-of-Discharge
EMElectric Motor
EMSEnergy Management Strategy
EVsElectric Vehicles
ESS Energy Storage Systems
GHG Greenhouse Gases
GWPGlobal Warming Potential
HESS Hybrid Energy Storage Systems
ICEVsInternal Combustion Engine Vehicles
KPIKey Performance Indicator
LCALife Cycle Analysis
MIMO Multi Input Multi Output
MPC Model Predictive Control
OCVOpen Circuit Voltage
PMSM Permanent Magnet Synchronous Motor
RMS Root Mean Square
SC Supercapacitors
SoCState of Charge
VSIVoltage-Source Inverter
xEVs Electrified Vehicles

References

  1. Goppelt, G. Electrification by 2030—The OEMs’ Plans. MTZ Worldw. 2022, 83, 8–13. [Google Scholar] [CrossRef]
  2. COP26 Goals. Available online: https://ukcop26.org/cop26-goals/ (accessed on 24 May 2022).
  3. Shafique, M.; Azam, A.; Rafiq, M.; Luo, X. Life Cycle Assessment of Electric Vehicles and Internal Combustion Engine Vehicles: A Case Study of Hong Kong. Res. Transp. Econ. 2022, 91, 101112. [Google Scholar] [CrossRef]
  4. Zheng, G.; Peng, Z. Life Cycle Assessment (LCA) of BEV’s Environmental Benefits for Meeting the Challenge of ICExit (Internal Combustion Engine Exit). Energy Rep. 2021, 7, 1203–1216. [Google Scholar] [CrossRef]
  5. Kawamoto, R.; Mochizuki, H.; Moriguchi, Y.; Nakano, T.; Motohashi, M.; Sakai, Y.; Inaba, A. Estimation of CO2 Emissions of Internal Combustion Engine Vehicle and Battery Electric Vehicle Using LCA. Sustainability 2019, 11, 2690. [Google Scholar] [CrossRef] [Green Version]
  6. Lai, X.; Chen, Q.; Tang, X.; Zhou, Y.; Gao, F.; Guo, Y.; Bhagat, R.; Zheng, Y. Critical Review of Life Cycle Assessment of Lithium-Ion Batteries for Electric Vehicles: A Lifespan Perspective. eTransportation 2022, 12, 100169. [Google Scholar] [CrossRef]
  7. Wikner, E.; Thiringer, T. Extending Battery Lifetime by Avoiding High SOC. Appl. Sci. 2018, 8, 1825. [Google Scholar] [CrossRef] [Green Version]
  8. Helmers, E.; Marx, P. Electric Cars: Technical Characteristics and Environmental Impacts. Environ. Sci. Eur. 2012, 24, 14. [Google Scholar] [CrossRef] [Green Version]
  9. Dong, Z.; Zhang, Z.; Li, Z.; Li, X.; Qin, J.; Liang, C.; Han, M.; Yin, Y.; Bai, J.; Wang, C.; et al. A Survey of Battery–Supercapacitor Hybrid Energy Storage Systems: Concept, Topology, Control and Application. Symmetry 2022, 14, 1085. [Google Scholar] [CrossRef]
  10. Shi, J.; Xu, B.; Shen, Y.; Wu, J. Energy Management Strategy for Battery/Supercapacitor Hybrid Electric City Bus Based on Driving Pattern Recognition. Energy 2022, 243, 122752. [Google Scholar] [CrossRef]
  11. Zhang, L.; Hu, X.; Wang, Z.; Sun, F.; Dorrell, D.G. A Review of Supercapacitor Modeling, Estimation, and Applications: A Control/Management Perspective. Renew. Sustain. Energy Rev. 2018, 81, 1868–1878. [Google Scholar] [CrossRef]
  12. Tehrani, K.; Maurice, O. A Cyber Physical Energy System Design (CPESD) for Electric Vehicle Applications. In Proceedings of the 2017 12th System of Systems Engineering Conference (SoSE), Waikoloa, HI, USA, 18–21 June 2017; pp. 1–6. [Google Scholar]
  13. Chong, L.W.; Wong, Y.W.; Rajkumar, R.K.; Isa, D. Modelling and Simulation of Standalone PV Systems with Battery-Supercapacitor Hybrid Energy Storage System for a Rural Household. Energy Procedia 2017, 107, 232–236. [Google Scholar] [CrossRef]
  14. Song, Z.; Li, J.; Hou, J.; Hofmann, H.; Ouyang, M.; Du, J. The Battery-Supercapacitor Hybrid Energy Storage System in Electric Vehicle Applications: A Case Study. Energy 2018, 154, 433–441. [Google Scholar] [CrossRef]
  15. Musa, A.; Pipicelli, M.; Spano, M.; Tufano, F.; De Nola, F.; Di Blasio, G.; Gimelli, A.; Misul, D.A.; Toscano, G. A Review of Model Predictive Controls Applied to Advanced Driver-Assistance Systems. Energies 2021, 14, 7974. [Google Scholar] [CrossRef]
  16. Golchoubian, P.; Azad, N.L. Real-Time Nonlinear Model Predictive Control of a Battery–Supercapacitor Hybrid Energy Storage System in Electric Vehicles. IEEE Trans. Veh. Technol. 2017, 66, 9678–9688. [Google Scholar] [CrossRef]
  17. Bemporad, A.; Bernardini, D.; Long, R.; Verdejo, J. Model Predictive Control of Turbocharged Gasoline Engines for Mass Production; SAE International: Warrendale, PV, USA, 2018. [Google Scholar]
  18. Kouchachvili, L.; Yaïci, W.; Entchev, E. Hybrid Battery/Supercapacitor Energy Storage System for the Electric Vehicles. J. Power Sources 2018, 374, 237–248. [Google Scholar] [CrossRef]
  19. Carter, R.; Cruden, A.; Hall, P.J. Optimizing for Efficiency or Battery Life in a Battery/Supercapacitor Electric Vehicle. IEEE Trans. Veh. Technol. 2012, 61, 1526–1533. [Google Scholar] [CrossRef]
  20. Zhu, T.; Wills, R.G.A.; Lot, R.; Kong, X.; Yan, X. Optimal Sizing and Sensitivity Analysis of a Battery-Supercapacitor Energy Storage System for Electric Vehicles. Energy 2021, 221, 119851. [Google Scholar] [CrossRef]
  21. Sreedhar, S.; Siegel, J.B.; Choi, S. Topology Comparison for 48V Battery-Supercapacitor Hybrid Energy Storage System. IFAC-PapersOnLine 2017, 50, 4733–4738. [Google Scholar] [CrossRef]
  22. Castaings, A.; Lhomme, W.; Trigui, R.; Bouscayrol, A. Practical Control Schemes of a Battery/Supercapacitor System for Electric Vehicle. IET Electr. Syst. Transp. 2016, 6, 20–26. [Google Scholar] [CrossRef]
  23. Rezaei, H.; Abdollahi, S.E.; Abdollahi, S.; Filizadeh, S. Energy Management Strategies of Battery-Ultracapacitor Hybrid Storage Systems for Electric Vehicles: Review, Challenges, and Future Trends. J. Energy Storage 2022, 53, 105045. [Google Scholar] [CrossRef]
  24. Salem, M.; Elnaggar, M.; Saad, M.S.; Fattah, H.A.A. Energy Management System for Fuel Cell-Battery Vehicles Using Multi Objective Online Optimization. IEEE Access 2022, 10, 40629–40641. [Google Scholar] [CrossRef]
  25. Energy Systems D3 2015 Volkswagen E-Golf|Argonne National Laboratory. Available online: https://www.anl.gov/es/energy-systems-d3-2015-volkswagen-egolf (accessed on 28 April 2022).
  26. 2015 Volkswagen E-Golf Limited Edition—Specifications. Available online: https://www.evspecifications.com/en/model/640172 (accessed on 24 January 2023).
  27. Cavanini, L.; Majecki, P.; Grimble, M.J.; Sasikumar, L.V.; Li, R.; Hillier, C. Processor-In-the-Loop Demonstration of MPC for HEVs Energy Management System. IFAC PapersOnLine 2022, 55, 173–178. [Google Scholar] [CrossRef]
  28. Giardiello, G.; de Nola, F.; Pipicelli, M.; Troiano, A.; Parascandolo, F.; Gimelli, A.; Santoro, D.; Sessa, B. Comparative Analysis on Fuel Consumption Between Two Online Strategies for P2 Hybrid Electric Vehicles: Adaptive-RuleBased (A-RB) vs. Adaptive-Equivalent Consumption Minimization Strategy (A-ECMS); SAE International: Warrendale, PV, USA, 2022. [Google Scholar] [CrossRef]
  29. Yu, Z.; Huai, R.; Xiao, L. State-of-Charge Estimation for Lithium-Ion Batteries Using a Kalman Filter Based on Local Linearization. Energies 2015, 8, 7854–7873. [Google Scholar] [CrossRef] [Green Version]
  30. Carmeli, M.S.; Toscani, N.; Mauri, M. Electrothermal Aging Model of Li-Ion Batteries for Vehicle-to-Grid Services Evaluation. Electronics 2022, 11, 1042. [Google Scholar] [CrossRef]
  31. Merkle, L.; Pöthig, M.; Schmid, F. Estimate E-Golf Battery State Using Diagnostic Data and a Digital Twin. Batteries 2021, 7, 15. [Google Scholar] [CrossRef]
  32. Suri, G.; Onori, S. A Control-Oriented Cycle-Life Model for Hybrid Electric Vehicle Lithium-Ion Batteries. Energy 2016, 96, 644–653. [Google Scholar] [CrossRef]
  33. Jin, L.; Zheng, Y.; Li, J.; Liu, Y. A Study of Novel Regenerative Braking System Based on Supercapacitor for Electric Vehicle Driven by In-Wheel Motors. Adv. Mech. Eng. 2015, 7, 1687814015573762. [Google Scholar] [CrossRef] [Green Version]
  34. Zou, Z.; Cao, J.; Cao, B.; Chen, W. Evaluation Strategy of Regenerative Braking Energy for Supercapacitor Vehicle. ISA Trans. 2015, 55, 234–240. [Google Scholar] [CrossRef] [PubMed]
  35. Partridge, J.; Abouelamaimen, D.I. The Role of Supercapacitors in Regenerative Braking Systems. Energies 2019, 12, 2683. [Google Scholar] [CrossRef] [Green Version]
  36. Quirama, L.F.; Giraldo, M.; Huertas, J.I.; Tibaquirá, J.E.; Cordero-Moreno, D. Main Characteristic Parameters to Describe Driving Patterns and Construct Driving Cycles. Transp. Res. D Transp. Environ. 2021, 97, 102959. [Google Scholar] [CrossRef]
  37. Gebisa, A.; Gebresenbet, G.; Gopal, R.; Nallamothu, R.B. Driving Cycles for Estimating Vehicle Emission Levels and Energy Consumption. Future Transp. 2021, 1, 615–638. [Google Scholar] [CrossRef]
  38. Baure, G.; Dubarry, M. Synthetic vs. Real Driving Cycles: A Comparison of Electric Vehicle Battery Degradation. Batteries 2019, 5, 42. [Google Scholar] [CrossRef] [Green Version]
  39. Andreev, M.K. An Overview of Supercapacitors as New Power Sources in Hybrid Energy Storage Systems for Electric Vehicles. In Proceedings of the 2020 XI National Conference with International Participation (ELECTRONICA), Sofia, Bulgaria, 23–24 July 2020; pp. 1–4. [Google Scholar]
  40. Alatalo, M. Module Size Investigation on Fast Chargers for BEV; Chalmers University of Technology: Gothenburg, Sweden, 2018. [Google Scholar]
  41. Song, Z.; Hofmann, H.; Li, J.; Han, X.; Zhang, X.; Ouyang, M. A Comparison Study of Different Semi-Active Hybrid Energy Storage System Topologies for Electric Vehicles. J. Power Sources 2015, 274, 400–411. [Google Scholar] [CrossRef]
  42. Bhattacharyya, P.; Banerjee, A.; Sen, S.; Giri, S.K.; Sadhukhan, S. A Modified Semi-Active Topology for Battery-Ultracapacitor Hybrid Energy Storage System for EV Applications. In Proceedings of the 2020 IEEE International Conference on Power Electronics, Smart Grid and Renewable Energy (PESGRE2020), Cochin, India, 2–4 January 2020; pp. 1–6. [Google Scholar]
  43. Parvini, Y.; Siegel, J.B.; Stefanopoulou, A.G.; Vahidi, A. Supercapacitor Electrical and Thermal Modeling, Identification, and Validation for a Wide Range of Temperature and Power Applications. IEEE Trans. Ind. Electron. 2016, 63, 1574–1585. [Google Scholar] [CrossRef]
  44. Xu, Y.; Zhang, H.; Yang, F.; Tong, L.; Yan, D.; Yang, Y.; Ren, J.; Ma, L.; Wang, Y. State of Charge Estimation of Supercapacitors Based on Multi-Innovation Unscented Kalman Filter under a Wide Temperature Range. Int. J. Energy Res. 2022, 46, 16716–16735. [Google Scholar] [CrossRef]
  45. Ostadi, A.; Kazerani, M. A Comparative Analysis of Optimal Sizing of Battery-Only, Ultracapacitor-Only, and Battery–Ultracapacitor Hybrid Energy Storage Systems for a City Bus. IEEE Trans. Veh. Technol. 2015, 64, 4449–4460. [Google Scholar] [CrossRef]
  46. Castaings, A.; Lhomme, W.; Trigui, R.; Bouscayrol, A. Energy Management of a Multi-Source Vehicle by λ-Control. Appl. Sci. 2020, 10, 6541. [Google Scholar] [CrossRef]
  47. Mesbahi, T.; Khenfri, F.; Rizoug, N.; Bartholomeüs, P.; Moigne, P.L. Combined Optimal Sizing and Control of Li-Ion Battery/Supercapacitor Embedded Power Supply Using Hybrid Particle Swarm–Nelder–Mead Algorithm. IEEE Trans. Sustain. Energy 2017, 8, 59–73. [Google Scholar] [CrossRef]
  48. Sikha, G.; Popov, B.N. Performance Optimization of a Battery–Capacitor Hybrid System. J. Power Sources 2004, 134, 130–138. [Google Scholar] [CrossRef]
  49. De Castro, R.; Pinto, C.; Araújo, R.E.; Melo, P.; Freitas, D. Optimal Sizing and Energy Management of Hybrid Storage Systems. In Proceedings of the 2012 IEEE Vehicle Power and Propulsion Conference, Seoul, Republic of Korea, 9–12 October 2012; pp. 321–326. [Google Scholar]
  50. Cabrane, Z.; Ouassaid, M.; Maaroufi, M. Analysis and Evaluation of Battery-Supercapacitor Hybrid Energy Storage System for Photovoltaic Installation. Int. J. Hydrog. Energy 2016, 41, 20897–20907. [Google Scholar] [CrossRef]
  51. Libich, J.; Máca, J.; Vondrák, J.; Čech, O.; Sedlaříková, M. Supercapacitors: Properties and Applications. J. Energy Storage 2018, 17, 224–227. [Google Scholar] [CrossRef]
Figure 1. Comparison of SC and BP energy and power density at cell, module, and pack level.
Vehicles 05 00024 g001
Figure 2. Adopted vehicle architecture and analysis methodology.
Vehicles 05 00024 g002
Figure 3. Fitting of the OCV parameters. The curves obtained were adopted for the numerical model.
Vehicles 05 00024 g003
Figure 4. Experimental driving cycle explored.
Vehicles 05 00024 g004
Figure 5. SC OCV vs. SoC curve adopted.
Vehicles 05 00024 g005
Figure 6. A schematic layout of possible BS-HESSs. CFG stands for configuration.
Vehicles 05 00024 g006
Figure 7. Operating mode investigated. The arrows indicate the power flow direction between components.
Vehicles 05 00024 g007
Figure 8. The state flow chart shows the state and the used transition rules.
Vehicles 05 00024 g008
Figure 9. Workflow of the proposed analysis.
Vehicles 05 00024 g009
Figure 10. Comparison of experimental and simulation data under four different driving cycles.
Vehicles 05 00024 g010
Figure 11. Motor efficiency map. The scatter points are the operating points of the driving cycles performed during the validation step.
Vehicles 05 00024 g011
Figure 12. SC size effect on battery ageing and ohmic loss reduction among the configurations and referenced to CFG1. The results are averaged among all the considered driving cycles.
Vehicles 05 00024 g012
Figure 13. BP current indicators of the CFG2 and CFG3 on different driving cycles.
Vehicles 05 00024 g013
Figure 14. Comparison of battery pack current in 61511002 test case for CFG1, CFG2, and CFG3.
Vehicles 05 00024 g014
Figure 15. Relative change in RMS and maximum current, considering the CFG1 as a reference, for both BS-HESS configurations varying SC size.
Vehicles 05 00024 g015
Figure 16. Cost comparison of the different BS-HESS topologies varying SC size.
Vehicles 05 00024 g016
Table 1. Main vehicle specifications [25,26].
ParameterValue
Curb weight [kg]1700
Frontal area A [m2]2.23
Drag coefficient Cd [-]0.29
Tire205/55 R16
Tire rolling resistance Cr, Cr1, Cr2 [-]1.112 × 10⁻², 3.784 × 10⁻⁴, −1.15 × 10⁻⁵
Inverter type3-phase voltage source inverters (VSI)
Electric Motor typepermanent magnet synchronous motor (PMSM)
Electric Motor max speed [rpm]12,000
Electric motor max torque [Nm]270
Battery nominal voltage [V]323
Battery capacity [Ah]75
Final drive ratio [-]9.8
Table 2. Driving cycles used for validation.
Test Name DescriptionSlope [%]Windows PositionA/C
61511002Steady State Speed0OpenOff
61511003Steady State Speed6OpenOff
61511006Passing manoeuvres0,3,6OpenOff
61511007High slope conditions25OpenOff
61511009Mixed0OpenOff
61511010UDDS0OpenOff
61511020Mixed0ClosedOn
Table 3. Battery ageing parameter values.
VariableValueVariableValue
A g 60 B f 2.78 × 10⁻⁴
B g 27 C f 0.57
C g 1 A h −30,725
A f 0 B h 8.31
Table 4. Characteristic parameters of the driving cycle.
Test NameDuration [s]Distance [km]Mean/Max Speed [km/h]Mean/Max acc. [m/s2]Pi/Pc/Pa/Pd [%]
6151100255010.066/1290.2/1.94/78/9/9
6151100355010.066/1290.2/1.94/78/9/9
6151100681211.771/1310.6/2.413/38/23/26
615110071141.033/660.4/1.826/21/29/24
61511009483053.540/1300.4/3.827/25/25/23
61511010201850.290/1300.3/4.38/69/11/12
61511020483053.540/1300.4/3.827/25/25/23
EXP13082.523/510.4/1.028/28/22/22
EXP2696049.626/570.3/1.64/30/36/30
EXP310807.525/510.4/1.911/28/34/27
Table 5. Tuning parameter of the rule-based controller.
ParameterValue
SoCSC,min [-]0.35
SoCSC,max [-]0.95
TP [kW]15
TP,max [kW]35
PSC,charging [kW]8
Table 6. Validation comparison among experimental and simulation data.
Test Name Final SoC (Exp/Sim)ΔSoC [%]Consumed Energy (Exp/Sim) [kWh]Energy Error [%]Max Speed Error [km/h]
6151100287.2/86.7−0.51.40/1.507.70.11
6151100368.8/68.5−0.34.33/4.33 −0.20.10
6151100626.8/23.2−3.64.76/4.882.30.35
6151100720/19.8−0.21.41/1.33−5.20.14
6151100967.2/66.8−0.46.94/6.960.30.12
6151101033.2/28.8−4.48.15/8.565.10.38
6151102031.6/31.60.014.77/14.740.060.25
Disclaimer/Publisher’s Note: The statements, opinions and data contained in all publications are solely those of the individual author(s) and contributor(s) and not of MDPI and/or the editor(s). MDPI and/or the editor(s) disclaim responsibility for any injury to people or property resulting from any ideas, methods, instructions or products referred to in the content.

