Article

Influences on Vibration Load Testing Levels for BEV Automotive Battery Packs

1
Department of Automotive and Aeronautical Engineering, Faculty of Engineering and Computer Science, Hamburg University of Applied Sciences, 20099 Hamburg, Germany
2
Voltabox AG, 33100 Paderborn, Germany
*
Author to whom correspondence should be addressed.
Vehicles 2023, 5(2), 446-463; https://doi.org/10.3390/vehicles5020025
Submission received: 22 March 2023 / Revised: 15 April 2023 / Accepted: 18 April 2023 / Published: 20 April 2023
(This article belongs to the Topic Vehicle Dynamics and Control)

Abstract

:
Battery Electric Vehicles (BEVs) have an increasingly large share of the vehicle market. To ensure a safe and long operation of the mostly large underfloor-mounted traction batteries, they must be developed and tested in advance under realistic conditions. Current standards often do not provide sufficiently realistic requirements for environmental and lifetime testing, as these are mostly based on data measured on cars with an Internal Combustion Engine (ICE). Prior to this work, vibration measurements were performed on two battery-powered electric vehicles and a battery-powered commercial mini truck over various road surfaces and other influences. The measurement data are statistically evaluated so that a statement can be made about the influence of various parameters on the vibrations measured at the battery pack housing and the scatter of the influencing parameters. By creating a load profile based on the existing measurement data, current standards can be questioned and new insights gained in the development of a vibration profile for the realistic testing of battery packs for BEVs.

1. Introduction

The traction battery is the most expensive single component in battery-powered electric vehicles. The high-voltage battery pack installed in an electric car can differ in size, shape, weight and structure depending on the intended use and the type of the vehicle [1]. In [2,3], batteries are divided into three categories (see Table 1). Sometimes the vehicles’ battery packs are also referred to as Rechargeable Energy Storage Systems (RESS), but that term is often used for stationary systems, which do not experience such vibration levels as the battery packs used in vehicles.
The scope of this paper is the determination of vibration loads acting on a category 3 battery pack of a BEV. New innovative concepts usually focus on the integration of the battery in the vehicle [4]. There are two different general concepts, “cell2module” and “cell2car” (see Figure 1). The “cell2module” or “module2pack” approach is to connect single cells in modules.
The modules are combined in a battery pack that is installed in the underfloor section of the vehicle. The advantage of this approach is that the battery pack is very stiff, resulting in less mechanical coupling to the vehicle for more yielding interfaces and hence less stress on the individual cells. This approach offers the possibility of testing the individual subsystems at different levels and thus detecting development errors at an early stage in the development process. The disadvantages of this approach are higher cost, more weight, and lower capacity of the packs in terms of required installation space. In the “cell2car” approach, the individual cells are integrated directly into the underfloor section of the vehicle. This offers the possibility of using the installation space more efficiently. Integrating the cells directly into the underfloor structure also reduces costs for large-scale automotive vehicle productions. A disadvantage of this concept is the higher mechanical coupling with the vehicle due to the lower stiffness of the pack structures if designed for maximum capacity in a given space and weight target. Moreover, the loads acting on the individual cells are higher than in the differential approach [1].
The loads used in common testing standards were mostly measured on vehicles with an internal combustion engine (ICE) [4]. Often, as in [5], the longitudinal and the transverse motion are equated. In [6], all three axes are equated. Although there is no evidence for this ([4]), this simplification is typically made for smaller components to derive a conservative testing strategy that also works for other mounting orientations in the vehicle as well as for an easy, conservative and reproducible testing on various test setups over a broad range of components. Accelerations in the vertical axis are dominant in all types of vehicles [3]. Omitting the longitudinal and transverse axes entirely, as in [7], represents a simplification of the environmental conditions and is insufficient for a holistically realistic environmental simulation [4]. The standards [2,8] cover a frequency range from 5 to 200 Hz [5], only a frequency range from 10 to 190 Hz, and [7] only from 7 to 50 Hz. It has already been established that significant vibrations also occur outside the ranges specified by these standards [4]. Small electrical components installed in the battery pack are also excited by frequencies above 200 Hz [9]. As a result, it can be assumed that a design optimum for BEV battery packs has not been found given these insufficient requirements. Even if safety performance may be acceptable on an overall scale, the designs would then be oversized for the loads that actually occur during the life cycle [4].
Most EV fire accidents are caused by an Internal Short-Circuit (ISC)-induced Thermal Runaway (TR). Demanding mechanical environments are common reasons for battery ISC and TR (see also [10,11] for a more detailed description). It is hence of particular interest to find more realistic vibration requirements for design and testing of traction battery packs that allow for a better use of the still remaining optimization potential in current over-dimensioned designs. This contribution focuses on methods on how to derive more realistic vibration loads for life-time and fatigue testing. Data from some preliminary test sets are analyzed with statistical methods to derive a prospective vibration test level based on the boundary conditions set in this analysis. Such an application of a statistical analysis with a normal tolerance limit to derive a conservative Power Spectral Density curve for testing based on vibrations measured on BEV battery packs under varying influence parameters has not been found in the literature.

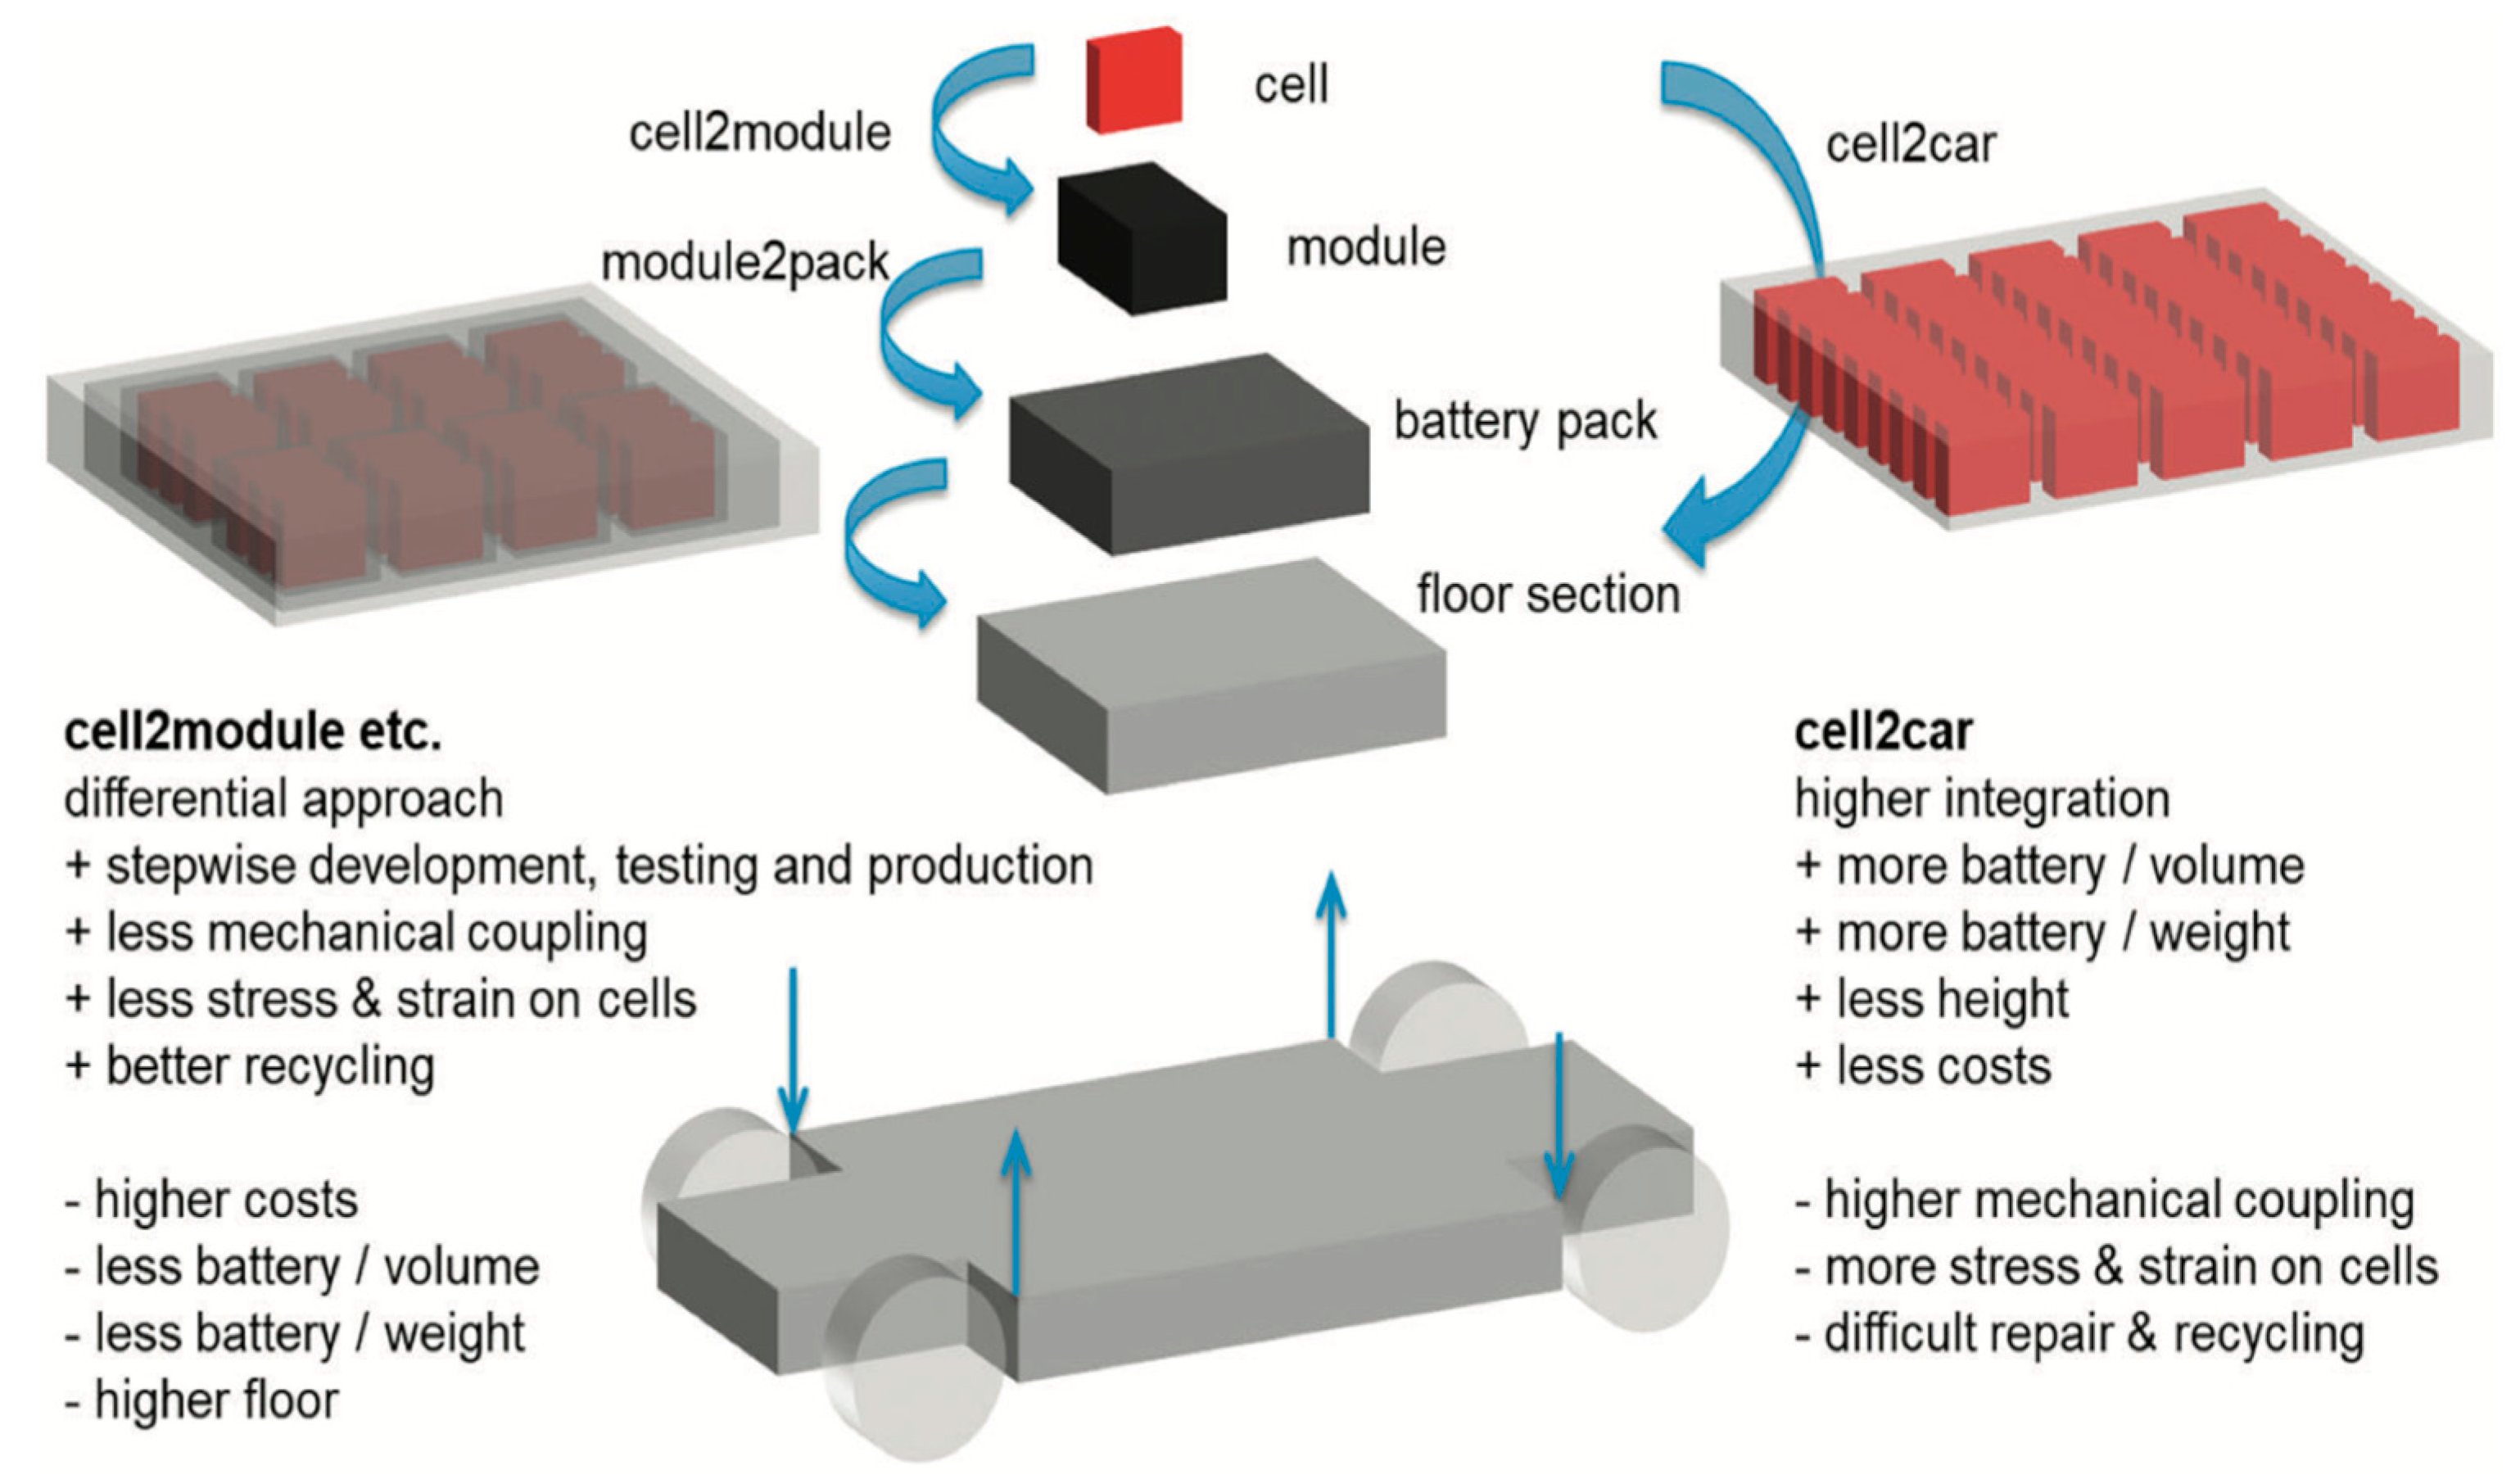
Economic Considerations for Design in Automotive and Other Mobile Applications

In contrast to the automotive industry, the Original Equipment Manufacturers (OEMs) of agricultural machines as well as the construction industry or other mobile machines have a wide range of technical and commercial challenges with the electrification of the vehicles.
From a commercial perspective, the sales volumes of these off-road vehicles distributed among a wide variety of vehicle manufacturers is relatively low. This means, if there is new technical solution found, a relatively small vehicle manufacturer has to handle a significant amount of battery design, especially if its vehicle portfolio includes a wide range of special vehicles. The low volumes of individual battery types with many variants complicate the commercial challenge of making vehicle costing as competitive as possible.
It is therefore advisable to use standardized and existing battery types that meet the technical challenges as far as possible. Economies of scale can be achieved by using as many as possible of the then selected battery over a wide range of vehicle categories.
The vehicle manufacturer’s minimum standards for the battery and the required certifications for the battery are usually provided by the battery manufacturers. In addition, the cooperation of vehicle and battery manufacturers is a must in the course of functional safety development. Off-road vehicle OEMs would be better positioned to consolidate their volumes on battery packs developed specifically for this purpose.
From a technical perspective, the OEMs of these specialty applications are mostly in the early stages of electrifying their vehicles. Furthermore, R&D resources are often driven by ICE powertrains due to their history. The change to now electric powertrains leads these manufacturers quickly into the situation of setting too high demands on battery packs, without considering the advantages of more efficient electric powertrains.
The in-house development of a battery pack based on the special requirements is understandable but not always efficient. There are at least three major challenges along the product life cycle that need to be positively addressed:
The first challenge is the development and certification complying to the respective standards of these battery systems. In the best case, this first step takes 12 months until the battery is ready for series production and prototyping. Furthermore, a mid-six-figure euro cost can be expected for the certification of a single system.
The second challenge is the industrialization phase of the battery system. In addition to reliable production processes, this requires an experienced team that can evaluate potential eventualities in advance and develop countermeasures. In addition to production quality and validation, production ramp-ups have to be supported by an experienced team in order to provide and manage target-oriented troubleshooting on site.
The third challenge is the supply of resources in the area of service as well as series development during the use phase at the end customer. In the special application of construction machines, agricultural machines or other niche applications, continuous service and engineering support must be supported by a development team. Furthermore, these special applications during customer use must be taken into account in the continuous improvement of the battery.
Battery recycling is not yet mandatory, but will be required by legislation in the near future. Although this is already part of the requirement at present, the highest possible recycling rate with low CO2 footprint use will only be fulfilled by very few.
Another cost-sensitive aspect of implementing BEV vehicles on a large scale is the charging and the needed charging infrastructure. Here, the costs for larger battery capacities for a longer driving range can be reduced with smart charging networks, where smaller batteries are needed. Moreover, using batteries as buffers to stabilize the power network are interesting applications playing into the overall cost balance. An economic approach to these challenges is found in [12,13]. This contribution, however, focuses on development and testing requirements for battery packs regarding its mechanical environments.
In summary, the development of a close-to-production battery is time-consuming—but the requirements for batteries in the automotive sector are often not suitable for off-road applications.
The manufacturers of these off-road vehicles to manufacturers of mobile machines must consolidate on existing, robust battery designs from established manufacturers. These established manufacturers have the resources and expertise to provide a suitable response to the challenges that will arise over the entire product life cycle. This expertise includes the design of battery systems for off-road applications, which often deviates from the requirements of the automotive industry. An illustrative example is shown in the following comparison of on-road and off-road vehicles.
The analysis of the statistical impact of varying influence parameters with the normal tolerance limit shown later can be used to define conservative but cost-effective requirements for design and certification testing over a wide range of possible applications.

2. Methods

The following chapter describes the basic methods and assumptions used for the analysis.

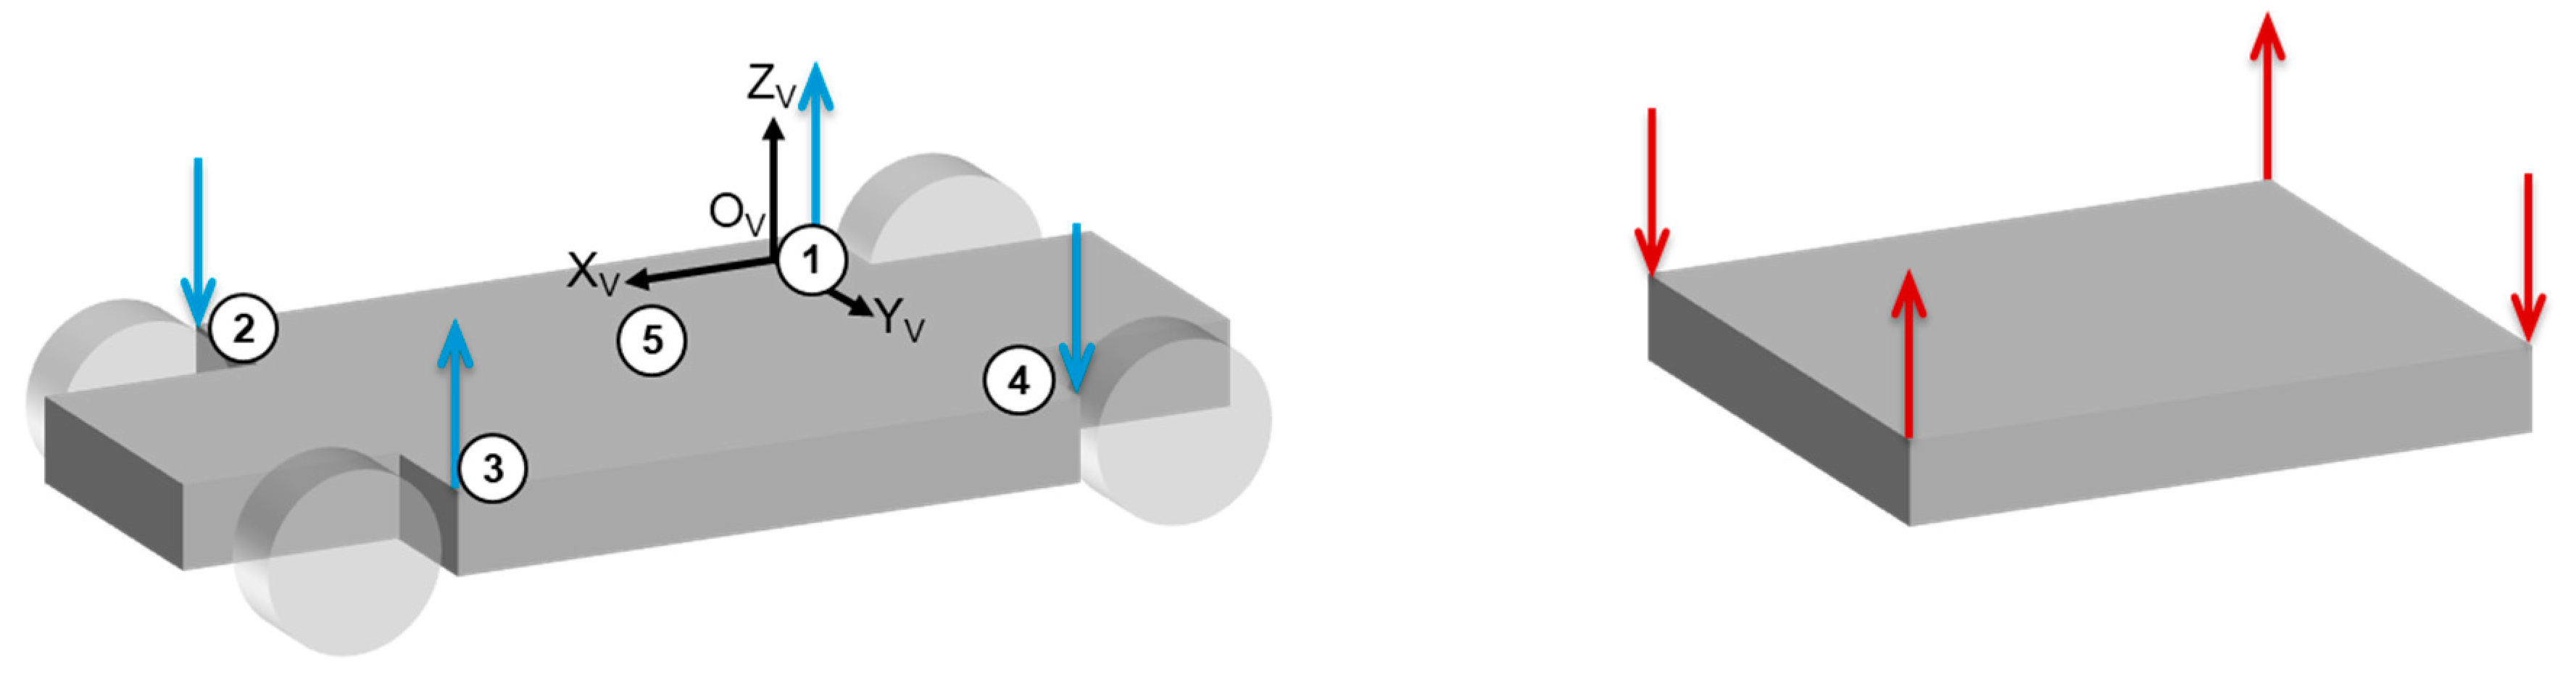
2.1. Movements in Time Domain

Rigid body movements of ground vehicles are widely described in the literature, i.e., [12]. In the case of a large traction battery mounted in the floor segment of a vehicle between the wheels, the main excitation input is coming from the wheel suspensions where the interaction with the inertial forces of the complete vehicle happens (see Figure 2 with the vehicle coordinate system, measurement points, movements and forces).
A description of general elastic deformation types of a simplified large traction battery in the floor segment of a vehicle body is described in Figure 3.

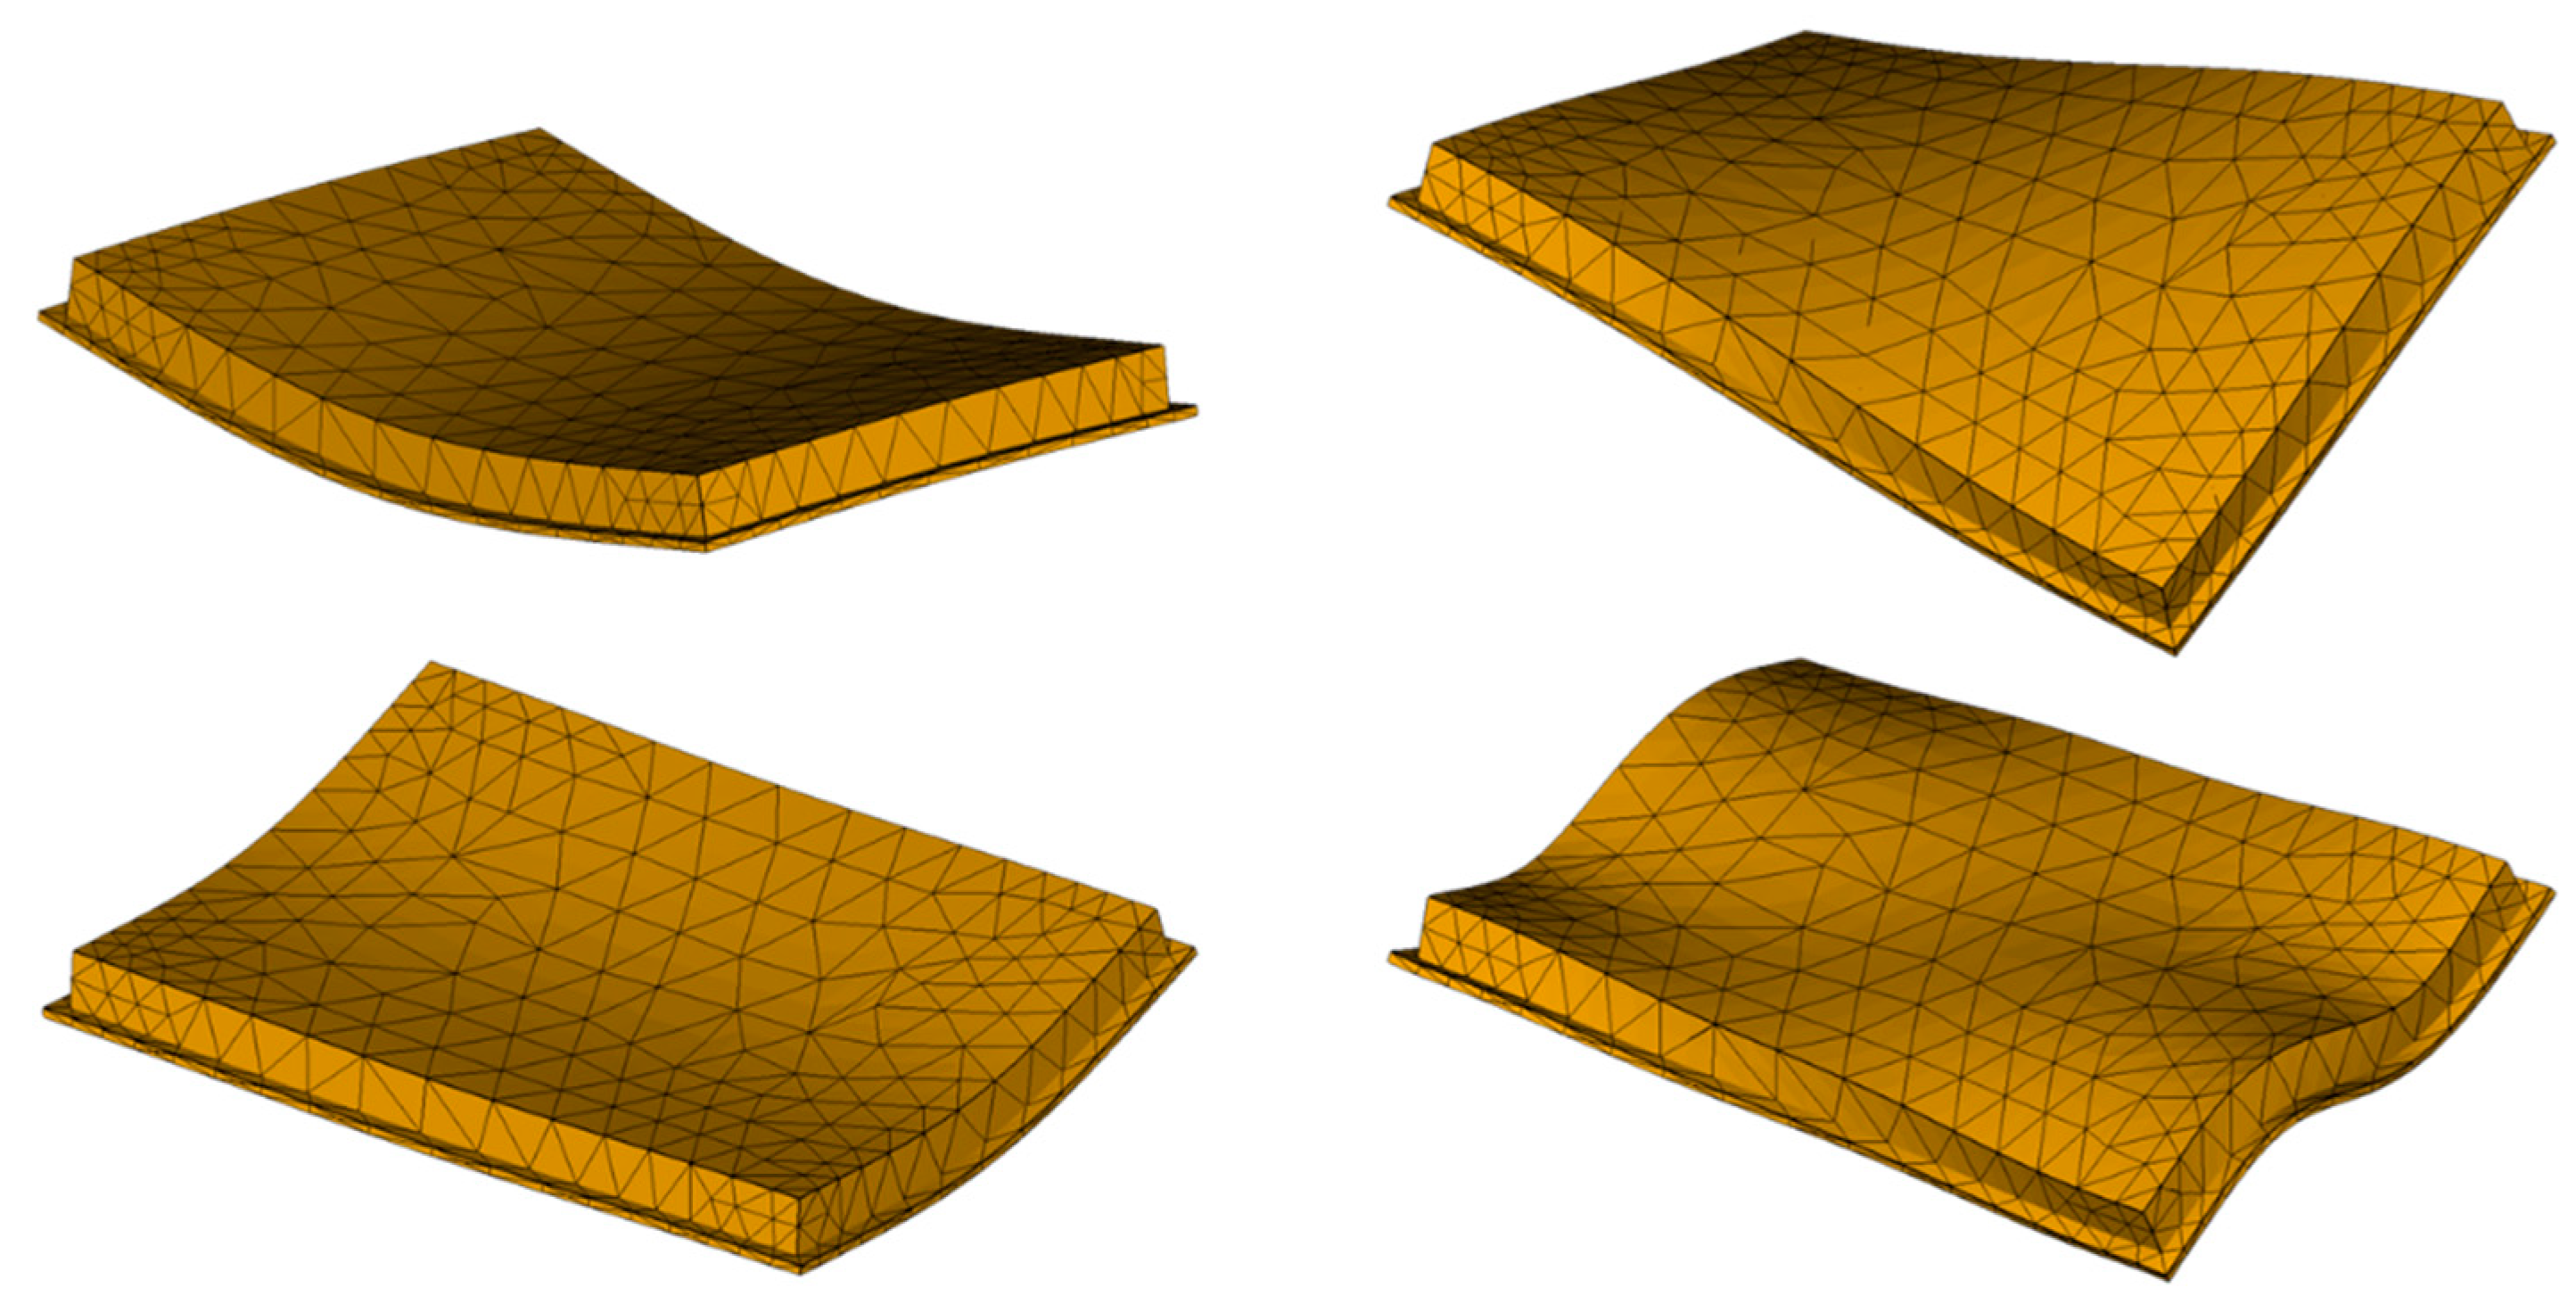
2.2. Comparison with Other Technical Solutions Regarding Mass and Stiffness

For the understanding of the main governing principles, the situation is simplified in the following way: the excitation to a quarter car is simplified to a vibrating mass behind a damper and a spring in parallel. They are excited by the road–vehicle interaction from road unevenness. Adding extra weight to the mass will decrease the movements in deflection, velocity or acceleration when this single-degree-of-freedom (SDOF) system is in isolation while the road unevenness causing the problem remains the same.
Hence, adding a larger and heavier battery to a car (i.e., for a longer range by a larger battery capacity) will decrease the acceleration experienced by the passenger in a general consideration when the influences of the rest of the vehicle and the road excitation are assumed to remain the same. That is a main reason for the difference in the acceleration levels of ISO 19453-6 Cat 1 for smaller mild hybrid battery packs and 2 for plug-in hybrid battery packs [2]. As the weight of a long-range battery pack can amount to 700 kg or even more in an automotive battery pack for premium long-distance travel BEVs, it constitutes a very significant part of the overall mass of the vehicle. It can be assumed that vibration levels are lower in these vehicles compared to a light short-distance two-seater BEV with a small battery and much smaller vehicle weight.
Other effects, such as the need for stiffer suspension when putting in heavier batteries, etc., is left aside at this point in this general set of assumptions, as it does not change the general dependance of influence and effect. The influence of the vehicle–battery interaction is also highlighted in the given ISO standard [2].
2 π f = k m
The quotient of stiffness k over mass m defines (after taking the square root) the resonance frequency f of a simple one-degree-of-freedom vibration system. The frequency range above the resonance is greatly reduced due to the isolation effect. A stiff suspension with low mass (i.e., a heavy-duty commercial truck with no cargo) leads to a higher resonance frequency, which lets a broader excitation range (below the rather high resonance frequency) through to the vehicle body because the isolation only takes effect at higher frequencies. A soft suspension with a very heavy battery pack (i.e., for long range travelling) will reduce the excitation input going through due to a broad isolation cutoff range and reduce the movements further by the high “seismic” mass of the battery.
It is obvious that the same vehicle sees higher vibration levels on its battery pack when going over rougher terrain with higher deflections at the same speed.
As these variations create a very broad range of possible excitation levels for design and testing, it needs to be limited to a certain level that is acceptable for the intended use intensity and use time. These limits differ when looking, i.e., on standard personal automotive vehicles in contrast to off-road heavy-duty vehicles. Therefore, the intended use is needed to define a realistic set of road surfaces, driving speeds, etc., for the definition of the excitation to be considered for design and testing of the battery pack.
A much more detailed look at vehicle dynamics and different modeling approaches is given in [14].
Later in this contribution, a comparison of the vibration levels on the same surfaces is shown for standard automotive BEVs, and a small and lightweight off-road vehicle with a small and lighter battery is shown to give a quantitative impression of the influences considered in the later analysis.
The main focus of the analysis shown is clearly on standard automotive BEV battery pack vibration levels.

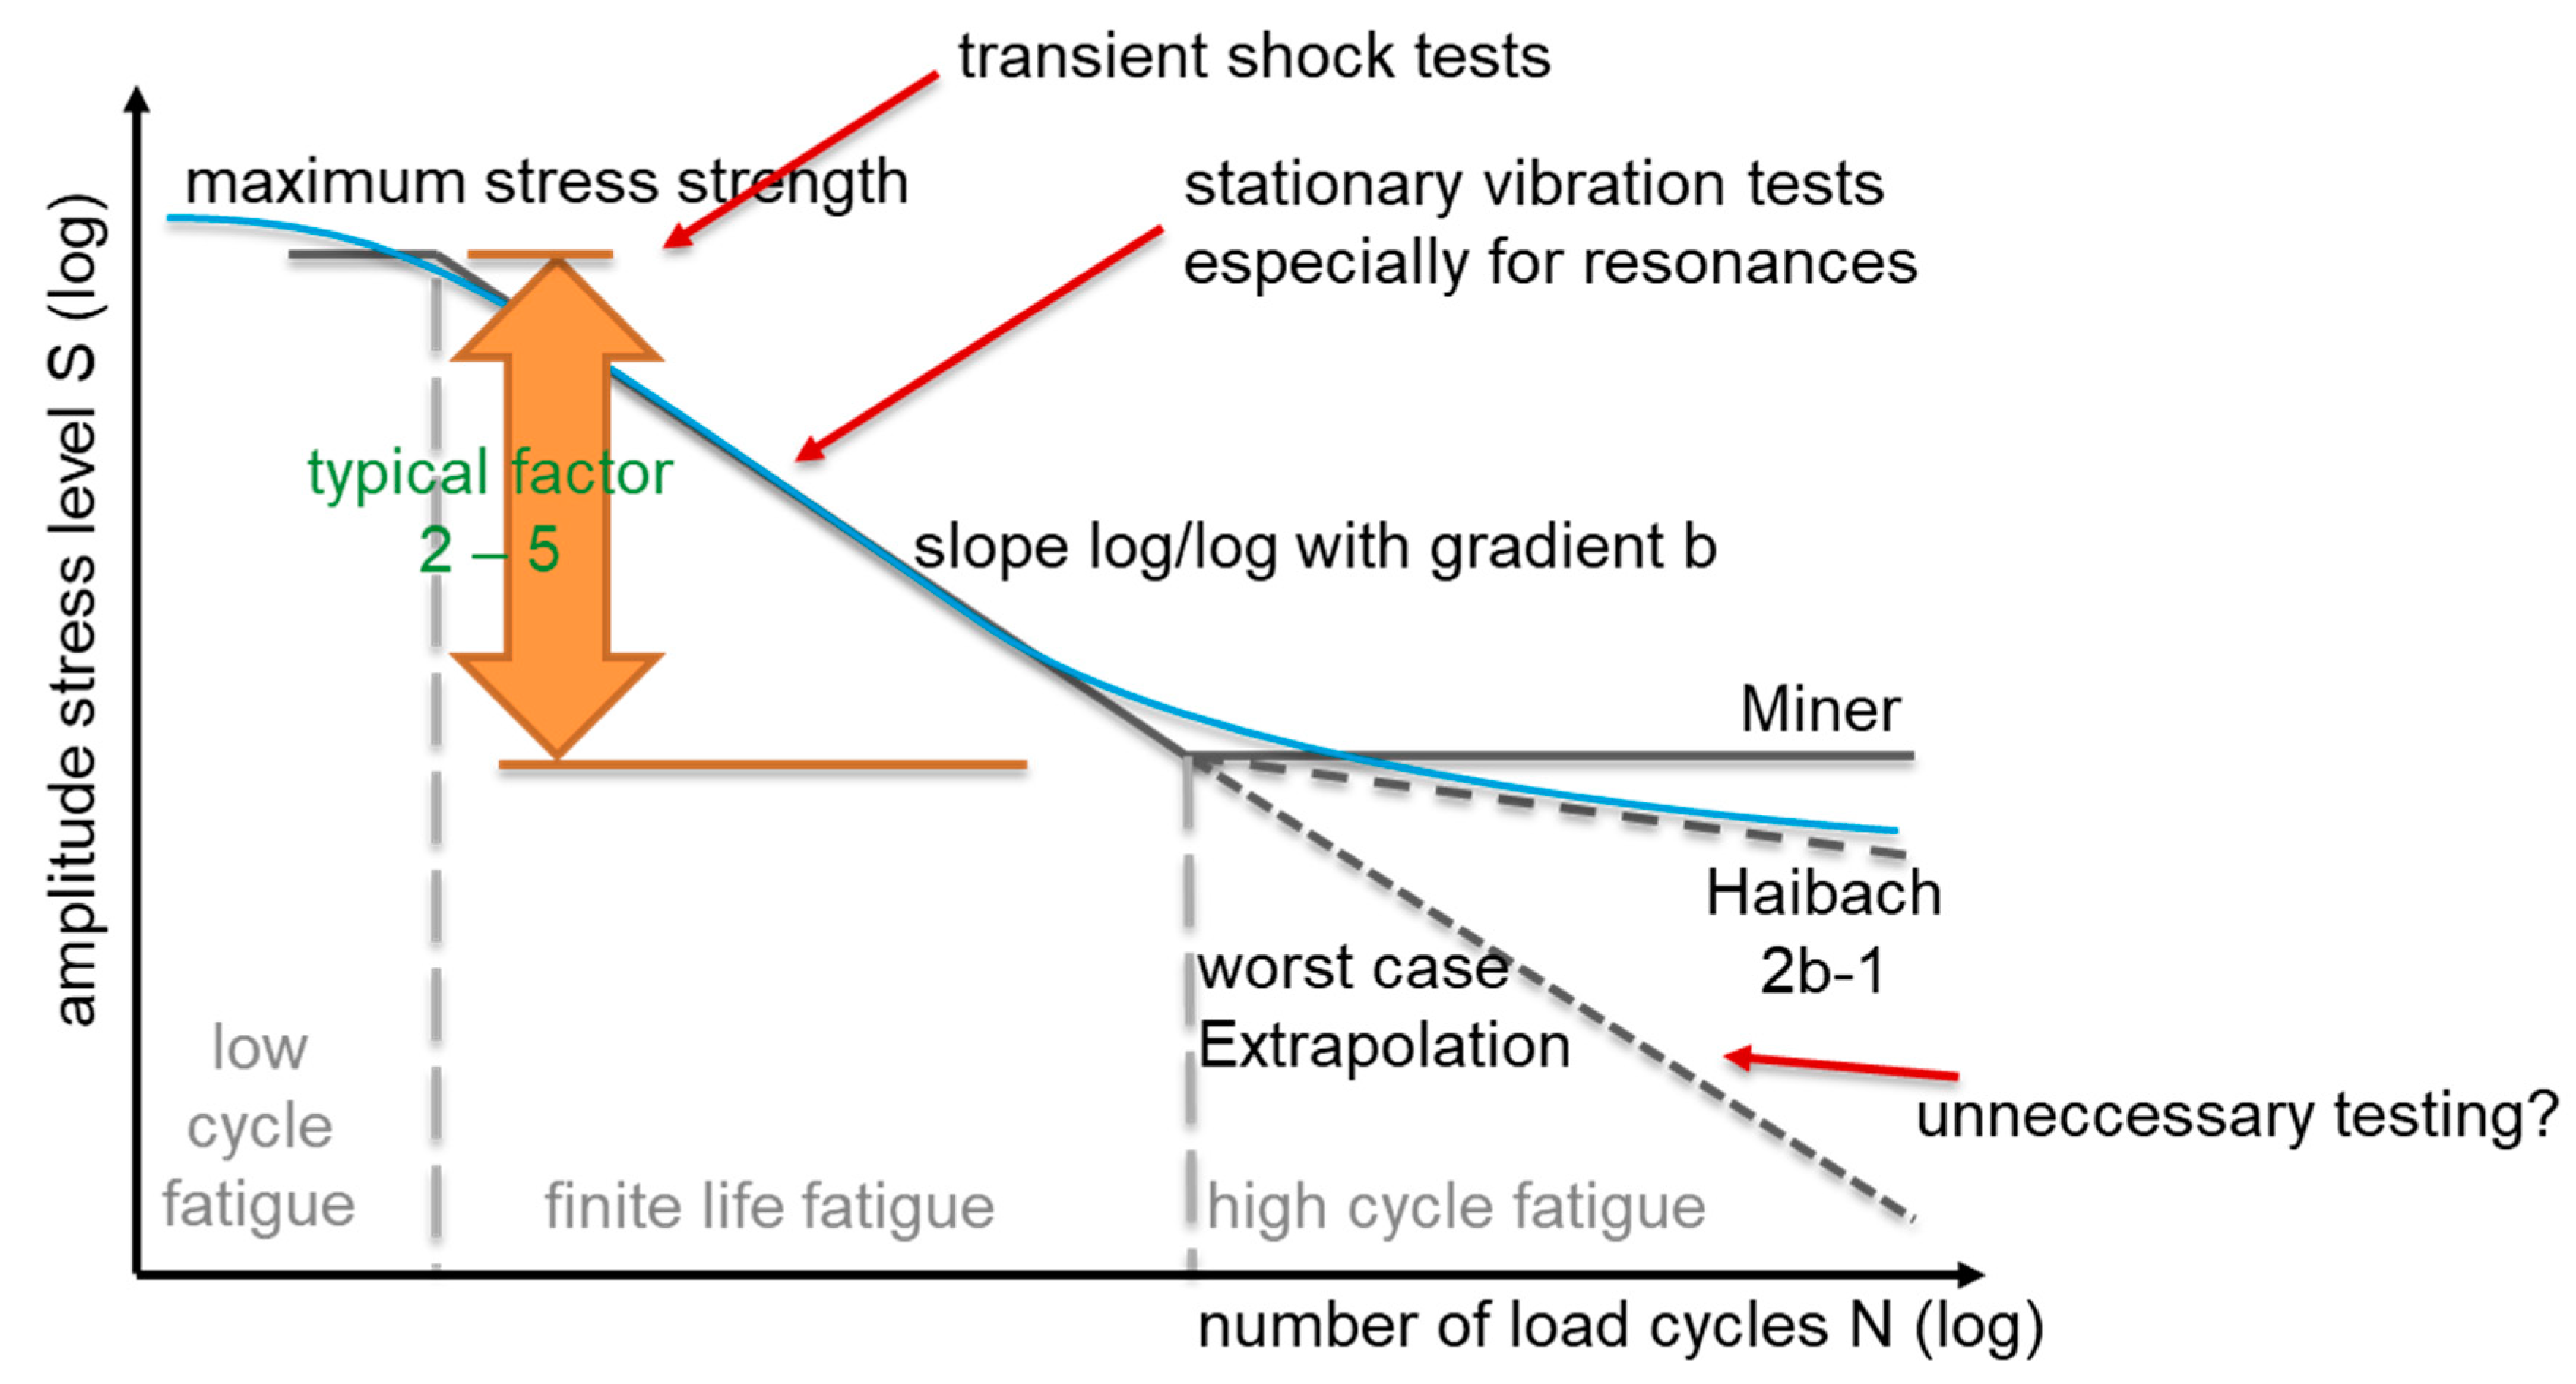
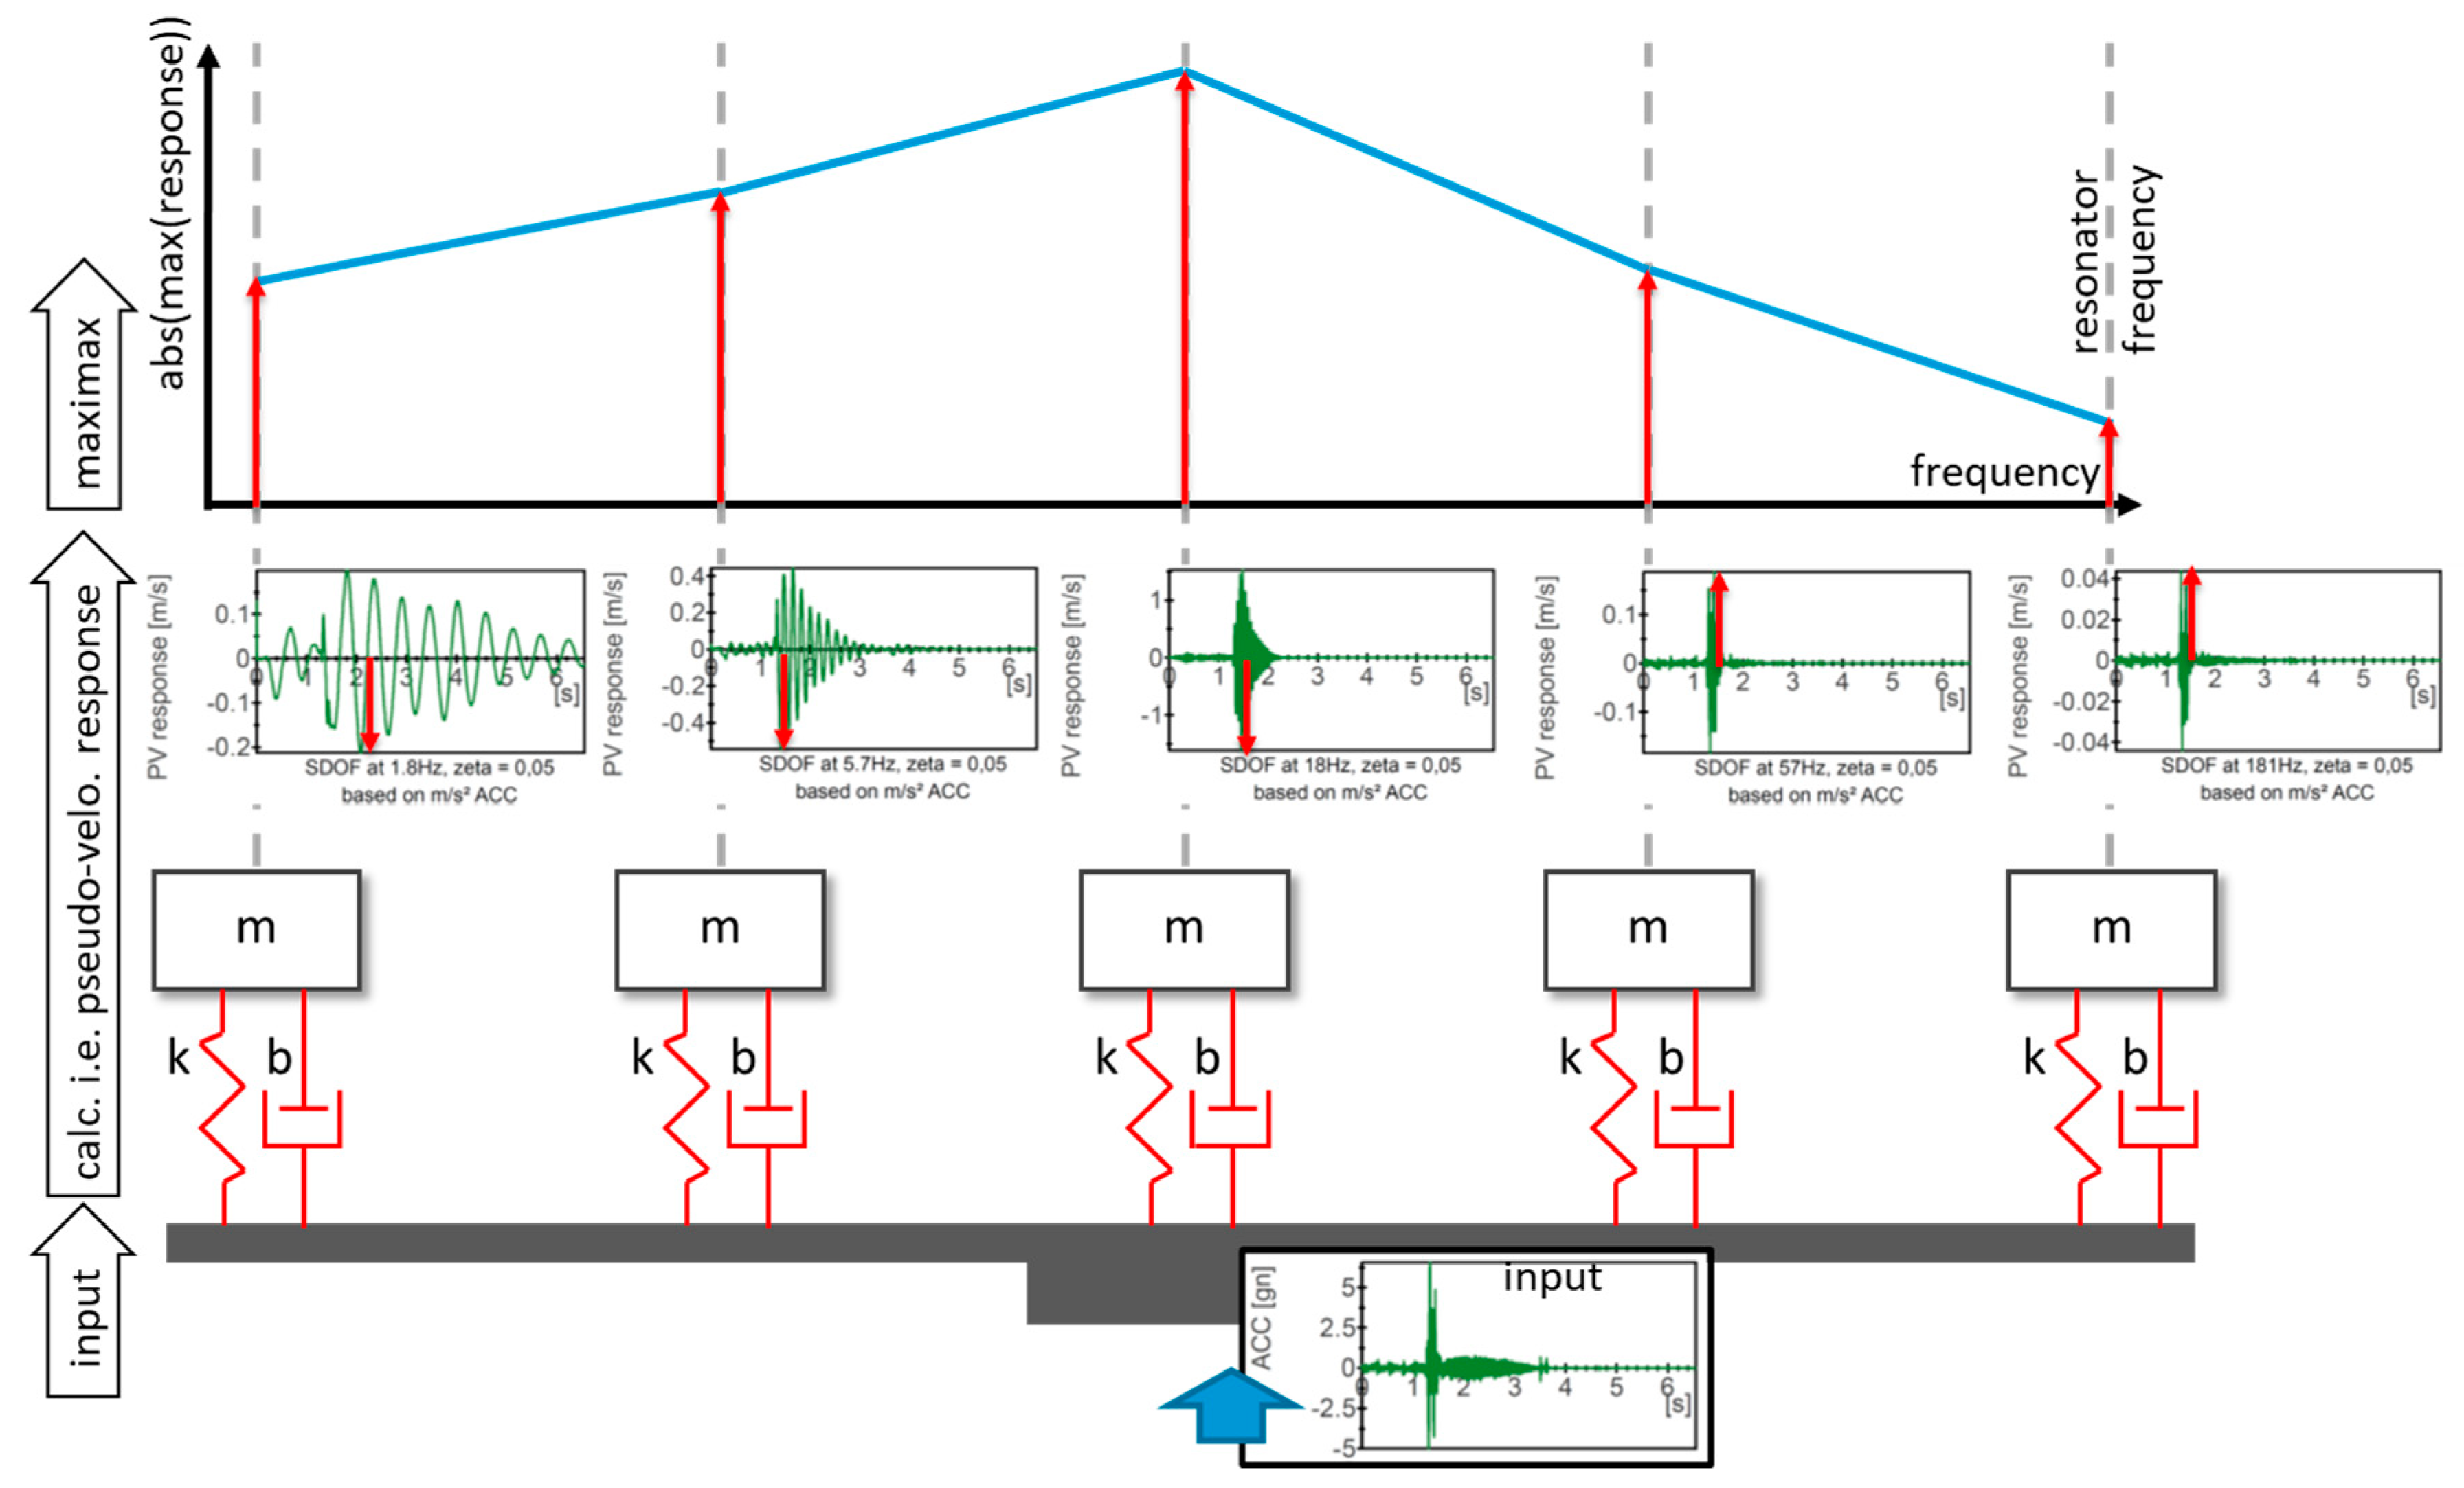
2.3. SRS for Boundary Considerations in SN Curve

In order to optimize the test time and thus make the development process shorter and less expensive, it is necessary to check which loads are important for testing the battery pack. For this purpose, the mechanical stresses at various locations, for various materials and various production treatments of the battery pack are compared. It can be assumed that for many materials used in the battery pack the fatigue strength for an “infinite life” is about a factor of 4 lower than the yield strength. This factor can be derived from [15], i.e., for longitudinal aluminum welds in Figure J.3 and Tables J.5 and J.6 of Eurocodes EN 1999-1-3. If a stress is below the infinite life threshold of the fatigue strength, no fatigue damage is to be expected, even at an infinite amount of load cycles. Hence, testing of these vibration excitations in this area is not necessary (see Figure 4).
Any excitation contribution, such as driving on a very smooth road, can be omitted if the substantiation also covers a test profile from very rough roads with stress peaks more than 4 times higher than the stress peaks of the smooth road excitation.
In order to compare maximum stress levels for such a heterogeneous structure, such as a battery pack, some assumptions have to be made:
The Pseudo Velocity (PV) represents a proportional factor of the mechanical stress [16,17]. The max-max values are shown in the Shock Response Spectrum (SRS), taking the maximum of absolute maximums and minimums (negative maximums). This form of representation is based on the assumption that a resonance is excited in the system at each frequency [18]. Here, a measured input is subjected to a fictive system that has a resonance at every frequency considered in the analysis. By using this very conservative approach, the vibration response to a real system (of which not all resonances might be known) can be estimated in a worst-case assumption. The real system will behave similar to the fictive system in its resonances. In non-resonance frequencies, the fictive system will overestimate the response of the real system but still yield a conservative engineering estimation. In the generic example Figure 5, the SRS takes into account a damping ratio of the system of ζ = 5%, which limits the gain or amplification of the system to V = 10. Normally, the SRS is used for transient shock events. Here, we use it to find the maxi-max of a more or less long duration stationary excitation. As we apply the method mostly on stationary long duration measurements, we do not actually analyze single transient shock events; hence, the application used here is sometimes also referred to as Maximum Response Spectrum instead of Shock Response Spectrum (SRS). The background and function of the method remains exactly the same. Here, we continue to use the name SRS, as it is more commonly known.
The maximum pseudo-velocity for the VW ID.3 is found at approximately vpvss = 0.46 m/s for the given conditions at the front right corner of the battery pack during an unloaded drive over rough cobblestone. If the test specimen does not fail more or lease immediately under this extreme value, stress levels 4 times lower are considered neglectable. A consideration of the other SRS leads to the result that all pseudo velocities calculated on smooth tarmac are smaller than the maximum measured pseudo velocity by at least a factor of 4 and therefore do not need to be tested, as they remain in the infinite-life region.

2.4. Measurement Data Set to Be Analyzed

This contribution focuses on an analysis of the needs on how to enable a realistic environment for large floor tractions batteries in a lab regarding its real-world excitations. This analysis is based on the first results of a smaller pre-test measurement campaign, with more planned in the future. Even these preliminary results indicate significant changes on the approach of component vibration testing in comparison to the state of the art, which is why it is covered in this contribution.
The analysis presented here uses partially the same set of original measurement data as presented in [1], which was now extended with the commercial off-road mini truck. Future papers of novel analysis steps will also reference this continuously growing data set. Therefore, the description of the data set overlaps partially. None, however, of the results of the then following analysis overlaps. Moreover, the methods used differ significantly. While in [1] mainly transfer functions are analyzed to study the vibration behavior of the battery packs, this paper targets the fatigue life estimation regarding several varying influence parameters of the environment.

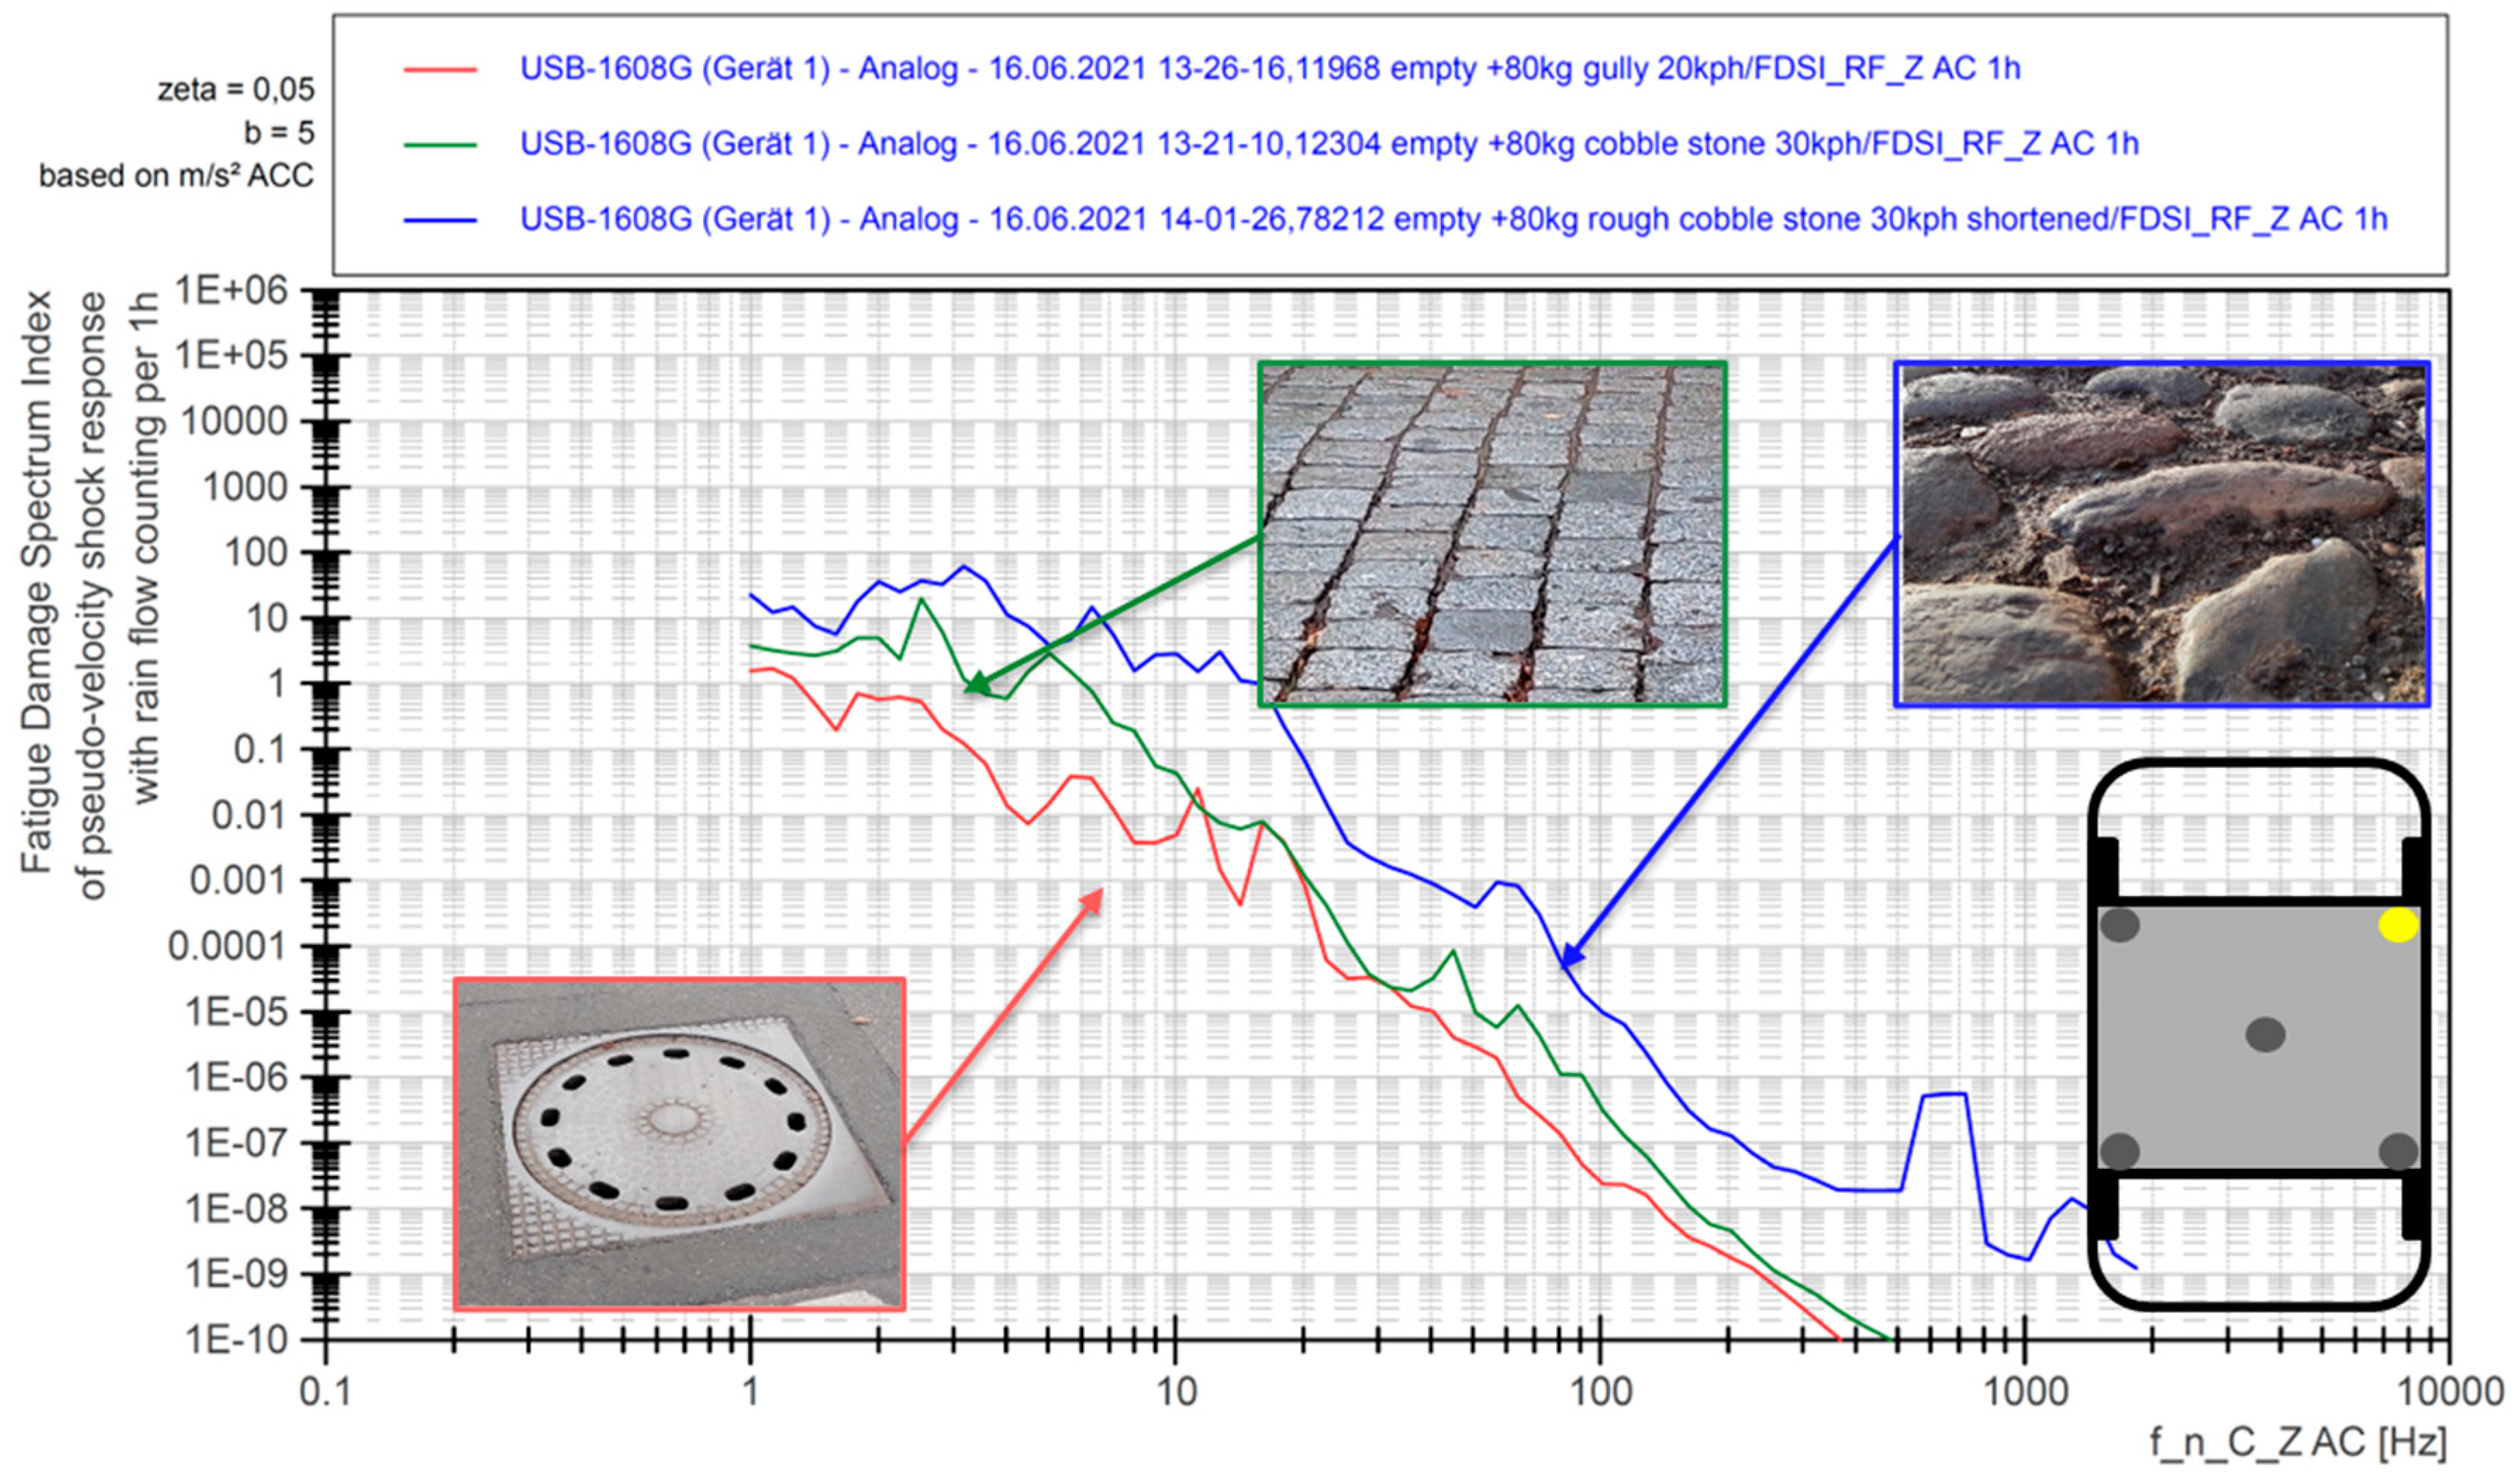
2.5. Excitations from Vehicle–Ground Interaction

The data for analysis were measured on serial production cars in real-world environments on different road surfaces under varied loading configurations. Each measurement is defined by vehicle, road surface, loading configuration and repetition. The road surfaces include but are not limited to: cobble stone—30 kph, rough cobble stone—30 kph, man-hole-cover—30 kph, pot hole—30 kph, city drive—various speeds, country road—100 kph, motorway—130 kph, and country roads—various speeds.

2.6. Vehicles of Preliminary Study

The following preliminary analysis uses the data from measurement on a VW ID.3 and a BMW i3, as shown Table 2, with the most relevant technical data. For the later comparison regarding the influence of the vehicle setup with weight and suspension stiffness, the analysis will include an EVUM off-road-mini truck even though the main focus of the analysis will be on the two standard automotive BEVs.
The table shows empty and max gross weight of the vehicles as well as information on the additional loading in the measurement campaign. Besides the mass loading of the driver and minor other masses, the additional masses loaded are given in the table. The weight of the battery pack—including also structural weight beside the pure cell weight—does not differ as much as may be expected with the capacity of the VW battery pack being twice as high as the capacity of the BMW. It can be assumed that the older BMW design still has a lot more structural weight. It is also assumed that the much more significant amount of structural support for the cells increases the stiffness of the BMW battery pack compared to the VW design considered here for analysis.
In [1], it was shown that the main basic modes are in a similar frequency range with even slightly higher resonance frequencies for the VW. The resonance frequency of an assumed single-degree-of-freedom-vibration system is determined by the square root out of stiffness over mass. Hence, the VW design compensates its higher mass very well by a stiff design. Different gravimetric densities of the batteries being used change the mass to be carried by the supporting structure of the pack.
The overall data set of the three vehicles consist of 45 measurements with several influences measured more than once for a better statistical data base.

2.7. Measurement Equipment and Signal Quality

The measurement and data acquisition equipment used is described in Table 3 with more information to be found in [1].
Further signal checks were performed based on the comparison of RMS versus standard deviation (mean offset), high kurtosis or high skewness values (impacting or contact losses), as well as general possible data errors. Questionable data were not used for analysis.

2.8. Normal Tolerance Limit on Power Spectral Density in Analysis Software

The programming of a universal evaluation tool is a prerequisite for statistical analysis. This enables a comparison of different sets of measurements in order to determine the effect of different vehicle configurations in a subsequent parameter study and to derive a load profile for testing. When calculating the set of measurements, a few statistical parameters are used as indicators for comparing the effects of the parameters.
The relative deviation applied on a spectrum is a good indicator for the scatter of the measured values. It gives percentage information about how far the maximum and minimum values differ from each other in the respective frequency.
ϵ r e l = x m i n x m a x x m a x 100 %
The normal tolerance limit is a limit for the spectral values of the vibration loads, based on their normal distribution in each frequency band. According to [19], the distribution of spectral values of different dynamic vibration measurements is not normally distributed. However, there are indications that the logarithm of these spectral values x is approximately normally distributed. Due to this, a conversion of the measured PSD values x via the logarithm into y must be performed:
y = l o g 10 x
The range referred to below as the “standard deviation range” includes about 68% of all measured values. This is limited by the upper and lower “standard deviation limits”. With the help of y _ as the mean value y , the tolerance constant C and the standard deviation S y of the spectral values, the Normal Tolerance Limit (NTL) can be calculated:
N T L y = y _ + C S y
The tolerance factor C is selected so that the NTL corresponds to the limit value below which 95% of the measured accelerations lie with a confidence of 50%. The NTL in the original unit of spectral values can be obtained by exponentiating the calculated NTL:
N T L x = 10 N T L y
If a weighting of the driving surfaces is carried out, this must be included in the calculation of the mean value and NTL. The weighting has no influence on the maximum values and the relative deviation in each frequency value. First of all, a mean value is calculated for each subsurface from the selected measurement data. These are extended in such a way that the multiples of the mean values are used, depending on driving surface and weighting, and thus influence the formation of the final mean value and NTL.
Some of the pre-study analysis was conducted using National Instruments DIADEM 2020. This includes digital filtering, frequency domain compensation, Fast Fourier Transformation (FFT), Power Spectral Densities (PSD), transfer functions with amplitude and unwrapped phase, coherence functions, Cross-Spectral Densities (CSD), channel arithmetic for time domain difference functions, statistical distributions (random probe) and statistical key figures such as Root Mean Square (RMS), min, max, kurtosis and skewness.
The digital filter responses were calculated using the VB-Scripting interface of DIADEM based on the filter algorithms of ISO 18431-4 [20] and verified to other industry implementation as well as examples from the literature given above.
The statistical data analysis with the NTL was conducted in Python scripting.

3. Results

The following sections show the result of the statistical analysis for an NTL testing profile looking at different influence parameters.
Figure 6 shows the Fatigue Damage Spectrum (FDS) calculated for 1 h testing time of the vibration input on the right front corner of the battery pack of the VW ID.3 for different surfaces. An FDS uses the same fictive system as the SRS and relates the pseudo-velocity to a mechanical stress that may cause fatigue depending on the stress level and the number of load cycles. For this, the calculated vibration responses of the worst-case system with a resonance frequency at every frequency to be considered are analyzed by a class counting method, i.e., Rainflow or cumulative level crossing. With these classes of stress levels and corresponding cycle numbers, a damage index is calculated based on the slope of an assumed SN curve. By doing this, a proportional fatigue damage index can be calculated. If the real system in Figure 6 has a resonance at 10 Hz, the 1 h exposure on rough cobble stone (blue) will cause more than 10 times the fatigue damage in an SN curve compared to the normal cobble stone (green). Or the other way round: the system will fail more than 10 times earlier at rough cobble stone exposure. For further information on FDS, SRS and test profile analysis, see also [9,18,21,22] as well as [23] with a special focus on multi-axial excitations.
In the case of the man-hole cover, it shows the FDS for a repetitive passing every ca. 7 s for 1 h. The pseudo-velocity has been calculated for the acceleration in m/s2 measured at the right front corner of the battery pack with an SN curve slope parameter b = 5 (i.e., for welded aluminum and copper parts) and a damping ration of 5%. It can be seen clearly that the rough cobble stone causes by far the most damage on the Fatigue Damage Index based on proportional behavior to the mechanical stresses.

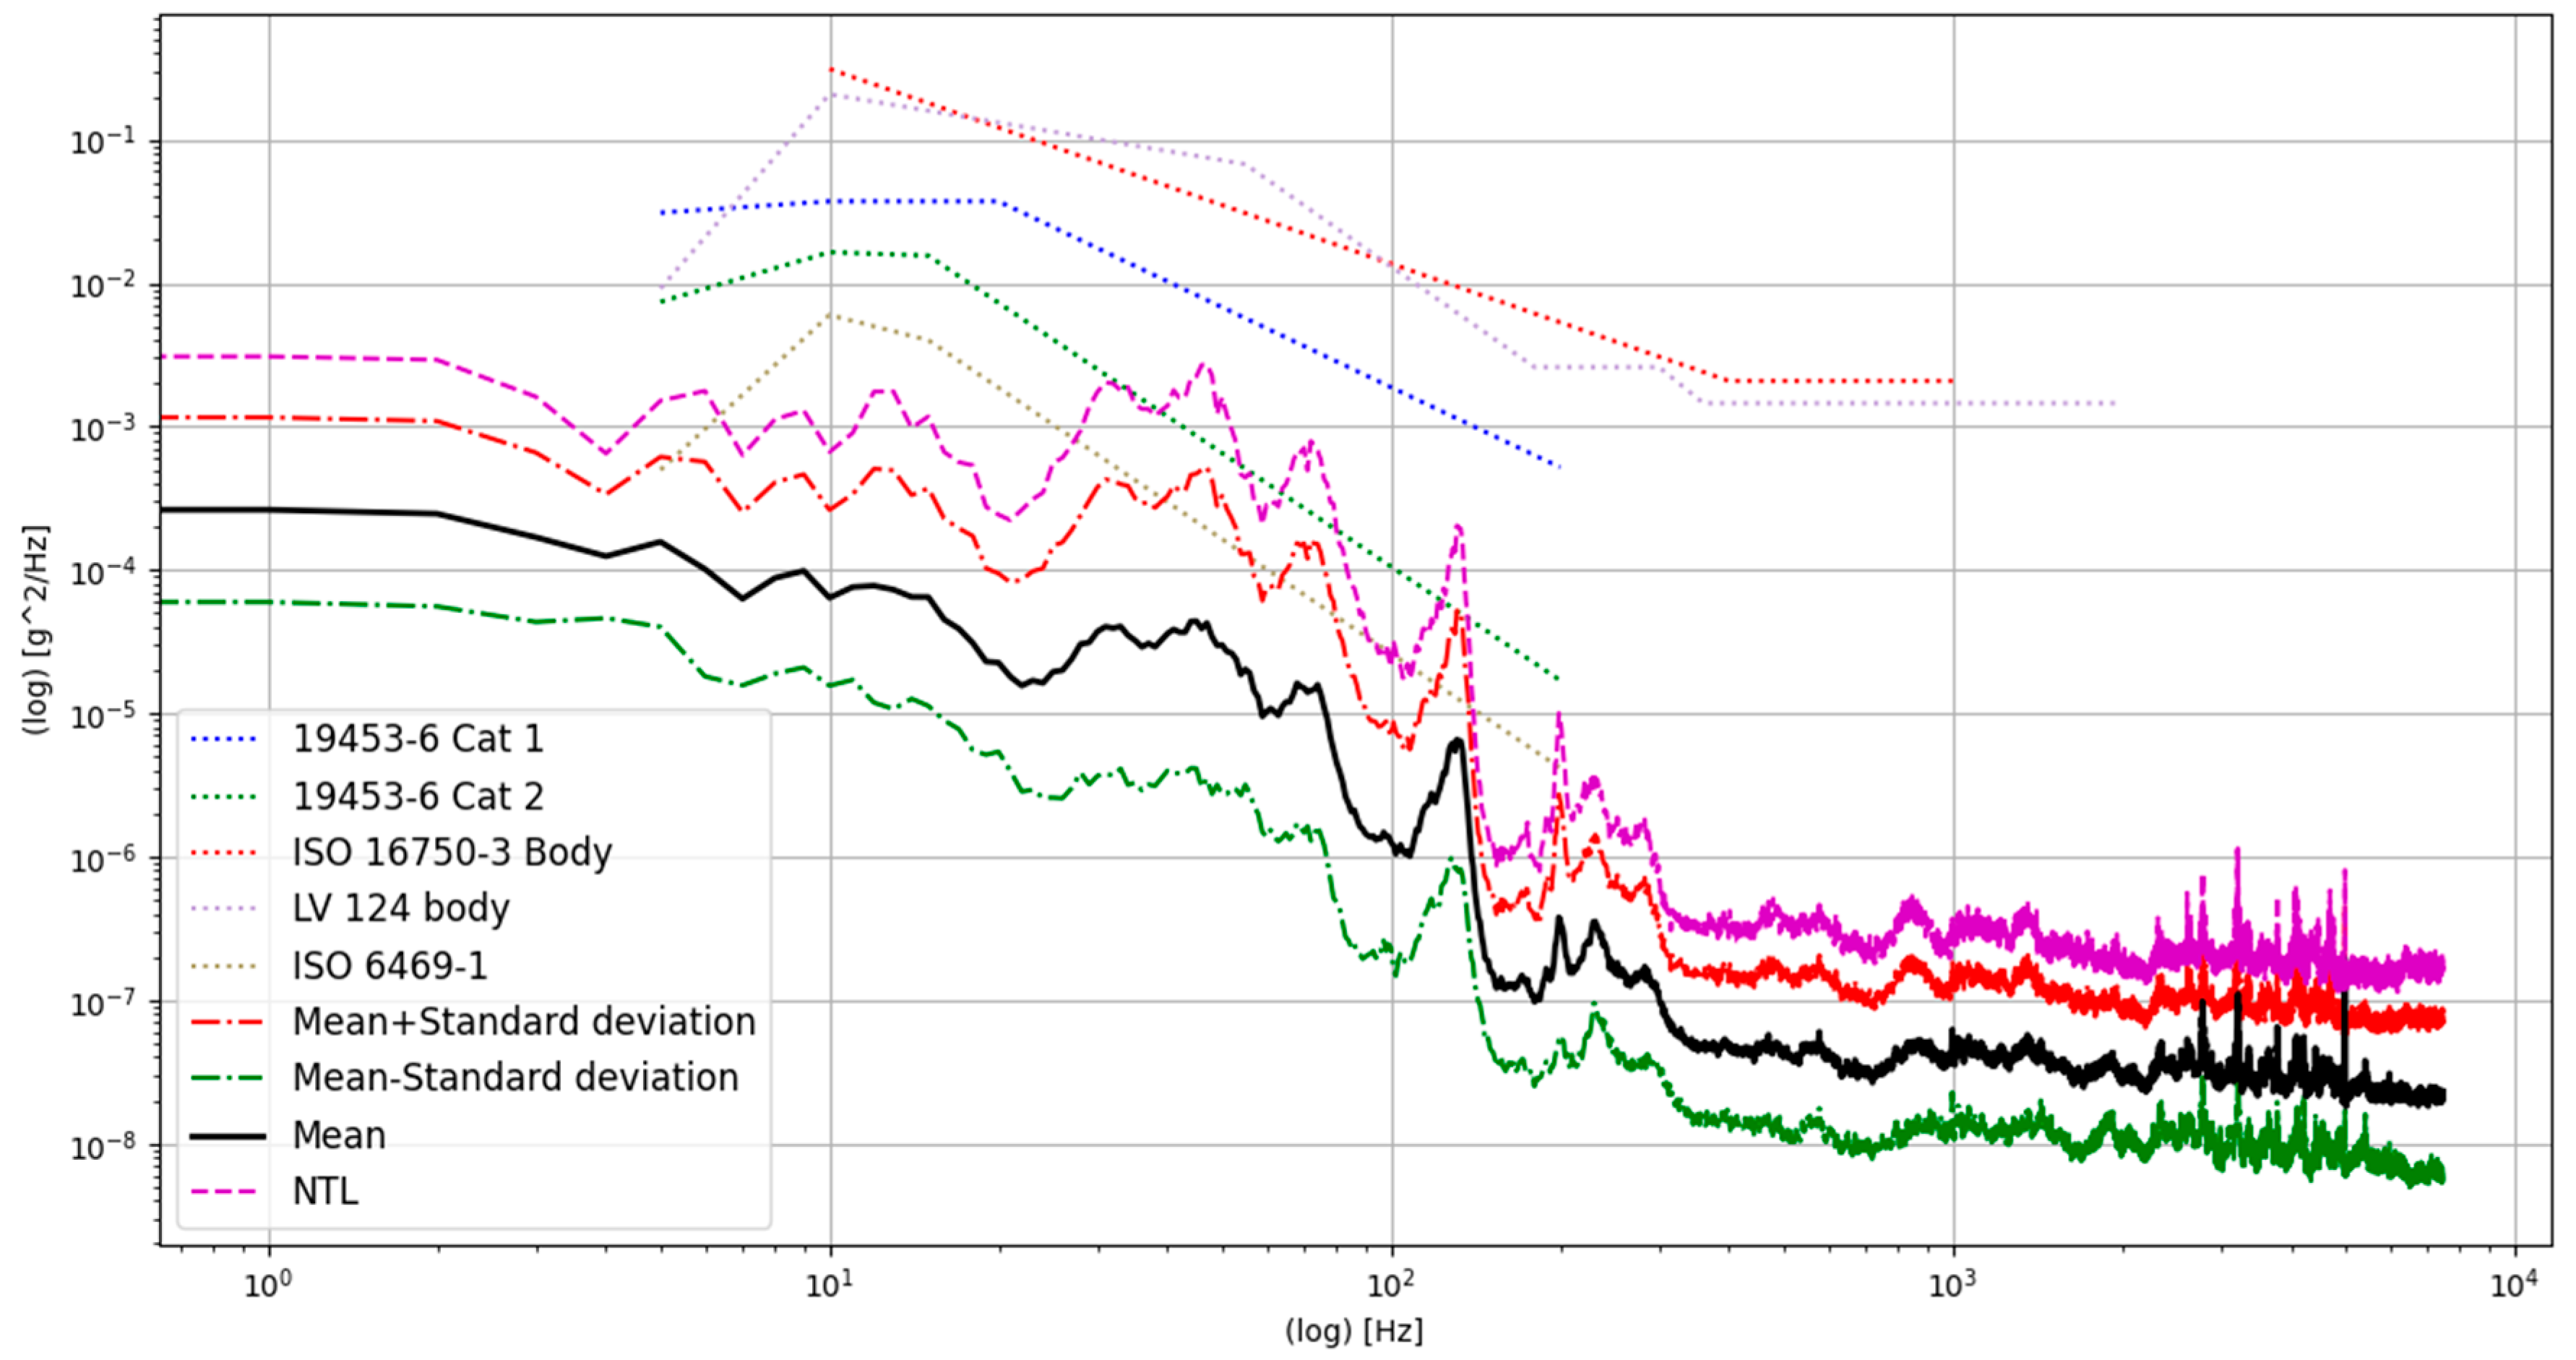
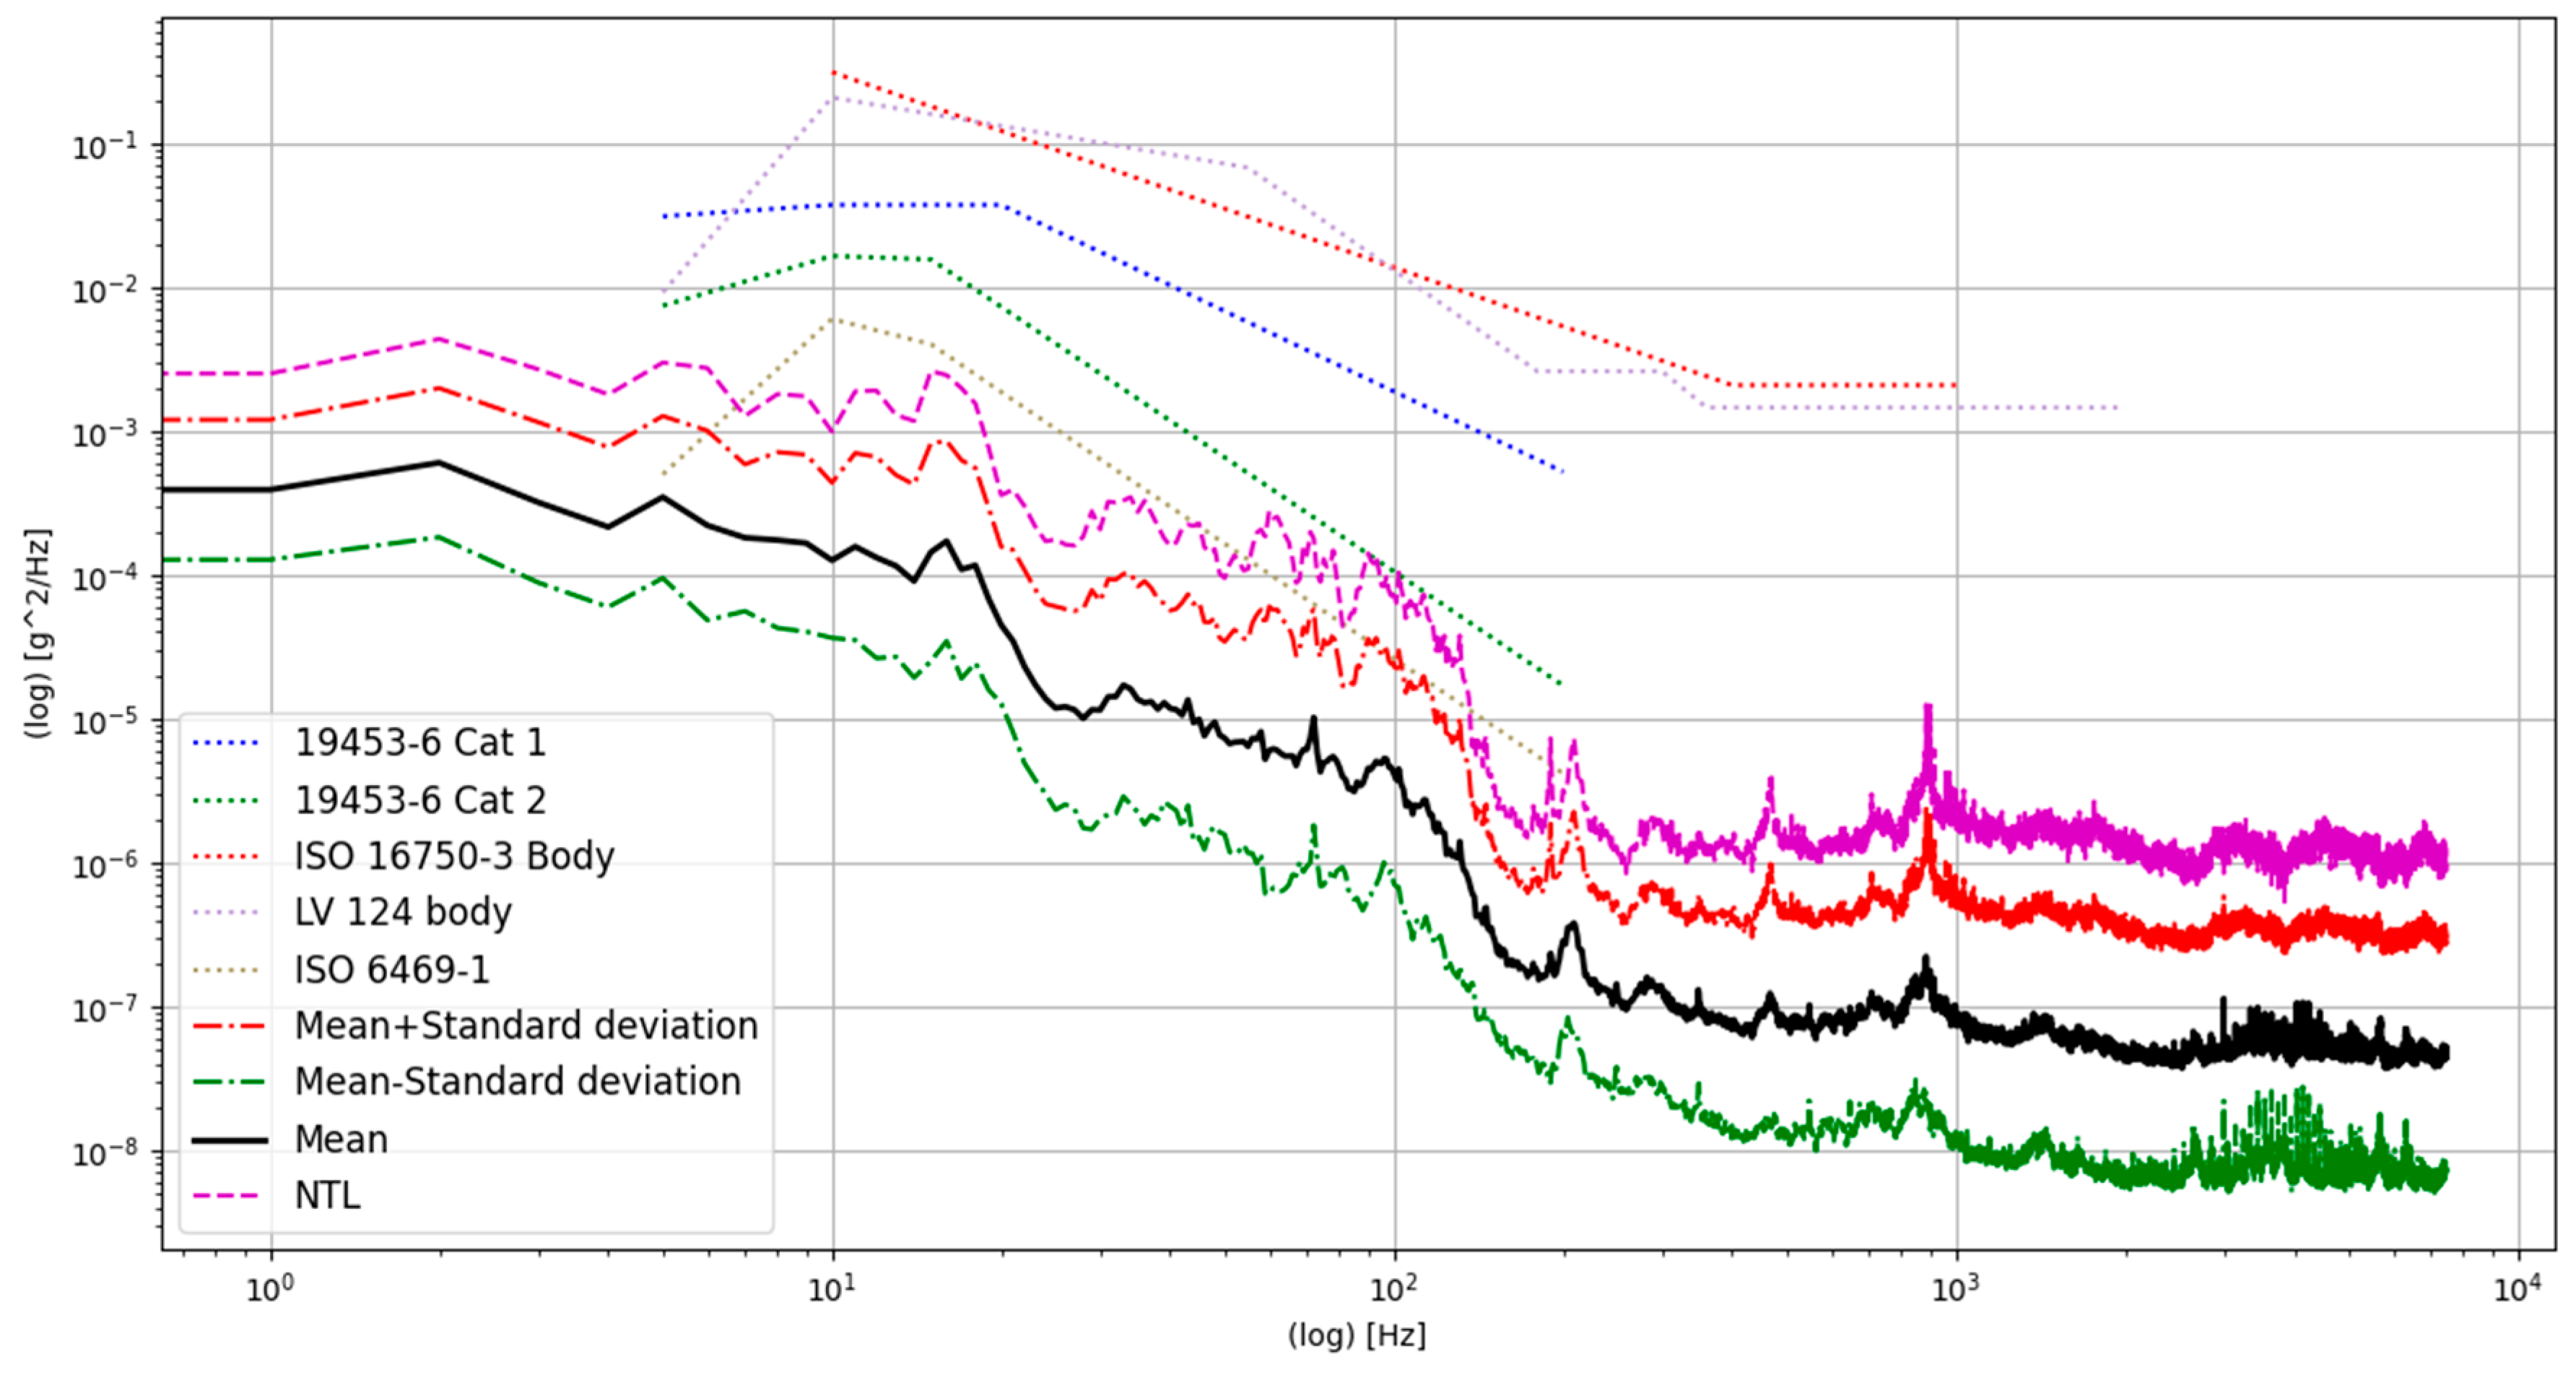
3.1. Power Spectral Density and Normal Tolerance Limits for Different Influence Factors

During the measurement campaign, the accelerations experienced by the vehicle were measured at various points. Here, the five different points on the battery pack as schematically shown on the right in Figure 6 (bottom right) are analyzed. They are located near the corners of the battery pack and in the middle. The influence parameters and their variations considered in the analysis out of the whole data set were:
  • Vehicle type (BMW i3, VW ID.3 and additional EVUM aCar commercial mini truck)
  • Road surface (rough cobble stone, cobble stone, smooth tarmac)
  • Mass loading of the vehicle (driver, extra load according to Table 2)
  • Measurement points on the battery pack (4 in the corners, 1 in the center)
In the following, the PSD of the measured acceleration time series are analyzed with statistical measures. It can be seen that the accelerations at the center of the battery (C) are lower outside resonance frequencies in all configurations compared to the corner points (see also [1]). This is most likely due to the extra mass in the load transfer path. In both vehicle types, the highest accelerations occur in the front part (RF—right front, LF—left front) of the high-voltage battery pack, as seen in the direction of travel. The difference between the two front sensor locations is small. In an unloaded BMW i3 (with only driver) on rough cobblestone, the two front sensors have a relative deviation of about 27.8% from each other up to 300 Hz in a statistical analysis over all measurements available for this parameter set. The sensors on the VW ID.3 in the same configuration have a relative deviation up to 300 Hz of about 29%.
Comparing the responses at different loading conditions of the vehicles there is no significant difference in the measured accelerations between the unloaded and loaded conditions of both cars, even on different surfaces, as shown in [1]. Accordingly, the payload of a vehicle has no significant influence on the accelerations measured at the battery.
As part of the measurement campaign, measurements were carried out over several road surfaces. Identifying the effects of different driving surfaces is essential for deriving test profiles. It can be seen on the PSD profiles for the different surfaces that the accelerations experienced by the battery (right front) are highest on rough cobblestone (see Figure 7).
Normal cobblestone represents the second highest level, followed by smooth tarmac. Other input variations such as mass loading of the vehicle and vehicle type are not varied for Figure 7. The average with the added standard deviation is higher than the level of the ISO 6469-1 [8] over a broad frequency range, while the average stays clearly below. The NTL calculated for 95% limit with 50% confidence as in [19] exceeds even ISO 19453-6 [2] Cat 2 several times but stays clearly below ISO 19453-6 Cat 1, LV124 [24] body and ISO 16750-3 [6] body profiles.

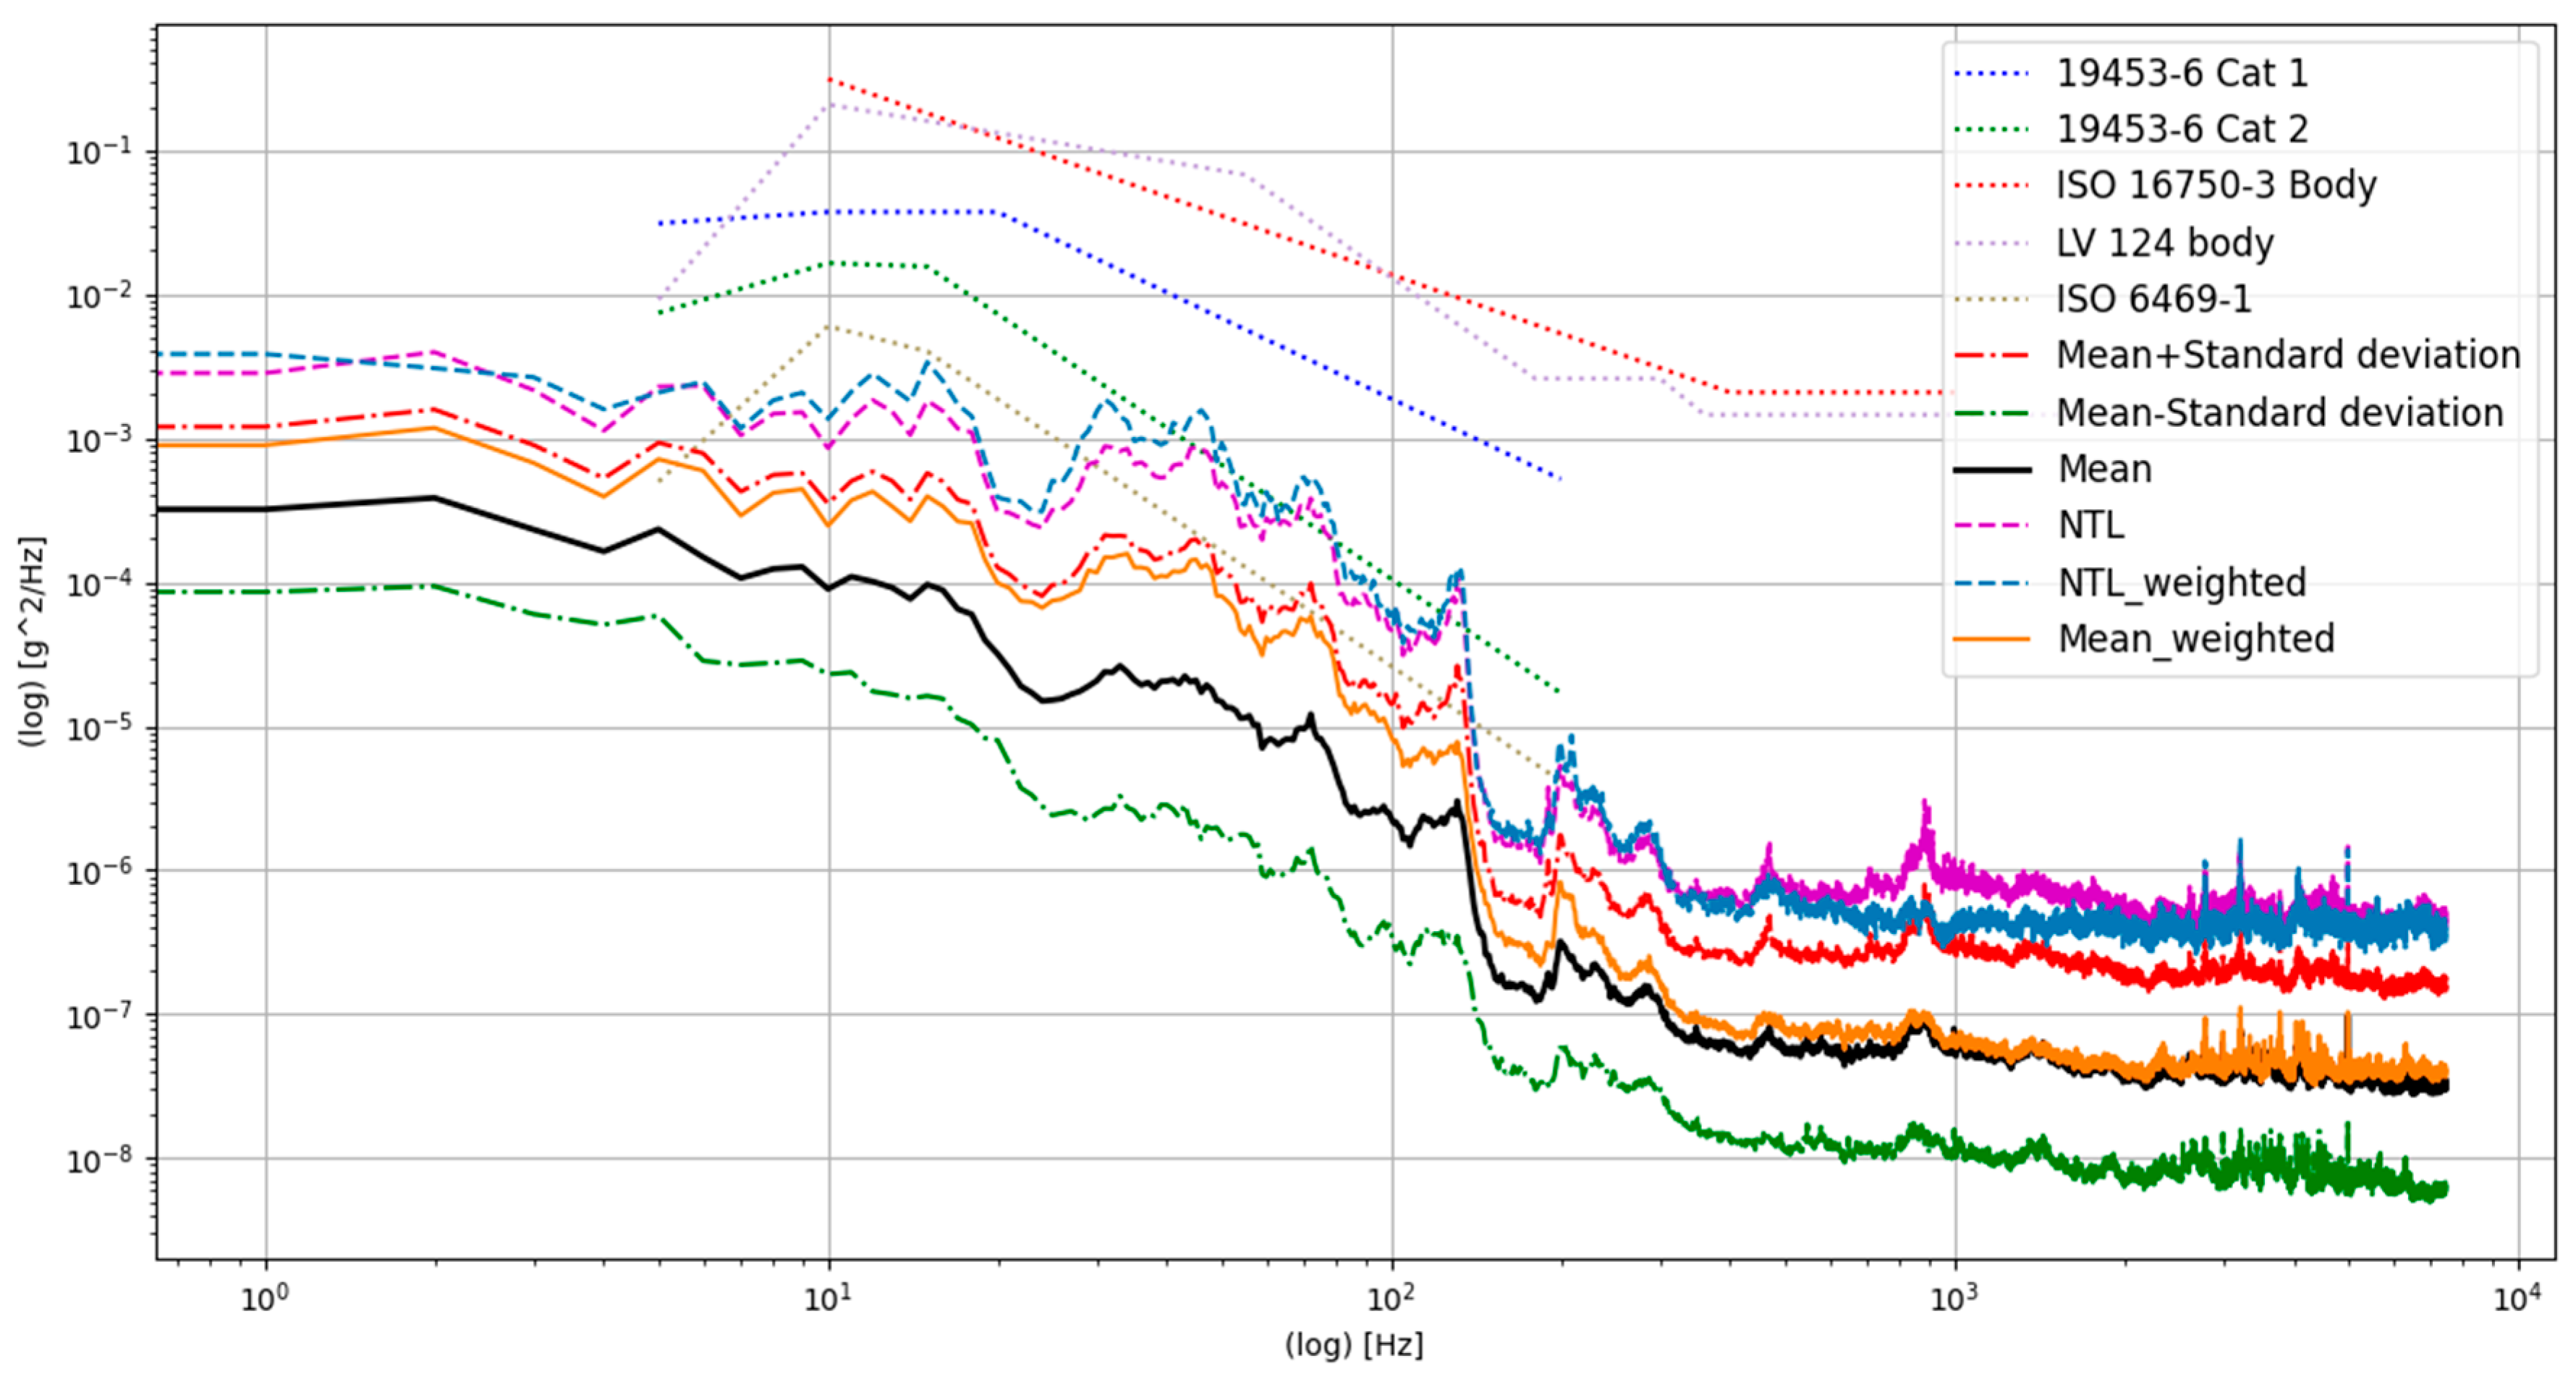
3.2. Power Spectral Density and Normal Tolerance Limits over All Measurements

In the following, all measurements available for the BMW i3 are considered for a statistical analysis to compare the vibration levels experienced by the battery pack, expressed as PSD, in general and in contrast to the applicable standards. Moreover, of interest is the scatter or deviation of the measurement data that results when all available configurations and all parameter variations are taken into account. The average relative deviation of the measurement data is 99.3% over the entire frequency range. Due to many widely varying measurement configurations, this deviation is plausible. But it also highlights the significance of distinguishing different surfaces when setting up a test method for life-time fatigue testing. Through all measurement data, there is a main resonant frequency at about 140 Hz.
Figure 8 shows that the averaged measured acceleration PSD remains several decades below the relevant testing standards’ profiles. It can also be seen that the upper standard deviation limit (mean + standard deviation) touches the category 2 PSD curve from ISO19453-6 [2] only at the resonance frequency at 140 Hz. In this, the standard deviation limit is more than a decade below the PSD curve for category 1. The determined 95/50-NTL also exceeds the PSD curve specified in ISO19453-6 [2] for category 2 batteries in the range between 28 and 145 Hz several times but generally stays below that.
Figure 9 shows the curves determined by calculating all available data of the VW ID.3. The average relative deviation of the calculated measured values is higher than that of the BMW. It is also visible that the VW has fewer and less pronounced amplifications at resonance between 10 and 200 Hz. This may also be due to more damping being included in the design or by a different suspension setup. The 95/50-NTL curve exceeds the PSD curve according to ISO6469-1 [8] in the range between about 55 and 140 Hz. The upper standard deviation limit only touches it at about 90 Hz. Neither the calculated NTL curve nor the upper standard deviation limit exceed the PSD curve specified in ISO19453-6 [2] for category 2 battery packs, which is also only touched by the NTL curve at around 100 Hz. The PSD curve specified in ISO19453-6 for category 1 storage devices is on average one decade above the NTL. The PSD curve specified in ISO16750-3 [6] for body parts is in some cases up to three decades above the NTL curve. It can be seen that for both vehicles some of the PSD curves specified by the standards are far above the accelerations that actually occur and therefore lead to over dimensioning of the battery packs, in particular the ICE profiles of ISO16750-3 [6] and LV124 [24] for small lightweight parts attached to the vehicle body.

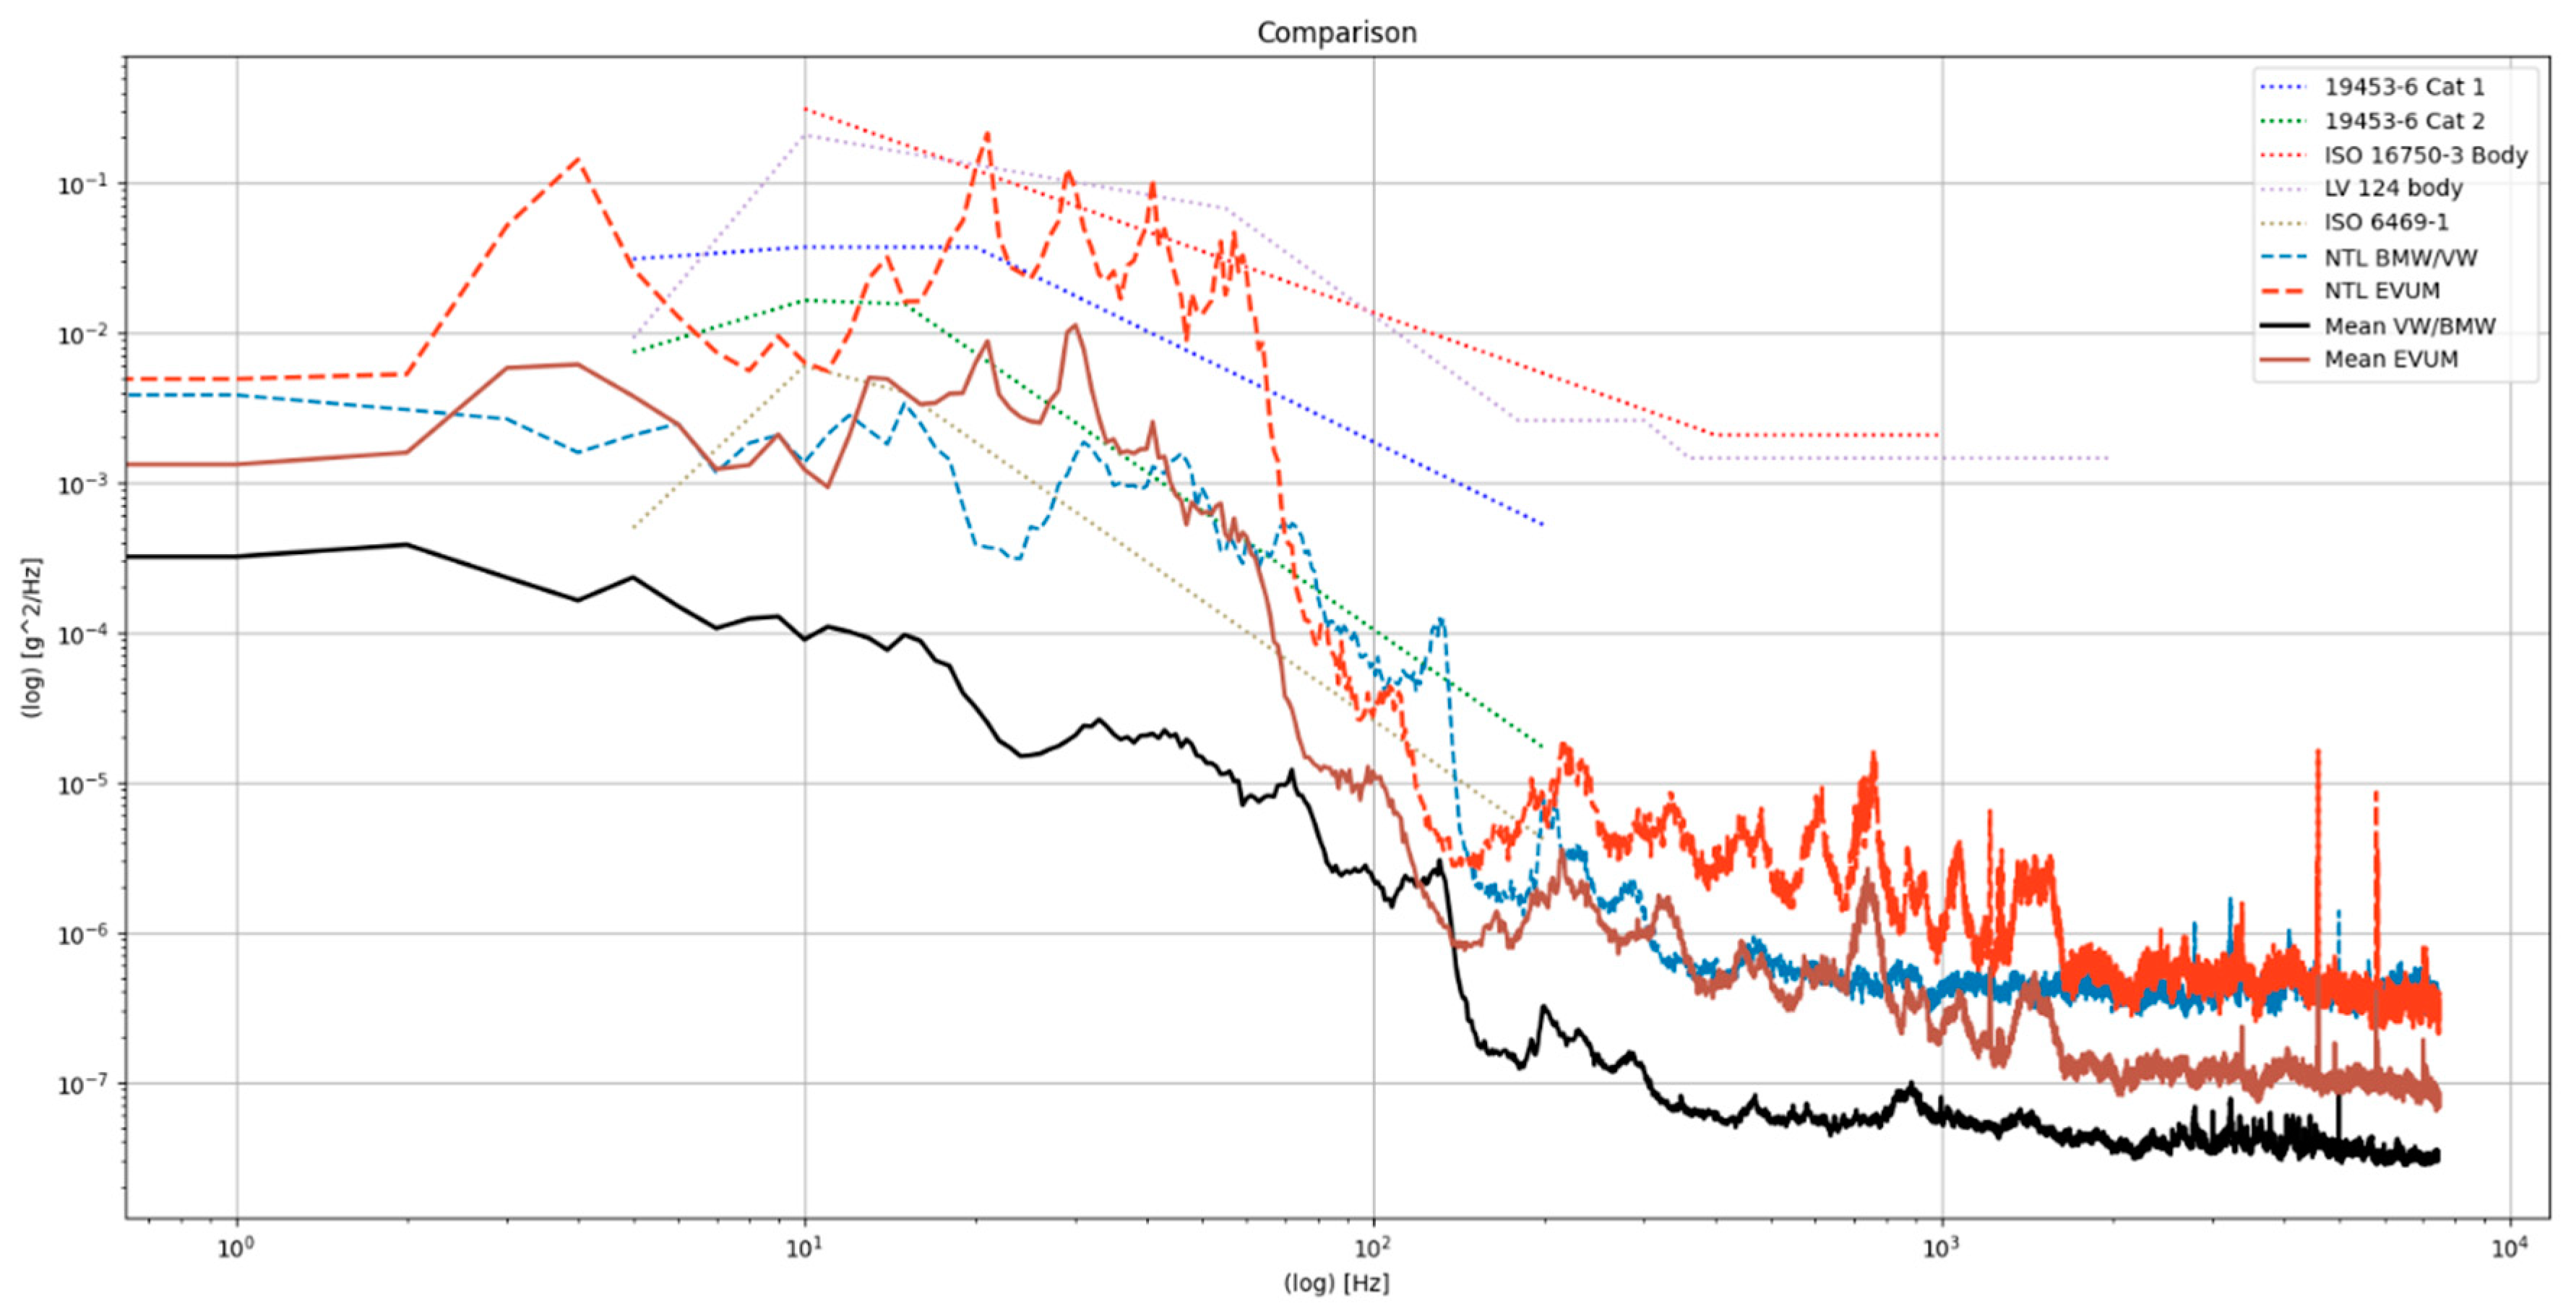
3.3. Comparison of NTL for BEVs and a Commercial Mini Truck

In order to gain an insight of how much influence a significantly different vehicle type can have on the results, the combined results of the VW ID.3 and BMW i3 were compared to the analysis of an EVUM aCar commercial mini truck for off road purposes.
The EVUM aCar commercial mini truck has a very stiff suspension and is intended to carry significant extra loading compared to its rather small own weight designed for an off-road use case with high relative payload capacity. On the other hand, the 48 V level battery pack is smaller and slightly lighter than the one typically found in standard automotive BEVs. Because of the stiff suspension transmitting a lot of the ground excitation to work on a lightweight battery without much other seismic mass of the vehicle to reduce the movements, the vibration levels of the empty EVUM are expected to be much higher than the one of the automotive BEVs.
For the following comparison, only the bad road surface conditions “rough cobble stone” and “cobble stone” were considered with the same surface driven over by the different vehicles at the same speed of 30 kph. The 95/50-NTL in Figure 10 shows that the BMW/VW measurement set has a wider spread between averaged mean to the NTL of all PSD data considered of these two standard automotive BEVs compared with the off-road mini truck. On the other hand, the NTL of the mini truck is about a decade higher than the NTL of the standard automotive BEVs.
The 95/50-NTL of the mini truck slightly exceeds the limits of LV124 and ISO 16750-3 for body parts in several cases but generally stays below that. Even the average of the cobble stone and rough cobble stone measurements of the mini truck clearly exceed ISO 19453-6 Cat 2.

3.4. Assimilation of Combined Testing Profiles and Durations

To test the vibrations of a complete vehicle life-time of several thousand hours in 1:1 in vibration tests would be far too costly. There are well-established methods to reduce test time to the minimum testing time needed for reaching the wanted information, i.e., on fatigue behavior. The standard MIL 810 (method “vibration”) [25] gives a good overview over these different measures; some of them can be also found in the informational appendix of ISO 16750-3 [6]. The methods of test time acceleration based on exchanging a part of the number of load cycles to be tested by higher stress levels on the same SN slope are not considered here, because it is very unpractical to consider all possible SN curve parameters conservatively for all possible failure modes of a battery pack under vibration excitation (see also [26]).
For the generation of a load profile based on the measured data, this contribution uses its own composition of the road components, which is chosen to match the available measured data. The assumptions are strongly influenced by the assumptions made in [21,27] and SAE J 2380 [5]. In the following, the weighting for the following assumes 60% smooth surface driving time, 20% (smooth) cobble stone driving time and 20% rough cobble stone driving time for a reasonable replication of a possible vehicle life to be covered in design and testing. Especially the 20% rough cobble stone should be considered as a rather conservative approach for standard personal BEV excitation. Many people will try to avoid driving such a road even at only 30 kph if possible considering the really bad driving comfort.
In a detailed look on the “maxi-max” pseudo-velocities in a shock response spectrum as a stress indicator, it was found that the peak stress levels caused in the rough cobble stone excitation are so high that the “maxi-max” stress levels of smooth surface all remain lower by at least a factor of 4, hence staying in the infinite-life region in fatigue analysis. In other words, if the battery pack does not fail soon under testing the rough cobble stone surface excitation, it will never fail under smooth surface excitations. When calculating normal tolerance limits with high limit percentage such as 95%, leaving out the really low excitation measurements has no significant influence on the calculated NTL. This is shown in Figure 11 when comparing the NTL on the weighted surface input assumption “mean_weighted” with the overall unweighted NTL. Therefore, any smooth surface driving times are not considered in the following, leaving the cobblestone surface driving times only.
Since trips over a manhole cover are estimated to be a very small part of the total distance or time compared to cobblestones and rough cobblestones, they can be tested in a separate shock test in case their peak accelerations exceed the peak accelerations of the other vibration tests. The unloaded and loaded configurations are also given equal weighting when creating the test profile.
The calculated testing profiles for the two standard automotive BEVs are shown in Figure 11. The mean value curve, the NTL curve and the standard deviation range are shown. It can be seen that the acceleration on average exceeds the load curve required by ISO6469-1 [8] for testing over a significant frequency range by at least one decade. It therefore cannot be used for life-time simulation of large battery packs due to massive undertesting. The upper standard deviation limit also intersects the required load curve only at a few points. Furthermore, the normal tolerance limit exceeds the load curve required by ISO19453-6 [2] for category 2 batteries only slightly at a few points. According to this study, the accelerations specified in LV124 [24], ISO16750 [6] and in ISO19453-6 (category 1) should not be used for design and testing for the use in BEVs because of massive over-testing.

3.5. Limitations of the Study

The study presented is based on only 45 measurements with two different standard BEVS and one small off-road mini truck from a preliminary data set before a research grant offers the possibility of further measurements and a significant enlargement of the data set. Only with a larger data set can the above indications on the statistical normal tolerance limit threshold to be expected over a large amount of different BEVs be fully justified. However, it is shown that varying the influences with the given data set does not push the threshold up in any significant manner, which renders them a probably substantial estimate.
As most OEMs treat their expected vehicle use times regarding different road surfaces and driving speeds as a secret, only academic assumptions can be publicly made here regarding the estimated exposure time. With realistic driving times for the different road surfaces a life-time damage accumulation can be performed and compared to actual standards as in [9].
Furthermore, the surfaces considered for the analysis as well as the assumptions and choices made to replicate reasonable vehicle life-time excitation are not following standardized proving ground surfaces described by the respective OEM for their vehicles. As the same surfaces and driving speeds have been used over all vehicles, etc., the data set is comparable in itself. Even though the self-defined parameters of the data set therefore make this contribution rather an academic feasibility study, the methods and procedures used proved well suited for a more detailed application in or with industry.
The load profile defined in this work is not sufficient for setting up a complete realistic test environment. For this, it is necessary to also investigate the accelerations in both longitudinal directions that are not considered in this work. Furthermore, measurements on only three vehicles are not transferable to all other battery-powered electric cars and further measurement campaigns have to be conducted. It is also necessary to examine the accelerations of battery packs with a more integral design of cells directly being coupled, i.e., by glue to high level support structures, sometimes even without module housing (cell2pack) of new vehicle designs. It is possible that the stronger mechanic coupling with the vehicle would result in greater accelerations. Moreover, different amounts of damping from sealing, foam and glue will significantly change the vibration behavior of the packs which will couple and interact with the rest of the vehicle.

4. Conclusions

The statistical evaluation carried out provides an understanding of the extent to which different vehicle configurations and driving surfaces have an influence on the accelerations measured on the battery of a BEV. The NTL used in the analysis to derive a conservative life-time-testing PSD profile covers a 95% limit for a 50% confidence as recommended in ISO 60721-2-9 [19].
  • The high-voltage battery packs of both standard automotive vehicles experience the highest loads at the corner points of the battery facing forward in the direction of driving.
  • The loading of extra weight in the rear legroom of the standard automotive BEVs only has a minor influence on vibration levels and resonance frequencies of the pack [1].
  • In contrast, the different driving road surfaces have a very strong influence on the measured accelerations. Due to low accelerations occurring on smooth tarmac, this influence can be neglected when testing the battery pack also under the rough road conditions used in this analysis because the levels remain far below infinite-life fatigue levels. The test profile created from the measured data with the given assumptions was then compared to applicable standards.
  • Out of the standards considered in this comparison for life-time testing, only the profile of ISO19453-6 cat 2 seems to be suitable for a realistic, but in general conservative, fatigue life-time testing of the standard automotive battery packs. Using other standards, such as LV124-2 [24], ISO16750-3 [6] and ISO19453-6 [2] (category 1), may result in incorrect dimensioning of the structural parts and massive over-testing. Using ISO6469-1 [8] for life-time fatigue testing may result in significant under-testing. This standard is not designed for fatigue testing.
  • Larger masses of bigger battery packs will also change the resulting excitation vibrations into the battery pack. It is assumed that larger masses reduce the vibration level in general and over a wide frequency range as can be seen by the difference of ISO19453-6 Cat 1 and Cat 2 [2] as well as the analysis of larger construction machinery battery packs.
  • The combination of a very stiff suspension with high vibration power input to a small and lightweight battery pack such as in the commercial off-road mini truck clearly marks a worst case, increasing the calculated 95/50-NTL by at least one decade.
In summary, the relationships established in this contribution represent another step in establishing a vibration profile for testing battery packs at the component level. The determined excitation characteristics based on the available measurement data challenge the excitation characteristics required in some of the current standards.

Author Contributions

Methodology, B.P.; Software, T.H.; Investigation, T.H. and B.P.; Resources, M.K.; Data curation, T.H.; Writing—review & editing, T.H., B.P. and M.K.; Supervision, B.P. All authors have read and agreed to the published version of the manuscript.

Funding

The authors received no specific funding for this pre-study. There are pending funding proposals for the further progress of the path described. We acknowledge support for the article processing charge by the Open Access Publication Fund of Hamburg University of Applied Sciences.

Data Availability Statement

The data presented in this study are available on request from the corresponding author.

Conflicts of Interest

The authors declare that they have no conflict of interest to report regarding the present study.

References

  1. Plaumann, B. Towards Realistic Vibration Testing of Large Floor Batteries for Battery Electric Vehicles (BEV). Sound Vib. 2022, 56, 1–19. [Google Scholar] [CrossRef]
  2. ISO 19453-6; Road Vehicles—Environmental Conditions and Testing for Electrical and Electronic Equipment—Part 6. Traction Battery Packs and Systems. International Organization for Standardization: Geneva, Switzerland, 2020.
  3. Kutka, H.; Müller, C.; Fülöp, T.; Dörnhöfer, A. Multilevel fatigue analysis of RESS in BEV/HEV—Multilevel-Festigkeitsentwicklungen der HV-Speicher von BEV/HEV-Fahrzeugen. In Berichtsband zur 45. Tagung des DVM-Arbeitskreises Betriebsfestigkeit; Brune, M., Ed.; Deutscher Verband für Materialforschung und -Prüfung: Berlin, Germany, 2018; pp. 1–18. [Google Scholar]
  4. Hooper, J.M.; Marco, J. Characterising the in-vehicle vibration inputs to the high voltage battery of an electric vehicle. J. Power Sources 2014, 245, 510–519. [Google Scholar] [CrossRef]
  5. J2380_202112; Vibration Testing of Electric Vehicle Batteries. SAE International: Warrendale, PA, USA, 2021.
  6. ISO 16750-3; Road Vehicles—Environmental Conditions and Testing for Electrical and Electronic Equipment—Part 3: Mechanical Loads. International Organization for Standardization: Geneva, Switzerland, 2012.
  7. UN ECE Regulation No. 100; Agreement Concerning the Adoption of Uniform Technical Prescriptions for Wheeled Vehicles, Equipment and Parts Which Can Be Fitted and/or Be Used on Wheeled Vehicles and the Conditions for Reciprocal Recognition of Approvals Granted on the Basis of These Prescriptions: Addendum 99. UNECE: Geneva, Switzerland, 2013.
  8. ISO 6469-1; Electrically Propelled Road Vehicles—Safety Specifications—Part 1: Rechargeable Energy Storage System (RESS). International Organization for Standardization: Geneva, Switzerland, 2019.
  9. Kjell, G.; Lang, J.F. Comparing different vibration tests proposed for li-ion batteries with vibration measurement in an electric vehicle. In Proceedings of the 2013 World Electric Vehicle Symposium and Exhibition (EVS27), Barcelona, Spain, 17–20 November 2013; IEEE: New York, NY, USA, 2013; pp. 1–11. [Google Scholar]
  10. Gao, W.; Li, X.; Ma, M.; Fu, Y.; Jiang, J.; Mi, C. Case Study of an Electric Vehicle Battery Thermal Runaway and Online Internal Short-Circuit Detection. IEEE Trans. Power Electron. 2020, 36, 2452–2455. [Google Scholar] [CrossRef]
  11. Wang, Q.; Ping, P.; Zhao, X.; Chu, G.; Sun, J.; Chen, C. Thermal runaway caused fire and explosion of lithium ion battery. J. Power Sources 2012, 208, 210–224. [Google Scholar] [CrossRef]
  12. Giannelos, S.; Borozan, S.; Strbac, G. A Backwards Induction Framework for Quantifying the Option Value of Smart Charging of Electric Vehicles and the Risk of Stranded Assets under Uncertainty. Energies 2022, 15, 3334. [Google Scholar] [CrossRef]
  13. Borozan, S.; Giannelos, S.; Strbac, G. Strategic network expansion planning with electric vehicle smart charging concepts as investment options. Adv. Appl. Energy 2021, 5, 100077. [Google Scholar] [CrossRef]
  14. Schramm, D.; Hiller, M.; Bardini, R. Vehicle Dynamics: Modeling and Simulation; Springer: Berlin/Heidelberg, Germany, 2014. [Google Scholar]
  15. EN 1999-1-3; Eurocode 9: Design of Aluminium Structures—Part 1–3: Structures Susceptible to Fatigue. CEN: Brussels, Belgium, 2011.
  16. Gaberson, H.A.; Chalmers, R.H. Modal Velocity as a Criterion of Shock Severity. Shock. Vib. Bull. 1969, 40, 31–49. [Google Scholar]
  17. Gaberson, H.A. Shock Severity Estimation. Sound Vib. 2012, 46, 12–19. [Google Scholar]
  18. Ahlin, K. Comparison of test specifications and measured field data. Sound Vib. 2006, 40, 22–24. [Google Scholar]
  19. IEC 60721-2-9; Classification of Environmental Conditions—Part 2–9: Environmental Conditions Appearing in Nature—Measured Shock and Vibration Data—Storage, Transportation and In-Use. IEC: Geneva, Switzerland, 2015.
  20. ISO 18431-4; Mechanical Vibration and Shock—Signal Processing—Part 4: Shock-Response Spectrum Analysis. International Organization for Standardization: Geneva, Switzerland, 2007.
  21. Hooper, J.; Marco, J. Defining a Representative Vibration Durability Test for Electric Vehicle (EV) Rechargeable Energy Storage Systems (RESS). World Electr. Veh. J. 2016, 8, 327–338. [Google Scholar] [CrossRef]
  22. McNeill, S.I. Implementing the Fatigue Damage Spectrum and Fatigue Damage Equivalent Vibration Testing. In Proceedings of the 79th Shock and Vibration Symposium, Orlando, FL, USA, 26–30 October 2008. [Google Scholar]
  23. Kersch, K.; Wagner, A.; Kuttner, T.; Woschke, E. Improved Techniques for Uniaxial and Multiaxial Vibration Test Profile Definition. J. IEST 2020, 63, 53–62. [Google Scholar] [CrossRef]
  24. LV 124-2; Electric and Electronic Components in Motor Vehicles up to 3.5 t—General Requirements, Test Conditions and Tests Part 2: Environmental Requirements. Mercedes MBN: Stuttgart, Germany, 2013.
  25. MIL-STD-810; Environmental Engineering Considerations and Laboratory Tests. Department of Defence (DOD): Washington, DC, USA, 2014.
  26. Plaumann, B. Anforderungen an die Vibrationsprüfung von großen unterflurmontierten Batterien für batteriebetriebene Elektrofahrzeuge (BEV)—Requirements for vibration testing of large underfloor-mounted battery for Battery Electric Vehicles (BEV). In Proceedings of the Workshop Brennstoffzelle, Batterie, Elektrischer Antrieb—Anforderungen und Absicherung 2021, Ulm, Germany, 17–18 November 2021. [Google Scholar]
  27. Statista, Bundesamt für Strassen (Schweiz). Zustand der Straßen in der Schweiz nach Bereich im Jahr 2020. December 2021. Available online: https://de.statista.com/statistik/daten/studie/936023/umfrage/zustand-der-strassen-in-der-schweiz-nach-bereich/ (accessed on 1 December 2022).
Figure 1. Concepts of cell2car and module2pack [1].
Vehicles 05 00025 g001
Figure 2. Incoherent movements (left) and incoherent excitation forces (right) on the corners (indicated by different directions) on a vehicle chassis.
Vehicles 05 00025 g002
Figure 3. First two modes of global bending (left), simple mode of global torsion and local corner bending (right) for a vehicle floor battery pack, similar to [2].
Vehicles 05 00025 g003
Figure 4. Boundary considerations of fatigue analysis using a typical SN curve.
Vehicles 05 00025 g004
Figure 5. Shock Response Spectrum (SRS) calculation for a simplified graph with only five possible resonating frequencies considered.
Vehicles 05 00025 g005
Figure 6. FDS for driving over different surfaces for the VW ID.3, calculated for 1h.
Vehicles 05 00025 g006
Figure 7. Road surfaces: BMW i3/loaded/right front (RF).
Vehicles 05 00025 g007
Figure 8. Statistical evaluation of the BMW i3 over all measurement data.
Vehicles 05 00025 g008
Figure 9. Statistical evaluation of the VW ID.3 over all measurement data.
Vehicles 05 00025 g009
Figure 10. Comparison of 95/50 normal tolerance limits for cobble stone and rough cobble stone measurements of VW&BMW vs. EVUM commercial minitruck.
Vehicles 05 00025 g010
Figure 11. Load profile calculated from measurement data.
Vehicles 05 00025 g011
Table 1. Categories of battery packs in ISO 19453-6 [2].
PropertiesCategory 1Category 2Category 3
Weight10–30 kg200 kg400–700 kg
PlacementDifferent places in carTunnel area, rare seats, trunkunderfloor-mounted constructions
ApplicationMild Hybrid Electric Vehicles (MHEVs)Hybrid Electric Vehicles/Plugin Electric Vehicles (HEVs/PHEVs)Battery Electric Vehicles (BEVs)
Table 2. Vehicles used for the preliminary analysis.
VehicleCompact BEV
VW ID.3
Compact BEV
BMW i3
EVUM aCar (Off-Road Mini Truck for Contrasting Design Requirements)
empty weight1810 kg1320 kg1460 kg
max gross weight2270 kg1670 kg2600 kg
added mass loading additional to driver etc. (80 kg)0 kg0 kg80 kg
(permanent second passenger)
87.5 kg
200 kg162.5 kg
battery energy62 kWh33 kWh16.5 kWh
battery pack weight376 kg256 kgca. 225 kg
Table 3. Measurement data acquisition equipment.
IEPE one-axial piezo accelerometer with charge amplifiers
PCB M353B18 ± 500 gn at 10 mV/gn
PCB-483C05 AC coupling with constant current for charge amplifiers
USB data acquisition system
Meilhaus Redlab, rebranded Measurement Computing (MCC)
1608 G with 16 bit, 16 analog inputs at ±1 to 10 V, 250 kS/s common rate
sampling rate per channel 15 kHz
Disclaimer/Publisher’s Note: The statements, opinions and data contained in all publications are solely those of the individual author(s) and contributor(s) and not of MDPI and/or the editor(s). MDPI and/or the editor(s) disclaim responsibility for any injury to people or property resulting from any ideas, methods, instructions or products referred to in the content.

