Article

Assessing the Accessibility of Cycling Infrastructure for Wheelchair Users: Insights from an On-Road Experiment and Online Questionnaire Study

Laboratoire Perceptions, Interactions, Comportements & Simulations Des Usagers de la Route Et de la Rue (PICS-L), Components and Systems Department (COSYS), Gustave Eiffel University, 77420 Champs sur Marne, France
*
Author to whom correspondence should be addressed.
Vehicles 2023, 5(1), 321-331; https://doi.org/10.3390/vehicles5010018
Submission received: 14 January 2023 / Revised: 27 February 2023 / Accepted: 28 February 2023 / Published: 2 March 2023
(This article belongs to the Special Issue Recent Developments in the Intelligent Transportation System (ITS))

Abstract

:
In this paper, we pay significant attention to the most vulnerable road users (i.e., people with disabilities) when interacting with cyclists. The special needs of these groups are studied by distributing an online questionnaire about their perception and interaction with cyclists besides conducting an on-road experiment to test the possibility of sharing cycling infrastructure with wheelchair users. In an authentic case study, 2 cyclists and 5 wheelchair users were asked to ride their vehicles on a cycling lane in Madrid, in order to evaluate wheelchair users’ interaction with cyclists and reaction to the infrastructure by applying objective and subjective measures. The participants were provided with GPS, a speed sensor, and a head-mounted camera to record the experiment. The results show that people with disabilities feel threatened by cyclists who share the sidewalk with them; the respondents to the questionnaire suggested making the sidewalk free of cyclists to avoid conflict and improve safety. Moreover, the outputs of the experiment show positive feedback from wheelchair users when sharing cycling infrastructure regarding the improvement of speed and safety feeling. However, it is recommended to increase the number of wheelchair users to obtain more reliable and generalizable results.

1. Introduction

The United Nations (UN) defines disability as ’long-term physical, mental, intellectual or sensory impairments which in interaction with various barriers may hinder a person’s full and effective participation in society on an equal basis with others’ [1]. Globally, the number of people who are currently experiencing disability is over 1 billion, which represents about 15% of the global population [2,3,4]. At least 430 million of them suffer from a hearing impairment that requires assistance [5], around 253 million suffer from visual impairment, out of which 36 million are blind [6], and between 250k to 500k people suffer a Spinal Cord Injury (SCI) around the world every year; caused by trauma (e.g., a car crash) or from disease or degeneration (e.g., cancer) [7,8], which leads to reduced or complete loss of walking and, accordingly, using a wheelchair to mobilize. In Spain (where this study took place), 4.38 million people (9% of the total population) state that they have some health problems that limit the development of their daily lives, with aging as one of the main causes [9]. In fact, almost everyone will experience some kind of disability during their lifetime (e.g., movement difficulties that accompany aging).
The different types of disability—cognitive or physical—which can be caused by disease, trauma, or aging, lead to problems in mobility [10,11,12,13] and limit the inclusion of disabled people in social activities [14,15,16]. A lot of challenges are facing urban road accessibility, including narrowing in sidewalks caused by the existence of urban furniture and trees, inadequate paving, lack of recess in the crossings, and elements limiting the free height of step [17]. According to a survey conducted by a Non-Governmental Organization (NGO), 98% of blind people experienced accidents while commuting in urban environments [18].
Mobility, as well as the observation and comprehension of information about the urban environment, are more difficult for people with physical, mental, or sensory disabilities, wheelchair users, and people with vision impairment. The state of the art on disabled people’s mobility needs is constantly evolving as new research, technology, and policies are developed to improve accessibility and mobility for people with disabilities; this includes features such as wheelchair ramps, tactile paving, and audible traffic signals to improve mobility and safety for people with visual, hearing, or mobility impairments [19]. Besides, advances in assistive technology have greatly improved the mobility of people with disabilities; these include electric wheelchairs, prosthetic limbs, and mobility aids such as canes and crutches, which are becoming more advanced and customizable to meet individual needs [20]. Moreover, the development of accessible transportation systems, such as low-floor buses, accessible taxis, and paratransit services, has greatly improved mobility for people with disabilities, particularly in urban areas [21,22]. In recent years, the concept of “universal design”, which entails creating places and products that are useable and accessible to everyone, regardless of ability, has drawn more attention. Instead of retrofitting products and places to accommodate individuals with disabilities, this strategy makes sure that they are created from the ground up to be inclusive [23].
Overall, there is a growing awareness and recognition of the importance of improving mobility and accessibility for people with disabilities. As part of this recognition and in accordance with the United Nations Convention on the Rights of Persons with Disabilities (CRPD), the EU members committed to improving the social and economic circumstances of people with disabilities, including increasing their mobility and enhancing their access to transportation networks [24]. In order to accomplish this, the metropolitan road network must be altered to accommodate the particular demands of the disabled and aged depending on the disability type; for example, wheelchair users require wide sidewalks with plenty of space; smooth, durable, and non-slippery pavement in both dry and wet circumstances; and well-designed ramps.
Even though the accessibility in public transport is well investigated, we have not found any source in the literature addressing the interaction between people with disabilities and cyclists, this interaction is very important to study, especially for short (<1 km) and medium (1–3 km) trips of people with disabilities (e.g., going to a supermarket or walking the dog). While cycling can offer benefits such as reduced carbon emissions and increased mobility, it also raises concerns about sidewalk congestion and safety for people with disabilities or limited mobility [25]. The proper and safe design of inclusive infrastructure may lead to allowing some disabled people, such as electric wheelchair users, to use these infrastructures for longer distances (e.g., to go to work) without the need to use public transport, this alternative could save their time and effort, gives them more freedom, and reduce the pressure on public transport.
This study contributes to the EU’s commitment to the mobility needs of people with disabilities. We discuss in this article the impact of cycling on accessibility, including how people with special needs perceive the various infrastructural elements, how they interact with other road users sharing the sidewalk with them, and how they detect and interact with cyclists. Sharing cycling infrastructure with wheelchair users may lead to improved accessibility and mobility for individuals with disabilities, as well as increased space and safety for pedestrians on sidewalks. This hypothesis suggests that sharing cycling infrastructure with electric wheelchair users may be beneficial for them and society as a whole. To test this hypothesis, we conduct a First-of-a-kind experiment, including cyclists and electric wheelchair users, to investigate factors such as the feasibility and safety of shared infrastructure, the impact on transportation patterns, and the experiences and perceptions of electric wheelchair users and cyclists.
The article is structured as follows: the second section is devoted to the methodology used in this study, which includes an online survey about the challenges facing people with disabilities when interacting with cyclists; and on-road experimentation conducted using wheelchairs and bicycles; the third section shows the analysis of the online survey and discusses the results of the experiment comparing between cyclists and wheelchair users; and finally the conclusion.

2. Materials and Methods

Two methods were used to assess the special mobility needs of people with disabilities; the first method included an online questionnaire, and the second method included a case study by conducting an on-road experiment with cyclists and wheelchair users.

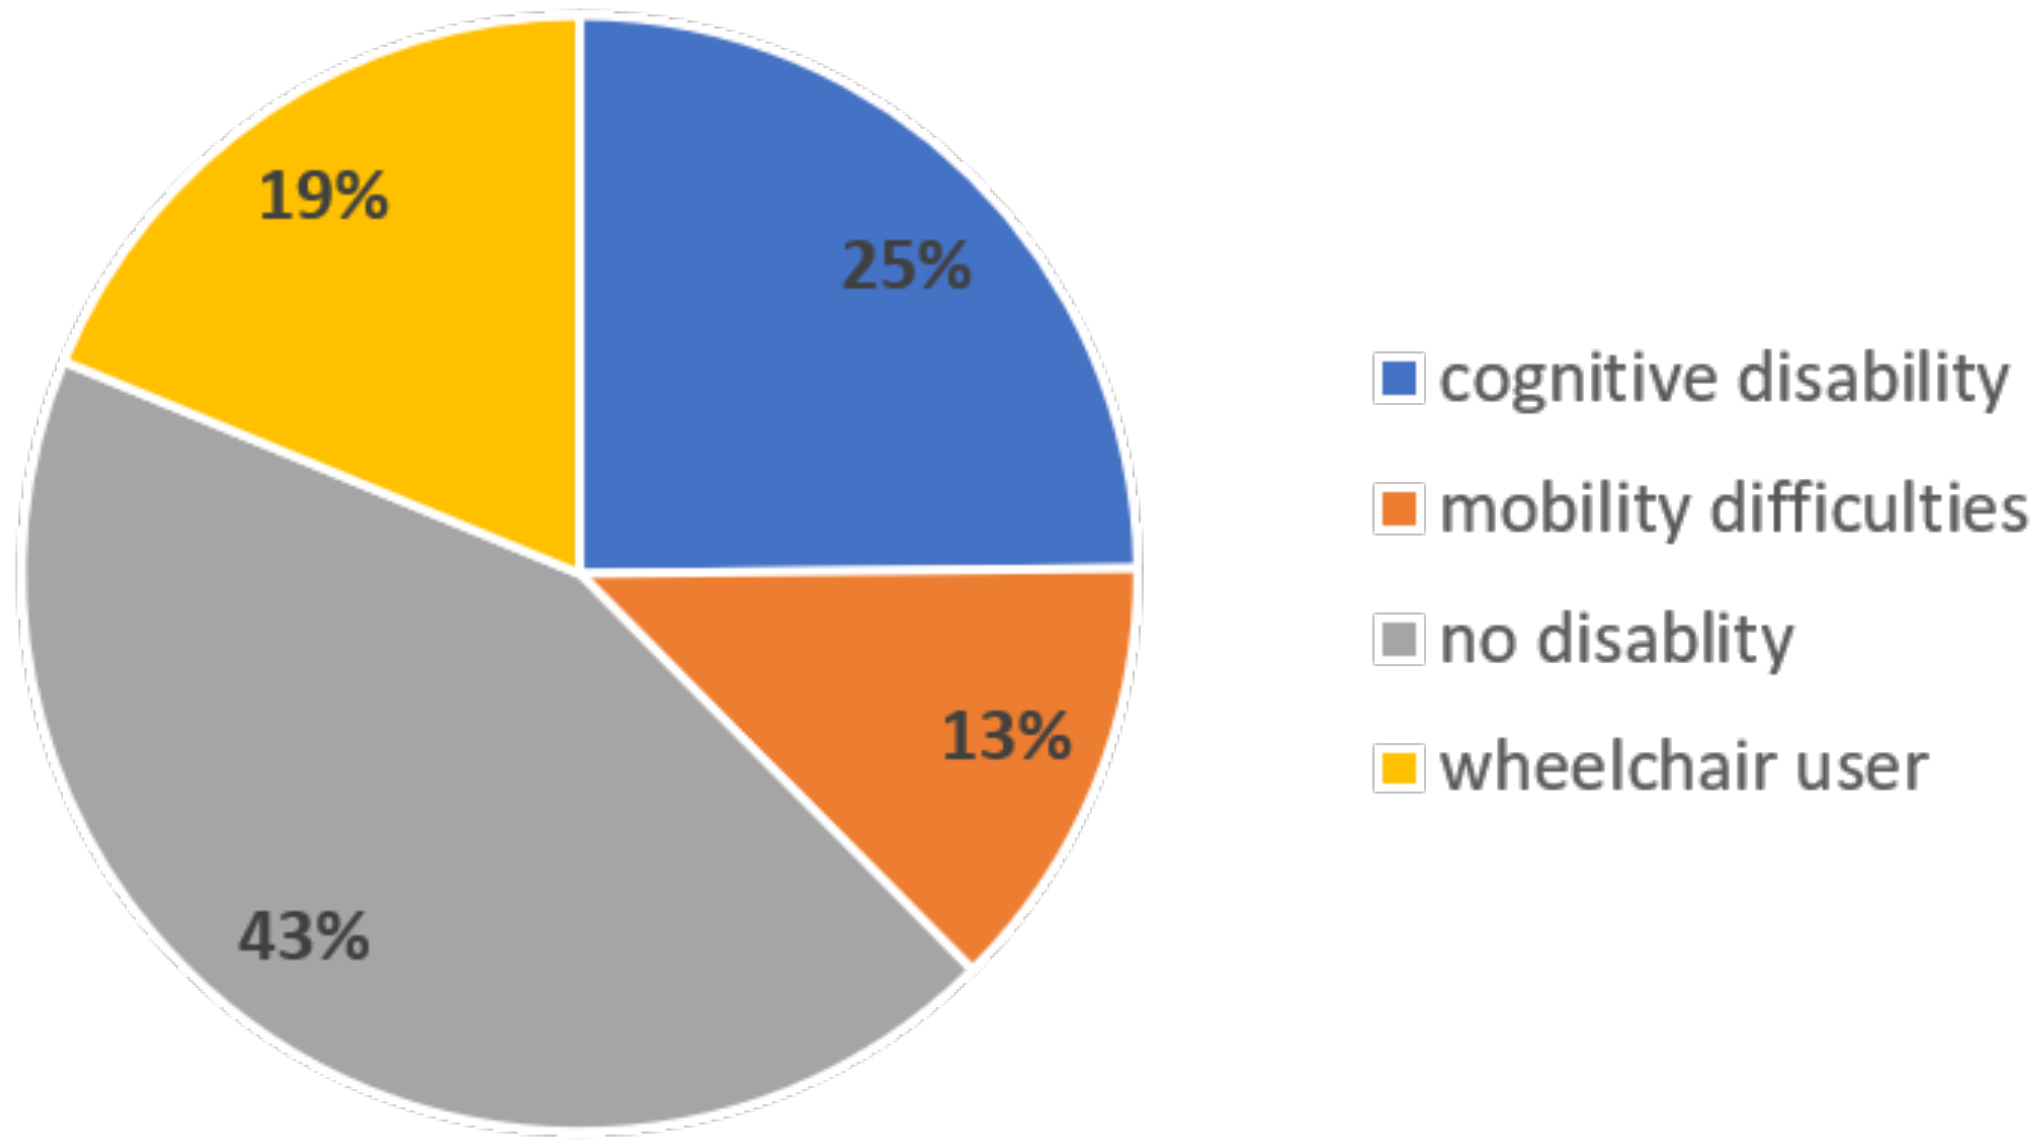
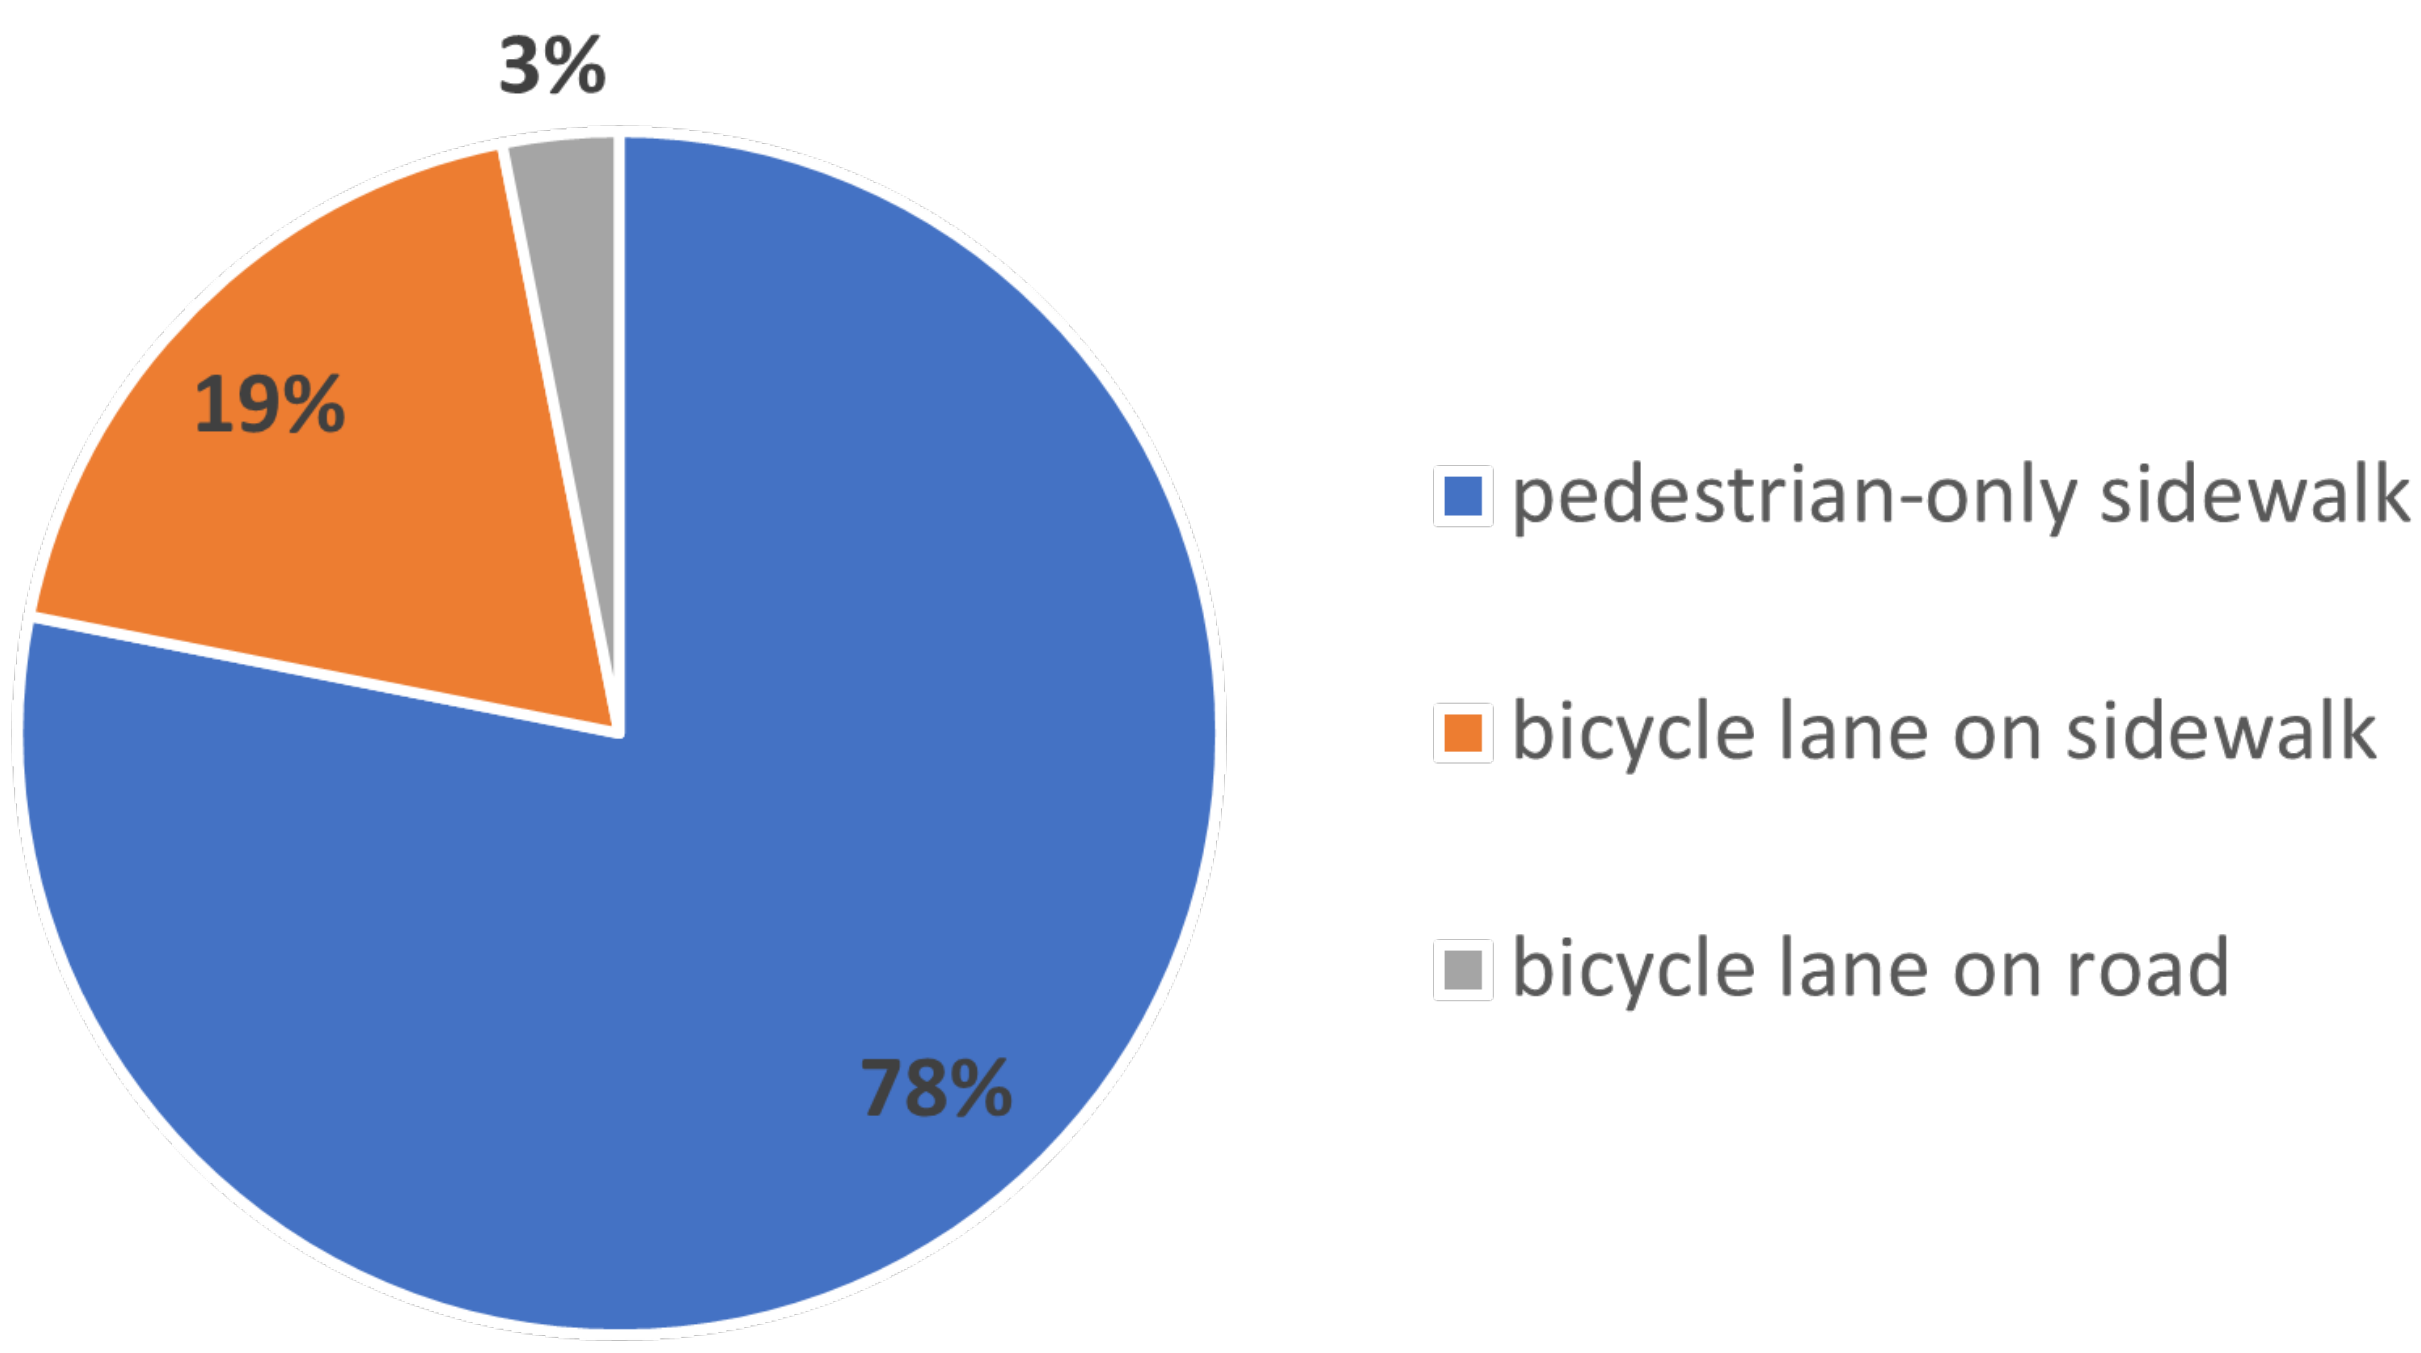
2.1. Online Survey Targeting People with Disabilities

In November 2021, an online questionnaire was sent to email lists of the ONCE Foundation and published on its website targeting people with disabilities or movement difficulties, (Fundacion ONCE) is a Spanish organization founded in February 1988, for the purpose of social inclusion of people with disabilities and improve their living conditions [26]. The survey was online for a month before starting the analysis. The main goals of this survey are: first, to analyze disabled users’ mobility needs in order to include their behavior in driving systems; second, to study the influence of the road surface characteristics and geometric design on the safety and behavior of disabled road users; and finally, to study the interaction between cyclists and disabled people.
The questionnaire was divided into two parts, the first part is dedicated to all kinds of people whether they suffer from a disability or not, whereas the second part was dedicated exclusively to wheelchair users. The first part consisted of different questions related to personal general information such as age, gender, and type of disability; the experience and challenges facing them as a road-users; and the interaction with cyclists and road infrastructure. The second part was dedicated to studying the interaction of wheelchair users with the infrastructure and other road users.

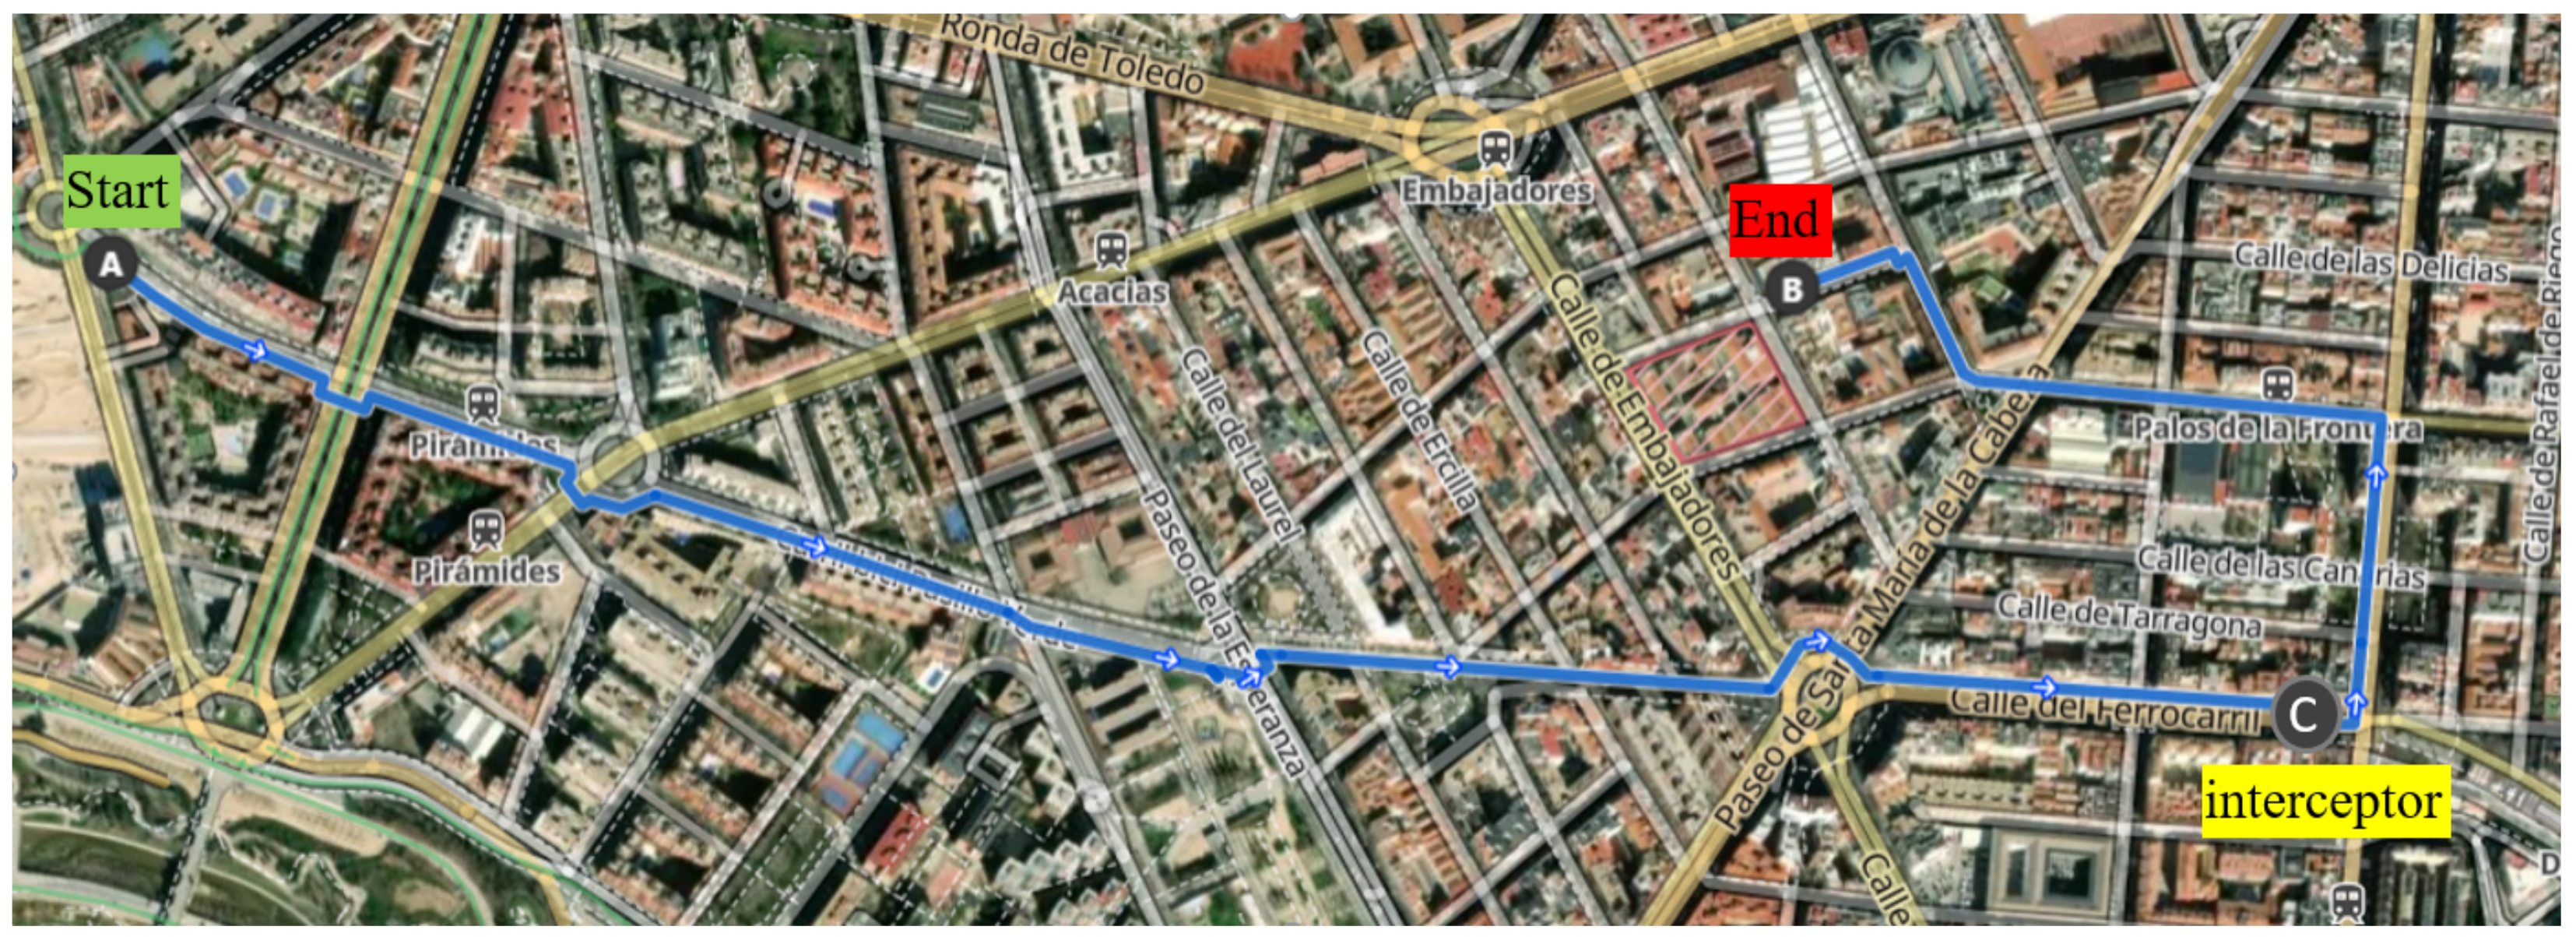
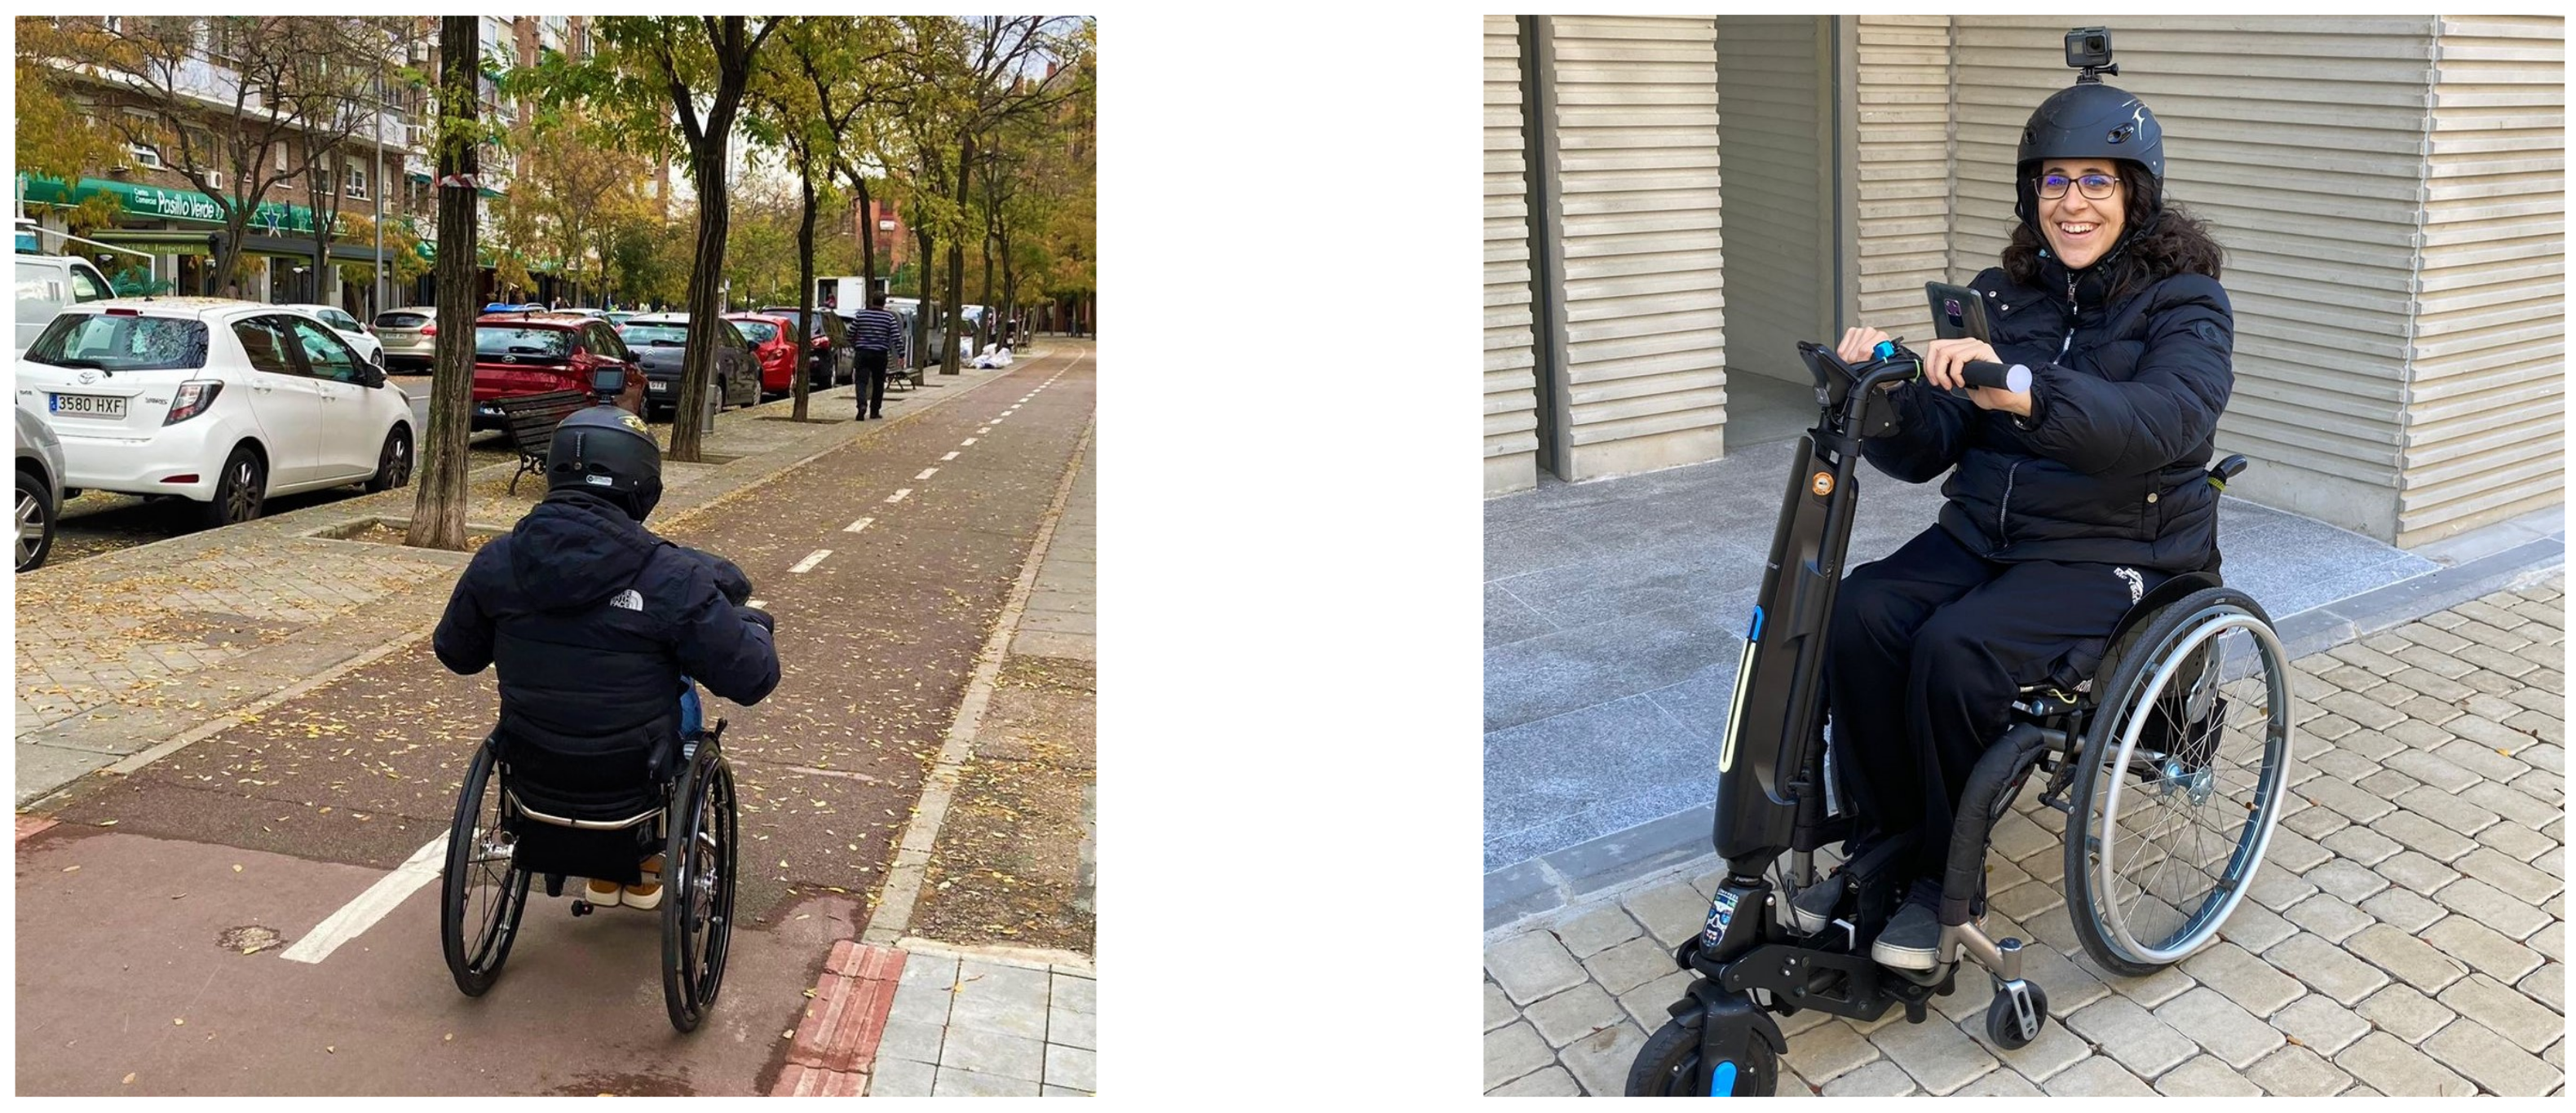
2.2. On-Road Case Study

Compared to other road users, wheelchair users need evener and flatter surfaces, lowered footpaths, barrier-free ways [27], and more spacious and wider paths, as the universal dimensions of the wheelchair are 1.35 × 1.35 m [28]. These specifications are similar to the ones required by bicycles, knowing that the recommended width for a one-way cycling lane ranges between 1.2 m and 1.5 m [29]. The goals of this case study are: to analyze the wheelchair-users behavior when using a separate cycling lane on the sidewalk level; analyze the road characteristics and their influence on the safety and behavior of road users; and study the interaction between cyclists and wheelchair users to verify the possibility of to use cycling infrastructure without hindering cyclists. The experiment took place in Madrid and Alcala in the third week of November 2021. Expected results will help to improve the infrastructure in terms of accessibility, safety, and comfort for road users.

Experimental Procedure

The experiment took place in two locations: the first one in Alcala where two experimental sessions were conducted on a two-way two-lane cycling path with a 2.7 m width, the experiment started and ended at the same point forming a circle of 2.8 km length, and the second location in Madrid, where 4 experimental sessions were conducted by wheelchair users and 2 sessions by cyclists. The route started at Plaza de Frencisco Morano and ended at Fundacion ONCE headquarter with a total length of 2.83 km. The route was divided into two zones: zone 1 is composed of a two-way two-lane cycling path with a 2.2 m width. The path was separated by trees from traffic and pedestrians and had a 2 km length (until point C on Figure 1), and zone 2 is composed of a sidewalk where the wheelchair dives among pedestrians for around 0.8 km. Detailed instructions concerning the experiment procedure were provided verbally during the test by the responsible people.
Prior to the experiment, the participants signed a standard consent form including brief details about their task, the data to be collected, and the use of the following analysis, the consent form assured the respect of the General Data Protection Regulation (GDPR) [30]. The participants have to follow the predetermined route using the Komoot application [31] on their mobiles. The participants in all sessions were provided with an Edge 130 plus device from Garmin to record their speed and trajectory, and a head-mounted sports camera was fixed on a helmet worn by wheelchair users to record the experiment as shown in Figure 2. A volunteering wheelchair user was asked to commute in the way of the two cyclists to observe their passing behavior closely, and an interceptor standing near point C (the end of zone 1) was stopping passing cyclists and scooter riders and asking them about their perception of the wheelchairs driving on the cycling infrastructure.
After the driving phase, the participants answered a questionnaire related to personal general information, their feelings during the experiment, and their evaluation of the interaction between wheelchair users and cyclists.

3. Results and Discussion

3.1. The Analysis of the Online Questionnaire

165 people responded to the online questionnaire: 92 (55.8%) of them were males and 73 (44.2%) were females; 3 of them were children (less than 14), 3 youth (15–24), 146 adults (25–64) and 12 seniors (more than 65). Figure 3 shows the different groups of people who responded to the questionnaire. 42 (25.5%) of all respondents said that the sidewalk is not shared with bicycles in their cities, whereas, 123 (74.5%) confirmed that the sidewalk is shared with bicycles.

3.1.1. The Perception of Cyclists by People with Disabilities

The analysis of the questionnaire shows that 76.4% of all respondents do not feel safe when sharing the sidewalk with cyclists; they interpret their feeling because of cyclists’ speeding and invasion of the limited space of the sidewalk; 77.6% said that cyclists ride their bicycles very fast on the sidewalk and 61.6% said they have difficulties detecting bicycles circulating in their path, because of their lack of viability and trouble hearing them (this mainly affects visual impaired people).
Responding to a question about their reaction to cyclists crossing their way, 83% said they stop until the cyclist passes, 7.3% said they continue their way hoping the cyclist stops, 4.2% said it depends on the condition and the passing priority, and the rest did not give a clear answer. In regards to when they thought it is appropriate for bicycles to stop, 90% said they should do so when they become aware that a person with a special need is planning to cross, while 10% said they should do so when the person with a special need actually begins to cross.
About encountering risky situations, 40.6% of the respondents said they experienced risky situations when interacting with cyclists; in 20 cases (12% of all respondents) an accident occurred leading to falling and sometimes causing bruises, one visually impaired respondent commented: “Despite having a bike path, they go on the sidewalk and they often complain that I don’t move away. Once they confronted me, they tried to attack me and my guide dog”. Answering a different question regarding the most appropriate place for cycling, 79.9% of the respondents suggested it should be on a separate cycling lane on street level, whereas 10.4% said the cycling lane should be on sidewalk level, and the rest were neutral.

3.1.2. Wheelchair Users’ Perceptions of Cyclists

Among 165 respondents, 32 wheelchair users responded to the online questionnaire and completed the second part dedicated exclusively to them. The responses came from 17 males, between 5 and 64 years old, and 15 females, between 11 and 63 years old, and included 2 children (less than 14) and 30 adults (25–64). 22 of them use manual wheelchairs and 10 use electric wheelchairs. The results show that 24 respondents (75%) feel unsafe when sharing the sidewalk with cyclists, and only 25% feel safe. 25 respondents (78%) said that the sidewalk is not well shared with other road users. They mentioned that they face some difficulties while driving their wheelchair on sidewalks including high curbs without ramps or with steep ramps, insufficient width, poor asphalt condition, conflict with pedestrians, architectural barriers, tree roots, unevenness of the road surface, lack of signals, and other obstacles like garbage bins, traffic signs, bushes, and advertisement banners, beside the low awareness and misbehavior of other road users, such as speeding and abrupt stopping. A wheelchair user commented: “the small wheels of the wheelchair get stuck sometimes, I use the cycling lanes when there are few bicycles but the wheelchair is wider than the bicycle. If the sidewalk is crowded some people can’t see you, and possibly crash you when the sidewalk is narrow, I use the street despite that it is dangerous”.
About the detection of cyclists on the sidewalk, 15 respondents (47%) said they have difficulty detecting bicycles, especially when they come from behind, it becomes harder to hear them. In regards to the estimation of their wheelchair speed, manual wheelchair users estimated their average speed between 1 and 6 km/h (the average for all is 4.36 km/h), whereas, the electric wheelchair users estimated their average speed between 4 and 10 km/h (the average for all is 6.43 km/h), and their maximum speed between 10 and 15 km/h.
Figure 4 shows the choice of the wheelchair-users regarding the most appropriate place to drive their wheelchair, the results show that 78% of them prefer to drive their wheelchair on a pedestrians-only sidewalk without sharing it with cyclists. They justify this choice by safety feelings as there are no other speeding cyclists; 19% chose a separate cycling lane on the same level of the sidewalk, justifying their choice by the pavement being more homogeneous, the existence of better ramps when joining the street at intersections, and there indirect interference with vehicles as they drive on different levels.
Figure 5 shows the choice of wheelchair users for the most comfortable surface to drive on. The results show that 66% chose concrete pavement, as it has a better grip, smoother surface, fewer joints, and fewer bumps and puddles compared to asphalt or tiled surfaces. These results correlate with a study by Fundacion ONCE shows that increased ground roughness, such as cobblestone pavement or tiles, causes dizziness and back pain for wheelchair users when moving on them for a long time [27].

3.2. The Analysis of the On-Road Experiment

Two cyclists (males aged 24 and 47 years old) and 5 wheelchair users (4 males and one female aged between 33 and 50 years old.) participated in the experiment, one of them repeated the experiment twice, in Alcala and Madrid. 4 of the wheelchair users mentioned that they use the electric wheelchair all the time, and 2 said they use it only for shopping or going for a walk. They have been using the wheelchair for between 8 and 28 years on daily basis. Their weekly travel distance ranges between 15 and 40 km (mean = 29 km, SD = 10.8). Three of them estimated their average speed to be 10 km/h, one 4 km/h, and one 7 km/h. Two of the participants said that they normally drive their wheelchairs on the sidewalk, whereas three of them drive on the cycling lane when there is enough space. The electric wheelchairs’ theoretical maximum speed limit differs from one model to another, with an average of 18.25 km/h; one wheelchair has a maximum speed limit of 30 km/h.

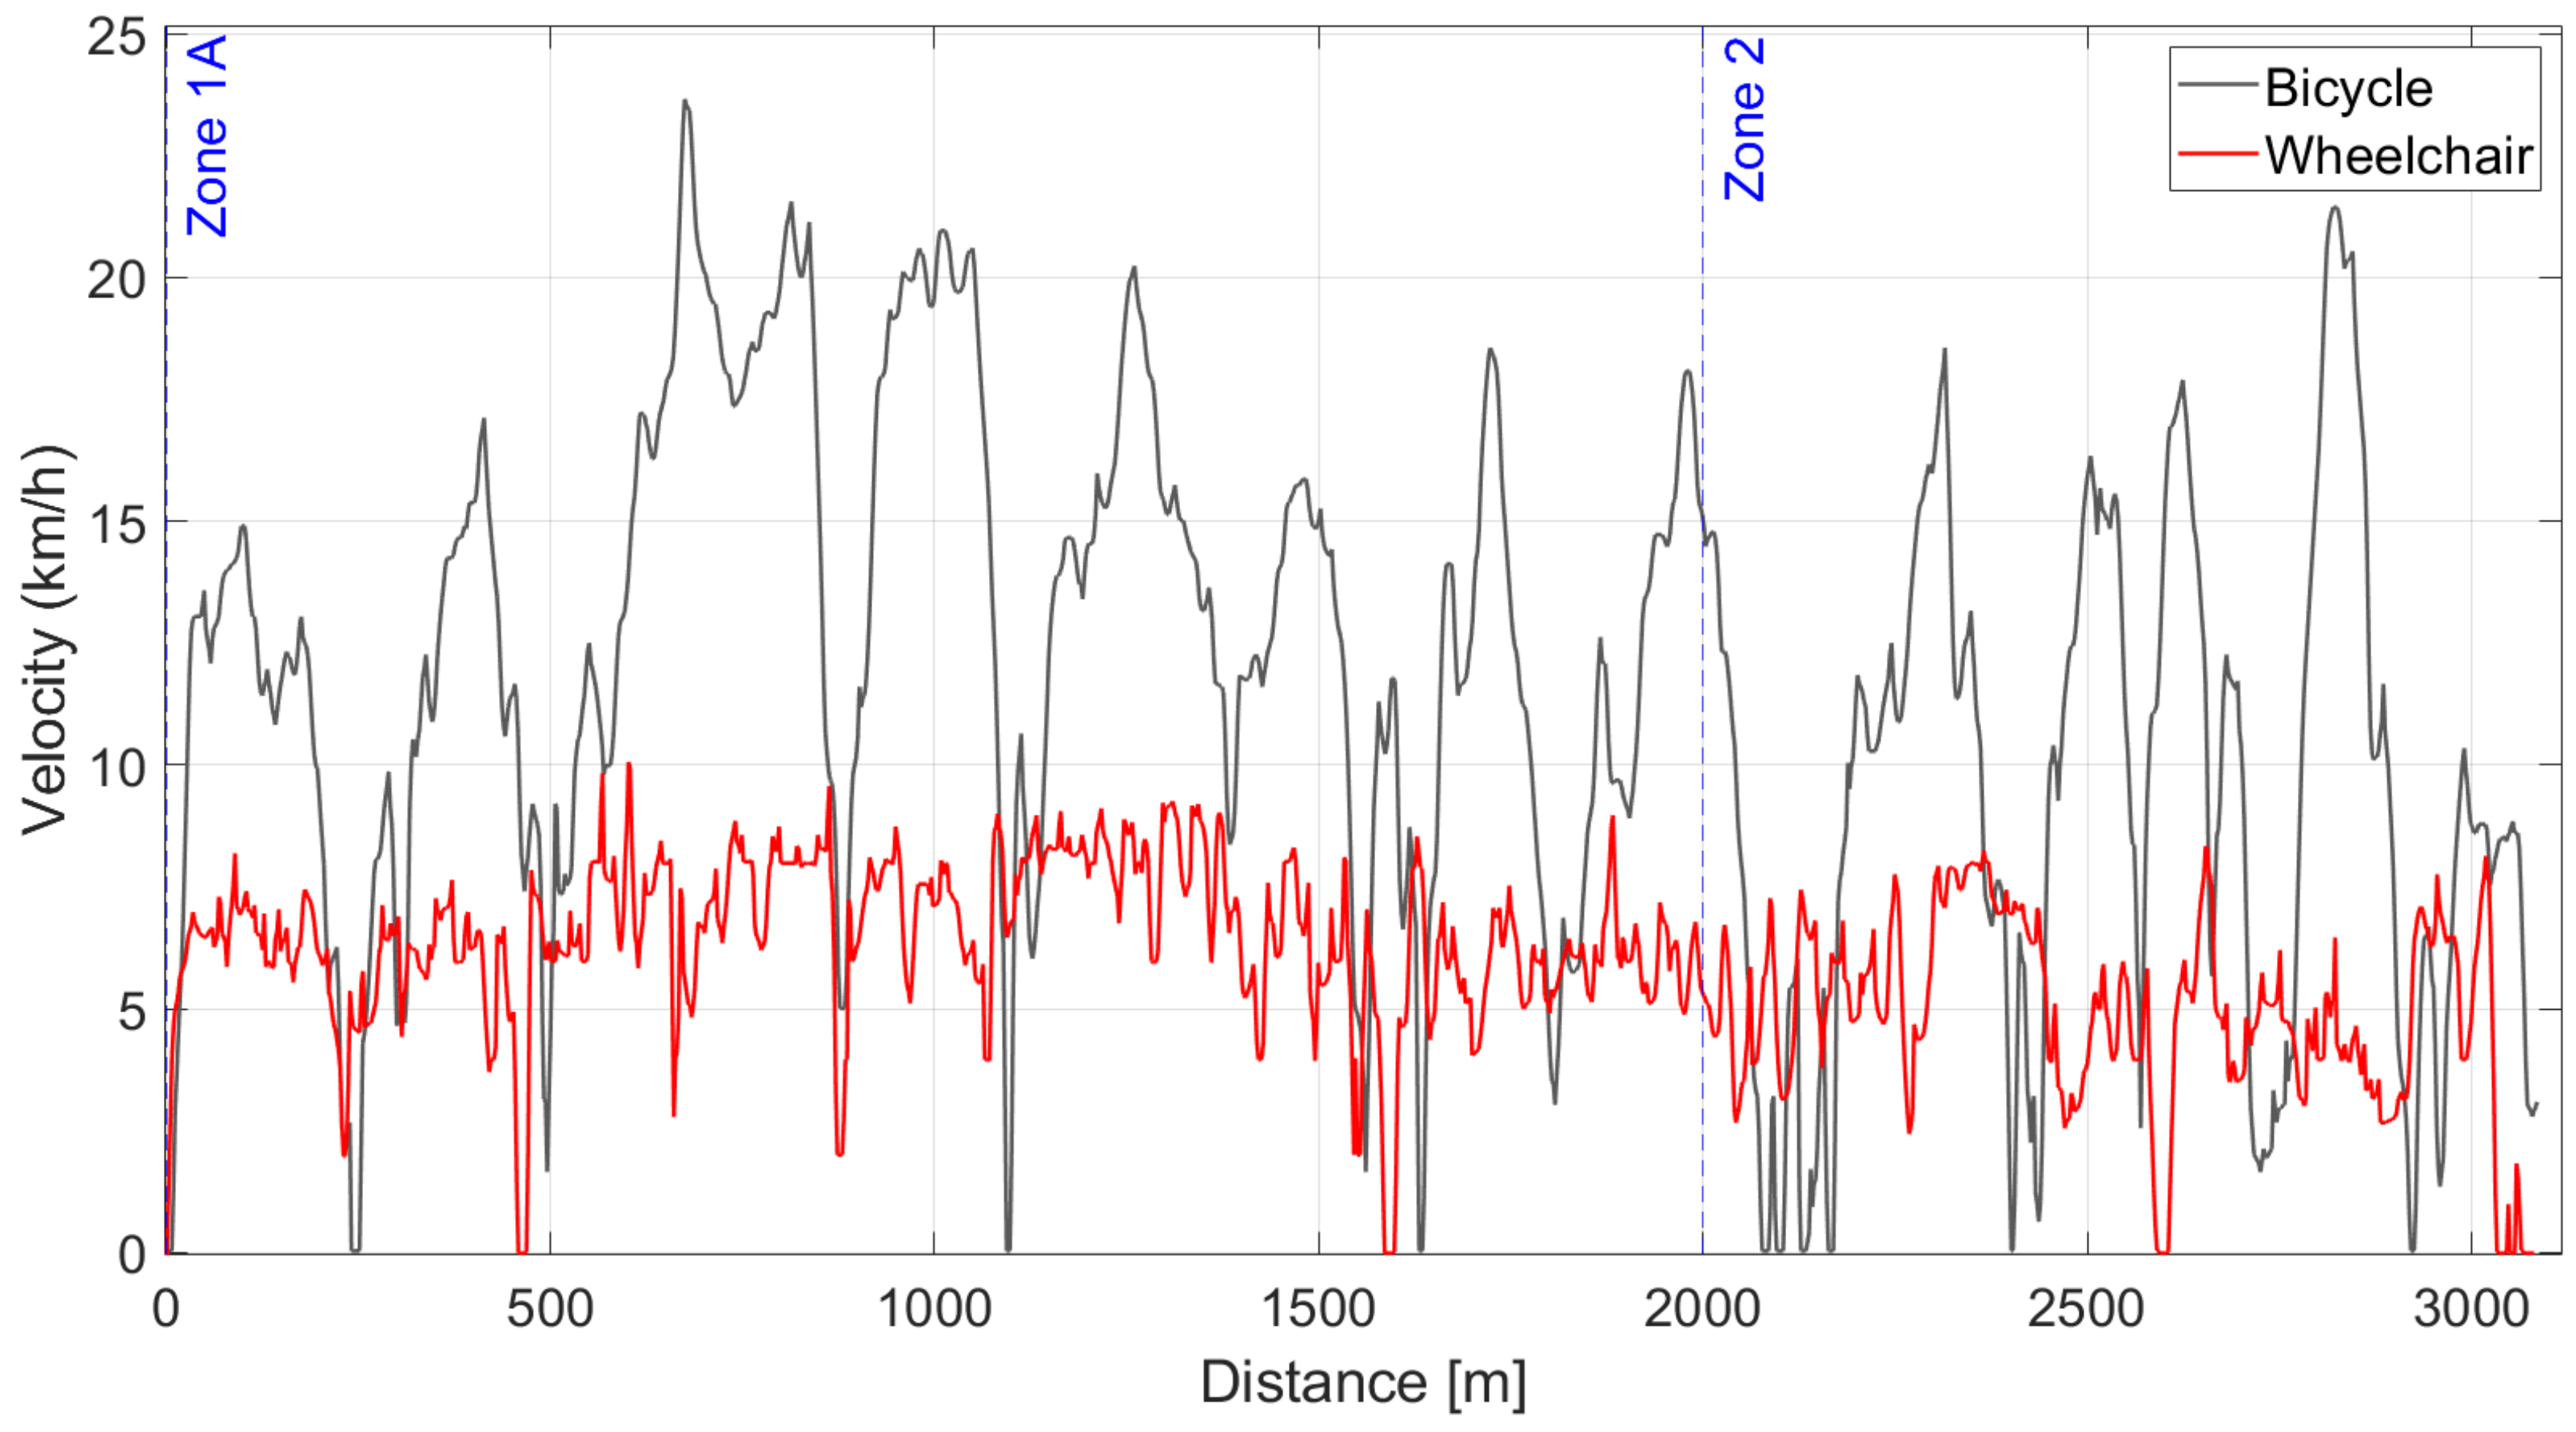
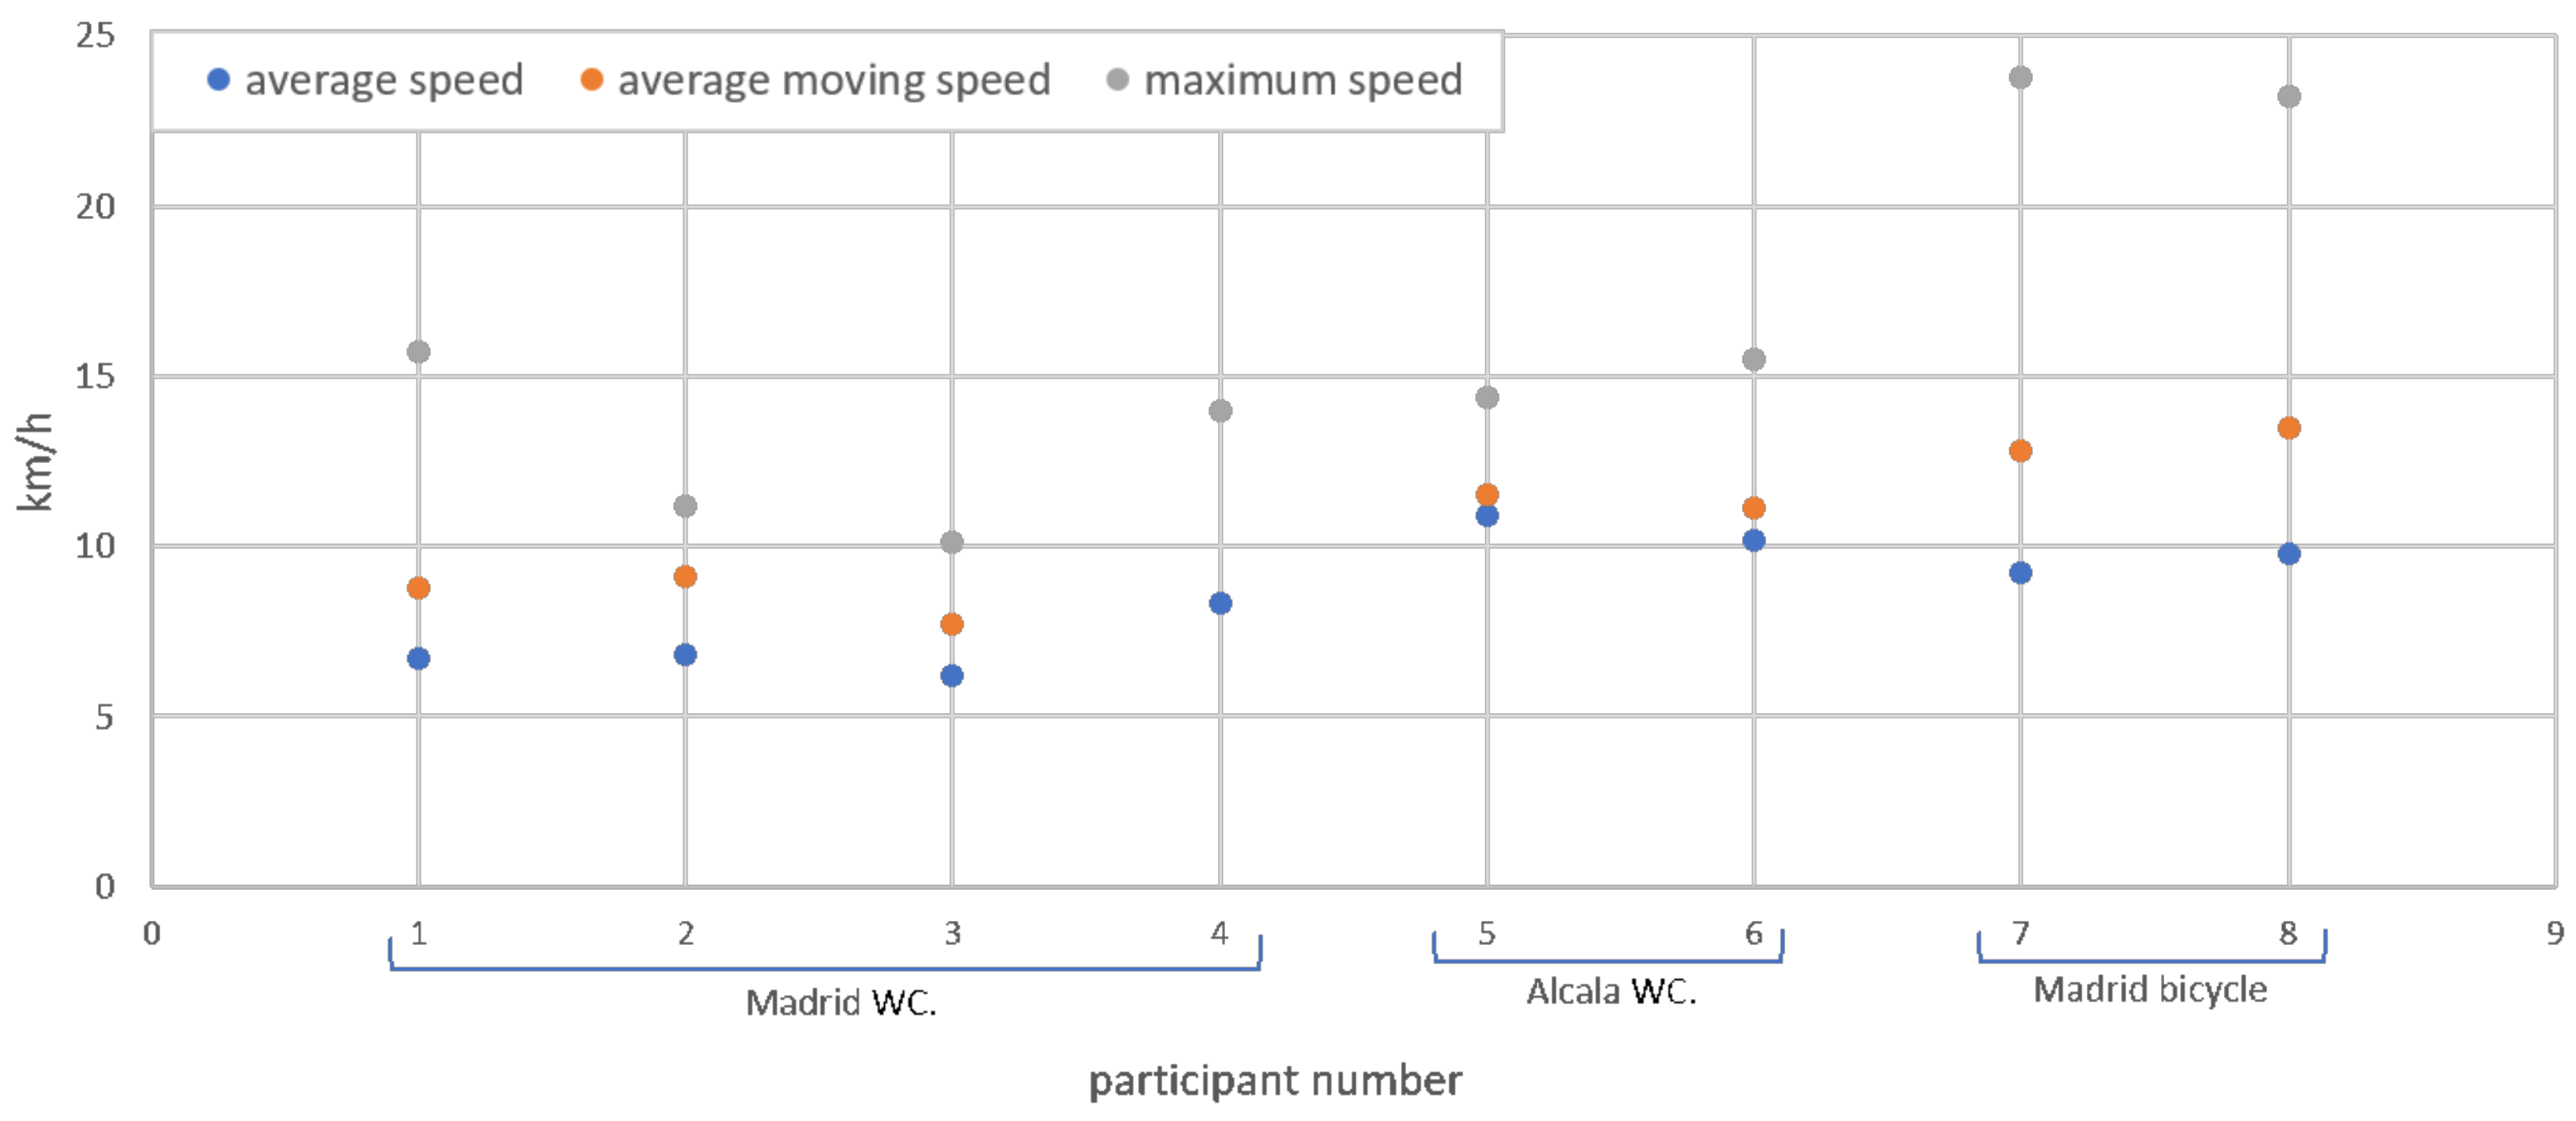
3.2.1. Speed Analysis of Wheelchair and Comparison with Cyclists

The analysis of the speed profile extracted from Garmin devise shows a similar behavior of accelerating and breaking between cyclists and wheelchair users. Figure 6 shows the speed profile for a wheelchair and a bicycle on the same experimental route. It is noticed that the cyclist’s speed is higher than the wheelchair user, even though acceleration and braking behavior match at some points along the route.
Figure 7 shows the average speed, the average moving speed, and the maximum speed for all participants including cyclists. We notice that the average normalized speed for all wheelchairs (9.64 km/h) is less than for cyclists (13.15 km/h). However, the wheelchair speed is still higher than pedestrians’ who have an average walking speed of 4.32 km/h [32].

3.2.2. Analysis of the Post-Experiment Questionnaire

The evaluation of wheelchair users driving experience on the cycling lane was studied through the analysis of the post-experiment questionnaire; 4 of the wheelchair users mentioned that they have a positive experience and general comfort, whereas one rated his experience as negative; all of them agreed it is useful to use the cycling lane, as it is safer, faster and more comfortable with fewer conflict points. In regards to their safety feeling, 3 participants said it is safer to use the cycling lane, whereas 2 said it is similar to driving on the sidewalks. One participant explained his unsafe feeling due to the existence of parked cars on the cycling lane which obliged him to drive beside cars. In regards to the width of the cycling lane, 3 participants thought that the space on the cycling lane is not sufficient for their wheelchairs, whereas 2 thought it is sufficient. All of them agreed they drove faster on the cycling lane because the surface is smoother, has less conflict with pedestrians, and fewer obstacles on the way; one participant commented: ’Accessibility on cycling lane is better because the pavement is even and it is respected by all pedestrians so the wheelchair can go faster’.
Regarding the interaction with passing cyclists, 4 participants mentioned that a cyclist passed them during the experiment. In 2 cases, the wheelchair user noticed the cyclist before he started passing him as he rang the bell before passing, whereas in 4 cases the participants noticed the cyclist only when he started passing. When the cyclists used the ring, the wheelchair users tried to slide right to allow more space for the cyclists.
Regarding their evaluation of the road’s geometric design and surface condition, they all agreed that the pavement condition of the cycling lane is better than the sidewalk. They mentioned difficulties encountered during the experiment such as sharp curves, unevenness of the road, damage to the road surface, and water channels. these obstacles forced them to slow down and made them feel uncomfortable. One participant recommended: ’I would like to see cycling lanes shared with wheelchairs in all cities because this allows wheelchair-users to go faster and safer.’

3.2.3. Cyclists’ Perception of Wheelchair Users

At the end of zone 1 of the experimental route, eight cyclists and one scooter were intercepted to answer some questions about passing the wheelchair users. All were males between 24 and 47 years. Seven of them (78%) said there is enough space to share the cycling with wheelchairs, whereas 2 (22%) said the space is insufficient. Seven of them said they did not use the ring bell when passing, one cyclist explained: ’when I use the ring, people get scared and less predictable, so I prefer to pass them without using it’. Four of them reduced their speed when passing, whereas the rest did not do anything different than passing any other bicycle.

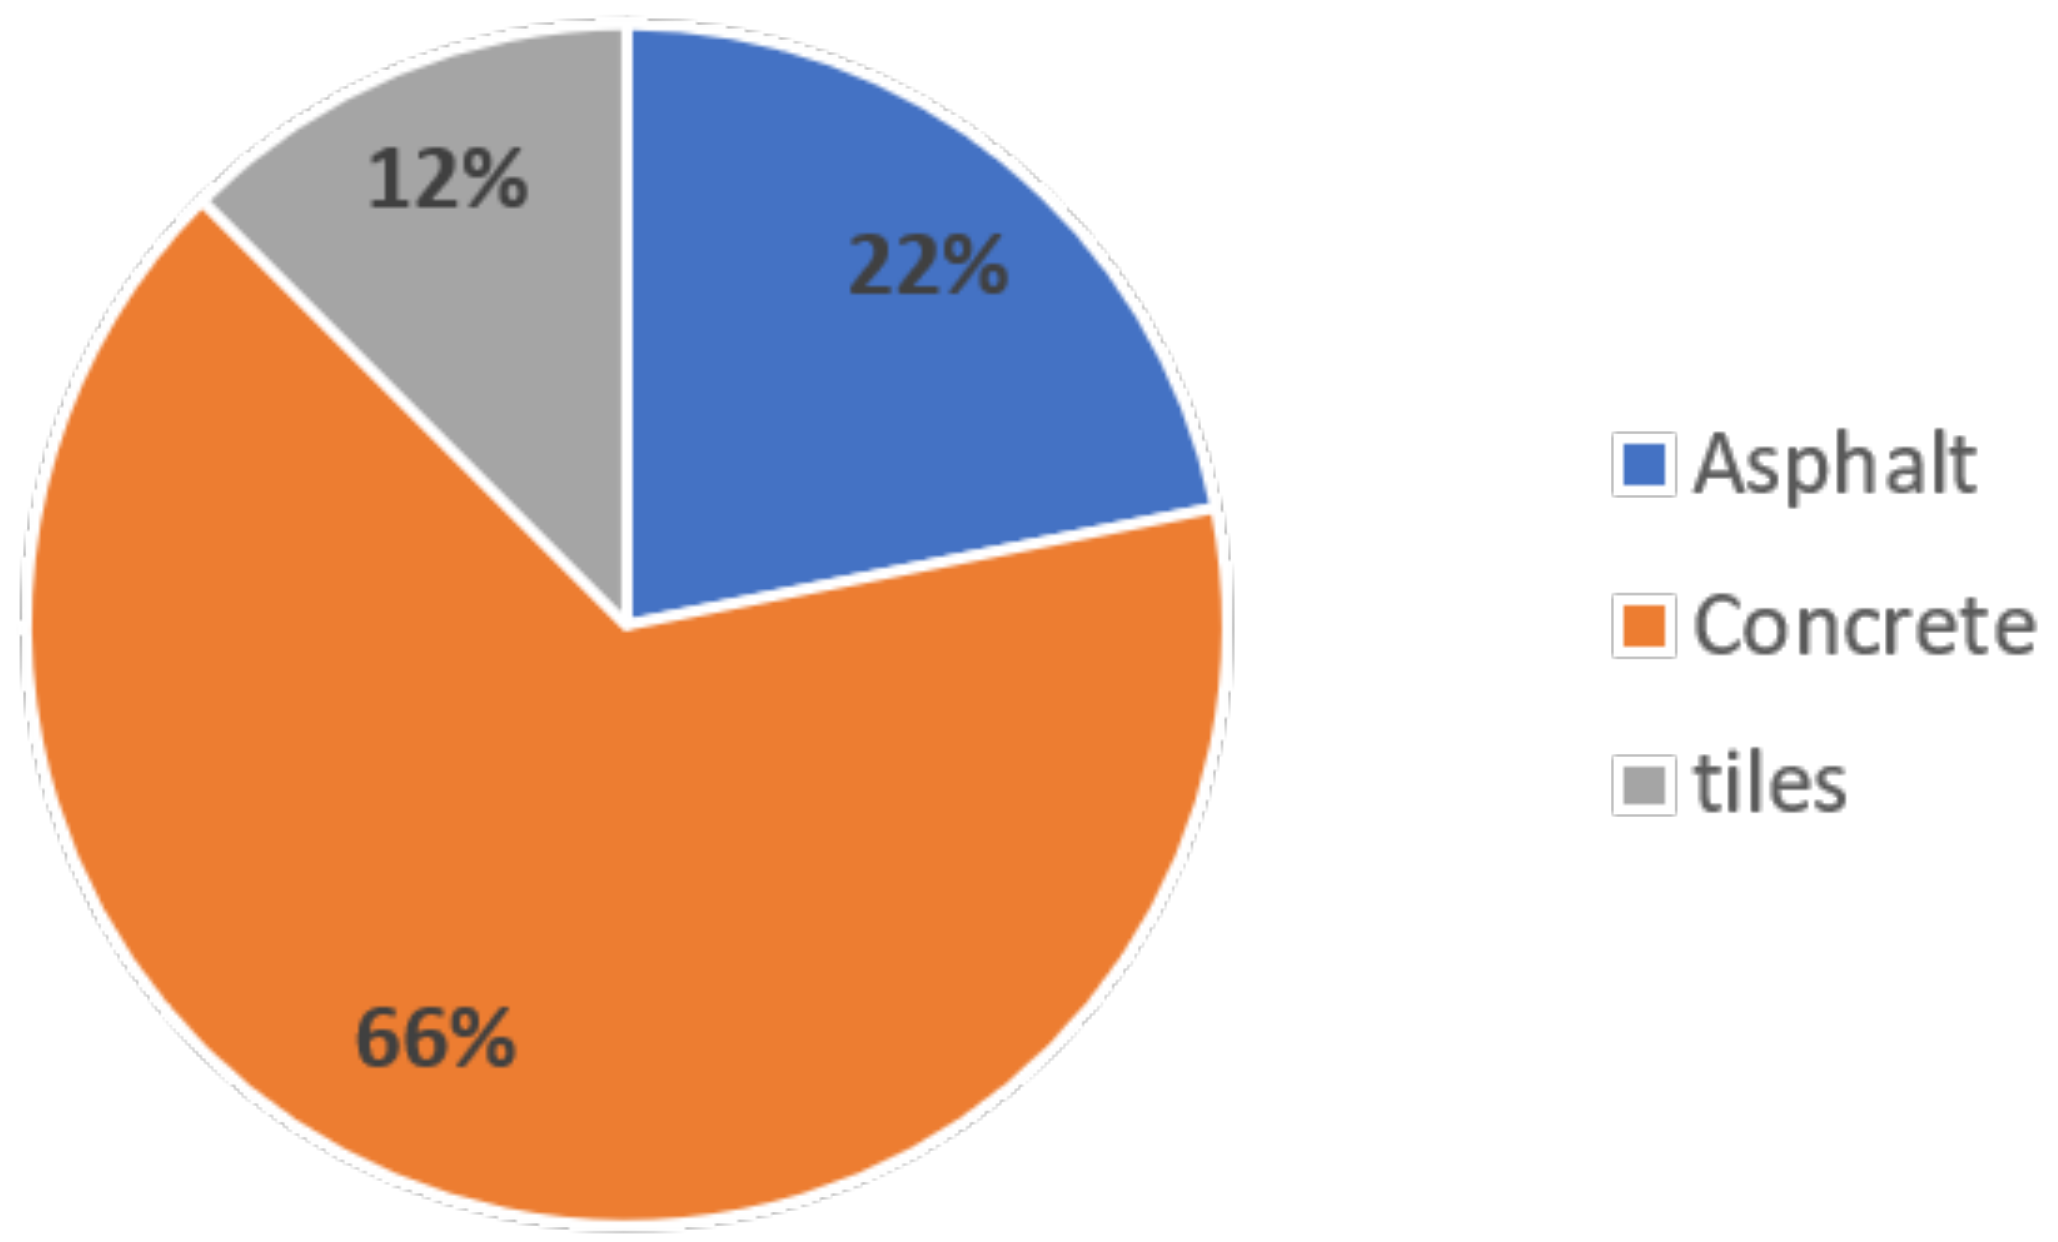
3.2.4. Video Analysis of the Interaction with Infrastructure and Other Road Users

The videos of both: wheelchair users and cyclists were collected and analyzed. The following points summarize the behavior of wheelchair users and cyclists and their interaction with the infrastructure and other road users:
In zone 1:
  • The wheelchair users drove on the right side of the cycling lane most of the time, but when they noticed the absence of other users, they drove on the left side or in the middle.
  • On traffic signals, the pedestrians blocked their way when crossing the street forcing them to slow down or change their trajectory.
  • On sharp curves, especially near the intersections where the degree of curvature is around 90, the wheelchair users depart their lane to the opposite one. On the other side, cyclists left their cycling lane more often on less sharp curves.
  • Wheelchairs reduced their speed significantly when encountering ramps, pavement damage, or obstacles, whereas cyclists reduced their speed slightly, and in some cases, they did not slow down at all.
  • The speed of the wheelchairs surpassed the speed of pedestrians all the time; when a pedestrian blocks the wheelchair user’s path, the wheelchair user slows down and passes the pedestrian from the left, with the exception of one instance where the wheelchair user passed the pedestrian from the right since the pedestrian was blocking the wheelchair user’s path on the left.
  • When pedestrians cross in front of the wheelchair, some of them stopped allowing the wheelchair user to pass, but in other cases, the wheelchair slowed down allowing them to pass, in one situation a wheelchair user spoke to crossing pedestrians warning them to keep attention (there was no cross-line), and he continued his way without slowing down putting them in risk.
  • In ALcala, one wheelchair-user, who is familiar with the experimental route, took a shortcut and left the cycling lane, and rejoined after crossing the street.
  • All cyclists passed the wheelchair users smoothly without even slowing down, in one case, a wheelchair user passed a stopping cyclist on the cycling lane without confusion or speed reduction.
In zone 2:
  • The wheelchair users drove on the right side of the sidewalk, when passing pedestrians, they slowed down and passed them from the left unless a pedestrian was walking on the left side they passed him from the right.
  • On narrow sidewalks, where there is only space for the wheelchair, the wheelchair users slowed down and drove behind pedestrians until they got a chance to pass, in some cases, the pedestrians noticed and cleared the route for them. One wheelchair user left the sidewalk and drove on the on-street cycling lane (without separation from other vehicles) putting himself in conflict with other vehicles.
The case study shows that there are similar behaviors between cyclists and wheelchair-users when sharing cycling infrastructure; for example, both road users expect smooth surfaces and well-designed ramps to make their commuting faster and more comfortable [33,34]; both are affected by the improper geometric design of the road, which force them to depart the lane on sharp curves and took shortcuts to shorten the traveled distance. It is also noticed that wheelchair users are more affected by the unevenness of the road profile, which forces them to reduce their speed more often than cyclists.

4. Conclusions

This study investigated the perceptions and practices of people with disabilities toward cyclists. Two methods were used: the first one is distributing an online questionnaire asking about their perception of cyclists and the challenges when interacting with them, and the second one is conducting an on-road case study including electric wheelchair users and cyclists to compare the two groups’ speed and behavior. The findings indicated that people with disabilities are concerned about safety issues related to cycling, such as high speeds, distracted cyclists, and insufficient infrastructure. The study suggests that there is a need for greater awareness and education to improve interactions between cyclists and people with disabilities, as well as a need for inclusive design and consultation to create more accessible bicycle infrastructure.
The results of the online questionnaire show that people with disabilities feel threatened by cyclists who share the sidewalk with them; mainly because they have difficulty detecting them, as bicycles are silent vehicles. The respondents to the questionnaire suggested making the sidewalk free of cyclists to avoid conflict and improve safety. Besides, an authentic case study was presented to check the possibility of sharing cycling lanes with electric wheelchair users, three aspects were investigated, the first one is related to the safety of wheelchair users, the second is related to their comfort interacting with cycling infrastructure and the third is the adequacy of their speed compared to cyclists and pedestrians. The results show the positive response of the participants and the improvement of speed and safety feeling of wheelchair users without disturbing other cyclists using the same path. This may lead to allowing wheelchair users to use cycling infrastructure under the condition that the width of the cycling lane is sufficient to allow cyclists to pass when necessary. However, the number of wheelchair users was limited because of safety concerns from the organizers, as this kind of test has never been conducted before, and it was difficult to find an adequate and spacious cycling lane to ensure the participants’ safety while avoiding blocking the way of other road users. It is recommended, for future studies, to include more wheelchair users (with electric or non-electric wheelchairs) to obtain more reliable and generalizable results.

Author Contributions

Conceptualization, M.S. and H.I.; methodology, M.S. and H.I.; formal analysis, M.S.; writing—original draft preparation, M.S.; writing—review and editing, H.I.; visualization, M.S.; supervision, H.I.; project administration, H.I.; funding acquisition, H.I. All authors have read and agreed to the published version of the manuscript.

Funding

This work was funded by Marie Skłodowska-Curie actions (H2020 MGA MSCA-ITN) within the SAFERUP project under grant agreement number 765057.

Informed Consent Statement

Informed consent was obtained from all subjects involved in the study.

Data Availability Statement

The data used to support the findings of this paper are available from the corresponding author upon request.

Acknowledgments

The authors gratefully acknowledge the contribution of Fundacion ONCE represented by José Luis Borau Jordan and Marian Palánquex Valles’ profile for hosting a part of this research.

Conflicts of Interest

The authors declare no conflics of interest.

References

  1. Assembly, U.G. Convention on the Rights of Persons with Disabilities. GA Res. 2006, 61, 106. [Google Scholar]
  2. Marks, D. Models of disability. Disabil. Rehabil. 1997, 19, 85–91. [Google Scholar] [CrossRef] [PubMed]
  3. Krahn, G.L. WHO world report on disability: A review. Disabil. Health J. 2011, 4, 141–142. [Google Scholar] [CrossRef] [PubMed]
  4. Stiker, H.J. A History of Disability; University of Michigan Press: Ann Arbor, MI, USA, 2019. [Google Scholar]
  5. WHO. World Report on Hearing; WHO: Geneva, Switzerland, 2021. [Google Scholar]
  6. WHO. World Report on Vision; WHO: Geneva, Switzerland, 2019. [Google Scholar]
  7. WHO. International Perspectives on Spinal Cord Injury; World Health Organization: Geneva, Switzerland, 2013. [Google Scholar]
  8. WHO. World Health Statistics 2008; World Health Organization: Geneva, Switzerland, 2008. [Google Scholar]
  9. Explicación breve de la EDAD2020, U. La Nueva Encuesta de Discapacidad-Dependencia en España. Available online: https://www.ine.es/prensa/edad_2020_p.pdf (accessed on 4 January 2023).
  10. Routhier, F.; Vincent, C.; Desrosiers, J.; Nadeau, S. Mobility of wheelchair users: A proposed performance assessment framework. Disabil. Rehabil. 2003, 25, 19–34. [Google Scholar] [CrossRef] [PubMed]
  11. Iezzoni, L.I.; McCarthy, E.P.; Davis, R.B.; Siebens, H. Mobility problems and perceptions of disability by self-respondents and proxy respondents. Med. Care 2000, 38, 1051–1057. [Google Scholar] [CrossRef] [PubMed]
  12. De Vries, N.; Van Ravensberg, C.; Hobbelen, J.; Rikkert, M.O.; Staal, J.; Nijhuis-Van der Sanden, M. Effects of physical exercise therapy on mobility, physical functioning, physical activity and quality of life in community-dwelling older adults with impaired mobility, physical disability and/or multi-morbidity: A meta-analysis. Ageing Res. Rev. 2012, 11, 136–149. [Google Scholar] [CrossRef] [PubMed]
  13. Enkelaar, L.; Smulders, E.; van Schrojenstein Lantman-de Valk, H.; Geurts, A.C.; Weerdesteyn, V. A review of balance and gait capacities in relation to falls in persons with intellectual disability. Res. Dev. Disabil. 2012, 33, 291–306. [Google Scholar] [CrossRef] [PubMed]
  14. Hoenig, H.; Landerman, L.R.; Shipp, K.M.; George, L. Activity restriction among wheelchair users. J. Am. Geriatr. Soc. 2003, 51, 1244–1251. [Google Scholar] [CrossRef]
  15. Velho, R.; Holloway, C.; Symonds, A.; Balmer, B. The effect of transport accessibility on the social inclusion of wheelchair users: A mixed method analysis. Soc. Incl. 2016, 4, 24–35. [Google Scholar] [CrossRef] [Green Version]
  16. Ricci, M.; Parkhurst, G.; Jain, J. Transport policy and social inclusion. Soc. Incl. 2016, 4, 1–6. [Google Scholar] [CrossRef]
  17. Falta, P.L. Barrier Free Design for Disabled Persons-Evaluation Framework for Assessing the Quality of Accessibility in Public Buildings; Faculty of Environmental Design, Universite de Montreal: Montreal, QB, Canada, 1982. [Google Scholar]
  18. Agrawal, M.P.; Gupta, A.R. Smart stick for the blind and visually impaired people. In Proceedings of the 2018 Second International Conference on Inventive Communication and Computational Technologies (ICICCT), Coimbatore, India, 20–21 April 2018; pp. 542–545. [Google Scholar]
  19. Mwanik, L.N. Assessing the Accessibility of the Built Environment to Persons with Reduced Mobility, a Case of Narok Town. Ph.D. Thesis, University of Nairobi, Nairobi, Kenya, 2022. [Google Scholar]
  20. National Academies of Sciences, Engineering, and Medicine. The Promise of Assistive Technology to Enhance Activity and Work Participation; National Academies of Sciences Press: Washington, DC, USA, 2017. [Google Scholar]
  21. Wu, Y.J.; Liu, W.J.; Yuan, C.H. A mobile-based barrier-free service transportation platform for people with disabilities. Comput. Hum. Behav. 2020, 107, 105776. [Google Scholar] [CrossRef]
  22. Ranchordás, S. Smart mobility. In Smart Urban Mobility: Law, Regulation, and Policy; University of Groningen: Groningen, The Netherlands, 2020; pp. 61–80. [Google Scholar]
  23. Imrie, R. Universalism, universal design and equitable access to the built environment. Disabil. Rehabil. 2012, 34, 873–882. [Google Scholar] [CrossRef] [PubMed]
  24. Kayess, R.; French, P. Out of darkness into light? Introducing the Convention on the Rights of Persons with Disabilities. Hum. Rights Law Rev. 2008, 8, 1–34. [Google Scholar] [CrossRef]
  25. Bennett, C.; Ackerman, E.; Fan, B.; Bigham, J.; Carrington, P.; Fox, S. Accessibility and The Crowded Sidewalk: Micromobility’s Impact on Public Space. In Proceedings of the Designing Interactive Systems Conference 2021, Virtual, 28 June–2 July 2021; pp. 365–380. [Google Scholar]
  26. Fundacion ONCE. Available online: https://www.fundaciononce.es/en/about-us/introduction (accessed on 29 May 2022).
  27. ONCE, F. Metro 4 All Research Study Detecting Users With Disabilities Needs at Metro Network; Fundacion ONCE: Madrid, Spain, 2021. [Google Scholar]
  28. Alonso López, F.; Cruz Mera, A.d.l.; Pires de Souza, E.; Reyes Torres, R.; Viéitez Vivas, A.M.; Peinado Margalef, N.; Moral Ávila, C.d.; Calle Cebrecos, M.; Kisters, C.; Montes, M.; et al. Accesibilidad en los Espacios públicos Urbanizados 2010. Available online: https://issuu.com/acceplan/docs/acceplan_accesibilidadespaciospubli (accessed on 29 May 2022).
  29. AASHTO Task Force on Geometric Design. Guide for the Development of Bicycle Facilities, 4th ed.; American Association of State Highway & Transportation Officials: Washington, DC, USA, 2012.
  30. File I. Proposal for a Regulation of the European Parliament and of the Council on the Protection of Individuals with Regard to the Processing of Personal Data and on the Free movement of Such Data (General Data Protection Regulation); Council of the European Union: Stockholm, Sweden, 2012.
  31. Komoot Website and Mobile Application. Available online: https://www.komoot.com/ (accessed on 29 May 2022).
  32. Montufar, J.; Arango, J.; Porter, M.; Nakagawa, S. Pedestrians’ normal walking speed and speed when crossing a street. Transp. Res. Rec. 2007, 2002, 90–97. [Google Scholar] [CrossRef]
  33. Shoman, M.; Imine, H.; Johansson, K.; Wallqvist, V. Measuring Cyclist’s Inputs, the Kinematic and Dynamic Properties of a City Bicycle, and Estimating the Road Profile via Sensor Fusion. Highlights Veh. 2023, 1, 1–16. [Google Scholar] [CrossRef]
  34. Shoman, M.M.; Imine, H.; Acerra, E.M.; Lantieri, C. Evaluation of cycling safety and comfort in bad weather and surface conditions using an instrumented bicycle. IEEE Access 2023, 11, 15096–15108. [Google Scholar] [CrossRef]
Figure 1. Experimental route in Madrid.
Vehicles 05 00018 g001
Figure 2. Two of the participants wearing a helmet with a camera and holding a mobile to follow the experimental route.
Vehicles 05 00018 g002
Figure 3. The classification of people who responded to the questionnaire.
Vehicles 05 00018 g003
Figure 4. The response of the wheelchair users about the most appropriate lane to drive the wheelchair.
Vehicles 05 00018 g004
Figure 5. The most comfortable surface to move on according to wheelchair users.
Vehicles 05 00018 g005
Figure 6. Comparison between the speed profiles of a wheelchair and a bicycle.
Vehicles 05 00018 g006
Figure 7. The average speed, average moving speed, and maximum speed for all cyclists and wheelchair users who participated in the experiment.
Vehicles 05 00018 g007
Disclaimer/Publisher’s Note: The statements, opinions and data contained in all publications are solely those of the individual author(s) and contributor(s) and not of MDPI and/or the editor(s). MDPI and/or the editor(s) disclaim responsibility for any injury to people or property resulting from any ideas, methods, instructions or products referred to in the content.

