
Framework for Building Low-Cost OBD-II Data-Logging Systems for Battery Electric Vehicles
 ,
,  and
and
Abstract
:1. Introduction
2. Review of OBD Technology
2.1. History
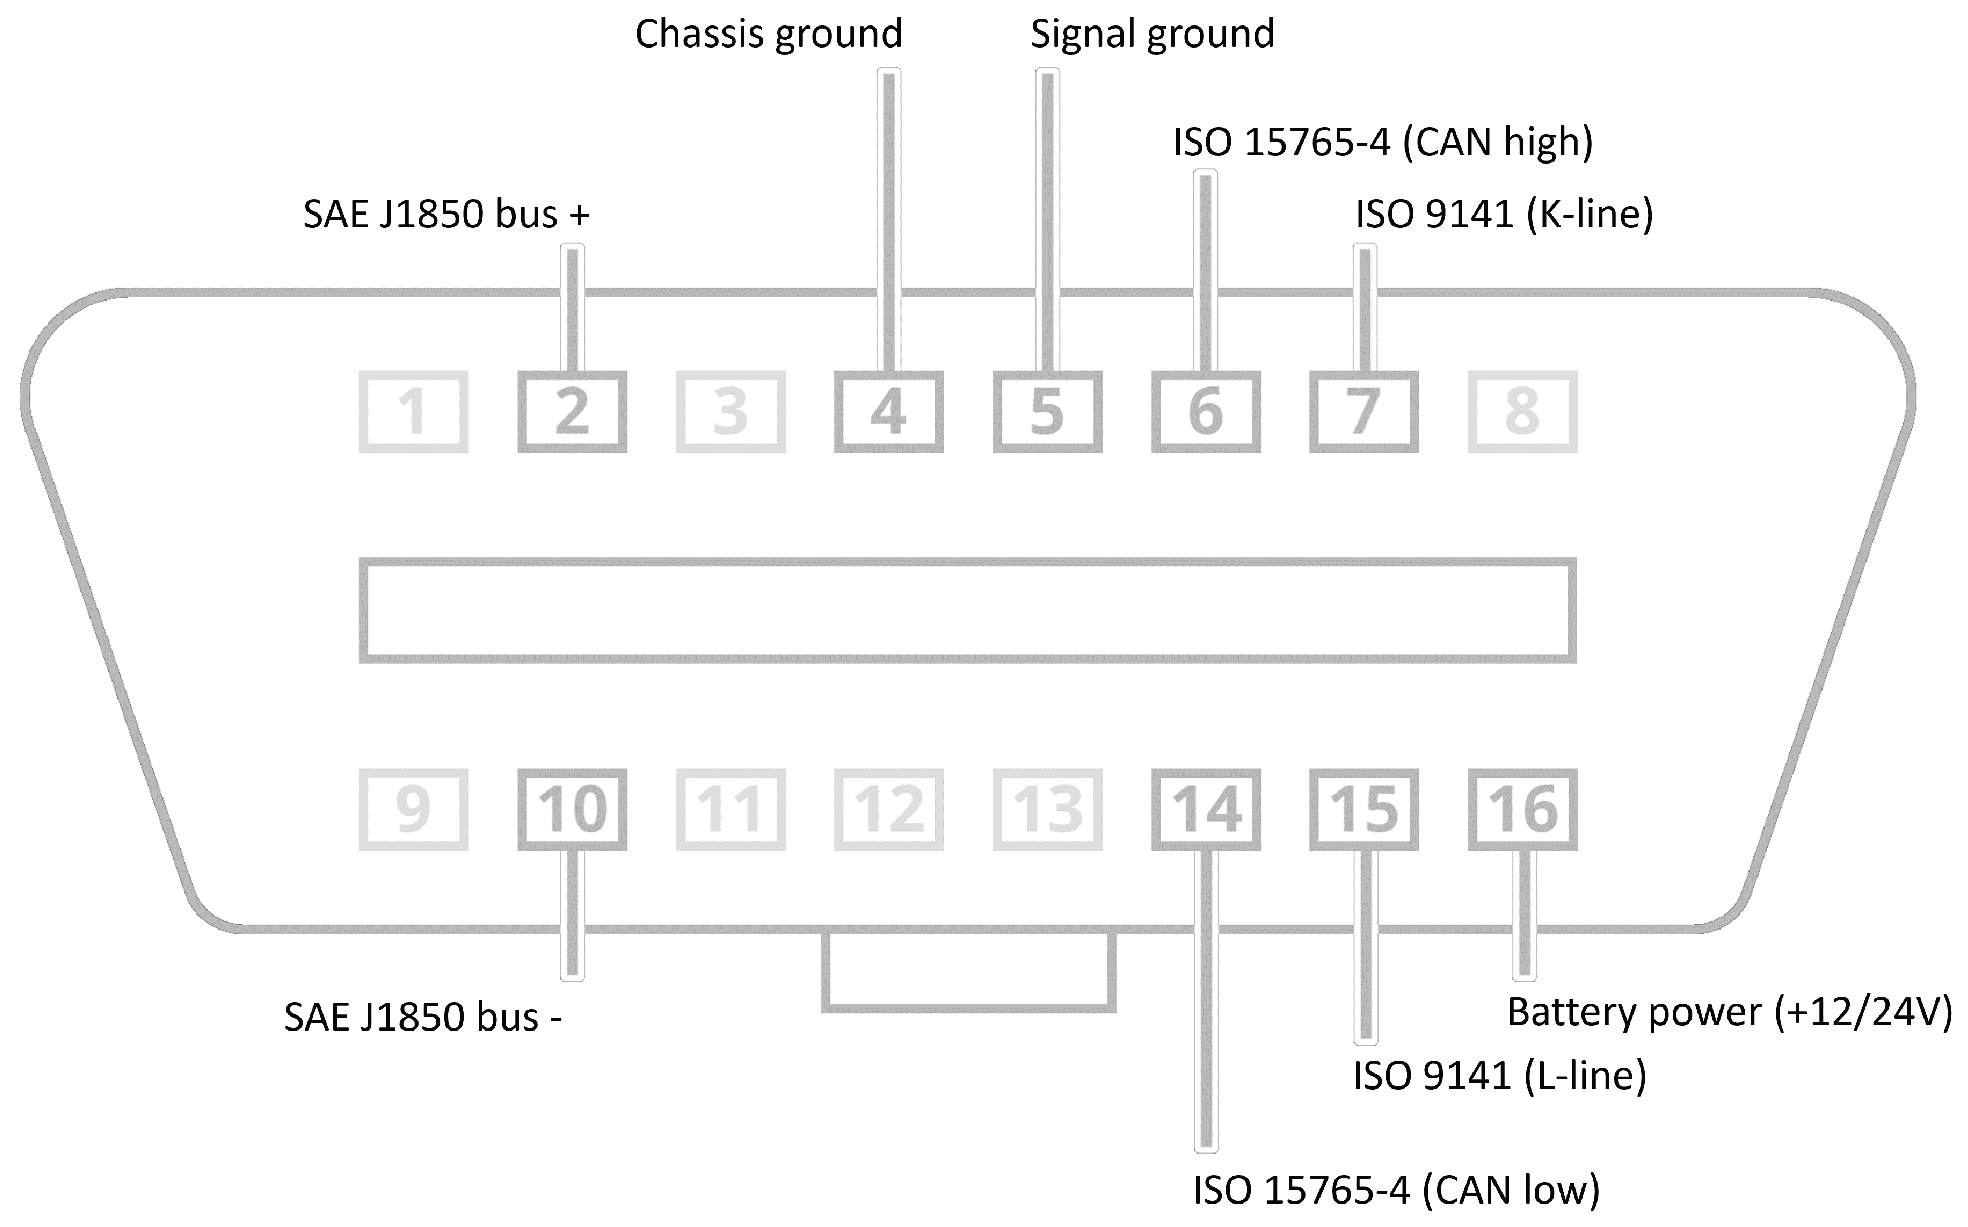
2.2. Data Link Connector
2.3. Communication Protocol
- ISO 15765 (CAN bus).
- ISO14230-4 (KWP2000).
- ISO9141-2.
- SAE J1850 (VPW).
- SAE J1850 (PWM).
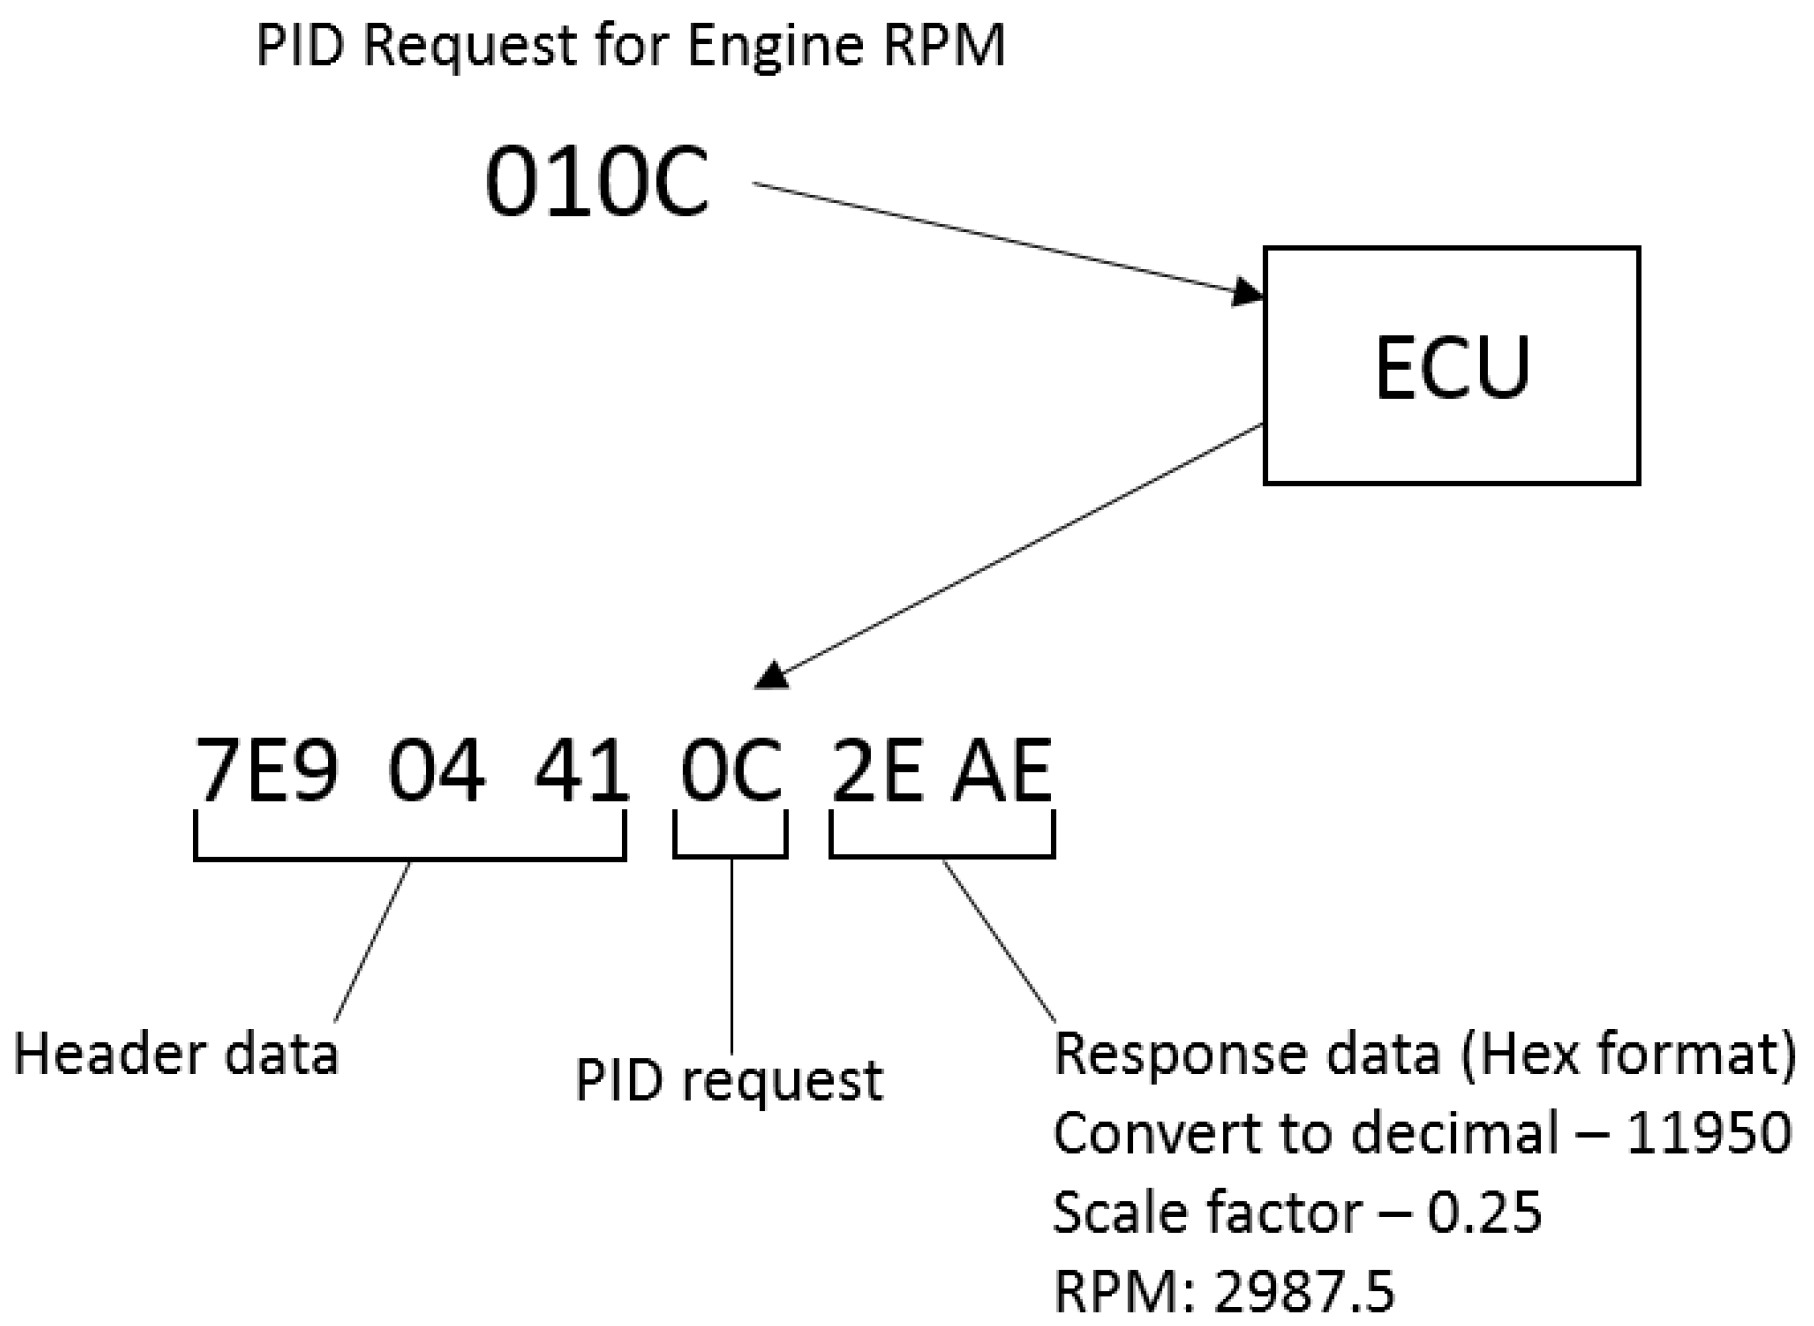
2.4. Parameter IDs
- Mode 1: gives current real-time engine data.
- Mode 2: gives fault information detected on the engine.
- Mode 3: DTCs that the ECU currently stores.
- Mode 4: sends a command to the ECU to clear all the DTCs and turn off the Malfunction Indicator Lamp (MIL) if on.
- Mode 5: tests the results from the oxygen sensor monitoring.
- Mode 6: other sensors test results.
- Mode 7: pending DTCs.
- Mode 8: controls the operation of the on-board system.
- Mode 9: the engine VIN (Vehicle Identification Number).
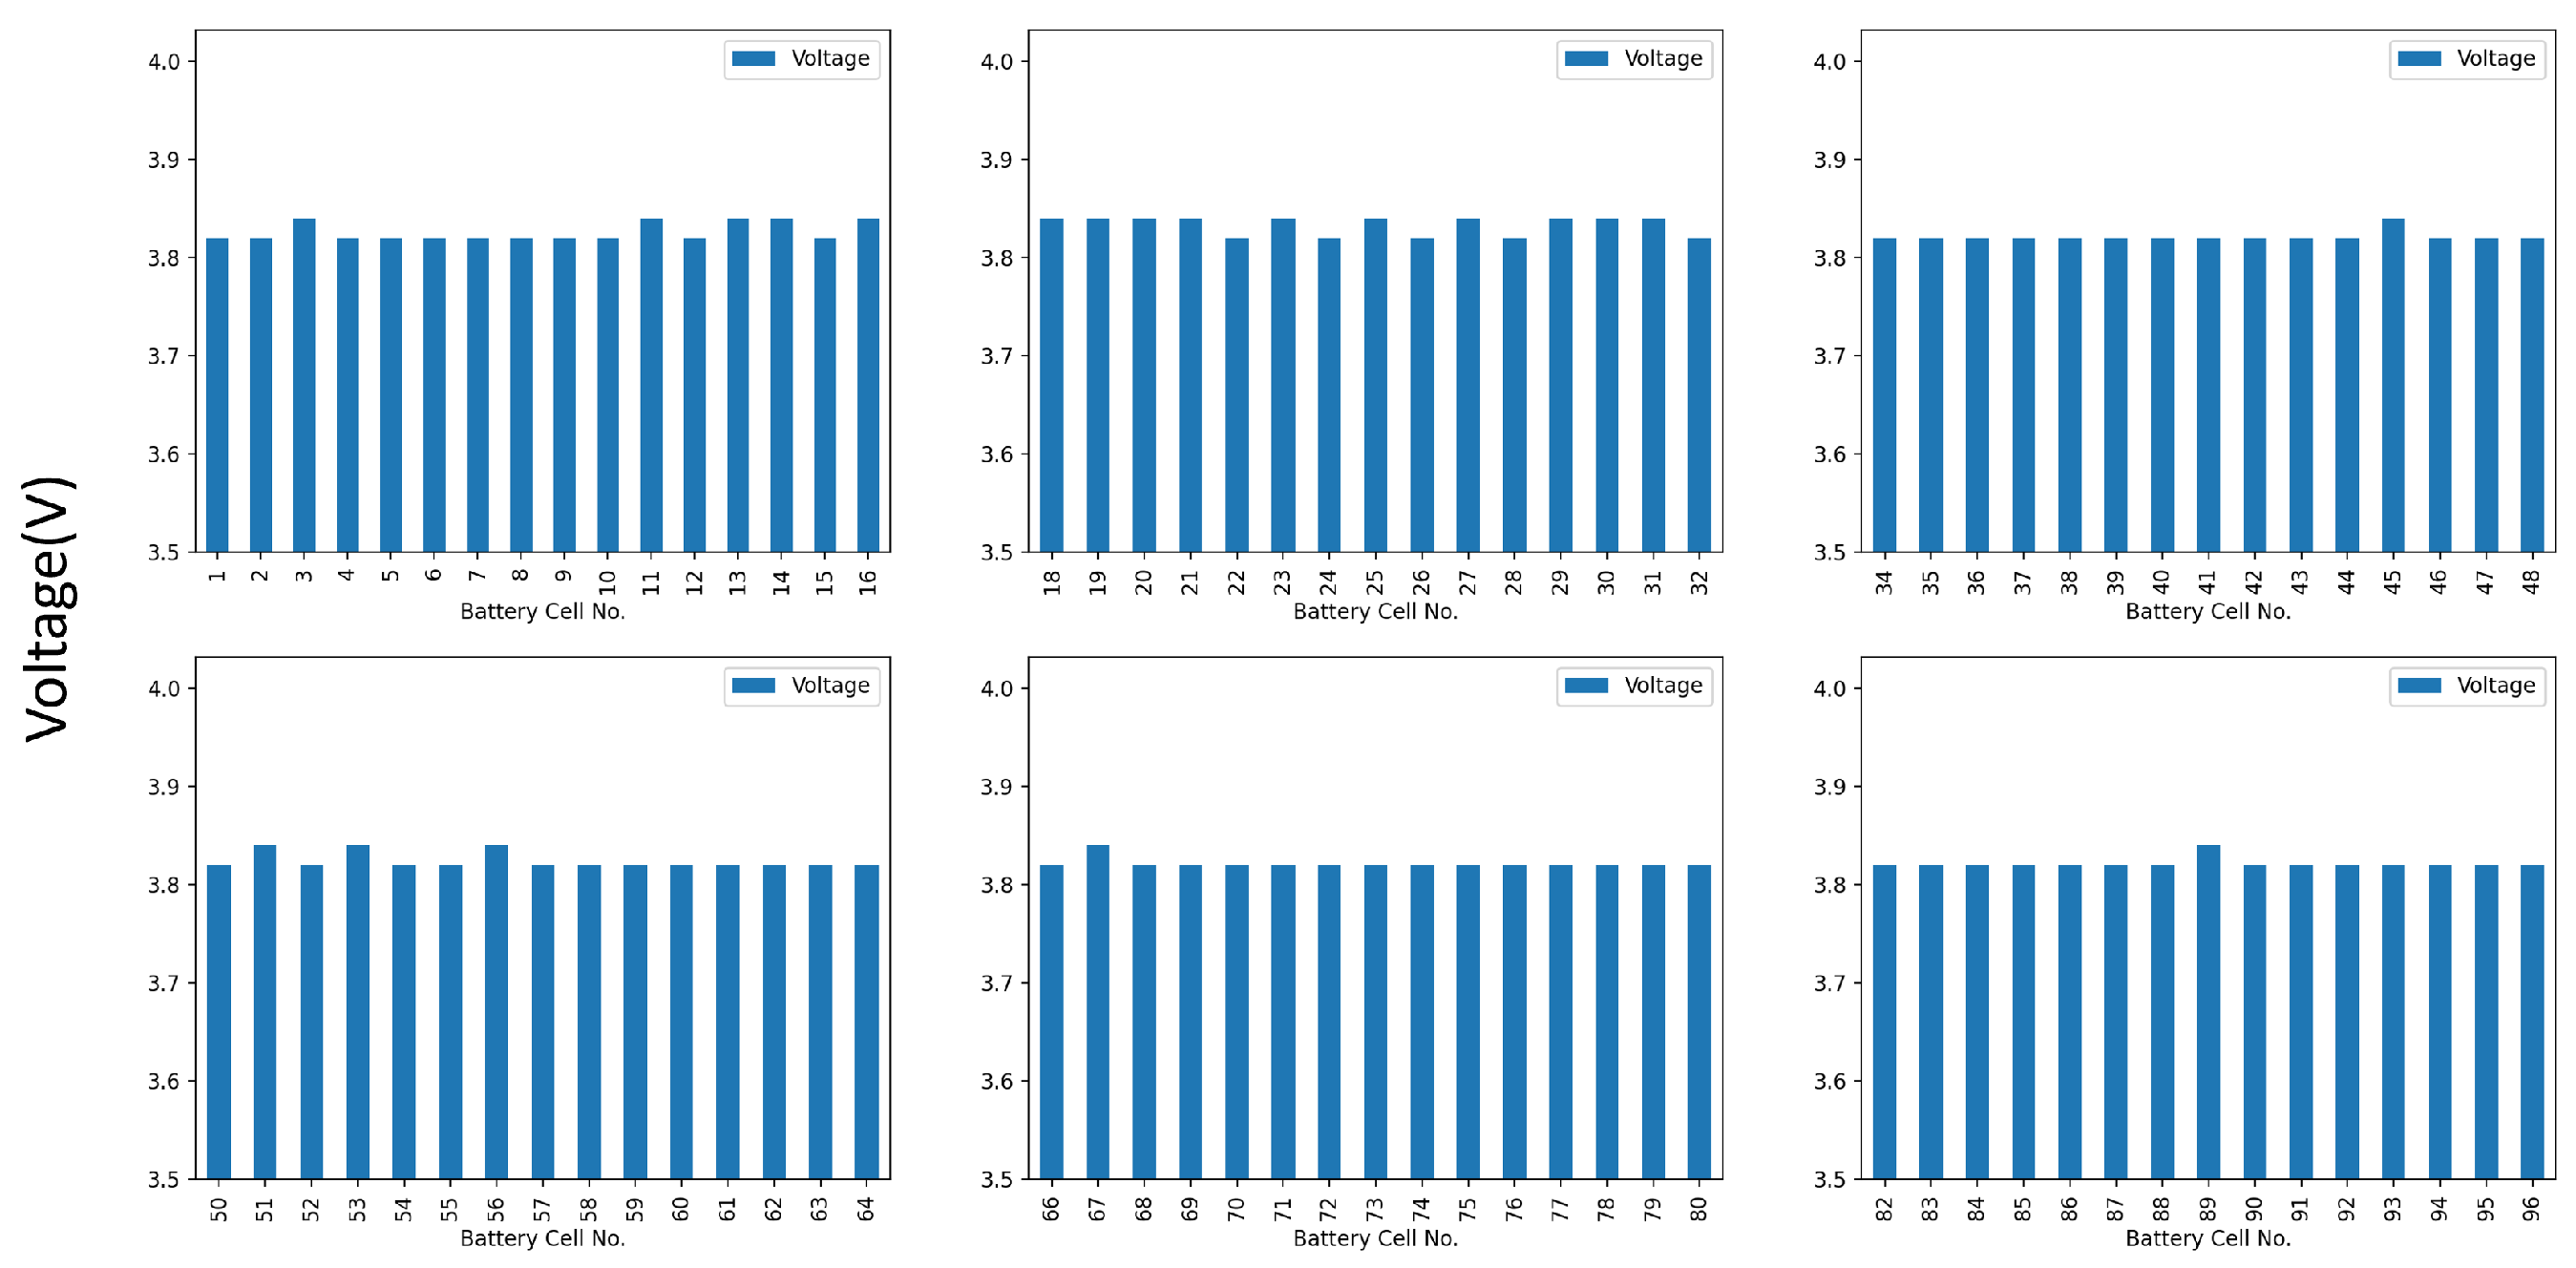
- 2101—battery modules 1–5 temperatures, drive motor rpm, cumulative charge data.
- 2102—battery cells 1–32 voltages.
- 2103—battery cells 33–64 voltages.
- 2104—battery cells 65–96 voltages.
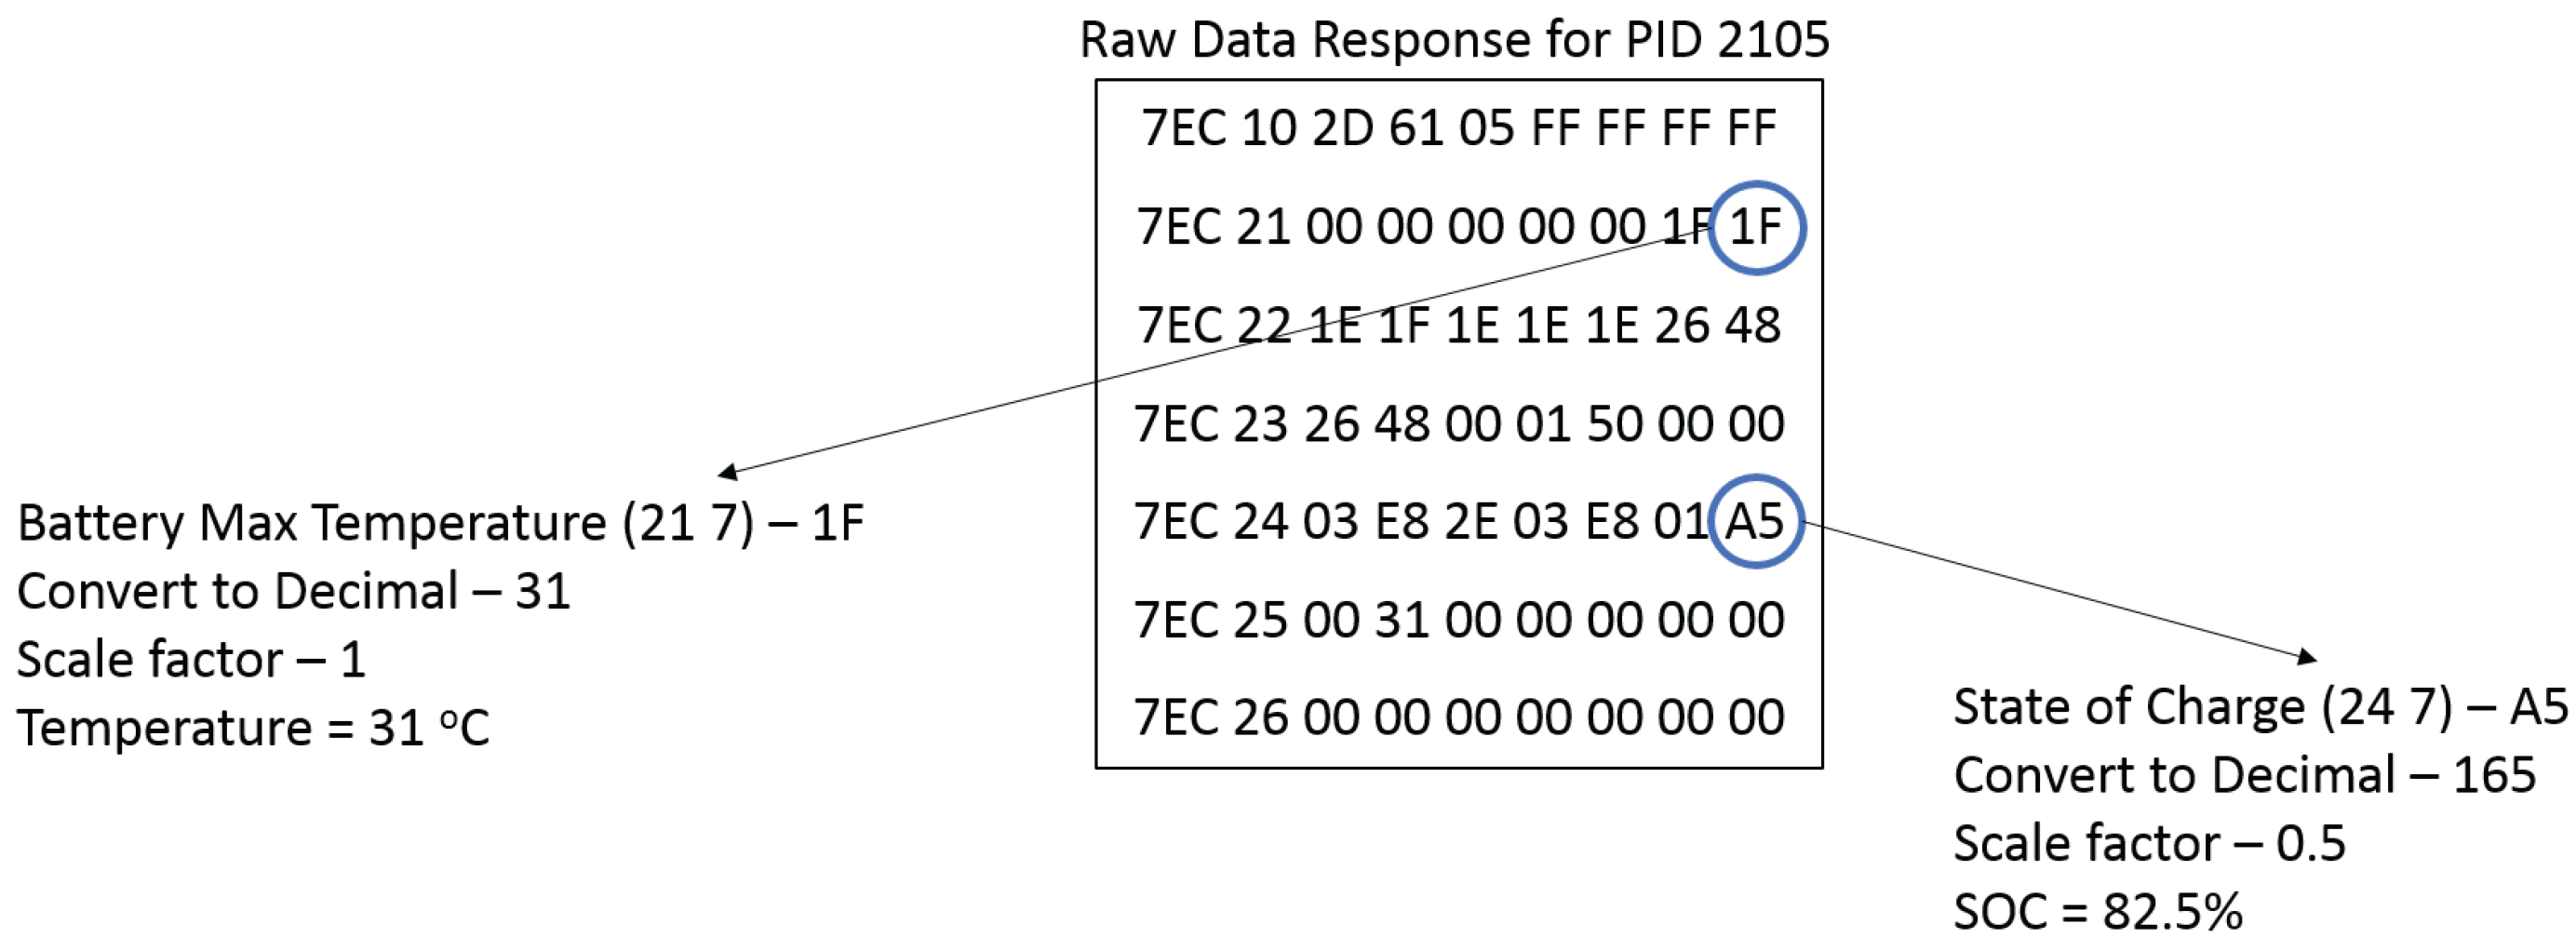
- 2105—battery modules 6–10 temperatures, SOH and SOC.
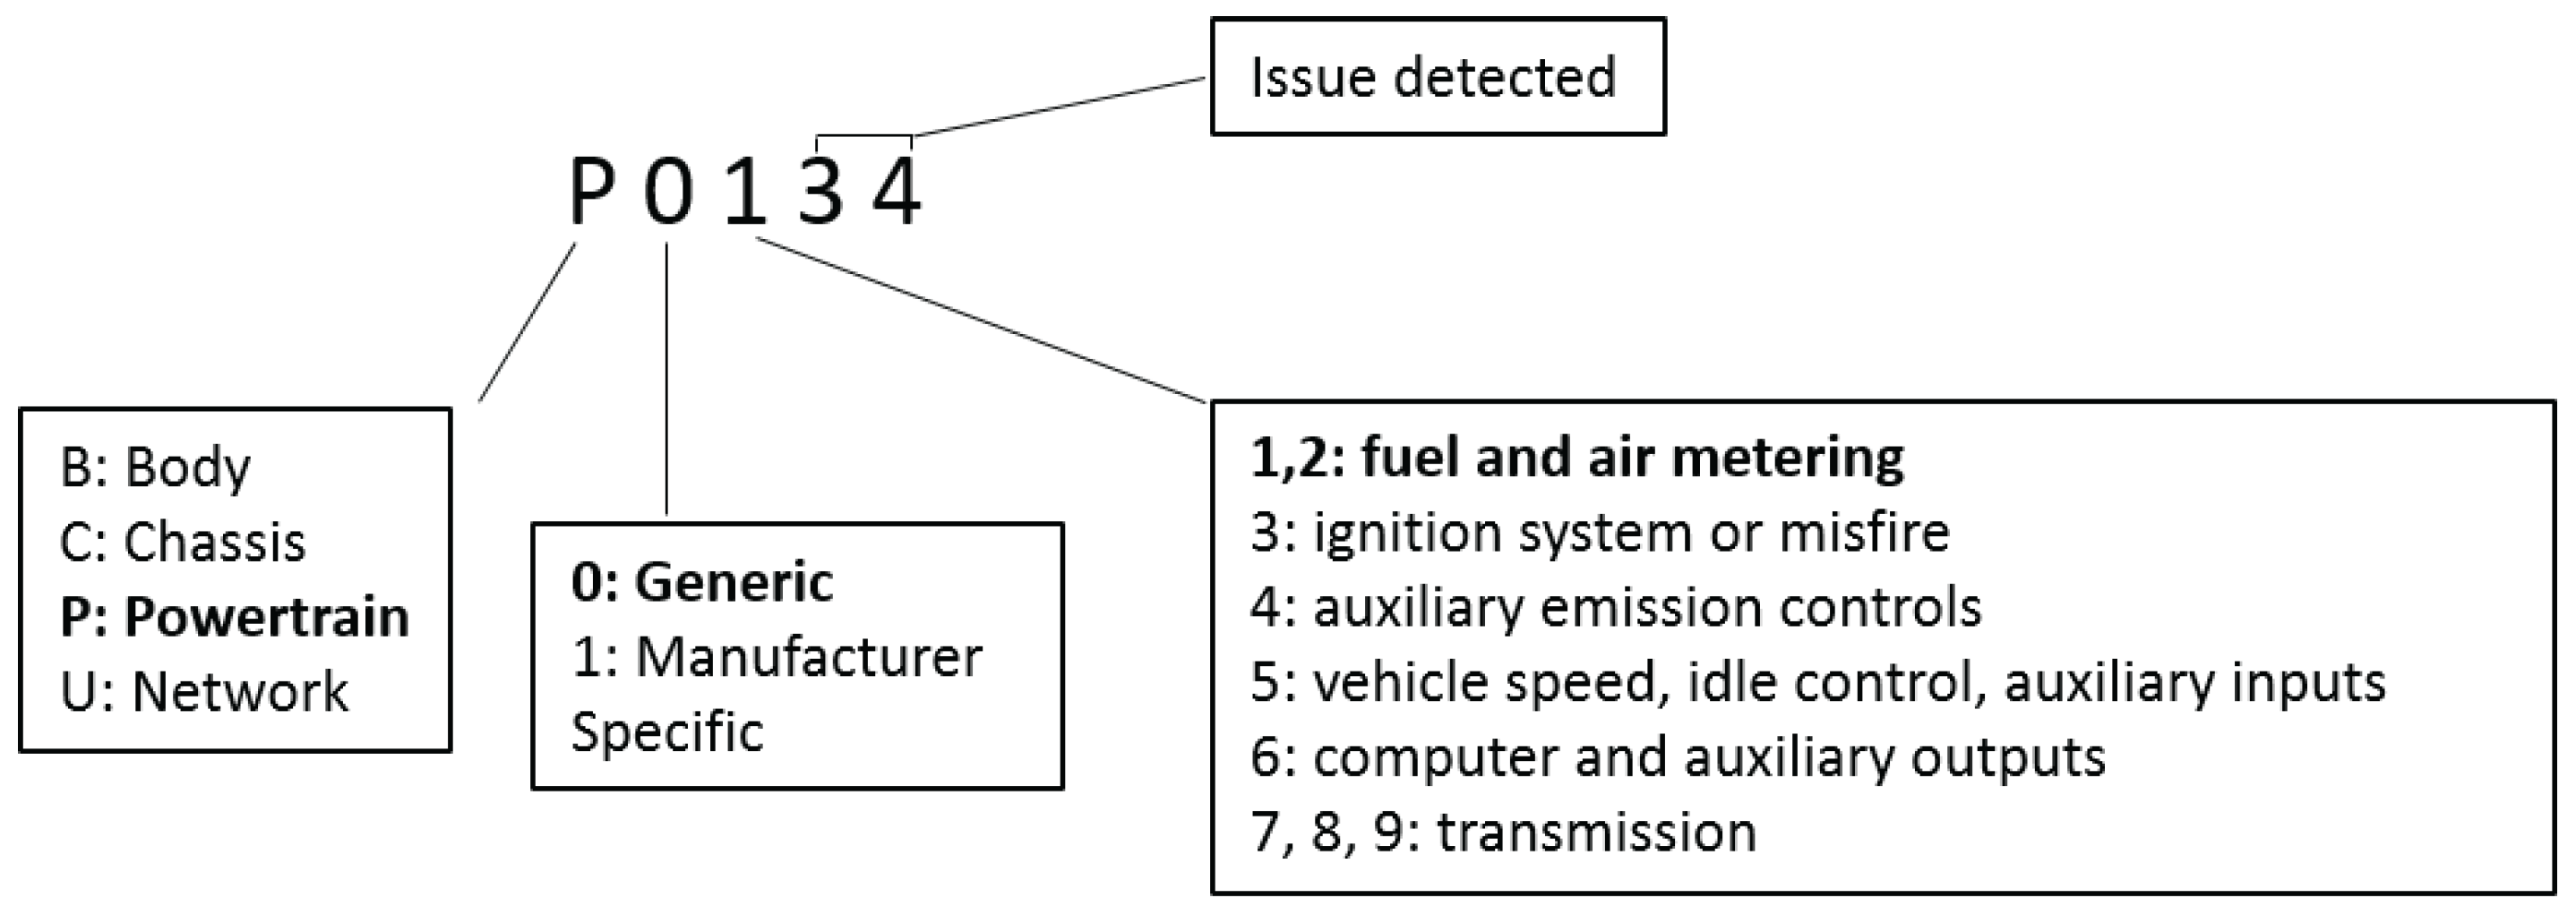
2.5. Diagnostic Trouble Codes
2.6. Commercially Available OBD-II Systems
3. OBD-II Data Logger Design
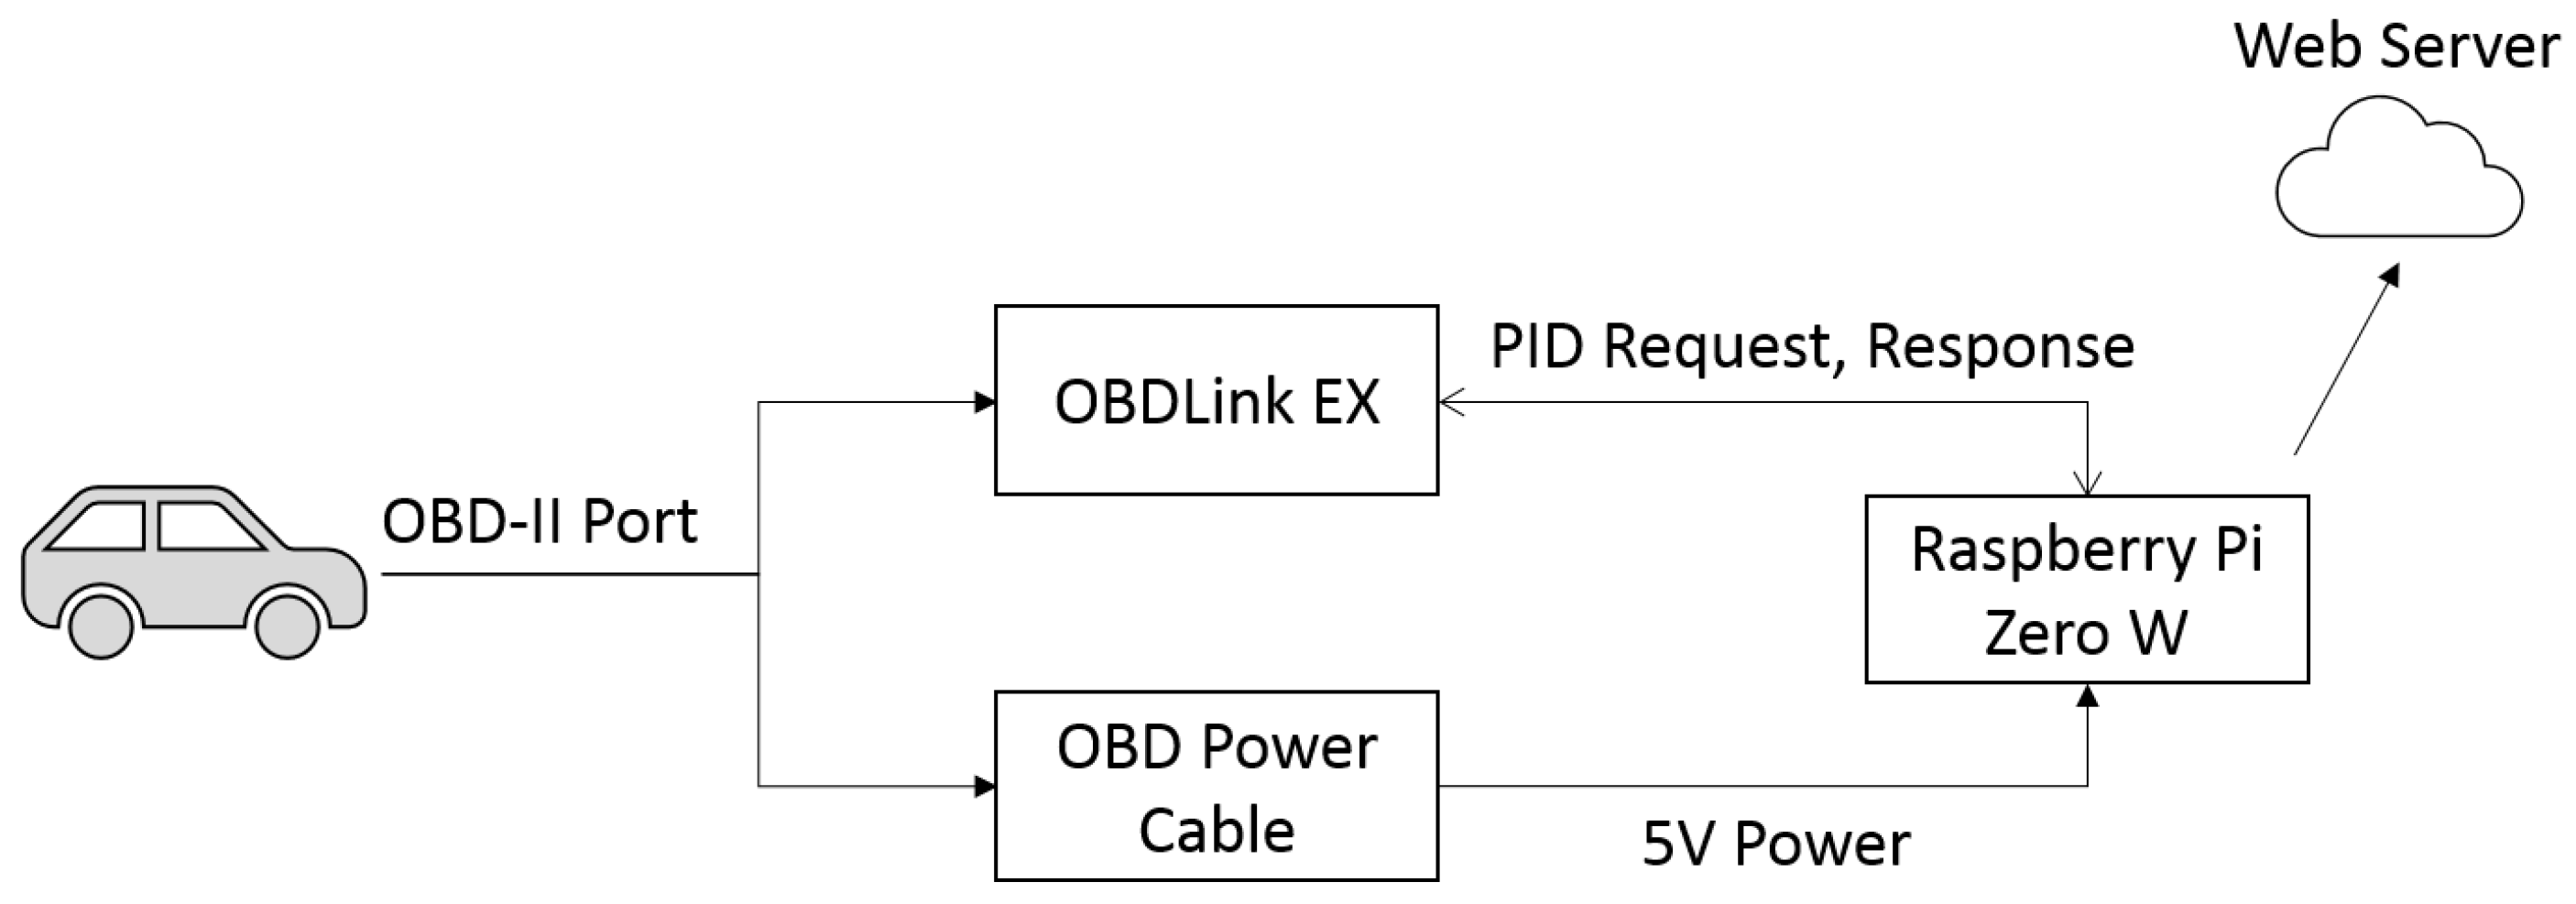
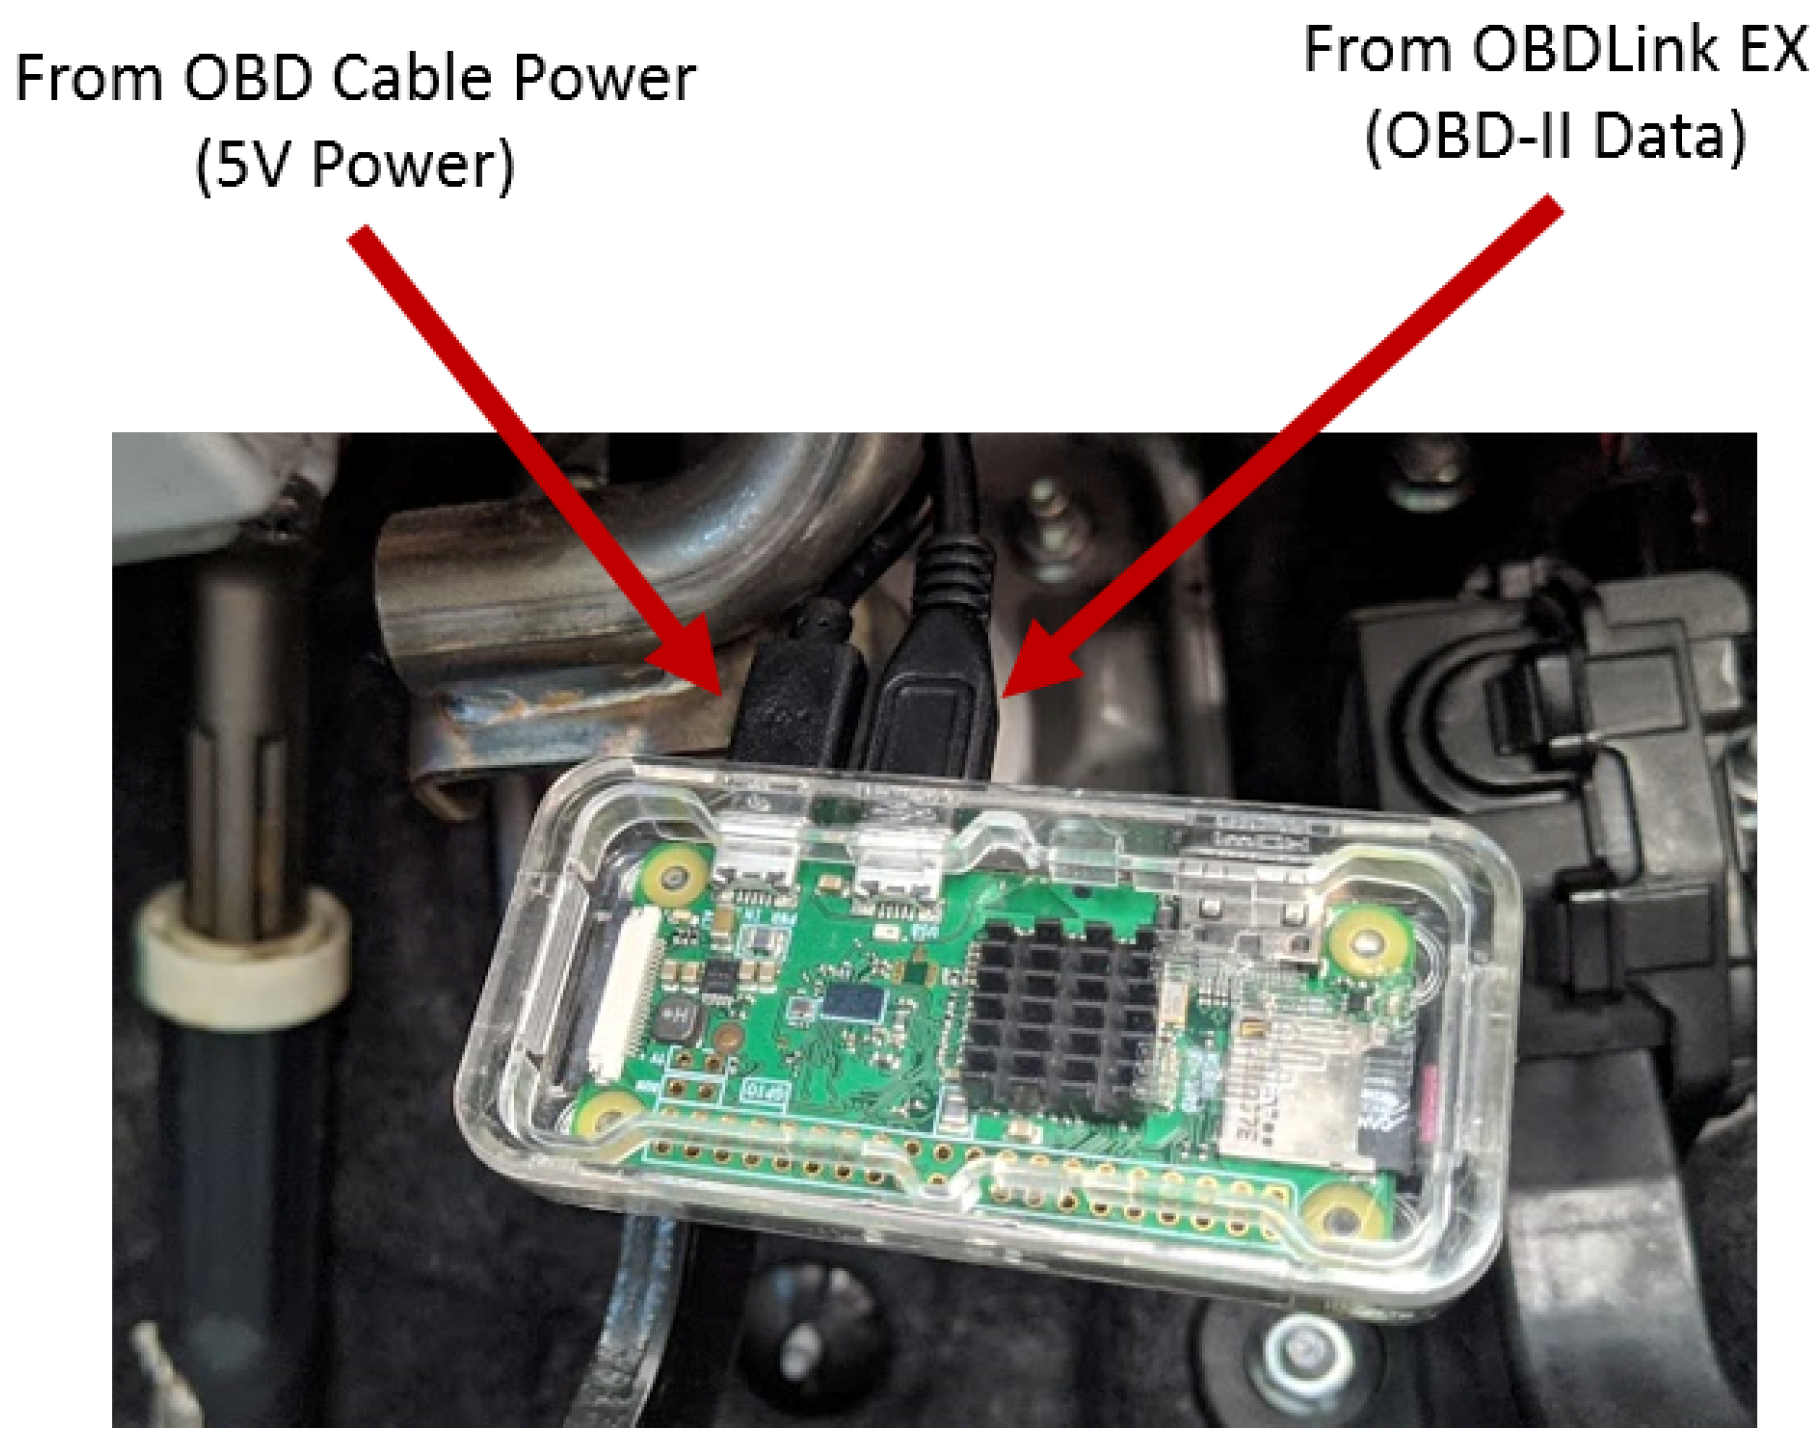
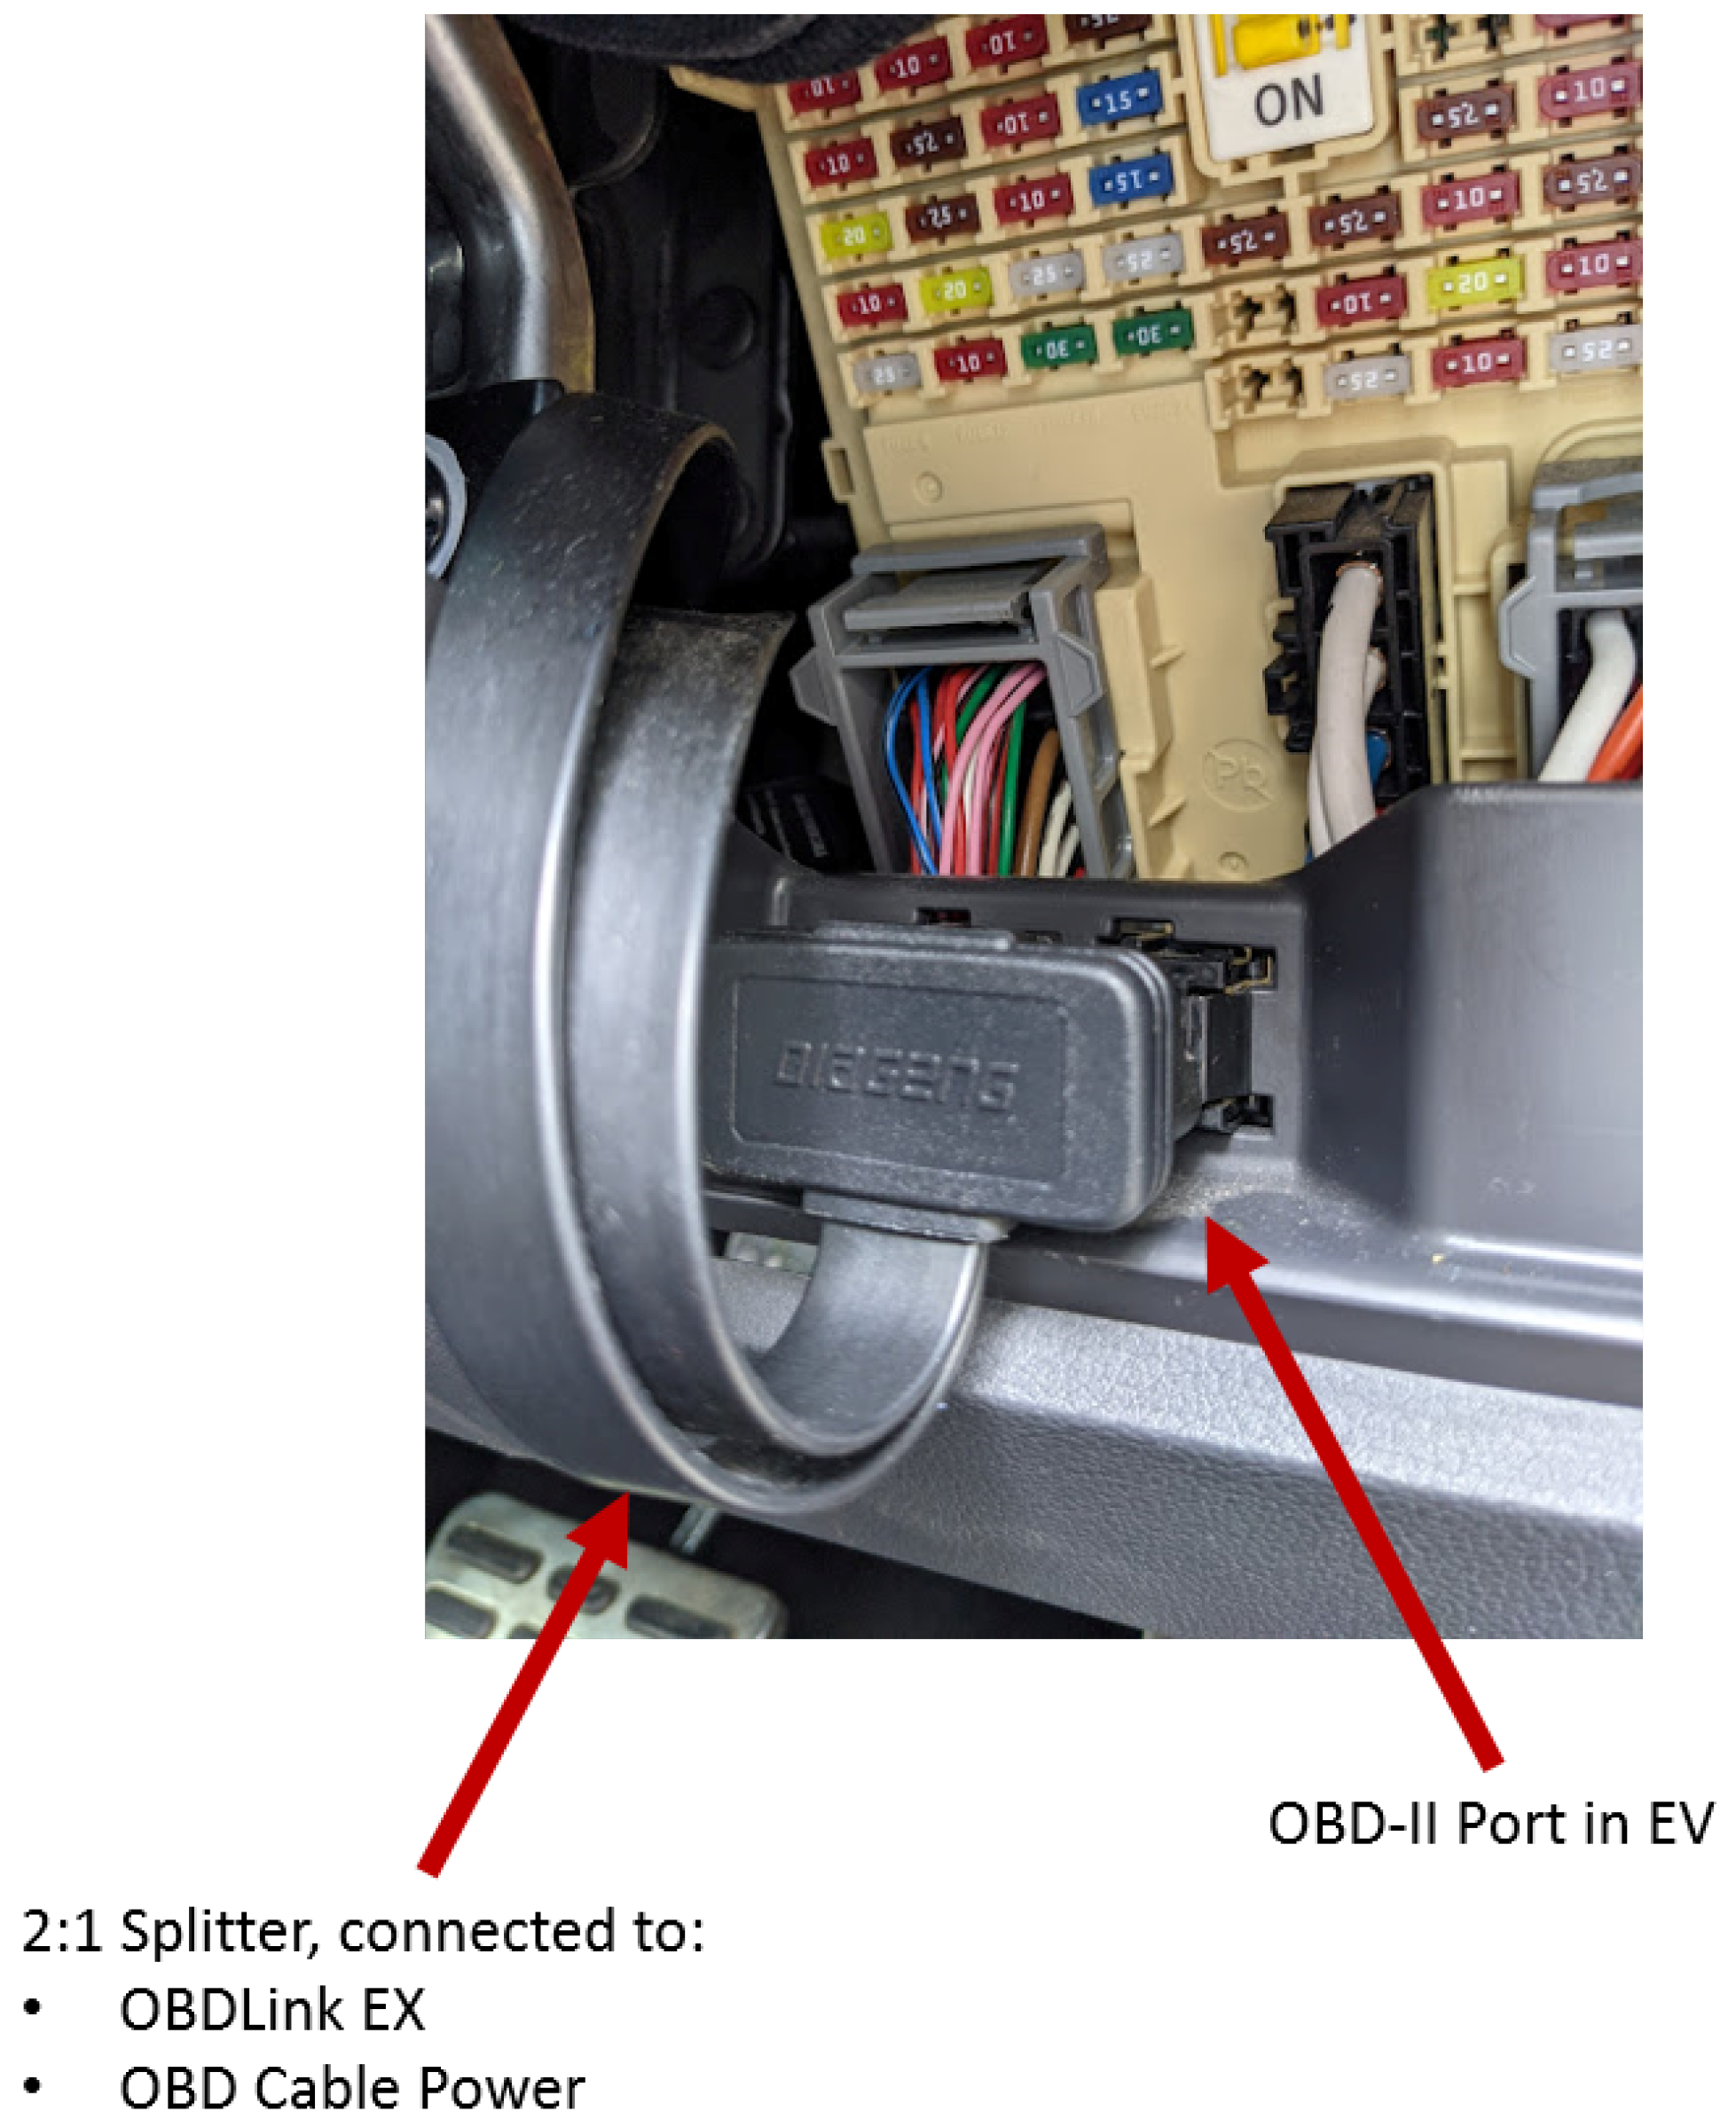
3.1. Hardware
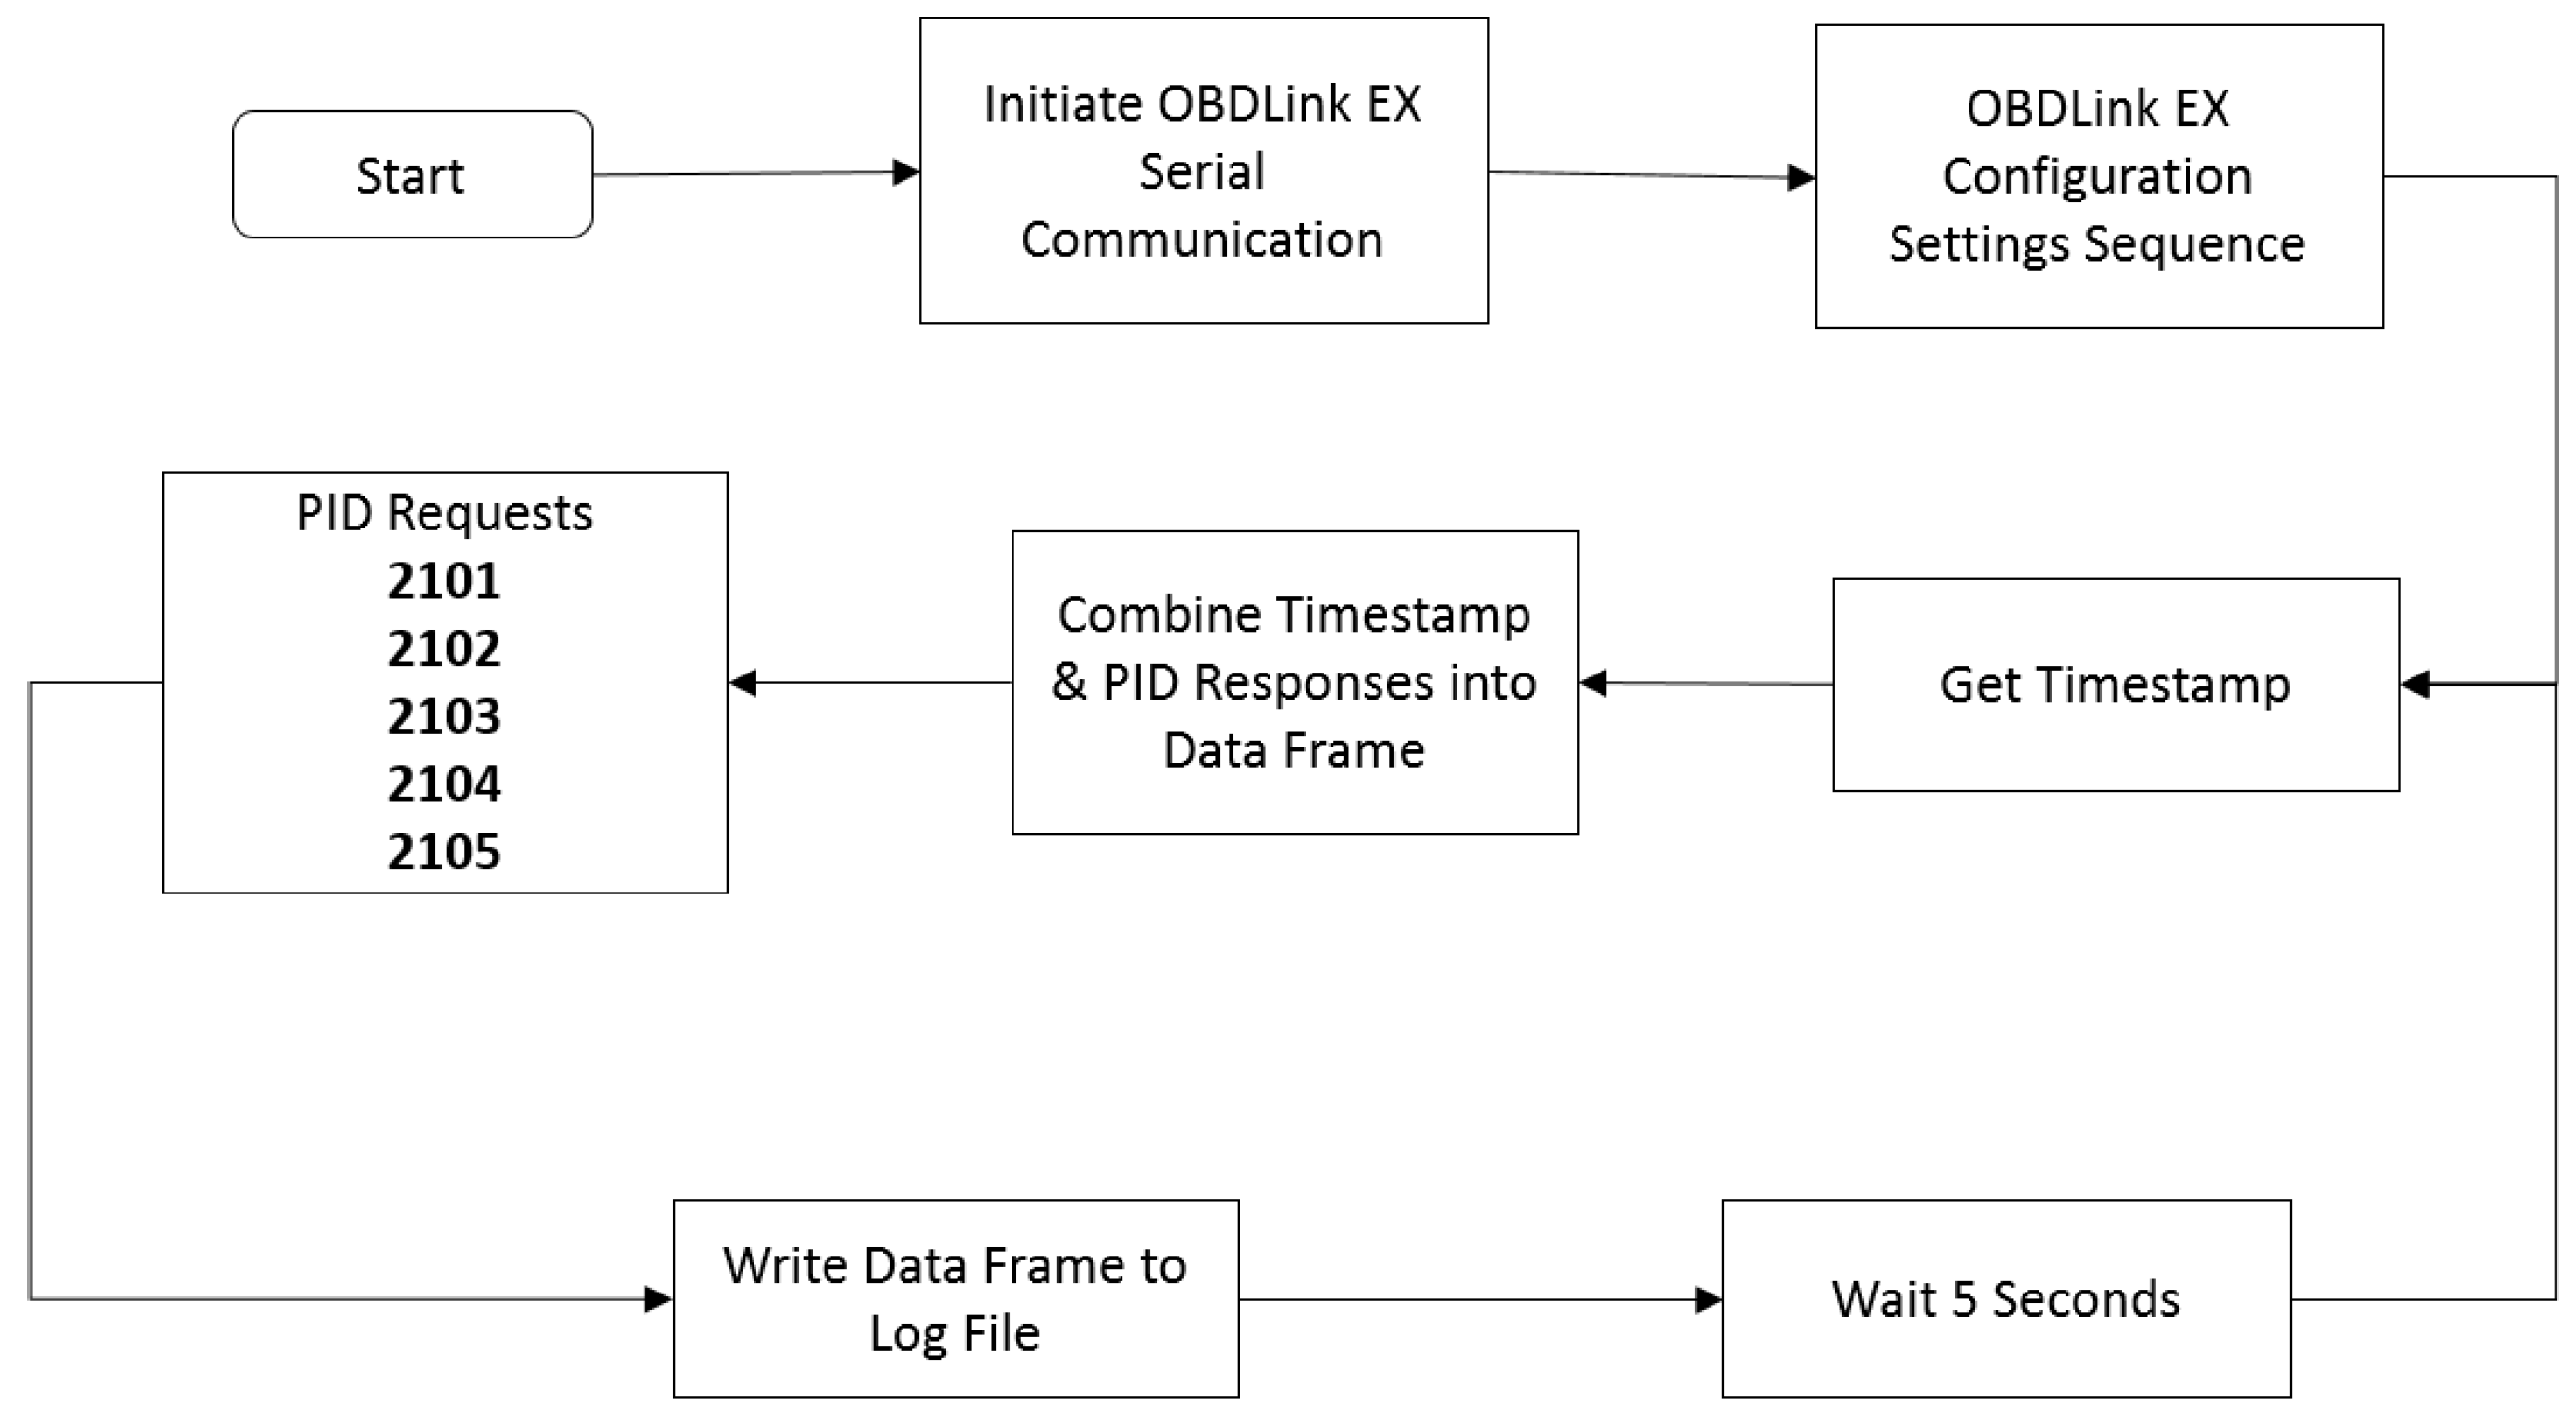
3.2. Data Capture
- Communication initiation setup—set the specific path to the COM port in which the OBDLink EX is connected to as well as the baud rate.
- OBDLink EX configuration setup—set the format for the data responses.
- PID requests and response capture—looped every five seconds (current setting) to continuously send PID requests to the OBDLink EX and store the raw data responses.
3.3. Online Data Logging
3.4. Data Processing
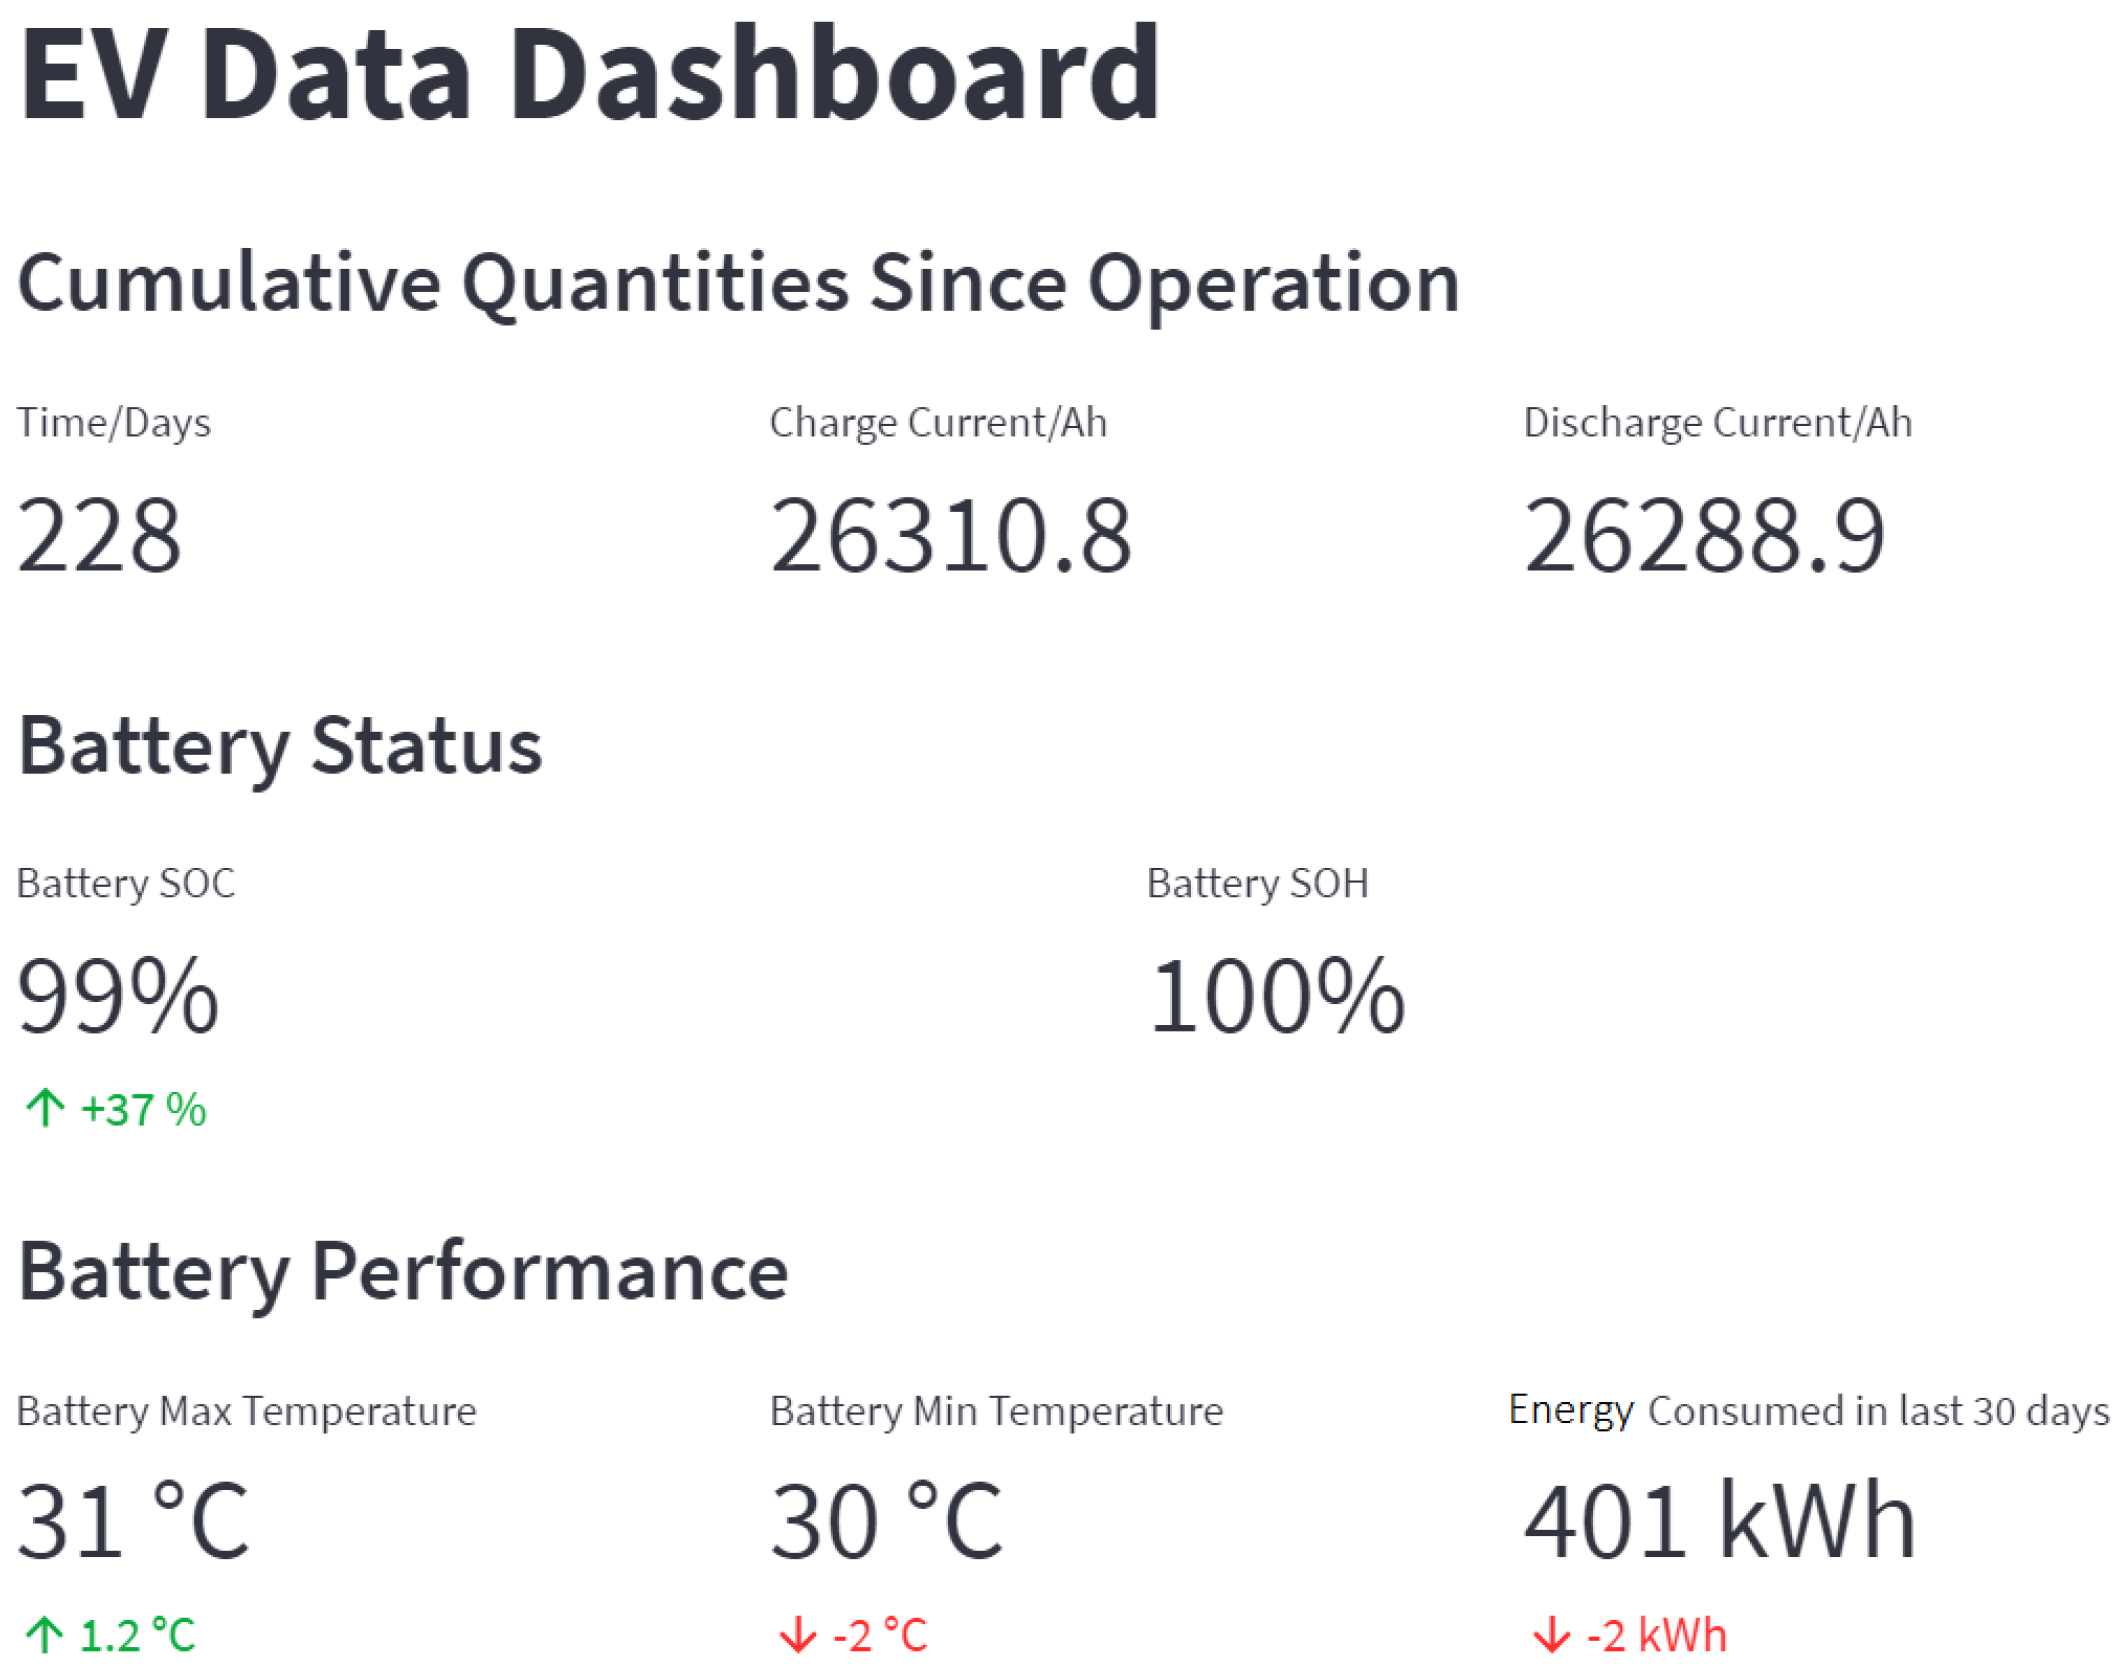
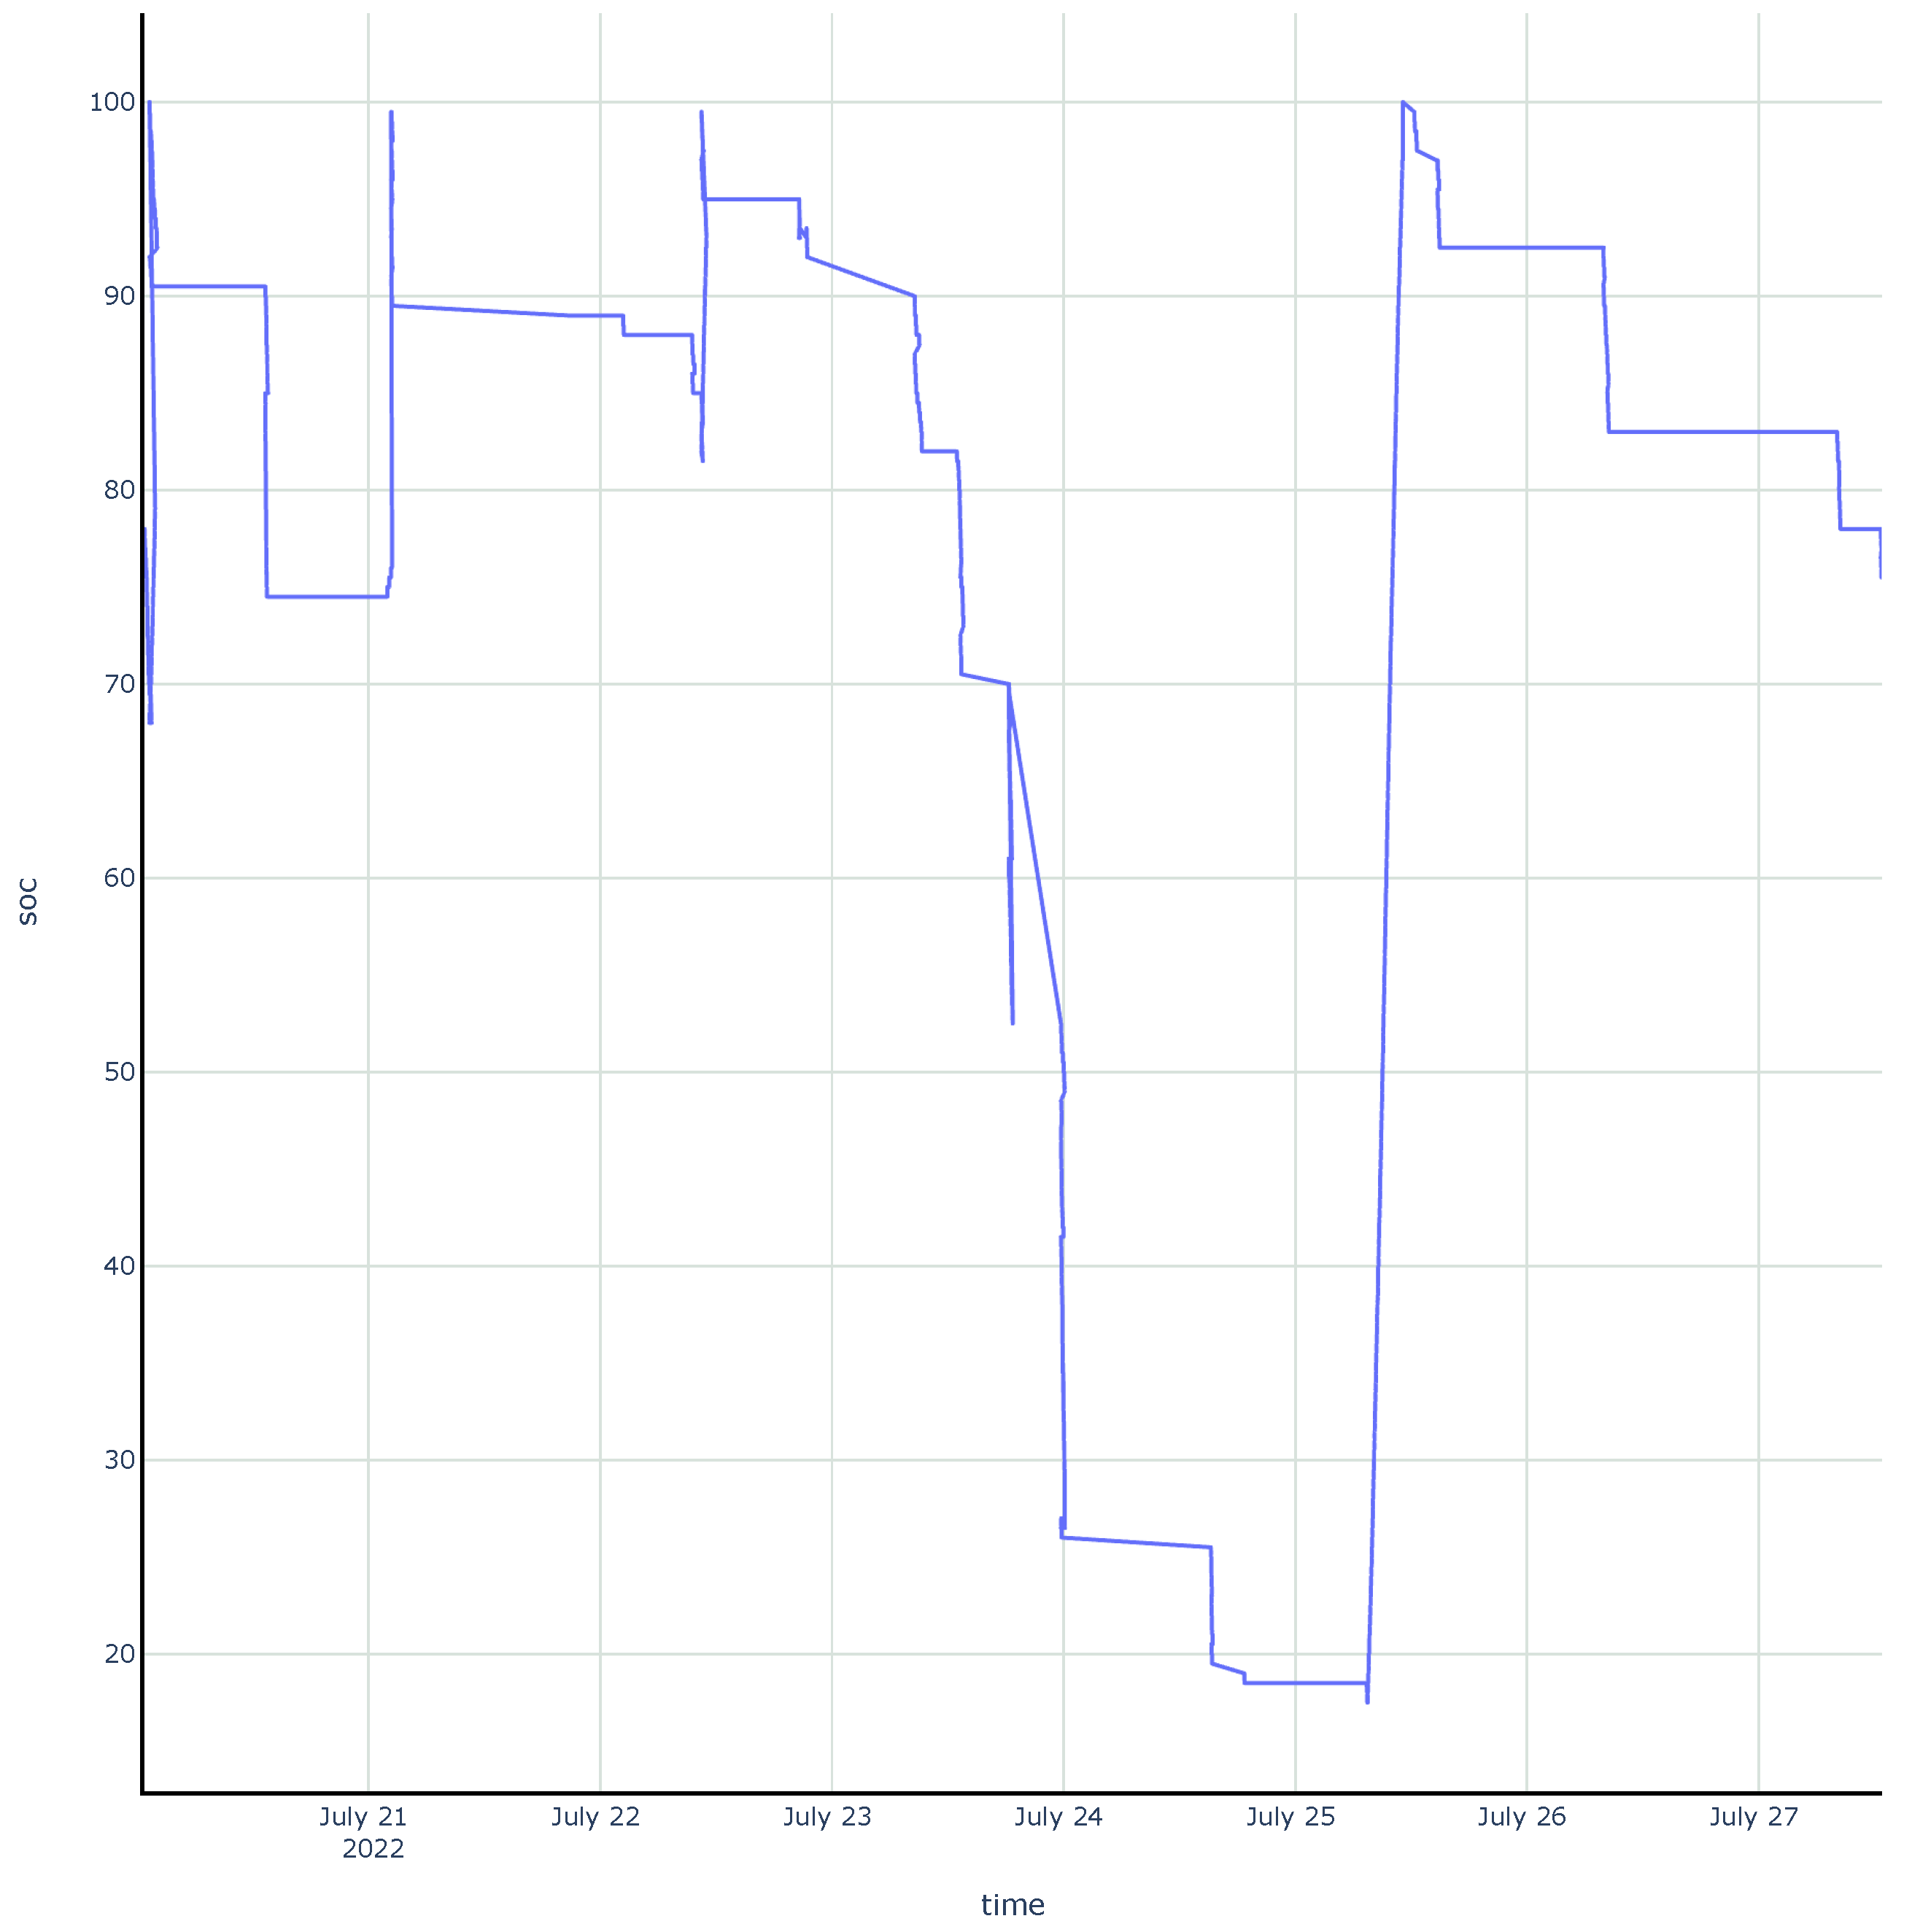
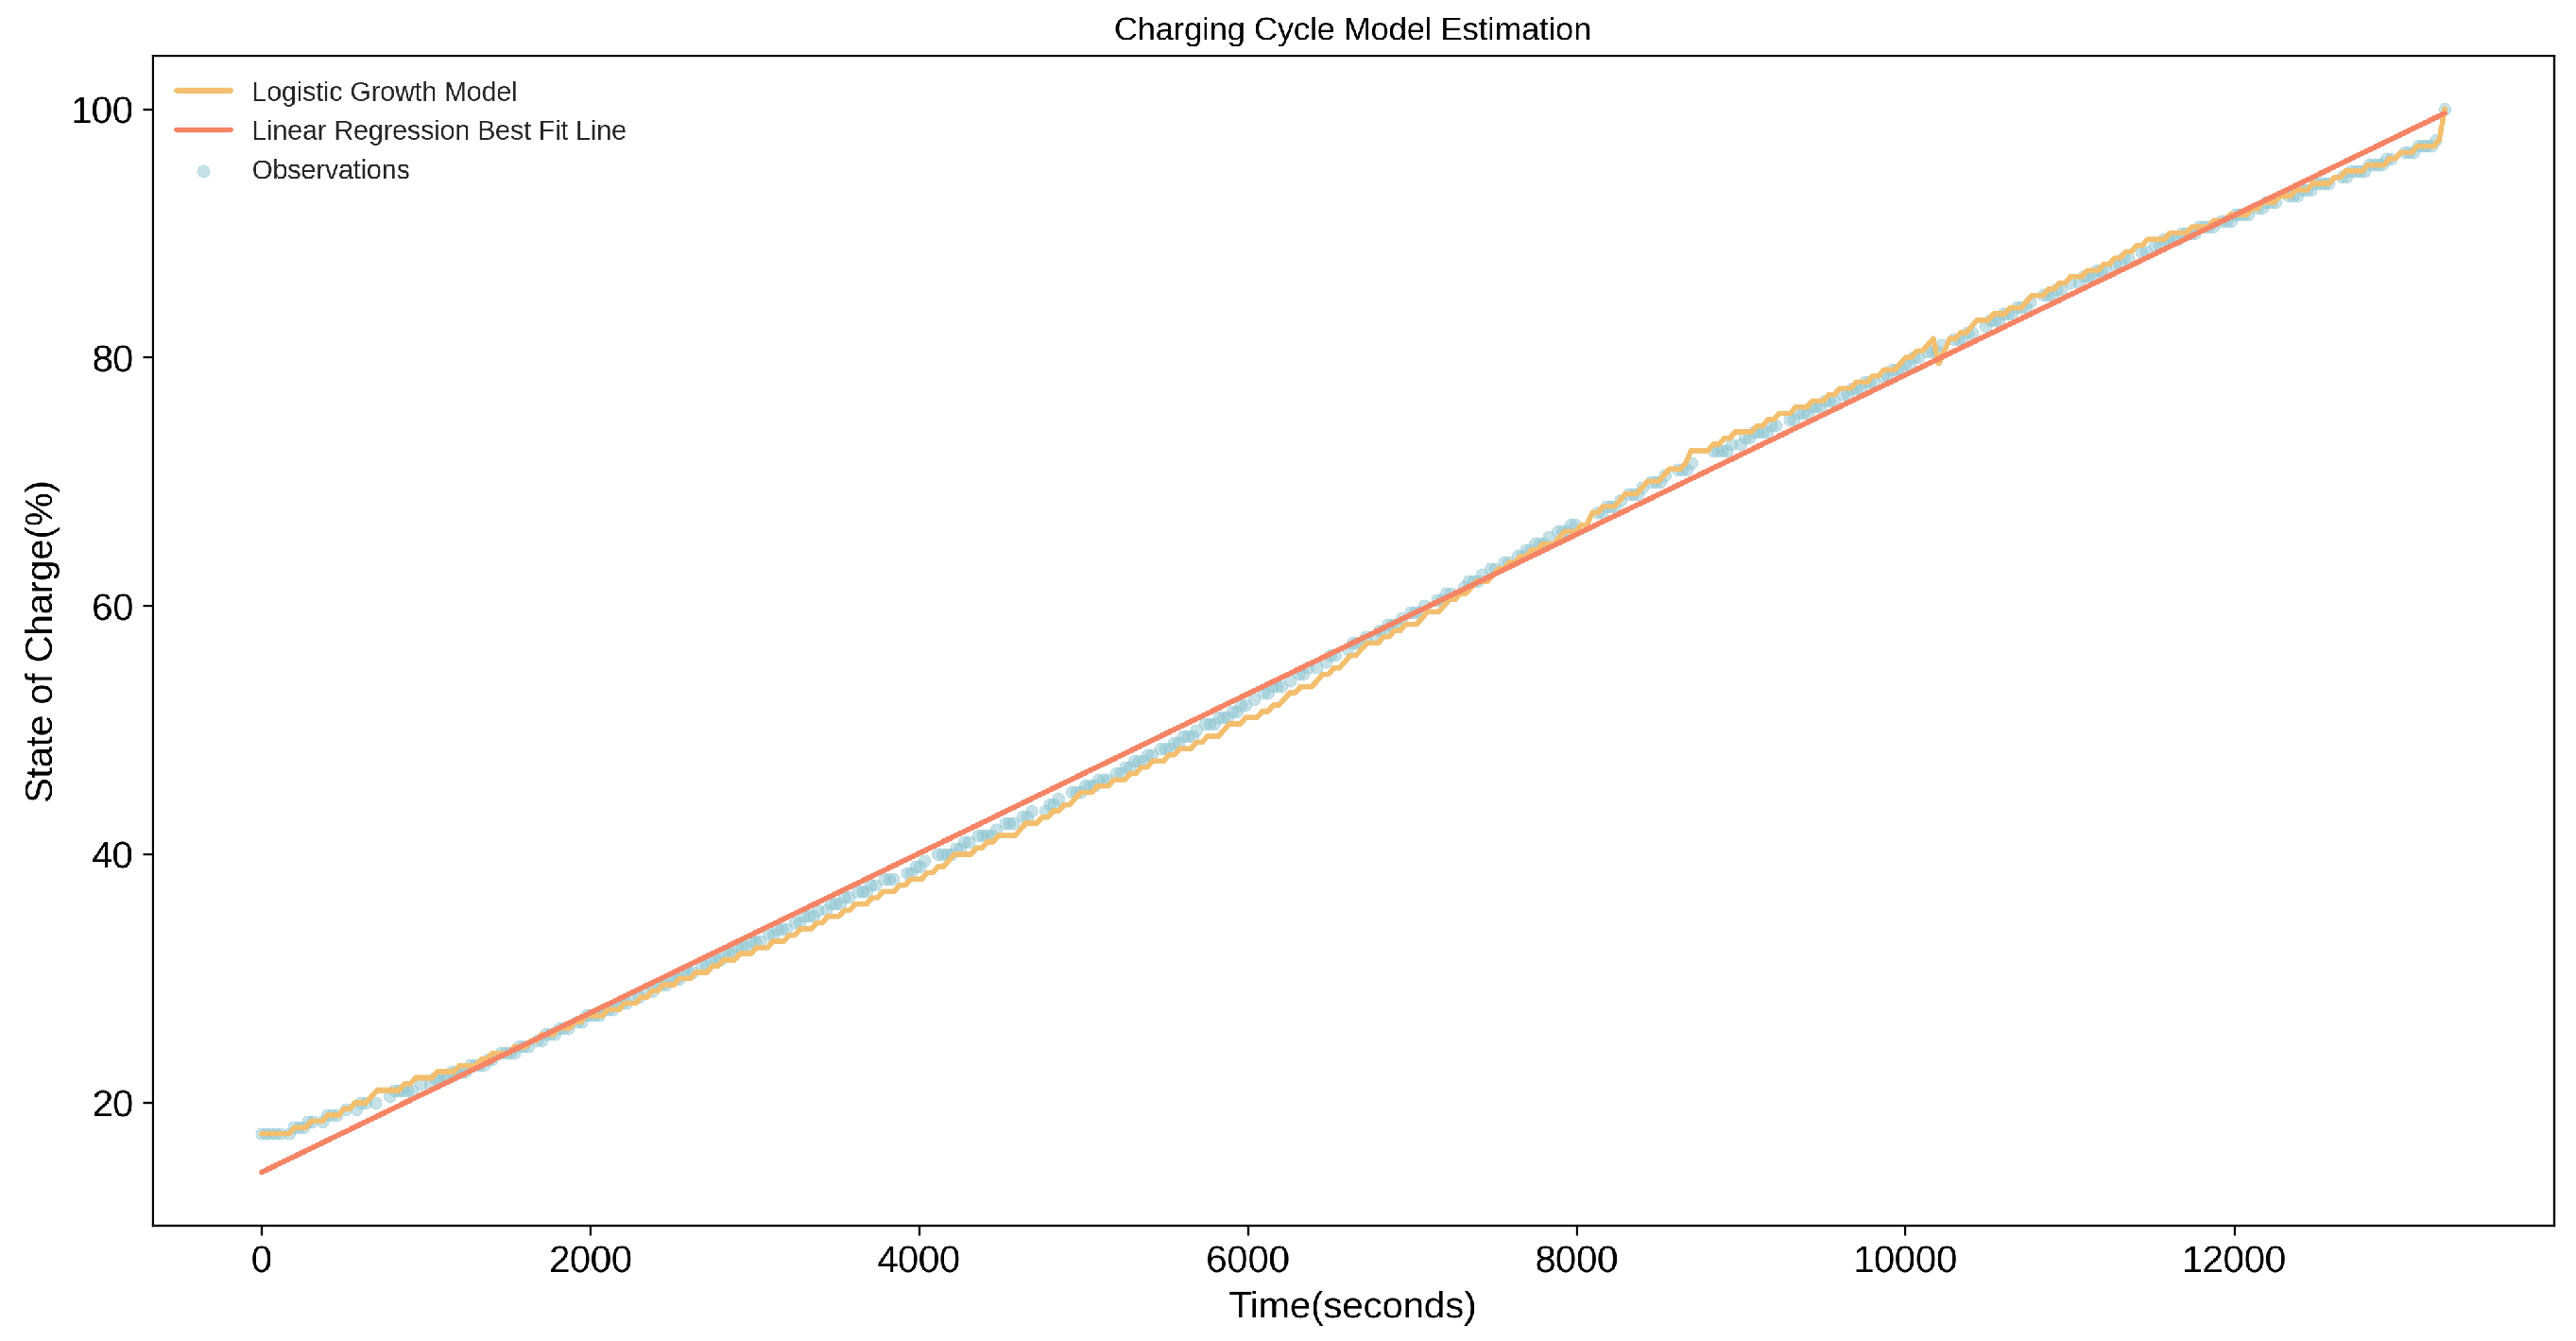
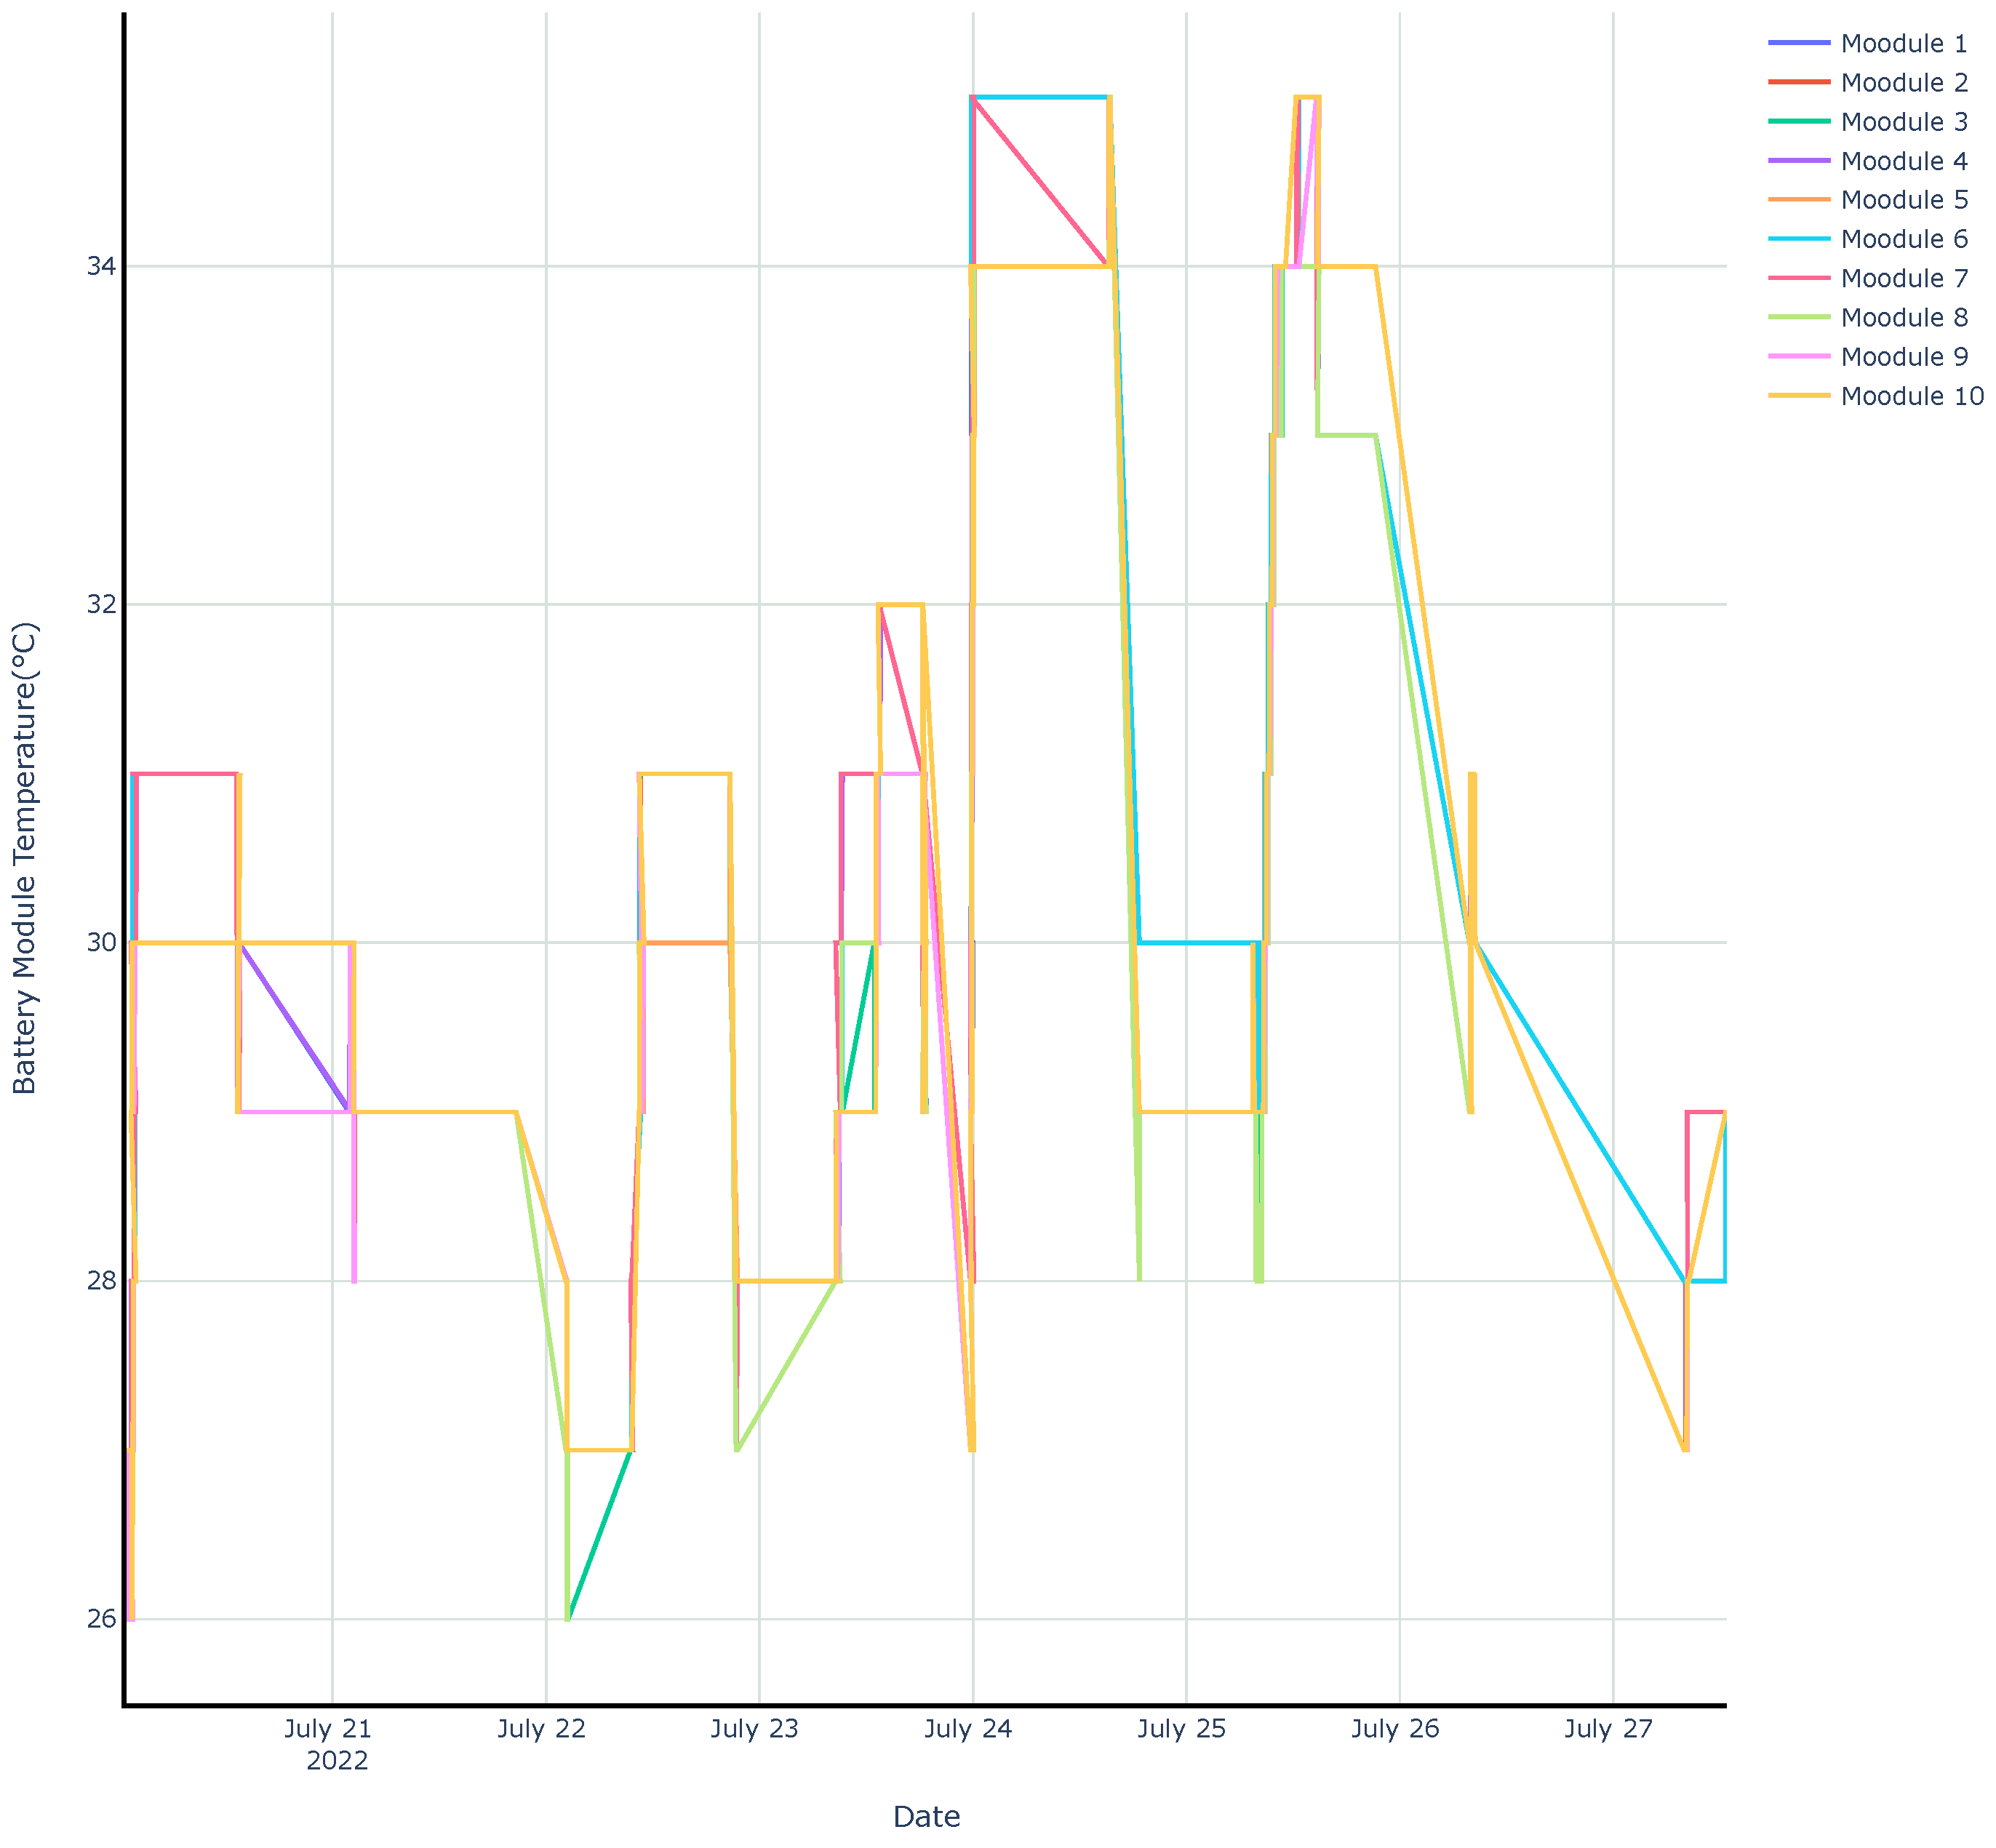
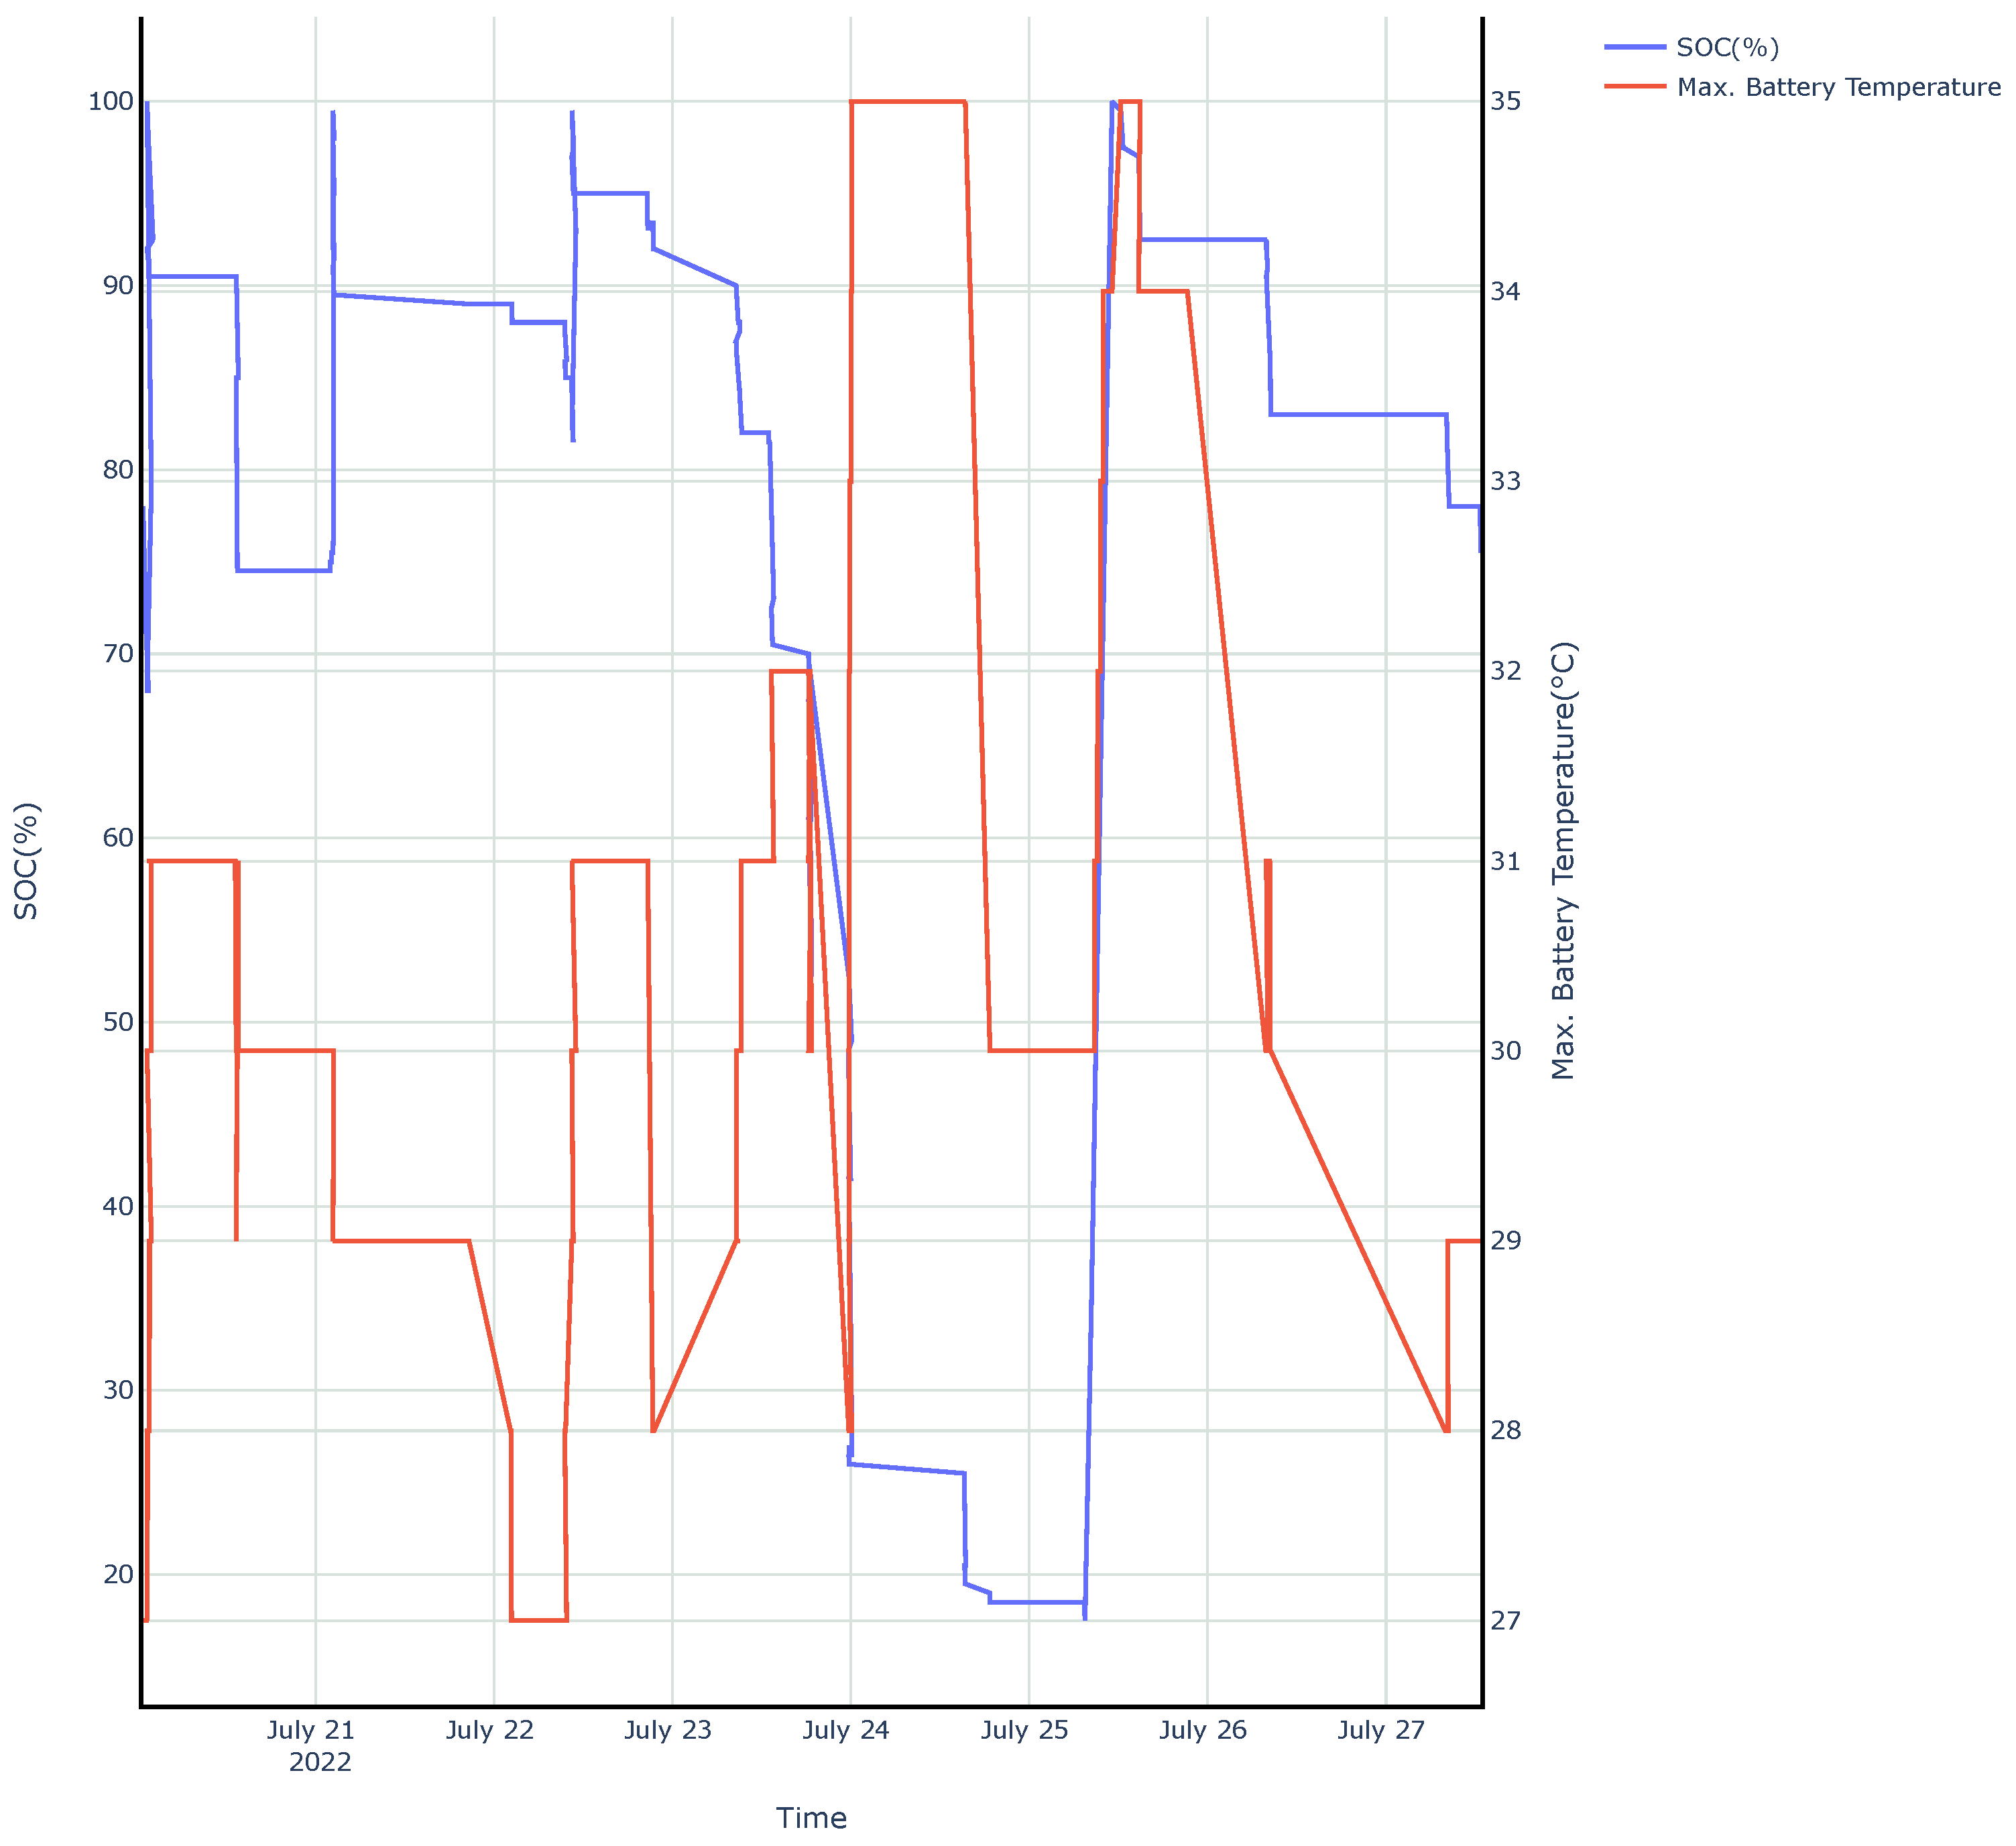
4. Results
5. Conclusions
Author Contributions
Funding
Institutional Review Board Statement
Informed Consent Statement
Data Availability Statement
Conflicts of Interest
Abbreviations
| UN | United Nations |
| SDG | Sustainable Development Goals |
| IEA | International Energy Agency |
| GHG | Greenhouse Gas |
| WTW | Well to Wheel |
| BEV | Battery Electric Vehicle |
| ICE | Internal Combustion Engine |
| OBD | On-Board Diagnostics |
| ECU | Engine Control Unit |
| SOH | State of Health |
| SOC | State of Charge |
| MIL | Malfunction Indicator Light |
| SAE | Society of Automobile Engineers |
| DTC | Diagnostic Trouble Codes |
| DLC | Data Link Connector |
| PID | Parameter ID |
| EVSE | Electric Vehicle Supply Equipment |
References
- United Nations Development Programme. Sustainable Development Goals. Available online: https://www.undp.org/sustainable-development-goals (accessed on 20 September 2022).
- Lipu, M.S.H.; Mamun, A.A.; Ansari, S.; Miah, M.S.; Hasan, K.; Meraj, S.T.; Abdolrasol, M.G.M.; Rahman, T.; Maruf, M.H.; Sarker, M.R.; et al. Battery Management, Key Technologies, Methods, Issues, and Future Trends of Electric Vehicles: A Pathway toward Achieving Sustainable Development Goals. Batteries 2022, 8, 119. [Google Scholar] [CrossRef]
- IPCC. Impacts of 1.5 °C Global Warming on Natural and Human Systems. In Global Warming of 1.5 °C: IPCC Special Report on Impacts of Global Warming of 1.5 °C above Pre-Industrial Levels in Context of Strengthening Response to Climate Change, Sustainable Development, and Efforts to Eradicate Poverty; Cambridge University Press: Cambridge, MA, USA, 2022; pp. 175–312. [Google Scholar] [CrossRef]
- International Energy Agency. Net Zero by 2050. Available online: https://www.iea.org/reports/net-zero-by-2050 (accessed on 20 September 2022).
- Jing, Q.-L.; Liu, H.-Z.; Yu, W.-Q.; He, X. The Impact of Public Transportation on Carbon Emissions—From the Perspective of Energy Consumption. Sustainability 2022, 14, 6248. [Google Scholar] [CrossRef]
- Ghosh, A. Possibilities and Challenges for the Inclusion of the Electric Vehicle (EV) to Reduce the Carbon Footprint in the Transport Sector: A Review. Energies 2020, 13, 2602. [Google Scholar] [CrossRef]
- Michaelides, E.E. Primary Energy Use and Environmental Effects of Electric Vehicles. World Electr. Veh. J. 2021, 12, 138. [Google Scholar] [CrossRef]
- Moro, A.; Lonza, L. Electricity carbon intensity in European Member States: Impacts on GHG emissions of electric vehicles. Transp. Res. Part Transp. Environ. 2018, 64, 5–14. [Google Scholar] [CrossRef] [PubMed]
- Omahne, V.; Knez, M.; Obrecht, M. Social Aspects of Electric Vehicles Research—Trends and Relations to Sustainable Development Goals. World Electr. Veh. J. 2021, 12, 15. [Google Scholar] [CrossRef]
- Shukla, S.; Sen, T.; Raj, A. Impact of E-Mobility Transition on Jobs: A Case Study of Jaipur, Rajasthan; CUTS International: Jaipur, India, 2020. [Google Scholar]
- IEA. Global EV Data Explorer. Available online: https://www.iea.org/data-and-statistics/data-tools/global-ev-data-explorer (accessed on 20 September 2022).
- Nugroho Adi, S.; Ariyanto, E.; Rakhmatsyah, A. Utilization of Onboard Diagnostic II (OBD-II) on Four Wheel Vehicles for Car Data Recorder Prototype. In Proceedings of the 2018 6th International Conference on Information and Communication Technology (ICoICT), Bandung, Indonesia, 3–5 May 2018. [Google Scholar] [CrossRef]
- Niazi Khan, M.A.; Nayyar, A.; Raza, A.; Awan, A.U.; Ali, M.H.; Rashid, N.; Iqbal, J. Development of an On-Board Diagnostic (OBD) kit for troubleshooting of compliant vehicles. In Proceedings of the 2013 IEEE 9th International Conference on Emerging Technologies (ICET), Islamabad, Pakistan, 9–10 December 2013. [Google Scholar] [CrossRef]
- Pretty, C.J.; Pratap Kumar, S. Design and Development of OBD-II Compliant Driver Information System. Indian J. Sci. Technol. 2015, 8, 21. [Google Scholar] [CrossRef]
- Baek, S.H.; Jeong, D.W.; Park, Y.S.; Kim, H.S.; Kim, M.J.; Jang, J.W. Implementation Vehicle Driving State System with OBD-II, MOST network. In Proceedings of the 17th Asia Pacific Conference on Communications, Sabah, Malaysia, 2–5 October 2011. [Google Scholar] [CrossRef]
- Sawant, R.P.; Mane, Y.B. Design and Development of On-Board Diagnostic (OBD) Device for Cars. In Proceedings of the 2018 Fourth International Conference on Computing Communication Control and Automation (ICCUBEA), Pune, India, 16–18 August 2018. [Google Scholar] [CrossRef]
- Yen, M.-H.; Tian, S.-L.; Lin, Y.-T.; Yang, C.-W.; Chen, C.-C. Combining a Universal OBD-II Module with Deep Learning to Develop an Eco-Driving Analysis System. Appl. Sci. 2021, 11, 4481. [Google Scholar] [CrossRef]
- Hong, S.; Hwang, H.; Kim, D.; Cui, S.; Joe, I. Real Driving Cycle-Based State of Charge Prediction for EV Batteries Using Deep Learning Methods. Appl. Sci. 2021, 11, 11285. [Google Scholar] [CrossRef]
- Ko, K.; Lee, T.; Jeong, S. A Deep Learning Method for Monitoring Vehicle Energy Consumption with GPS Data. Sustainability 2021, 13, 11331. [Google Scholar] [CrossRef]
- Khorsravinia, K.; Hassan, M.K.; Rahman, R.Z.A.; Al-Haddad, S.A.R. Integrated OBD-II and mobile application for electric vehicle (EV) monitoring system. In Proceedings of the 2017 IEEE 2nd International Conference on Automatic Control and Intelligent Systems (I2CACIS), Kota Kinabalu, Malaysia, 21 October 2017. [Google Scholar] [CrossRef]
- Wang, L.Y.; Wang, L.F.; Liu, W.; Zhang, Y.W. Research on fault diagnosis system of electric vehicle power battery based on OBD technology. In Proceedings of the 2017 International Conference on Circuits, Devices and Systems (ICCDS), Chengdu, China, 5–8 September 2017. [Google Scholar] [CrossRef]
- Posada, F.; German, J. International Council on Clean Transportation (ICCT). Review of LDV OBD Requirements Under the European, Korean and Californian Emission Programs. 2016. Available online: https://theicct.org/sites/default/files/publications/LDV%20OBD%20China%20White%20Paper%20vFinal.pdf (accessed on 25 August 2022).
- TransportPolicy.net. Available online: https://www.transportpolicy.net/standard/us-on-board-diagnostics (accessed on 9 August 2022).
- Kasam, A.; Kiran, O.S.; Yasasvi, N.V. OBD I & II (On Board Diagnostic). Int. J. Sci. Res. Dev. 2014, 1.5, 1213–1218. [Google Scholar]
- Liu, Y.-J.; Yao, Y.; Liu, C.; Chu, L.; Liu, X. A Remote On-Line Diagnostic System for Vehicles by Integrating OBD, GPS and 3G Techniques. In Advances in Intelligent and Soft Computing; Springer: Berlin/Heidelberg, Germany, 2011; pp. 607–614. [Google Scholar] [CrossRef]
- Sim, A.X.; Sitohang, B. OBD-II standard car engine diagnostic software development. In Proceedings of the 2014 International Conference on Data and Software Engineering (ICODSE), Bandung, Indonesia, 26–27 November 2014. [Google Scholar] [CrossRef]
- Jejusoul, OBD-PIDs-for-HKMC-EVs. Available online: https://github.com/JejuSoul/OBD-PIDs-for-HKMC-EVs (accessed on 15 September 2021).
- AutoPi Telematics Unit, CAN-FD - 4G/LTE Edition. Available online: https://shop.autopi.io/en/products/autopi-telematics-unit-can-fd-4glte-edition-22/ (accessed on 19 September 2022).
- CANedge2: 2x CAN Bus Data Logger (SD + WiFi). Available online: https://www.csselectronics.com/products/can-bus-data-logger-wifi-canedge2 (accessed on 19 September 2022).
- OTC 3005 (Bosch) InfoLogger - OBD2 & EOBD Vehicle Data Recorder. Available online: https://www.diagnostic-world.com/ (accessed on 19 September 2022).
- OBD-II/CAN Logger. Available online: https://iosix.com/product/obd-ii-data-logger/ (accessed on 19 September 2022).
- Qi, X.; Wu, G.; Boriboonsomsin, K.; Barth, M.J. Data-driven decomposition analysis and estimation of link-level electric vehicle energy consumption under real-world traffic conditions. Transp. Res. Part Transp. Environ. 2018, 64, 36–52. [Google Scholar] [CrossRef] [Green Version]
- Morsalin, S.; Mahmud, K.; Town, G.E. Smart Data-Logging System for Coordination of EVs in Distributed Energy Management System, 1st ed.; Graham Town: Melbourne, Australia, 2016; Available online: https://www.researchgate.net/publication/321085968 (accessed on 21 September 2022).
- Addison, L.M.; Hosein, G.A.; Bahadoorsingh, S.; Sharma, C. Goodness-of-Fit Probabilistic Models for EV Charging in Caribbean Small Island States. In Towards Sustainable Transport and Mobility. Perspectives on Travelling and Commuting in Small Island States; Hamburg University Press: Hamburg, Germany, 2022. [Google Scholar] [CrossRef]
- Chen, M.; Rincon-Mora, G.A. Accurate Electrical Battery Model Capable of Predicting Runtime and I-V Performance. IEEE Transactions on Energy Conversion. IEEE Trans. Energy Convers. 2006, 21, 504–511. [Google Scholar] [CrossRef]


| Item | Cost (USD) |
|---|---|
| Auto Pi Telematics Unit, CAN-FD 4G/LTE Edition [28] | 246.86 |
| CANedge2: 2× CAN Bus Data Logger (SD + WiFi) [29] | 576.18 |
| OTC Tools—Infologger Event Data Recorder [30] | 139.57 |
| IOSIX—OBD-II/CAN Logger WiFi [31] | 900.00 |
| Item | Cost (USD) |
|---|---|
| Vilros Raspberry Pi Zero W Basic Starter Kit | 27.99 |
| SanDisk 32 GB Micro SD Card | 7.99 |
| OBDLink EX FORScan OBD Adapter (USB) | 33.95 |
| Rearmaster Universal OBD Power Cable (Micro USB) | 13.98 |
| OBD-II Splitter Cable Male to Dual Female | 8.99 |
| Total | 92.90 (USD) |
| Parameter | PID Response Location | CAN hex | Dec. | Scale Factor | Value | Unit |
|---|---|---|---|---|---|---|
| Battery Max Temperature | 21 7 | 1F | 31 | 1 | 31 | °C |
| Battery Min Temperature | 22 1 | 1E | 30 | 1 | 30 | °C |
| Battery Module 6 Temperature | 21 6 | 1F | 31 | 1 | 31 | °C |
| Battery Module 7 Temperature | 22 2 | 1F | 31 | 1 | 31 | °C |
| Battery Module 8 Temperature | 22 3 | 1E | 30 | 1 | 30 | °C |
| Battery Module 9 Temperature | 22 4 | 1E | 30 | 1 | 30 | °C |
| Battery Module 10 Temperature | 22 5 | 1E | 30 | 1 | 30 | °C |
| Available Charge Power | 22 6:7 | 2648 | 9800 | 0.01 | 98 | kW |
| Available Discharge Power | 23 1:2 | 2648 | 9800 | 0.01 | 98 | kW |
| Battery Cell Voltage Deviation | 23 3 | 0 | 0 | - | 0 | V |
| Quick Charge Normal Status | 23 4 | 1 | 1 | - | 1 | - |
| Airbag H/wire Duty | 23 5 | 50 | 80 | 1 | 80 | % |
| Battery Heater Temp 1 | 23 6 | 0 | 0 | 1 | - | °C |
| Battery Heater Temp 2 | 23 7 | 0 | 0 | 1 | - | °C |
| State of Health (SOH)/Max Deterioration | 24 1:2 | 3E8 | 1000 | 0.1 | 100 | % |
| Max Deterioration Cell no. | 24 3 | 2E | 46 | 1 | 46 | - |
| Min Deterioration | 24 4:5 | 3E8 | 1000 | 0.1 | 100 | % |
| Min Deterioration Cell no. | 24 6 | 1 | 1 | 1 | 1 | - |
| State of Charge (SOC) Display | 24 7 | A5 | 165 | 0.5 | 82.5 | % |
Publisher’s Note: MDPI stays neutral with regard to jurisdictional claims in published maps and institutional affiliations. |
© 2022 by the authors. Licensee MDPI, Basel, Switzerland. This article is an open access article distributed under the terms and conditions of the Creative Commons Attribution (CC BY) license (https://creativecommons.org/licenses/by/4.0/).
Share and Cite
Ramai, C.; Ramnarine, V.; Ramharack, S.; Bahadoorsingh, S.; Sharma, C. Framework for Building Low-Cost OBD-II Data-Logging Systems for Battery Electric Vehicles. Vehicles 2022, 4, 1209-1222. https://doi.org/10.3390/vehicles4040064
Ramai C, Ramnarine V, Ramharack S, Bahadoorsingh S, Sharma C. Framework for Building Low-Cost OBD-II Data-Logging Systems for Battery Electric Vehicles. Vehicles. 2022; 4(4):1209-1222. https://doi.org/10.3390/vehicles4040064
Chicago/Turabian StyleRamai, Clarence, Veeresh Ramnarine, Shankar Ramharack, Sanjay Bahadoorsingh, and Chandrabhan Sharma. 2022. "Framework for Building Low-Cost OBD-II Data-Logging Systems for Battery Electric Vehicles" Vehicles 4, no. 4: 1209-1222. https://doi.org/10.3390/vehicles4040064