Article

A Fuzzy Logic Approach for Determining Driver Impatience and Stress Leveraging Internet of Vehicles Infrastructure

1
Department of Information and Communication Engineering, Fukuoka Institute of Technology (FIT), 3-30-1 Wajiro-Higashi, Higashi-Ku, Fukuoka 811-0295, Japan
2
Graduate School of Engineering, Fukuoka Institute of Technology (FIT), 3-30-1 Wajiro-Higashi, Higashi-Ku, Fukuoka 811-0295, Japan
*
Author to whom correspondence should be addressed.
Vehicles 2022, 4(2), 553-566; https://doi.org/10.3390/vehicles4020032
Submission received: 1 April 2022 / Revised: 26 May 2022 / Accepted: 26 May 2022 / Published: 2 June 2022
(This article belongs to the Special Issue Internet of Vehicles and Vehicles Engineering)

Abstract

:
Drivers are held responsible for the vast majority of traffic crashes. Although most of the errors causing these accidents are involuntary, a significant number of them are caused by irresponsible driving behaviors, which must be utterly preventable. Irresponsible driving, on the other hand, is often associated with driver stress and the impatience they show while driving. In this paper, we consider the factors that cause drivers to become impatient and experience stress and propose an integrated fuzzy logic system that determines the stress level in real time. Based on the stress level, the proposed system can take the appropriate action that improves the driving situation and consequently road safety. By using inputs, such as the unnecessary maneuvers that drivers make, the time pressure, and the number of times they are forced to stop, a fuzzy logic controller determines the driver’s impatience, which is then considered alongside other factors, such as the driving experience and history, the behavior of other drivers, and the traffic condition to determine the stress level. We show, through simulations, the feasibility of the proposed approach to accurately determine driver stress and demonstrate some actions that can be performed when stress exceeds certain levels.

1. Introduction

The iterative advances in inter-vehicular networking technologies and Artificial Intelligence (AI) are paving the way, not only for a complete deployment of connected cars but also for reaching a bigger goal, that of transforming mobility and transportation via self-driving cars.
Nonetheless, even if the automotive industry properly establishes all the technical aspects to make fully autonomous vehicles a reality, there will still be one huge obstacle, the infrastructure. Building the required infrastructure is expected to take years to decades even in the most developed countries; and considering that 93% of the world’s road fatalities occur in low- and middle-income countries [1], driver assistance systems and vehicular networks should remain in focus for the foreseeable future.
Driver assistance systems are intelligent systems implemented in vehicles that improve driving safety by assisting drivers in a myriad of ways. Since they reside mostly inside cars, they do not depend on the infrastructure as much as self-driving cars do [2]. Furthermore, many driver assistance systems can be deployed with fewer costs and, thus, are a feasible alternative for the low- and middle-income countries to reduce traffic accidents significantly.
Vehicular networks, on the other hand, aim not only at reducing car accidents but also at increasing traffic flow and improving the traveling experience for drivers and passengers [3,4,5]. In vehicular networks, vehicles act as network nodes whereby they communicate with adjacent vehicles, infrastructure, pedestrians, and the network to share important information concerning various applications.
By leveraging the data acquired by other vehicles and infrastructure and the ones made available by the network, driving assistance systems can make better decisions and offer more services, thus providing drivers with enhanced applications and experience. These data range from simple information, such as traffic and road condition messages to a complete perception of the surrounding environment obtained through cameras, further improving road safety.
Nevertheless, there are other events and factors that cause car accidents, and the drivers and their behavior are among the critical reasons. In fact, according to the traffic safety facts provided by a survey of the U.S. Department of Transportation [6], the drivers are the immediate reason for more than 94% of the investigated car crashes. The driver-related errors are broadly categorized into recognition errors (e.g., inattentive driving, distracted driving, and inadequate surveillance), decision errors (i.e., misjudgment of the driving situations), performance errors (overcompensation, poor directional control, etc.), and non-performance errors (fatigue, sleep, etc.) [6,7,8,9]. Although most of these errors are involuntary, many often come due to irresponsible driving behaviors, which must be preventable. These irresponsible behaviors are, in most cases, associated with the stress and impatience drivers feel while driving. Finding the factors that trigger impatience and stress and determining their degree accurately is, thus, a work that must be in the immediate focus.
In [10], we have proposed an intelligent system based on Fuzzy Logic (FL) that determines driver stress based on factors such as the driver’s impatience, the behavior of other drivers, and the traffic condition. In this work, we present an improved system, called Improved Fuzzy-based System for Determining Driver Stress (IFSDDS), that additionally considers the driving experience and history as an input parameter and uses the unnecessary manouvrers, the time pressure, and the number of forced stops as determinants of driving impatience. We present the concept of the proposed system in Figure 1. We evaluate IFSDDS by computer simulations and see the effect that the considered factors have on the determination of driver stress.
The structure of the paper is as follows. Section 2 provides a background overview of the technology enablers. Section 3 describes the proposed fuzzy-based system and its implementation. Section 4 discusses the simulation results. Finally, conclusions and future work are given in Section 5.

2. Background and Related Work

In this section, we present a brief introduction of Internet of Things (IoT), Wireless Sensor Networks (WSNs), and Internet of Vehicles (IoV), since these concepts and technologies enable a complete deployment of our proposed system.

2.1. Internet of Things

In general, IoT is a networking concept that refers to the rapidly growing number of devices able to communicate and interact with others over different types of networks with the aim of creating a smart environment which will add more ease to daily life for the people worldwide. Although there are many components involved in IoT, Intelligent Transportation Systems (ITS) are an essential part when it comes to the development of one of the most important IoT applications—Smart Cities. ITS include intelligent systems which help to better manage traffic, cut pollution, make better use of infrastructure, and help citizens stay safe and clean. However, most ITS rely on expensive infrastructure, and alternatives which reduce the required investment are to be sought-after [11].

2.2. Wireless Sensor Networks

Sensors offer significant help in various social problems by converting real-world events into digital data that can be processed, analyzed, stored, and acted upon. A WSN consists of a large number of sensor nodes that operate together to monitor a particular process [12,13]. WSNs have become more mature over the years and will continue to give momentum to many applications for the features it provides. As one of the technologies that take part in ITS, WSNs are seen as key components of heterogeneous systems cooperating along with other technologies employed in vehicular scenarios, especially due to the low installation and maintenance costs [14]. They can be deployed along urban roads and highways, intersections, and in parking areas to constantly obtain information about the weather and road condition, the traffic state, and so on.

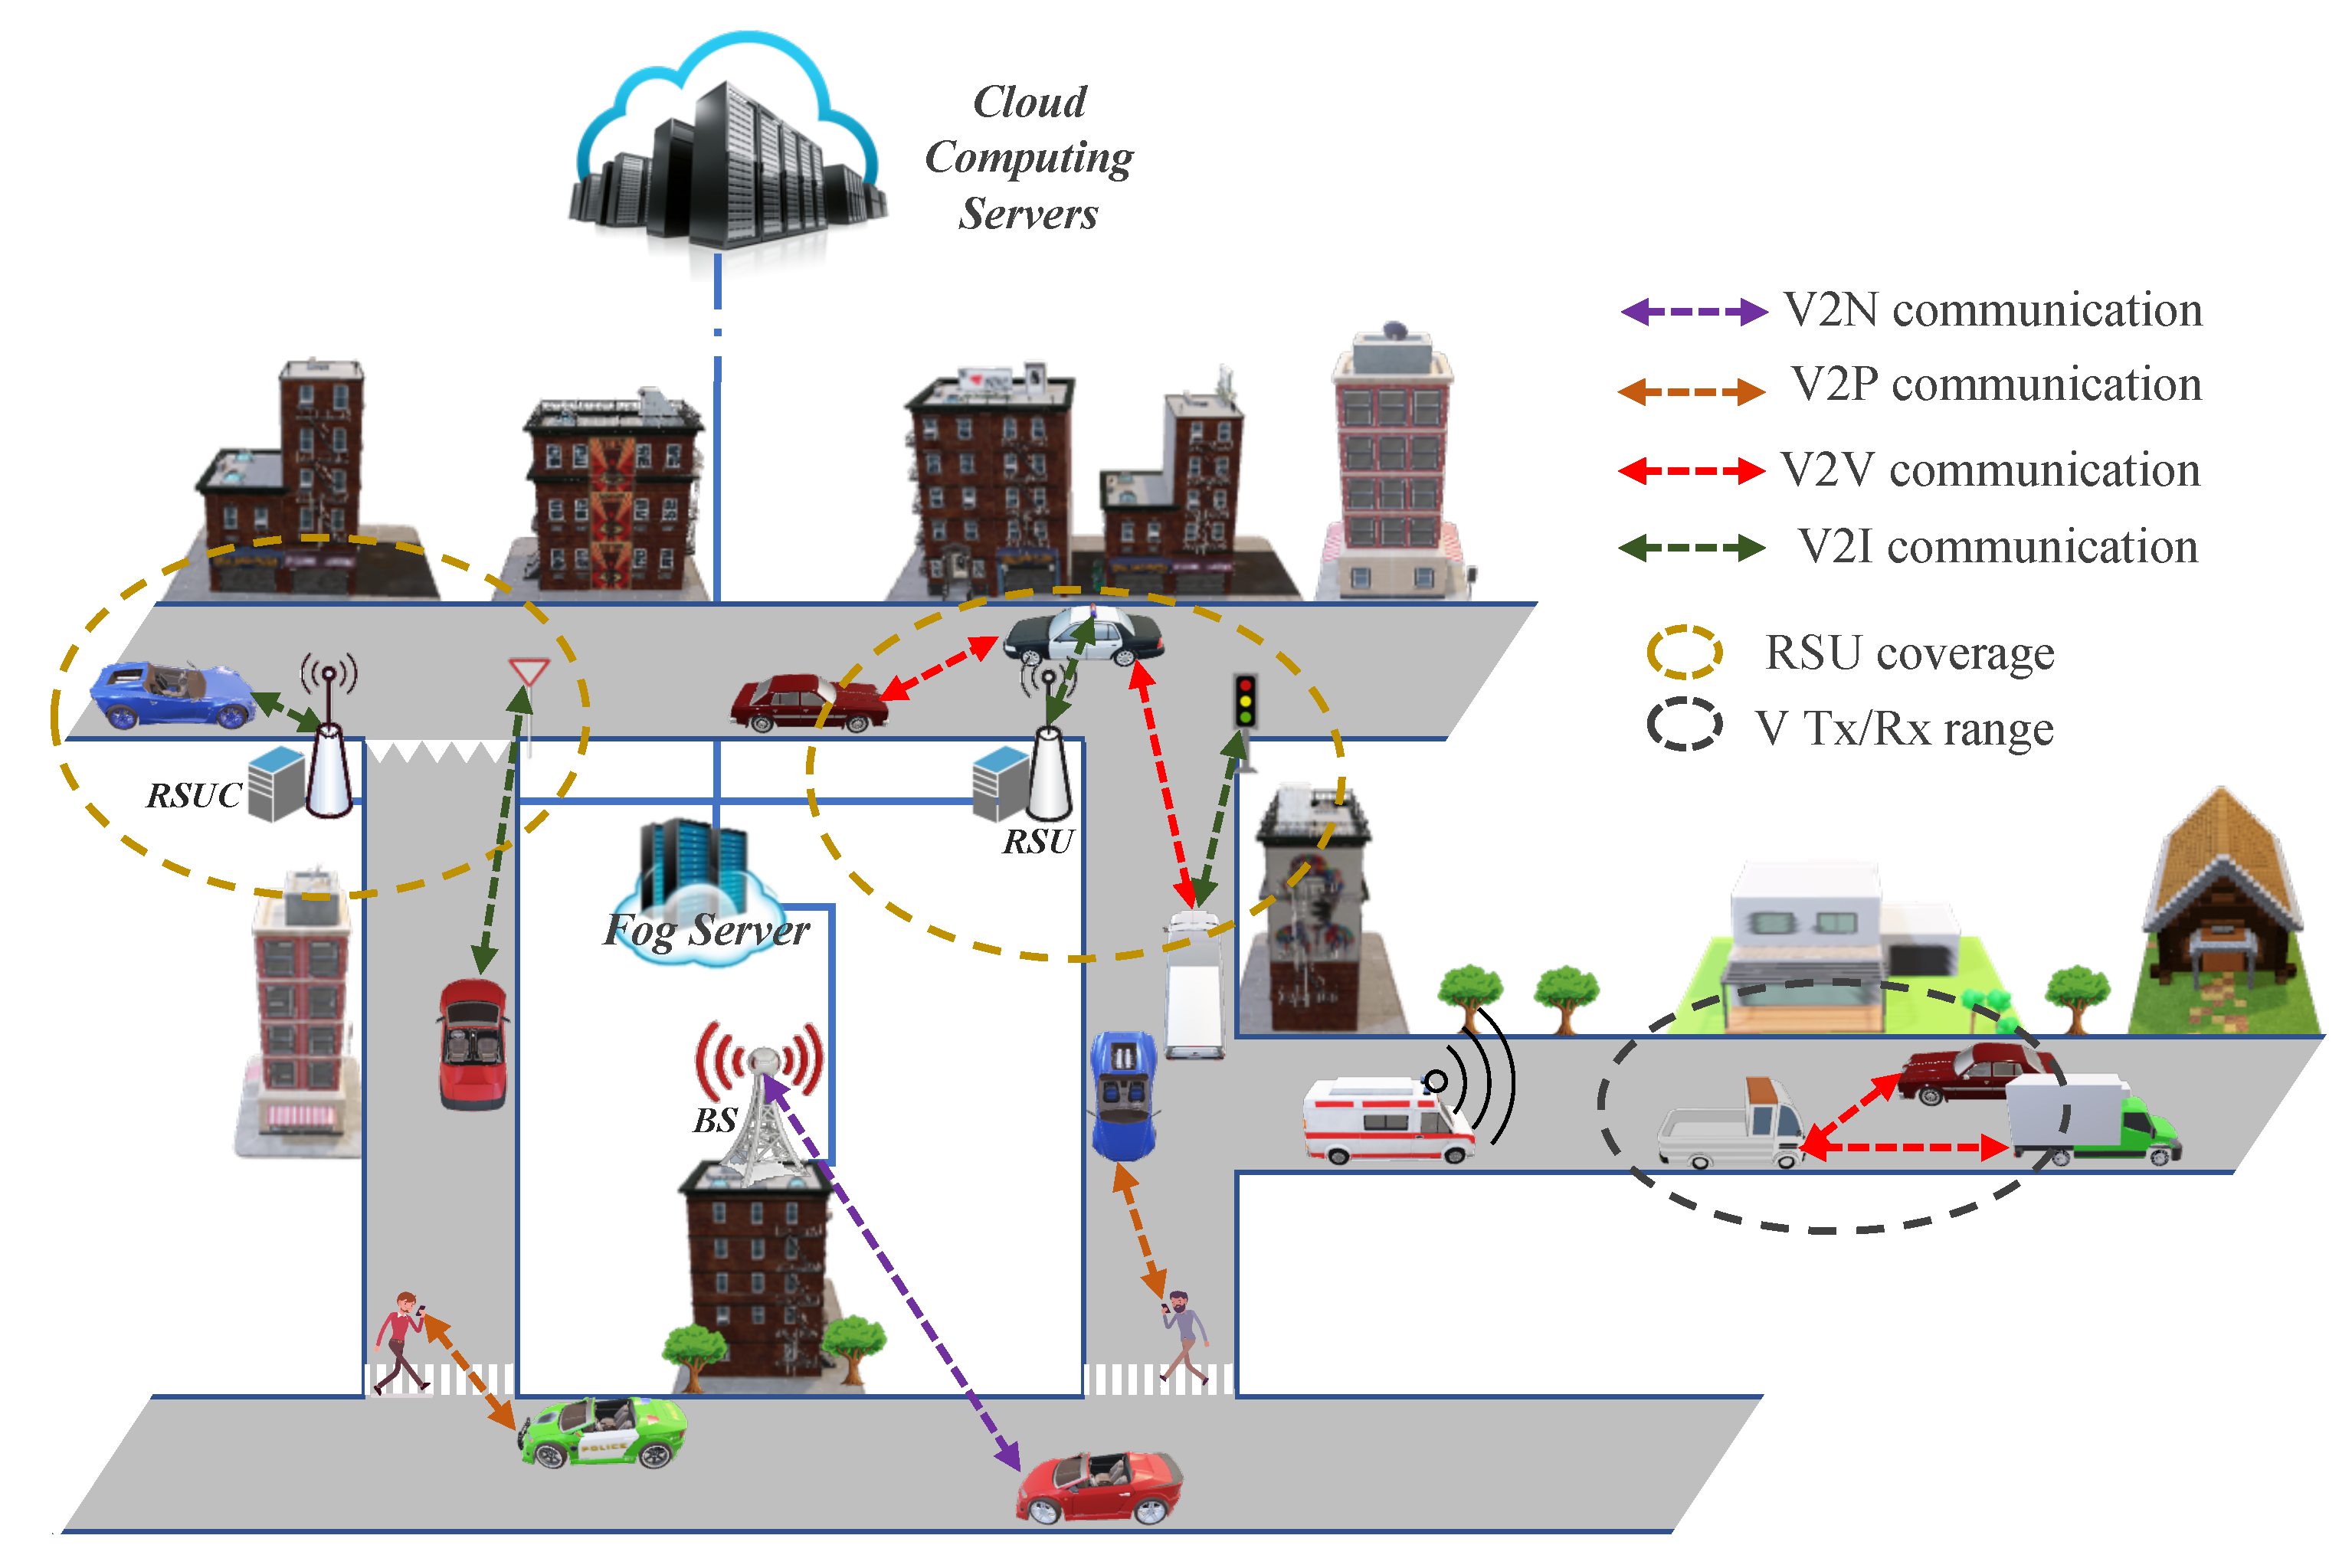
2.3. Internet of Vehicles

The advances in vehicle manufacturing and communication technologies have made it possible for vehicles to be equipped with various sensing platforms and computing capabilities and at the same time with communication modules that enable the connection of vehicles to different entities (surrounding vehicles, Roadside Units (RSUs), RSU Controllers (RSUC), smart road infrastructure, pedestrians, network, cloud, and so on) via Vehicle-to-Everything (V2X) communications [15,16,17,18]. Many of these developments are driven by the proliferation of IoT technologies, which have also driven the traditional vehicular networks into the IoV. Many types of communications are envisioned in IoV, but only Vehicle-to-Vehicle (V2V), Vehicle-to-Infrastructure (V2I), Vehicle-to-Pedestrian (V2P), and Vehicle-to-Network (V2N) have made their way to become standardized by far. We have illustrated these types of communications in Figure 2.
IoV is expected to offer a multitude of services characterized by divergent requirements, ranging from a fully automated vehicle traveling in a smart city to streaming 8 K videos on an in-vehicle infotainment system [19]. However, these services will be available for widespread use only when a complete integration of cellular networks into IoV is achieved.
Therefore, it is necessary to continue designing alternative systems and applications that are more feasible to quickly solve the problems of today but also can work in cooperation with the technologies of the future.

3. Integrated Fuzzy-Based System for Determining Driver Stress

In previous works, we have implemented several intelligent, non-complex, non-intrusive driver assistance systems that can improve road safety. By considering different parameters, including in-car environment parameters, such as the ambient temperature and noise, and driver’s vital signs, i.e., heart and respiratory rate, we implemented an intelligent system in a testbed and conducted experiments in a real scenario [20]. The considered parameters included environmental factors and driver’s health condition, as these parameters affect the driver’s capability and vehicle performance at a high degree. In [21], we presented an integrated fuzzy-based system, which, in addition to those parameters, considers the following inputs: vehicle speed, weather and road condition, driver’s body temperature, and vehicle interior relative humidity. The inputs were categorized based on the way they affect the driving operation. In a more recent work [22], we proposed a system that determines driver stress since stress is often the cause of many road accidents. In this work, we propose an improved version of our system, called IFSDDS, that can determine the driver stress feeling level based on the degree of impatience, traffic condition, other drivers’ behavior, and driving experience and history. To determine the driver’s impatience, we use the unnecessary maneuvers that drivers make, the time pressure, and the number of forced stops.

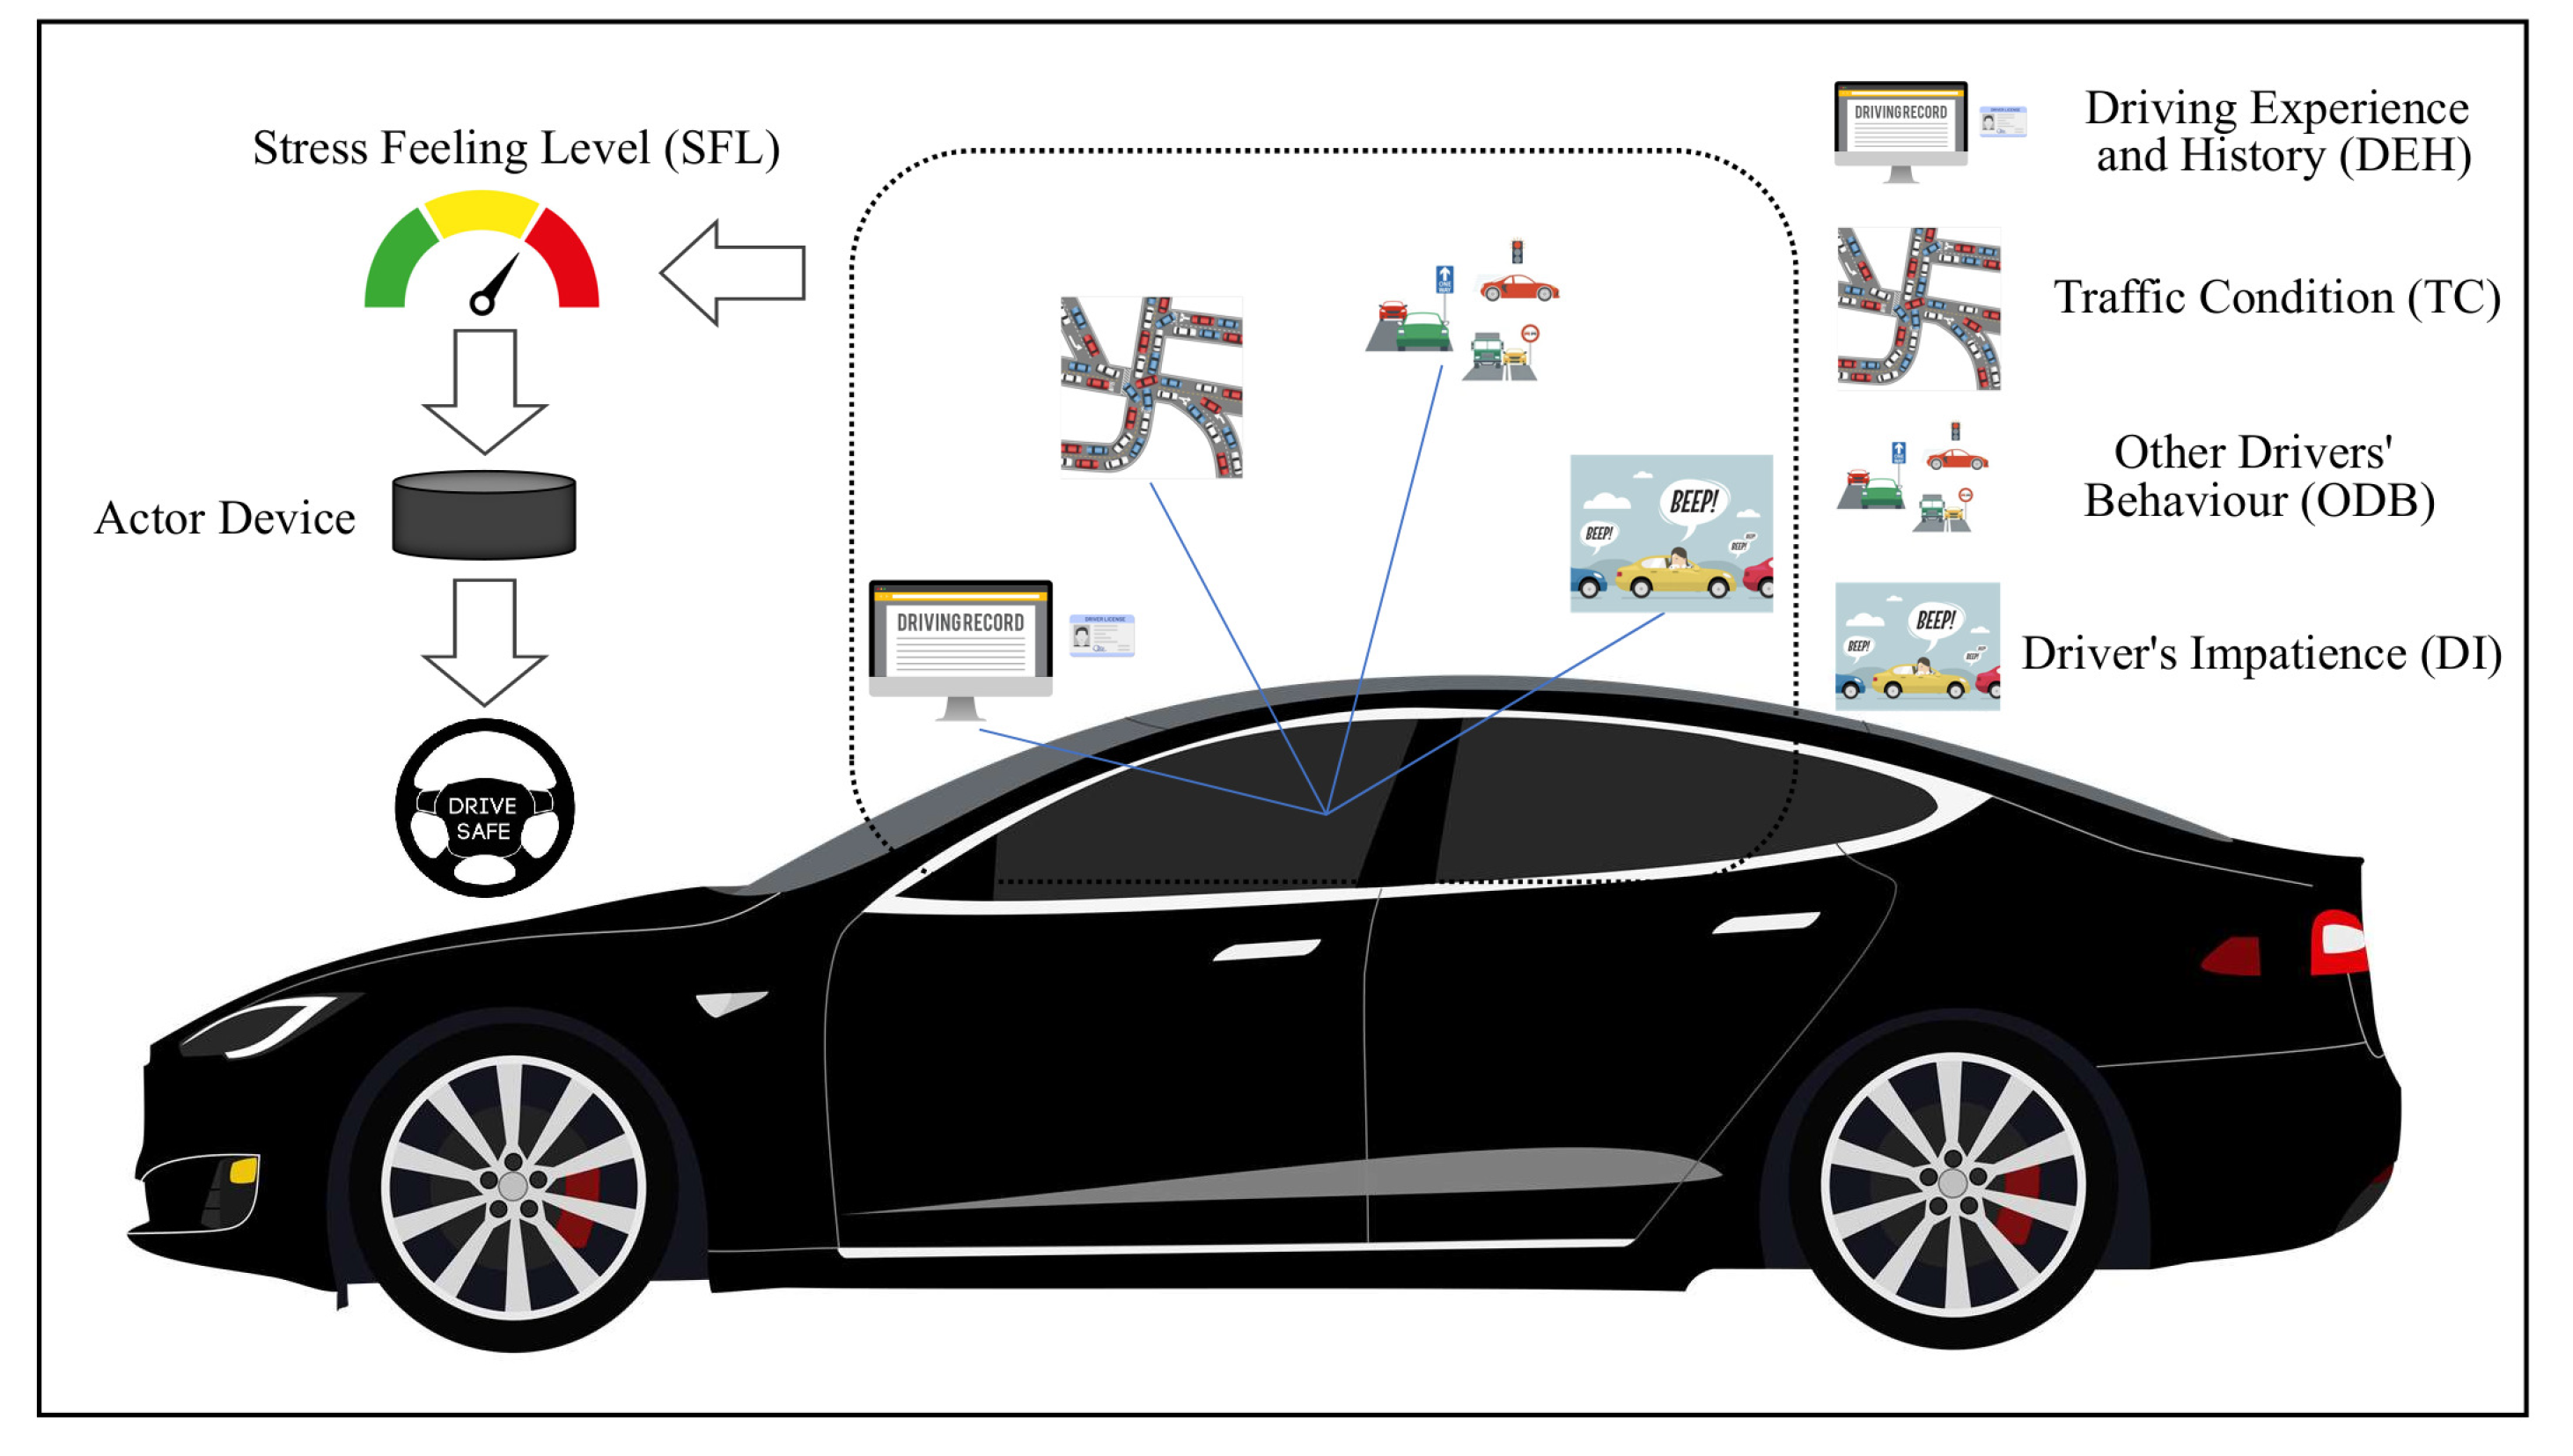
3.1. Description of IFSDDS Parameters

Unnecessary Maneuvers (UM): Driving a car involves many maneuvers regardless of the time or distance and whether it is in city or rural areas. A good operation of the car requires most of the maneuvers to produce a desirable outcome; that is, each action should achieve the intended results. However, this is not always the case. Often drivers perform various maneuvers that are unnecessary or produce no significant outcome. For example, accelerating the car when shortly after there is a need to engage the brakes to slow down is considered an unnecessary maneuver. Other examples would be unnecessary overtaking, tailgating, or even frequent lane changes on the city roads [23]. These unnecessary maneuvers indicate that the driver is becoming impatient; therefore, detecting and utilizing the data generated from such maneuvers is a step closer to improved road safety.
Time Pressure (TP): Time pressure can be defined as the result of an unfavorable ratio between the available time and the time needed to reach the destination. However, reaching the destination later than scheduled or desired does not always elicit the same time pressure because that is more related to the consequences arising from the delay. On the other hand, even in the absence of these time constraints, many drivers may feel time-pressured due to other factors, such as the individual factor and/or the accelerating pace of life [24]. Studies that have investigated the correlation between time pressure and impatience report that drivers tend to show high degrees of impatience when under the pressure of time. Moreover, some time-pressured drivers even undertake risky actions, such as speeding and dangerous overtaking.
Number of Forced Stops (NFS): A driver must stop the car upon encountering a stop sign, a road intersection while the traffic signal is red, or a crosswalk with pedestrians trying to move across the street. All these events are an inevitable part of driving and should not affect the driver in any way. Nevertheless, while a single or a few stops may not have any negative influence, an increased number of them can begin adding that impact on drivers. When all these stops are rather involuntary and frequent, they do not lead up only to an increased traveling time but also an increased ratio between stoppage time and overall traveling time [25]. When the ratio increases significantly, the drivers become more impatient and eventually feel more stressed.
Driver Impatience (DI): The impatience is considered an indicator of stress. Impatient drivers gradually make small mistakes that can escalate to bigger ones, which often lead to serious accidents [24,26]. By inputting the above parameters in a Fuzzy Logic Controller (FLC), we can determine the degree of driver’s impatience, which then can be used as an input to determine driver stress.
Traffic Condition (TC): The traffic condition is a direct cause for stress. No one wants to waste time on the road and traffic jams create the feelings of no escape. Different studies have been focused on identifying the effects of traffic conditions on driving stress. The results have shown that stress levels were highest for drivers experiencing congested roadways [27,28,29,30,31]. The data regarding traffic condition can easily be retrieved from traffic management centers via V2N communications. V2I communications can also be used to communicate with the infrastructure alongside roads to obtain additional information regarding the traffic condition in that particular area.
Other Drivers’ Behavior (ODB): Even the most experienced drivers may feel stress when they fall victims to road rage, or even just by being surrounded by drivers who show other irresponsible behaviors, such as drunk and distracted driving. Most drivers feel relaxed when others show good driving etiquette but experience elevated stress once they share the road with drivers who violate traffic signals [23]. For example, many drivers might feel momentary stress when the driver ahead makes a turn or changes the lane without signaling, or when the irresponsible behavior of others leads to an involvement in a near miss. The dangerous behaviors can be detected via various sensors and cameras, following that the data are analyzed in total discretion in accordance with the privacy concerns. The data can also be communicated to the corresponding vehicles to improve the accuracy of self-detecting risky maneuvers.
Driving Experience and History (DEH): Research has shown that factors, such as age or accident history, although not always directly [32,33], are associated with driving [34,35]. For example, drivers who have been involved in a traffic accident are more likely to feel anxious and develop post-traumatic stress disorders that can last up to a year [36,37]. In addition, younger drivers have reported much more stress than experienced drivers [38]. The accident history profile can be created using the data from the so-called “black box” each smart car is being equipped with, the servers of insurance companies, and the government department responsible for motor vehicles.
Stress Feeling Level (SFL): This parameter is the output of our system. It includes seven stress levels ranging from low to extremely high. Although the output values are numbers from 0 to 1, the linguistic description of stress levels is also useful for the interpretation of the results, which on the other hand, allows for better implementation of an actor module. Based on the stress level, an actor module can perform actions that can improve the driver stress for the safety of all road users.

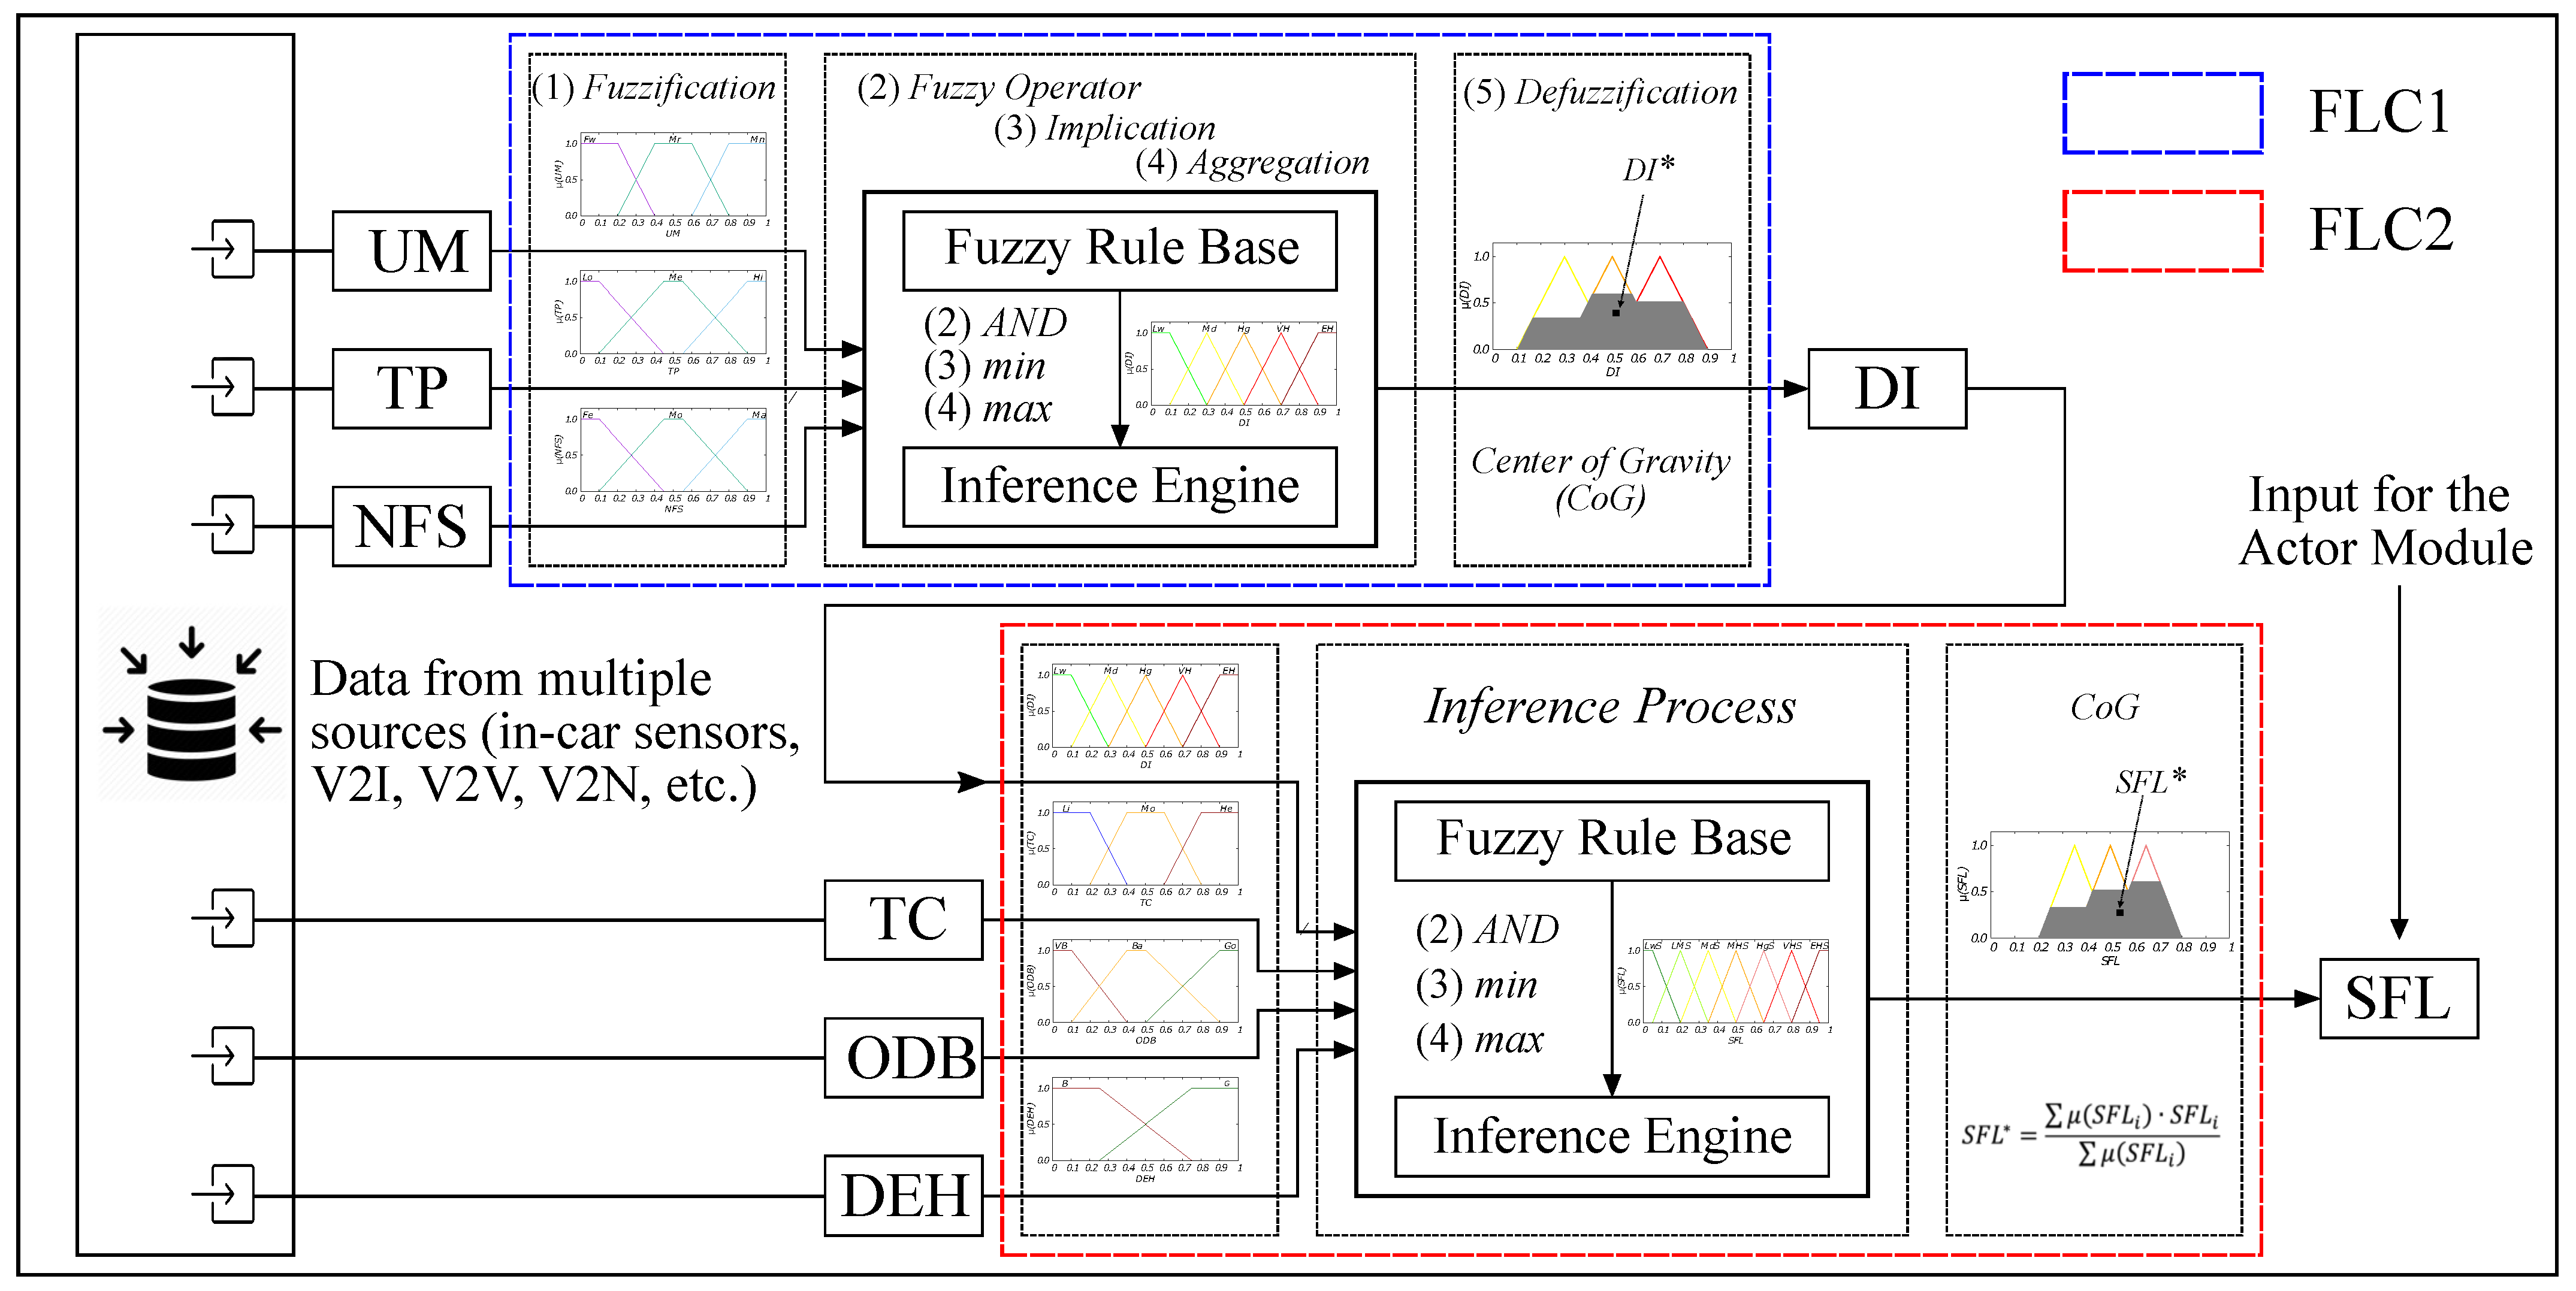
3.2. Implementation Details

We use FL to implement IFSDDS as FL can make real-time decisions based on the uncertainty and vagueness of the provided information [39,40,41]. IFSDDS is composed of two FLCs, one that determines the driver’s impatience and one that determines the stress level, which is the final output of the system. A detailed diagram of IFSDDS is given in Figure 3.
We use type 1 fuzzy sets because type 1 fuzzy systems are faster, include lower computational costs, and are adequate for our application. Regarding the inference engine used, we choose Mamdani over Sugeno because Mamdani systems have more widespread acceptance for decision support applications due to the intuitive and interpretable nature of the Fuzzy Rule Base (FRB). Moreover, determining the parameters of polynomials in the antecedent of Sugeno fuzzy rules is inefficient and less straightforward compared to defining the output fuzzy sets for Mamdani systems [42,43,44].
In addition, the methods selected along the inference process are: AND operation (min method) as the Fuzzy Operator, min method for the Implication step, max as the Aggregation method, and Center of Gravity (CoG) for the defuzzification process. These methods are the most used methods in literature due to the simplicity, efficacy, and performance they offer.
The term set of each linguistic parameter is defined, respectively, as:
T ( U M ) = { F e w ( F w ) , M o d e r a t e ( M r ) , M a n y ( M n ) } ; T ( T P ) = { L o w ( L o ) , M e d i u m ( M e ) , H i g h ( H i ) } ; T ( N F S ) = { F e w ( F e ) , M o d e r a t e ( M o ) , M a n y ( M a ) } ; T ( D I ) = { L o w ( L w ) , M o d e r a t e ( M d ) , H i g h ( H g ) , V e r y H i g h ( V H ) , E x t r e m e l y H i g h ( E H ) } ; T ( T C ) = { L i g h t ( L ) , M o d e r a t e ( M ) , H e a v y ( H ) } ; T ( O D B ) = { V e r y B a d ( V B ) , B a d ( B a ) , G o o d ( G o ) } ; T ( D E H ) = { B a d ( B ) , G o o d ( G ) } ; T ( S F L ) = { L o w S t r e s s ( L w S ) , L o w t o M o d e r a t e S t r e s s ( L M S ) , M o d e r a t e S t r e s s ( M d S ) , M o d e r a t e t o H i g h S t r e s s ( M H S ) , H i g h S t r e s s ( H g S ) , V e r y H i g h S t r e s s ( V H S ) , E x t r e m e l y H i g h S t r e s s ( E H S ) } .
Each term in a term set characterizing a parameter is, in essence, a fuzzy set and is represented by a membership function. The membership functions used for all parameters are given in Figure 4. We use three terms for the input parameters of FLC1 and five for its output. For the output of FLC2, on the other hand, we use seven. Using fewer terms for the input parameters and more for the outputs enables input-output continuity, which is an important feature that recommends that small changes in the input parameters should result in small changes in output values.
The input parameters are normalized (before fuzzification) using the following formula: x n o r m a l i z e d = ( x x m i n ) / ( x m a x x m i n ) . The reason for normalization is to have the system work in many situations since most of the parameters we consider differ from case to case. For example, the traffic on secondary streets is not the same as on the main roads, and the concept of “heavy traffic” is not the same either. Heavy traffic on main streets includes many more cars and very different waiting times. The normalization of the variables enables better adaptation for various drivers and driving scenarios.
Regarding the shape of membership functions, we use triangular and trapezoidal functions because these types have lower computational costs and are more suitable for real-time operation. The numeric range of each membership function is decided based on the nature of each parameter and then adjusted during the design process, which involved many computer simulations. The overlap of two membership functions defines the elements that belong to both fuzzy sets simultaneously, whereby at least one element belongs to both sets at the same degree of membership. The membership degree of this element is known differently as completeness and is usually denoted by ϵ . An ϵ = 0.5 guarantees efficient and robust control because an increased overlap of membership functions introduces redundancies, whereas slight overlap can lead to inefficient control.
The linguistic description of input and output parameters concerns the FRB, too. Based on the linguistic description of input and output parameters of each FLC, its FRB forms a fuzzy set of dimensions T ( x 1 ) × T ( x 2 ) × × T ( x n ) , where T ( x i ) is the number of terms on T ( x i ) , and n is the number of input parameters. For example, FLC1 has three input parameters with three linguistic terms each; therefore, there are 27 rules in the FRB1. Correspondingly, FRB2 is composed of 90 rules. The FRB1 and FRB2 are shown in Table 1 and Table 2, respectively. The rules are IF-THEN statements that are activated in the decision process when an input is given. For instance, Rule 1 of FRB1 can be interpreted as: “IF UM is Fw, TP is Lo, and NFS is Fe THEN DI is Lw” or Rule 1 of FRB2: “IF DEH is B, ODB is VB, TC is L, and DI is Lw THEN SFL is MdS”. In each instance of the inference process there is at least one rule fired, whereas the maximum number of fired rules depends on the characteristics of membership functions. In our system, the number of rules activated simultaneously for FLC1 and FLC2 can be as high as 8 and 16 rules, respectively.

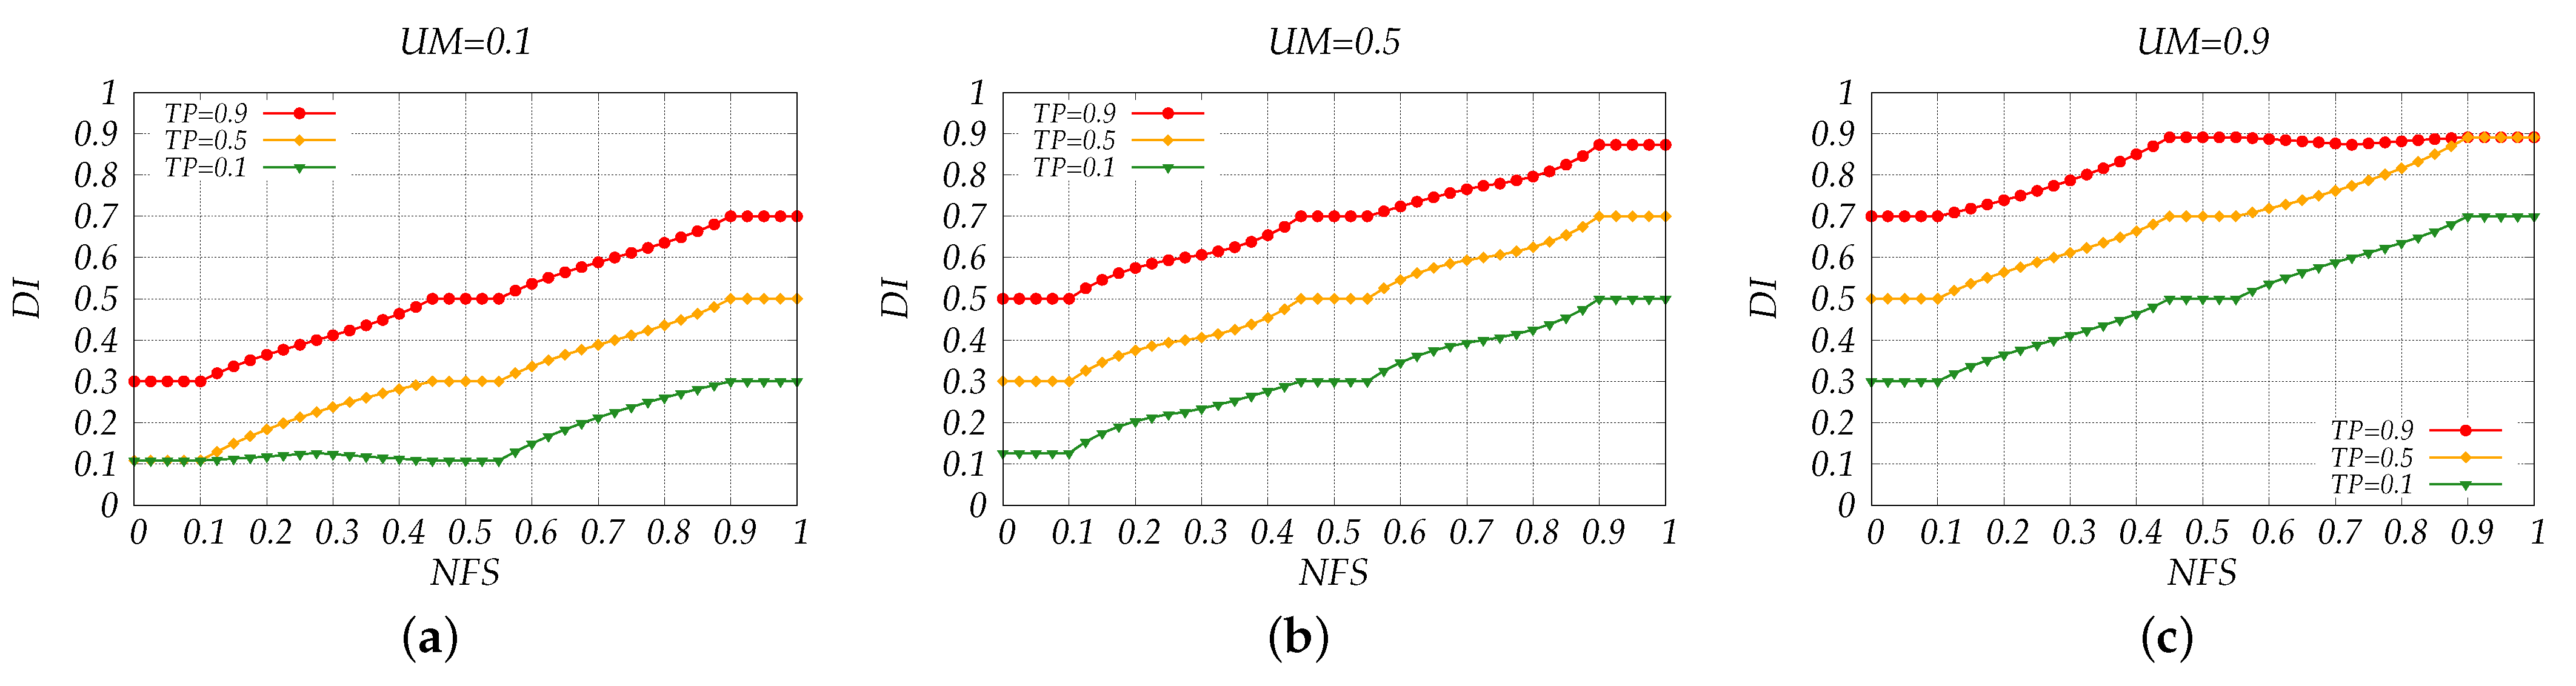
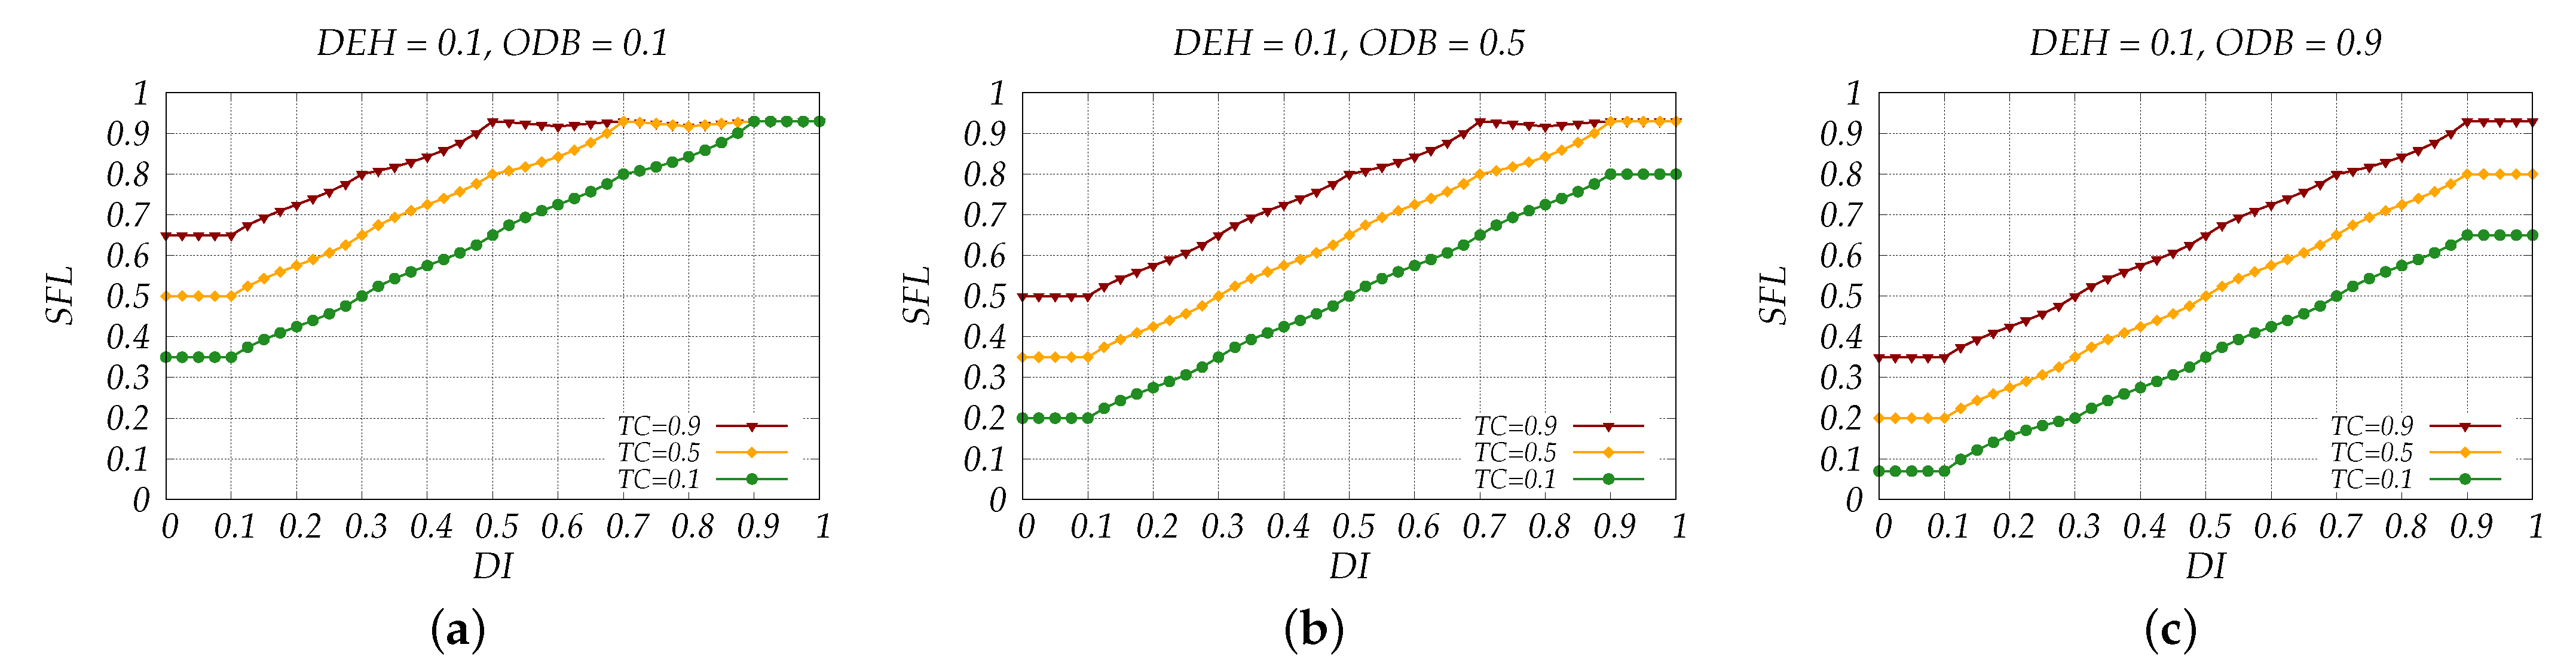
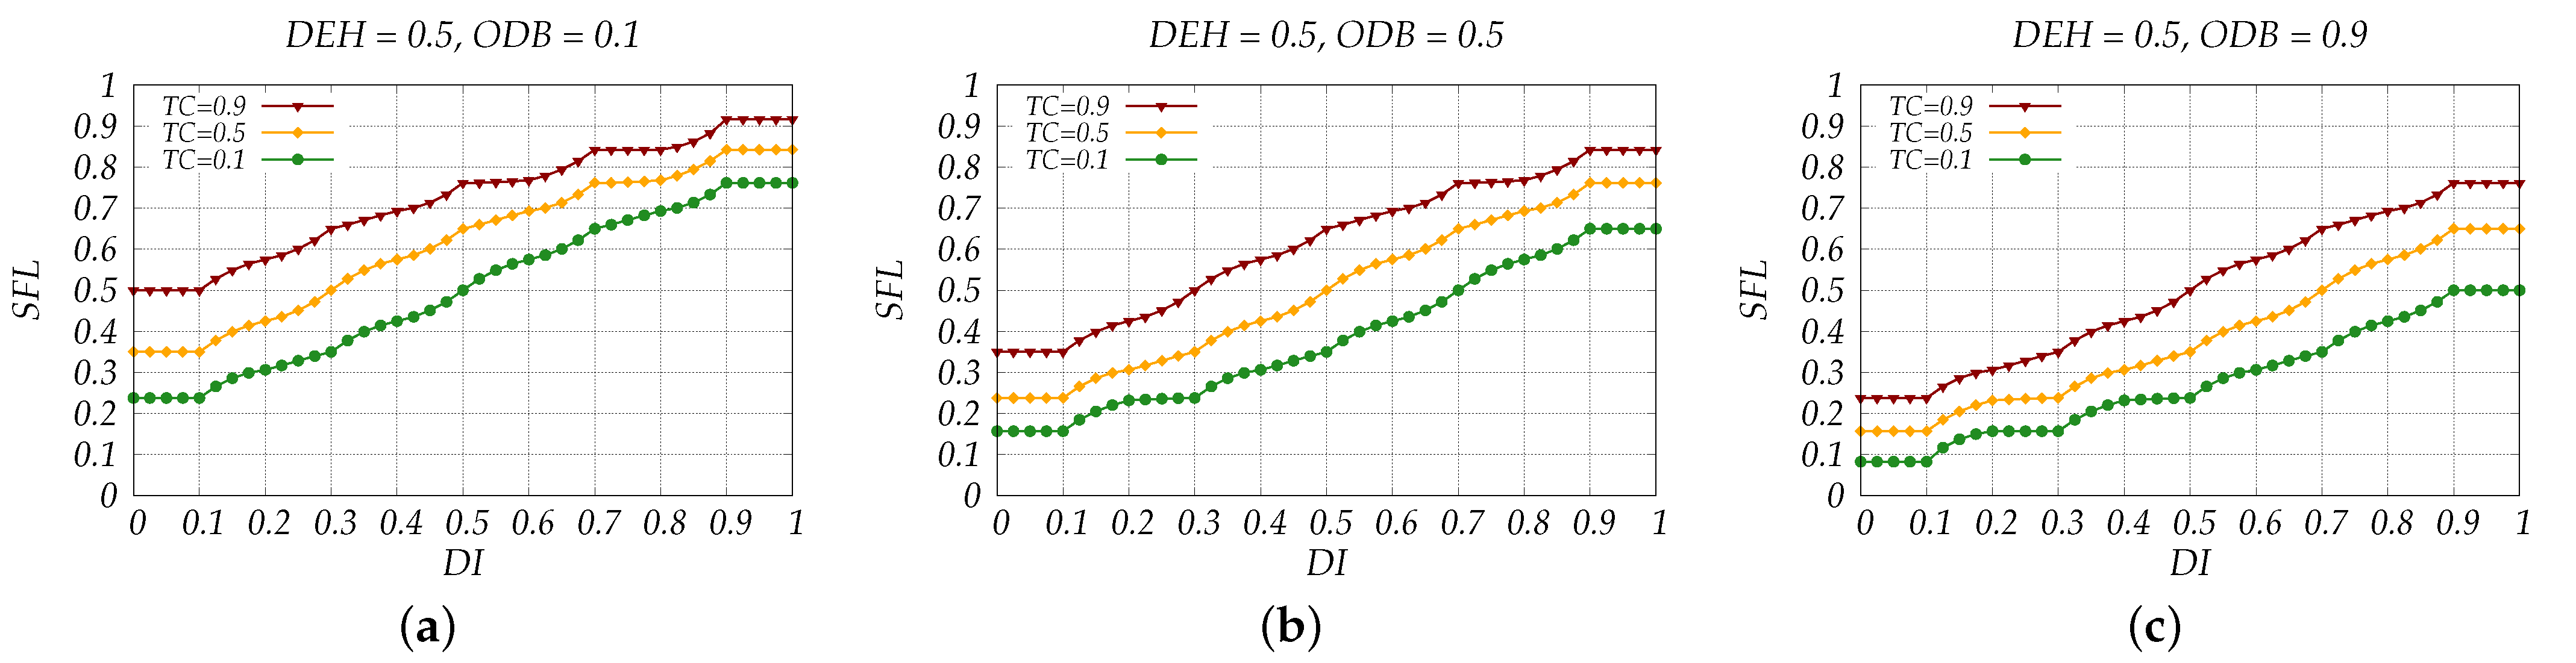
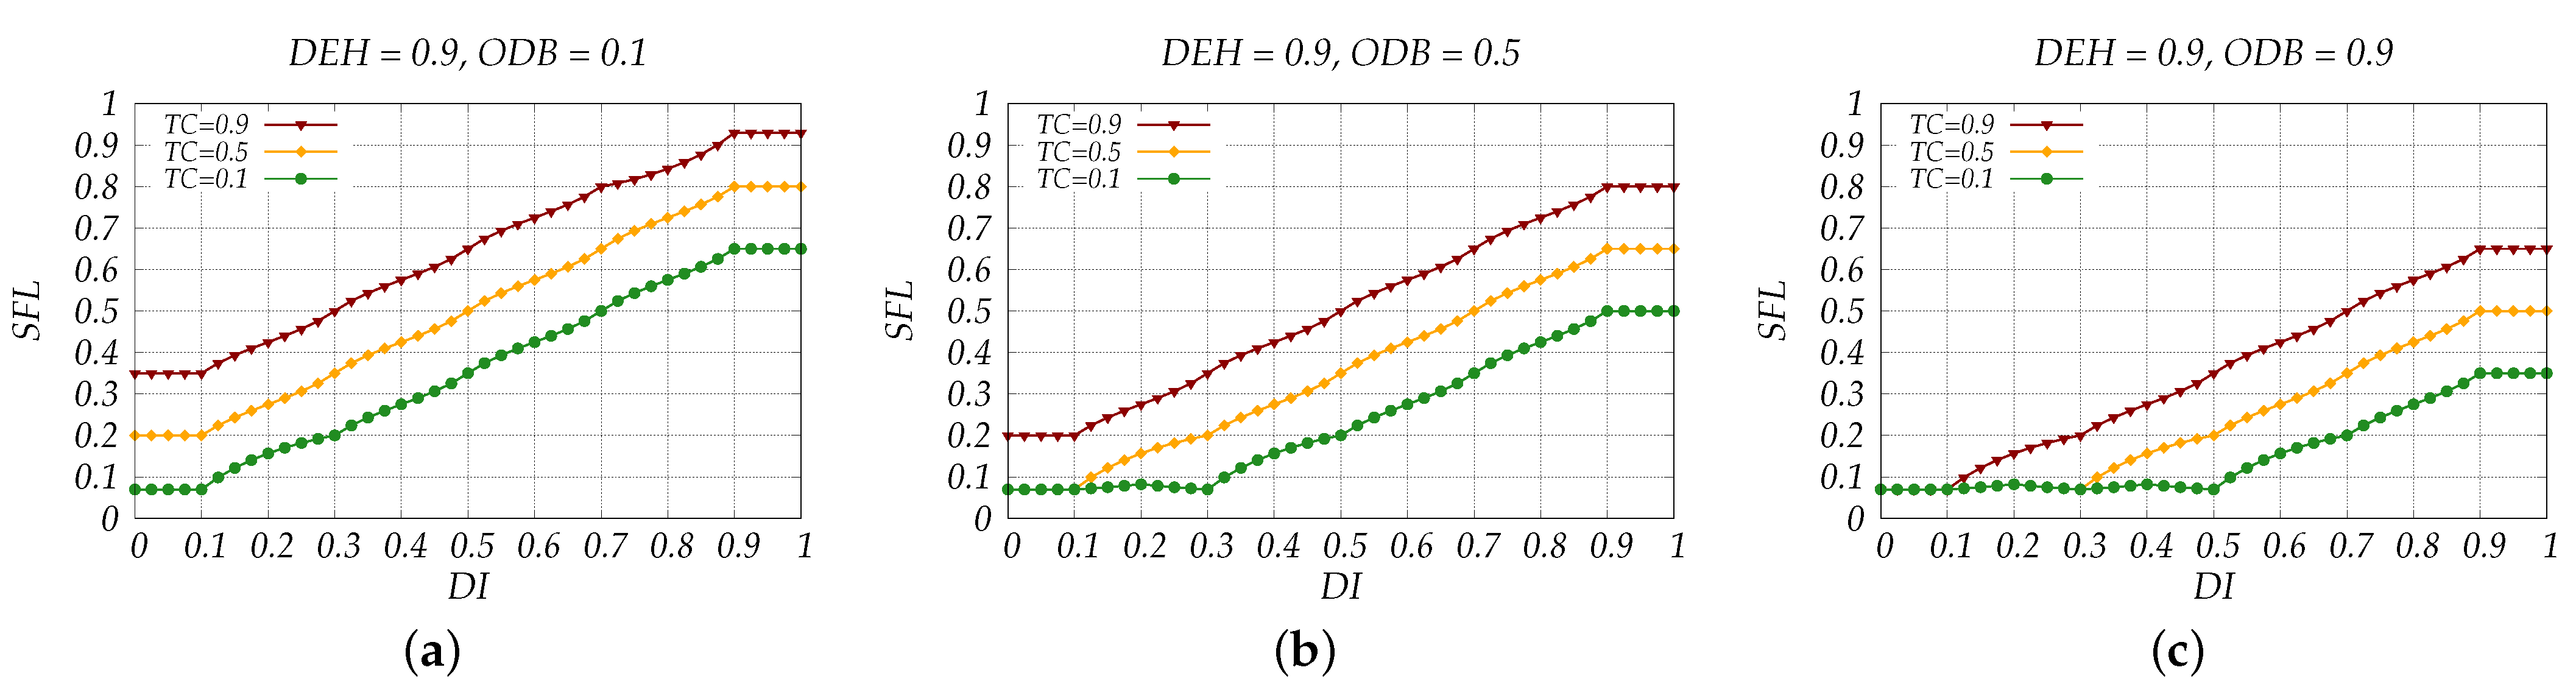
4. Simulation Results

In this section, we present the simulation results for the proposed system. The simulations are carried out using FuzzyC, a fuzzy simulation tool we have designed and implemented in C programming language. FuzzyC has accuracy and ease of use similar to MATLAB® Fuzzy Logic Toolbox™ [45] but higher computational efficiency. All the aspects of the simulation environment are summarized in Table 3.
The results are presented for each FLC separately as this way enables simpler interpretation of the effect that each input of IFSDDS has on the stress feeling level. Figure 5 shows the effect that UM, TP, and NFS have on DI, whereas Figure 6, Figure 7 and Figure 8 show the effect that DI and the rest of parameters have on SFL.
In the results presented in Figure 5, we show the relation between DI and NFS for different TP and UM values. We consider three scenarios for each of the latter parameters. Specifically, the values 0.1, 0.5, and 0.9 indicate low, medium, and high time pressure and few, moderate, and many unnecessary maneuvers for TP and UM, respectively.
We can see that when the driver makes only a few unnecessary maneuvers, most of the driving scenarios are not associated with high levels of impatience. The only few scenarios involving impatience are when the driver is under high time pressure and has to stop many times along the way. On the other hand, when the drivers make more unnecessary maneuvers, we can see an increased degree of impatience. In fact, for UM = 0.5, there is only one scenario where the driver is patient, whereas, for UM = 0.9, there is no such scenario. This situation even holds when the driver is not time-pressured and does not have to stop frequently.
A high degree of impatience is an indicator the driver is experiencing driving stress, but considering the effect of other factors alongside it decreases the margin of error in determining the level of stress the driver is truly feeling. For example, increased impatience during congestion or when other drivers violate traffic signs shows that the driver is under more stress. The DEH parameter also determines the stress level experienced during these driving episodes, and we explain these effects in the following scenarios.
In Figure 6, we show the results for DEH = 0.1 and change ODB from 0.1 to 0.9. We can see that when the behavior of other drivers is very bad, the drivers seem to handle the driving operation without high stress only when they are patient and when there is no traffic congestion. When traffic is heavy, we can see that the drivers experience much more stress, with most scenarios involving very high stress levels. This can be attributed to the fact that they are still inexperienced and yet with a history of accidents. On the other hand, when the behavior of other drivers is good, there are more driving situations handled with normal stress levels.
The impact of better driving experience and history can be seen in Figure 7 and Figure 8. Figure 7 shows the results for experienced drivers involved in accidents in the past and inexperienced drivers with no bad records. They experience less stress but still considerable values, with stress values above the moderate level accounting for most driving scenarios.
In the case of experienced drivers with no bad records (see Figure 8), we can see that drivers experience high stress only when they show high degrees of impatience while other drivers are violating traffic rules. All the other scenarios indicate that the drivers are not experiencing stress that can cause a potential accident.
During situations involving too much stress, the IFSDDS can trigger actions that can improve the driving situation and, thus, reduce the risk of an accident. For instance, the system can suggest the usage of an alternative route with less congestion; or it can adjust the car’s interior environment to the driver’s preferences in order to help the driver remain patient and handle the driving episodes safely.

5. Conclusions

In this paper, we proposed an approach for determining driver impatience and driver stress by leveraging the IoV infrastructure. The proposed approach consists of an integrated fuzzy-based system with two fuzzy logic controllers that determine the degree of impatience and stress considering different factors. For the determination of impatience, we used the unnecessary maneuvers performed by the driver, the time pressure felt while driving, and the number of times the driver has to stop on the way. The driver’s impatience is then used as input alongside other stress factors, such as the traffic condition, the behavior of other drivers, and the driving experience and history to determine the driving stress.
We showed through simulations the effect of the considered parameters on the determination of impatience and stress feeling levels. The simulations show that when drivers make many unnecessary maneuvers, they tend to show an increased degree of impatience, especially if they are under high time pressure or have to stop many times on the way to the destination. Regarding driver stress, when the traffic is heavier than usual, the experienced stress tends to be higher, especially if the drivers are still inexperienced or have bad driving records. In addition, the stress is even higher when other drivers violate the traffic rules. However, when experienced drivers have no bad driving records and are driving with much patience, they can operate the car smoothly in almost every driving situation.
In the future, we would like to make extensive simulations and experiments to evaluate the proposed system and compare the performance with existing systems. Moreover, we will implement IFSDDS in a testbed to determine its accuracy and look into false positives/negatives to further improve the system.

Author Contributions

Conceptualization, K.B. and E.Q.; methodology, K.B. and L.B.; software, K.B. and P.A.; validation, M.I., K.M. and L.B.; writing—original draft preparation, K.B. and E.Q.; visualization, E.Q.; supervision, L.B. All authors have read and agreed to the published version of the manuscript.

Funding

This research received no external funding.

Data Availability Statement

Not applicable.

Conflicts of Interest

The authors declare no conflict of interest.

Abbreviations

The following abbreviations are used in this manuscript:
AIArtificial Intelligence
DEHDriving Experience and History
DIDriver Impatience
FLFuzzy Logic
FLCFuzzy Logic Controller
FRBFuzzy Rule Base
IFSDDSIntegrated Fuzzy-based System for Determining Driver Stress
IoTInternet of Things
IoVInternet of Vehicles
ITSIntelligent Transportation Systems
NFSNumber of Forced Stops
ODBOther Drivers’ Behavior
RSURoadSide Unit
RSUCRoadSide Unit Controller
SFLStress Feeling Level
TCTraffic Condition
TPTime Pressure
UMUnnecessary Maneuvers
V2IVehicle-to-Infrastructure
V2NVehicle-to-Network
V2PVehicle-to-Pedestrian
V2VVehicle-to-Vehicle
V2XVehicle-to-Everything
WSNWireless Sensor Network

References

  1. World Health Organization. Global Status Report on Road Safety 2018: Summary; World Health Organization: Geneva, Switzerland, 2018; (WHO/NMH/NVI/18.20), Licence: CC BY-NC-SA 3.0 IGO). [Google Scholar]
  2. Dong, Y.; Hu, Z.; Uchimura, K.; Murayama, N. Driver Inattention Monitoring System for Intelligent Vehicles: A Review. IEEE Trans. Intell. Transp. Syst. 2011, 12, 596–614. [Google Scholar] [CrossRef]
  3. Seo, H.; Lee, K.D.; Yasukawa, S.; Peng, Y.; Sartori, P. LTE evolution for vehicle-to-everything services. IEEE Commun. Mag. 2016, 54, 22–28. [Google Scholar] [CrossRef]
  4. Karagiannis, G.; Altintas, O.; Ekici, E.; Heijenk, G.; Jarupan, B.; Lin, K.; Weil, T. Vehicular Networking: A Survey and Tutorial on Requirements, Architectures, Challenges, Standards and Solutions. IEEE Commun. Surv. Tutor. 2011, 13, 584–616. [Google Scholar] [CrossRef]
  5. Lottermann, C.; Botsov, M.; Fertl, P.; Müllner, R.; Araniti, G.; Campolo, C.; Condoluci, M.; Iera, A.; Molinaro, A. LTE for Vehicular Communications. In Vehicular ad hoc Networks: Standards, Solutions, and Research; Springer International Publishing: Cham, Switzerland, 2015; pp. 457–501. [Google Scholar] [CrossRef]
  6. Singh, S. Critical Reasons for Crashes Investigated in the National Motor Vehicle Crash Causation Survey. In Traffic Safety Facts: Crash Stats; Report No. DOT HS 812 506; National Highway Traffic Safety Administration (NHTSA): Washington, DC, USA, 2018. [Google Scholar]
  7. Rolison, J.J.; Regev, S.; Moutari, S.; Feeney, A. What are the factors that contribute to road accidents? An assessment of law enforcement views, ordinary drivers’ opinions, and road accident records. Accid. Anal. Prev. 2018, 115, 11–24. [Google Scholar] [CrossRef] [PubMed]
  8. Colagrande, S. A methodology for the characterization of urban road safety through accident data analysis. Transp. Res. Procedia 2022, 60, 504–511. [Google Scholar] [CrossRef]
  9. Wu, G.F.; Liu, F.J.; Dong, G.L. Analysis of the Influencing Factors of Road Environment in Road Traffic Accidents. In Proceedings of the 2020 4th Annual International Conference on Data Science and Business Analytics (ICDSBA), Changsha, China, 5–6 September 2020; pp. 83–85. [Google Scholar] [CrossRef]
  10. Bylykbashi, K.; Qafzezi, E.; Ampririt, P.; Ikeda, M.; Matsuo, K.; Barolli, L. A Fuzzy-Based System for Safe Driving in VANETs Considering Impact of Driver Impatience on Stress Feeling Level. In Advances in Internet, Data & Web Technologies; Barolli, L., Kulla, E., Ikeda, M., Eds.; Springer International Publishing: Cham, Switzerlan, 2022; pp. 236–244. [Google Scholar] [CrossRef]
  11. Lu, N.; Cheng, N.; Zhang, N.; Shen, X.; Mark, J.W. Connected Vehicles: Solutions and Challenges. IEEE Internet Things J. 2014, 1, 289–299. [Google Scholar] [CrossRef]
  12. Wang, Y.; Attebury, G.; Ramamurthy, B. A Survey of Security Issues in Wireless Sensor Networks. IEEE Commun. Surv. Tutor. 2006, 8, 2–23. [Google Scholar] [CrossRef] [Green Version]
  13. Dargie, W.; Poellabauer, C. Motivation for a Network of Wireless Sensor Nodes. In Fundamentals of Wireless Sensor Networks: Theory and Practice; John Wiley & Sons: Hoboken, NJ, USA, 2011; pp. 1–16. [Google Scholar] [CrossRef]
  14. Losilla, F.; Garcia-Sanchez, A.J.; Garcia-Sanchez, F.; Garcia-Haro, J.; Haas, Z.J. A comprehensive approach to WSN-based ITS applications: A survey. Sensors 2011, 11, 10220–10265. [Google Scholar] [CrossRef]
  15. Hartenstein, H.; Laberteaux, L. A Tutorial Survey on Vehicular Ad Hoc Networks. IEEE Commun. Mag. 2008, 46, 164–171. [Google Scholar] [CrossRef]
  16. Hartenstein, H.; Laberteaux, K. Introduction. In VANET Vehicular Applications and Inter-Networking Technologies; John Wiley & Sons: Hoboken, NJ, USA, 2010; pp. 1–19. [Google Scholar] [CrossRef]
  17. Jurgen, R. V2V/V2I Communications for Improved Road Safety and Efficiency; SAE International: Warrendale, PA, USA, 2012. [Google Scholar]
  18. Prayitno, A.; Nilkhamhang, I. V2V Network Topologies for Vehicle Platoons with Cooperative State Variable Feedback Control. In Proceedings of the 2021 Second International Symposium on Instrumentation, Control, Artificial Intelligence, and Robotics (ICA-SYMP), Bangkok, Thailand, 20–22 January 2021; pp. 1–4. [Google Scholar] [CrossRef]
  19. Lee, M.; Atkison, T. VANET applications: Past, present, and future. Veh. Commun. 2021, 28, 100310. [Google Scholar] [CrossRef]
  20. Bylykbashi, K.; Qafzezi, E.; Ikeda, M.; Matsuo, K.; Barolli, L. Fuzzy-based Driver Monitoring System (FDMS): Implementation of two intelligent FDMSs and a testbed for safe driving in VANETs. Future Gener. Comput. Syst. 2020, 105, 665–674. [Google Scholar] [CrossRef]
  21. Bylykbashi, K.; Qafzezi, E.; Ampririt, P.; Ikeda, M.; Matsuo, K.; Barolli, L. Performance Evaluation of an Integrated Fuzzy-Based Driving-Support System for Real-Time Risk Management in VANETs. Sensors 2020, 20, 6537. [Google Scholar] [CrossRef] [PubMed]
  22. Bylykbashi, K.; Qafzezi, E.; Ampririt, P.; Ikeda, M.; Matsuo, K.; Barolli, L. A Fuzzy-Based System for Determining Driver Stress in VANETs Considering Driving Experience and History. In Advanced Information Networking and Applications; Barolli, L., Hussain, F., Enokido, T., Eds.; Springer International Publishing: Cham, Switzerland, 2022; pp. 1–9. [Google Scholar] [CrossRef]
  23. Hill, J.D.; Boyle, L.N. Driver stress as influenced by driving maneuvers and roadway conditions. Transp. Res. Part F Traffic Psychol. Behav. 2007, 10, 177–186. [Google Scholar] [CrossRef]
  24. Naveteur, J.; Cœugnet, S.; Charron, C.; Dorn, L.; Anceaux, F. Impatience and time pressure: Subjective reactions of drivers in situations forcing them to stop their car in the road. Transp. Res. Part F Traffic Psychol. Behav. 2013, 18, 58–71. [Google Scholar] [CrossRef]
  25. Vhaduri, S.; Ali, A.; Sharmin, M.; Hovsepian, K.; Kumar, S. Estimating Drivers’ Stress from GPS Traces. In Proceedings of the AutomotiveUI ’14: 6th International Conference on Automotive User Interfaces and Interactive Vehicular Applications, Seattle, WA, USA, 17–19 September 2014; Association for Computing Machinery: New York, NY, USA, 2014; pp. 1–8. [Google Scholar] [CrossRef] [Green Version]
  26. Bylykbashi, K.; Qafzezi, E.; Ampririt, P.; Ikeda, M.; Matsuo, K.; Barolli, L. A Fuzzy-Based System for Deciding Driver Impatience in VANETs. In Advances on P2P, Parallel, Grid, Cloud and Internet Computing; Barolli, L., Ed.; Springer International Publishing: Cham, Switzerland, 2022; pp. 129–137. [Google Scholar] [CrossRef]
  27. Kaiser, S.; Furian, G.; Schlembach, C. Aggressive Behaviour in Road Traffic—Findings from Austria. Transp. Res. Procedia 2016, 14, 4384–4392. [Google Scholar] [CrossRef] [Green Version]
  28. Bitkina, O.V.; Kim, J.; Park, J.; Park, J.; Kim, H.K. Identifying Traffic Context Using Driving Stress: A Longitudinal Preliminary Case Study. Sensors 2019, 19, 2152. [Google Scholar] [CrossRef] [Green Version]
  29. Hennessy, D.A.; Wiesenthal, D.L. The relationship between traffic congestion, driver stress and direct versus indirect coping behaviours. Ergonomics 1997, 40, 348–361. [Google Scholar] [CrossRef]
  30. Antoun, M.; Ding, D.; Bohn-Goldbaum, E.E.; Michael, S.; Edwards, K.M. Driving in an urban environment, the stress response and effects of exercise. Ergonomics 2018, 61, 1273–1281. [Google Scholar] [CrossRef]
  31. Singh, R.R.; Conjeti, S.; Banerjee, R. Assessment of Driver Stress from Physiological Signals collected under Real-Time Semi-Urban Driving Scenarios. Int. J. Comput. Intell. Syst. 2014, 7, 909–923. [Google Scholar] [CrossRef] [Green Version]
  32. Clapp, J.D.; Olsen, S.A.; Danoff-Burg, S.; Hagewood, J.H.; Hickling, E.J.; Hwang, V.S.; Beck, J.G. Factors contributing to anxious driving behavior: The role of stress history and accident severity. J. Anxiety Disord. 2011, 25, 592–598. [Google Scholar] [CrossRef] [Green Version]
  33. Chung, E.K.; Park, S.Y.; Sohn, Y.W. Effects of Occupational Drivers’ Traffic Accident History on Risk Perception, Work Attitudes, and Unstable Driving. Transp. Res. Rec. 2021, 2675, 734–744. [Google Scholar] [CrossRef]
  34. Simon, F.; Corbett, C. Road traffic offending, stress, age, and accident history among male and female drivers. Ergonomics 1996, 39, 757–780. [Google Scholar] [CrossRef] [PubMed]
  35. Magaña, V.C.; Scherz, W.D.; Seepold, R.; Madrid, N.M.; Pañeda, X.G.; Garcia, R. The Effects of the Driver’s Mental State and Passenger Compartment Conditions on Driving Performance and Driving Stress. Sensors 2020, 20, 5274. [Google Scholar] [CrossRef] [PubMed]
  36. Ścigała, D.K.; Zdankiewicz-Ścigała, E. The Role in Road Traffic Accident and Anxiety as Moderators Attention Biases in Modified Emotional Stroop Test. Front. Psychol. 2019, 10, 1575. [Google Scholar] [CrossRef]
  37. Mayou, R.; Bryant, B. Consequences of road traffic accidents for different types of road user. Injury 2003, 34, 197–202. [Google Scholar] [CrossRef]
  38. Zhao, Y.; Yamamoto, T.; Kanamori, R. Study of older male drivers’ driving stress compared with that of young male drivers. J. Traffic Transp. Eng. (Engl. Ed.) 2020, 7, 467–481. [Google Scholar] [CrossRef]
  39. Kandel, A. Fuzzy Expert Systems; CRC Press: Boca Raton, FL, USA, 1991. [Google Scholar]
  40. Klir, G.J.; Folger, T.A. Fuzzy Sets, Uncertainty, and Information; Prentice Hall, Inc.: Upper Saddle River, NJ, USA, 1987. [Google Scholar]
  41. Munakata, T.; Jani, Y. Fuzzy Systems: An Overview. Commun. ACM 1994, 37, 69–77. [Google Scholar] [CrossRef]
  42. Zimmermann, H.J. Fuzzy Set Theory and Its Applications; Springer Science & Business Media: New York, NY, USA, 1996. [Google Scholar] [CrossRef]
  43. Zadeh, L.A.; Kacprzyk, J. Fuzzy Logic for the Management of Uncertainty; John Wiley & Sons, Inc.: New York, NY, USA, 1992. [Google Scholar]
  44. McNeill, F.M.; Thro, E. Fuzzy Logic: A Practical Approach; Academic Press: Cambridge, MA, USA, 1994. [Google Scholar]
  45. MathWorks. Fuzzy Logic Toolbox; MathWorks: Natick, MA, USA, 2019. [Google Scholar]
Figure 1. Concept of IFSDDS.
Vehicles 04 00032 g001
Figure 2. Illustration of a typical IoV Network.
Vehicles 04 00032 g002
Figure 3. Detailed diagram of IFSDDS.
Vehicles 04 00032 g003
Figure 4. Membership functions of IFSDDS. (a) Unnecessary Maneuvers, (b) Time Pressure, (c) Number of Forced Stops, (d) Driving Experience and History, (e) Other Drivers’ Behavior, (f) Traffic Condition, (g) Driver’s Impatience, and (h) Stress Feeling Level.
Vehicles 04 00032 g004
Figure 5. Simulation results showing the effect of UM, TP, and NFS on the determination of DI. (a) UM = 0.1, (b) UM = 0.5, (c) UM = 0.9.
Vehicles 04 00032 g005
Figure 6. Simulation results showing the effect of ODB, TC, and DI on the determination of driver stress when DEH = 0.1. (a) DEH = 0.1, ODB = 0.1, (b) DEH = 0.1, ODB = 0.5, (c) DEH = 0.1, ODB = 0.9.
Vehicles 04 00032 g006
Figure 7. Simulation results showing the effect of ODB, TC, and DI on the determination of driver stress when DEH = 0.5. (a) DEH = 0.5, ODB = 0.1, (b) DEH = 0.5, ODB = 0.5, (c) DEH = 0.5, ODB = 0.9.
Vehicles 04 00032 g007
Figure 8. Simulation results showing the effect of ODB, TC, and DI on the determination of driver stress when DEH = 0.9. (a) DEH = 0.9, ODB = 0.1, (b) DEH = 0.9, ODB = 0.5, (c) DEH = 0.9, ODB = 0.9.
Vehicles 04 00032 g008
Table 1. FRB of FLC1.
No.UMTPNFSDINo.UMTPNFSDINo.UMTPNFSDI
1FwLoFeLw10MrLoFeLw19MnLoFeMd
2FwLoMoLw11MrLoMoMd20MnLoMoHg
3FwLoMaMd12MrLoMaHg21MnLoMaVH
4FwMeFeLw13MrMeFeMd22MnMeFeHg
5FwMeMoMd14MrMeMoHg23MnMeMoVH
6FwMeMaHg15MrMeMaVH24MnMeMaEH
7FwHiFeMd16MrHiFeHg25MnHiFeVH
8FwHiMoHg17MrHiMoVH26MnHiMoEH
9FwHiMaVH18MrHiMaEH27MnHiMaEH
Table 2. FRB of FLC2.
No.DEHODBTCDISFLNo.DEHODBTCDISFLNo.DEHODBTCDISFL
1BVBLLwMdS31BGoLLwLwS61GBaLLwLwS
2BVBLMdMHS32BGoLMdLMS62GBaLMdLwS
3BVBLHgHgS33BGoLHgMdS63GBaLHgLMS
4BVBLVHVHS34BGoLVHMHS64GBaLVHMdS
5BVBLEHEHS35BGoLEHHgS65GBaLEHMHS
6BVBMLwMHS36BGoMLwLMS66GBaMLwLwS
7BVBMMdHgS37BGoMMdMdS67GBaMMdLMS
8BVBMHgVHS38BGoMHgMHS68GBaMHgMdS
9BVBMVHEHS39BGoMVHHgS69GBaMVHMHS
10BVBMEHEHS40BGoMEHVHS70GBaMEHHgS
11BVBHLwHgS41BGoHLwMdS71GBaHLwLMS
12BVBHMdVHS42BGoHMdMHS72GBaHMdMdS
13BVBHHgEHS43BGoHHgHgS73GBaHHgMHS
14BVBHVHEHS44BGoHVHVHS74GBaHVHHgS
15BVBHEHEHS45BGoHEHEHS75GBaHEHVHS
16BBaLLwLMS46GVBLLwLwS76GGoLLwLwS
17BBaLMdMdS47GVBLMdLMS77GGoLMdLwS
18BBaLHgMHS48GVBLHgMdS78GGoLHgLwS
19BBaLVHHgS49GVBLVHMHS79GGoLVHLMS
20BBaLEHVHS50GVBLEHHgS80GGoLEHMdS
21BBaMLwMdS51GVBMLwLMS81GGoMLwLwS
22BBaMMdMHS52GVBMMdMdS82GGoMMdLwS
23BBaMHgHgS53GVBMHgMHS83GGoMHgLMS
24BBaMVHVHS54GVBMVHHgS84GGoMVHMdS
25BBaMEHEHS55GVBMEHVHS85GGoMEHMHS
26BBaHLwMHS56GVBHLwMdS86GGoHLwLwS
27BBaHMdHgS57GVBHMdMHS87GGoHMdLMS
28BBaHHgVHS58GVBHHgHgS88GGoHHgMdS
29BBaHVHEHS59GVBHVHVHS89GGoHVHMHS
30BBaHEHEHS60GVBHEHEHS90GGoHEHHgS
Table 3. Testing environment.
SimulatorFuzzyC
HardwareASRock Z77 Extreme6
OSUbuntu 20.04.4 LTS
CPUIntel® Core™ i7-3770 CPU @ 3.40 GHz × 8
Memory16 GB
Publisher’s Note: MDPI stays neutral with regard to jurisdictional claims in published maps and institutional affiliations.

