Article

Relationship between Somatic Cell Score and Fat Plus Protein Yield in the First Three Lactations in Spanish Florida Goats

by
Rocío Jiménez-Granado
1,
Antonio Molina
2,
Manuel Sánchez Rodríguez
1,
Chiraz Ziadi
2,* and
Alberto Menéndez Buxadera
2
1
Departamento de Produccion Animal, Universidad de Cordoba, Campus de Rabanales, Ctra, Madrid–Cadiz, km 396, 14071 Cordoba, Spain
2
Departamento de Genetica, Universidad de Cordoba, Campus de Rabanales, Ctra, Madrid–Cadiz, km 396, 14071 Cordoba, Spain
*
Author to whom correspondence should be addressed.
Dairy 2024, 5(1), 1-12; https://doi.org/10.3390/dairy5010001
Submission received: 2 November 2023 / Revised: 7 December 2023 / Accepted: 12 December 2023 / Published: 21 December 2023
(This article belongs to the Section Dairy Animal Health)

Abstract

:
The aim of this study was to estimate genetic parameters of somatic cell score (SCS) and fat plus protein yield (FPY) using repeatability (RM) and random regression (RRM) models in Florida goats. The data consisted of 340,654 test-day controls of the first three lactations, and the pedigree contained 36,144 animals. Covariance components were estimated with a bivariate RM and RRM using the REML approach. Both models included as fixed effects the combination of herd and control date, litter size, kidding number and lactation length, and as random effects, the additive genetic and permanent environmental effects. A variation in the shape of the genetic parameters along the lactation curve was observed for both traits, and h2 oscillated between 0.272 and 0.279 for SCS and 0.099 and 0.138 for FPY. The genetic correlation between SCS and FPY was negative and medium (−0.304 to −0.477), indicating that a low-SCS EBV is associated with a genetic predisposition to high FPY production. Our results showed that given the magnitude of h2 for SCS and its rg with FPY, the SCS could be used as a selection criterion to increase resistance to mastitis, thus obtaining an improved dairy and cheese aptitude in this breed.

1. Introduction

According to Miller and Lu [1], the goat dairy industry is increasing its activity worldwide. This trend is due not only to the nutritional value of goat milk [2] but also to the additional attributes of its consumption behavior and habits, which give this species an essential role in maintaining the environment of the region where it is farmed by decreasing the risk of soil deterioration, reducing the possibility of fires and keeping many marginal areas of Europe productive [3]. On the other hand, increases of over 7% in the demand for goat milk for the cosmetics industry are predicted up to 2025 [4], which means that the prospects for goat farming are secure.
At the European level, Spain is the second largest producer of goat milk [5], with the Andalusia region being where the largest number of goats are concentrated and where around 40% of the milk of this species is produced, mostly for the manufacture of different types of cheese. Among the indigenous goat breeds in this country, the Florida breed is the one with the greatest productive potential, and it has been subjected to an improvement program for over 20 years, with highly satisfactory results [6]. A recent publication indicates that cumulative milk production in the period up to 240 days of lactation in the Florida breed has increased at a rate of 1.7% per year. However, this may, as a collateral effect, have increased potential infection problems, which is reflected in aspects such as somatic cell count (SCC), due to the constant interaction between the udder and the milking equipment [7]. Although a certain level of SCC may be tolerated as an indicator of resistance to infection, immunity and health, it may also represent risks to product quality and could result in economic losses.
High SCC or total bacterial count (TBC) represents a significant problem in the dairy industry, leading to important economic losses, not to mention the hygienic and legal consequences or the major impact it has on food safety and public health [8]. One of the factors leading to an increase in these parameters in milk is subclinical mastitis (SCM).
Bulk milk bacterial cells can enter from the environment during milking or from bacterial growth because of insufficient cleaning and sanitation of the system, but in some cases, they can also enter from the goat’s mammary gland. Therefore, the TBC of bulk milk can sometimes be used to monitor the level of mastitis on a farm [9]. Indeed, the identification of risk factors for high SCC is of great importance in regions where SCC regulations are already applied in the goat industry, as well as in regions undergoing changes towards the implementation of programs and regulations for goat milk quality. However, there is limited information currently available about the on-farm risk factors associated with SCC levels in goat bulk milk [10,11].
The Florida is a native Spanish breed of dairy goat distributed mostly in the center and south of Spain, raised under a wide variety of systems of production, ranging from semi-extensive to semi-intensive systems [12]. The main selection criterion in the breeding program of this breed is the fat plus protein yield per lactation [13].
In this breed, Jiménez-Granado et al. [7] showed how the levels of this parameter have increased alarmingly over the last decade, which is consistent with the levels of mastitis perceived by the farmer. It is therefore considered necessary to establish a plan to control and prevent mastitis, which combines sanitary and management measures with the search for greater resistance to this disease. Since the year 2004, the collection of records on SCC in goat milk has become mandatory throughout the EU. So, with the availability of this information and the well-known relationship between mastitis and SCC, the genetic study of this variable has become possible, with the aim of improving resistance to mastitis. In fact, there is already evidence of positive results of a breeding program to decrease the level of SCC [14,15], with low genetic relationships with milk production and its components. In order to determine the optimal strategy that takes into account not only somatic cell levels but also their interrelationships with the other selection criteria, it is essential to estimate the genetic relationship between this parameter and the main selection criteria in the breed.
Accordingly, the aim of this study was to estimate genetic parameters of somatic cell score (SCS) and fat plus protein yield across lactations and kidding number, using repeatability and random regression models.

2. Materials and Methods

2.1. Phenotypic Data and Pedigree

For this study, a total of 1,031,143 test-day (TD) records collected between 2005 and 2019 were accessed from the National Association of Florida Goat Breeders (ACRIFLOR). These TD records belonged to 90 herds and included a total of 58,606 females, bred on farms in the regions of Andalusia and Extremadura, which share similar climatic conditions, with an average temperature of 16.38 °C (between 14 °C and 24 °C) and an average relative humidity of 65.7% (between 37% and 78%; see supplementary materials Map S1). All the data were subjected to a data-editing process, and all lactations longer than 305 days, parity numbers greater than 6 and records with somatic cell count (SCC) outside the usual range (<40 × 103 to >10,000 × 103) were excluded. In the end, we used for the variance component analysis a total of 340,654 TDs recorded in the first 43 weeks of lactation of the first three kiddings from January 2006 to November 2019, from 27,479 daughters of 941 sires and 16,243 dams, of which 8788 were in the data vector. The pedigree contained all the known ancestors of the phenotyped animals, with a total of 36,144 animals. The variables analyzed were SCC transformed into SCS = log2 (SCC) + 3 [16] and the total daily amount of fat plus protein (FPY) expressed in grams.

2.2. Statistical Analysis

The traits studied were recorded over a fixed time scale (over the first three lactations), so their statistical processing was applied in stages. First, SCS and FPY were analyzed using a linear fixed effects model in order to obtain initial information on the causes of variation and also to be able to represent the forms of responses of both dependent variables at each kidding along the lactation trajectory. In this analysis, we considered the fixed effects of a combination of herd and control date (HCDi 8618 levels), litter size (LSj 4 levels), kidding number (NPk 3 classes) and lactation length expressed in weeks (DIMwl 43 weeks).
In the initial analysis, the (co)variance components were studied using bivariate models, according to a repeatability model (RM), which assumed no variation across lactation, and each dependent variable was expressed as an average for each kidding, as follows:
y 1 y 2 = X 1 0 0 X 2 b 1 b 2 + Z 1 0 0 Z 2 μ 1 μ 2 + W 1 W 2 p 1 p 2 + e 1 e 2
where y1 and y2 represent the phenotypic values for SCS and FPY, respectively. The elements bi represent the same fixed effects mentioned previously; µi are the vectors for the additive genetic random effect and pi is the permanent environmental random effect due to repetitions of the same observations in the animal. The matrices Xi, Zi and Wi are incidence matrices connecting the fixed and random effects to the vector of dependent variables. Finally, ei represents the random vector of the error.
Subsequently, a second analysis was performed with a random regression model (RRM) analyzing the variables SCS and FPY recorded in each TD throughout lactation (DIMwI). The representation of this model was similar to the RM, but in the RRM, the elements of a Legendre polynomial of order r were included as covariates. (Φr) of order r, as a fixed covariate in Xi and a random covariate in Zi, was included to estimate the evolution of the (co)variance components between both dependent variables along the lactation trajectory expressed as DIMwi.
Both models were run for each of the first three lactations and the total number of lactations, using the statistical program Asreml 3 [17]. The expected (co)variance components for the RM were:
E μ 1 μ 2 p 1 p 2 e 1 e 2   = 0 , var   μ 1 μ 2 p 1 p 2 e 1 e 2 = A σ μ 1 2 A σ μ 21 0 0 0 0     A σ μ 12 A σ μ 2 2 0 0 0 0     0 0 I W σ p 1 2 0 0 0   0 0 0 I W σ p 2 2 0 0   0 0 0 0 I n σ e 1 2 0   0 0 0 0 0 I n σ e 2 2
where the elements σ μ 1 2 ; σ p i 2 and σ e i 2 stand for the genetic, permanent environment and residual variances for lscc (X1 ) and fpy (X2), respectively, σ μ 12 is their covariance, IW and ln are identity matrices and A is the denominator of the kinship relationship. The genetic heritability parameters (h2xi) and the genetic correlations between both dependent variables (rg12) were estimated according to classical formulas [18].
Unlike the RM, in RRM, the genetic (co)variance components for both dependent variables were not considered to be the same for each point on the lactation scale, which means that there will be parameters of h2xi; rg12 and EGVi for each ith point of DIMwi. Traits which are expressed longitudinally require an additional procedure presented by Jamrozik and Schaeffer [19], although basically the structure of expected (co)variances and estimates was similar:
E α 1 α 2 p 1 p 2 e 1 e 2   = 0 , var   α 1 α 2 p 1 p 2 e 1 e 2 = A C α 1 A C α 21 0 0 0 0     A C α 12 A C α 2 0 0 0 0     0 0 I W σ p α 1 2 0 0 0   0 0 0 I W σ p α 2 2 0 0   0 0 0 0 I n σ e α 1 2 0   0 0 0 0 0 I n σ e α 2 2
In this representation, I only changes the point expression of µi by α i , which is a linear function for SCS and FPY throughout the lactation expressed in terms of a Legendre polynomial ( Φ d ) . The term is a symbol of the Kronecker operator and C α   is a matrix containing the eigen elements of the polynomial used, while the rest of the terms are the same as previously presented. The matrix C α   t has a complex structure consisting of four square submatrices C α = c α 1 c α 12 c α 21 c α 2 , with, on the diagonal ( c α 1 and c α 2 ), the genetic (co)variance components for each trait, with the elements corresponding to a polynomial of order r = 2, which best fits the data, and, outside the diagonal ( c α 12 = c α 21 ), the covariances between all the terms of each variable. The structure of each of these submatrices was:
C α i = Φ d σ i α 2 σ i s α σ i q α σ s i α σ s α 2 σ s q α σ q i α σ s s α σ q α 2 Φ d
in which σ i α 2 ;   σ s α 2 and σ q α 2   are the variances of the intercept, slope and quadratic term, respectively ,   while σ i s α ;   σ i q α and σ s q α are the corresponding covariances of the elements of the Legendre polynomial Φ d . This longitudinal procedure is more complex but offers multiple advantages, as shown below.
With the results of C α i   and the coefficients of Φ d , the heritability values ( h α i 2 ) and the genetic correlations ( r g α ), both within and between both dependent variables at each point of the dimw scale including Φ d , were calculated as follows:
For   h α i 2 = Φ d i   C α i   Φ d i   Φ d i   C α i   Φ d i + σ p α i 2 + σ e α i 2 ,   the   same   formula   was   used   for   i   =   SCS   and   FPY .
The intrapartum genetic correlations used for each variable throughout lactation were:
r g α = Φ d i   C α i   Φ d j   Φ d i   C α i   Φ d i   Φ d i   C α i   Φ d j  
while the intrakidding genetic correlations for each pair of variables throughout lactation were:
r g α 12 = Φ d i   C α 12   Φ d j   Φ d i   C α 1   Φ d i   Φ d i   C α 2   Φ d j  
Finally, the expected genetic values for SCS and FPY ( E G V X i ) were estimated by direct solution in the RM, while RRM at each of the three births and the total at any point along the DIMw trajectory were estimated by:
E G V X i = r = 0 2 Φ d i α i
where α i is the solution of the RRM corresponding to animal i and consists of the corresponding elements of the Legendre polynomial ( Φ ) of order 2, in this case a quadratic equation. By manipulating the terms of Φ , the EGV for cumulative production up to any point in the lactation can be estimated. The procedure was similar for both variables.

3. Results

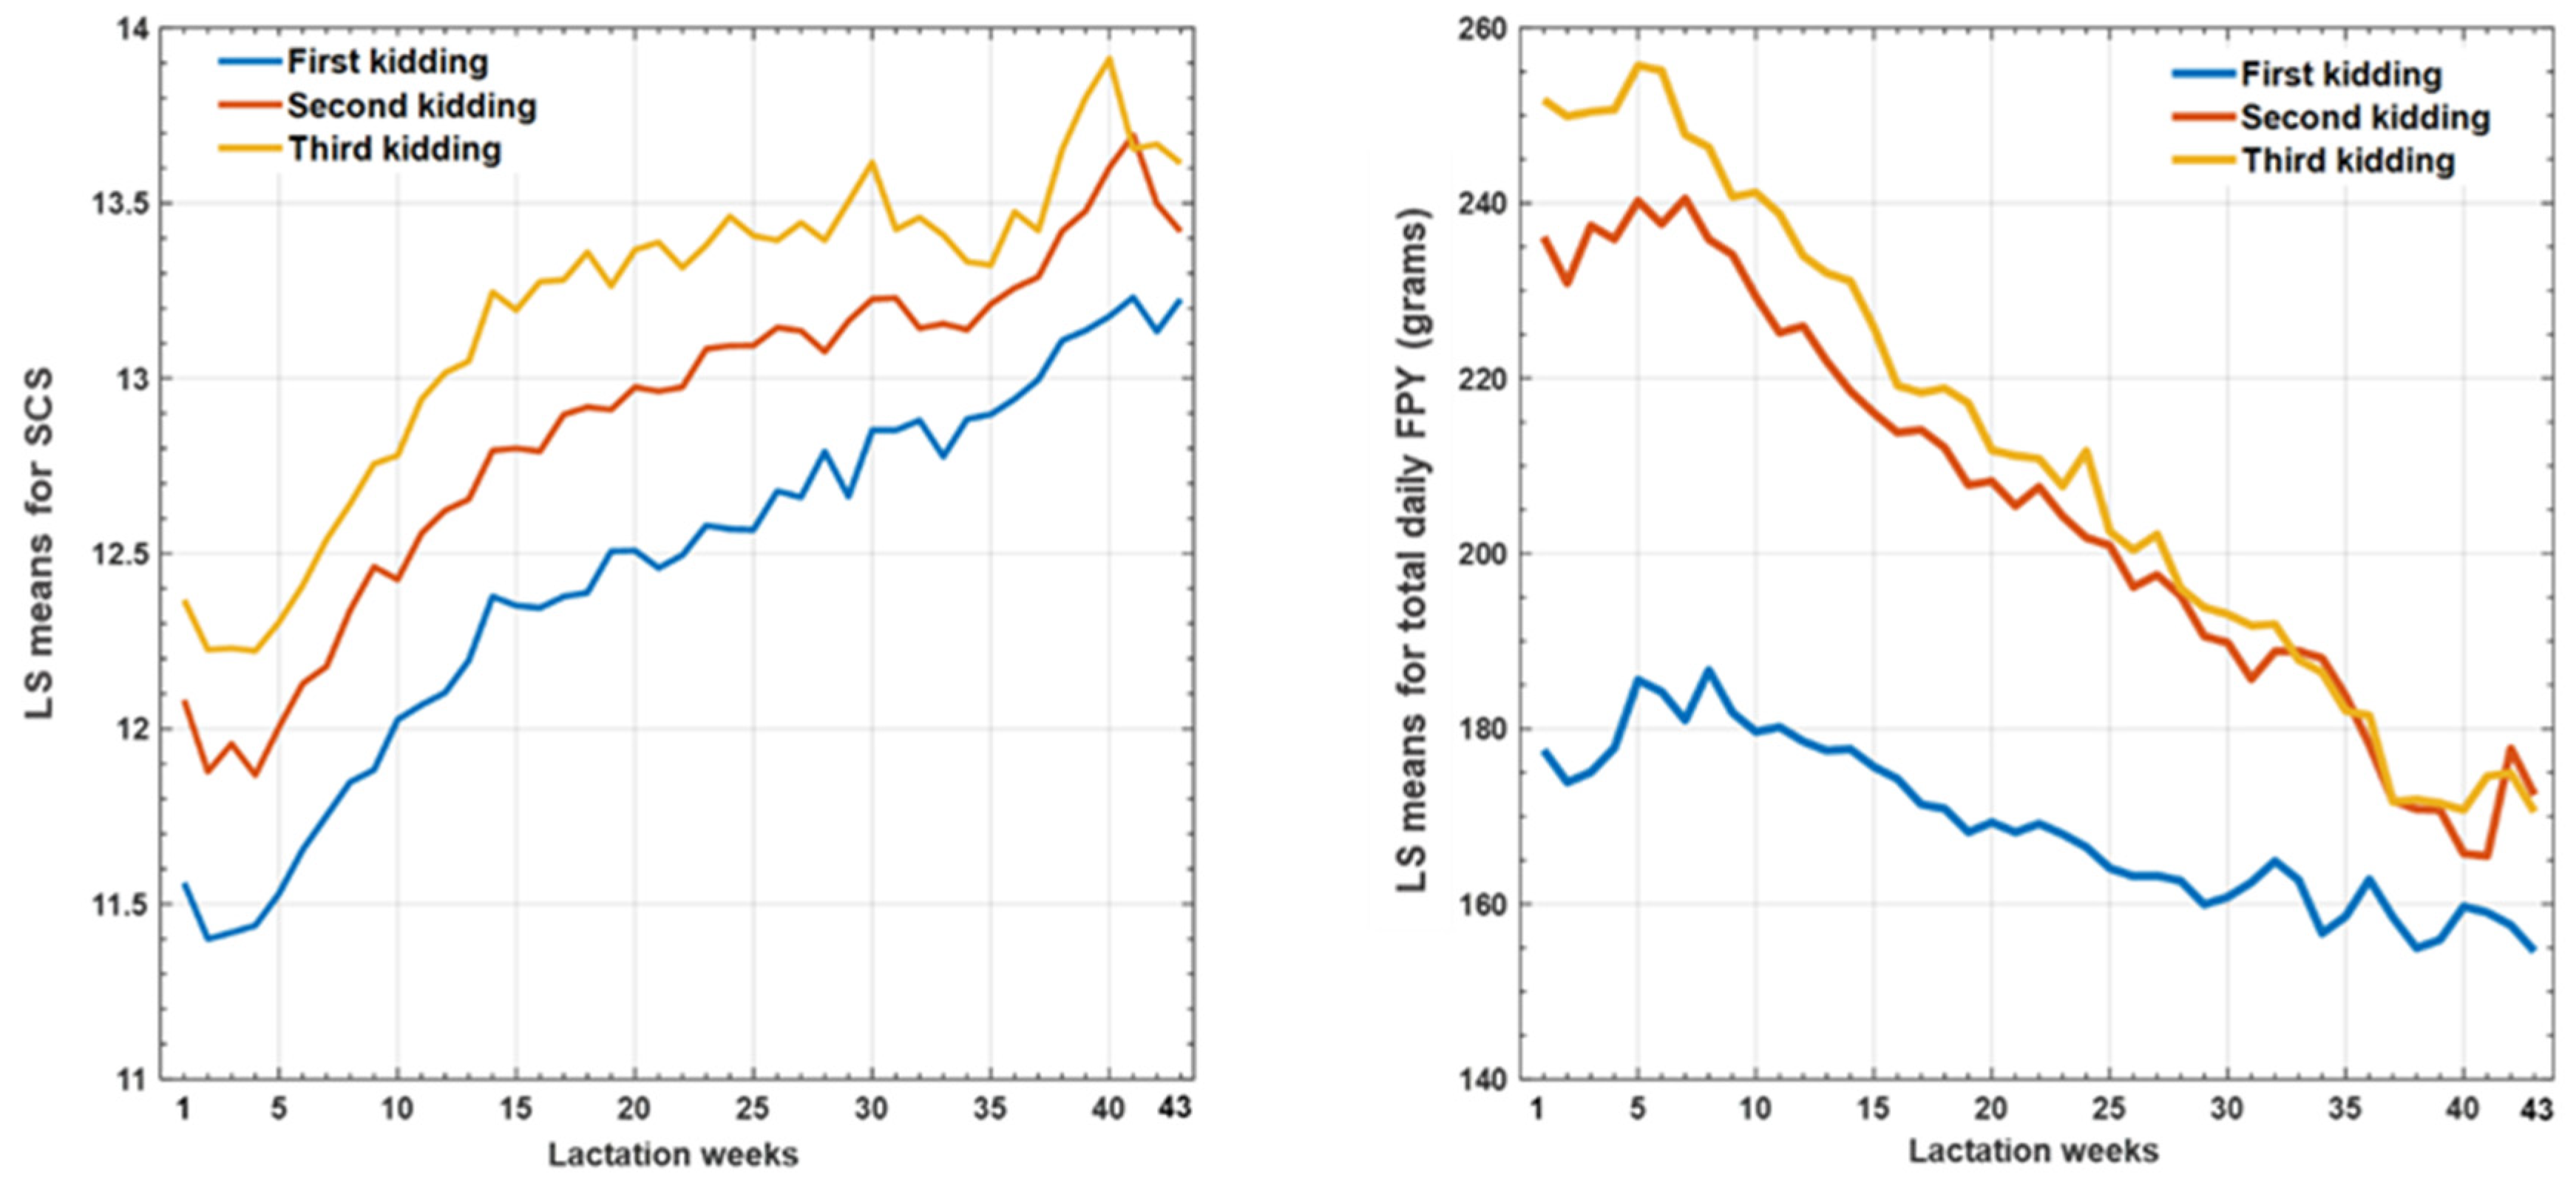
3.1. Phenotypic Parameters

Table 1 gives an overview of the database used. As can be seen, we followed the performance of 27,749 does, with an average number of 12 TD and 2.06 lactations per animal. These were daughters of 16,243 goats and 941 sires.
The results of the preliminary fixed effects model determined that all effects included in the model using both dependent variables were highly significant. Figure 1 shows the main phenotypic trends for FPY and SCS throughout lactation length and kidding number.
For both variables, there was a clear tendency to increase their level as the number of lactations increased, although this was more marked between the first and the other lactations for FPY. If the different lactations are compared, similar behavior can be observed in the three lactations for the SCC, so that as the lactation progresses, the SCC increases. The number of somatic cells increased rapidly until week 15, with a few weeks of delay compared to the productive peak of FPY. After that, it continued to grow more slowly until reaching the maximum peak at the end of lactation at almost week 40 (approx. 10 months in lactation). In the case of FPY, there was an inverse, similar trend in all three lactations, but with a clearly lower magnitude in the case of the first lactation. This difference was probably due to the fact that the first kidding usually takes place when physical development is not yet complete (the animal has not yet reached adult size), so that during the first lactation, many nutrients still have to be used for the animal’s growth as well as for milk production.

3.2. Genetic Parameters

3.2.1. Repeatability Model

The estimated results obtained according to this model are presented in Table 2. The variation between lactations of the variance components can be observed, for the first three lactations analyzed, both for the SCS trait and the FPY. Thus, heritability ranged between 0.272 and 0.279 for the SCS trait and between 0.099 and 0.138 for FPY.
Table 3 presents the genetic correlations between the EGVs for each kidding for each variable and between both variables within each lactation. When using the RM, the correlations between the EGVs for each variable in the three lactations showed a positive pattern of relationships within each variable. The EGVXi of each variable in the three kiddings also showed a pattern of positive relationships within the variable but of moderate magnitude, while there was a slight antagonism between SCS and FPY (ranging from −0.307 for the first kidding to −0.592 for the third one).
This correlation showed that animals with a higher predisposition to present mastitis (higher genetic values for SCS) have a lower potential for milk production (FPY, in our case). It therefore follows that genetic selection for higher resistance to mastitis should result in a better response for milk production.

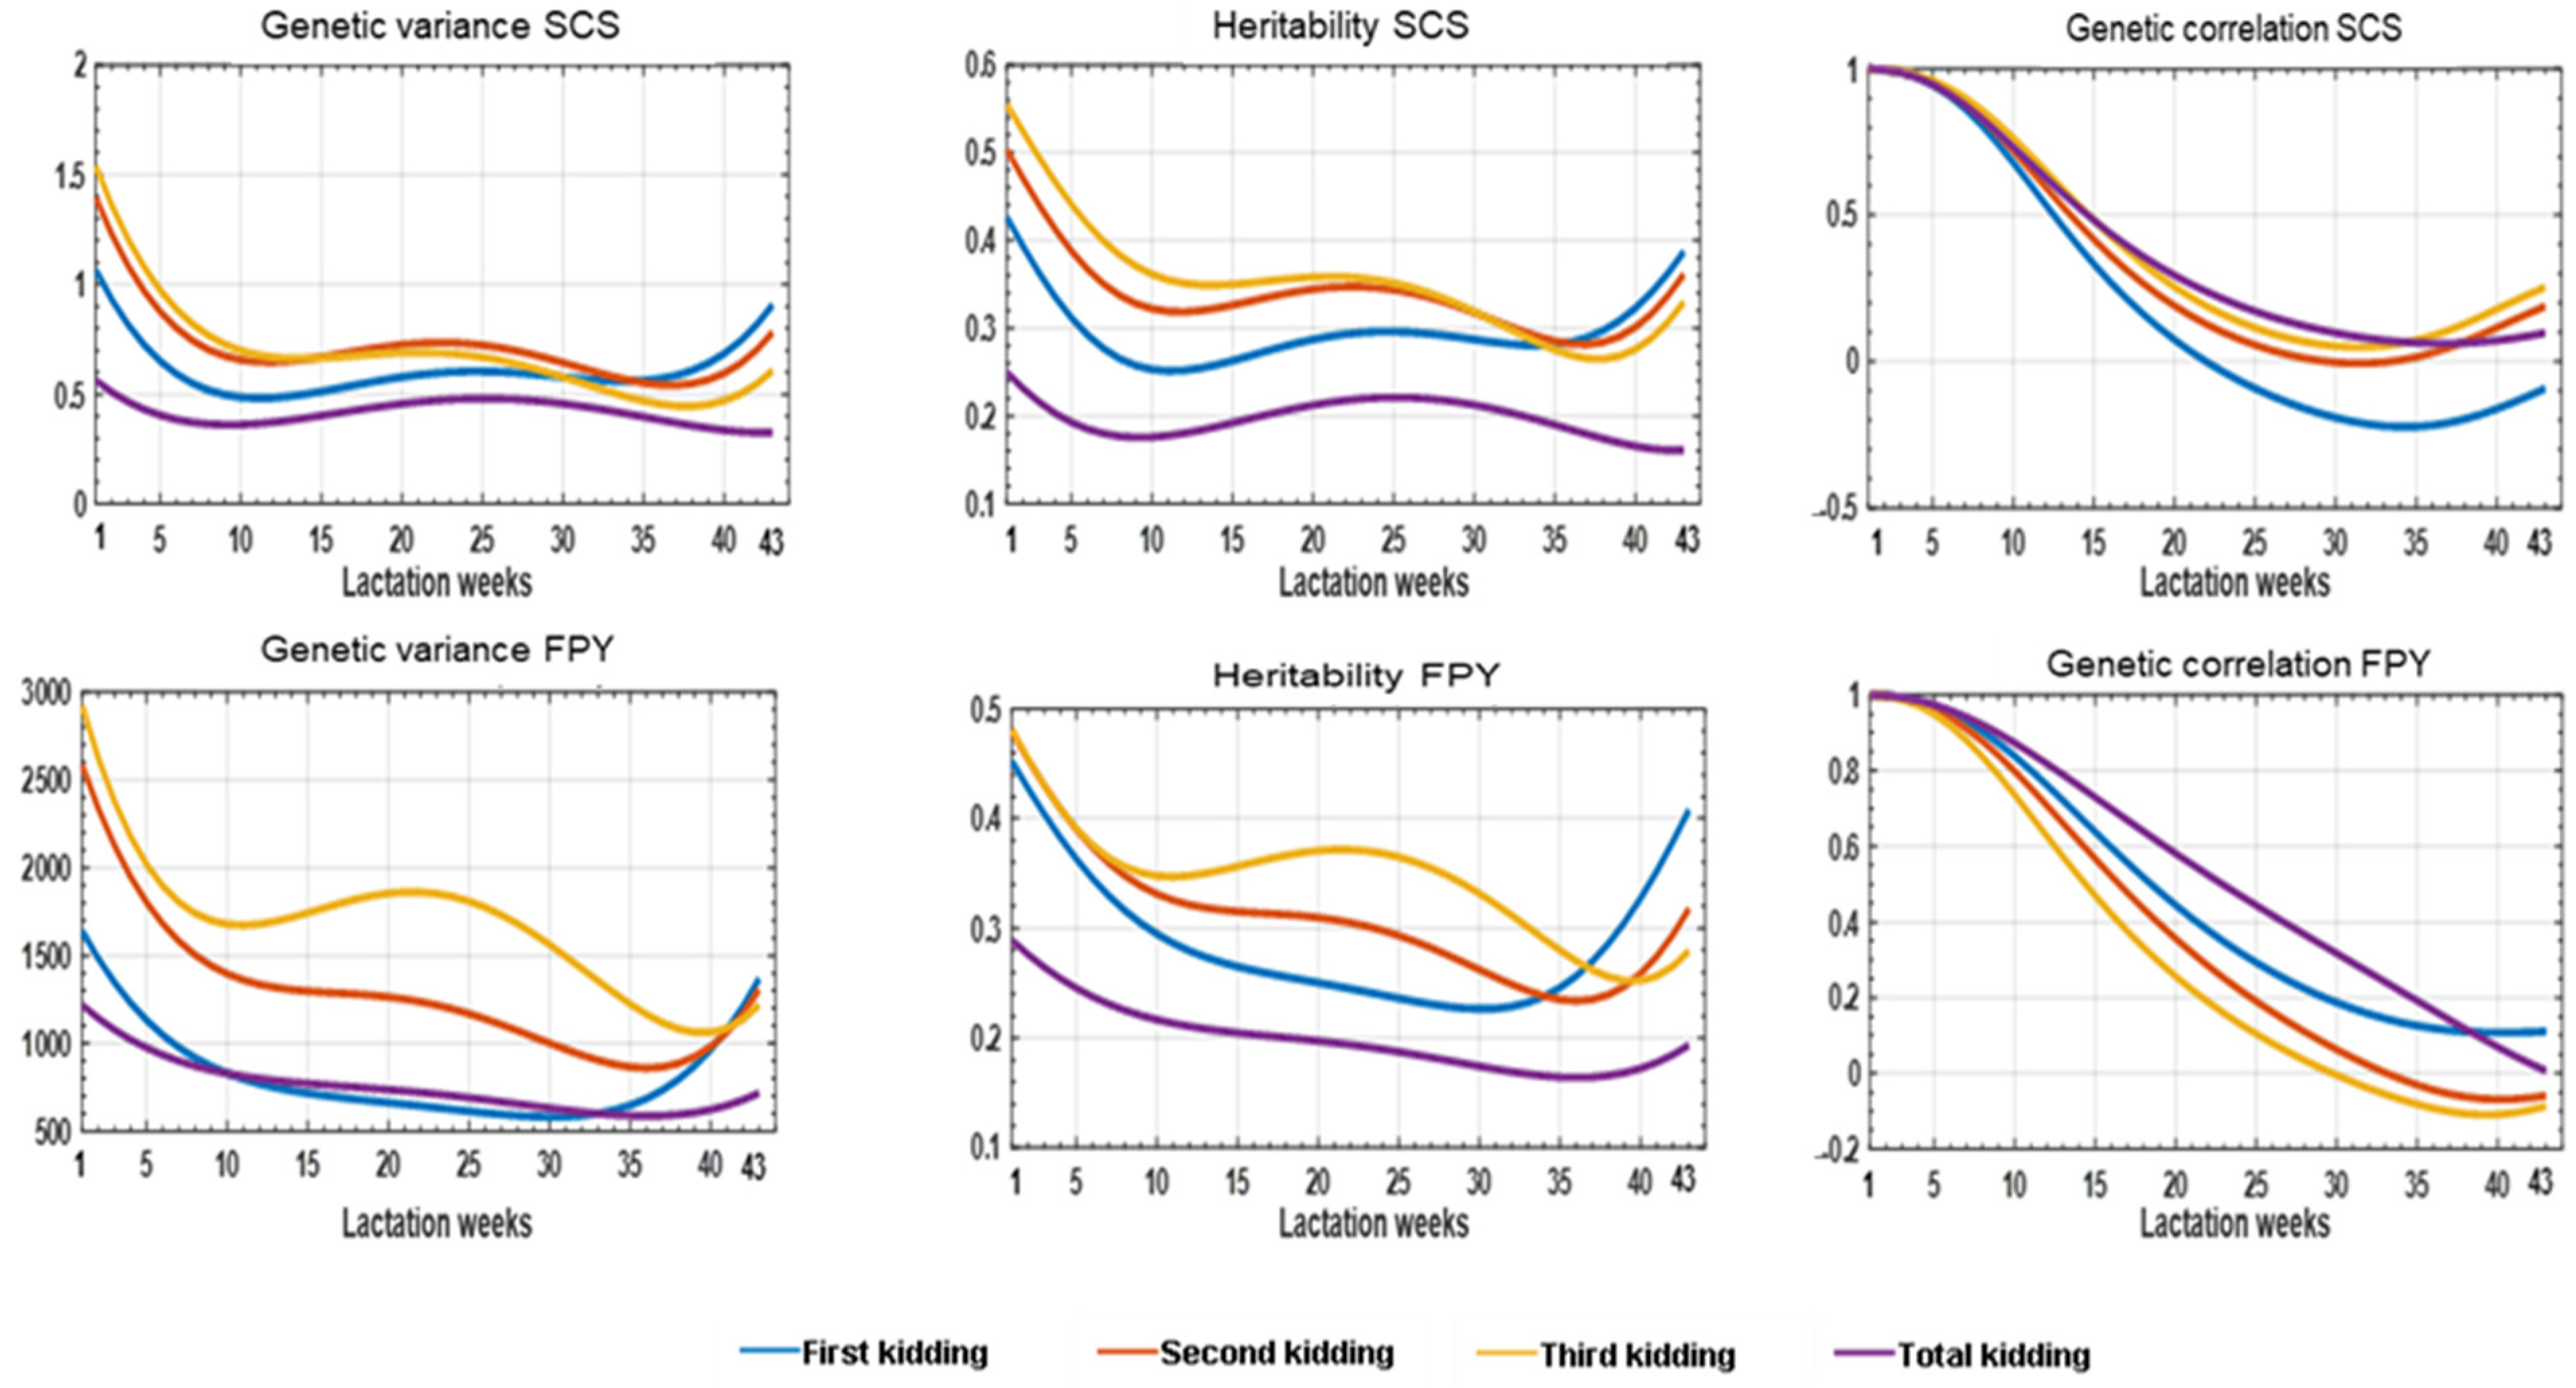
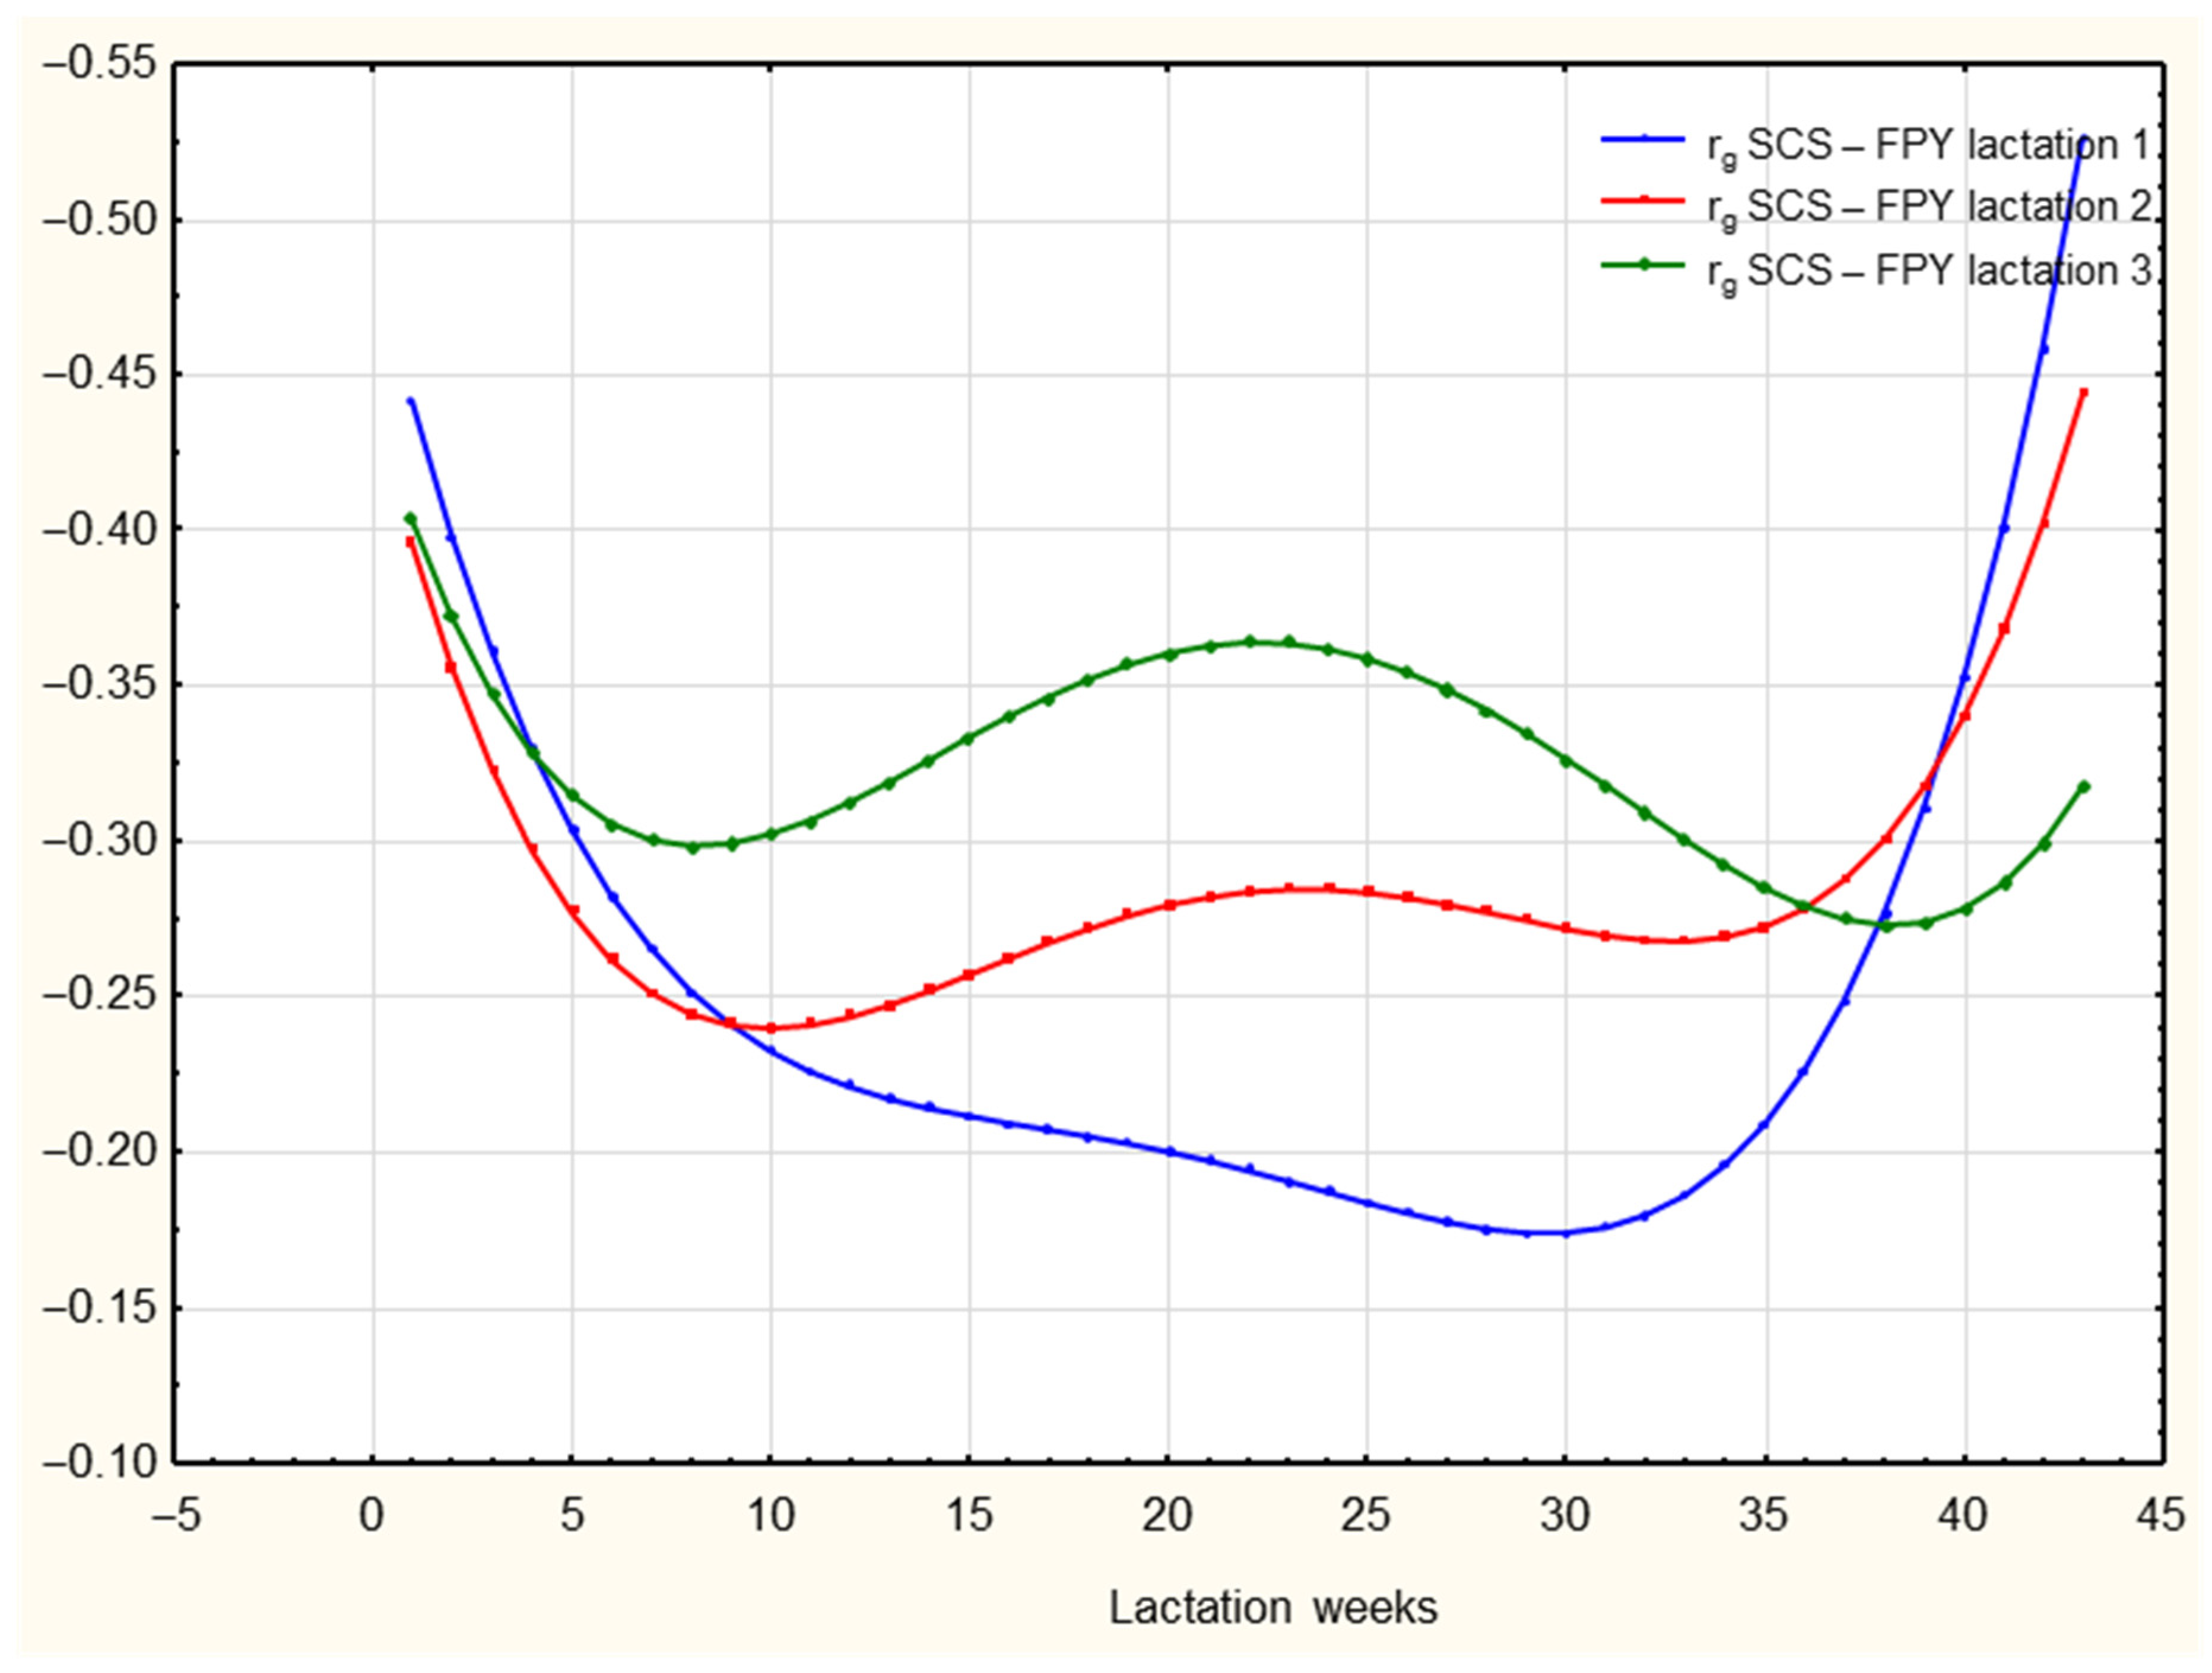
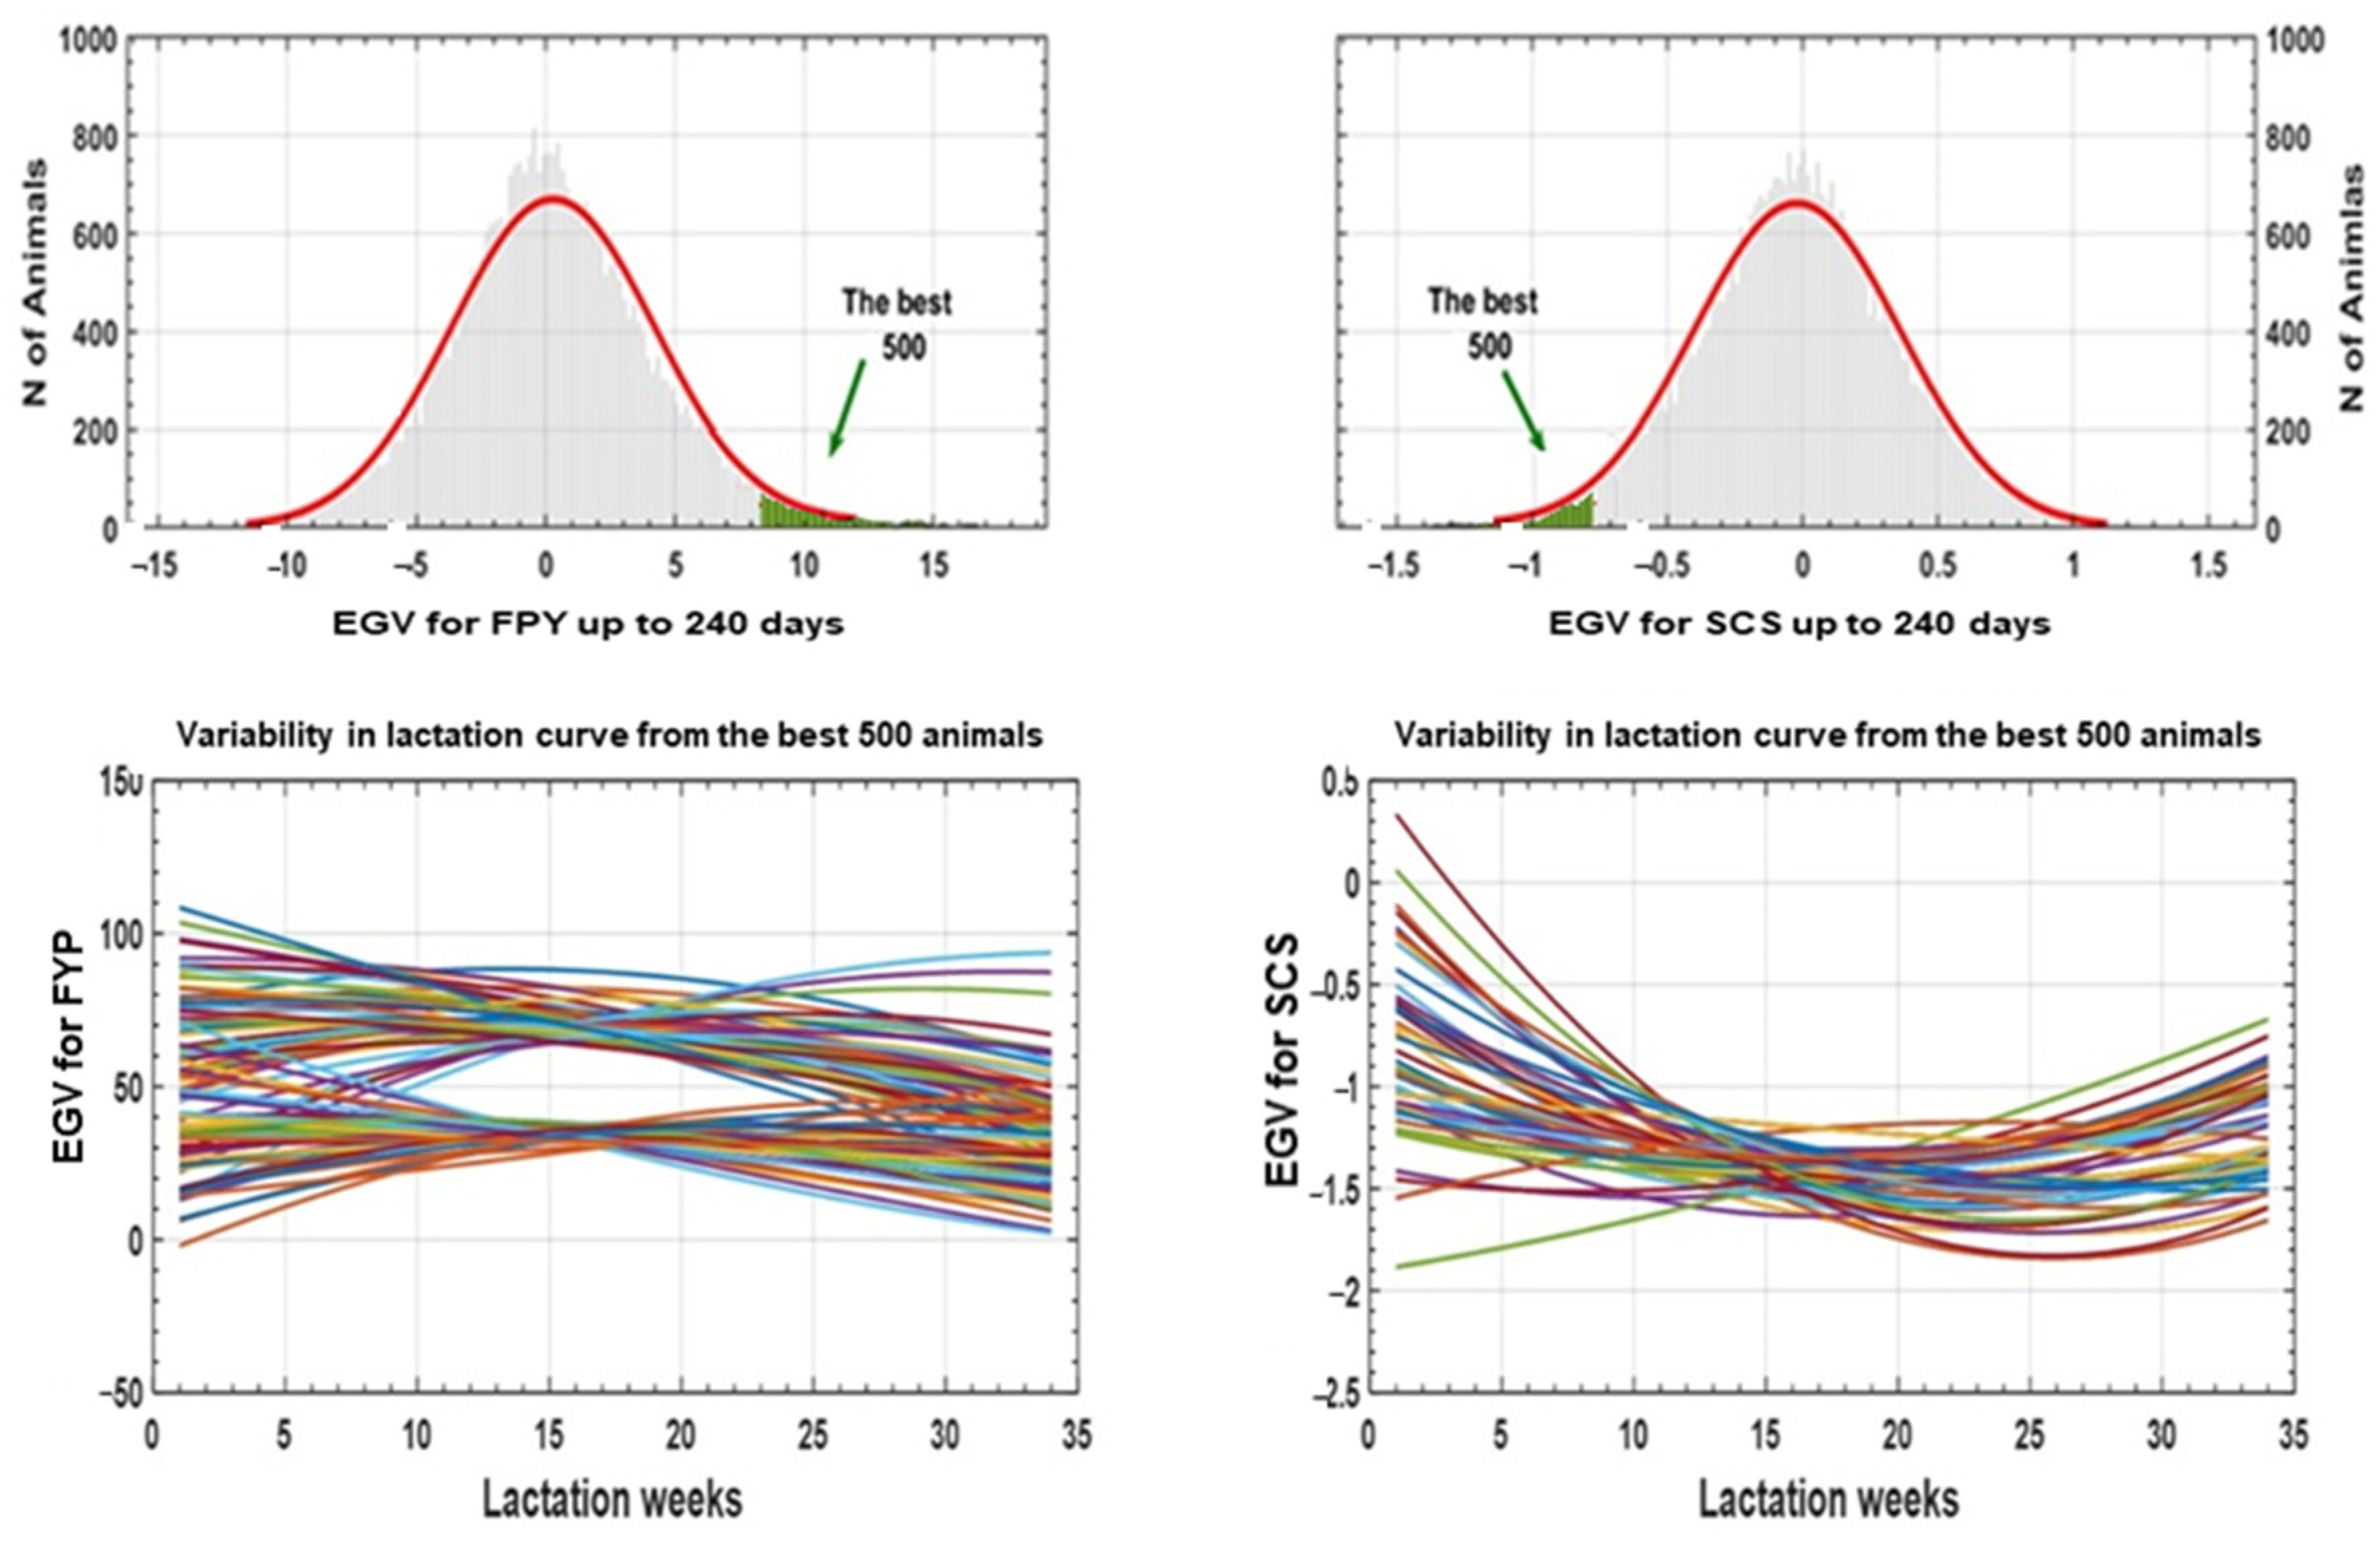
3.2.2. Random Regression Model

The evolution of the (co)variance components, heritabilities and within-trait genetic correlations of both variables along the DIMwi scale and each kidding is represented in Figure 2. Genetic variances and h2 estimates showed similar shapes, with a decreasing trend as DIMw increases and a slight increase in the middle of lactation. In the same way, the within-trait genetic correlations across the DIMwi scale and number of kiddings were different from unity.
The genetic correlations between FPY and SCS throughout the lactation and in the three different parities are presented in Figure 3. Their estimated values were negative in all cases and oscillated between −0.53; −0.17, −0.44; −0.24 and −0.40; −0.27, for the first, second and third kidding, respectively. These results indicate that an expected low genetic somatic cell count is associated with a high genetic production potential. The correlations were higher in the first phase, when the animal initiates milk production, as well as in the final phase, when after a lactation, the udder epithelium has suffered the stress of milk production for a whole lactation. In the middle of lactation another peak occurs, coinciding with the productive stress after the lactation peak (although it is less evident in the case of the first lactation).
The results shown in Figure 2 indicate that the variables studied should not be considered as expressing the same traits throughout the lactation: in other words, there is genetic variation in the type of response. To illustrate this variation, it was considered that, in practical terms, the objective can be interpreted as higher cumulative FPY volume at 240 days of lactation and lower average SCS. To obtain these values, the corresponding EGVs were estimated following the suggestion by Jamrozik and Schaeffer [19], whose general formulation is presented above in the Materials and Methods section. Using this method, the best 500 animals were selected and the results are presented in Figure 4.
It should be noted that, among the best selected animals, there were contrasting forms of response in both variables, with animals that can be described as robust maintaining the same level of EGVs throughout the lactation, while others, which can be described as plastic, showing a tendency to decrease or increase in the same trajectory. This illustrates one of the key advantages of using RRM, in that it allows us to identify the animals that present special attributes in their response pattern throughout lactation. Our work demonstrates that there is genetic variation in the shape of the lactation curve for the traits studied, so that the results of the RM may be biased by assuming the opposite. The correlations between the EGVs estimated by both models corroborate this view, as can be seen in Figure 5.
For SCS, there was a slight increase until the 10th week of lactation for each of the kiddings, followed by a decreasing response until the 34th week of lactation. This correlation of less than 0.8 in all cases implies that selection for increased resistance to mastitis (lower somatic cell count) has a different direct response (much lower in the case of the RM) depending on the assessment method used (RM or RRM), especially in the early stages of lactation. In the same way, the indirect correlated response for resistance to mastitis, if the selection criterion is FPY, will be lower when using RM than when using RRM, since the genetic correlations between both traits is always lower in RM (Table 2 and Table 3).
For FPY, the pattern was similar, but with correlations below 0.53 (Figure 5), so that selection for milk production appears to also have an indirect response for resistance to mastitis, although in this case of a lesser magnitude than in the reverse selection. Also, in this case, the indirect response is higher when selecting RRM.

4. Discussion

The issue of udder health, and particularly subclinical and clinical mastitis and its simplest and most economical indicator, somatic cell count (SCC), has prompted numerous studies to incorporate these indicators into selection programs. The positive results published in Holstein cattle in the USA and Canada [20], with reductions ranging from around 10% to 40% in SCC levels, have provided very encouraging support for work in small ruminants. Results in dairy goats (Scholtens et al. [15] in New Zealand breeds; Arnal et al. [21] in French Alpine goats) and dairy sheep (Serrano et al. [22] in the Manchega breed; Riggio et al. [23]; Tolone et al. [24] in the Valle del Belice breed) also point in the same direction. The usefulness of recording and analyzing SCC has the major advantage that it is a very simple character which can be incorporated in bulk into the periodic dairy control systems in these species. However, the level of SCC might not distinguish the threshold from which infection could be identified, so, there has been a certain degree of controversy about the periodicity in which SCC should be evaluated: following the average lactation, when using the well-known RM model or on each test-day (TD), when RRM is used. A detailed study published by Windig et al. [25] comparing both models has suggested that more benefits could be obtained with the use of TD.
It can be seen how the values of h2 lie within the published range of the literature available for goat species, with estimates of h2 for SCS of between 0.18 and 0.32 (Rupp et al. [26] and Arnal et al. [27] in Alpine and Saanen breeds; Scholtens et al. [15] in New Zealand breeds). It should be noted, however, that previous references were not homogeneous with regard to how to quantify the level of SCC, and a wide range of models were also used.
Estimates of h2 for total fat plus protein production have shown ranges of h2 between 0.04 and 0.40, as published by numerous authors, in goat species (Rupp et al. [26] in Alpine and Saanen breeds; García-Peniche et al. [28] and Castañeda-Bustos et al. [29] in US breeds; Scholtens et al 2019 [15] in New Zealand breeds; Arnal et al 2019 [27] in Alpine and Saanen breeds). The results of this study for both variables were within the lower levels of the above references, while the same trends can be seen in the wide variability of genetic origin that could be exploited in a selection program and the negative but weak relationships between SCS and milk components. However, this negative correlation does not coincide with the farmer’s viewpoint, at least on those farms with higher production levels, which could lead us to think that production levels in this breed are not yet high enough for the production stress suffered by the animals to compromise their immune response capacity (i.e., cause a lower resistance to udder infection). However, Figure 1 shows that the inverse relationship between the two variables at the phenotypic level follows the same tendency as at the genetic level. An increase in the number of somatic cells might be related to natural desquamation by simple repletion of the udder in highly productive animals, without there being a defensive inflammatory reaction caused by bacterial growth and without being related to a higher propensity of genetic origin.
In accordance with Stinchcombe and Kirkpatrick [30], traits which are expressed across a temporal trajectory (or various environmental levels) are classified as ‘function value traits’. These traits should be studied using RRM, such as the one employed in this study. In line with the findings of Zumbach et al. [31], Apodaca-Sarabia et al. [32] and Arnal et al. [21], our study concurs that a Legendre polynomial of order 2 provides the best fit to data on goat milk production under diverse conditions.
The few references available on SCS present values of h2 from 0.12 to 0.25 [32], while Arnal et al. [21] found an h2 of between 0.10 and 0.155; both studies showed slight increases in the middle of lactation. Applying the same statistical model, Arnal et al. [21] presented values of h2 from 0.14 to 0.23 for total fat and protein production in the three kiddings of Alpine goats in France, with both variables showing higher values of h2 in the middle of lactation. Similar trends were indicated by Zumbach et al. [31], but with higher levels of h2, from 0.28 to 0.47, while Oliveira et al. [33] showed results of h2 from 0.40 to 0.50 for fat and protein percentages, respectively, recorded along the lactation scale.
Regarding the genetic correlations (rg) between different points in the lactation, the trends for each variable were very similar for each kidding, with a decreasing response with distance between lactation stages. This same response was presented by Zumbach et al. [31] (rg ≈ 0.48 to 0.80 for total protein and rg ≈ 0.37 to 0.73 for total fat) in different goat breeds in Germany; Arnal et al. [21], with (rg ≈ 0.50 to 0.85) for fat and total protein in Alpine goats from France, while Oliveira et al. [33] presented the same pattern (rg ≈ 0.50) for percentages of fat and protein in Saanen and Alpine goats from Brazil. The problem is even more complex if we consider the rg between SCS and FPY, which were median but negative throughout lactation. References of this type are scarce, however: Rupp et al. [26] presented values of rg ≈ −0.13 to − 0.20, which are very close to those in Figure 2, following the same trend as in dairy sheep [23]. In general, the relationships between milk components in goat species tend to be negative, according to several references presented in tables in the article by Scholtens et al. [15].
In general, references to rg between milk production traits and SCS are scarce and have only been reported for fat yield and protein yield separately, using a repeatability model. Rupp et al. [26] observed negative rg between SCS and FY and PY (−0.13 and −0.04, respectively) in the French Saanen breed. Conversely, other studies have reported positive correlations between these traits, varying between 0.06 and 0.23 (Rupp et al. [26] in Alpine goats; Valencia-Posadas et al. [34] in Nigerian Dwarf goats).

5. Conclusions

The statistical studies carried out in this work indicate that a low genetic somatic cell count is associated with a high genetic production potential. This correlation is greater when the animals begin milk production and in the final phase of lactation, when the udder epithelium has suffered the stress of milk production during an entire lactation. This correlation shows that animals with a greater predisposition towards presenting mastitis (higher EBV for SCS) have a lower potential for milk production (FPY, in our case). Genetic selection for low EBV for SCS therefore not only determines a greater resistance to mastitis but also leads to a better response for milk production.

Supplementary Materials

The following supporting information can be downloaded at: https://www.mdpi.com/article/10.3390/dairy5010001/s1, Map S1: Geographic distribution of Florida farms.

Author Contributions

Conceptualization, A.M., M.S.R. and A.M.B.; methodology, C.Z., A.M. and A.M.B.; software, C.Z. and A.M.B.; validation, R.J.-G., C.Z. and A.M.B.; formal analysis, C.Z. and A.M.B.; investigation, R.J.-G., C.Z. and A.M.B.; resources, R.J.-G. and A.M.B.; data curation, R.J.-G. and C.Z.; writing—original draft preparation, A.M.B.; writing—review and editing, R.J.-G., A.M., M.S.R., C.Z. and A.M.B.; visualization, R.J.-G. and C.Z.; supervision, A.M. and A.M.B.; project administration, M.S.R. and A.M.; funding acquisition, M.S.R. and A.M. All authors have read and agreed to the published version of the manuscript.

Funding

This work was funded by the PAIDI Research Groups AGR-195 (Animal Science) and AGR-158 (Breed Improvement and Molecular Genetics) of the University of Córdoba, to which the authors belong.

Institutional Review Board Statement

Not applicable.

Informed Consent Statement

Not applicable.

Data Availability Statement

The data that support the findings of this study are available on request from the corresponding author with the permission of the ACRIFLOR (National Association of Florida Goat Breeders).

Acknowledgments

We would like to thank the technical team of ACRIFLOR (National Association of Florida Goat Breeders) for providing the data used in this study.

Conflicts of Interest

The authors declare no conflict of interest.

References

  1. Miller, B.A.; Lu, C.D. Current status of global dairy goat production: An overview. Asian-Australas. J. Anim. Sci. 2019, 32, 1219. [Google Scholar] [CrossRef] [PubMed]
  2. Stergiadis, S.; Nørskov, N.P.; Purup, S.; Givens, I.; Lee, M.R. Comparative nutrient profiling of retail goat and cow milk. Nutrients 2019, 11, 2282. [Google Scholar] [CrossRef] [PubMed]
  3. Morales, F.D.A.R.; Genís, J.M.C.; Guerrero, Y.M. Current status, challenges and the way forward for dairy goat production in Europe. Asian-Australas. J. Anim. Sci. 2019, 32, 1256. [Google Scholar] [CrossRef] [PubMed]
  4. Linker, R. The Goat Milk Cosmetics Market is Expected to Grow at a CAGR of over 7% during the Period 2019–2025. 2020. Available online: https://www.reportlinker.com/p05932562/Goat-Milk-Cosmetics-Market-Global-Outlook-and-Forecast.html?utm_source=GNW (accessed on 1 October 2023).
  5. Guerrero, A.; Abecia, J.A.; Sañudo, C. The Goat Sector in Spain: Situation, Local Breeds, and Production Systems. In Goats (Capra)-From Ancient to Modern; IntechOpen: London, UK, 2019. [Google Scholar]
  6. Muñoz-Mejías, M.; Menéndez-Buxadera, A.; Sánchez-Rodríguez, M.; Serradilla, J. Genetic progress attained in the selection program of Florida breed of goats in Spain. Option Méditerranéennes Ser. A 2013, 108, 134–139. [Google Scholar]
  7. Jimenez-Granado, R.; Molina, A.; Ziadi, C.; Sanchez, M.; Muñoz-Mejías, E.; Demyda-Peyrás, S.; Menendez-Buxadera, A. Genetic Parameters of Somatic Cell Score in Florida Goats Using Single and Multiple Traits Models. Animals 2022, 12, 1009. [Google Scholar] [CrossRef]
  8. Matuozzo, M.; Spagnuolo, M.S.; Hussein, H.A.; Gomaa, A.; Scaloni, A.; D’Ambrosio, C. Novel biomarkers of mastitis in goat milk revealed by MALDI-TOF-MS-based peptide profiling. Biology 2020, 9, 193. [Google Scholar] [CrossRef]
  9. Gómez-Gascón, L.; Galán-Relaño, A.; Cardoso-Toset, F.; Barrero-Domínguez, B.; Astorga, R.; Luque, I.; Tarradas, C.; Gómez-Laguna, J. Lactate dehydrogenase: Detecting high bacterial and somatic cells counts in goats from whole milk samples. Small Rumin. Res. 2022, 208, 106632. [Google Scholar] [CrossRef]
  10. Granado, R.J.; Rodríguez, M.S.; Arce, C.; Estévez, V.R. Factors affecting somatic cell count in dairy goats: A review. Span. J. Agric. Res. 2014, 12, 133–150. [Google Scholar] [CrossRef]
  11. Koop, G.; Nielen, M.; Van Werven, T. Bulk milk somatic cell counts are related to bulk milk total bacterial counts and several herd-level risk factors in dairy goats. J. Dairy Sci. 2009, 92, 4355–4364. [Google Scholar] [CrossRef]
  12. Molina, A.; Muñoz, E.; Díaz, C.; Menéndez-Buxadera, A.; Ramón, M.; Sánchez, M.; Carabaño, M.J.; Serradilla, J.M. Goat genomic selection: Impact of the integration of genomic information in the genetic evaluations of the Spanish Florida goats. Small Rumin. Res. 2018, 163, 72–75. [Google Scholar] [CrossRef]
  13. ARCA. Sistema Nacional De Información De Razas. Raza Caprina Florida, Ministerio De Agricultura, Alimentación Y Medio Ambiente. Gobierno De España. (mapa.gob.es). 2022. Available online: https://resolucionaprobacionflorida05_05_20_tcm30-537798.pdf (accessed on 31 July 2023).
  14. Bagnicka, E.; Lukaszewicz, M.; Ådnøy, T. Genetic parameters of somatic cell score and lactose content in goat s milk. J. Anim. Feed. Sci. 2016, 25, 210–215. [Google Scholar] [CrossRef]
  15. Scholtens, M.; Lopez-Villalobos, N.; Garrick, D.; Blair, H.; Lehnert, K.; Snell, R. Estimates of genetic parameters for lactation curves for milk, fat, protein and somatic cell score in New Zealand dairy goats. N. Z. J. Anim. Sci. Prod. 2019, 79, 177–182. [Google Scholar]
  16. Wiggans, G.; Shook, G. A lactation measure of somatic cell count. J. Dairy Sci. 1987, 70, 2666–2672. [Google Scholar] [CrossRef] [PubMed]
  17. Gilmour, A.R.; Gogel, B.; Cullis, B.; Thompson, R.; Butler, D. ASReml User Guide (Release 3.0). 2009; VSN International Ltd.: Hemel Hempstead, UK, 2015. [Google Scholar]
  18. Falconer, D.S. Introduction to Quantitative Genetics; Longman Group Limited: London, UK, 1982. [Google Scholar]
  19. Jamrozik, J.; Schaeffer, L.R. Estimates of Genetic Parameters for a Test Day Model with Random Regressions for Yield Traits of First Lactation Holsteins. J. Dairy Sci. 1997, 80, 762–770. [Google Scholar] [CrossRef] [PubMed]
  20. Weigel, K.A.; Shook, G.E. Genetic selection for mastitis resistance. Vet. Clin. Food Anim. Pract. 2018, 34, 457–472. [Google Scholar] [CrossRef] [PubMed]
  21. Arnal, M.; Larroque, H.; Leclerc, H.; Ducrocq, V.; Robert-Granié, C. Estimation of genetic parameters for dairy traits and somatic cell score in the first 3 parities using a random regression test-day model in French Alpine goats. J. Dairy Sci. 2020, 103, 4517–4531. [Google Scholar] [CrossRef] [PubMed]
  22. Serrano, M.; Pérez-Guzmán, M.; Montoro, V.; Jurado, J. Genetic analysis of somatic cell count and milk traits in Manchega ewes: Mean lactation and test-day approaches. Livest. Prod. Sci. 2003, 84, 1–10. [Google Scholar] [CrossRef]
  23. Riggio, V.; Finocchiaro, R.; Van Kaam, J.; Portolano, B.; Bovenhuis, H. Genetic parameters for milk somatic cell score and relationships with production traits in primiparous dairy sheep. J. Dairy Sci. 2007, 90, 1998–2003. [Google Scholar] [CrossRef]
  24. Tolone, M.; Larrondo, C.; Yáñez, J.M.; Newman, S.; Sardina, M.T.; Portolano, B. Assessment of genetic variation for pathogen-specific mastitis resistance in Valle del Belice dairy sheep. BMC Vet. Res. 2016, 12, 158. [Google Scholar] [CrossRef]
  25. Windig, J.; Ouweltjes, W.; Ten Napel, J.; De Jong, G.; Veerkamp, R.; De Haas, Y. Combining somatic cell count traits for optimal selection against mastitis. J. Dairy Sci. 2010, 93, 1690–1701. [Google Scholar] [CrossRef]
  26. Rupp, R.; Clément, V.; Piacere, A.; Robert-Granié, C.; Manfredi, E. Genetic parameters for milk somatic cell score and relationship with production and udder type traits in dairy Alpine and Saanen primiparous goats. J. Dairy Sci. 2011, 94, 3629–3634. [Google Scholar] [CrossRef] [PubMed]
  27. Arnal, M.; Larroque, H.; Leclerc, H.; Ducrocq, V.; Robert-Granié, C. Genetic parameters for first lactation dairy traits in the Alpine and Saanen goat breeds using a random regression test-day model. Genet. Sel. Evol. 2019, 51, 43. [Google Scholar] [CrossRef] [PubMed]
  28. García-Peniche, T.; Montaldo, H.H.; Valencia-Posadas, M.; Wiggans, G.; Hubbard, S.; Torres-Vázquez, J.; Shepard, L. Breed differences over time and heritability estimates for production and reproduction traits of dairy goats in the United States. J. Dairy Sci. 2012, 95, 2707–2717. [Google Scholar] [CrossRef] [PubMed]
  29. Castañeda-Bustos, V.J.; Montaldo, H.H.; Torres-Hernández, G.; Pérez-Elizalde, S.; Valencia-Posadas, M.; Hernández-Mendo, O.; Shepard, L. Estimation of genetic parameters for productive life, reproduction, and milk-production traits in US dairy goats. J. Dairy Sci. 2014, 97, 2462–2473. [Google Scholar] [CrossRef]
  30. Stinchcombe, J.R.; Kirkpatrick, M. Genetics and evolution of function-valued traits: Understanding environmentally responsive phenotypes. Trends Ecol. Evol. 2012, 27, 637–647. [Google Scholar] [CrossRef]
  31. Zumbach, B.; Peters, K.; Emmerling, R.; Sölkner, J. Development of a test day model for milk sheep and goats under unfavourable structural conditions in Germany. In Proceedings of the Annual Meeting of EAAP, Bled, Slovenia, 5–9 September 2004; p. S4. [Google Scholar]
  32. Apodaca-Sarabia, C.; Lopez-Villalobos, N.; Blair, H.; Prosser, G. Genetic parameters for somatic cell score in dairy goats estimated by random regression. In Proceedings of the New Zealand Society of Animal Production, Canterbury, New Zealand, 24–26 June 2009; pp. 206–209. [Google Scholar]
  33. Oliveira, H.; Silva, F.; Siqueira, O.; Souza, N.; Junqueira, V.; Resende, M.; Borquis, R.; Rodrigues, M. Combining different functions to describe milk, fat, and protein yield in goats using Bayesian multiple-trait random regression models. J. Anim. Sci. 2016, 94, 1865–1874. [Google Scholar] [CrossRef]
  34. Valencia-Posadas, M.; Lechuga-Arana, A.A.; Ávila-Ramos, F.; Shepard, L.; Montaldo, H.H. Genetic parameters for somatic cell score, milk yield and type traits in Nigerian Dwarf goats. Anim. Biosci. 2022, 35, 377–384. [Google Scholar] [CrossRef]
Figure 1. Least-squares means of somatic cell score (SCS) and fat plus protein yield (FPY) across lactation length (in weeks) and number of kiddings in the Florida breed.
Dairy 05 00001 g001
Figure 2. Evolution of variance components, heritabilities and genetic correlations across lactations and each parity for somatic cell score (SCS) and fat plus protein yield (FPY) using a random regression model in the Florida breed.
Dairy 05 00001 g002
Figure 3. Evolution of the genetic correlations between somatic cell score (SCS) and fat plus protein yield (FPY) throughout lactation and in each parity using a random regression model in the Florida breed.
Dairy 05 00001 g003
Figure 4. Frequency distribution of estimated genetic values (EGVs) for somatic cell score (SCS) and fat plus protein yield (FPY) up to 240 days of lactation and variation in shapes of the lactation curves of the 500 best animals, using a random regression model in the Florida breed.
Dairy 05 00001 g004
Figure 5. Correlations between the estimated genetic values (EGVs) of somatic cell score (SCS) and fat plus protein yield (FPY) estimated by the repeatability and random regression models throughout lactation for each kidding in the Florida breed.
Dairy 05 00001 g005
Table 1. Descriptive statistics of the data analyzed (standard deviation in parenthesis) in the Florida goat breed.
Kidding Number
FirstSecondThirdTotal
Number of test-day records145,816118,03976,799340,654
Number of animals25,43019,26812,59927,749
Number of sires939900807941
Number of dams15,21512,150840616,243
Average SCS (×103) 11.86 (1.65)12.36 (1.61)12.72 (1.54)12.22 (1.65)
Average daily FPY (grams)168.1 (64.1)211.0 (79.1)219.9 (83.2)194.6 (77.6)
SCS: somatic cell score; FPY: fat plus protein yield.
Table 2. Estimation of genetic parameter components for somatic cell score (SCS) and total daily fat plus protein yield (FPY) in the Florida goat breed using a bivariate repeatability model.
Lactation Number
FirstSecondThirdTotal
SCSFPYSCSFPYSCSFPYSCSFPY
Genetic variance0.283452.90.291539.00.273522.40.264497.8
Phenotypic variance1.02432751.06648500.9795287.51.0514379.0
Heritability0.276 ± 0.020.138 ± 0.010.272 ± 0.020.111 ± 0.010.279 ± 0.020.099 ± 0.010.246 ± 0.010.105 ± 0.01
Genetic correlation−0.304 ± 0.03−0.308 ± 0.04−0.477 ± 0.06−0.371 ± 0.04
Repeatibility 0.486 ± 0.0010.202 ± 0.01
Table 3. Correlations between the expected genetic values estimated according to the repeatability model in the Florida goat breed: above the diagonal, correlations between kiddings for SCS; below the diagonal, correlations between kiddings for FPY and on the diagonal, correlations for each kidding between SCS and FPY.
FirstSecondThird
First−0.3070.5520.418
Second0.366−0.4230.609
Third0.1970.358−0.592
Disclaimer/Publisher’s Note: The statements, opinions and data contained in all publications are solely those of the individual author(s) and contributor(s) and not of MDPI and/or the editor(s). MDPI and/or the editor(s) disclaim responsibility for any injury to people or property resulting from any ideas, methods, instructions or products referred to in the content.

