

ReMouse Dataset: On the Efficacy of Measuring the Similarity of Human-Generated Trajectories for the Detection of Session-Replay Bots

Abstract
:1. Introduction
2. Related Work
2.1. Mouse Dynamics for User Authentication
2.2. Mouse Dynamics for Bot Detection
2.3. Mouse Dynamics Datasets
2.3.1. Balabit Dataset
2.3.2. Bogazici Mouse Dynamics Dataset
2.3.3. The Attentive Cursor Dataset
2.3.4. SapiMouse Dataset
2.3.5. Chao Shen Dataset
2.3.6. DFL Dataset
3. ReMouse Dataset
3.1. Web Platform for Data Collection
3.2. ReMouse Dataset Acquisition
4. ReMouse Dataset Analysis
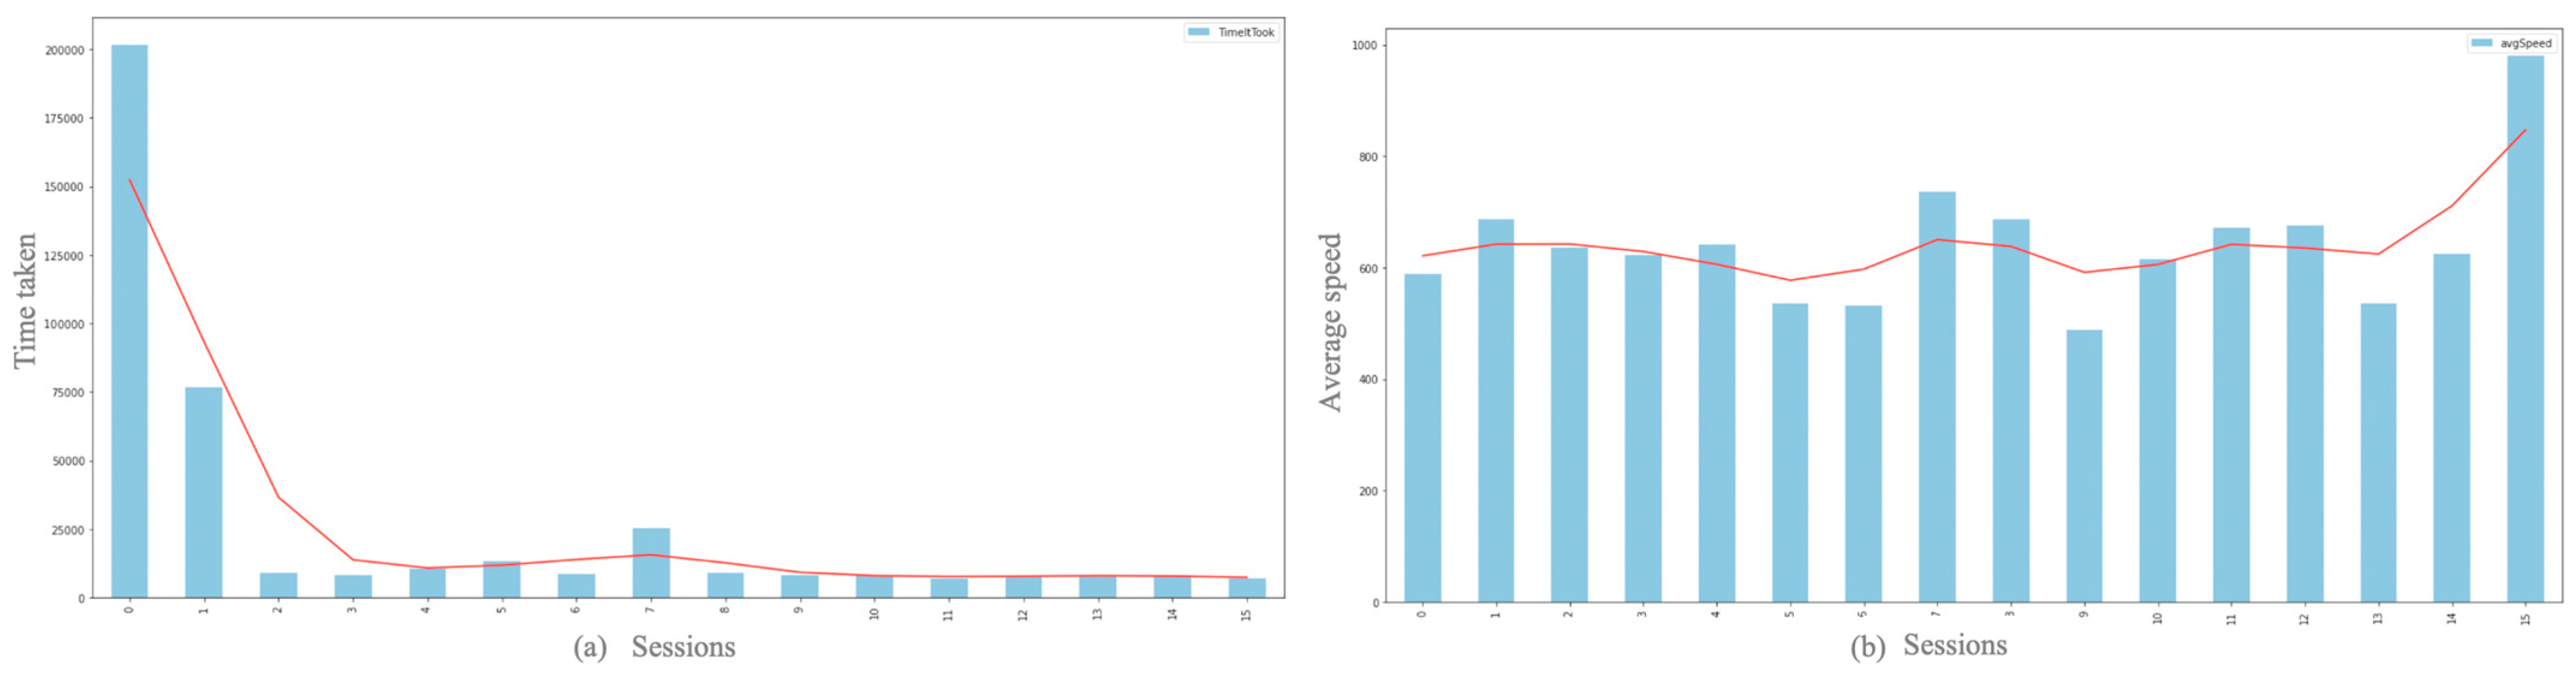
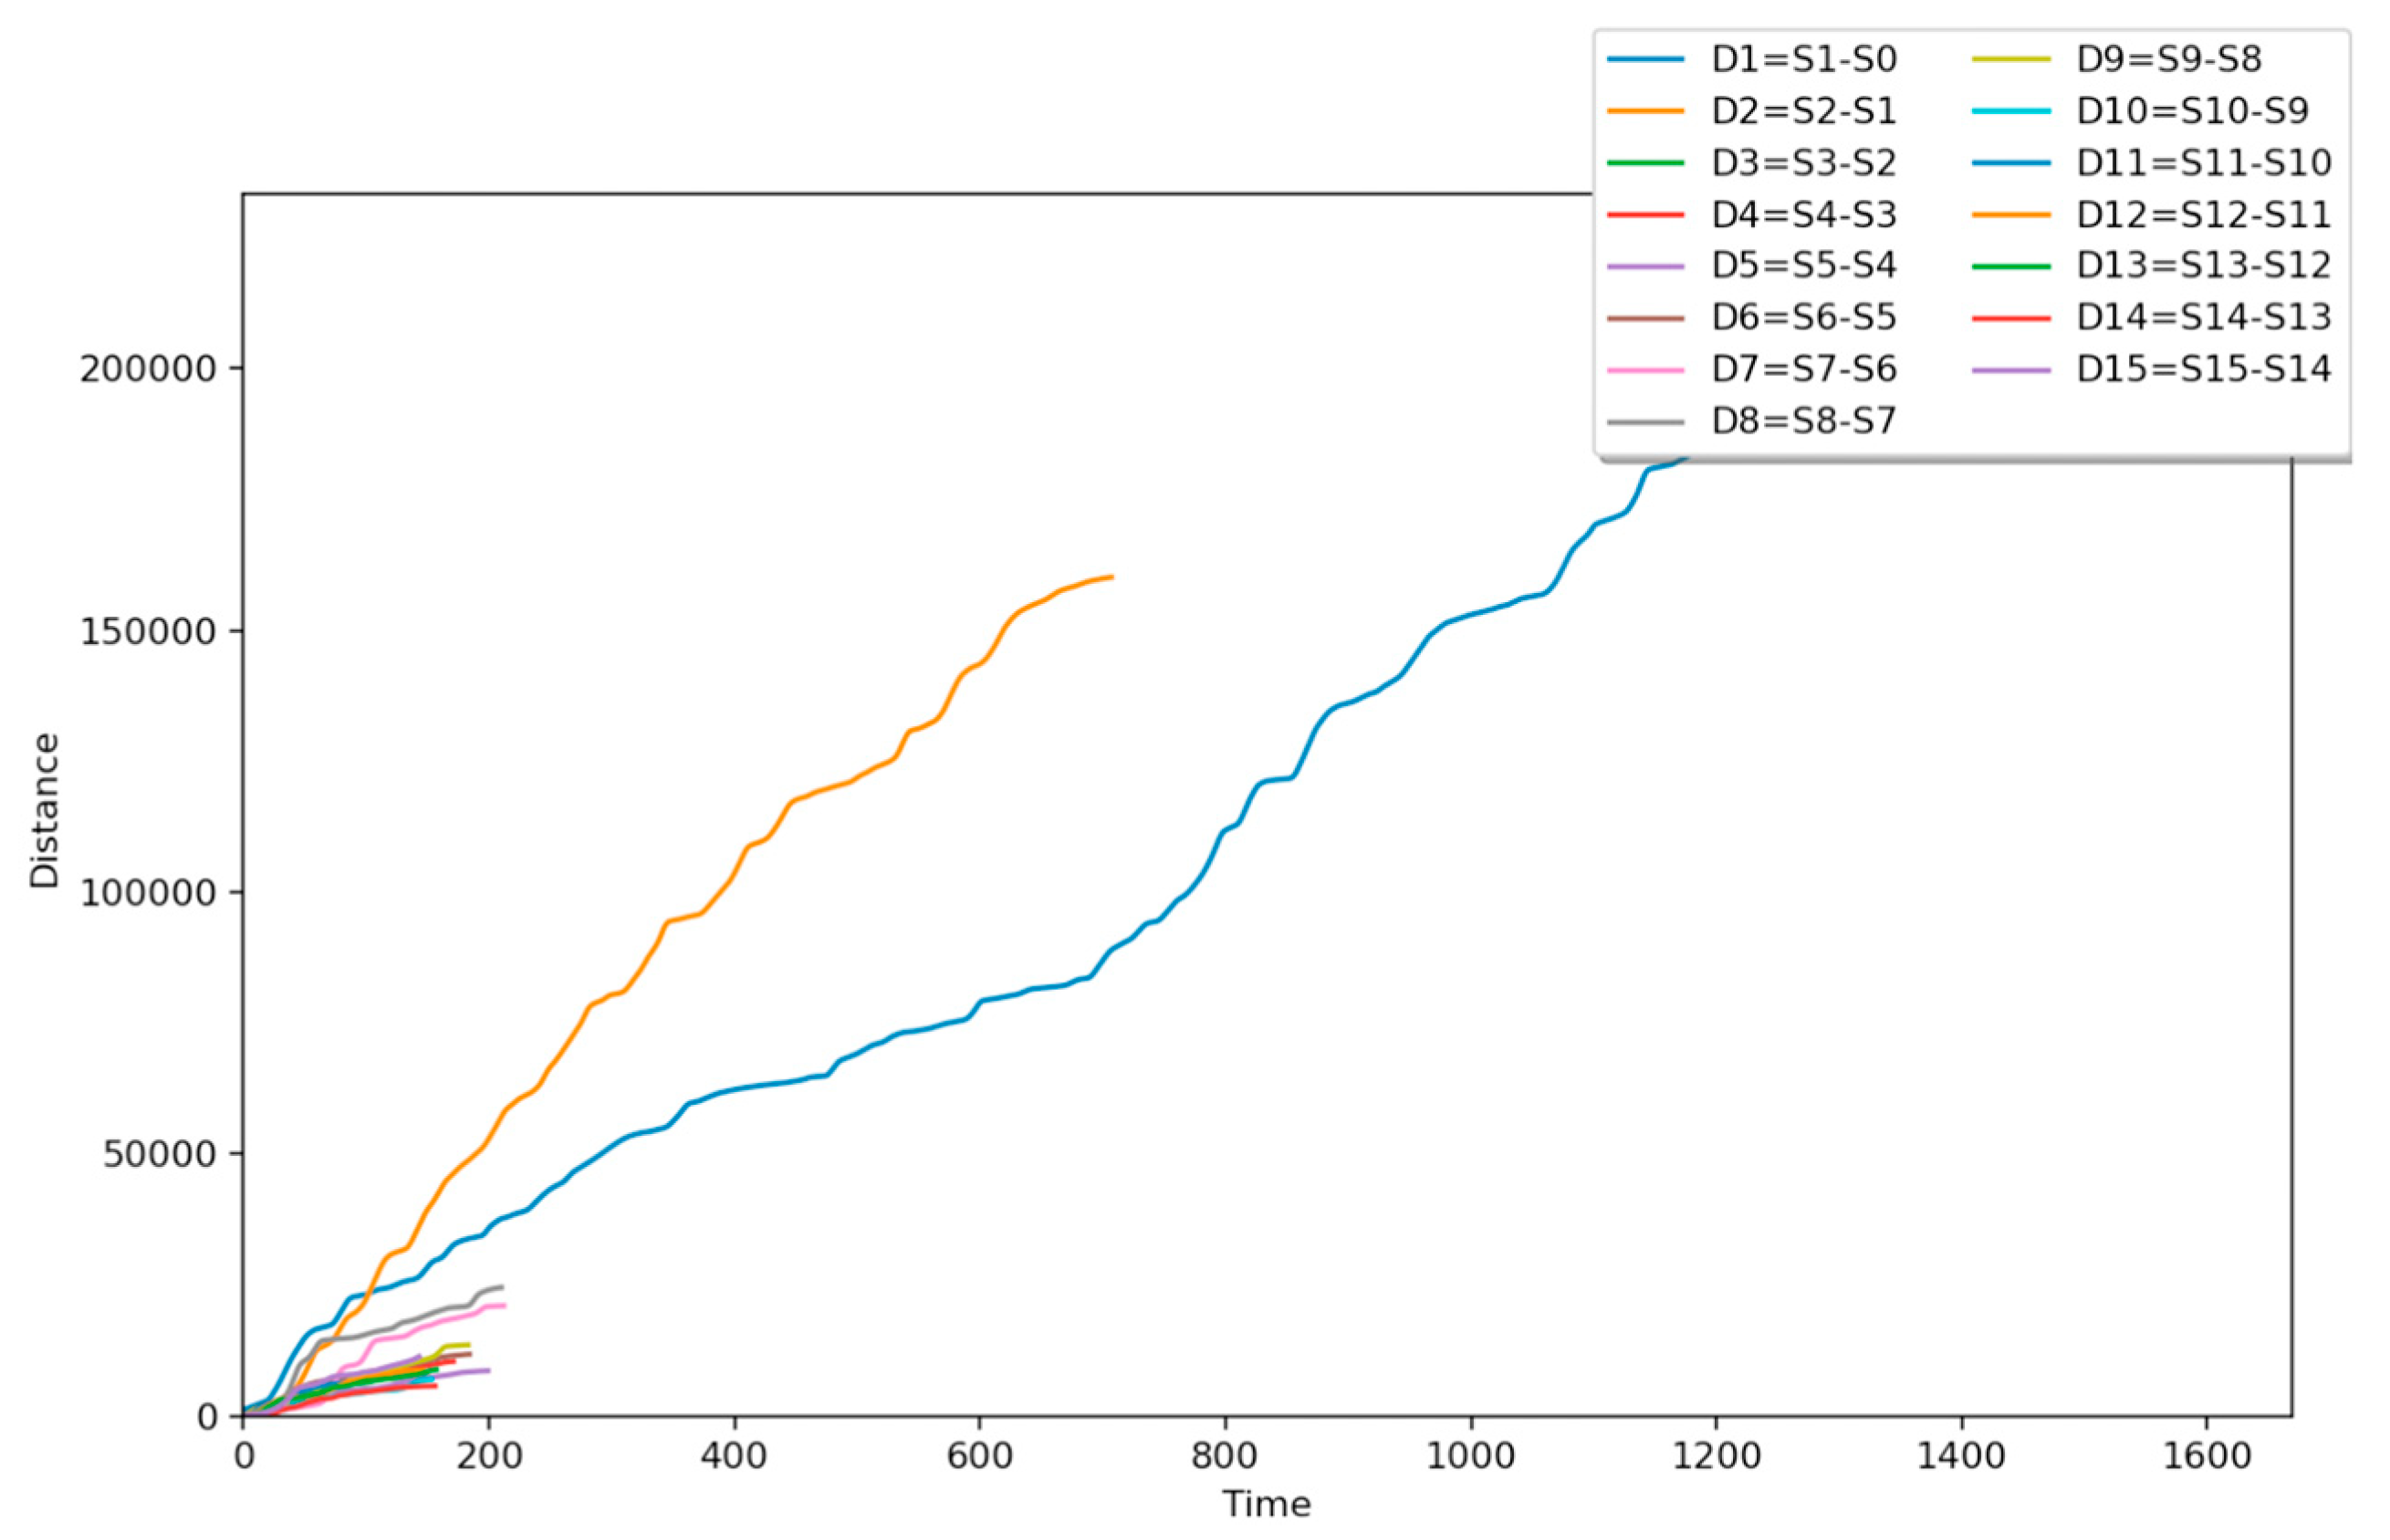
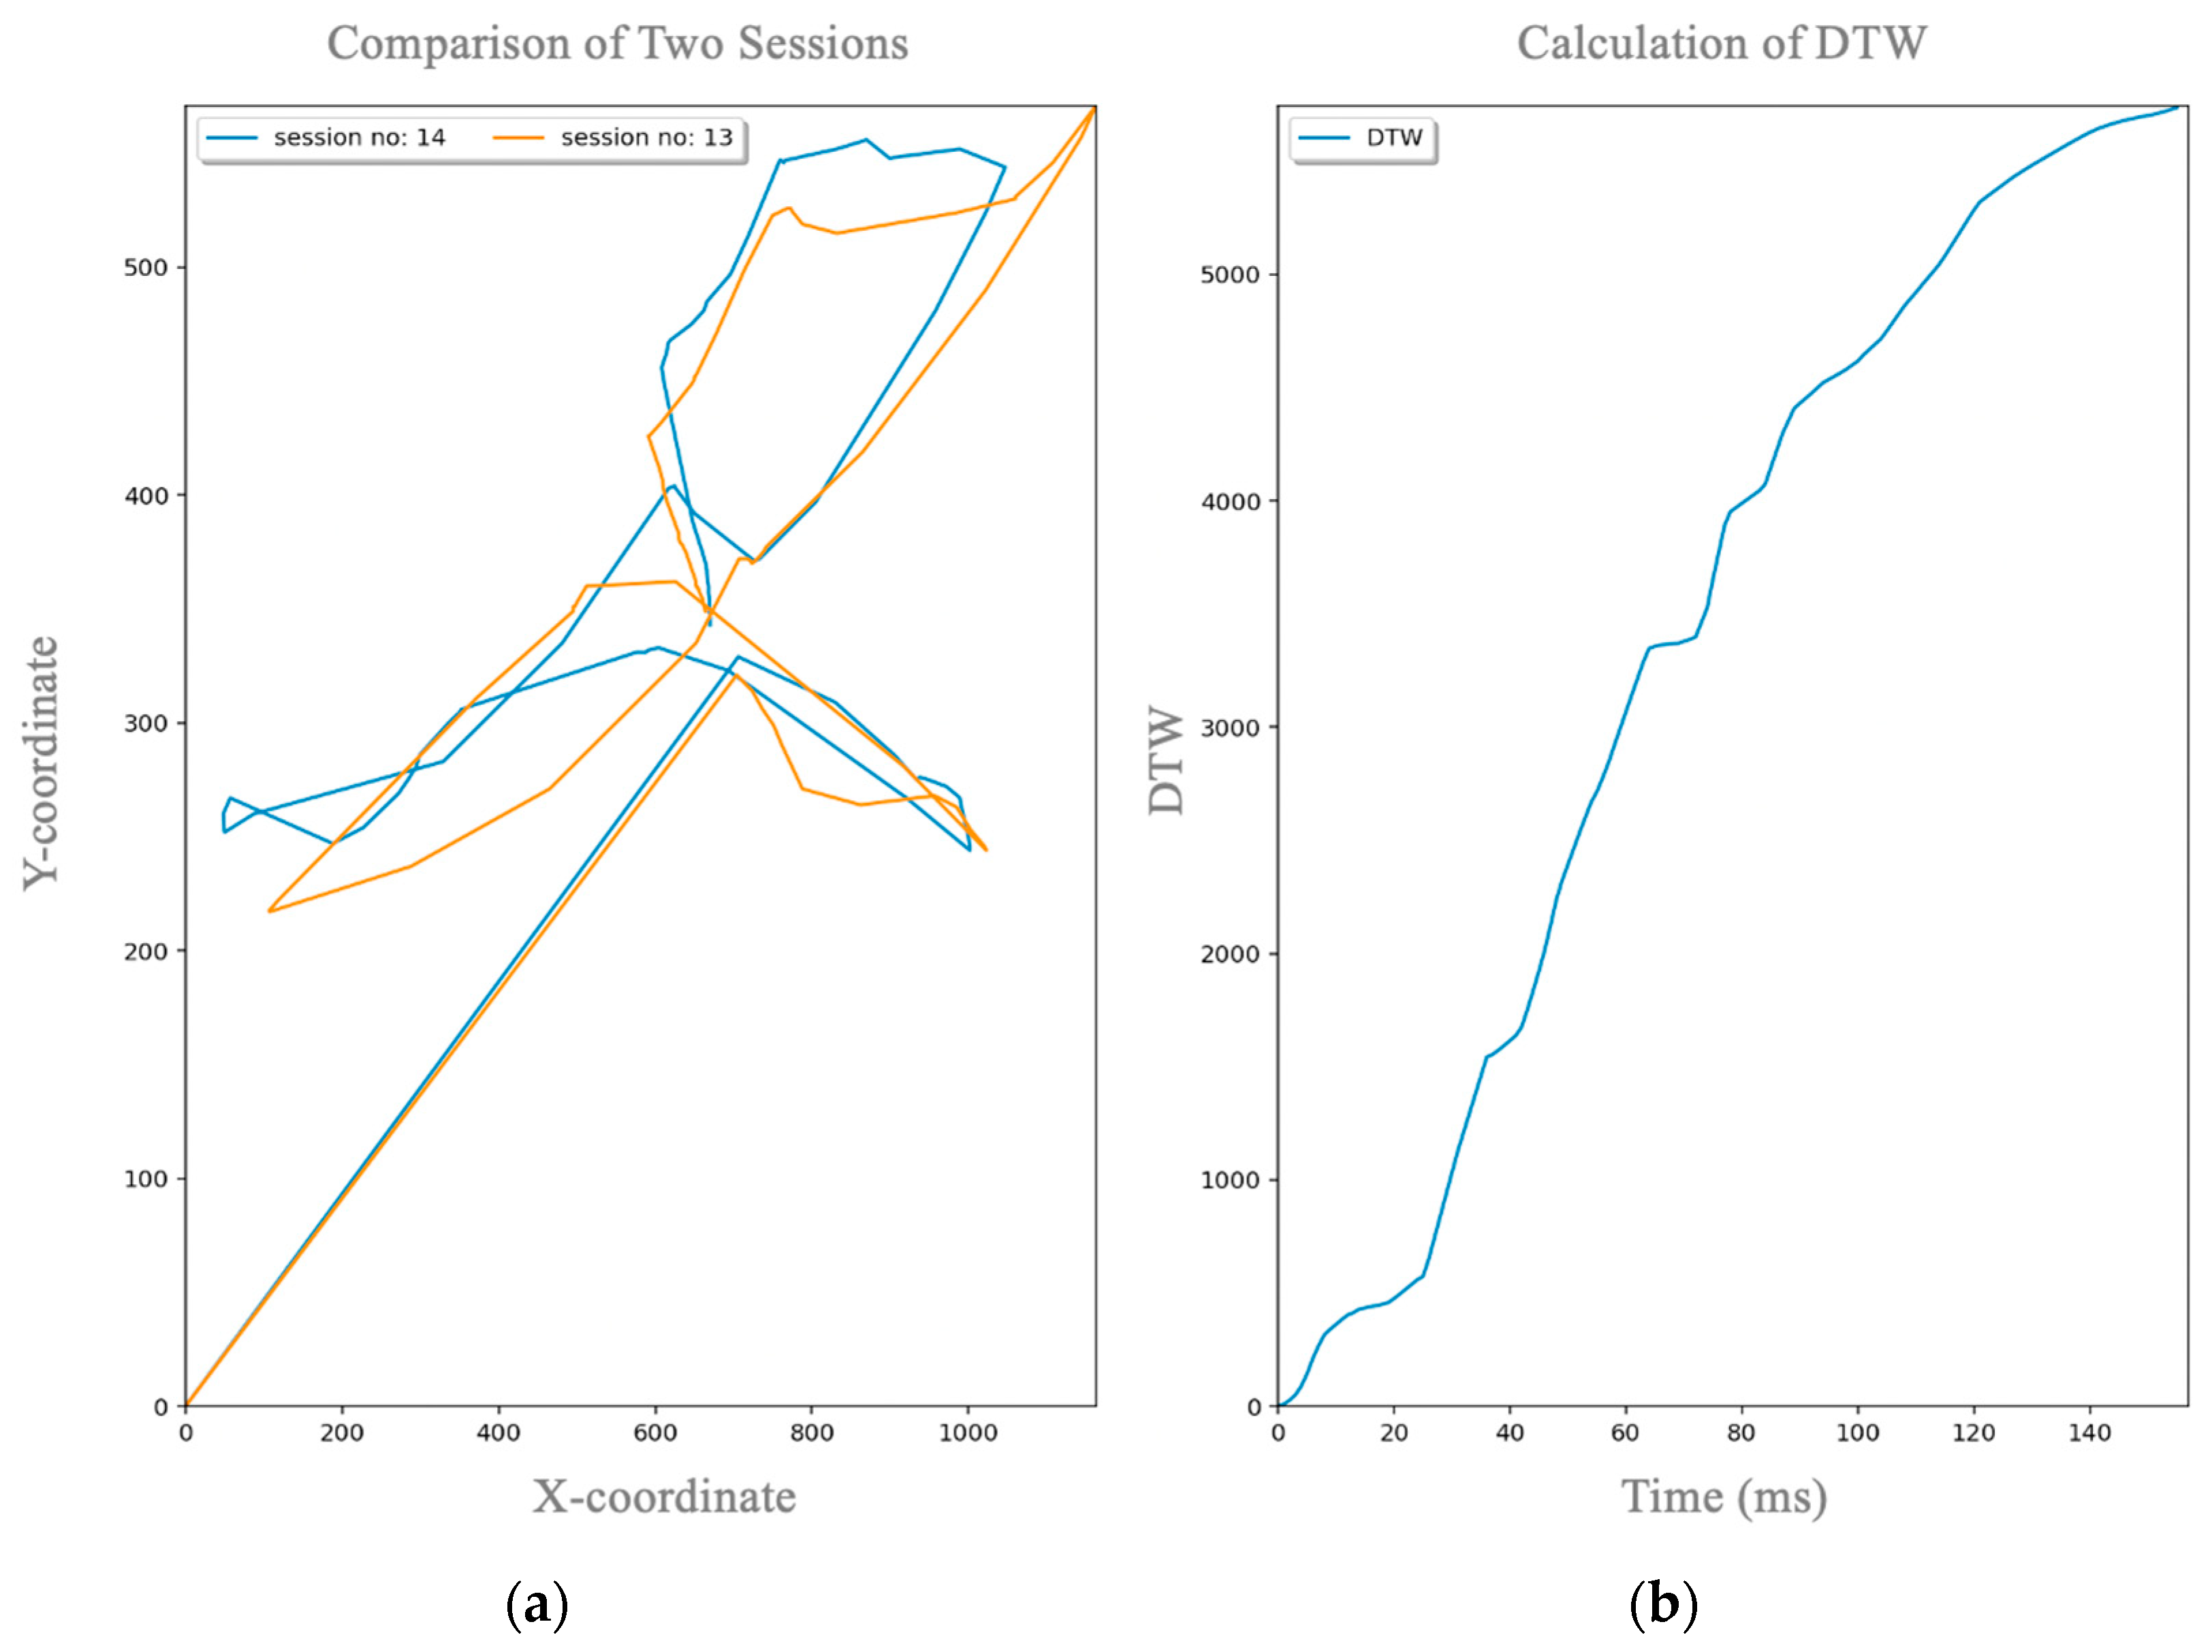
4.1. Sessions Generated by The Same User
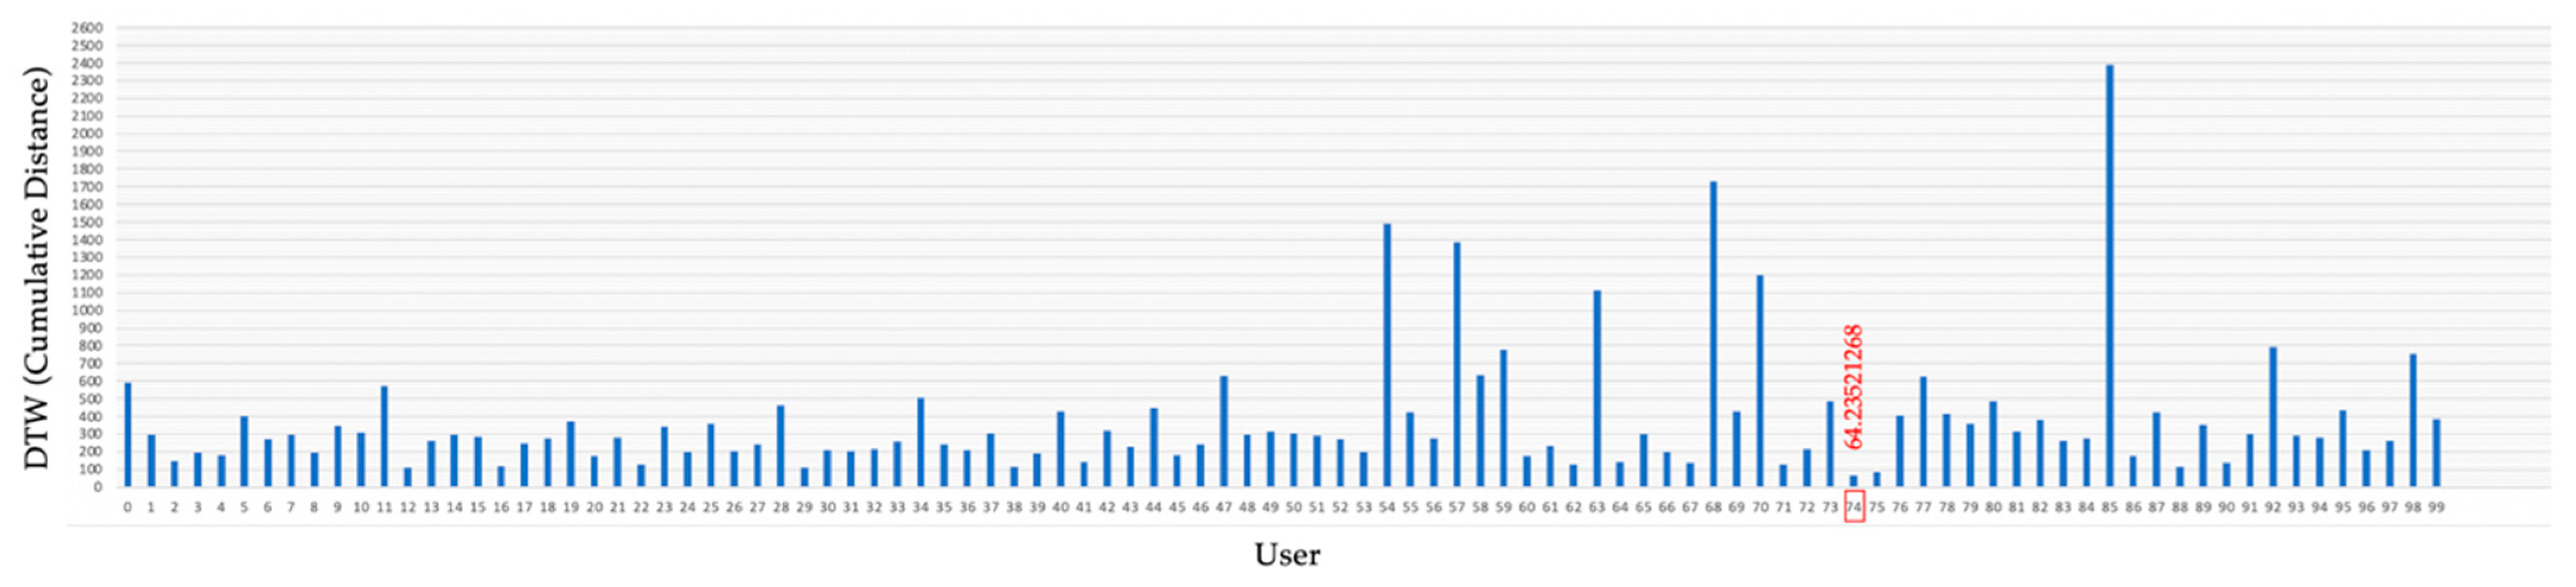
4.2. Sessions Generated by Different User
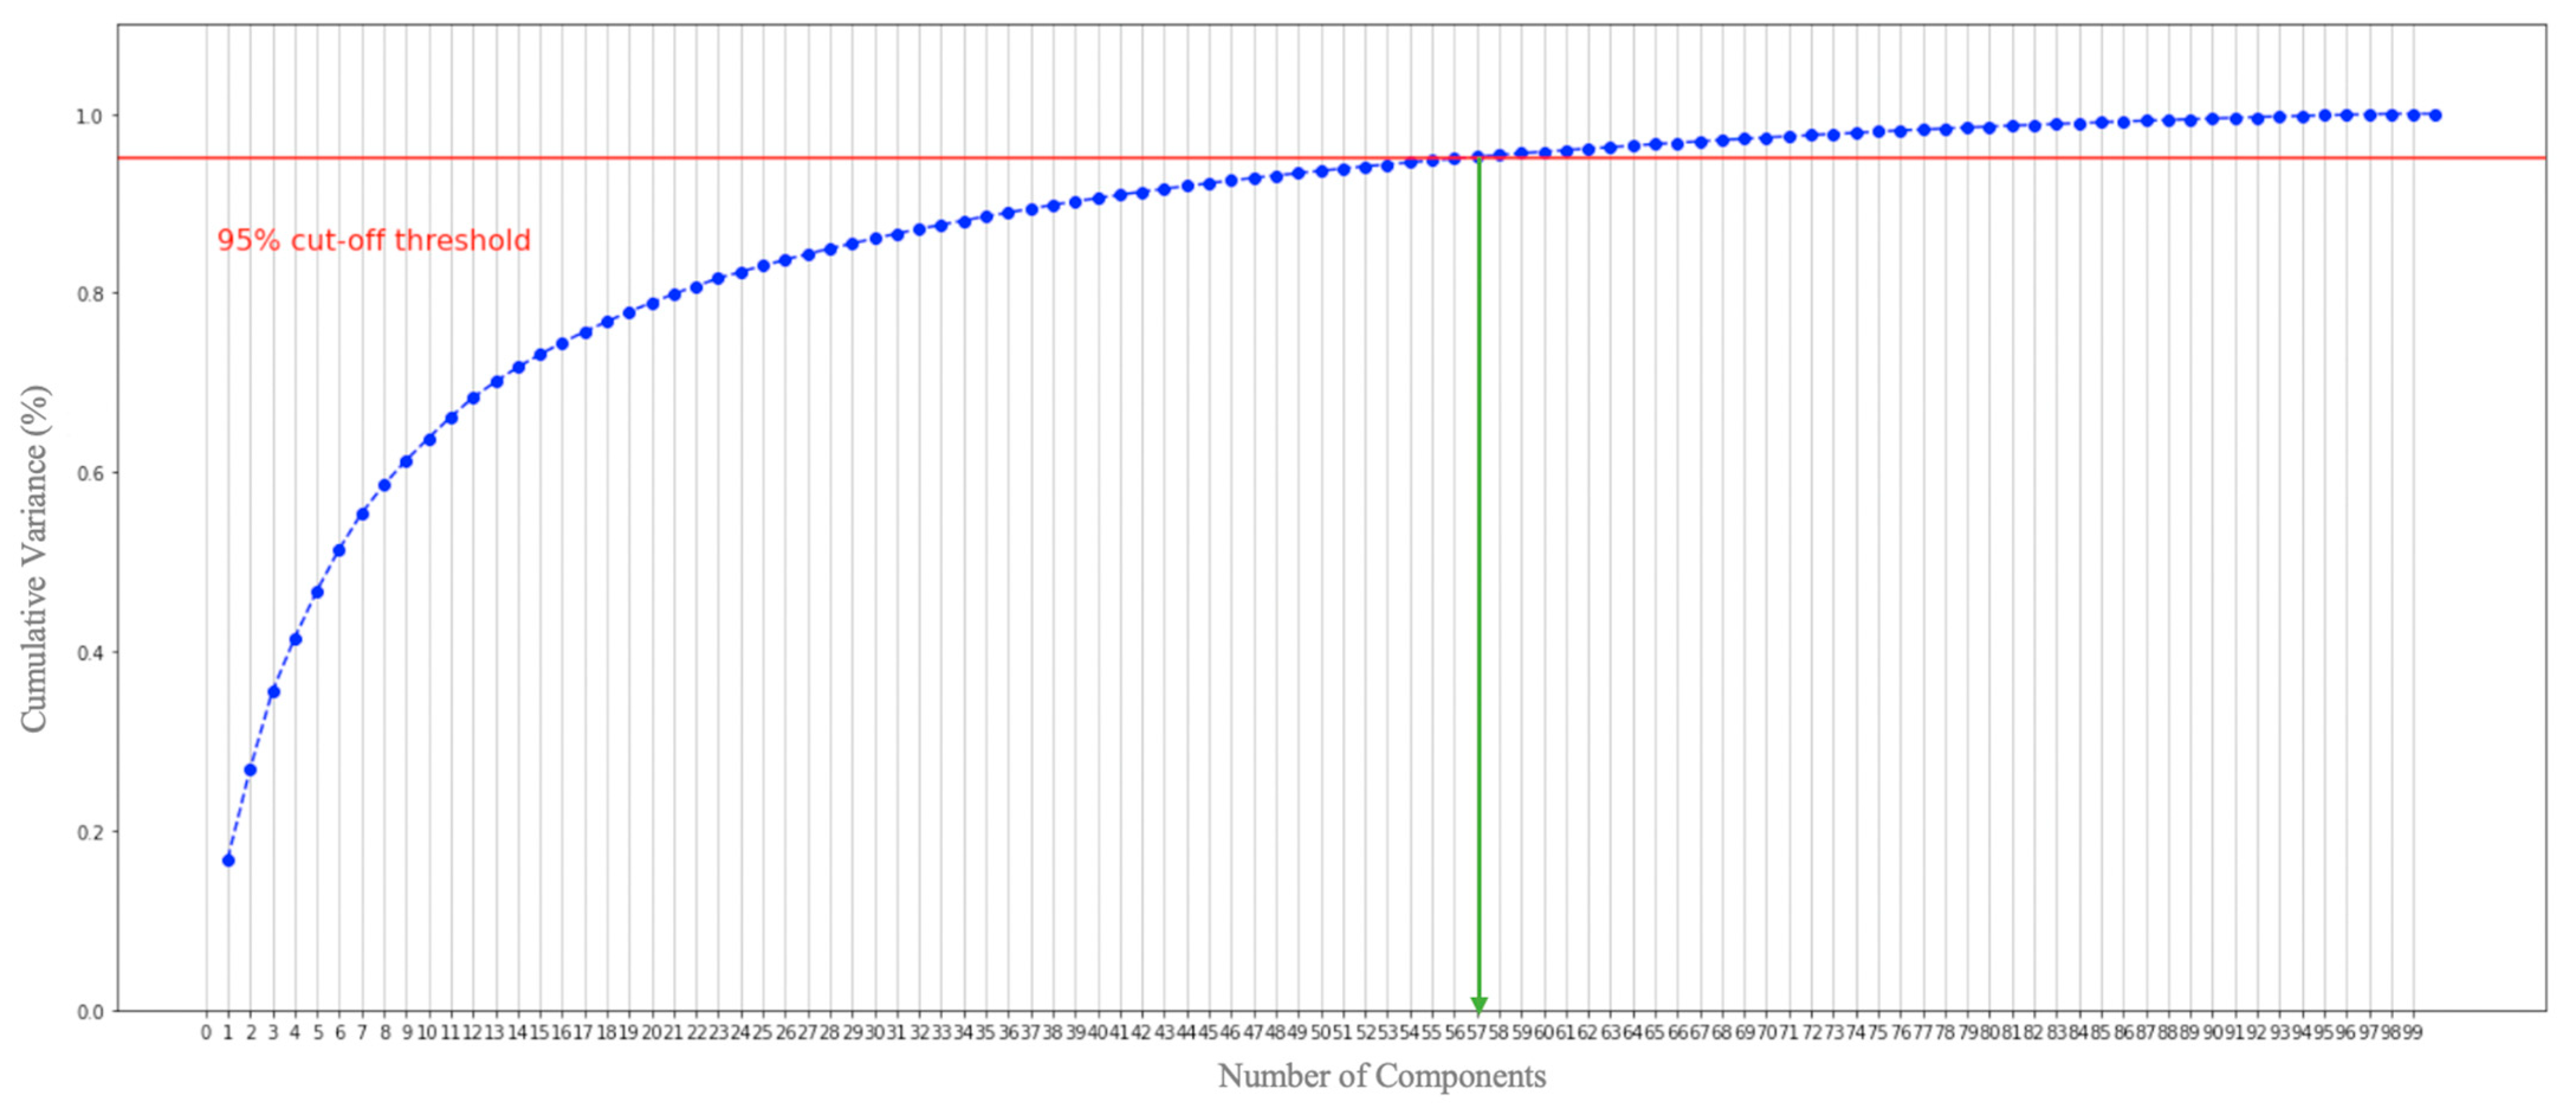
5. Feature Engineering—Preparing ReMouse Dataset for Machine-Learning-Based Analysis
6. ML-Based Analysis of ReMouse Dataset: Focusing on Sessions Generated by Different Users
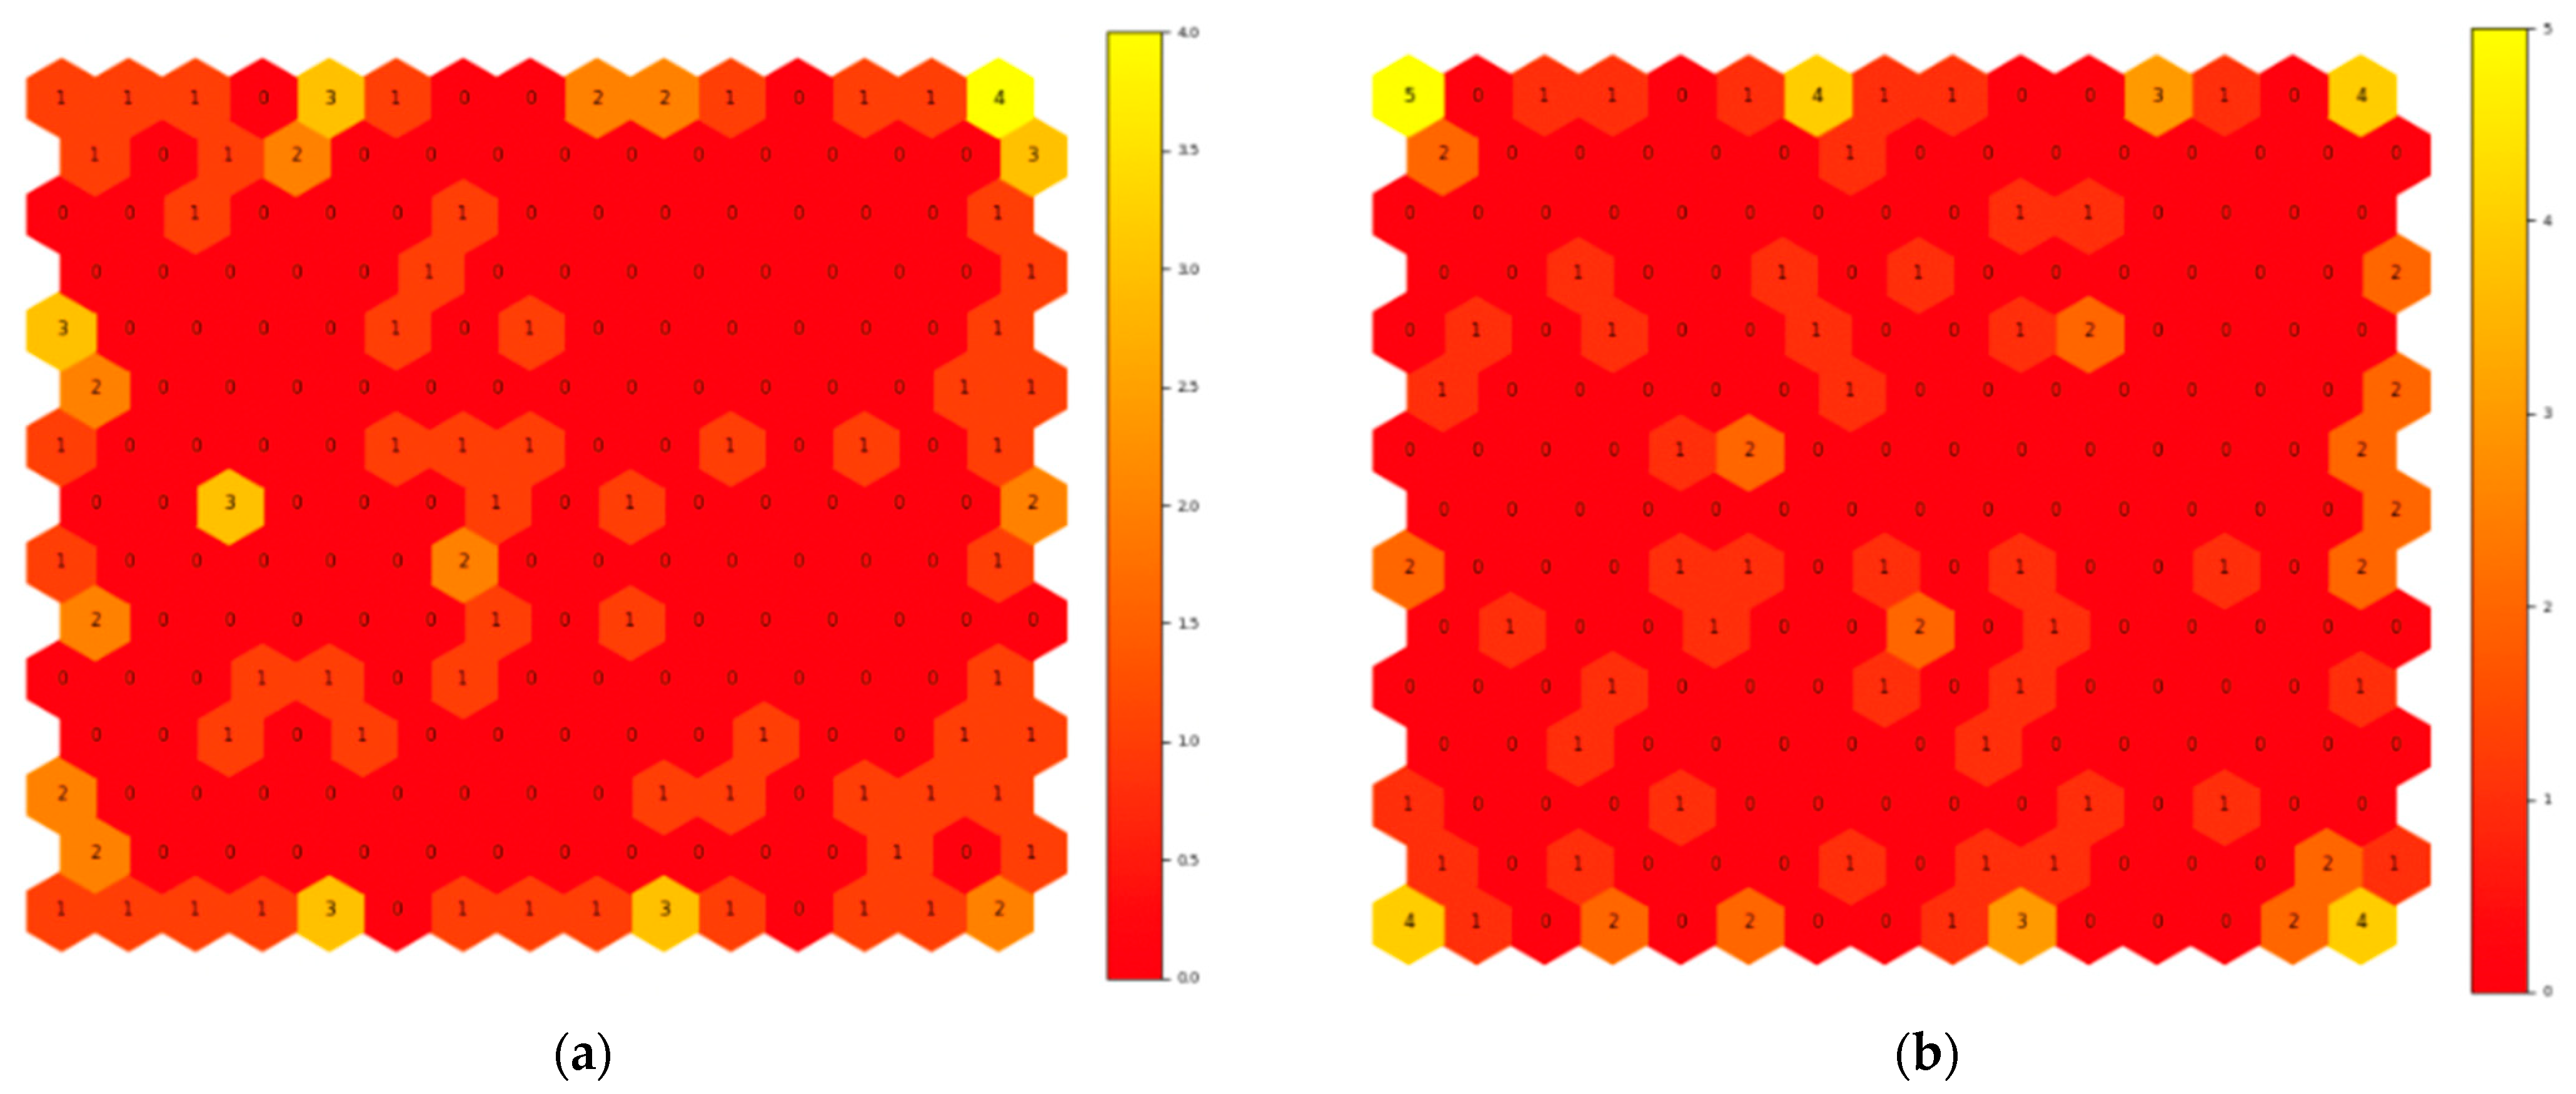
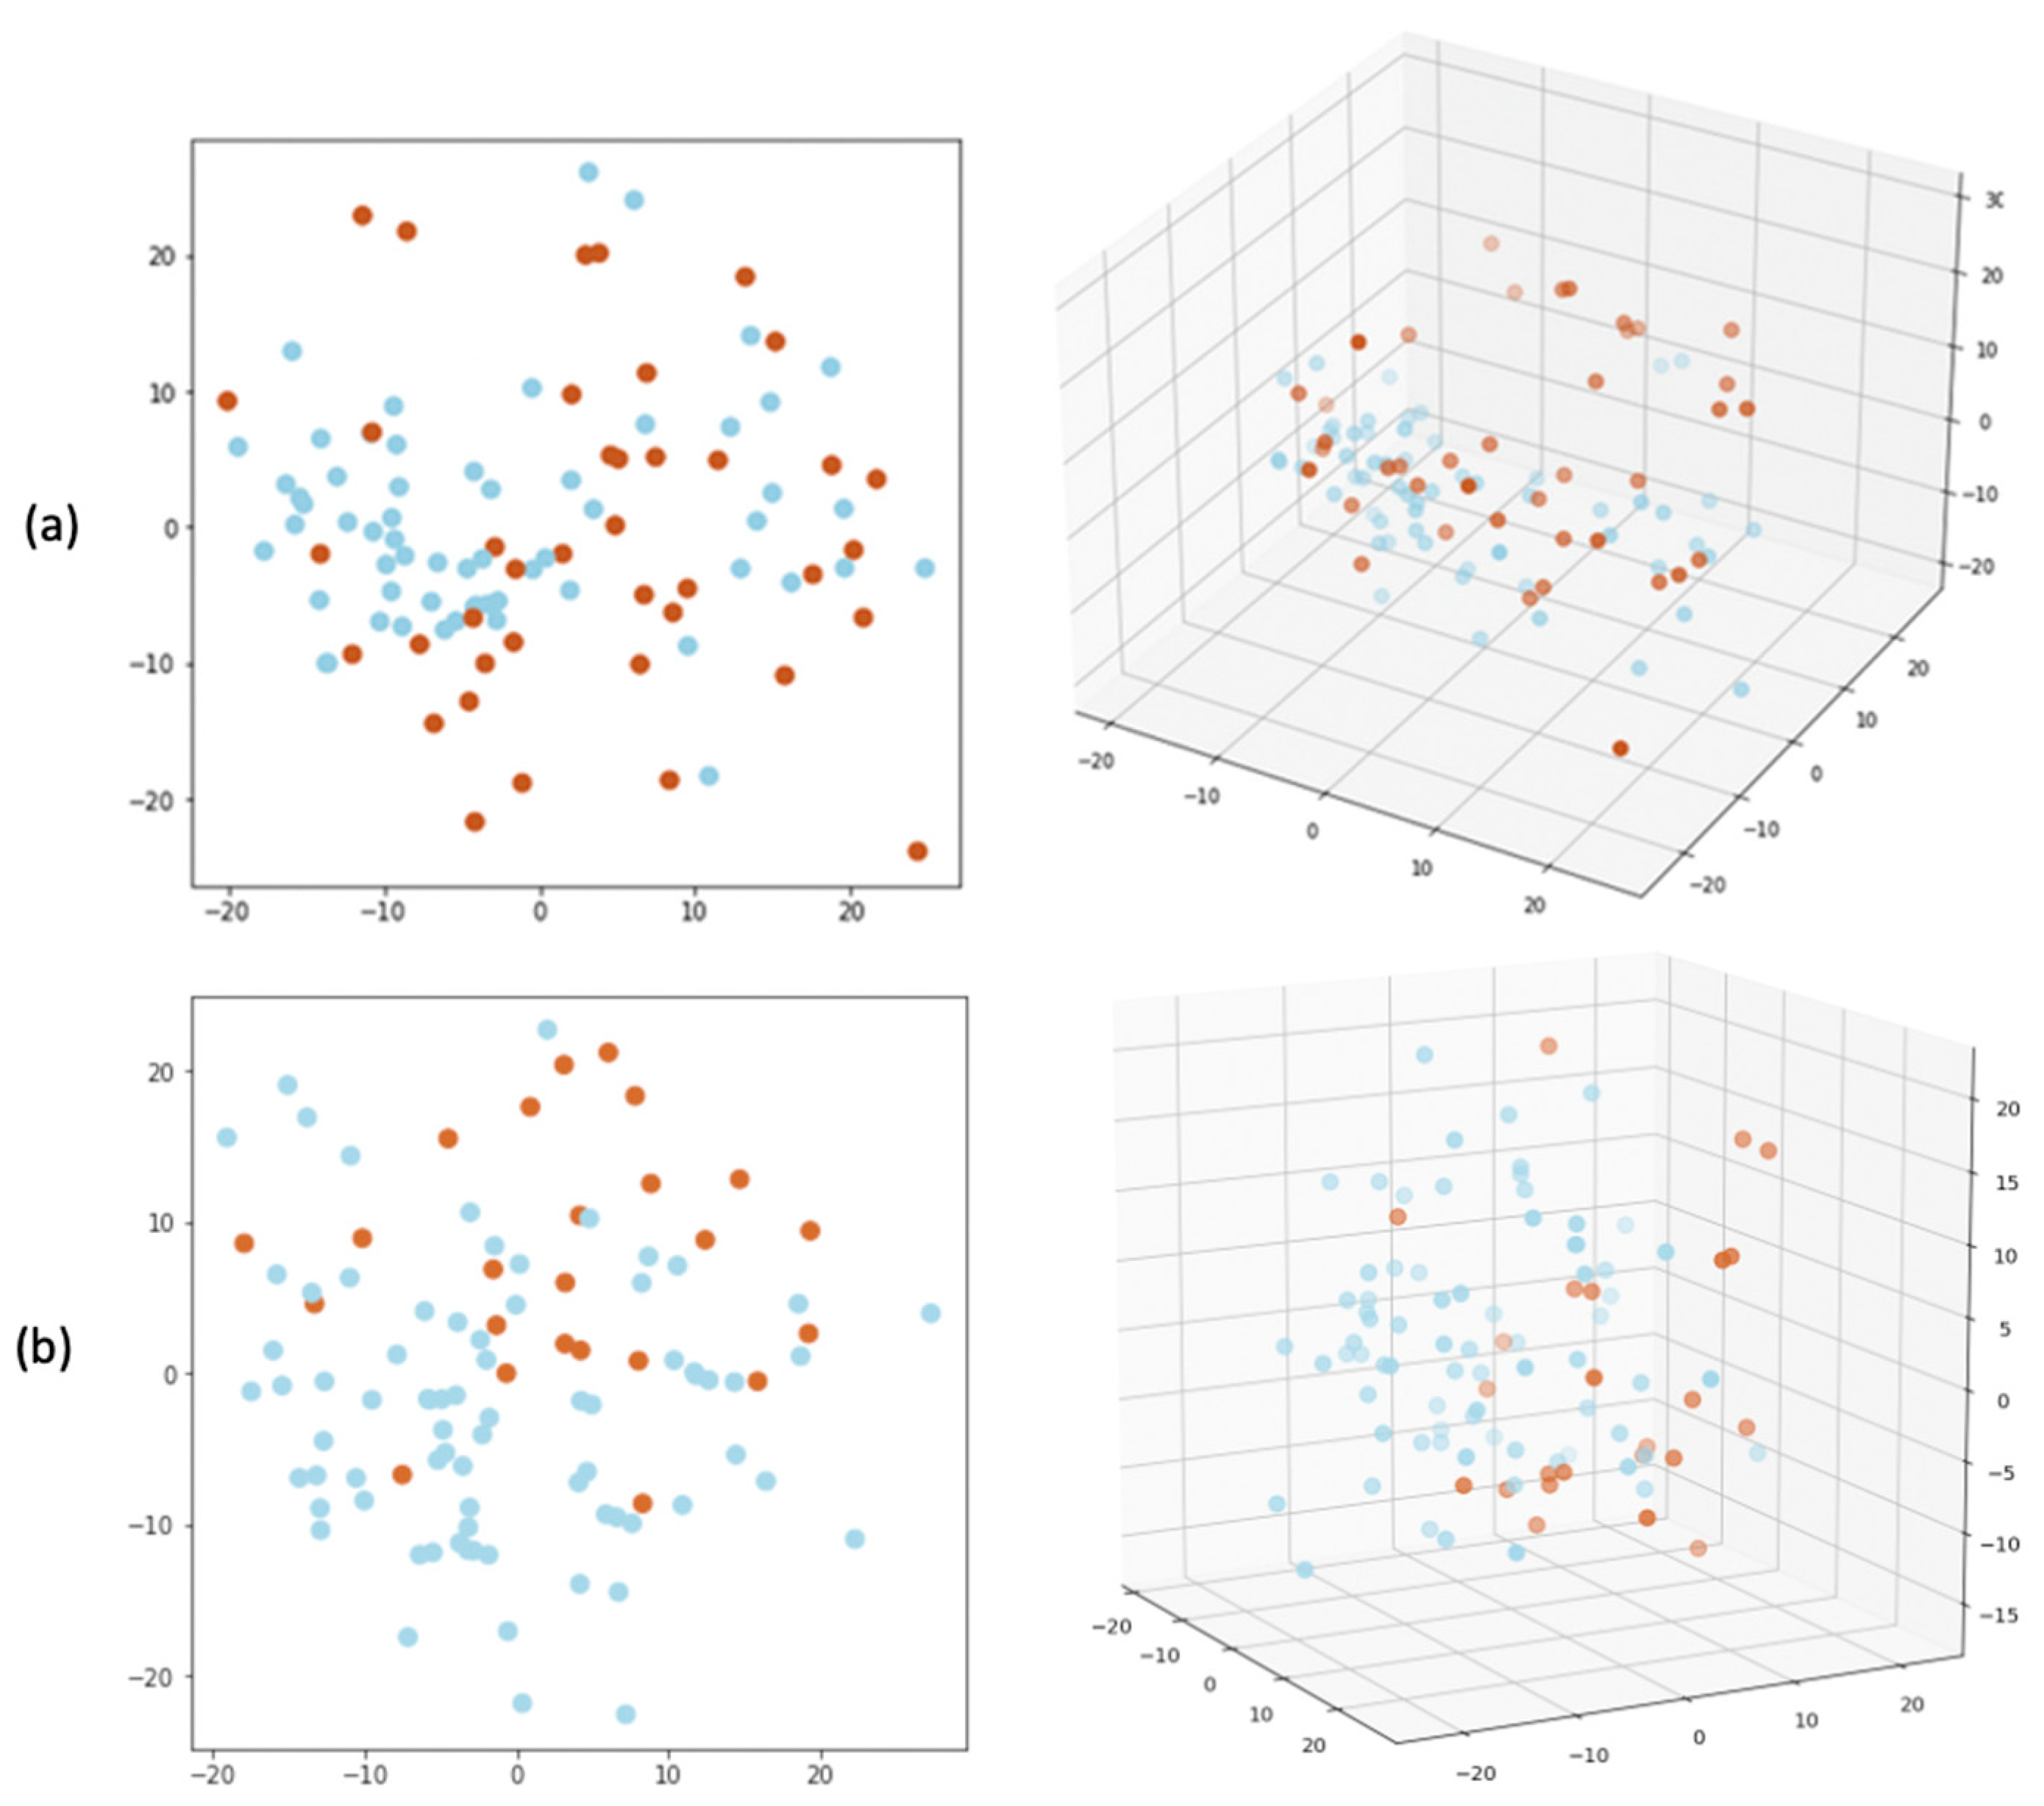
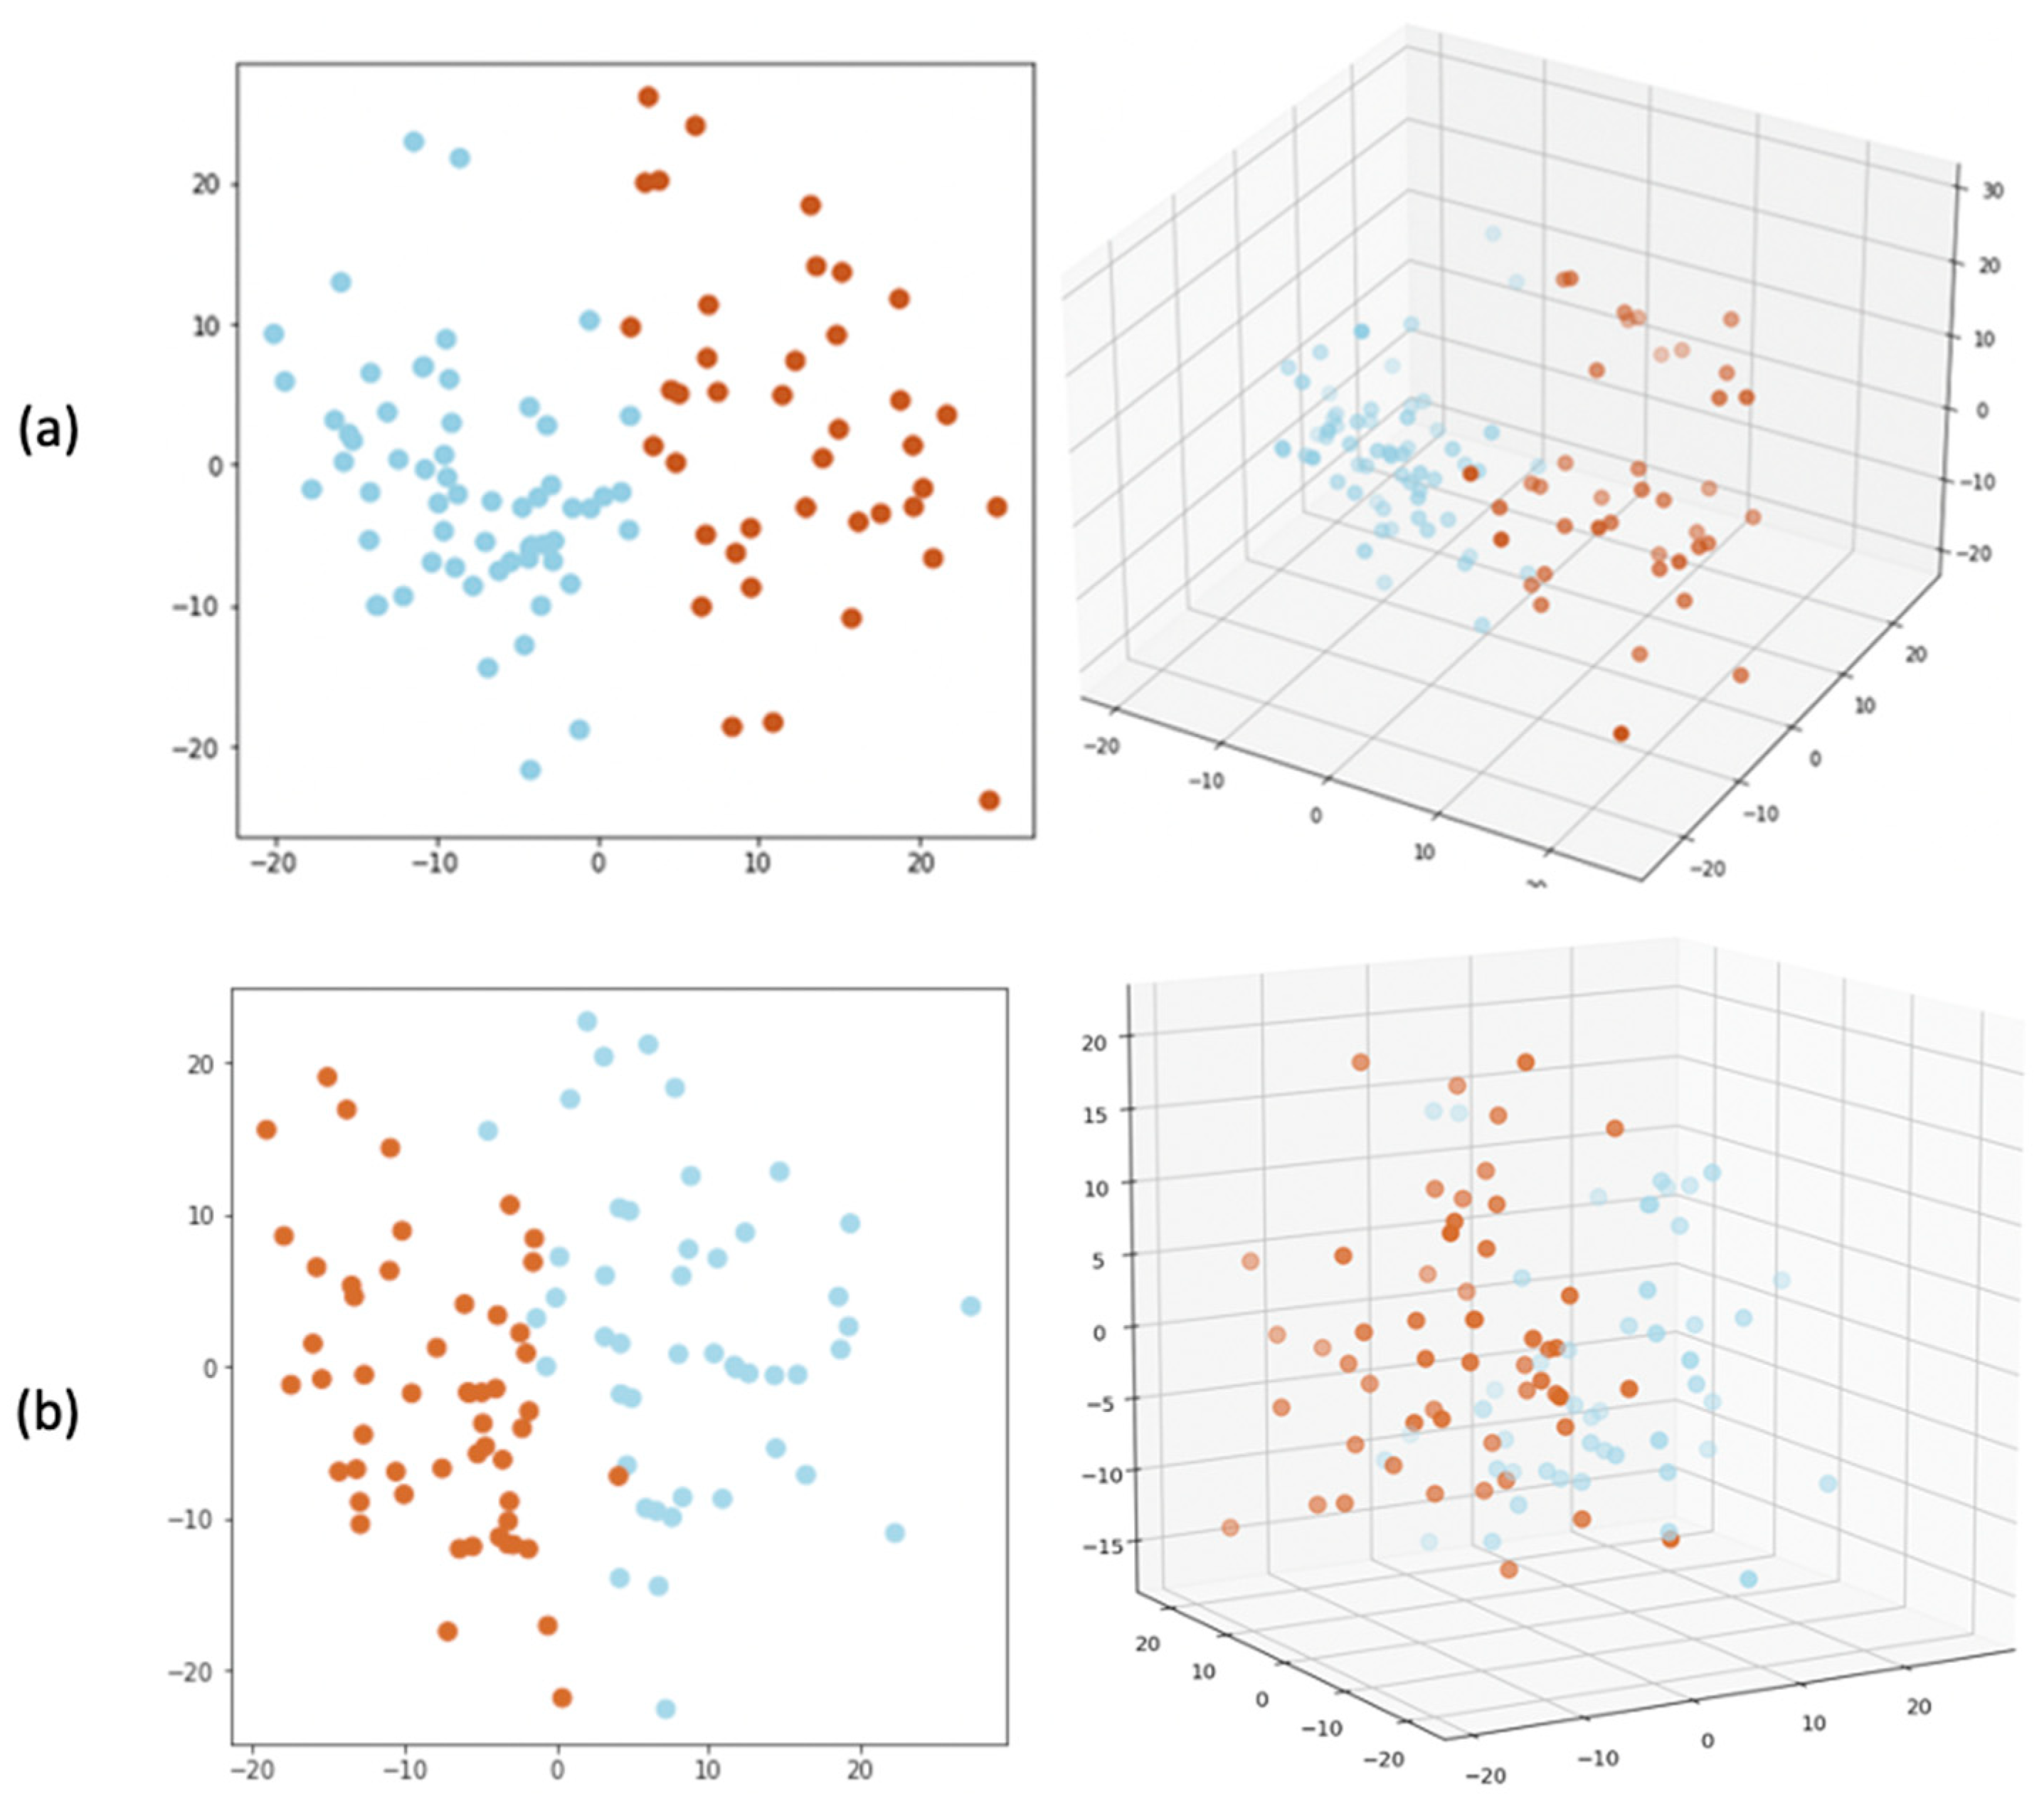
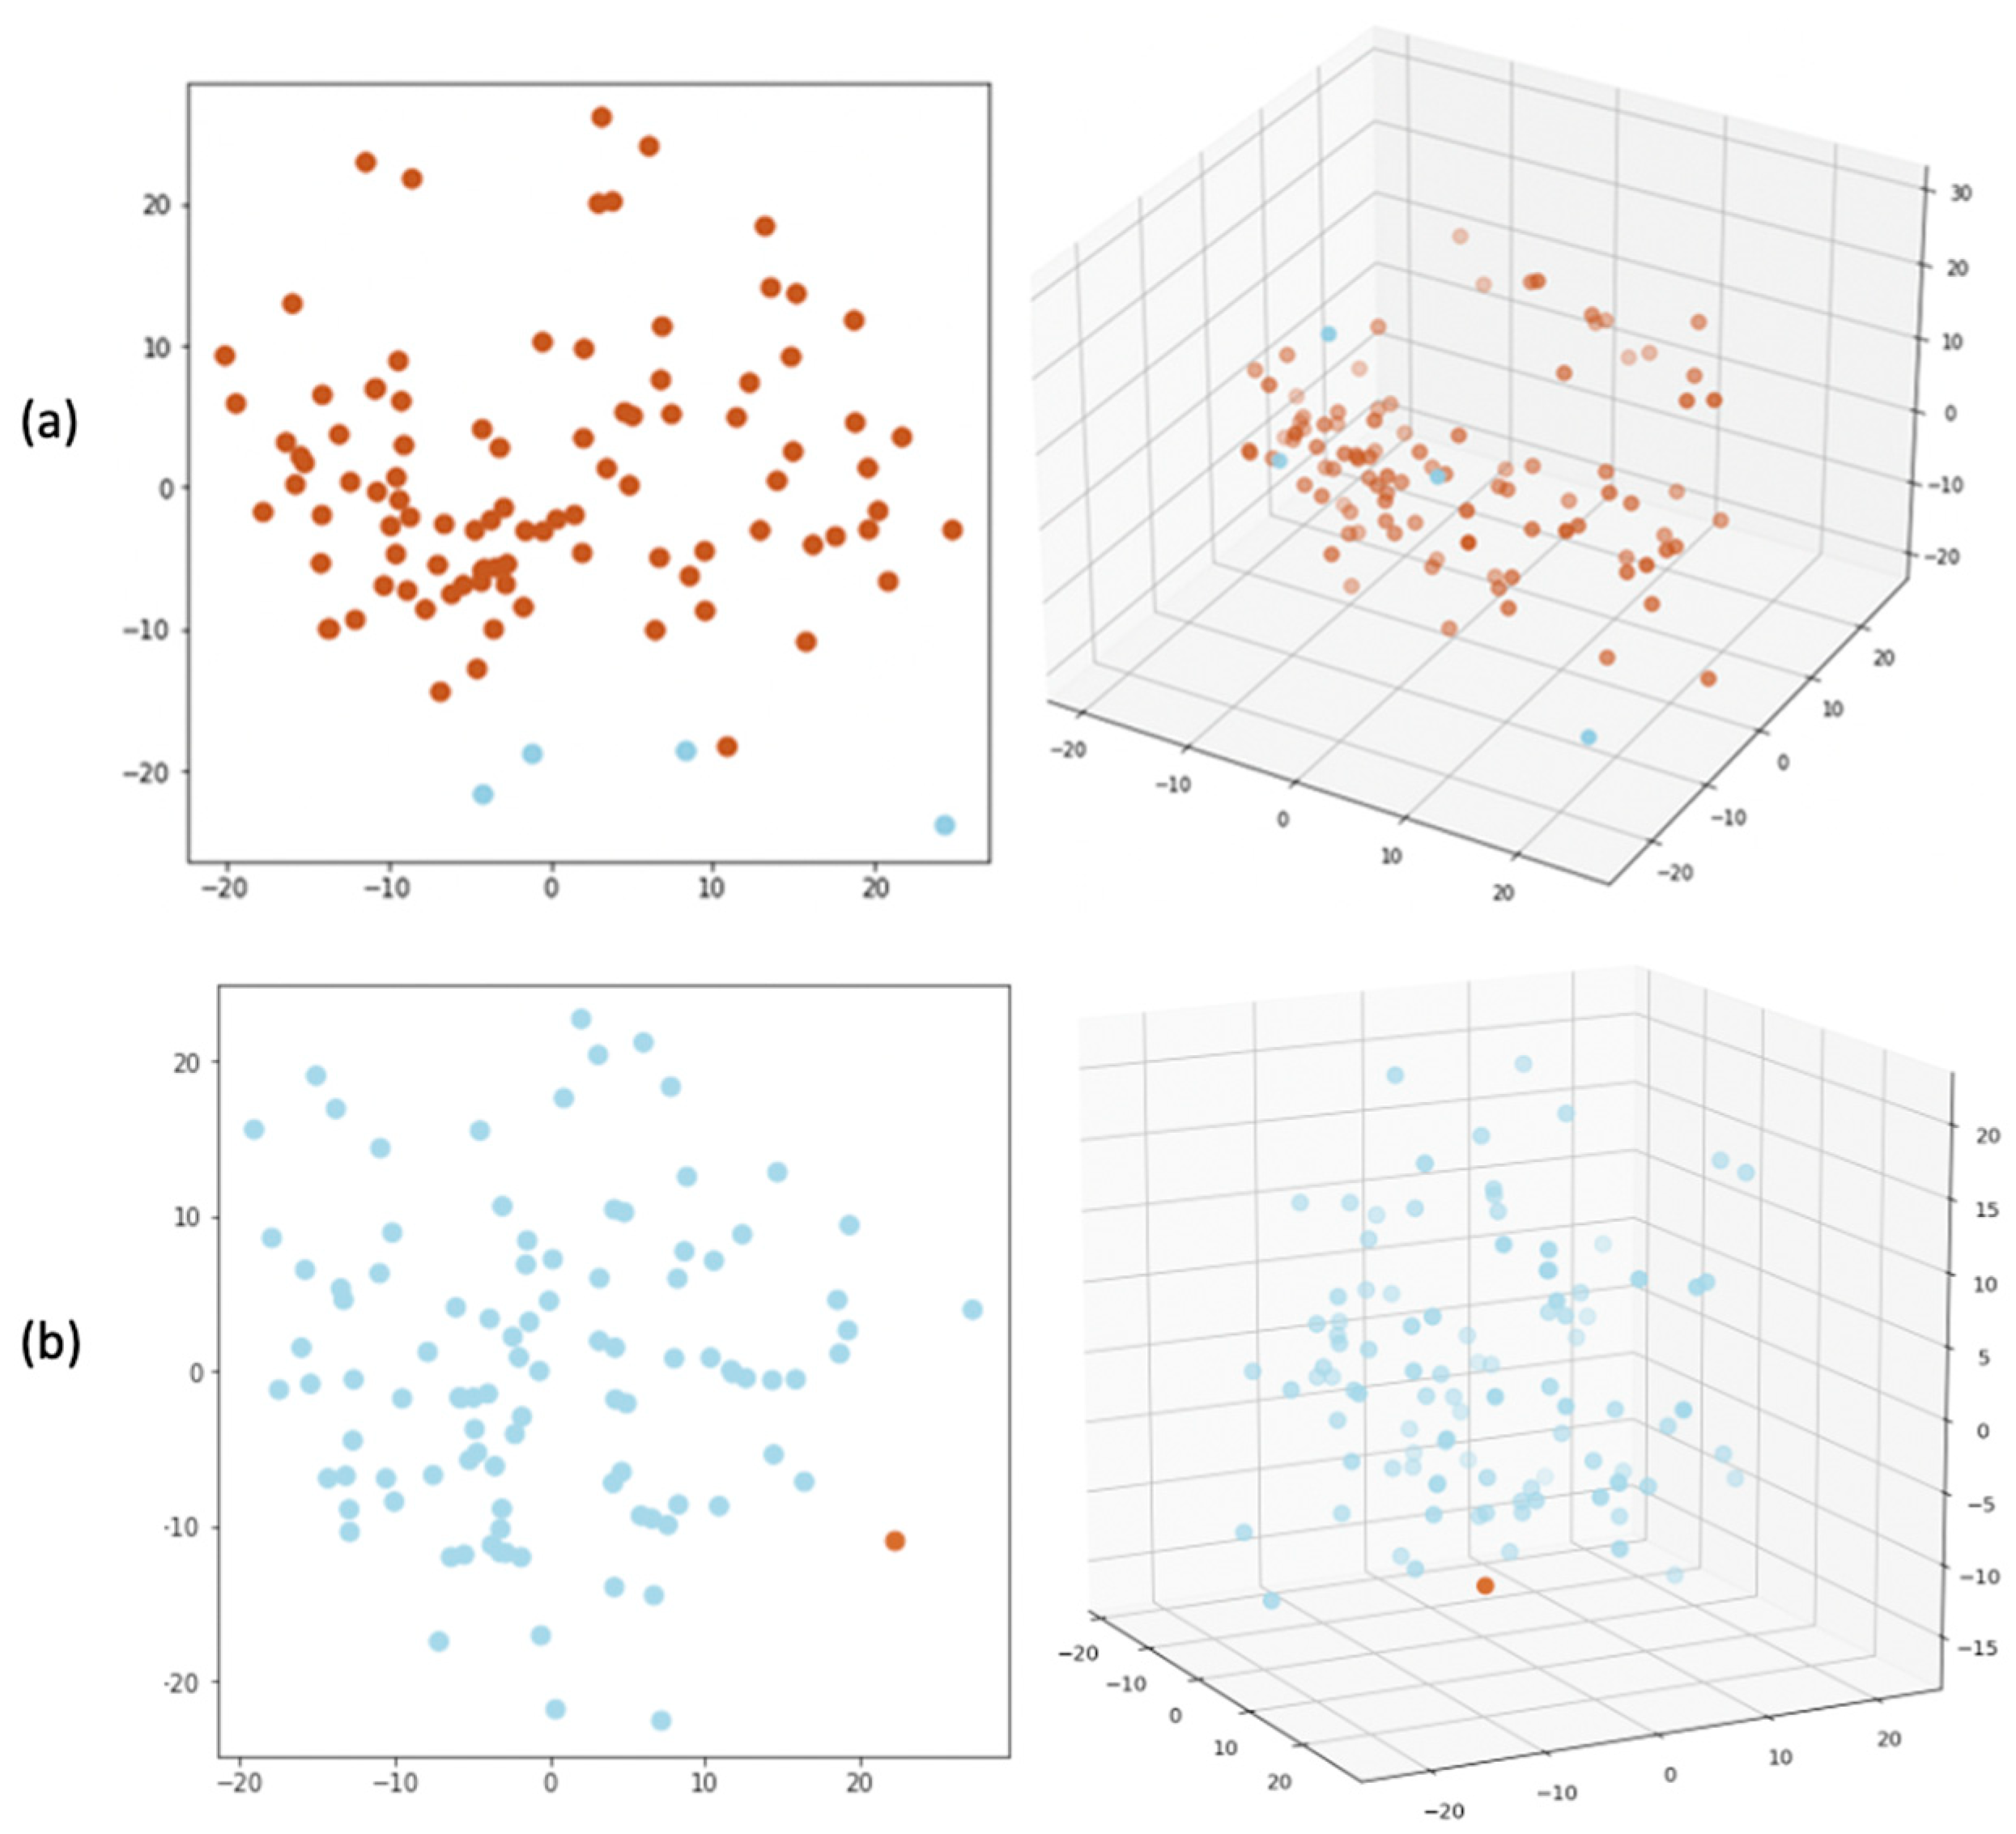
6.1. Data Analysis Using SOM Map
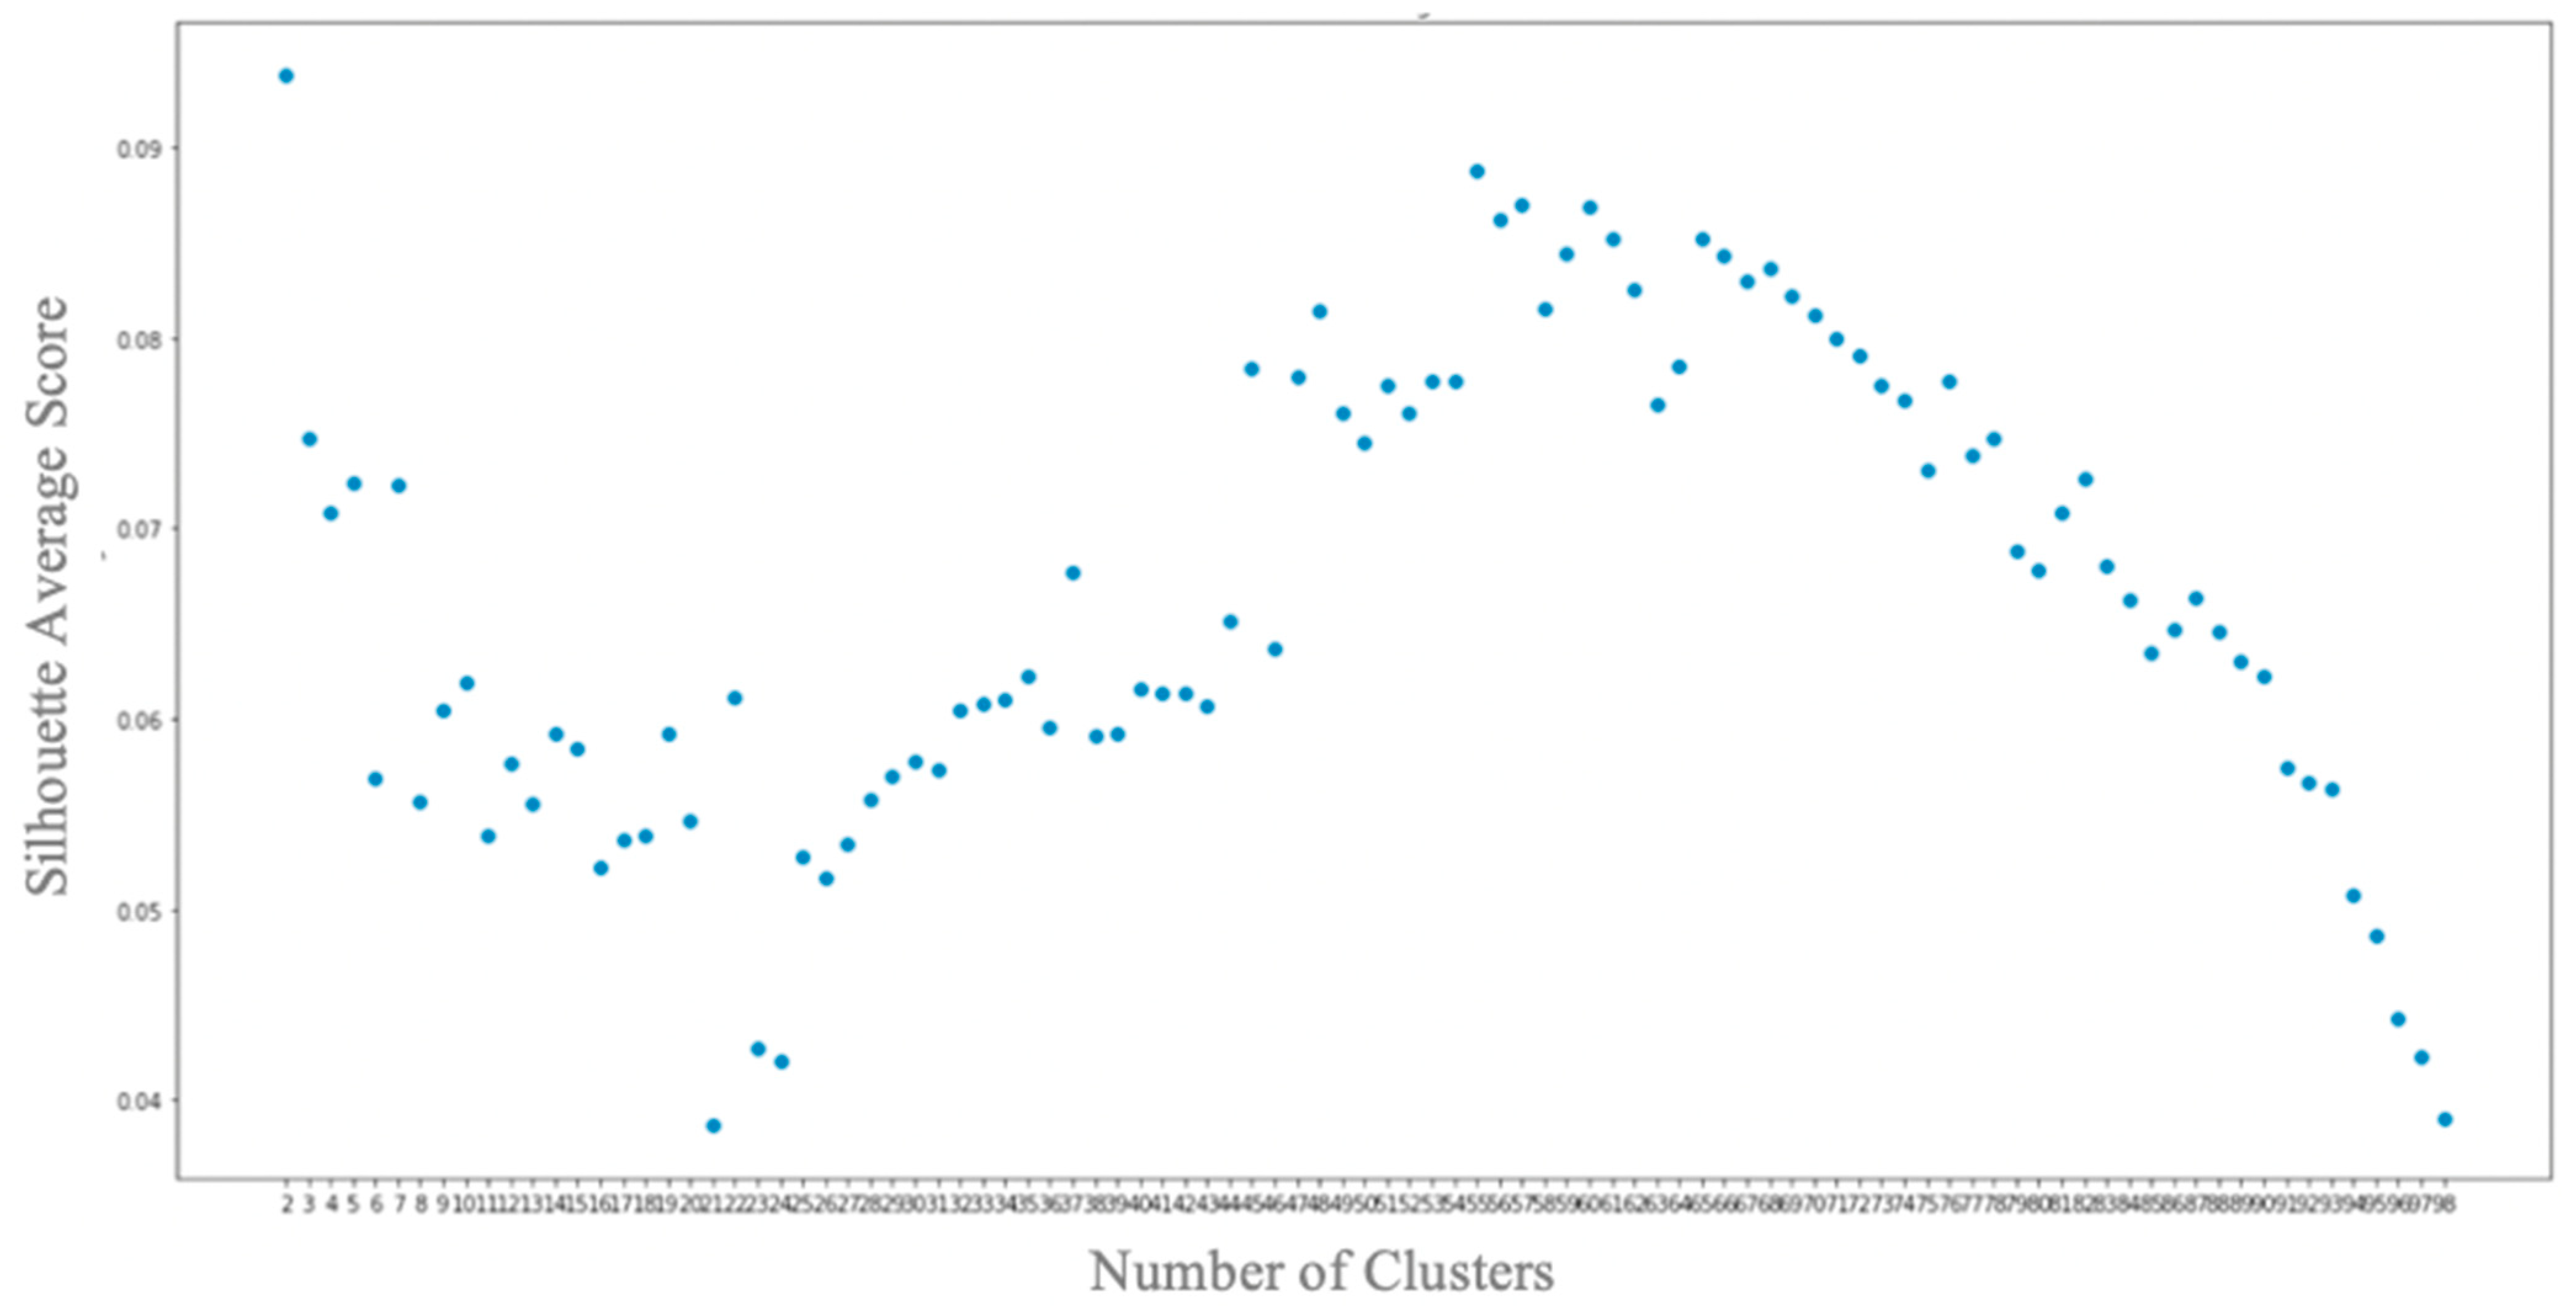
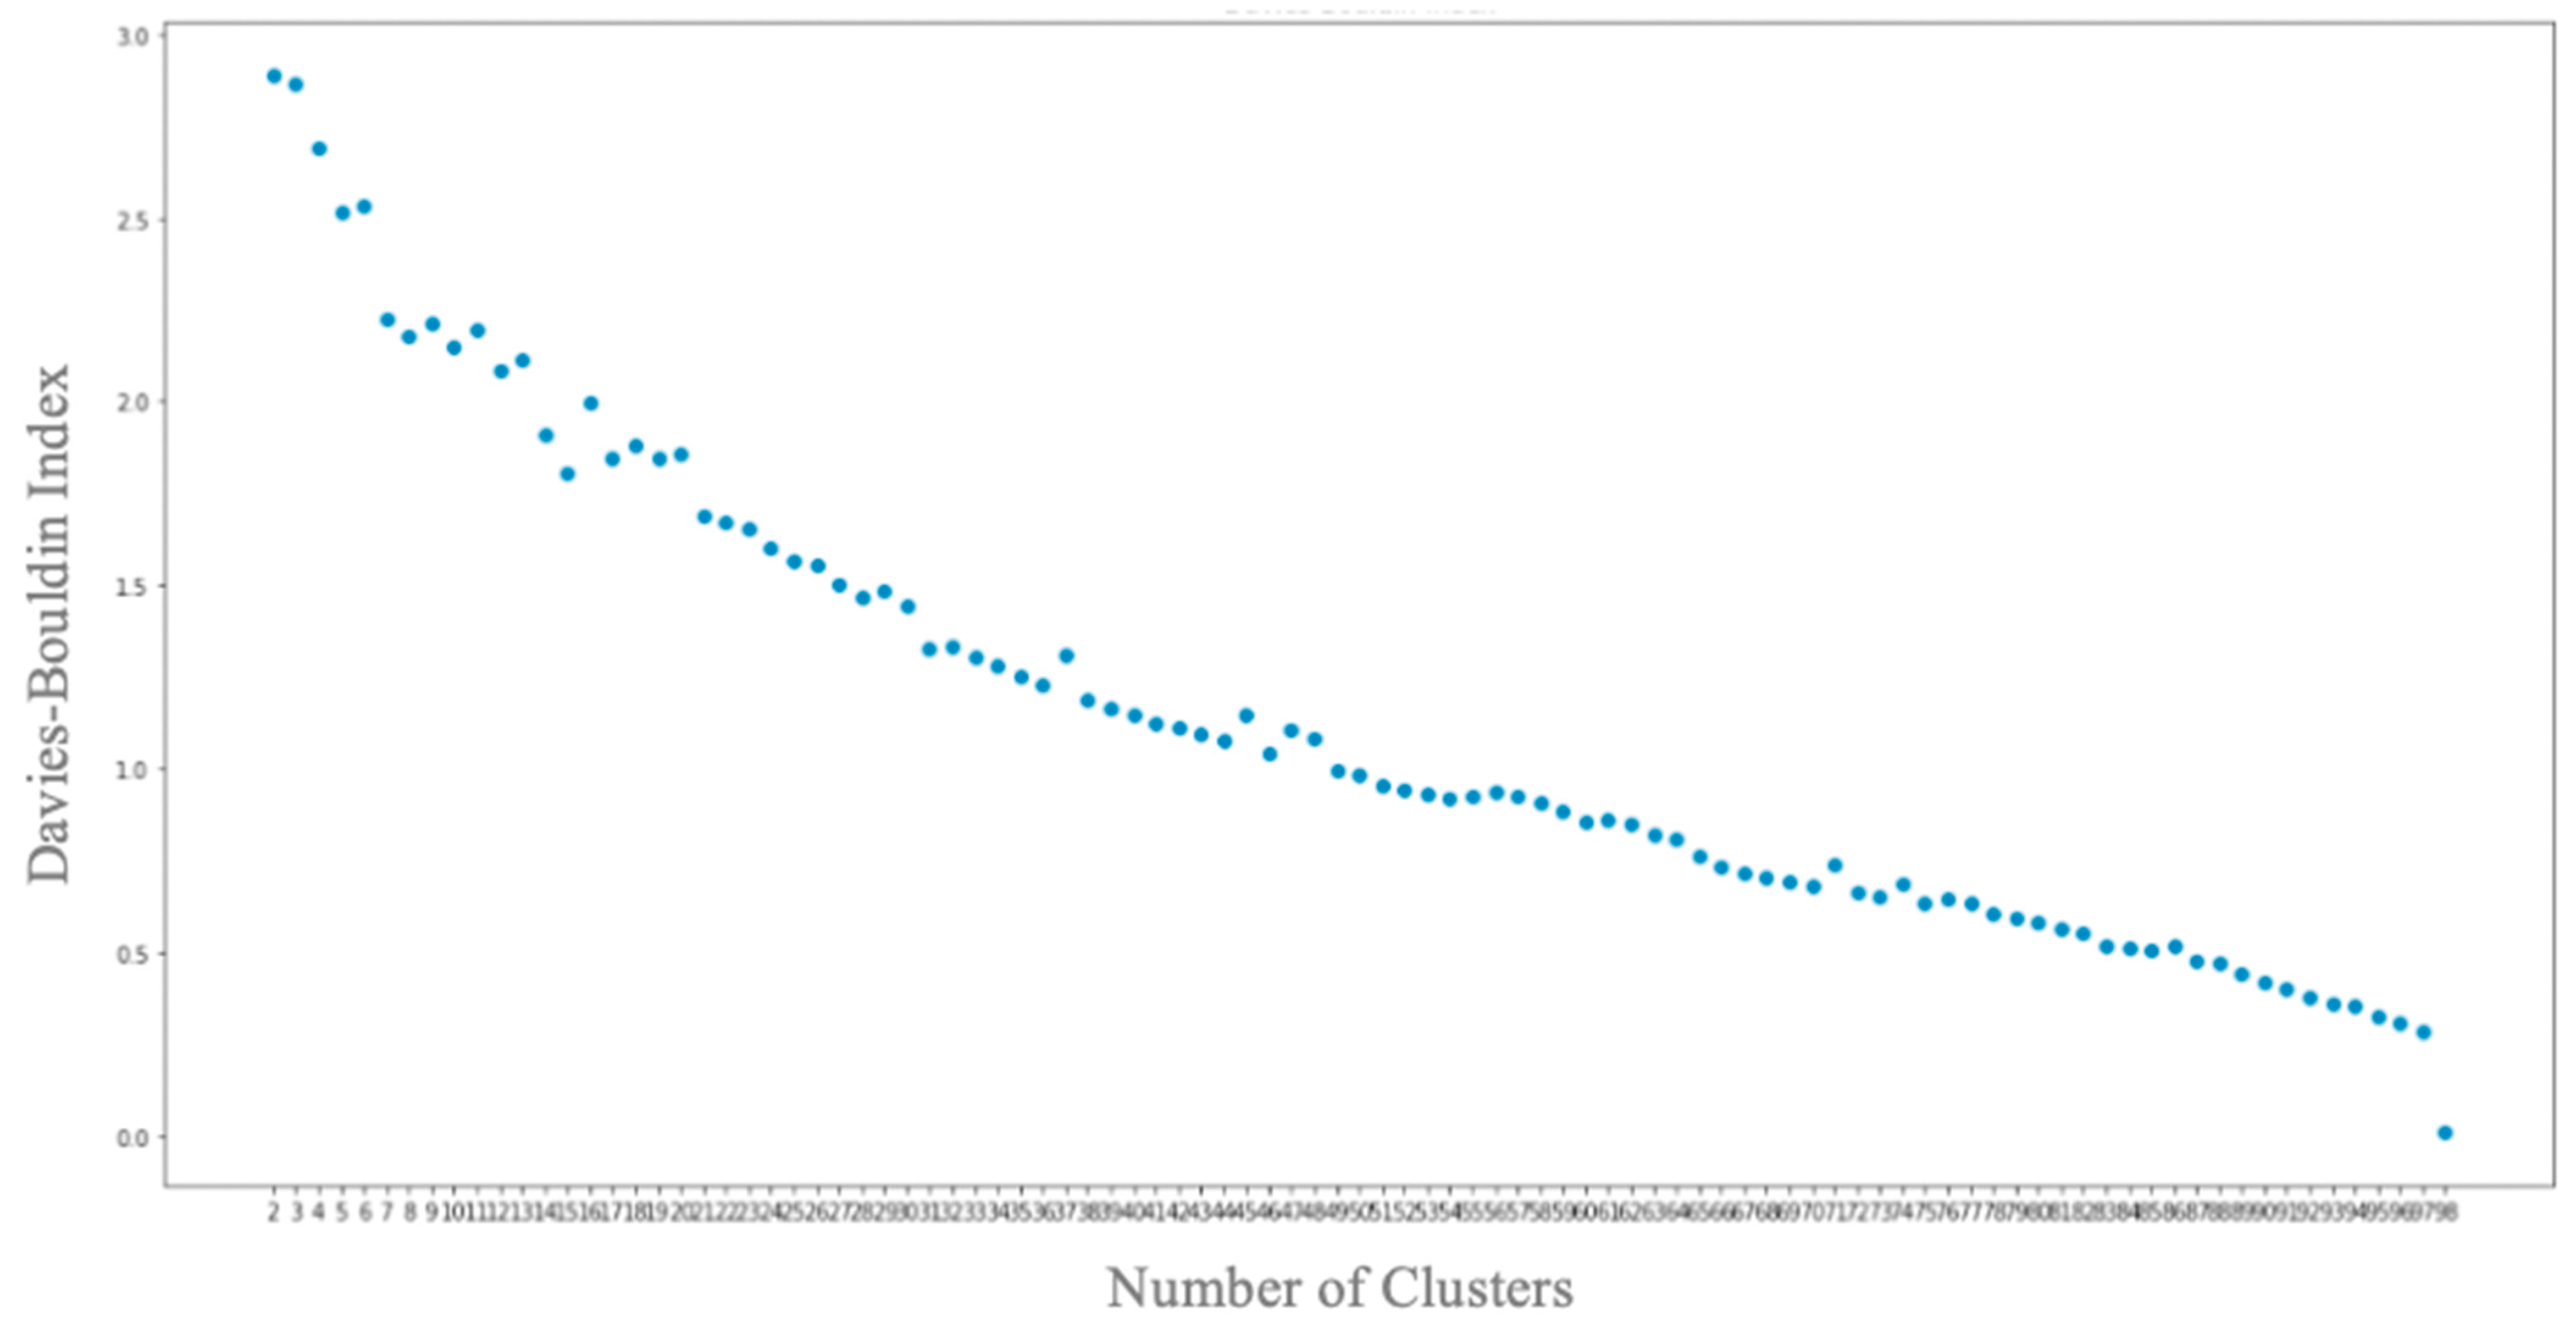
6.2. Data Analysis Using Unsupervised Clustering Techniques
7. Conclusions and Future Work
Author Contributions
Funding
Institutional Review Board Statement
Informed Consent Statement
Data Availability Statement
Conflicts of Interest
References
- Maureen. What Is Behavioral Biometric Authentication? 1Kosmos. 2022. Available online: https://www.1kosmos.com/biometric-authentication/what-is-behavioral-biometrics-authentication/ (accessed on 25 February 2023).
- Thomas, P.A.; Mathew, K.P. A Broad Review on Non-Intrusive Active User Authentication in Biometrics. J. Ambient. Intell. Human Comput. 2023, 14, 339–360. [Google Scholar] [CrossRef] [PubMed]
- Leiva, L.A.; Arapakis, I.; Iordanou, C. My Mouse, My Rules: Privacy Issues of Behavioral User Profiling via Mouse Tracking. In Proceedings of the 2021 Conference on Human Information Interaction and Retrieval, 51–61. CHIIR ‘21, Canberra, ACT, Australia, 14–19 March 2021; Association for Computing Machiner: New York, NY, USA, 2021. [Google Scholar] [CrossRef]
- Kaklauskas, A. Web-based Biometric Computer Mouse Advisory System to Analyze a User’s Emotions and Work Productivity. In Biometric and Intelligent Decision Making Support; Kaklauskas, A., Ed.; Intelligent Systems Reference Library; Springer International Publishing: Cham, Switzerland, 2014; Volume 81, pp. 137–173. [Google Scholar] [CrossRef]
- Katerina, T.; Nicolaos, P. Mouse behavioral patterns and keystroke dynamics in End-User Development: What can they tell us about users’ behavioral attributes? Comput. Hum. Behav. 2018, 83, 288–305. [Google Scholar] [CrossRef]
- Rahman, R.U.; Tomar, D.S. Threats of price scraping on e-commerce websites: Attack model and its detection using neural network. J. Comput. Virol. Hacking Tech. 2020, 17, 75–89. [Google Scholar] [CrossRef]
- Nick, R. How Attackers Use Request Bots to Bypass Your Bot Mitigation Solution. Security Boulevard (Blog). 2021. Available online: https://securityboulevard.com/2021/07/how-attackers-use-request-bots-to-bypass-your-bot-mitigation-solution/ (accessed on 14 June 2022).
- Chu, Z.; Gianvecchio, S.; Wang, H. Bot or Human? A Behavior-Based Online Bot Detection System. In From Database to Cyber Security: Essays Dedicated to Sushil Jajodia on the Occasion of His 70th Birthday; Pierangela, S., Indrajit, R., Indrakshi, R., Eds.; Lecture Notes in Computer Science; Springer International Publishing: Cham, Switzerland, 2018; pp. 432–449. [Google Scholar] [CrossRef]
- Sadeghpour, S.; Vlajic, N. ReMouse-Mouse Dynamic Dataset; IEEE: New York, NY, USA, 2022; Available online: https://ieee-dataport.org/documents/remouse-mouse-dynamic-dataset (accessed on 24 August 2022).
- Jaiswal, A.K.; Tiwari, P.; Hossain, M.S. Predicting users’ behavior using mouse movement information: An information foraging theory perspective. Neural Comput. Appl. 2020, 1–14. [Google Scholar] [CrossRef]
- Kirsh, I.; Joy, M. Exploring Pointer Assisted Reading (PAR): Using Mouse Movements to Analyze Web Users’ Reading Behaviors and Patterns. In HCI International 2020-Late Breaking Papers: Multimodality and Intelligence; Constantine, S., Masaaki, K., Helmut, D., Lauren, R.-J., Eds.; Lecture Notes in Computer Science; Springer International Publishing: Cham, Switzerland, 2020; pp. 156–173. [Google Scholar] [CrossRef]
- Chong, P.; Elovici, Y.; Binder, A. User Authentication Based on Mouse Dynamics Using Deep Neural Networks: A Comprehensive Study. IEEE Trans. Inf. Forensics Secur. 2019, 15, 1086–1101. [Google Scholar] [CrossRef]
- Hu, T.; Niu, W.; Zhang, X.; Liu, X.; Lu, J.; Liu, Y. An Insider Threat Detection Approach Based on Mouse Dynamics and Deep Learning. Secur. Commun. Netw. 2019, 2019, 1–12. [Google Scholar] [CrossRef]
- Kaixin, W.; Liu, H.; Wang, B.; Hu, S.; Song, J. A User Authentication and Identification Model Based on Mouse Dynamics. In Proceedings of the 6th International Conference on Information Engineering, online, 19–20 November 2022; 2017; pp. 1–6. [Google Scholar]
- Yildirim, M.; Anarim, E. Novel Feature Extraction Methods for Authentication via Mouse Dynamics with Semi-Supervised Learning. In Proceedings of the 2019 Innovations in Intelligent Systems and Applications Conference (ASYU), Izmir, Turkey, 31 October–2 November 2019; 2020; pp. 1–6. [Google Scholar] [CrossRef]
- Antal, M.; Fejer, N.; Buza, K. SapiMouse: Mouse Dynamics-based User Authentication Using Deep Feature Learning. In Proceedings of the 2021 IEEE 15th International Symposium on Applied Computational Intelligence and Informatics (SACI), Timisoara, Romania, 19–21 May 2021; pp. 61–66. [Google Scholar] [CrossRef]
- Antal, M.; Denes-Fazakas, L. User Verification Based on Mouse Dynamics: A Comparison of Public Data Sets. In Proceedings of the 2019 IEEE 13th International Symposium on Applied Computational Intelligence and Informatics (SACI), Timisoara, Romania, 23–31 May 2019; pp. 143–148. [Google Scholar] [CrossRef]
- Antal, M.; Fejér, N. Mouse dynamics based user recognition using deep learning. Acta Univ. Sapientiae Inform. 2020, 12, 39–50. [Google Scholar] [CrossRef]
- Yildirim, M.; Anarim, E. Mitigating insider threat by profiling users based on mouse usage pattern: Ensemble learning and frequency domain analysis. Int. J. Inf. Secur. 2021, 21, 239–251. [Google Scholar] [CrossRef]
- Acien, A.; Morales, A.; Fierrez, J.; Vera-Rodriguez, R. BeCAPTCHA-Mouse: Synthetic mouse trajectories and improved bot detection. Pattern Recognit. 2022, 127, 108643. [Google Scholar] [CrossRef]
- Iliou, C.; Kostoulas, T.; Tsikrika, T.; Katos, V.; Vrochidis, S.; Kompatsiaris, I. Detection of Advanced Web Bots by Combining Web Logs with Mouse Behavioural Biometrics. Digit. Threat. Res. Pract. 2021, 2, 1–26. [Google Scholar] [CrossRef]
- Wei, A.; Zhao, Y.; Cai, Z. A Deep Learning Approach to Web Bot Detection Using Mouse Behavioral Biometrics. In Biometric Recognition; Zhenan, S., Ran, H., Jianjiang, F., Shiguang, S., Zhenhua, G., Eds.; Lecture Notes in Computer Science; Springer International Publishing: Cham, Switzerland, 2019; pp. 388–395. [Google Scholar] [CrossRef]
- Rahman, R.U.; Tomar, D.S. New biostatistics features for detecting web bot activity on web applications. Comput. Secur. 2020, 97, 102001. [Google Scholar] [CrossRef]
- Chuda, D.; Peter, K.; Jozef, T. Mouse Clicks Can Recognize Web Page Visitors! In Proceedings of the 24th International Conference on World Wide Web, Florence, Italy, 18–22 May 2015; pp. 21–22. [Google Scholar]
- Niu, H.; Chen, J.; Zhang, Z.; Cai, Z. Mouse Dynamics Based Bot Detection Using Sequence Learning. In Biometric Recognition; Jianjiang, F., Junping, Z., Manhua, L., Yuchun, F., Eds.; Lecture Notes in Computer Science; Springer International Publishing: Cham, Switzerland, 2021; pp. 49–56. [Google Scholar] [CrossRef]
- Rahman, R.U.; Tomar, D.S. A new web forensic framework for bot crime investigation. Forensic Sci. Int. Digit. Investig. 2020, 33, 300943. [Google Scholar] [CrossRef]
- Solano, J.; Lopez, C.; Esteban, R.; Alejandra, C.; Lizzy, T.; Martin, O. SCRAP: Synthetically Composed Replay Attacks vs. Adversarial Machine Learning Attacks against Mouse-Based Biometric Authentication. In Proceedings of the 13th ACM Workshop on Artificial Intelligence and Security, Virtual Event, USA, 13 November 2020; pp. 37–47. [Google Scholar]
- Fülöp, Á.; Kovács, L.; Kurics, T.; Windhager-Pokol, E. Balabit Mouse Dynamics Challenge Data Set. 2016. Available online: https://github.com/balabit/Mouse-Dynamics-Challenge (accessed on 14 June 2022).
- Kılıç, A.A.; Yıldırım, M.; Anarım, E. Bogazici mouse dynamics dataset. Data Brief 2021, 36, 107094. [Google Scholar] [CrossRef] [PubMed]
- Leiva, L.A.; Arapakis, I. The Attentive Cursor Dataset. Front. Hum. Neurosci. 2020, 14, 565664. [Google Scholar] [CrossRef]
- Antal, M. Sapimouse. Python. 2021. Available online: https://github.com/margitantal68/sapimouse (accessed on 14 June 2022).
- Shen, C.; Cai, Z.; Guan, X. Continuous authentication for mouse dynamics: A pattern-growth approach. In Proceedings of the IEEE/IFIP International Conference on Dependable Systems and Networks (DSN 2012), Boston, MA, USA, 25–28 June 2012; pp. 1–12. [Google Scholar] [CrossRef]
- Karim, M. Hasanuzzaman A Study on Mouse Movement Features to Identify User. Sci. Res. J. 2020, 8, 77–82. [Google Scholar] [CrossRef]
- Django REST Framework. 2011. Available online: https://www.django-rest-framework.org/ (accessed on 14 June 2022).
- INFORMS. A Measure of Distance between Time Series: Dynamic Time Warping. INFORMS. 2022. Available online: https://www.informs.org/Publications/OR-MS-Tomorrow/A-measure-of-distance-between-time-series-Dynamic-Time-Warping (accessed on 21 June 2022).
- Morse, G. Programmatic Identification of Support/Resistance Trend Lines with Python. Medium. 2019. Available online: https://towardsdatascience.com/programmatic-identification-of-support-resistance-trend-lines-with-python-d797a4a90530 (accessed on 21 June 2022).
- Simonyan, K.; Andrew, Z. Very Deep Convolutional Networks for Large-Scale Image Recognition. arXiv 2014, arXiv:1409.1556. [Google Scholar] [CrossRef]
- Keras-Applications/Vgg16.Py at Master Keras-Team/Keras-Applications. 2020. GitHub. Available online: https://github.com/keras-team/keras-applications (accessed on 21 June 2022).
- Liu, F.; Wang, Y.; Wang, F.-C.; Zhang, Y.-Z.; Lin, J. Intelligent and Secure Content-Based Image Retrieval for Mobile Users. IEEE Access 2019, 7, 119209–119222. [Google Scholar] [CrossRef]
- Hands-on Transfer Learning with Keras and the VGG16 Model. Available online: https://www.learndatasci.com/tutorials/hands-on-transfer-learning-keras/ (accessed on 21 June 2022).
- Brownlee, J. Transfer Learning in Keras with Computer Vision Models. Machine Learning Mastery (Blog). 2019. Available online: https://machinelearningmastery.com/how-to-use-transfer-learning-when-developing-convolutional-neural-network-models/ (accessed on 21 June 2022).
- Deng, J.; Dong, W.; Socher, R.; Li, L.-J.; Li, K.; Fei-Fei, L. ImageNet: A large-scale hierarchical image database. In Proceedings of the 2009 IEEE Conference on Computer Vision and Pattern Recognition, Miami, FL, USA, 20–25 June 2009; pp. 248–255. [Google Scholar] [CrossRef] [Green Version]
- Keras, T. Keras Documentation: Keras Applications. 21 June 2022. Available online: https://keras.io/api/applications/#vgg16 (accessed on 25 February 2023).
- Cunningham, P. Dimension Reduction. In Machine Learning Techniques for Multimedia: Case Studies on Organization and Retrieval, Matthieu Cord and Pádraig Cunningham; Cognitive Technologies; Springer: Berlin/Heidelberg, Germany, 2008; pp. 91–112. [Google Scholar] [CrossRef]
- Salgado, C.M.; Vieira, S.M. Machine Learning for Patient Stratification and Classification Part 2: Unsupervised Learning with Clustering. In Leveraging Data Science for Global Health; Leo Anthony, C., Maimuna, S.M., Patricia, O., Juan Sebastian, O., Kenneth, E.P., Melek., S., Eds.; Springer International Publishing: Cham, Switzerland, 2020; pp. 151–168. [Google Scholar] [CrossRef]
- Penn, B.S. Using self-organizing maps to visualize high-dimensional data. Comput. Geosci. 2005, 31, 531–544. [Google Scholar] [CrossRef]
- Moosavi, V. Sevamoo/SOMPY. Jupyter Notebook. 2014. Available online: https://github.com/sevamoo/SOMPY (accessed on 21 June 2022).
- Gupta, R. Deeper Dive into Self-Organizing Maps (SOMs). Water Programming: A Collaborative Research Blog (Blog). 2020. Available online: https://waterprogramming.wordpress.com/2020/07/20/deeper-dive-into-self-organizing-maps-soms/ (accessed on 21 June 2022).
- Marzouki, K.; Takeshi, Y. Novel Algorithm for Eliminating Folding Effect in Standard SOM. In ESANN; Citeseer: Princeton, NJ, USA, 2005; pp. 563–570. [Google Scholar]
- Dittenbach, M.; Dieter, M.; Andreas, R. The Growing Hierarchical Self-Organizing Map. In Proceedings of the IEEE-INNS-ENNS International Joint Conference on Neural Networks. IJCNN 2000. Neural Computing: New Challenges and Perspectives for the New Millennium, Como, Italy, 27 July 2000; IEEE: Piscataway, NJ, USA, 2000; pp. 15–19. [Google Scholar]
- Deng, D.; Kasabov, N. On-line pattern analysis by evolving self-organizing maps. Neurocomputing 2003, 51, 87–103. [Google Scholar] [CrossRef]
- Sklearn.Cluster.KMeans. Scikit-Learn. Available online: https://scikit-learn/stable/modules/generated/sklearn.cluster.KMeans.html (accessed on 22 June 2022).
- Sklearn.Cluster.AgglomerativeClustering. Scikit-Learn. Available online: https://scikit-learn/stable/modules/generated/sklearn.cluster.AgglomerativeClustering.html (accessed on 21 June 2022).
- Davies, D.L.; Bouldin, D.W. A Cluster Separation Measure. IEEE Trans. Pattern Anal. Mach. Intell. 1979, 2, 224–227. [Google Scholar] [CrossRef]
- Georgios, D. Geodra/Articles. Jupyter Notebook. 2019. Available online: https://github.com/geodra/Articles/blob/85a4d13e060d45129af7b62174ea28619f4d9cf8/Davies-Bouldin%20Index%20vs%20Silhouette%20Analysis%20vs%20Elbow%20Method%20Selecting%20the%20optimal%20number%20of%20clusters%20for%20KMeans%20clustering.ipynb (accessed on 22 June 2022).
- Aguinis, H.; Villamor, I.; Ramani, R.S. MTurk Research: Review and Recommendations. J. Manag. 2020, 47, 823–837. [Google Scholar] [CrossRef]


| Name | Ref. | # User | Data Collection | Period of Observing Each User’s Activity | Action | Session Fields | Task | Repeat Sessions |
|---|---|---|---|---|---|---|---|---|
| Balabit | [28] | 10 | N/A | N/A | Mouse movement, point click, drag and drop | Timestamp, coordinates, pressed button, state of the mouse | Non-guided | No |
| Bogazici | [29] | 24 | 1 month | 2550 h | Mouse movement, point click, drag and drop | Timestamp, coordinates, button, state of the mouse, application window name | Non-guided | No |
| The Attentive Cursor | [30] | 3K | N/A | 2 h | Mouse movement, point click | Timestamp, coordinates, event name, XPath of the DOM element that relates to the event, the DOM element attributes (if any) | Guided | No |
| SapiMouse | [31] | 120 | N/A | 4 min of each user’s activity | Mouse movement, point click, drag and drop | Timestamp, coordinates, button, state of the mouse | Guided | No |
| Chao Shen | [32] | 28 | 2 months | 30 sessions of 30 min | Mouse movement, point click, drag and drop | Timestamp, action type, application type, screen area, window position | Non-guided | No |
| DFL | [17] | 21 | 7 months | Daily users’ mouse activities for 7 months | Mouse movement, point click, drag and drop | Timestamp, coordinates, button, state of the mouse | Non-guided | No |
| ReMouse | [9] | 100 | 2 Days | 5 min of each user’s activity | Mouse movement, point click, drag and drop | User ID, session ID, timestamp, coordinates, button, event type, state of the mouse, speed, screen size | Guided | Yes |
| Users | Sessions | Min DTW Normalized Cumulative Distance | Users | Sessions | Min DTW Normalized Cumulative Distance |
|---|---|---|---|---|---|
| 0 | 7,8 | 591.6516 | 50 | 2,3 | 303.9826 |
| 1 | 5,6 | 295.2985 | 51 | 4,5 | 291.6989 |
| 2 | 35,36 | 147.0755 | 52 | 7,8 | 272.5094 |
| 3 | 13,14 | 192.1207 | 53 | 13,14 | 196.9675 |
| 4 | 9,10 | 180.0245 | 54 | 2,3 | 1490.494 |
| 5 | 4,5 | 398.1191 | 55 | 13,14 | 421.657 |
| 6 | 8,9 | 272.4871 | 56 | 11,12 | 276.5871 |
| 7 | 19,20 | 293.7516 | 57 | 8,9 | 1387.489 |
| 8 | 17,18 | 192.9701 | 58 | 8,9 | 634.1661 |
| 9 | 11,12 | 345.1108 | 59 | 6,7 | 777.4243 |
| 10 | 5,6 | 308.2797 | 60 | 6,7 | 174.8066 |
| 11 | 3,4 | 572.3161 | 61 | 17,18 | 232.3106 |
| 12 | 2,3 | 107.556 | 62 | 27,28 | 126.1892 |
| 13 | 21,22 | 262.7717 | 63 | 3,4 | 1112.61 |
| 14 | 4,5 | 297.0564 | 64 | 33,34 | 142.0399 |
| 15 | 2,3 | 287.2074 | 65 | 9,10 | 301.4555 |
| 16 | 9,10 | 116.766 | 66 | 33,34 | 199.8493 |
| 17 | 10,11 | 247.4575 | 67 | 14,15 | 137.9862 |
| 18 | 12,13 | 275.4263 | 68 | 3,4 | 1728.454 |
| 19 | 9,10 | 371.7259 | 69 | 4,5 | 427.3393 |
| 20 | 7,8 | 175.7365 | 70 | 9,10 | 1201.285 |
| 21 | 11,12 | 280.7912 | 71 | 17,18 | 126.8211 |
| 22 | 23,24 | 127.987 | 72 | 16,17 | 211.9789 |
| 23 | 7,8 | 343.7548 | 73 | 5,6 | 487.4164 |
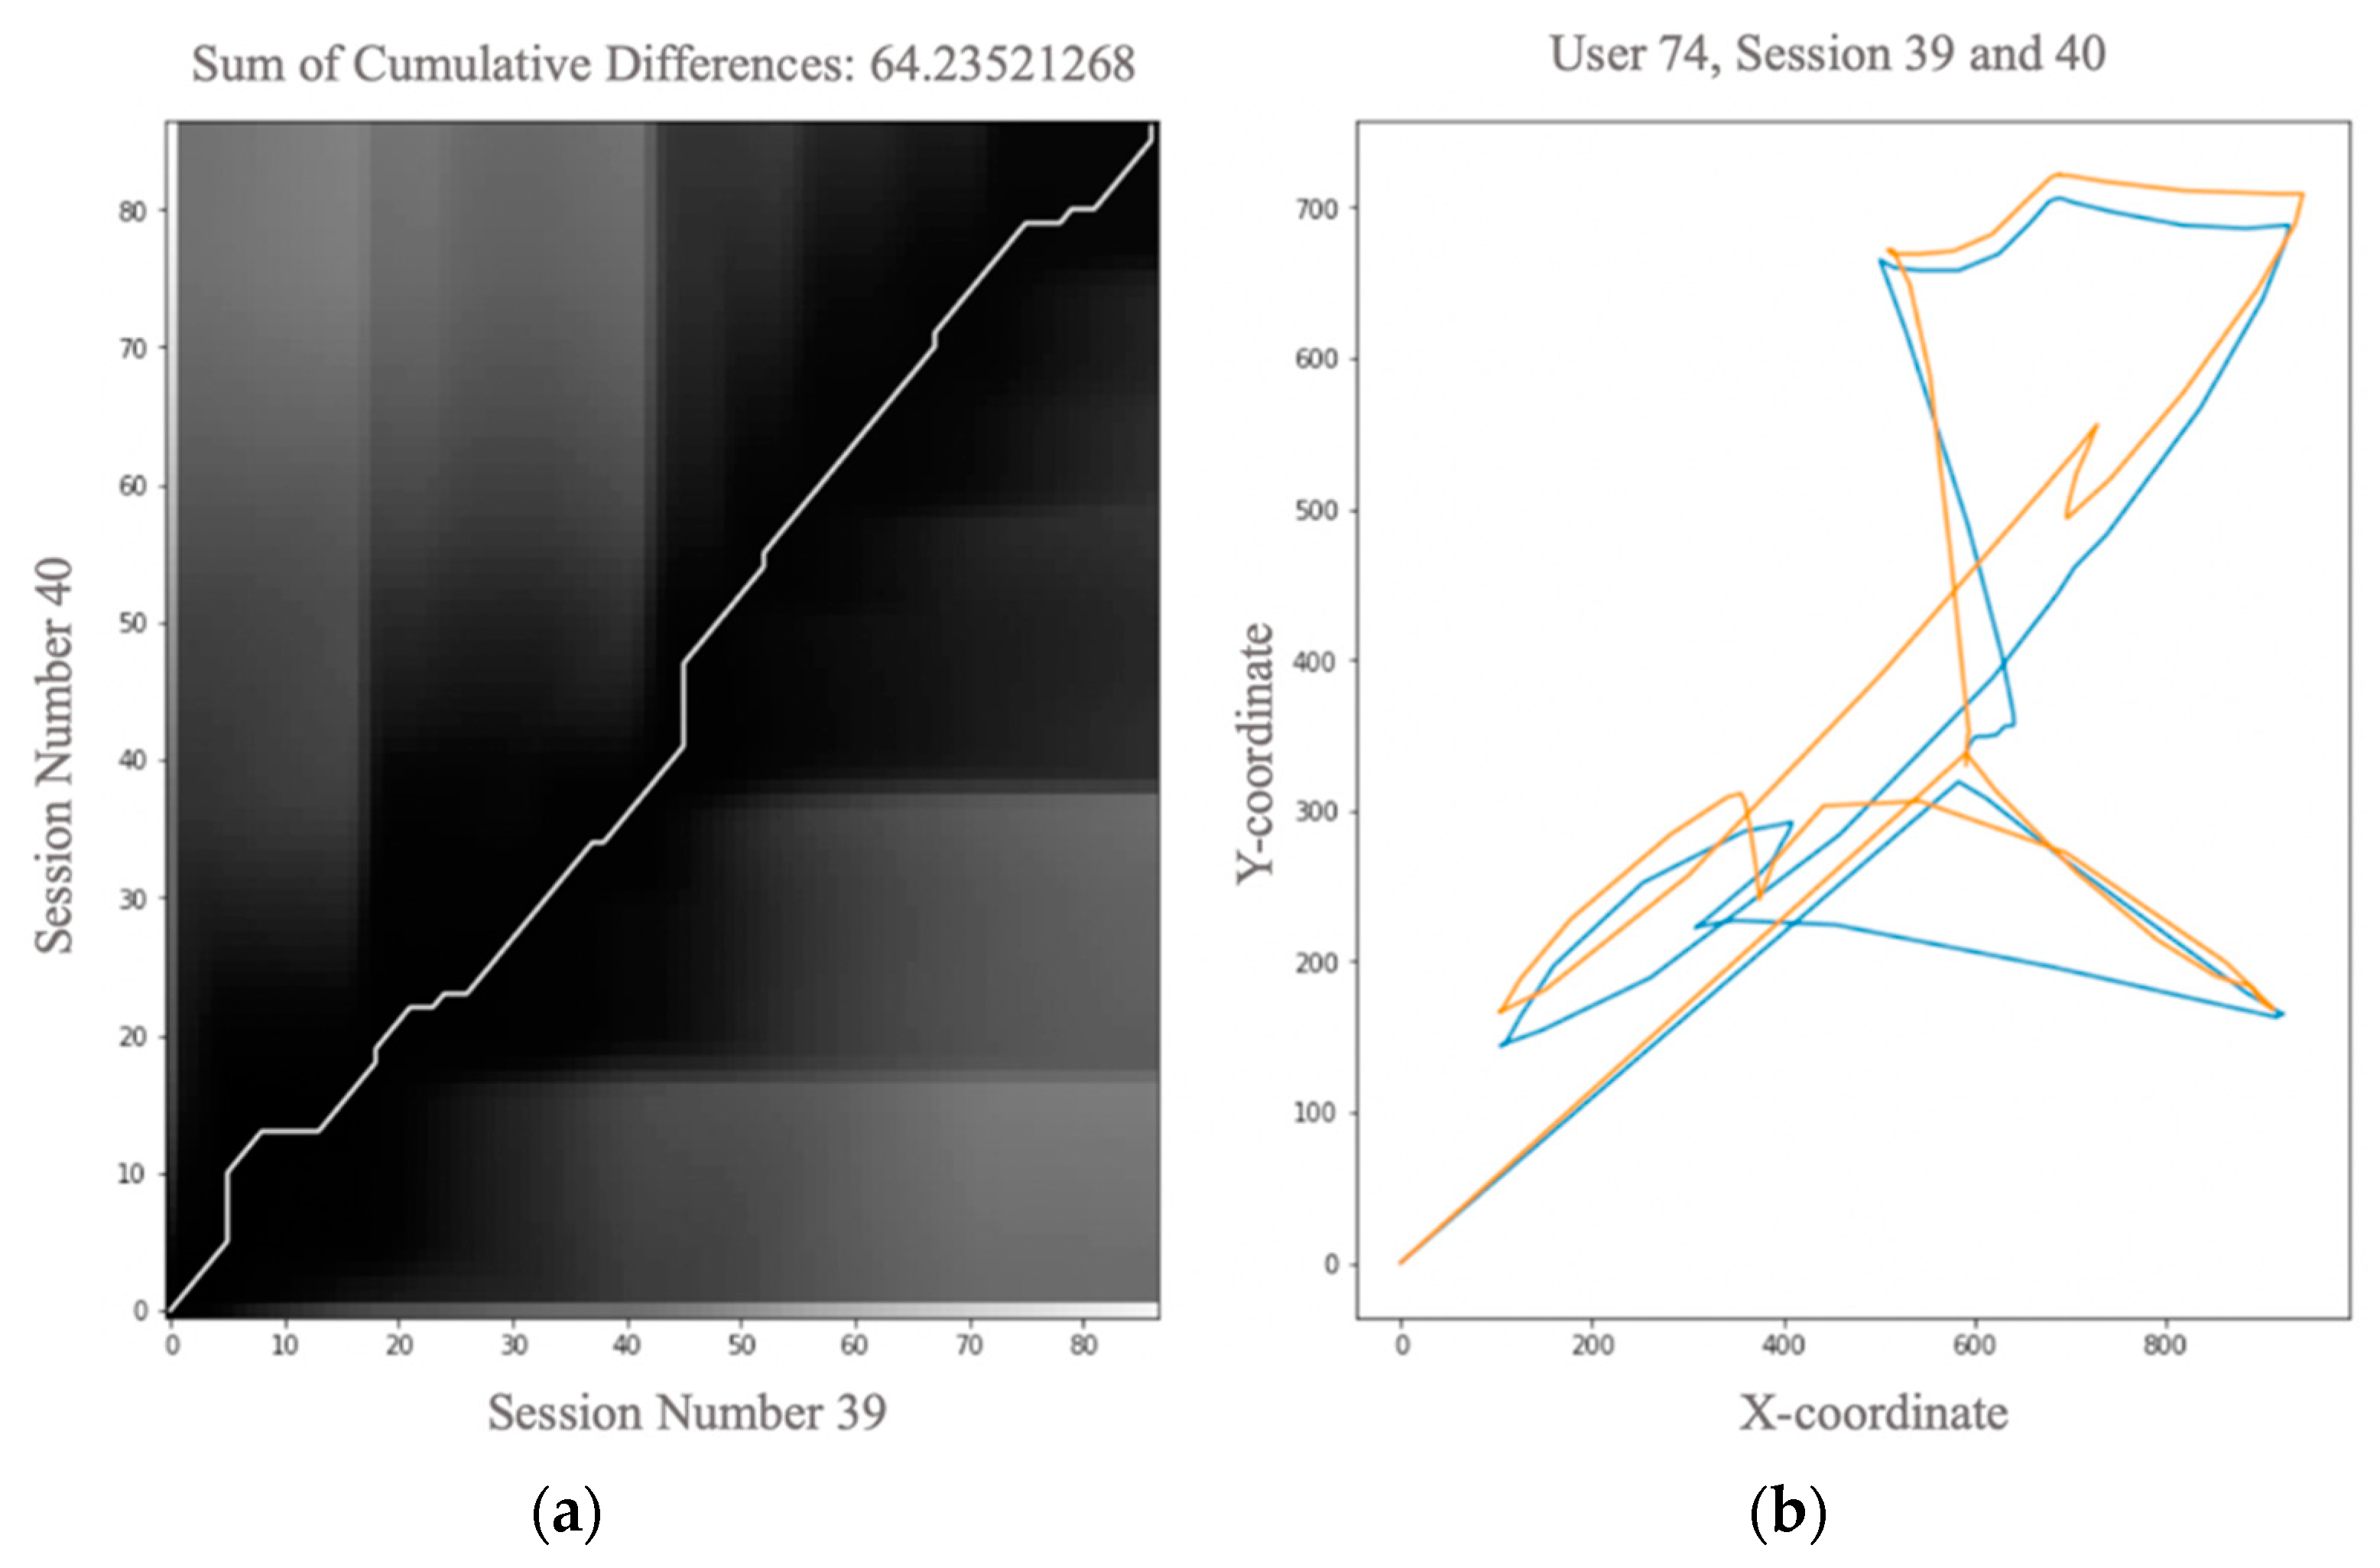
| 24 | 28,29 | 198.9364 | 74 | 39,40 | 64.23521 |
| 25 | 12,13 | 358.7146 | 75 | 24,25 | 85.11796 |
| 26 | 29,30 | 204.9529 | 76 | 8,9 | 402.6993 |
| 27 | 11,12 | 241.8954 | 77 | 3,4 | 623.3006 |
| 28 | 7,8 | 462.876 | 78 | 10,11 | 412.5679 |
| 29 | 26,27 | 110.2986 | 79 | 11,12 | 355.0567 |
| 30 | 5,6 | 210.5634 | 80 | 18,19 | 488.2605 |
| 31 | 11,12 | 203.5428 | 81 | 7,8 | 315.7737 |
| 32 | 5,6 | 213.7062 | 82 | 13,14 | 383.0098 |
| 33 | 14,15 | 258.7817 | 83 | 9,10 | 262.1923 |
| 34 | 8,9 | 503.8331 | 84 | 6,7 | 275.4376 |
| 35 | 2,3 | 241.2987 | 85 | 8,9 | 2391.673 |
| 36 | 23,24 | 210.416 | 86 | 48,49 | 174.3101 |
| 37 | 10,11 | 305.7957 | 87 | 11,12 | 422.6979 |
| 38 | 23,24 | 112.3997 | 88 | 24,25 | 113.6169 |
| 39 | 4,5 | 191.0098 | 89 | 7,8 | 354.2762 |
| 40 | 7,8 | 429.8543 | 90 | 17,18 | 134.8357 |
| 41 | 17,18 | 143.9127 | 91 | 6,7 | 299.5449 |
| 42 | 21,22 | 318.2114 | 92 | 5,6 | 792.4915 |
| 43 | 18,19 | 226.5839 | 93 | 7,8 | 292.0623 |
| 44 | 4,5 | 446.748 | 94 | 8,9 | 282.6595 |
| 45 | 6,7 | 181.1306 | 95 | 9,10 | 432.2253 |
| 46 | 6,7 | 240.4841 | 96 | 23,24 | 210.416 |
| 47 | 5,6 | 630.878 | 97 | 13,14 | 261.8753 |
| 48 | 12,13 | 294.704 | 98 | 2,3 | 753.1881 |
| 49 | 2,3 | 315.2712 | 99 | 8,9 | 386.572 |
| Min DTW | Users | Sessions |
|---|---|---|
| 21.941833 | 1 and 2 | 6 and 29 |
| Min DTW | Users | Sessions |
|---|---|---|
| 20.376812 | 1 and 1 | 16 and 28 |
Disclaimer/Publisher’s Note: The statements, opinions and data contained in all publications are solely those of the individual author(s) and contributor(s) and not of MDPI and/or the editor(s). MDPI and/or the editor(s) disclaim responsibility for any injury to people or property resulting from any ideas, methods, instructions or products referred to in the content. |
© 2023 by the authors. Licensee MDPI, Basel, Switzerland. This article is an open access article distributed under the terms and conditions of the Creative Commons Attribution (CC BY) license (https://creativecommons.org/licenses/by/4.0/).
Share and Cite
Sadeghpour, S.; Vlajic, N. ReMouse Dataset: On the Efficacy of Measuring the Similarity of Human-Generated Trajectories for the Detection of Session-Replay Bots. J. Cybersecur. Priv. 2023, 3, 95-117. https://doi.org/10.3390/jcp3010007
Sadeghpour S, Vlajic N. ReMouse Dataset: On the Efficacy of Measuring the Similarity of Human-Generated Trajectories for the Detection of Session-Replay Bots. Journal of Cybersecurity and Privacy. 2023; 3(1):95-117. https://doi.org/10.3390/jcp3010007
Chicago/Turabian StyleSadeghpour, Shadi, and Natalija Vlajic. 2023. "ReMouse Dataset: On the Efficacy of Measuring the Similarity of Human-Generated Trajectories for the Detection of Session-Replay Bots" Journal of Cybersecurity and Privacy 3, no. 1: 95-117. https://doi.org/10.3390/jcp3010007