Article

Influence of the 2020 Seismic Hazard Update on Residential Losses in Greater Montreal, Canada

Department of Civil Engineering, McGill University, Montreal, QC H3A 0C3, Canada
*
Author to whom correspondence should be addressed.
GeoHazards 2023, 4(4), 406-420; https://doi.org/10.3390/geohazards4040023
Submission received: 20 September 2023 / Revised: 18 October 2023 / Accepted: 19 October 2023 / Published: 22 October 2023
(This article belongs to the Collection Geohazard Characterization, Modeling, and Risk Assessment)

Abstract

:
Greater Montreal is situated in a region with moderate seismic activity and rests on soft ground deposits from the ancient Champlain Sea, as well as more recent alluvial deposits from the Saint Lawrence River. These deposits have the potential to amplify seismic waves, as demonstrated by past strong, and recent weak, earthquakes. Studies based on the 2015 National Seismic Hazard Model (SHM5) had estimated losses to residential buildings at 2% of their value for an event with a return period of 2475 years. In 2020, the seismic hazard model was updated (SHM6), resulting in more severe hazards for eastern Canada. This paper aims to quantify the impact of these changes on losses to residential buildings in Greater Montreal. Our exposure database includes population and buildings at the scale of dissemination areas (500–1000 inhabitants). Buildings are classified by occupancy and construction type and grouped into three building code levels based on year of construction. The value of buildings is obtained from property-valuation rolls and the content value is derived from insurance data. Damage and losses are calculated using Hazus software developed for FEMA. Losses are shown to be 53% higher than the SHM5 estimates.

1. Introduction

Several previous studies have highlighted the potential losses due to a large earthquake in the region of Montreal [1,2,3,4,5]. Indeed, the Metropolitan Community of Montreal (MMC) comprises approximately half the population of Quebec and is the second most populous city in Canada, with an average density of population around 1000 people per km2. It also ranks third among major metropolitan areas in terms of seismic activity, with an M6 earthquake occurring on average once every 200 years [6]. The MMC includes 14 regional county municipalities (RCM) divided in 6116 dissemination areas as defined by Statistics Canada (Figure 1).
In Canada, seismic hazard models have been constantly evolving since the first national seismic hazard map of 1953, which was a qualitative zonation [7,8]. In 1970, the first probabilistic map was produced for peak ground acceleration (PGA) with an exceedance probability of 40% in 50 years. In 1985, a modern probabilistic model was used to calculate PGA and peak ground velocity (PGV) with an exceedance probability of 10% in 50 years.
The next generations (2005, 2015 and 2020) provide estimates of PGA, PGV and spectral acceleration at different periods for a 2% probability level in 50 years. In 2005, site-specific spectral values and a deterministic model for the Cascadia mega-earthquake were incorporated. In 2015, a fully probabilistic model was used that includes published attenuation relations in a logic tree to sample the uncertainty in ground-motion characterization.
The last generation of the seismic hazard model (SHM6) in 2020 improves the subduction sources, adds faults, includes new attenuation functions, and increases the number of hazard products. The hazard values are pre-calculated in a continuous manner for fifteen Vs30 values. Adams et al. [6] note that the estimated hazards are significantly changed relative to those of the 2015 version. For Southeastern Canada, the values of Sa(0.2 s) and Sa(2.0 s) increase by 70 and 45%, respectively, for C class sites and a return period of 475 years due to the new ground-motion models, and for low period spectral acceleration, due to changes in the site condition terms.
Figure 2 illustrates the changes in the uniform hazard spectra for the City Hall of Montreal and for site class C (Vs30 = 450 m/s) with the different models since 2005. It shows that the largest difference is found between the two most recent models.
Most of our analyses in the region of Montreal have used the tool Hazus to calculate residential-building damage and losses, and the associated human impacts. Since 1992, this tool, developed by the Federal Emergency Management Agency (FEMA) and the National Institute of Building Sciences, has been constantly improved and used in North America and abroad to produce estimates of the human and economic consequences of earthquakes and other natural hazards [9]. For instance, Tantala et al. [10] analyzed the risk to buildings, essential facilities and humans for a set of deterministic and probabilistic scenarios in the New York/New Jersey/Connecticut Region. Field et al. [11] present loss estimates for an earthquake rupture on the recently identified Puente Hills blind-thrust fault beneath Los Angeles. Moffatt and Cova [12] performed analyses at the scale of individual lots for Salt Lake County. Hazus has also been used to perform sensitivity analyses to assess the influence of site conditions and associated soil amplification on losses in California (e.g., [13]). Kircher et al. [14] compared Hazus-estimated, and observed, damage and losses resulting from the 1994 Northridge earthquake and concluded that the direct economic losses to residential buildings were similar to those observed in residential insurance claims. Hazus was selected to perform nationwide annualized earthquake estimates in 2001, 2008 and 2016 by FEMA and represents a benchmark for similar analysis abroad [15,16,17].
This tool has also been used to perform analyses outside the USA. Bendito et al. [18] used the USGS ShakeMaps scenarios calculated for two potential earthquake events as input into Hazus to calculate losses in Mérida State, located in western Venezuela. Similar analyses were conducted in Israel at different scales [19,20], in the metropolitan area of Istanbul [21], and in the Iranian capital Tehran [22]. In Canada, the development of the Canadian version of the Hazus software, based on version 2.1 [23], has allowed Ploeger et al. [24] to apply the FEMA approach to downtown Ottawa, Canada, for a scenario earthquake of M6.5 at an epicentral distance of 15 km and depth of 10 km. In the Montreal region, several analyses were performed for residential buildings’ damage and losses, and associated human impacts, for deterministic and probabilistic scenarios (e.g., [1,5]). For these analyses, detailed soil-condition mapping, as well as an exposure model at the scale of the census dissemination areas, were compiled.
In this paper, we present the hazard, exposure and fragility models included within Hazus. The flowchart in Figure 3 describes the approach used to estimate damage and losses using both SMH-2015 and SHM-2020 corrected for the site conditions. A comparison and discussion of the calculated damage and loss is then made, taking into account the two generations of SHM.

2. Hazard, Exposure and Fragility Models

2.1. Site Condition Model

A detailed site condition model for the MMC based on Vs30 mapping has been incrementally developed over the last 20 years (e.g., [25,26]) as illustrated in Figure 4. This map is derived from shear-wave velocity (Vs) data from non-invasive seismic methods, borehole profiles converted into vs. profiles, and geological data. The collected data, as well as the approach used to interpolate them within the MMC, are detailed in a recent companion paper by Rosset et al. [2]. This zonation has been compared to the distribution of felt reports converted into intensity during several weak earthquakes in the region of Montreal. The reported intensity is globally larger in zones with site classes D and E, where amplification of seismic waves are the most probable [27].
The microzonation map in Figure 4 is also well-correlated with the thickness of recent alluvial and clay deposits from the Champlain Sea, a past inlet of the Atlantic Ocean into the North American continent, created by the retreating ice sheets during the closure of the last glacial period (13,000–10,000 years). The northeastern part of the MMC is the region with the deepest post-glacial deposits, up to 50 m close to the Saint Lawrence River. In the Island of Montreal, site class E zones are observed in old riverbeds with alluvial deposits up to 15 m. Approximately 27% of the MMC is covered by site classes D and E, 36% by site class C, 31% by site class B, and the remainder is the identified outcropping bedrock, which is classified as A.
For the SHM5, a foundation factor F(T) included in the 2015 National Building Code of Canada is applied to amplify or de-amplify the ground motions of the reference probabilistic hazard map [28]. This factor depends on the level of ground motion as given by the hazard map and the site class (a range of Vs30) provided by the microzonation. The PGA, Sa(0.3 s) and Sa(1.0 s) maps are accordingly adjusted based on each of these factors. In contrast, the information provided by the Vs30 map is directly introduced in the probabilistic hazard calculations in SHM6 for each site.

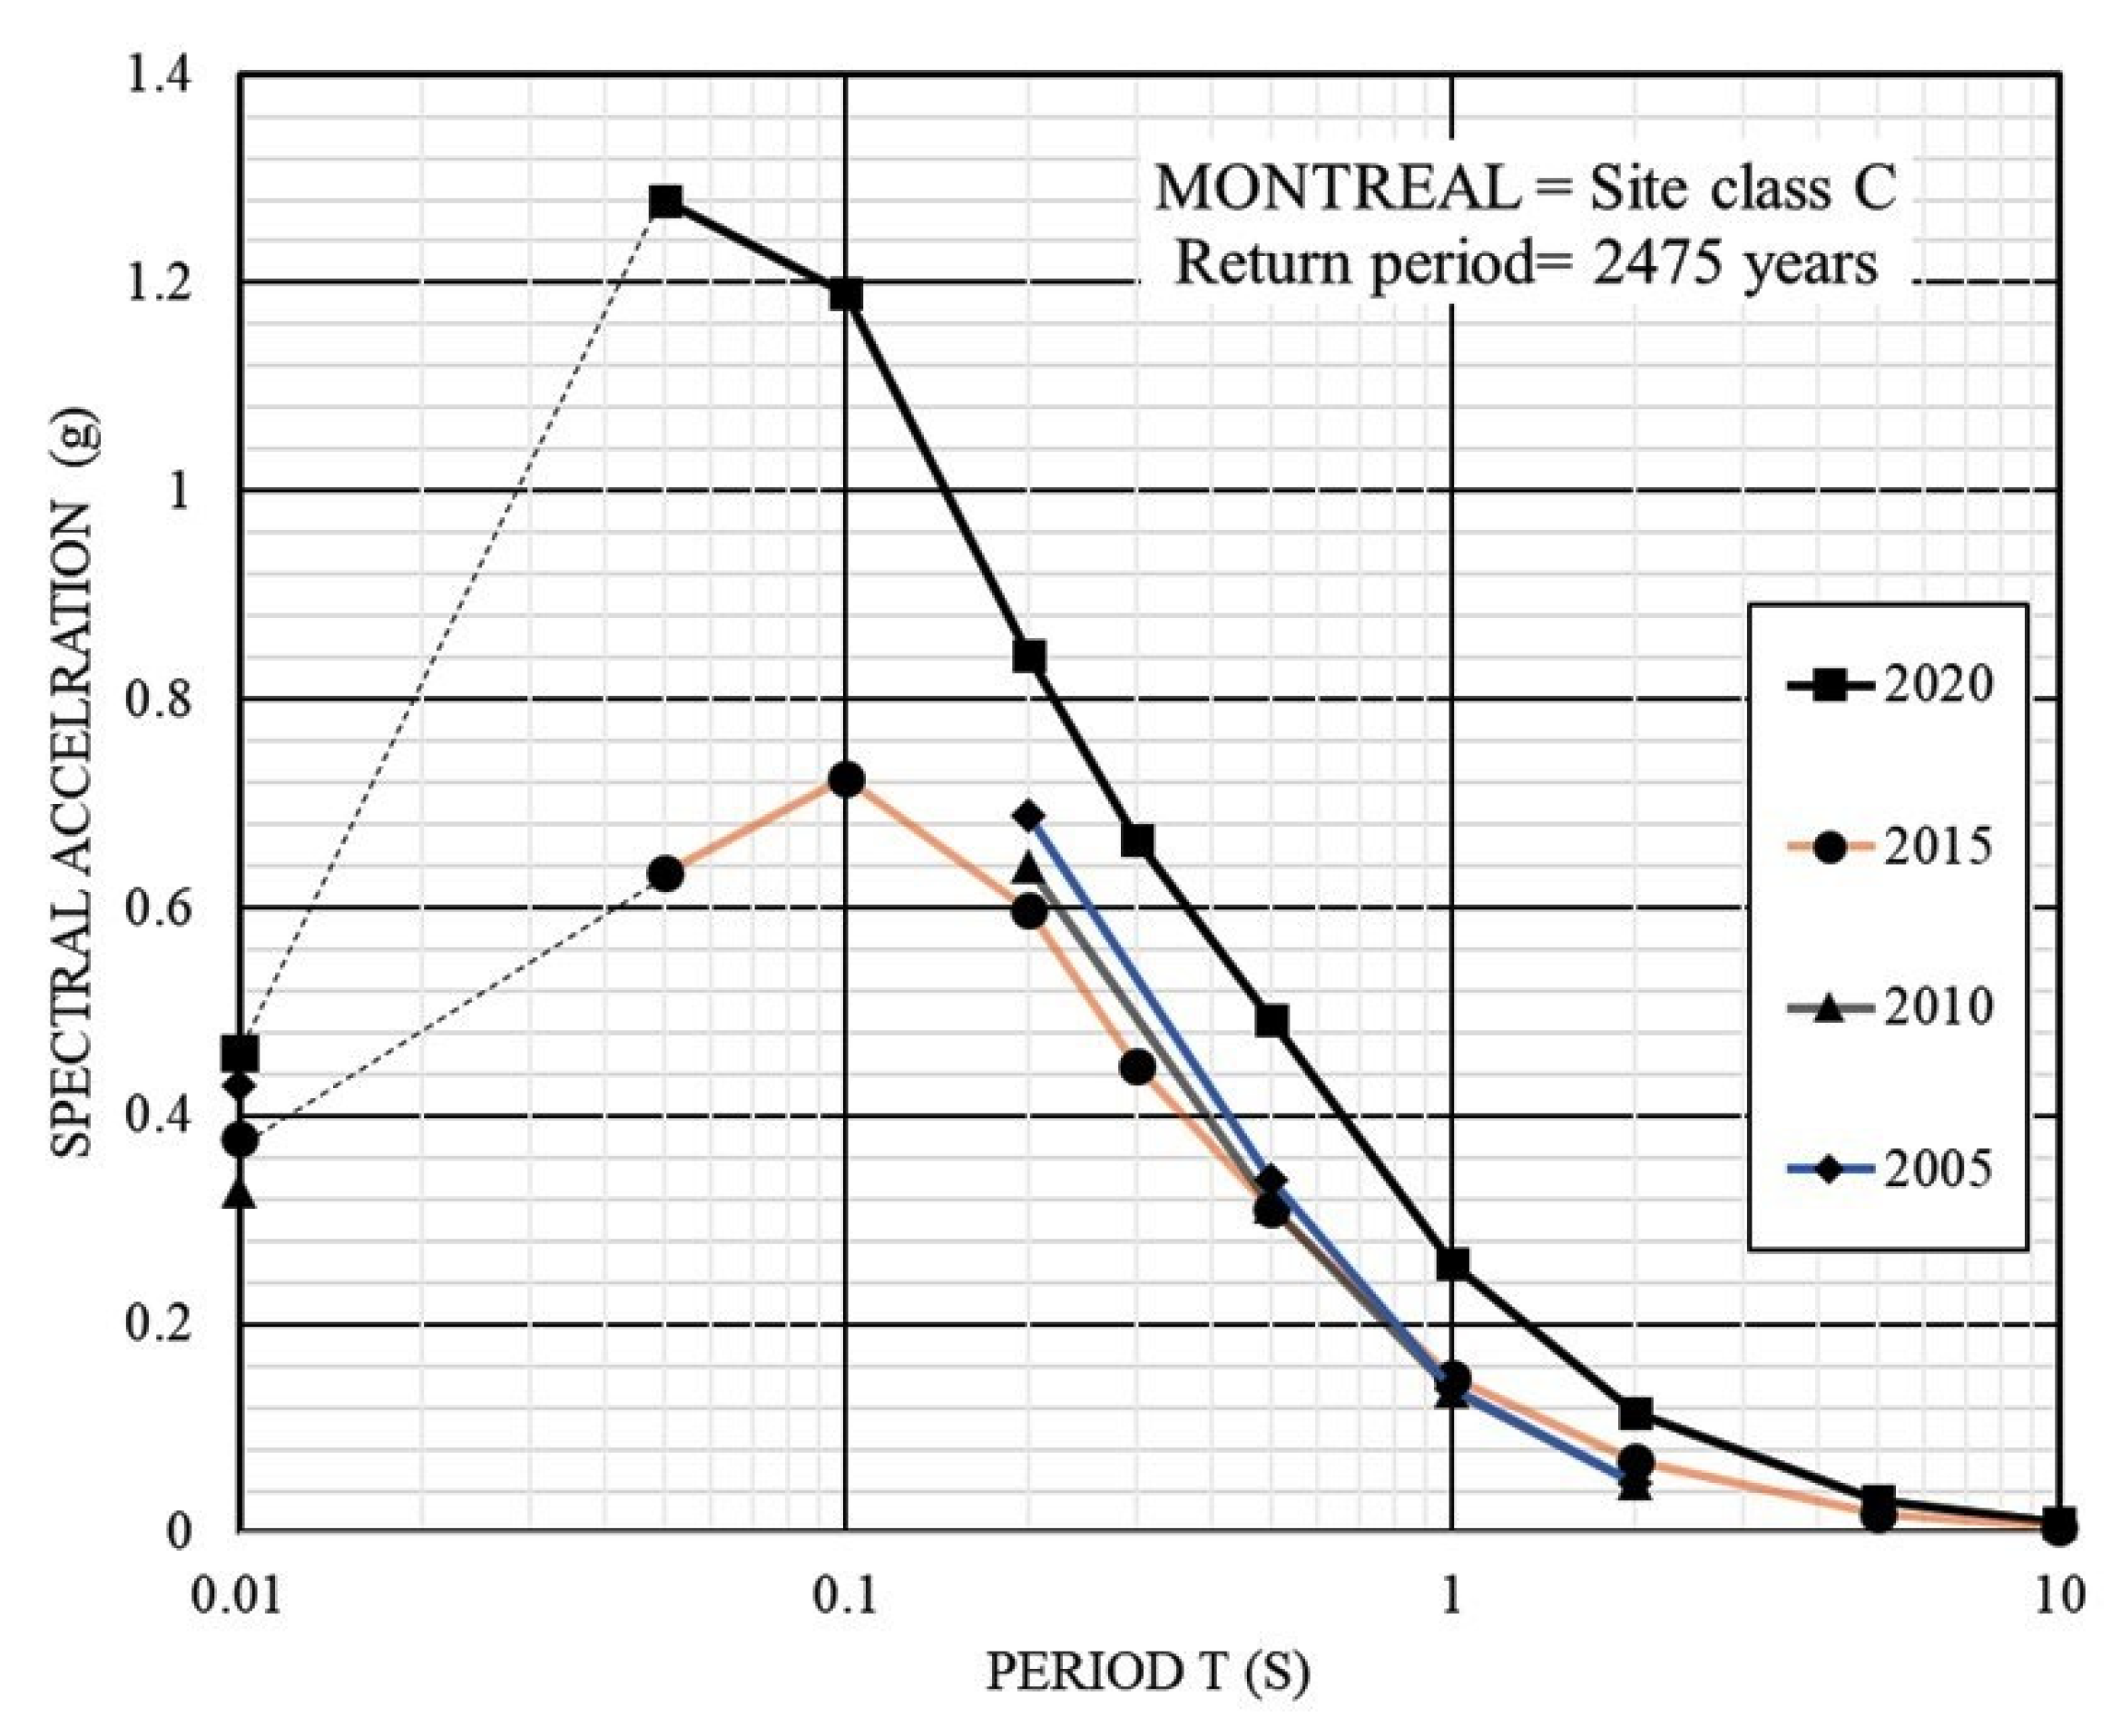
2.2. Seismic Hazard Models
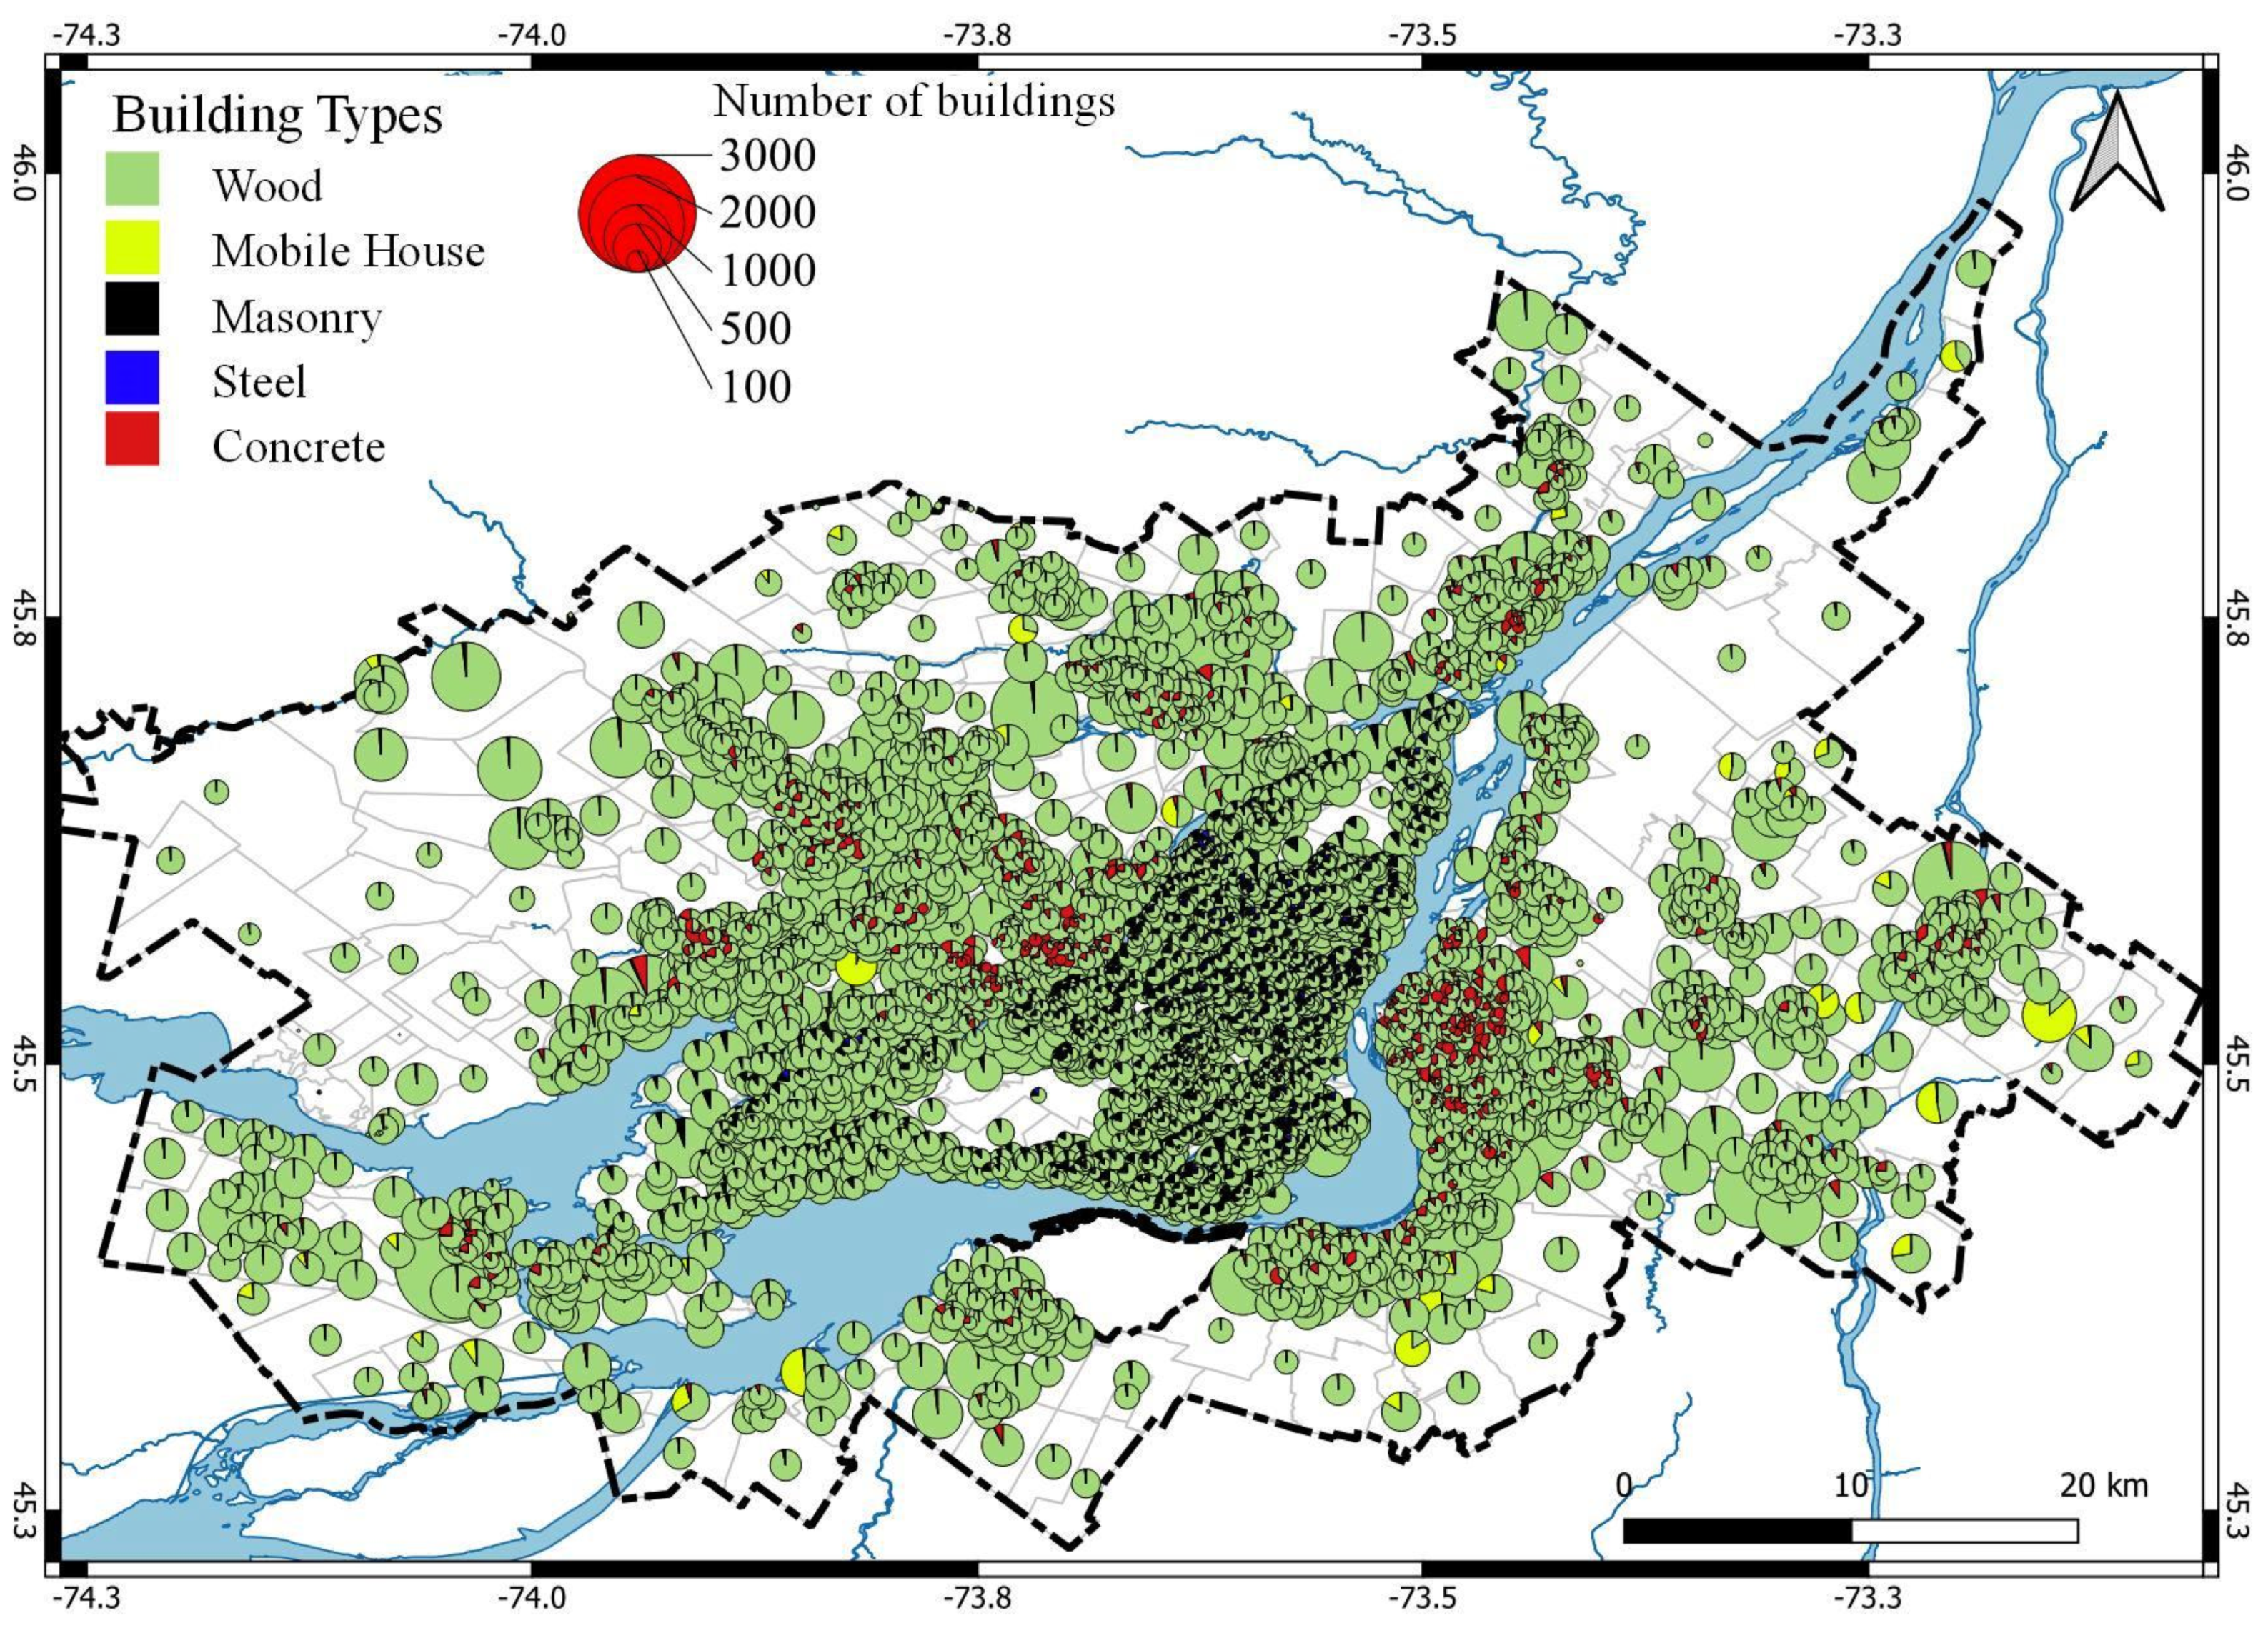
Seismic hazard parameters are first calculated for the return period of 2475 years at a reference site condition (site class C) using SHM5 and SHM6. Both models are extensively described in [29,30,31] for SHM5 and in [7,8] for SHM6. As shown in the uniform hazard spectra in Figure 2, PGA and spectral acceleration increase at all periods.
For the SHM5, the national hazard data provided by NRCan on a 10 km resolution grid are interpolated into a regular 2 km grid in order to fulfill the spatial resolution of the exposure model [32]. For the SHM6, the hazard parameters are directly calculated on the 2 km grid with constant and variable Vs30 distributions. Left maps in Figure 4 present the hazard maps calculated for constant site class C (Vs30 = 450 m/s), while maps to the right include the variable Vs30 data in Figure 3, later averaged in each dissemination area.
For constant Vs30 values, maximum ground-motion values increase by 18, 33 and 42% for PGA, Sa(0.3 s) and Sa(1.0 s), respectively, with the new hazard model (SHM6) (left maps in Figure 4). This increase is reduced to 18, 22 and 33%, respectively, when a variable Vs30 model is adopted. On average for the DAs, the increases are 12, 16 and 19%, for PGA, Sa(0.3 s) and Sa(1.0 s), respectively, within the MMC. For PGA, 79% of the DAs in SHM6 have higher values than for the SHM5 model (right maps in Figure 5). This percentage is reduced to 28 and 12% for Sa(0.3 s) and Sa(1.0 s), respectively.

2.3. Exposure Model

The exposure model includes demographic information and data on residential buildings in the MMC at the scale of the dissemination areas (delimited by thin black lines in the map of Figure 1). Population during the day and night and other demographic parameters are estimated from the 2016 census of population (Statistics Canada, 2016) updated in 2018. The 2016 property assessment roll for the municipality of Montreal, updated in 2018, and the one for 2018 for the municipalities outside Montreal, serve as basic information to evaluate the number of buildings, the floors’ surface area and the property value (data provided by the Civil Protection of Quebec). The taxonomy of the buildings is the one used in Hazus [8]. Within each building type, the tool further classifies buildings into subtypes based on various factors, such as occupancy, construction materials and age. These subtypes are used to assess the vulnerability and potential damage to buildings in more detail. Residential buildings (RES) are divided into single-family housing, mobile homes, and multi-family housing (multiplex), sub-divided into six types considering the number of dwellings. The count by occupancy types is based on the number of dwellings combined with their geographical location, as in the property roll. In the Island of Montreal, a screening of the buildings district by district to classify them as a function of construction type (wood, masonry, concrete, steel or mobile house, as defined in Table 5.1 page 5–6 in [9]) has been performed. For municipalities outside Montreal, similar rules have been adopted, e.g., single-family houses and multiplex up to four dwellings built after 1875 are wood-frame houses and, before this date, unreinforced masonry houses (refer to [1] for more details). The map in Figure 6 shows the 870,000+ buildings grouped by types and number in each DA. The wood-frame houses (in green) are predominant within the MMC, except in a few DAs where it is the mobile houses (in yellow) that predominate. In the island of Montreal, the percentage of unreinforced masonry buildings (in black) is higher than in other municipalities, while the one for concrete-frame buildings (in red) is important in several DAs that are sparsely distributed.
The distribution of buildings by type is clearly different between Montreal and its neighboring municipalities, as illustrated in Figure 7. The historical center of the city and the surrounding districts account for more than 13% of unreinforced masonry buildings up to four floors, and 1% of steel-frame buildings. Wood-frame houses represent 95.4% of the building stock in the municipalities outside Montreal, and 2.7% are concrete buildings.
The building types are split into three levels of design code (pre-, low- and moderate codes) corresponding to three periods of construction related to the editions of the NBCC, namely before 1970, 1970–1990, and after 1990, where the year 1990 marks the introduction of new seismic requirements in several design standards. Wood-frame houses (W1) are distributed equally between the code levels, as steel and unreinforced masonry buildings mainly belong to the pre-code level. Concrete-frame buildings achieve figures of 18%, 44% and 38% in the pre-, low- and moderate-code levels, respectively. For mobile houses, the distribution is estimated at around 11%, 69% and 20%.
The property roll provides the property value assigned to the buildings and is used to calculate the property taxes. All buildings in the database have an assessed value, occupancy and construction type and are aggregated by DAs. Data sensitivity analyses show that the calculated total value from the roll differs by less than 1% from that calculated using the total floor area, and by 10% from that calculated using the number of buildings and the median value by area. CatIQ (Catastrophe Indices and Quantification Inc., Toronto) provides the ratio of property value to content value at the scale of the Forward Sortation Area from postal codes. The average ratio is around 51% ± 9% for 2018.
Table 1 lists the estimated values of the buildings and their contents for single-family, mobile and multiple-families houses. The total residential building portfolio is around 295.5 billion CAD, the building value counting for 67% of the total. Single-family houses represent 64% of the total asset value and multiplex 34%.
The map in Figure 8 shows the spatial distribution of the building value by DAs in Montreal and surrounding municipalities. It is complemented by the estimated number of buildings showing a correlation between the DA’s value and the number of buildings, especially in the newly urbanized areas outside Montreal.
Table 2 lists the values of the buildings and their contents for the different construction types. Wood-frame houses represent 86% of the total buildings’ value, unreinforced masonry 6.8%, concrete-frame 5.6%, steel-frame and mobile houses, the remainder.

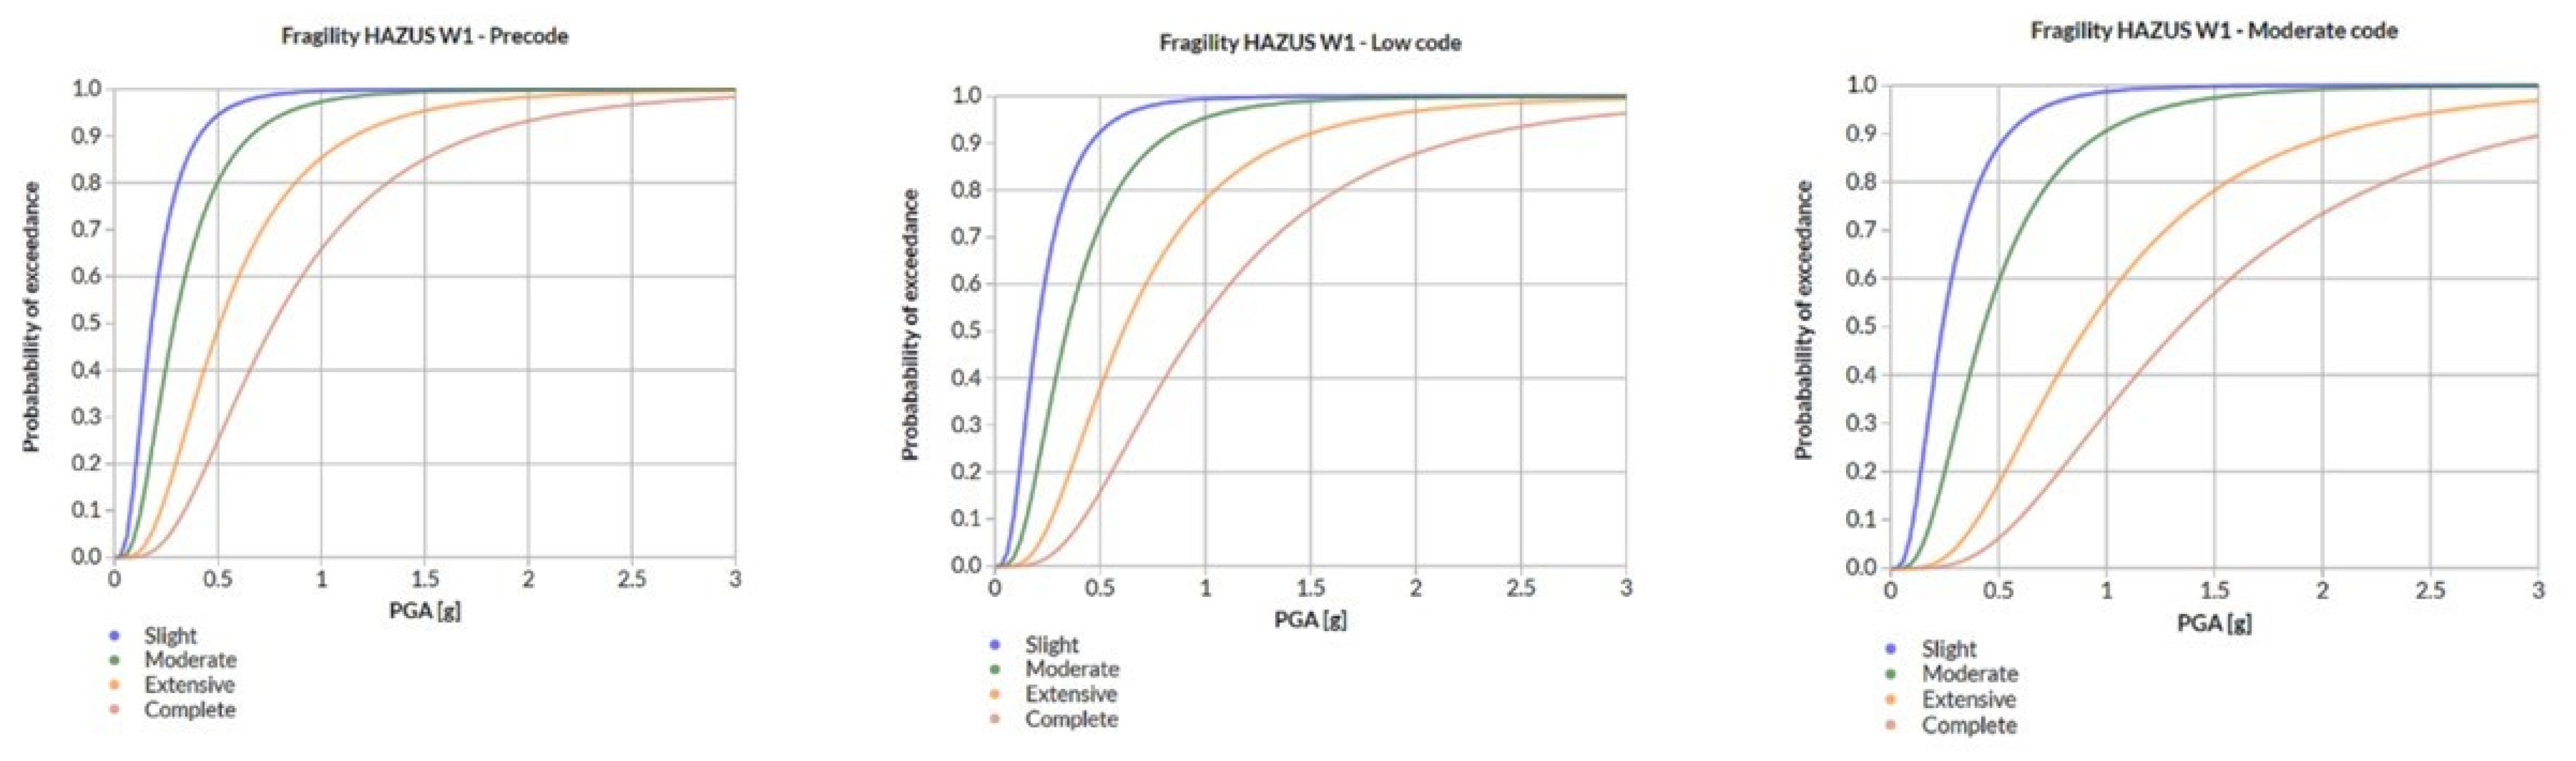
2.4. Fragility and Loss Models

In Hazus, building damage is estimated with fragility curves, which describe the probability of reaching or exceeding different states of damage as a function of a peak building response. The latter (either spectral displacement or spectral acceleration) is the point of intersection of the capacity curve and demand spectrum (details of the calculation are provided in the technical manual in FEMA [9]). These curves are provided for different building types (including three heights) and seismic design levels. In the region of Montreal, three design code epochs were defined. The year 1970 was the date when capacity-based design and structural ductility considerations were first introduced. Structures built before this year are considered as pre-code (according to the Hazus codification) and the ones built after this date are low-code. In 1990, new seismic requirements in several design standards were introduced and correspond to the highest level of seismic design considered for residential buildings, (moderate code in Hazus). For wood-frame houses, the main building type is pre-code (59% in Montreal, 26% outside Montreal), low-code (26% in Montreal, 37% outside Montreal) and moderate-code (15% in Montreal, 37% outside Montreal). The curves of Figure 9 exemplify the differences in fragilities as a function of code level for wood-frame houses.
Seismic losses are calculated as the sum over all damage states of the product of the probability of a given damage state multiplied by the repair cost ratio times the building value. For structural damage, losses CSi for a given occupancy type i are calculated as follows:
C S i = d s = 2 5 ( B R C i × i = 1 8 P S T R d s , i × R C S d s , i )
where RCSds,i is the structural repair and replacement ratio (in % of building replacement cost) for occupancy i in damage state ds; PSTRds,i is the probability of occupancy i being in structural damage state ds. BRCi is the building-replacement cost for occupancy i as provided in Hazus (further details in section 11.2.1 in Hazus technical manual [9]). Similar equations are used to estimate non-structural and content losses.

3. Comparison of Damage and Losses Calculated with SHM5 and SHM6

3.1. Damage Distribution

Damages are categorized into structural, non-structural, and contents. Structural elements are the main load-bearing components that provide building stability, such as beams or columns, and the non-structural elements are other components such as exterior wall panels, staircases, and chimneys. The latter are divided into acceleration-sensitive and drift-sensitive components, which are evaluated differently in Hazus. The contents of the building include equipment and furnishings. Percentages by construction type and level of damage for SHM5 and SHM6 hazards are illustrated in Figure 10. For the SHM6, the number of buildings with extensive and complete damage is around 6000 (0.7% of the total number), 85% being multiplexes. For the SHM5, this number is around 1000, 65% being multiplexes. This increase is mainly from the unreinforced masonry-bearing walls buildings (URM) which are pre-code designs, and for 61% with 1–2 floors and 20% with more than two floors. In addition, steel-frame buildings with pre-code designs are the most affected by the increase in seismic hazard; however, they account for only 0.4% of the total number of buildings.

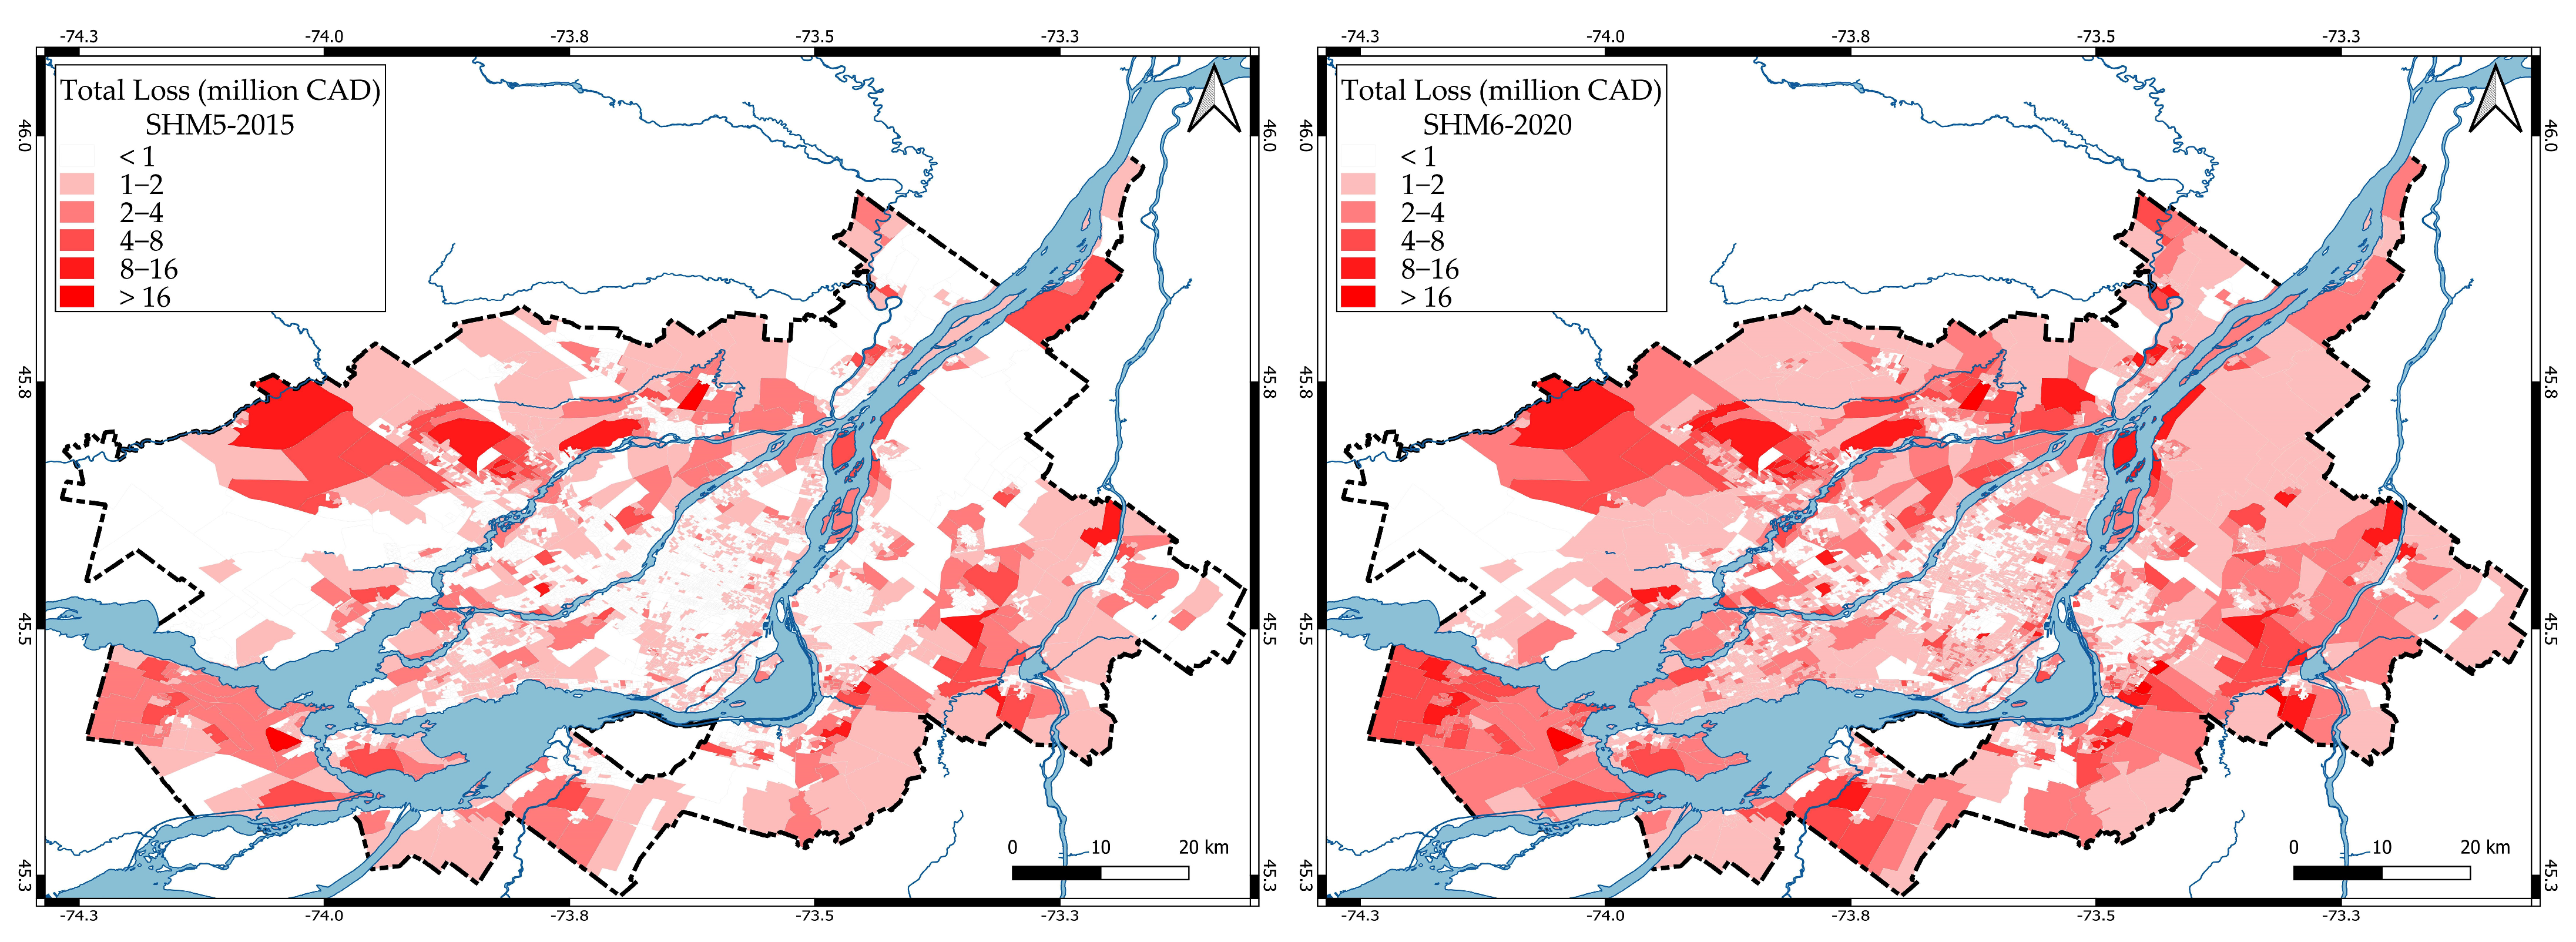
3.2. Economic Losses

In Hazus, the building losses are divided into the repair costs of structural, non-structural and contents damage. Table 3 lists the results of the loss calculations using the two SHM divided into structural, non-structural and contents components. Changes in the values between the two are also given. For the return period of 2475 years, the total residential losses are estimated at around 5.73 billion and 8.75 billion CAD for the SHM5 and SHM6, respectively, which represents an increase of 53% between the two versions of the hazard model. The part of structural losses over the total increases from 5 to 8% as the non-structural one remains stable at around 61% for the two models. The contents take the third part of the total losses. The value of structural damage is multiplied by more than two with the SHM6, as the cost of non-structural and contents damage show increases of 54% and 40%, respectively.
The bar graph in Figure 11 compares the distribution of building losses by ranges of 200 k CAD and by number of DAs for the two SHMs. From the fifth to the sixth generation of the seismic hazard model, the mean value of losses by DA increases from 640 k to 1430 k CAD, with a standard deviation similar to around 1100 k CAD. There is a general shift to higher losses with the SHM6, with the number of DAs affected increasing globally.
The maps in Figure 12 show the distribution of total residential losses by DAs considering both hazard models. The number of DAs with the largest losses (>16 million Can$) is increased by a factor of 2.2 between the two models and represents 16% of the total in the 2020 model.

4. Discussion and Conclusions

Adams et al. [6] noticed a significant increase in Class C seismic hazards from the SHM5 to SHM6, particularly in eastern Canada due to the substantial changes to the GMMs at all spectral periods (+18% for PGA and +39% in average for other spectral periods for soil type C). This increase is also observed for other soil types when including in the hazard calculation the seismic microzonation information (Figure 4). For example, PGA values increase by 12% ± 7% in average among the DAs, the mean PGA value changing from 0.35 to 0.40 g when using the SHM6, as illustrated on the left map in Figure 13.
The consequences of this increase in seismic hazards on the calculated damage are described by levels of damage and building type. The buildings without damage decrease from 76 to 63% with the new generation of the SHM. Conversely, the percentage of buildings extensively and completely damaged increases from 0.1 to 0.7% and the ones with moderate damage rise from 2.6 to 5.5%. Wood-frame buildings are the ones that suffer less damage, but the slight damage increases from 20 to 30% of their total. From the SHM5 to SHM6, the percentage of URM buildings with extensive damage is multiplied by 2.4. The reinforced-concrete, moment-resisting frame buildings (C1) are the ones most affected, and the percentage of extensive and complete damage is 10 times higher with the SMH6 than with the SHM5. This type of damage is mainly pre-code level in Montreal and low-code level in the surrounding municipalities. For mobile houses, which represent 0.6% of the total building stock, extensive and complete damage counts for 9% of the total number when using the SHM6, 22 times more than the SHM5 results.
The economic losses to residential buildings are directly derived from the damage and have multiplied by 1.5 from the SHM5 to SHM6. They are also directly correlated to the increase in the ground-motion values as illustrated in Figure 13. Losses increase from 1.9 to 3.0% of the total value of building stock. The losses due to non-structural damage represent 61% of the total and the ones from structural damage move from 5 to 8% with the new SHM. The rest of the costs are from contents damage. In average, 80% of the total losses are from wood-frame houses, with an increase in value of 33% for the SHM6, as unreinforced masonry structures account for 10%, with a similar order of magnitude in changes. The cost of repairing concrete buildings rises from 4 to 9% (a 66% increase in value) and the cost of repairing steel buildings is multiplied by 1.8. Mobile houses have their losses multiplied by 1.7.
A concomitant study to estimate the annualized earthquake losses in the MMC have shown that the losses are proportional to the total value and the average ages of the buildings by DA [32,33]. Indeed, the year of construction is used to select the corresponding fragility for a given design code level as exemplified in Figure 9 for the wood-frame houses, the oldest buildings having the worst performance.
Capacity curves for the derivation of fragility functions can be calibrated for typical wood-frame houses in the province of Quebec. Special attention can be directed towards non-structural damage to confirm or infirm their large contribution, which accounts for more than two-thirds of the losses in the current analysis. A specific study could be also conducted to better estimate the damage to mobile homes, concrete and steel buildings, because the difference in losses between the two seismic hazard models is more significant for these (an increase of 70% in average) than for other building types.
Finally, the content losses are based on the Hazus approach, which has not been validated for Eastern Canada and accounts for one-third of the total losses. The estimates of losses correspond to the average but the significant increase in losses with the new hazard model highlights the need to better quantify, propagate and communicate uncertainties when providing seismic loss estimates. The quantification of uncertainties is an important element in prioritizing, optimizing, and justifying risk management and mitigation strategies across all potential natural hazards, in particular when considering competing financial demands for climate-change adaptation.

Author Contributions

Conceptualization, P.R. and X.L.; methodology, P.R.; validation, P.R., X.L. and L.C.; formal analysis, X.L.; writing—original draft preparation, P.R.; writing—review and editing, P.R., X.L. and L.C.; supervision, P.R. and L.C.; project administration, L.C.; funding acquisition, L.C. All authors have read and agreed to the published version of the manuscript.

Funding

This research was funded by the Ministère de la sécurité publique du Québec in the program “Cadre pour la prévention de sinistres 2013–2020 du gouvernement du Québec” (CPS 15-16-02; CPS 17-18-07 and CPS 20-21-09).

Data Availability Statement

The Hazus tool is available from the FEMA website (https://www.fema.gov/flood-maps/products-tools/hazus, accessed on 21 October 2023). The collected and analyzed exposure data are protected by confidentiality with the Ministère de la Sécurité Publique du Québec.

Acknowledgments

This work has benefited from the different students who helped to collect and format the building exposure data (Andrea Mellado, Florence Sousha, Suze Youance). The comments of the four anonymous reviewers greatly improved this manuscript.

Conflicts of Interest

The authors declare no conflict of interest.

References

  1. Rosset, P.; Chouinard, L.; Nollet, M.J. Consequences on Residential Buildings in Greater Montreal for a Repeat of the 1732 M5.8 Montreal Earthquake. In Proceedings of the Canadian Society of Civil Engineering Annual Conference 2021. CSCE 2021, online, 26–29 May 2021; Lecture Notes in Civil Engineering. Springer: Singapore, 2023; Volume 240, pp. 667–679. [Google Scholar] [CrossRef]
  2. Hobbs, T.E.; Journeay, J.M.; Rao, A.S.; Kolaj, M.; Martins, L.; LeSueur, P.; Simionato, M.; Silva, V.; Pagani, M.; Johnson, K.; et al. A national seismic risk model for Canada: Methodology and scientific basis. Earthq. Spectra 2023, 39, 1410–1434. [Google Scholar] [CrossRef]
  3. Hobbs, T.E.; Van Ulden, J.; Rotheram, D.; Chow, W.; LeSueur, P.; Journeay, J.M.; Ulmi, M.; Ulmi, D.; Fok, A.; Van de Valk, J.; et al. RiskProfiler. Geological Survey of Canada. 2022. Available online: www.RiskProfiler.ca (accessed on 19 September 2023).
  4. AIR Study of Impact and the Insurance and Economic Cost of a Major Earthquake in British Columbia and Ontario/Quebec. Commissioned by the Insurance Bureau of Canada. 2013. Available online: https://docslib.org/doc/9800294/study-of-impact-and-the-insurance-and-economic-cost-of-a-major-earthquake-in-british-columbia-and-ontario-qu%C3%A9bec (accessed on 20 June 2023).
  5. Yu, K.; Rosset, P.; Chouinard, L. Seismic Vulnerability Assessment for Montreal. Georisk 2016, 10, 164–178. [Google Scholar] [CrossRef]
  6. Adams, J.; Allen, T.; Halchuk, S.; Kolaj, M. Canada’s 6th Generation Seismic Hazard Model, as Prepared for the 2020 National Building Code of Canada. In Proceedings of the 12th Canadian Conference on Earthquake Engineering, Vancouver, BC, Canada, 17–20 June 2019; Available online: https://www.caee.ca/12CCEEpdf/192-Mkvp-139.pdf (accessed on 21 October 2023).
  7. Kolaj, M.; Halchuk, S.; Adams, J.; Allen, T. Sixth Generation Seismic Hazard Model of Canada: Input files to produce values proposed for the 2020 National Building Code of Canada. In Geological Survey of Canada; Open File 8630; Natural Resources Canada: Ottawa, ON, Canada, 2020; 15p. [Google Scholar] [CrossRef]
  8. Kolaj, M.; Adams, J.; Halchuk, S. The 6th Generation Seismic Hazard Model of Canada. In Proceedings of the 17th World Conference on Earthquake Engineering, Sendai, Japan, 13–18 September 2020; pp. 1–12. Available online: https://publications.gc.ca/collections/collection_2021/rncan-nrcan/m183-2/M183-2-8629-eng.pdf (accessed on 21 October 2023).
  9. Federal Emergency Management Agency. Hazus Earthquake Model Technical Manual Hazus 5.1; FEMA Publication; Department of Homeland Security and Federal Emergency Management Agency: Washington, DC, USA, 2022. Available online: https://www.fema.gov/sites/default/files/documents/fema_hazus-earthquake-model-technical-manual-5-1.pdf (accessed on 21 October 2023).
  10. Tantala, M.W.; Nordenson, G.J.P.; Deodatis, G.; Jacob, K. Earthquake loss estimation for the New-York city metropolitan region. Soil Dyn. Earthq. Eng. 2008, 28, 812–835. [Google Scholar] [CrossRef]
  11. Field, E.H.; Seligson, H.A.; Gupta, N.; Gupta, V.; Jordan, T.H.; Campbell, K.W. Loss estimates for a Puente Hills blind-thrust earthquake in Los Angeles, California. Earthq. Spectra 2005, 21, 329–338. [Google Scholar] [CrossRef]
  12. Moffatt, S.F.; Cova, T.J. Parcel-scale earthquake loss estimation with HAZUS: A case study in salt Lake County, Utah. Cartogr. Geogr. Inf. Sci. 2010, 37, 17–29. [Google Scholar] [CrossRef]
  13. Chen, R.; Jaiswal, K.S.; Bausch, D.; Seligson, H.; Wills, C.J. Annualized earthquake loss estimates for California and their sensitivity to site amplification. Seismol. Res. Lett. 2016, 87, 1363–1372. [Google Scholar] [CrossRef]
  14. Kircher, C.A.; Whitman, R.V.; William, T. HAZUS Earthquake Loss Estimation Methods. Natural Hazards Review 2006, 7, 45–59. [Google Scholar] [CrossRef]
  15. Federal Emergency Management Agency. Hazus®99 Estimated Annualized Earthquake Losses for the United States; FEMA 366; Federal Emergency Management Agency Mitigation Directorate: Washington, DC, USA, 2002.
  16. Federal Emergency Management Agency. Hazus®MH Estimated Annualized Earthquake Losses for the United States; FEMA 366; Federal Emergency Management Agency: Washington, DC, USA, 2008.
  17. Federal Emergency Management Agency. FEMA-P366 Estimated Annualized Earthquake Losses for the United States; FEMA report; Federal Emergency Management Agency: Washington, DC, USA, 2017.
  18. Bendito, A.; Rozelle, J.; Bausch, D. Assessing Potential Earthquake Loss in Mérida State, Venezuela Using Hazus. Int. J. Disaster Risk Sci. 2014, 5, 176–191. [Google Scholar] [CrossRef]
  19. Felsenstein, D.; Elbaum, E.; Levi, T.; Calvo, R. Post-processing HAZUS earthquake damage and loss assessments for individual buildings. Nat. Hazards 2021, 105, 21–45. [Google Scholar] [CrossRef]
  20. Levi, T.; Bausch, D.; Katz, O.; Rozelle, J.; Salamon, A. Insights from Hazus loss estimations in Israel for Dead Sea Transform earthquakes. Nat. Hazards 2015, 75, 365–388. [Google Scholar] [CrossRef]
  21. Ansal, A.; Akinci, A.; Cultrera, G.; Erdik, M.; Pessina, V.; Tönük, G.; Ameri, G. Loss estimation in Istanbul based on deterministic earthquake scenarios of the Marmara Sea region (Turkey). Soil Dyn. Earthq. Eng. 2009, 29, 699–709. [Google Scholar] [CrossRef]
  22. Firuzi, E.; Ansari, A.; Amini Hosseini, K.; Rashidabadi, M. Probabilistic earthquake loss model for residential buildings in Tehran, Iran to quantify annualized earthquake loss. Bull. Earthq. Eng. 2019, 17, 2383–2406. [Google Scholar] [CrossRef]
  23. Ulmi, M.; Wagner, C.L.; Wojtarowicz, M.; Bancroft, J.L. Hazus-MH 2.1 Canada, User and Technical Manual: Earthquake Module; Natural Resources Canada: Ottawa, ON, Canada, 2014. [Google Scholar]
  24. Ploeger, S.K.; Atkinson, G.M.; Samson, C. Applying the HAZUS-MH software tool to assess seismic risk in downtown Ottawa, Canada. Nat. Hazards 2010, 53, 1–20. [Google Scholar] [CrossRef]
  25. Rosset, P.; Bour-Belvaux, M.; Chouinard, L. Microzonation models for Montreal with respect to Vs30. Bull. Earthq. Eng. 2015, 13, 2225–2239. [Google Scholar] [CrossRef]
  26. Rosset, P.; Takahashi, A.; Chouinard, L. Vs30 Mapping of the Greater Montreal Region Using Multiple Data Sources. Geosciences 2023, 13, 256. [Google Scholar] [CrossRef]
  27. Rosset, P.; Bent, A.; Halchuk, S.; Chouinard, L. Positive correlation of DYFI intensity data and microzonation in site classes for Ottawa, Quebec City and the metropolitan area of Montreal. Seismol. Res. Lett. 2022, 93, 3468–3480. [Google Scholar] [CrossRef]
  28. National Building Code of Canada; National Research Council of Canada; Canadian Commission on Building and Fire Codes: Ottawa, ON, Canada, 2015; Volume 1, 708p; Volume 2, 696p.
  29. Halchuk, S.C.; Adams, J.E.; Kolaj, M.; Allen, T.I. Deaggregation of NBCC 2015 Seismic Hazard for Selected Canadian Cities. In Proceedings of the Extended Abstract for the 12th Canadian Conference on Earthquake Engineering, Vancouver, BC, Canada, 17–20 June 2019; 9p. Available online: https://seismescanada.rncan.gc.ca/hazard-alea/2019_12CCEE/12CCEE_Halchuk_etal_Deaggregation_192-DMsa-149.pdf (accessed on 21 October 2023).
  30. Allen, T.I.; Halchuk, S.; Adams, J.; Rogers, G.C. Canada’s 5th Generation Seismic Hazard Model: 2015 Hazard Values and Future Updates. In Proceedings of the 6th World Conference on Earthquake Engineering, Santiago Chile, 9–13 January 2017; 12p. Available online: http://www.wcee.nicee.org/wcee/article/16WCEE/WCEE2017-3494.pdf (accessed on 21 October 2023).
  31. Allen, T.I.; Halchuk, S.; Adams, J.; Weatherill, G.A. Forensic PSHA: Benchmarking Canada’s Fifth Generation seismic hazard model using the OpenQuake-engine. Earthq. Spectra 2020, 36 (Suppl. 1), 91–111. [Google Scholar] [CrossRef]
  32. Long, X. Estimation of the Annualized Earthquake Loss (AEL) for Residential Buildings in the Greater Montreal area using HAZUS and OpenQuake. Master’ Thesis, McGill University, Montreal, QC, Canada, 2023. 123p. Available online: https://escholarship.mcgill.ca/downloads/z029pb041?locale=en (accessed on 10 October 2023).
  33. Rosset, P.; Nollet, M.-J.; Chouinard, L. Annualized Residential Earthquake Losses in the Greater Montreal Area. In Proceedings of the Canadian Conference Earthquake Engineering, Vancouver, BC, Canada, 25–30 June 2023; Paper 228. Available online: https://az659834.vo.msecnd.net/eventsaircancprod/production-venuewest-public/8963cb098a3c4b7f9bb28565dfb34aa3 (accessed on 13 October 2023).
Figure 1. Investigated region. Black lines delimit the Regional County Municipalities (RCM) with their associated name. Dashed black line is the limit of the Montreal Metropolitan Community and thin blue lines are the dissemination areas.
Geohazards 04 00023 g001
Figure 2. Uniform hazard spectra for the Montreal City Hall as calculated every five years since 2005 in the national seismic hazard model. Calculations are for site class C and the return period of 2475 years.
Geohazards 04 00023 g002
Figure 3. Flowchart describing the procedure used to calculate damage and losses using as input the Seismic Hazard Models (SHM-2015 and 2020) corrected for the site condition model. The corresponding section for each step of the calculation is indicated in italics.
Geohazards 04 00023 g003
Figure 4. Site conditions in terms of Vs30 maps grouped by site classes (data from Rosset et al., 2022).
Geohazards 04 00023 g004
Figure 5. Distribution of PGA (in g) for the return period of 2475 years using (top) the SHM5 and (bottom) the SHM6. PGA is calculated (left) by grid for site class C (Vs30 = 450 m/s) and (right) by dissemination area using the Vs30 map in Figure 3.
Geohazards 04 00023 g005
Figure 6. Distribution of residential buildings by type. The surface of the pie charts is proportional to the number of buildings and centered in each dissemination area.
Geohazards 04 00023 g006
Figure 7. Distribution of residential buildings by type in (a) municipalities outside Montreal and (b) in Montreal. The percentage of buildings is labeled above each bar.
Geohazards 04 00023 g007
Figure 8. Residential building value (in million of CAD) and number of buildings by dissemination areas. The surface of the circle is proportional to the number of buildings.
Geohazards 04 00023 g008
Figure 9. Fragility curves as used in Hazus for wood-frame houses (W1) for three code levels (pre-, low- and moderate-code levels). The curves are colored for slight, moderate, extensive and complete damage levels.
Geohazards 04 00023 g009
Figure 10. Percentage of damage by construction type and levels of damage using the SHM5 (a) and the SHM6 (b). URM is for unreinforced masonry buildings and MH for mobile houses.
Geohazards 04 00023 g010
Figure 11. Distribution of building losses (in thousand CAD) by number of dissemination areas for the return period of 2475 years using the SHM5 and SHM6 models. The x-axis values are the upper limit of each bar. The dots with line are the percentage of DAs for each range of loss values (left y-axis).
Geohazards 04 00023 g011
Figure 12. Distribution of building losses (in million of CAD) by dissemination areas for the return period of 2475 years using the (left) SHM5-2015 and the (right) SHM6-2020 models.
Geohazards 04 00023 g012
Figure 13. Influence of the seismic hazard model update on (left) PGA and on (right) loss (in %).
Geohazards 04 00023 g013
Table 1. Distribution of building and content values by occupancy type.
Value
(in Million CAD)
Occupancy TypesTotal
RES1
(Single Family Houses)
RES2
(Mobile House)
RES3A-3F
(Multiplex)
Building125,94142770,136196,504
Content67,22224131,56799,030
Total193,163668101,703295,534
Table 2. Distribution of building and content values by construction type.
Value
(in Million CAD)
Construction TypesTotal
WoodSteelConcreteMasonryMobile House
Building169,164128611,00813,9961050196,504
Content86,4575225427613049599,030
Total255,621180816,43520,1261545295,534
Table 3. Residential building losses (in million CAD) as calculated with the SHM5 and SHM6 models.
Hazard ModelResidential Building Losses (in Million CAD)
StructuralNon-StructuralContentsTotal
SHM5298.03507.61924.95730.5
SHM6667.35386.22695.08748.5
Variation+124%+54%+40%+53%
Disclaimer/Publisher’s Note: The statements, opinions and data contained in all publications are solely those of the individual author(s) and contributor(s) and not of MDPI and/or the editor(s). MDPI and/or the editor(s) disclaim responsibility for any injury to people or property resulting from any ideas, methods, instructions or products referred to in the content.

