1. Introduction
Emergencies are not rare events in big cities and metropolises. Because of the fast growth of urban areas and the lack of planning in most cities, emergency events are very common [
1,
2]. Among the many types of hazardous events, floods are the most recurrent and have the most significant impact on human lives and cities [
3,
4]. Additionally, the current global warming process is causing an increase in the frequency of heavy rains and storms in several cities, putting additional pressure on urban resilience [
5,
6].
In order to minimise the negative impacts of flooding in cities, different strategies have been adopted recently, ranging from flood risk prediction [
7] to rescuing and mitigation response during critical times [
8]. With the advent of sensors that can continuously monitor urban areas in real time, providing information about rainfall index and rivers levels, sensor positioning and communication have also become relevant issues [
9]. In all these cases, data-driven approaches have emerged as a practical way to better understand the particularities of target cities and provide the most adequate services in each considered area [
10], improving prediction, prevention, and actions during a flooding-related emergency, while paving the way for the construction of smart cities.
Some researchers have been studying and developing data-driven methods for assessing flood risk in urban areas in order to verify which parts of a city are more prone to suffering a flooding event [
11,
12,
13,
14], potentially requiring more assistance. In such works, specific parameters of each studied city have been usually considered to perform the expected assessment, achieving relevant results. However, in addition to the usual impossibility of applying a given assessment method to other cities in general, most proposals have centred on data that are not publicly or easily available for every city, potentially constraining their practical adoption for urban planning and flood-related emergency preparedness. Hence, open methodologies that make use of publicly available data are of great importance for aiding stakeholders and authorities in assessing urban risk levels, which should be a guiding development principle in this area [
15,
16].
Flood risk in urban areas can be directly traced to the geography of a city. First, elevation and slopes are relevant parameters since water flows to lower regions due to gravity, dictating the flooding behaviour. Second, the existence of rivers within the considered urban area is also a risk since flood may occur when a river reaches its maximum capacity and spills over its banks [
17]. In both cases, the most common causes are excessive rainfall, rapid snow melting, or even an accident (e.g., a dam collapse or a broken pipe), which may be actively measured for the issuing of emergency alerts and execution of evacuation actions [
18]. Although such measures are warranted in many cases, it is usually important to identify critical areas that are more prone to flooding in advance: these are the areas that need quicker assistance and better rescue plans.
Therefore, when retrieving data from open databases for processing and decision making, it is possible to better assess urban flood risk particularly when data from different domains are combined. The idea herein is not to perform flood detection or prediction (which may be performed using other systems) but to estimate how badly an area will be affected by a flood, on average. In this context, flood risk was assessed in this study based on the combination of relief (expected tendency to accumulate water), rivers crossing urban areas (potential source of flooding), and urban emergency response infrastructure (capability of a city to quickly respond to a critical situation). While the first two factors increase flood risk in the considered area, the later has the opposite effect, reducing the combined risk. As such, based on these three data domains, a combined flood risk index can be determined for every defined urban zone, which can be computed for any city in the world.
This study exploited georeferenced data from OpenStreetMap, a public database with geospatial data collected and configured collaboratively, as well as data from the Open-Elevation API. Among the retrieved and computed data, elevation, slope, and distance to rivers are important parameters in flood risk assessment [
11]. Furthermore, data regarding emergency-response infrastructure were also retrieved, particularly fire brigades, police stations (for rescuing), and hospitals (for assisting victims).
To evaluate our proposal, the city of Porto, Portugal, was considered as a case study. The Douro River, crossing the city of Porto, has an extensive flood history that has made a significant impact on the city more than once, increasing the expected relevance of our approach [
19].
The remainder of this article is organised as follows:
Section 2 presents some related works in the area of flood risk assessment and smart cities’ optimisation. The materials and methods are described in
Section 3.
Section 4 presents our proposed approach based on a substantial mathematical modelling, while
Section 5 details the performed experiments and the achieved results. Then,
Section 6 presents our discussions and outlines research trends when exploiting our approach in real scenarios. Finally, conclusions and references are presented.
2. Related Works
Emergency management in smart cities has been studied as a research topic for some years, with several researchers developing methodologies and mathematical models to detect, provide alert about, and mitigate emergency events [
20,
21]. When performing such services, the concept of “urban risk to emergency” is typically associated with the potential threats and vulnerabilities that cities and densely populated areas face regarding the occurrence of emergencies or disasters. Moreover, risk can also be associated with the potential for negative consequences during critical situations. This way, flood risk is directly related to excessive water and its urban impacts, with many complexities and variables that must be considered, making this a challenging research area [
22,
23].
Emergency risk assessment is considered as an important element when creating more resilient cities. Within a smart city scenario, emergency risk has been typically assessed based on exposure to critical situations and vulnerability to their negative impacts [
24]. In fact, while risk exposure indicates the probability of the occurrence of an emergency, usually due to the physical proximity to a dangerous source (e.g., rivers, lakes, and dams), risk vulnerability is an indication of the predisposition of being affected by critical events when they happen (lower areas where water may accumulate), which may be associated with elevation and slope. In a different way, urban resilience may be associated with the existence of emergency response services (e.g., fire brigades and rescuing centres), which is a factor that reduces the perceived risk. Although meaningful when processed in a combined way, however, the existing literature has mostly been concerned with a single risk perspective, leaving opportunities for improvement.
Flooding events are the most frequent type of urban emergency, impacting cities and resulting in economic losses and many other types of damage [
3]. Recently, a direct link between global warming and an increase in river floods in several cities has also been established [
5,
6], which increases concern regarding how prone big cities will be in the future to river floods. In parallel, the negative impacts of heavy rains on cities have also driven many research works [
25,
26]. In brieg, many studies have focused on risk assessment based on risk exposure or the vulnerability to flooding events.
In order to perform a proper risk assessment in a city, regardless of the considered hazard type and expected optimisation, a lot of urban parameters need to be taken into consideration. For example, air humidity can be considered when computing fire risk in some urban areas [
27], triggering alarms in dangerous conditions. Other approaches could take other types of parameters like demographic data and social indicators, constituting a resilience index for a city [
10]. Regardless, the literature indicates that the effectiveness and coverage of risk assessment approaches are directly linked to some environmental, spatial, temporal, or social urban parameters.
In the specific case of flooding, there are some parameters that must be considered in a risk assessment approach. Initially, it is paramount to define the types of floods that may happen in an urban area: rain and river floods [
11]. Regarding rain floods, lower areas surrounded by higher areas are more prone to flooding. Also, high-slope zones permit water to flow to lower zones and are less prone to flooding in the event of a heavy rainfall. Regarding river floods, the proximity to the river has a considerable impact on the flood risk [
28]. All these elements define risk perceptions based on exposure to a critical event.
Still considering this kind of risk perception, the researchers in [
11] made use of elevation and slope data, among other parameters, from the Eldoret Municipality in Kenya, to classify the flood risk level. Their approach is based on the analytical hierarchy process (AHP) and geographic information systems (GISs) for performing the assessment and was able to generate risk maps for the region with an error level of less than 8%. Also, the work in [
12] made use of elevation and slope, among other parameters, as inputs to a fuzzy support vector machine (FSVM) for assessing the flood risk level in the basin of the Prahova River, Romania. The authors found that the use of FSVM achieved good performance compared to when using other models.
While some researchers have used region-specific data for risk exposure and vulnerability assessments, the existence of flood response services is related to urban infrastructure. In [
9], the authors considered the existence of emergency response infrastructure to compute the vulnerability of each urban area to urban emergencies, in inverse order. In that work, hospitals, fire brigades, and police stations were used as references when computing risk vulnerability, with areas not served as well by those facilities being considered riskier. A similar approach is described in [
29], which provides a highly reconfigurable and open tool to support this type of analysis.
In order to encompass all risk dimensions, this study adopted two publicly and easily accessible data sources as references. The first source was Open-Elevation API, which contains data for the computation of elevation and slope in the zones to allow the assessment of both rain and river flood risks. The second one was OpenStreetMap, which contains the geolocalisation of rivers, enabling the computation of their distances to support the assessment of river flood risk. Moreover, OpenStreetMap can also be used for risk calculation based on urban infrastructure, providing PoIs geolocalisation data, along with the CityZones tool [
29], supporting the computation of emergency response risk. These were the fundamental data sources that were considered when computing our risk in urban areas, as discussed in the next subsections. Therefore, by combining these data sources and our proposed algorithms for flood risk assessment, to the best of our knowledge, we fill a research gap.
3. Materials and Methods
The flood risk assessment of any urban areais based on three general parameters: (a) the expected flood risk resulting from heavy rain, (b) exposure to flood due to the proximity to rivers, and (c) the existing urban flooding response capability, considering using the presence and proximity to response centres that may perform some mitigation actions. Overall, certain hazards (low slope, low elevation, and proximity to rivers) increase the probability of damage caused by flooding, increasing the computed risk perception. There is, in fact, a historical association of these factors with flooding, as discussed before. Moreover, after a flood-related emergency happens, response centres can mitigate the resulting damage and support rescue operations, having an opposite effect than the identified hazards.
In general, hazard, risk, and vulnerability are intertwined concepts that have a direct influence on the urban dynamics of emergencies. In our approach, these fundamental concepts are described as follows:
Risk: This is the probability that an associated emergency occurs. If a zone has high risk of flood, that zone is assumed to be more prone to flooding (an emergency) when a river rises or a heavy rainfall occurs.
Hazard: This is any threat that may trigger an emergency, depending on defined safety thresholds and security parameters. In this sense, the proximity to a river or low-elevation areas are examples of hazardous conditions regarding the risk of flooding.
Vulnerability: This indicates how well an area may recover from an emergency event. In our assessment approach, the proximity to response centres, which may act to mitigate an emergency, reduces the zones’ vulnerability.
Putting all these concepts together, the urban parameters from different perspectives can provide important data when computing how risky each zone is, which is highly practically significant. We treat them in a data-driven geospatial fashion, defining a generic approach that is easily applicable to any city in the world provided that the required parameters can be retrieved.
Generally, many other parameters presented in the literature may influence the risk level of a city regarding flood events [
30]. However, our approach performs risk assessment based solely on publicly and freely available data with minimum configurations, providing a generalist approach that can be used for virtually any city. Additionally, our approach may be extended to incorporate new parameters, making it possible to gather other data and insert them into the risk assessment equation.
Before presenting the details of the proposed approach, some fundamental definitions are required, as presented in the next subsections.
3.1. Area of Interest
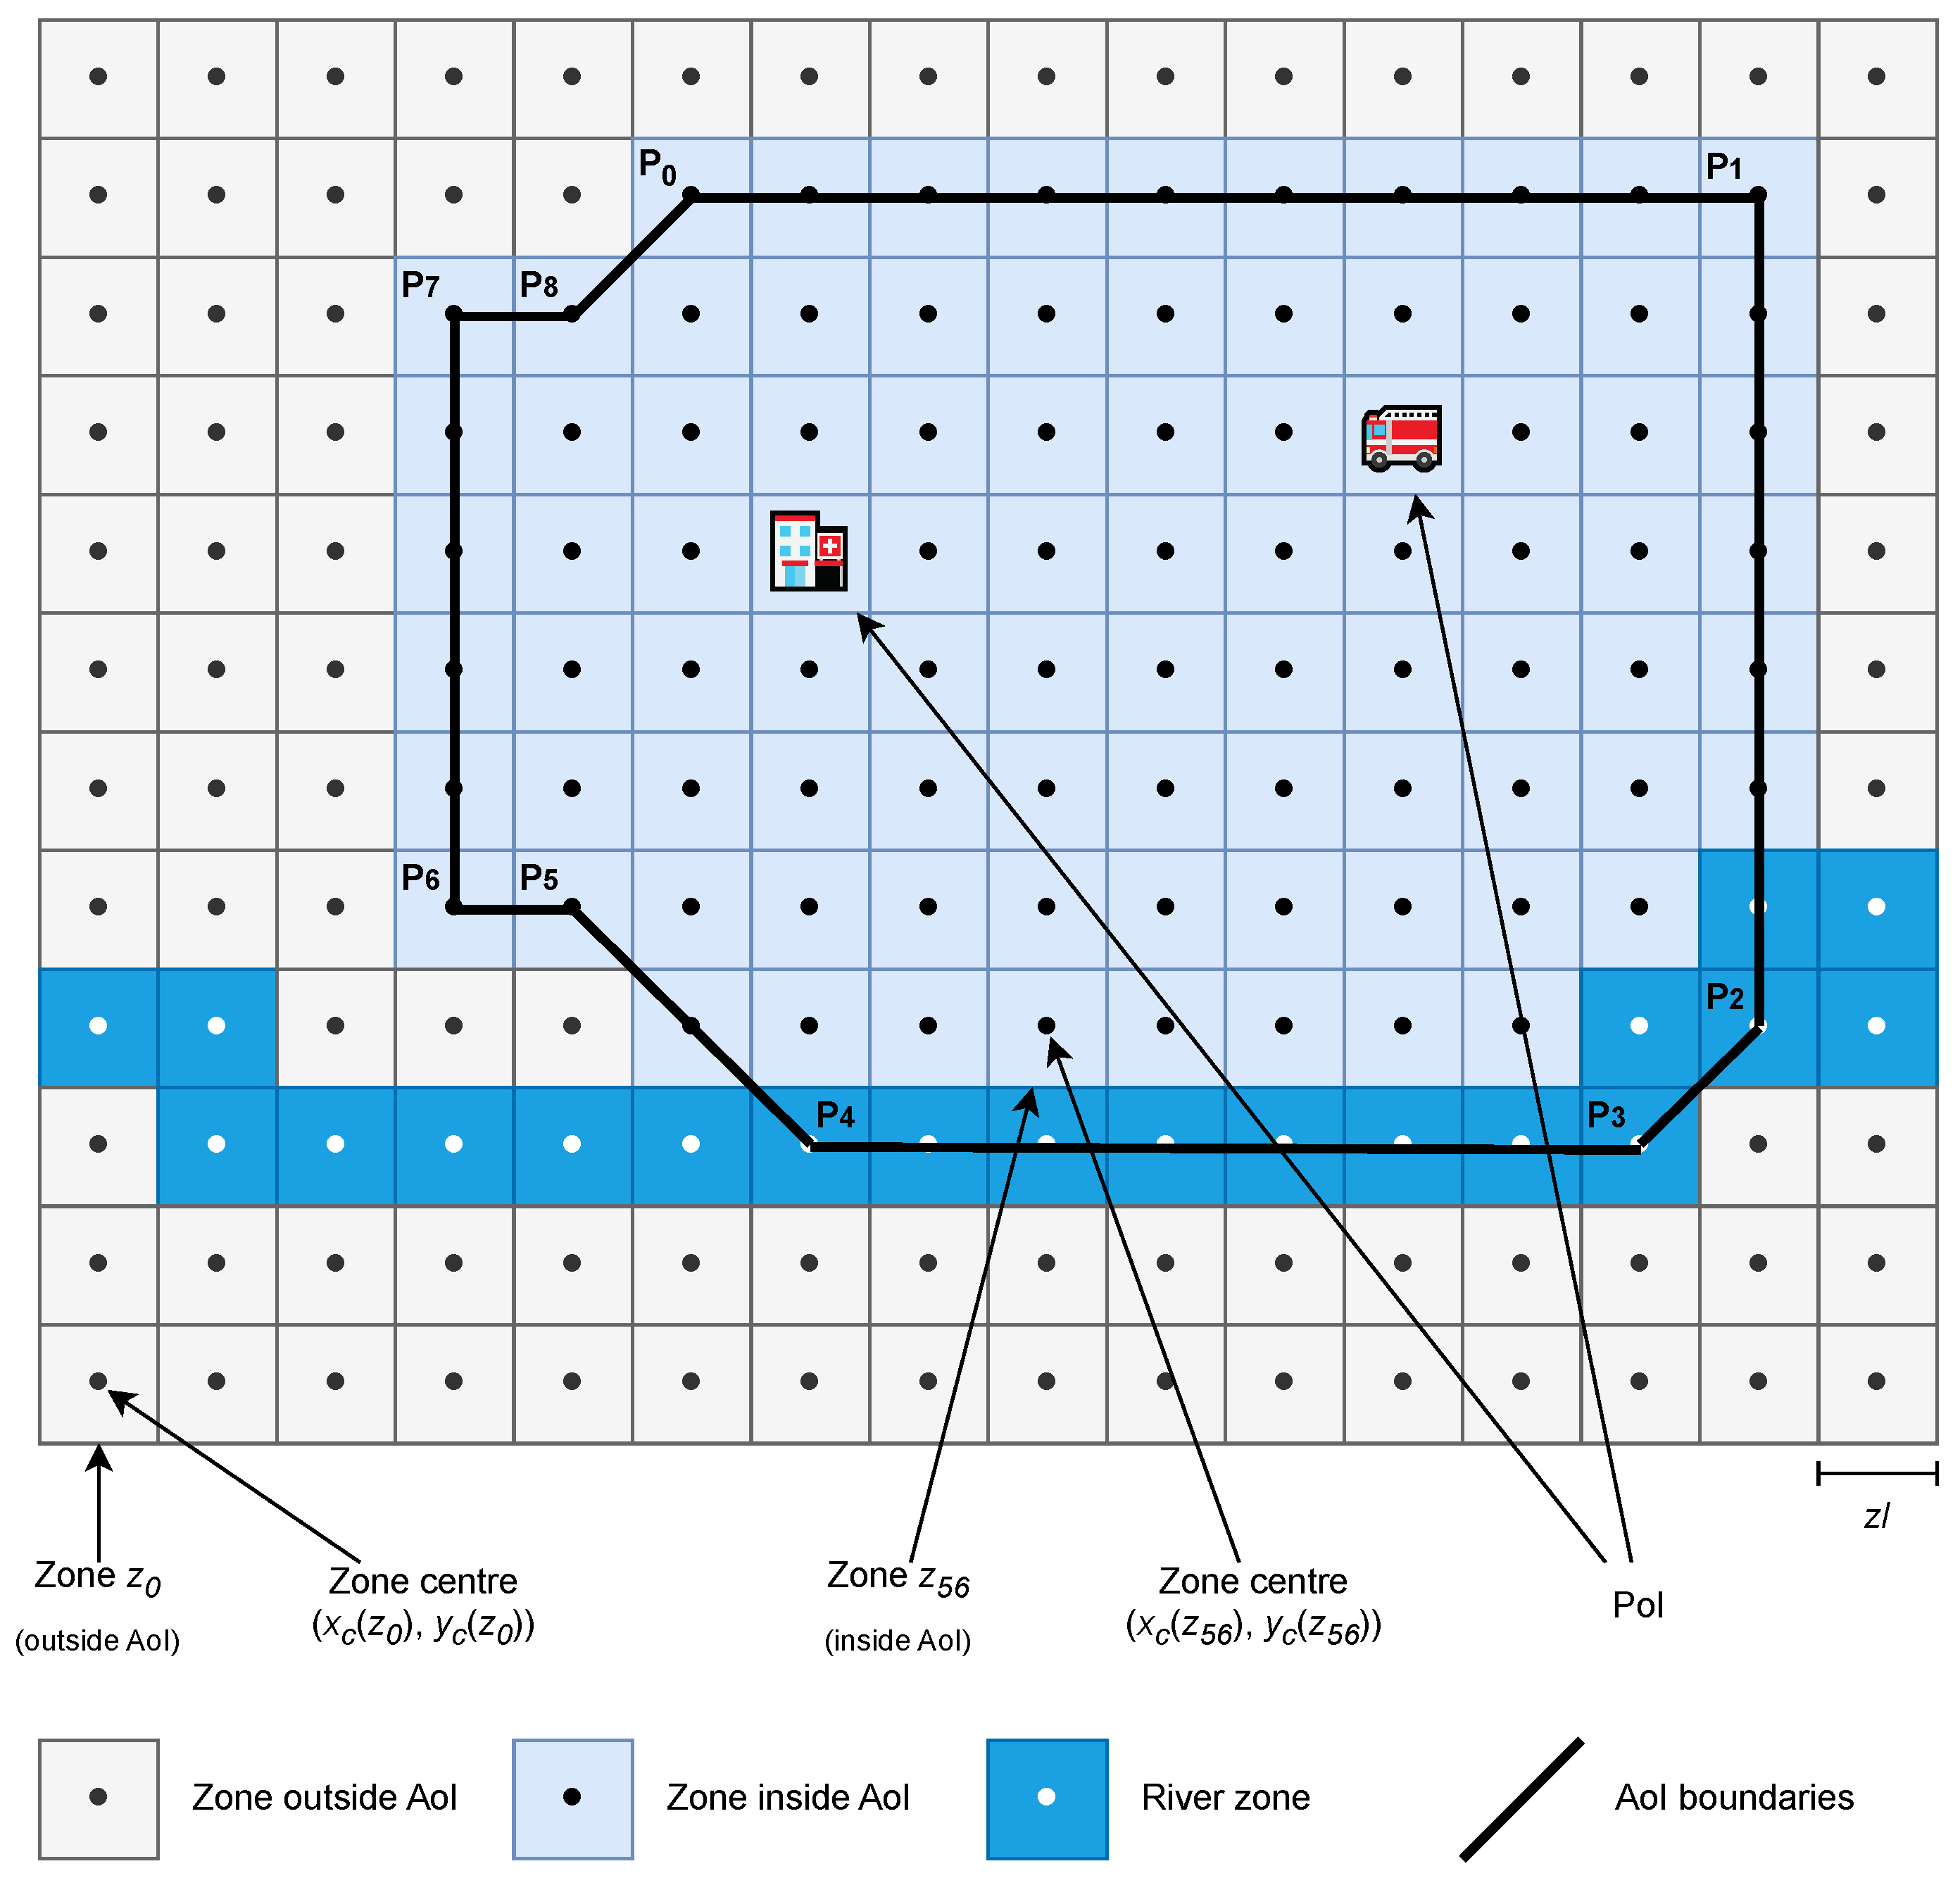
To assess an urban area regarding combined flood risk, its perimeter must be initially delimited. Our model defines a polygon area referred as the area of interest (AoI), which is segmented into small zones, forming a grid-like structure. These zones are the core element of the proposed assessment process, encompassing the fundamental parameters that are used as input when the final flood risk perception. Here, each zone is defined as squares of fixed size and location position (centre of the defined square) for zones and . The position of each zone is required when calculating the distance of each zone to the modelled elements.
Some of the zones may be positioned in an area covered by a river, referred as “river zones”. The set of river zones, denoted by , is a subset of Z, and every river zone has the same attributes as an ordinary zone plus the river’s flood quota (described in rhw next subsection). If there is more than one river in the AoI, each river zone takes the flood quota of the river to which it belongs.
An AoI is a polygon that encompass a region of the city that will be classified. In this sense, an AoI is defined by a set of line segments
S that connect the pairs of points
forming the polygon defined by
. Set
S can be directly defined by a stakeholder or retrieved from geographic information system (GIS) data as Shapefiles or GeoJSON files. We exploited the work in [
29] to retrieve emergency response data and implemented this function using GeoJSON files containing multipolygon data to define an AoI, which we adopted as a reference in this study. After delimiting an AoI, some zones may be inside or outside the delimited area, requiring the exclusion of the zones outside the AoI from the proposed risk assessment process. In other words, the final grid-like structure of the zones is entirely covered by the defined polygonal area, excluding the zones where the point
is outside the polygonal area of the AoI.
The area of interest must be carefully defined as it limits the effective area considered in flood risk assessment. For example, in the assessment of a whole city, a polygon comprising the borders of the city can be defined as an AoI. However, if an assessment of the risk levels of zones within a more specific region is desired, the AoI should be reduced and limited to the effective target region, improving the significance of the results.
3.2. Emergency Response Infrastructure
Each emergency response infrastructure in a city is defined as a point of interest (PoI), which is basically defined by its GPS position. The nature of a PoI is typically standardised so it can be processed in a more generic way, which is helpful during a flood. In this sense, fire brigades are of great importance in mitigating critical situations and supporting people in the vicinity of a flooded area, mostly due to their rescue capabilities during emergencies. Similarly, police stations and hospitals have an important role when coordinating rescue operations and attending to victims.
In a scenario of multiple PoIs, a weight value for each of them may be used to determine their level of importance in the assessment process. For example, fire brigades may be more important than hospitals in the mitigation process; thus, they might have a higher weight. Nevertheless, in order to make this general weighting problem more tractable and flexible to enable application in any city, each PoI may have the same relevance and impact during a flood in a common case, but stakeholders and specialists may define specific weights for them.
A PoI is defined by its GPS position at
for any given point of interest
, where
P is the set of PoIs, and
is the number of PoIs within the defined AoI [
9].
Figure 1 depicts the zones within an AoI, highlighting the PoIs. The value of
defines the size of the zones and the resolution of the grid, i.e., the smaller the zone, the larger the number of zones forming the grid. Small values for
can provide more details in the classification results but at a higher computation cost. On the other hand, the bigger the AoI, the greater the chance of finding PoIs. Although the value for
can be freely defined by the user of the proposed approach, it is recommended that it matches the digital terrain model (DTM of source data. For example, if using remote sensing data of
, a zone length
makes the zones in the AoI match the pixels in the remote sensing data.
4. Proposed Approach
The next subsections present the proposed mechanisms for computing flood parameters (risk perceptions) and the unified flood risk assessment.
4.1. Elevation Data: Rain-Flood Risk
After the grid is defined and an AoI is delimited, the zones can be assessed according to different parameters associated with urban flooding. The first considered parameter is related to the zones’ relief, since it impacts how water accumulates during an emergency.
When computing flood risk, elevation is a good parameter for obtained a general perception of vulnerability, which is, in fact, a measured level of “susceptibility” to negative effects in this case [
11,
12,
13]. From the elevation data of the zones, it is also possible to compute slopes to better perceive such risk. While lower zones can accumulate water in the event of a heavy rainfall, water on a high-gradient slope flows quickly. The combination of both characteristics gives us a unified perception of how likely a zone is to retain water, which we define as the rain flood risk.
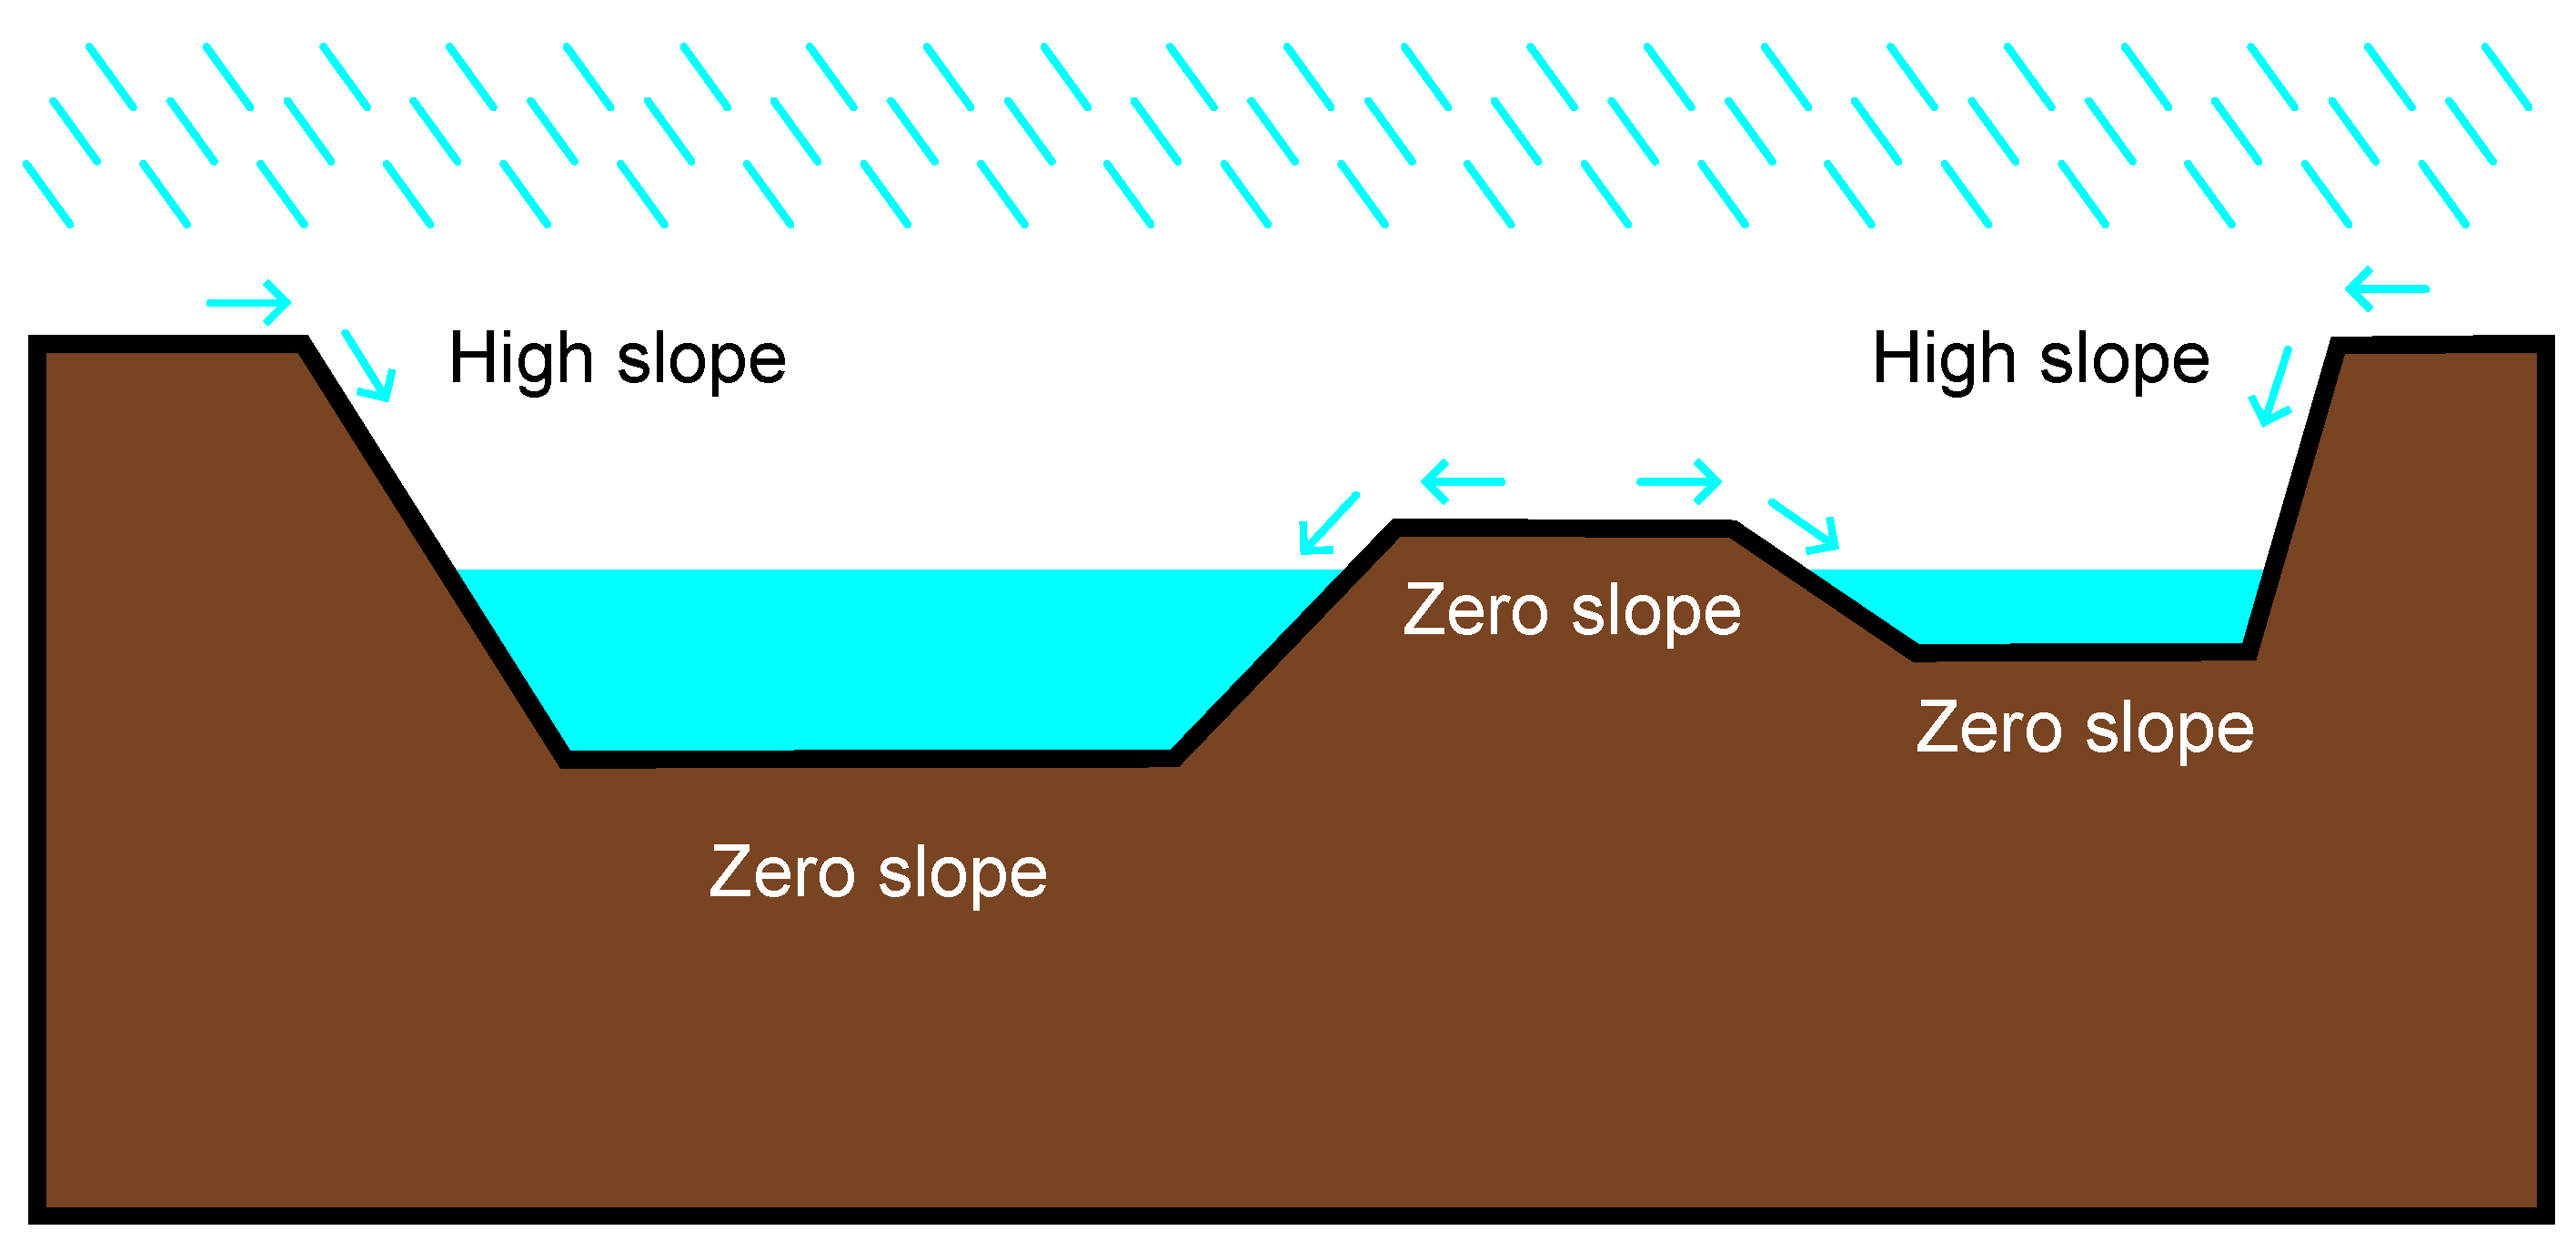
Figure 2 shows typical water flow on a terrain with different slopes. Rain water flows down from high-elevation zones, accumulating in lower areas with low-gradient slopes. Although some areas may be lower than others, if they have a higher-gradient slope, water flows down and does not accumulate.
Having modelled both types of data, we were able to compute how vulnerable a zone is regarding a rain flood event by combining its elevation and slope. As aforementioned, high-elevation reduces (heavy) rain flood risk, while lower elevation increases it. In addition, high-gradient slopes reduce rain flood risk. The computation of the rain flood risk
H of a zone
z, defined as
, is performed as described in Equation (
1).
In this computation, the elevations of the zones are normalised in the range of
, as shown in Equation (
2). In fact, the rain flood risk in a zone is relative to that in the other zones within the AoI; thus its meaning is constrained to this defined area. Thus, the average elevation zone has a value of
, while that of the lower zone is
, and that in the higher zone is
. In this range, the average elevation in zone
is
, providing the reference value for elevation parameters.
The slope gradient is the highest ratio of the height difference between the surrounding zones and the zone size (
). Suppose a set of zones
in the vicinity of zone
z; then, the slope gradient is calculated as shown in Equation (
3). This is computed for every zone
surrounding zone
z, and the maximum computed value is defined as
. If the zones have the same elevation, the slope gradient is 0. A difference in height that produces a
angle returns a slope gradient of 1. In this sense, flat surfaces have a value of 0, having no interference in the computation of the rain flood risk obtained from the elevation data. However, as long as the gradient slope rises, it reduces the rain flood risk computed from the elevation data. This is because although a zone may have a lower altitude, water does not accumulate if it flows downward due to the gradient slope [
11].
4.2. Fluvial Data: River Flood Risk
Another relevant parameter in flood risk assessment is the presence of rivers within the AoI. In some situations, it is common that a river crossing a city rises high enough (usually due to heavy rain) and floods its surroundings, which must be properly considered by authorities when pursuing flood resilience. It is important to account the presence of a river in the computation of the unified flood risk assessment of the zones, since this factor is expected to increase the overall flood risk.
The first considered element in this particular assessment is the distance from the river. For each zone within the AoI, we calculated its distance to the nearest river, since this factor will have the most significant impact on the flood risk. This distance is relevant because the closer a zone to that river, the higher its exposure to river-originated flooding. The work in [
31] shows that even at a distance of 100 m from a river, a location is still prone to flooding by the river, thus this factor must be properly considered.
Not all rivers are the same. Some rivers may dangerously rise during heavy rains, while some do not rise at all. As such, a river flood exposure assessment equation cannot use the distance from the river as a unique parameter, since the historical flooding behaviour of a river must also be considered. In this sense, a core element used in our approach is the river flooding history, denoted as “flood quota”. This element indicates the highest historical flood elevation of the river, i.e., how high that river has risen in the past. For example, the Seine River in Paris has a historical flood elevation of 8.80 m (which occurred in 1658) [
32]. In this case, that elevation would be the reference value for flood elevation in our computation for that city. Then, having the historical flood elevation of the river in an AoI, zones with a value lower than that will probably suffer in the next flood event. Although it does not mean that the river will reach the historical elevation in every next flood event, history tells us that such a level has been reached before; thus, it is not an unrealistic assumption. Furthermore, even though some rivers have been “tamed” by the construction of dams and canals in modern cities, climatic changes are already changing precipitation, making it hard to predict how the rivers will rise in the near future. With all that said, the highest historical level seems to be a good indication for the intended flood assessment.
Therefore, the proposed river flood risk (exposure) computation combines the historical flood quota
of the considered river and the normalised distance of the zones from it, achieving a balanced risk parameter that affects the final assessment of each zone, as shown in Equation (
4).
In order to determine the river flood risk, we identified zones that are affected by a river, processing them separately. This way, the set of all river zones within the limits of the AoI, comprising the subset , supports the computation of , for every zone . The value of is inversely proportional to the normalised distance to the modelled river if the zone elevation (for a zone outside the river area) is equal to or lower than the elevation (for a zone within the river area), plus the flood quota of that river (). Otherwise, the river-flood risk is 0 for that zone.
If there is more than one river within the AoI, Equation (
4) computes an exposure value for each zone
z considering each zone
r (over a river) for all rivers. Since different rivers may have different historic flood elevations, the parameter
returns the historic flood level regarding the river containing the considered zone
r. Doing so, we provide a flexible mechanism to consider the impacts of the rivers in any urban configuration.
After the performed computations for every zone
z, the final river flood risk is deteremined, as presented in Equation (
5). In this assessment, the considered value is the maximum computed river flood risk, since we assume the worst case scenario as the reference.
4.3. PoI Data: Emergency-Response Risk
The flood risk in each zone can also be assessed according to the existing urban emergency mitigation capability, which is accounted for with the proximity to response centres (PoIs). When a flood occurs and the local authorities are notified (using phone calls, sensors, or any other means), the typical mitigation procedures begin. First responders like paramedics, fire responders, and police agents move toward the flooded area to take the needed actions. Since time is crucial to reduce the number of victims, these agents need to arrive at their destination as soon as possible. This way, assistance is provided earlier when affected zones are closer to the PoIs, which is thus an important factor for decreasing flood risk.
Each zone has an emergency response risk perception (
E) based on its distance to every PoI. Zones closer to PoIs have a lower risk perception value than more distant zones. Hence, the risk perception of a zone
z, defined as
, is shown in Equation (
6).
The emergency response risk perception of a zone
z is computed by taking the inverse of the square distances of that zone to every PoI
multiplied by the PoI’s weight
, according to the formulations proposed in [
9,
29]. Then, since this is a risk-reducing factor, we take its inverse value. In this equation, the more distant a zone
z from the PoIs, the higher its emergency response risk parameter
(which means it has fewer urban services, on average).
4.4. Flood Risk Assessment
Having calculated the rain flood risk (how vulnerable a zone is to heavy rain), river flood risk (exposure of a zone to a nearby river), and emergency response risk (how well served by public services a zone is during an emergency), the proposed assessment approach combines the three parameters to produce a unified flood risk level for every zone.
Figure 3 presents the overall processing flow for the proposed approach.
The goal of the proposed assessment approach is to provide an overview of urban flood risk, identifying areas (zones) that will be most affected by flooding, on average, taking open databases as references. The idea is to numerically evaluate the impact of water accumulation and how the response centres in a city will act to mitigate the eventual conditions. In this sense, a unified flood risk level can be exploited to produce useful heatmaps from the combination of elevation, river zones, and PoI localisation. Equation (
7) defines how to compute the unified risk level of each zone,
.
From Equation (
7), the unified flood risk of a zone
z is represented by its rain flood risk
, which can be mitigated by the presence of response centres, considered in its risk perception
. In any case, the presence of a river increases the zone’s flood risk by totaling the river flood exposure
. Since not every city has a river, the value of
may be 0 in some cases, having no influence in the unified flood risk of the zones.
Equation (
7) also demonstrates a generalist approach that allows several layers containing other parameters that are valuable to an assessment process to be considered. For example, we added the rain-flood risk
by multiplying it to the emergency-response risk
, but other formulations could be proposed. In fact, we expect a “plugabble” effect, making it easy to implement other assessment procedures and mixing them together to achieve an overall picture of the risk zones of an AoI, depending on the expected risk modelling.
After computing the unified flood risk for each zone, our approach classifies each zone into one of a group of predefined classes. The number of classes is parameterised and is denoted by
M, i.e., if
, the classification model sets each zone a risk class ranging from 1 to 3 (low, medium, and high risks, with 3 being the riskiest). Equation (
8) describes the risk class computation of a zone, which adopts natural logarithmic behaviour for the risk classification since it is very reasonable for urban planning [
33,
34].
A value of
means that the zone has the lowest risk level among the zones within the AoI, i.e., this zone is not very vulnerable to rain flooding, it is near several PoIs (enabling faster initiation of an emergency mitigation procedure), and it has little exposure to river floods. The worst case is when
, which means that zone
z has the highest risk of a rain flood, the poorest positioning regarding the distance to and localisation of the PoIs, and very high exposure to river flooding. Intermediate values are obtained in situations that one bad parameter may be compensated by a good parameter. Once again, it is important to remark that the class of a zone is relative to the defined AoI due to the employed normalisation process, so making comparisons among different areas of interest is pointless.
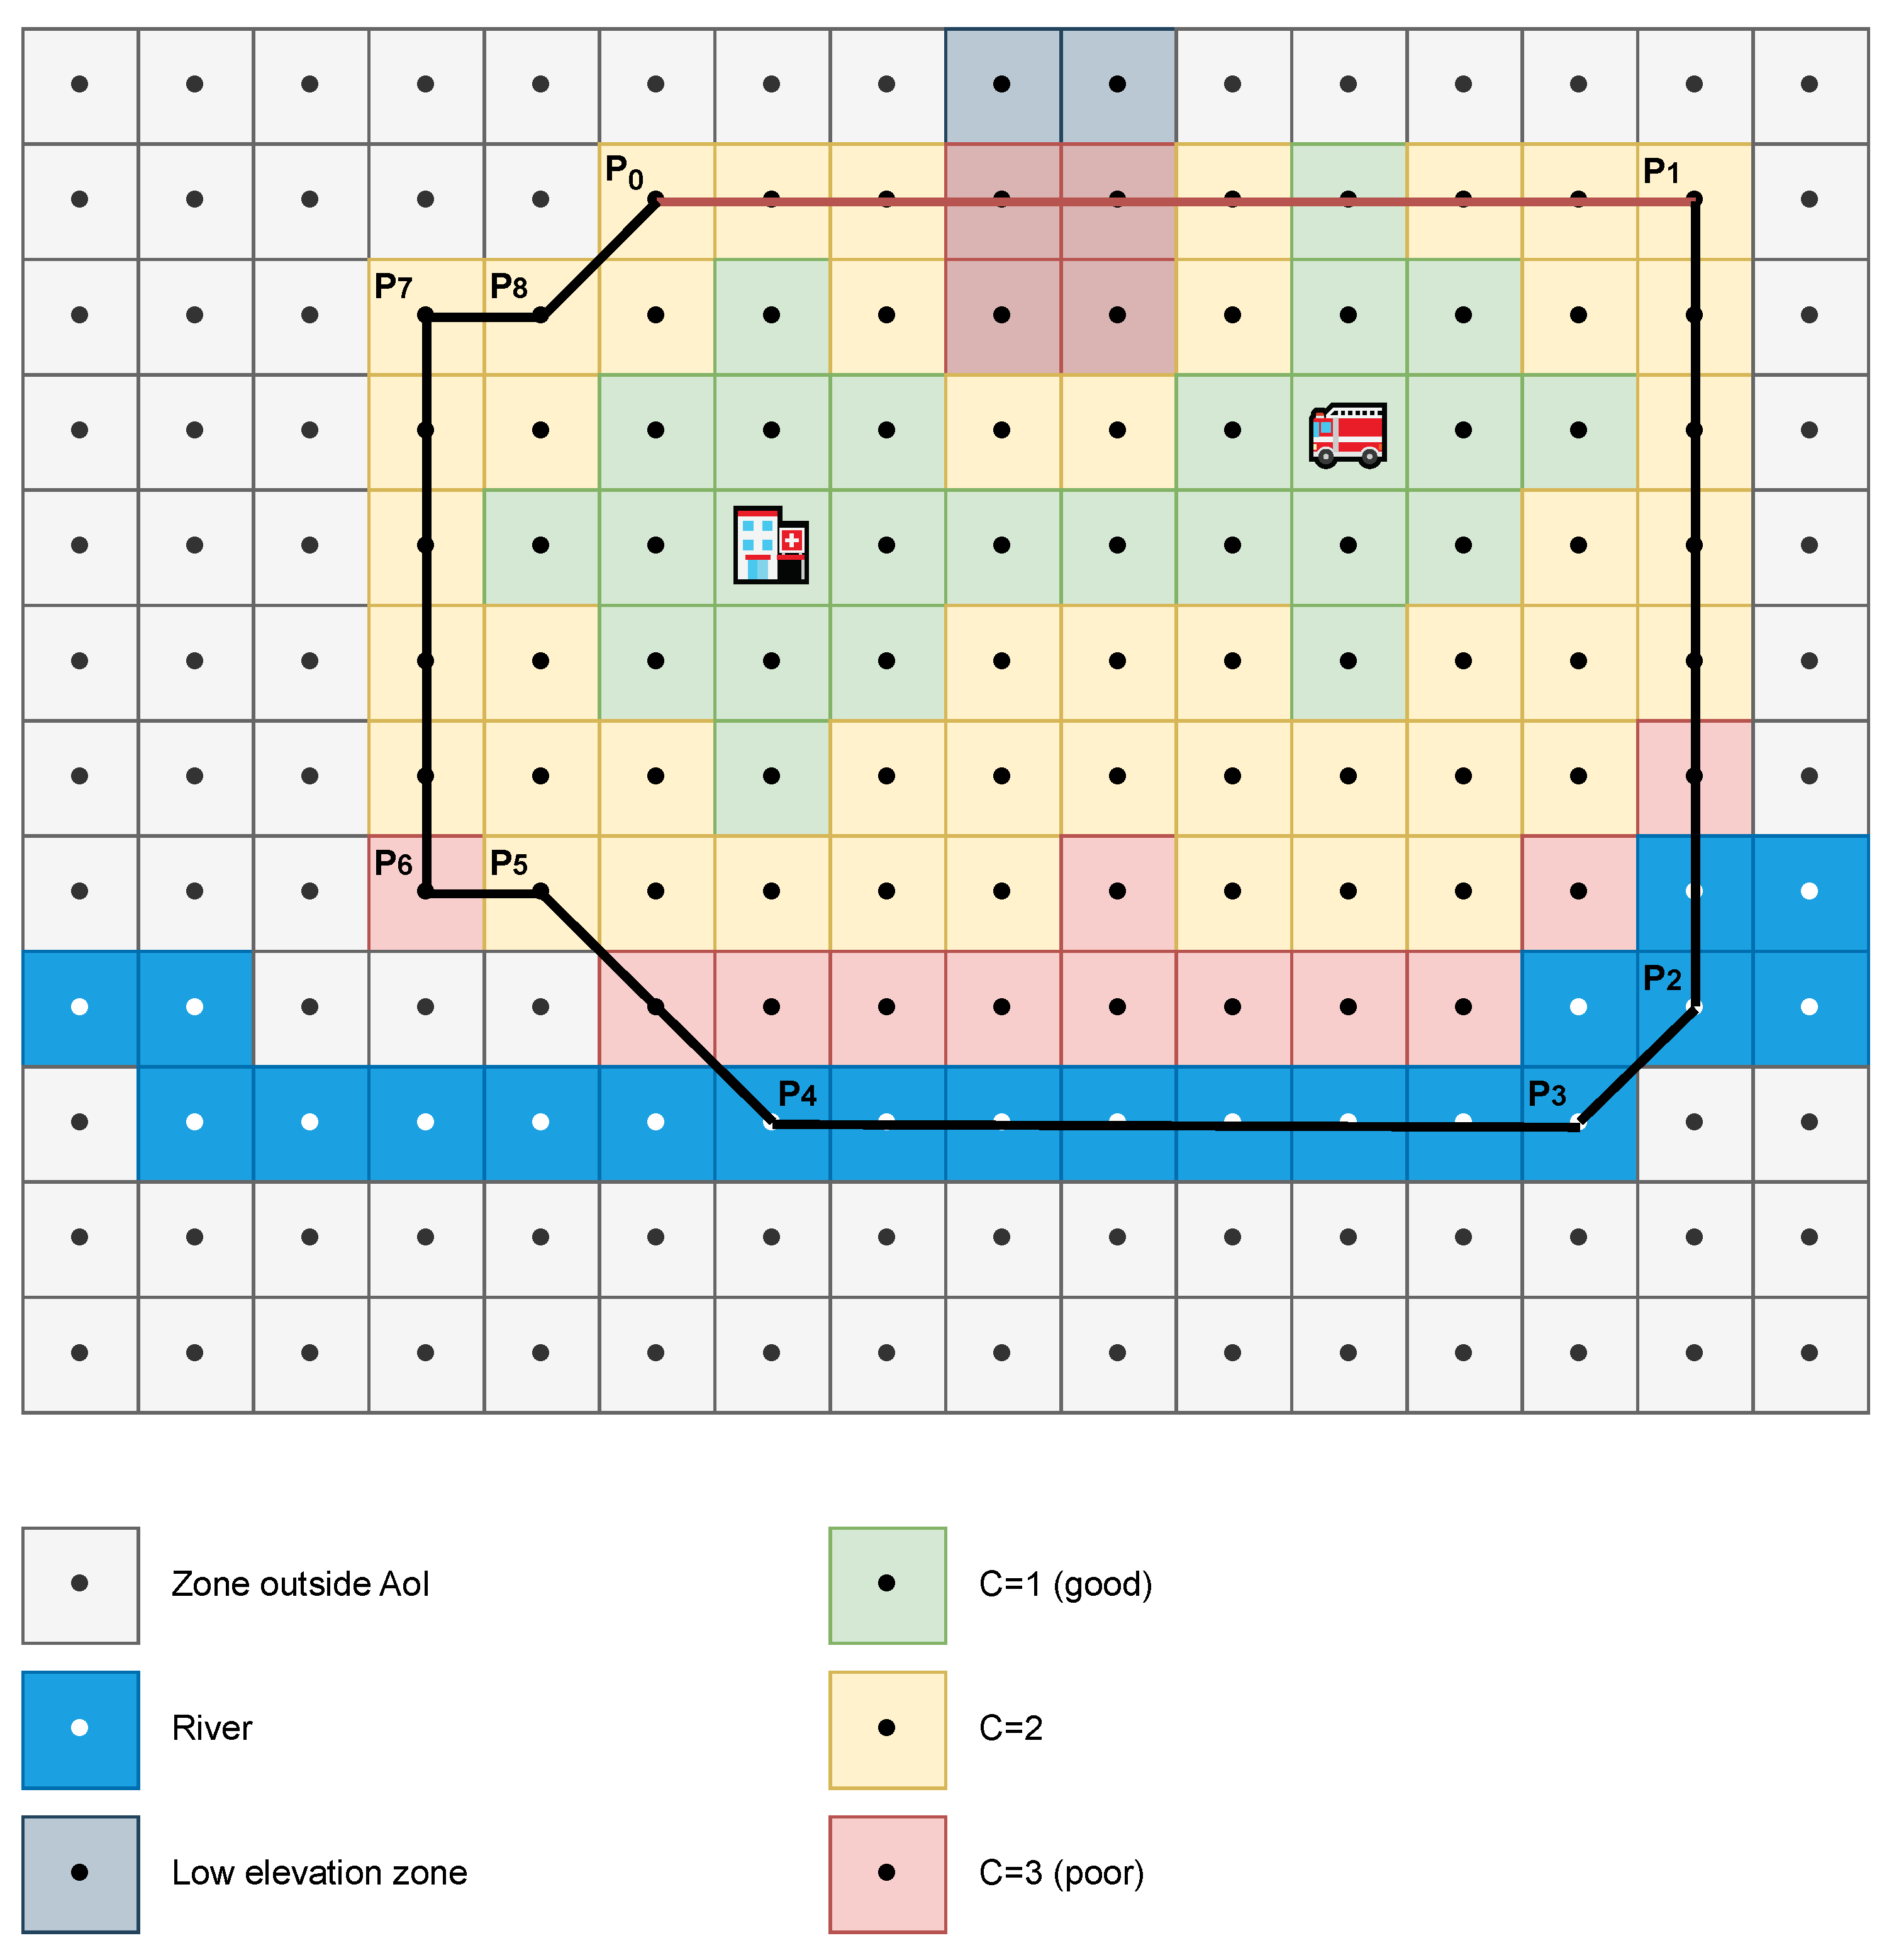
Figure 4 demonstrates a visual example of this risk computation.
In
Figure 4, the four zones at the top have a high risk classification level (red) because they have low elevation (grey squares) and thus are prone to rain flood, whilst the zones at the bottom of the figure have a high risk classification due of their proximity to the river. The other zones have medium (yellow) or low (green) risk levels owing to their proximity to risky zones and/or response centres (one hospital and one fire station). This figure also highlights the list of vertices of the AoI (from P
0 to P
8).
5. Experiments and Achieved Results
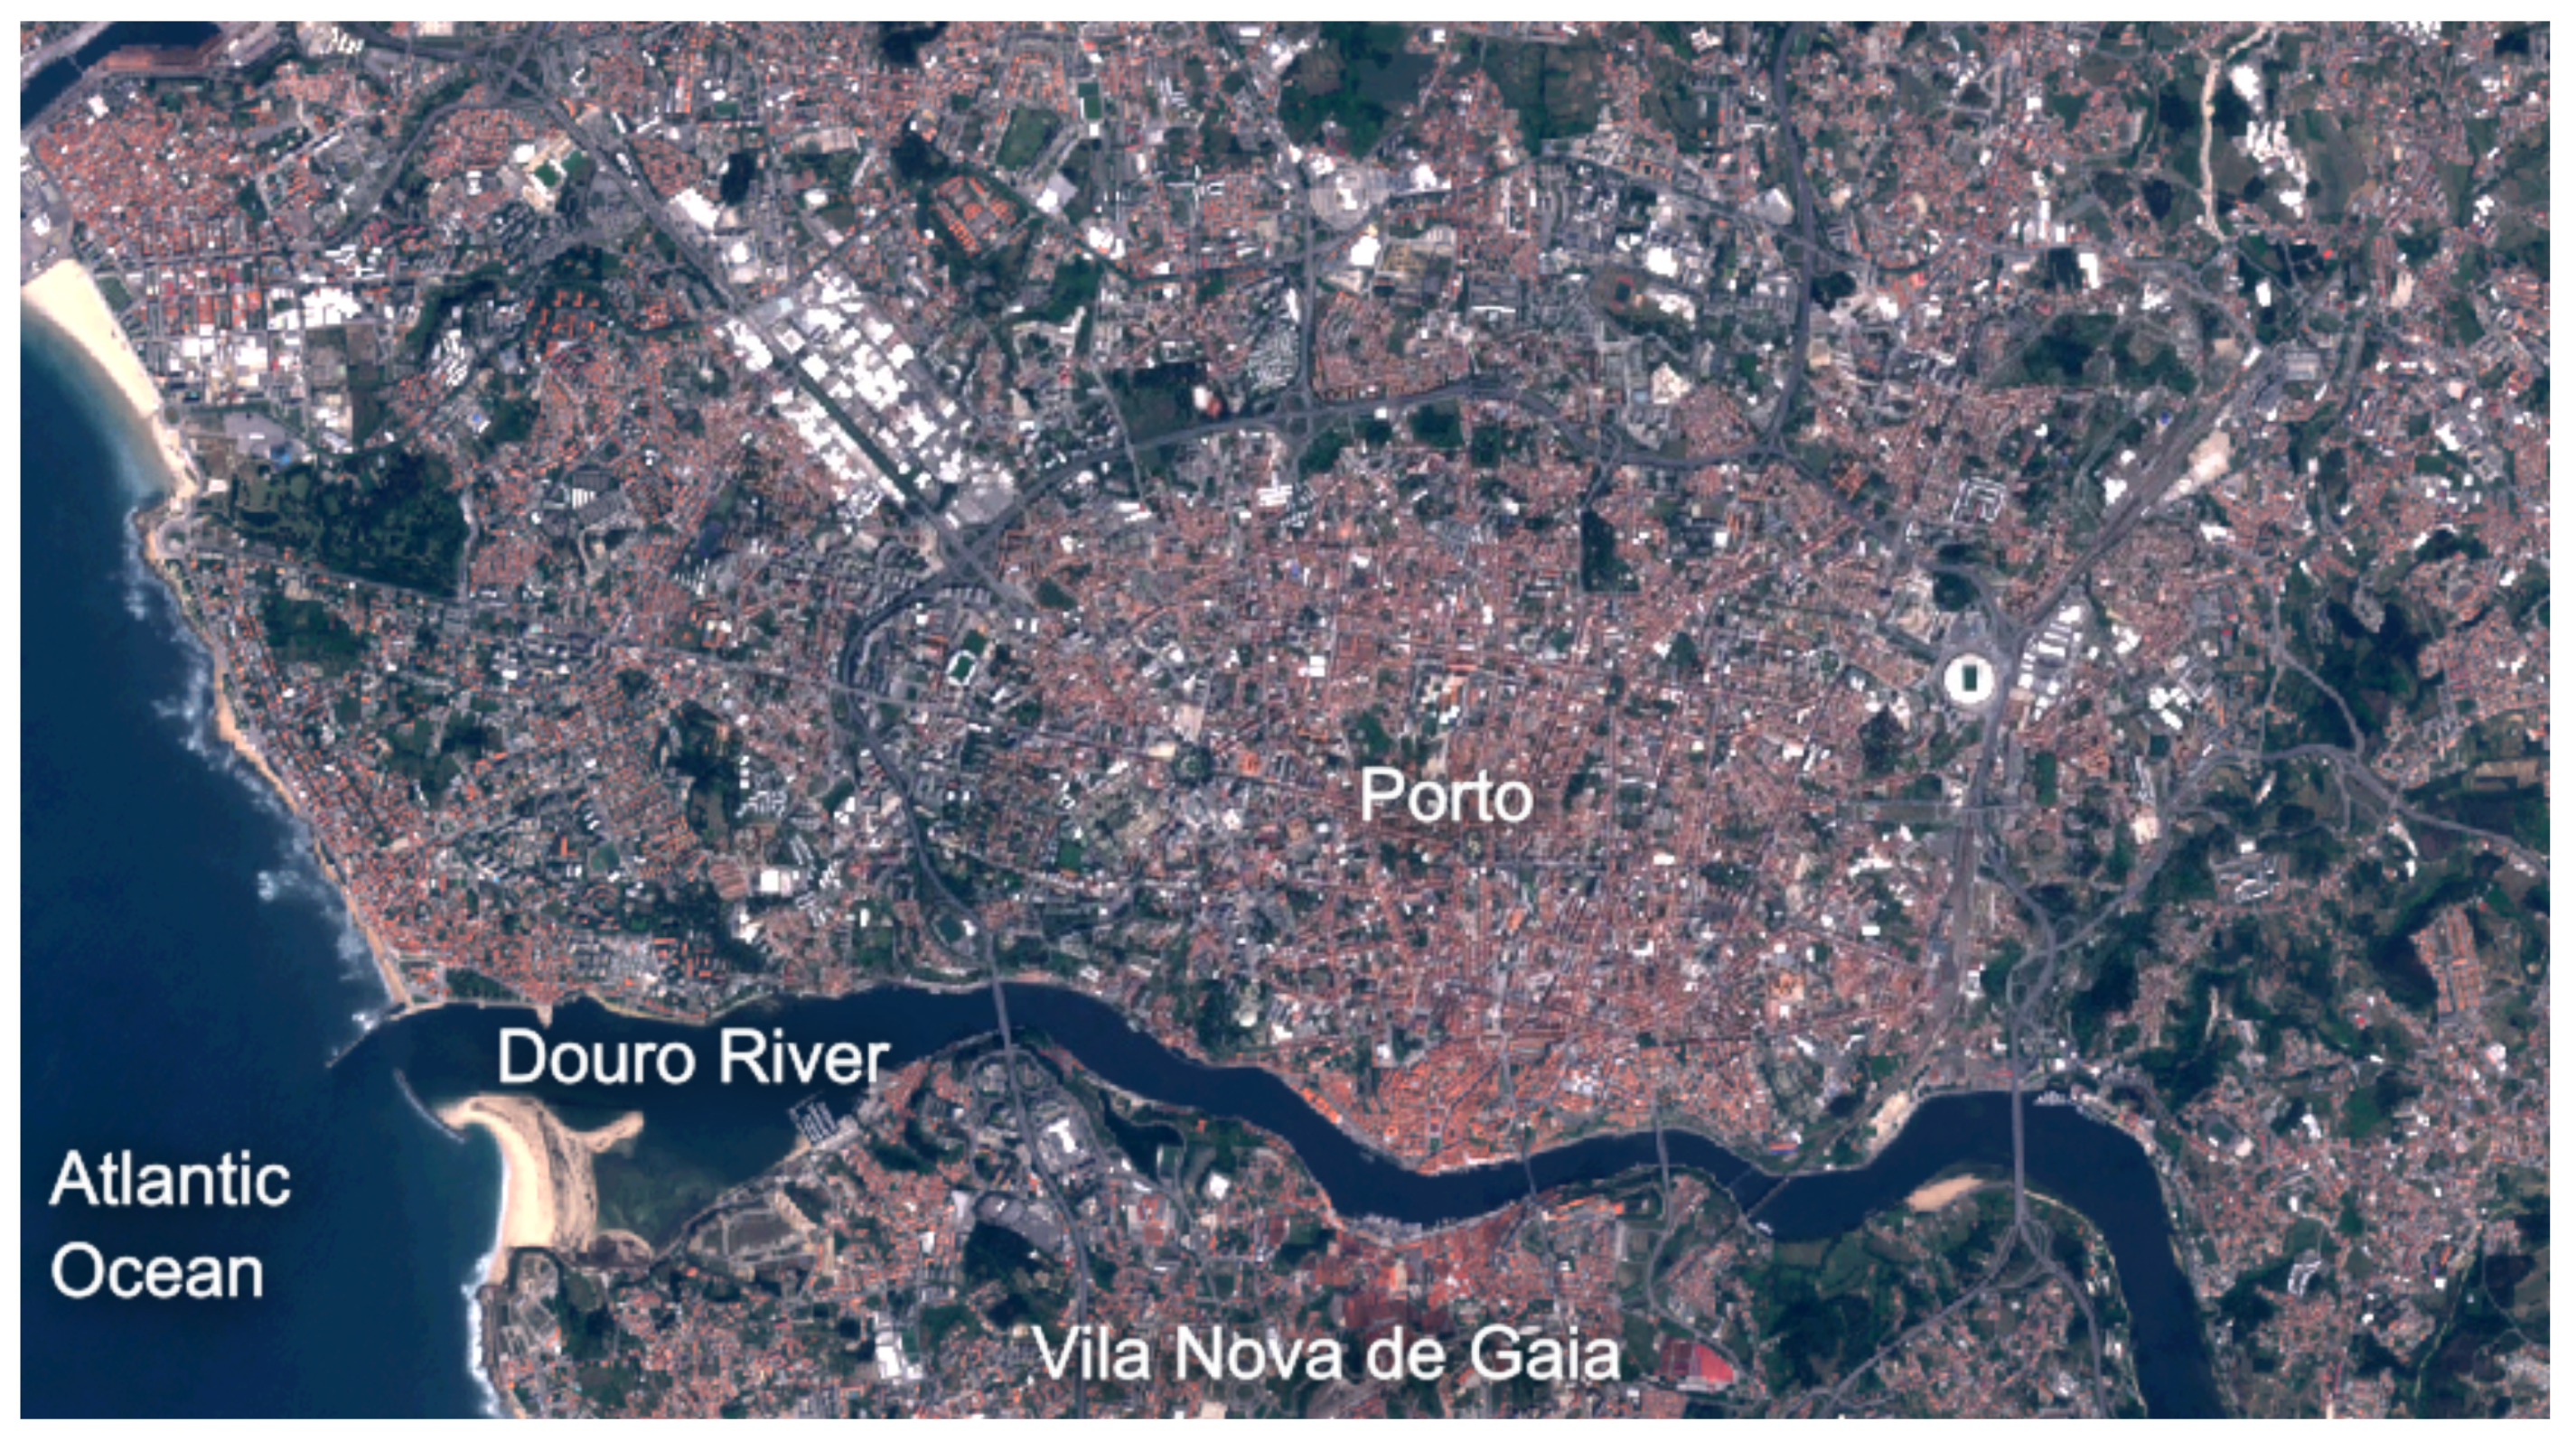
Porto, a historic city situated along the banks of the Douro River in northern Portugal, was chosen as the target city for the evaluation of our proposed approach. It is the second largest city in Portugal, renowned for its cultural heritage, vibrant atmosphere, and economic significance. However, its geographical location near the Douro River places it at risk of flood events, making it an ideal case for flood risk assessment.
Figure 5 presents a satellite view of the city, highlighting its flood-prone terrain.
The city of Porto holds a special place in the context of flood risk assessment due to its historical and contemporary susceptibility to river flooding. The Douro River, which flows through Porto before reaching the Atlantic Ocean, has been the site of recurrent flood events over the centuries. Historical flood data for the Douro River in Porto provide a rich repository of information on past flood events, their extent, and the resulting damage. These events have left an indelible mark on the city’s infrastructure and inhabitants.
The highest flood elevation in the history of Douro River along the city of Porto was
in 1909 [
35]; thus, this was the considered value for Equation (
5). The AoI was delimited to the boundaries of the city, and the retrieved PoIs were fire brigades, police stations, and hospitals.
At this point, an important aspect is the proper selection of the relevant weights for the PoIs. Usually, firefighters and police agents are the first responders that act in mitigation processes when a river flood occurs in Portugal, while hospitals are used to provide medical assistance to the victims and as hubs to dispatch and receive incoming ambulances. Although ambulances and hospital services are needed in a flood event, firefighters may be perceived as the most important responders in such mitigation scenarios, followed by police agents. But, the opposite may also a reasonable choice, with police agents being more relevant depending on the cities’ characteristics and emergency strategies. In this sense, in order to define a reference for the experiments, the weight for fire brigades was empirically set to 10 and the weight for police stations was set to 5, while that of hospitals was set to 4, meaning that fire brigades were twice more important than police stations, which, in turn, were slightly more relevant than hospitals in our experiments. Although we defined those weights, different values could be used in the same approach since our approach does not define fixed weights for any PoI.
The algorithms were executed on a computer with a 6-core AMD Ryzen 5 4600H 3.0 GHz processor, 16 GB of RAM, running Debian GNU/Linux 12. All the code was implemented using the Python 3.11 language, making use of the MultiProcessing library.
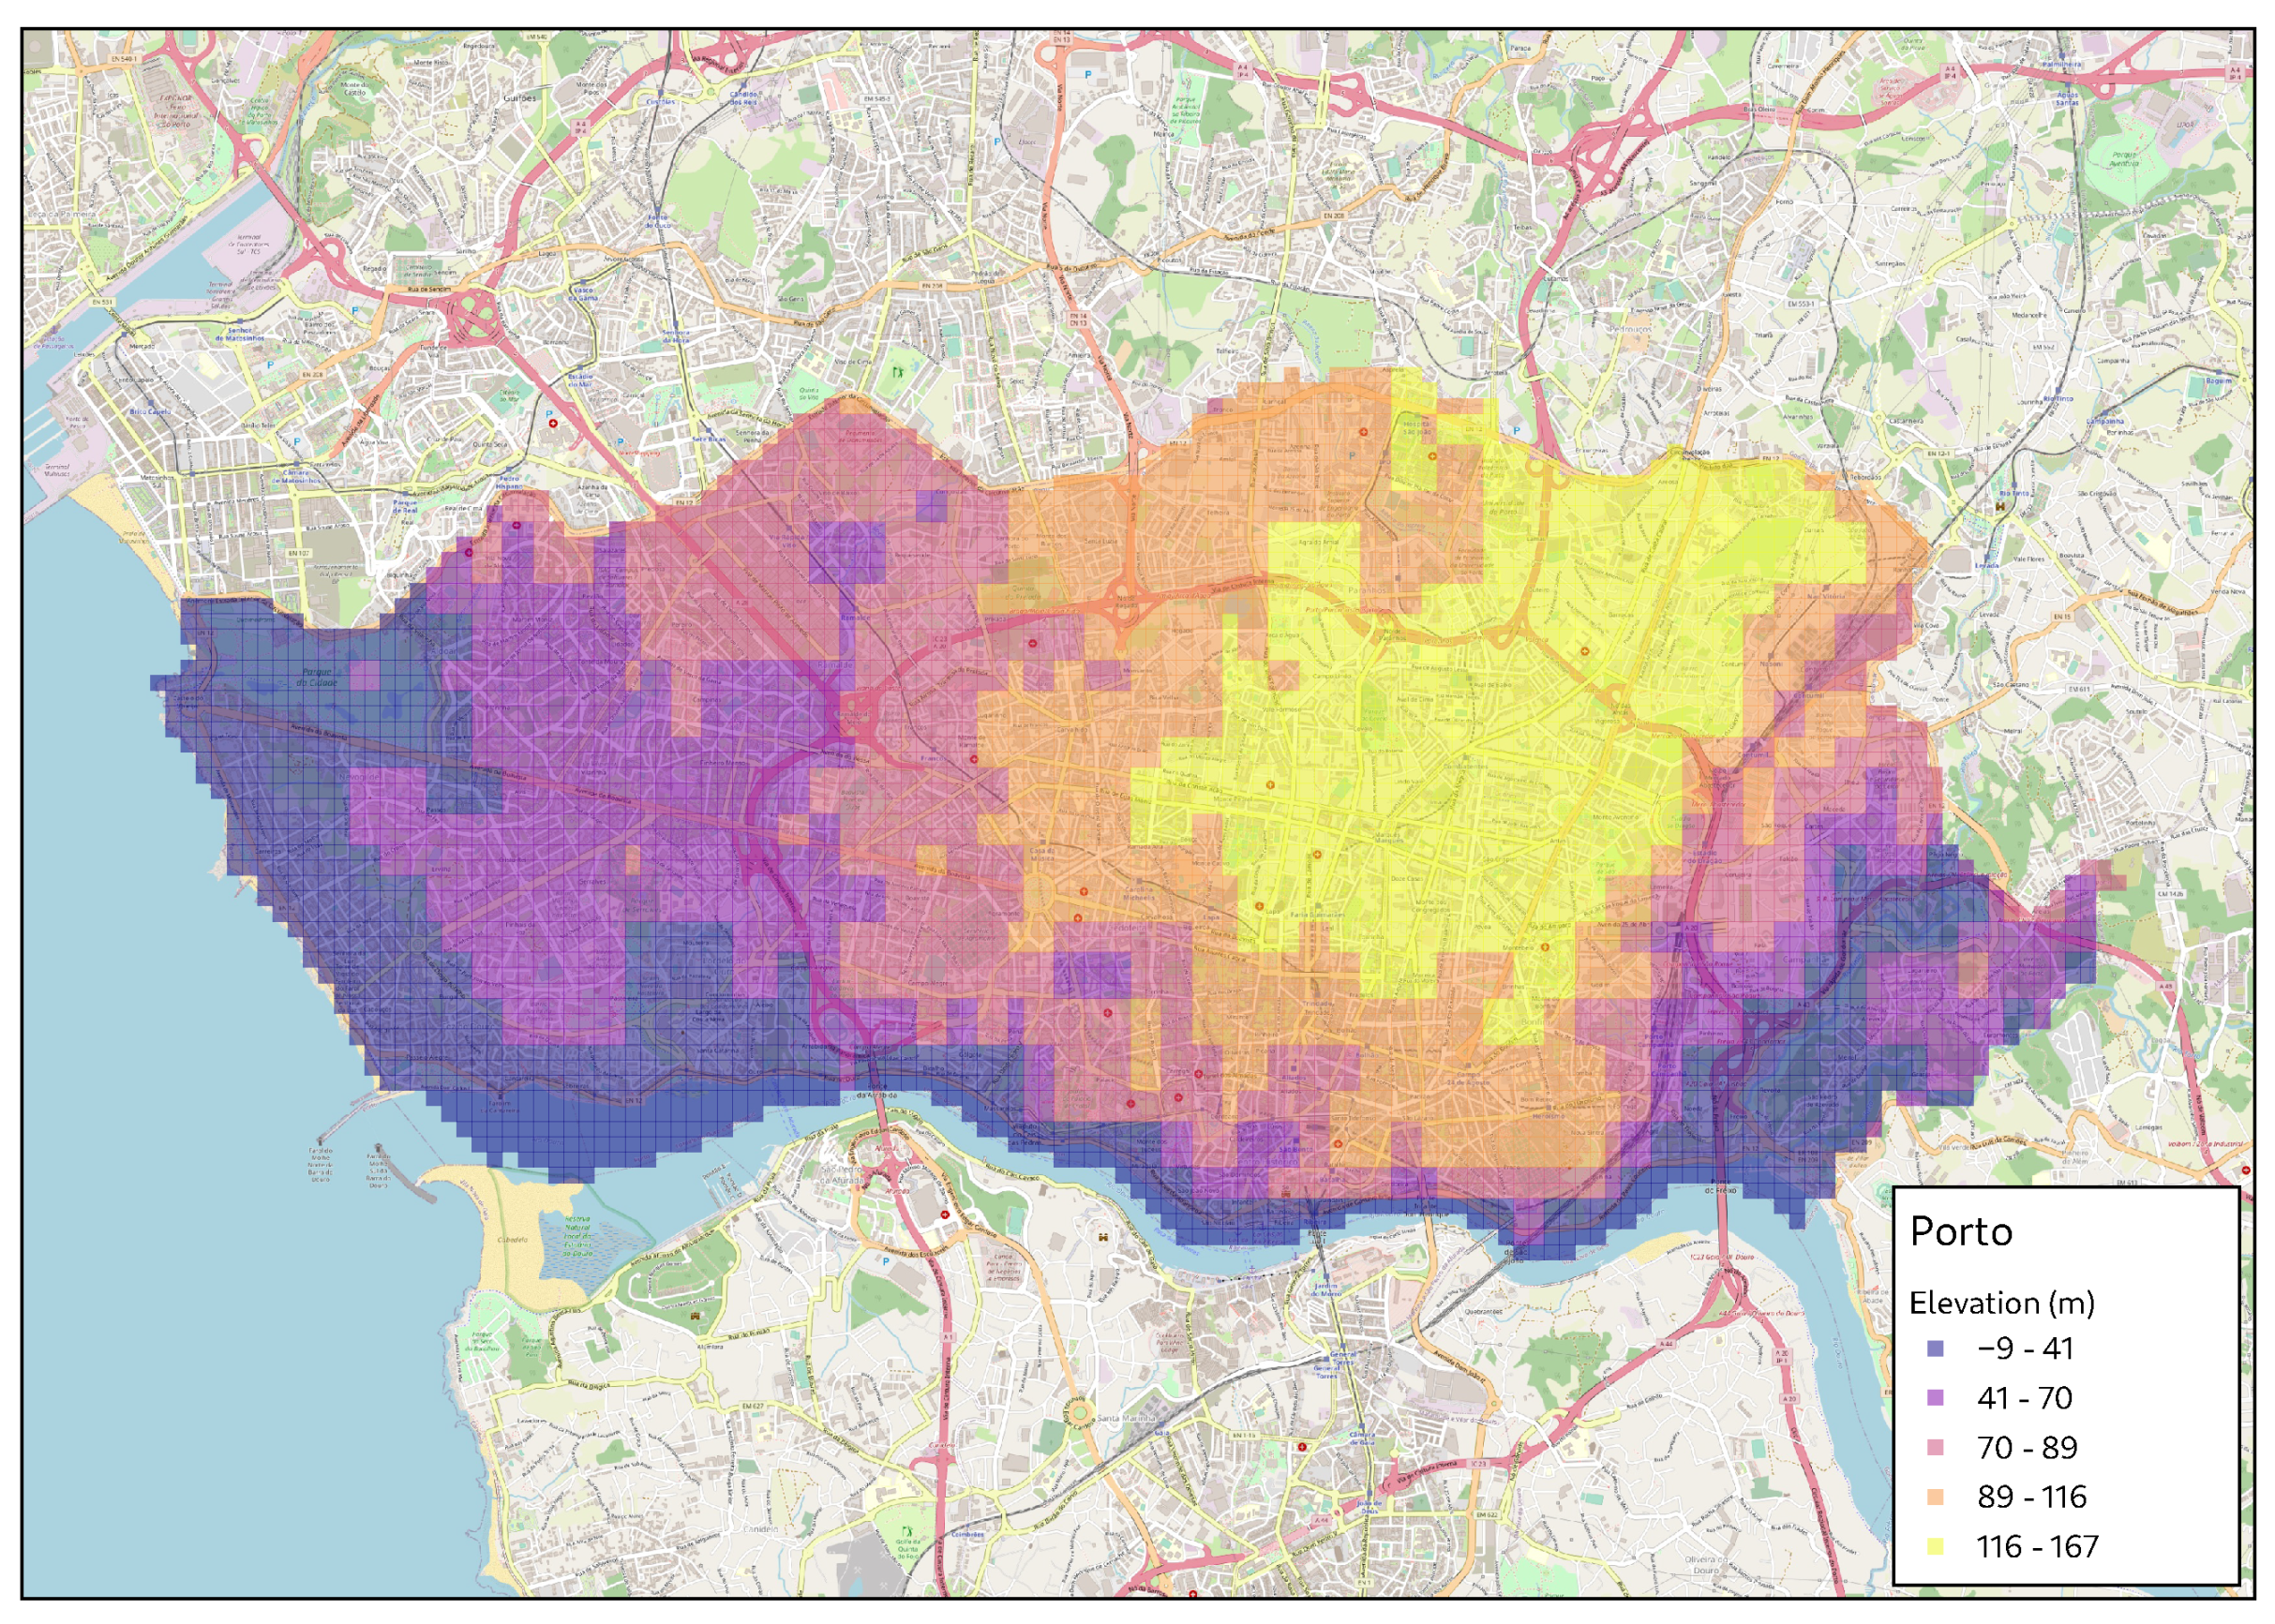
Figure 6 presents the elevation of every zone within the defined AoI, created using Open-Elevation API, for zones with
m matching Open-Elevation’s DTM. As expected, the elevations of the zones near the coast and banks of the Douro River are lower, being potentially more affected by water accumulation during a flood.
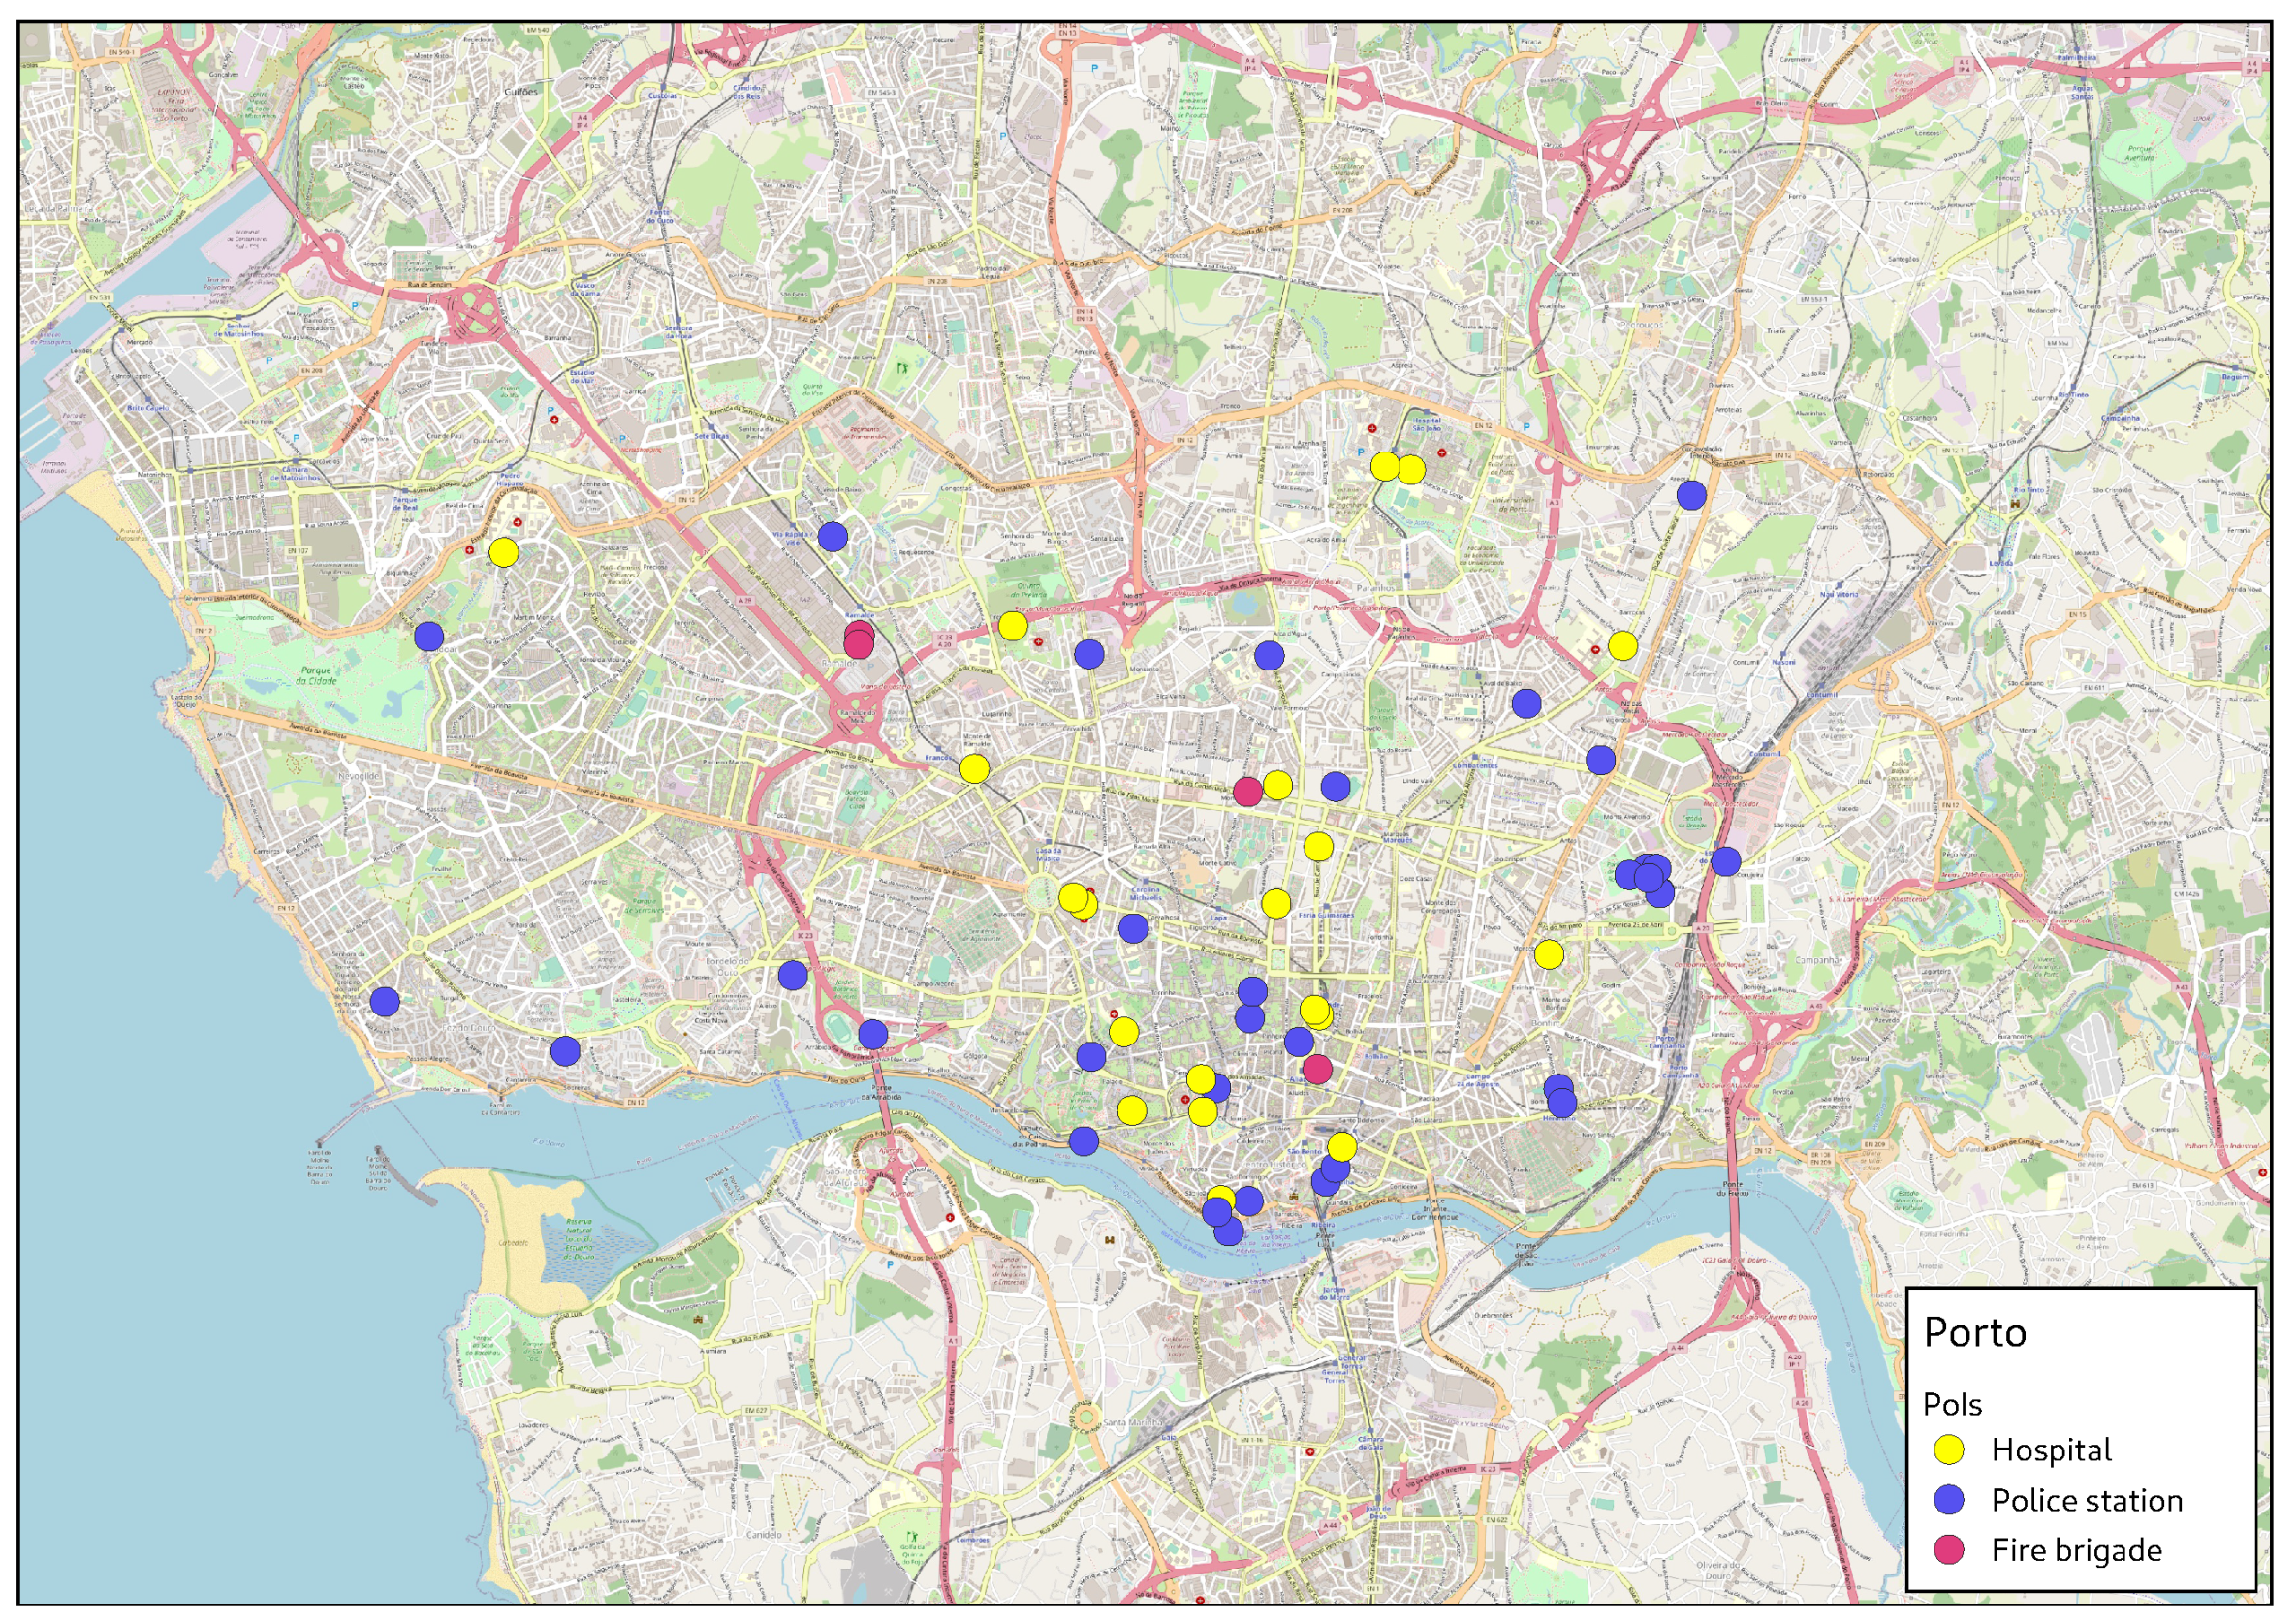
The retrieved list of PoIs within the defined AoI is depicted in
Figure 7. The colour of the dots represents the PoI type in our experiments.
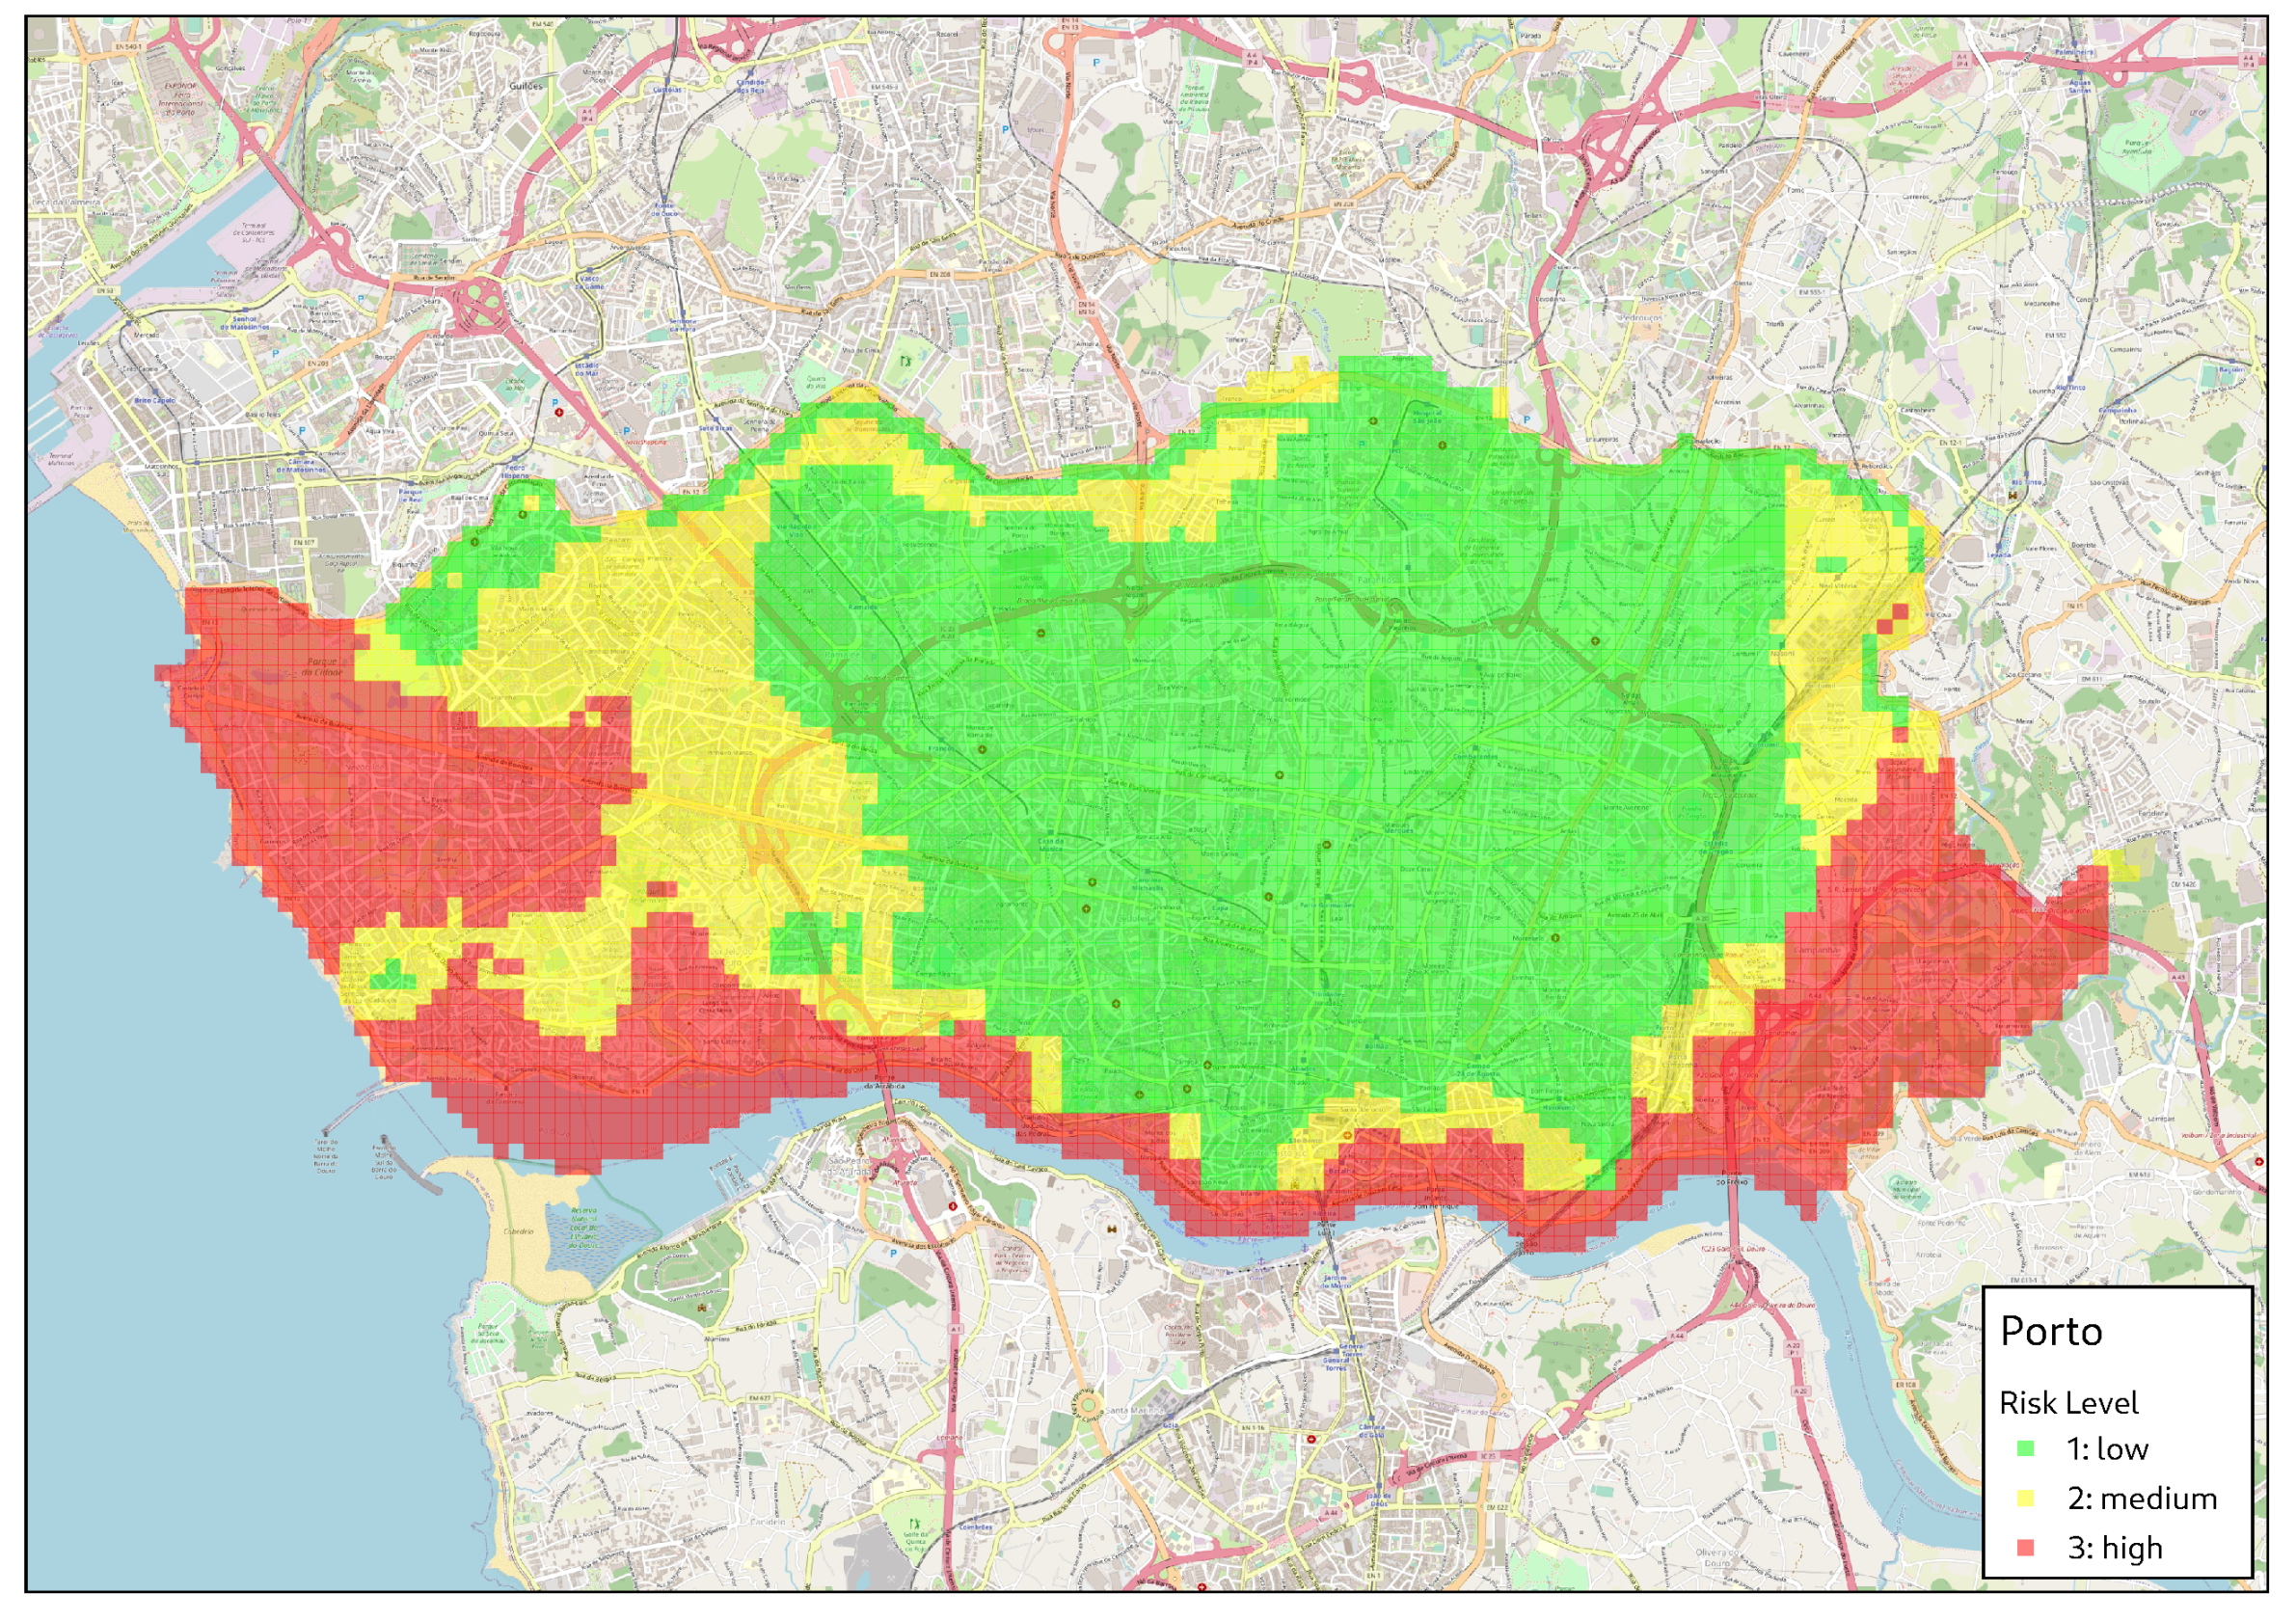
Figure 8 shows the final flood risk classification for the city of Porto, combining the three computed risk parameters. In the figure, zones with lower risk are classified as
(green), while the riskiest zones are
(red). When analysing the results presented in
Figure 8, they match the flooded areas reported in [
35,
36]. In both works, the authors presented the effects of the Douro River’s historical floods, including a map of Porto and Gaia depicting the most affected zones. These zones were at the Douro riverside, showing similarity to the results of our approach. In fact, our approach also considers rain flood risk, classifying other zones as high risk like the ones in the left region of Porto. However, the effect of heavy rain on the city of Porto is harder to compare, mainly due to the fact that previous works focused on larger regions and districts, as in [
19,
37]. This is, in fact, one of the key aspects of our approach: allowing fine-grained small-scale flood risk classification within cities of any size, providing results not presented before.
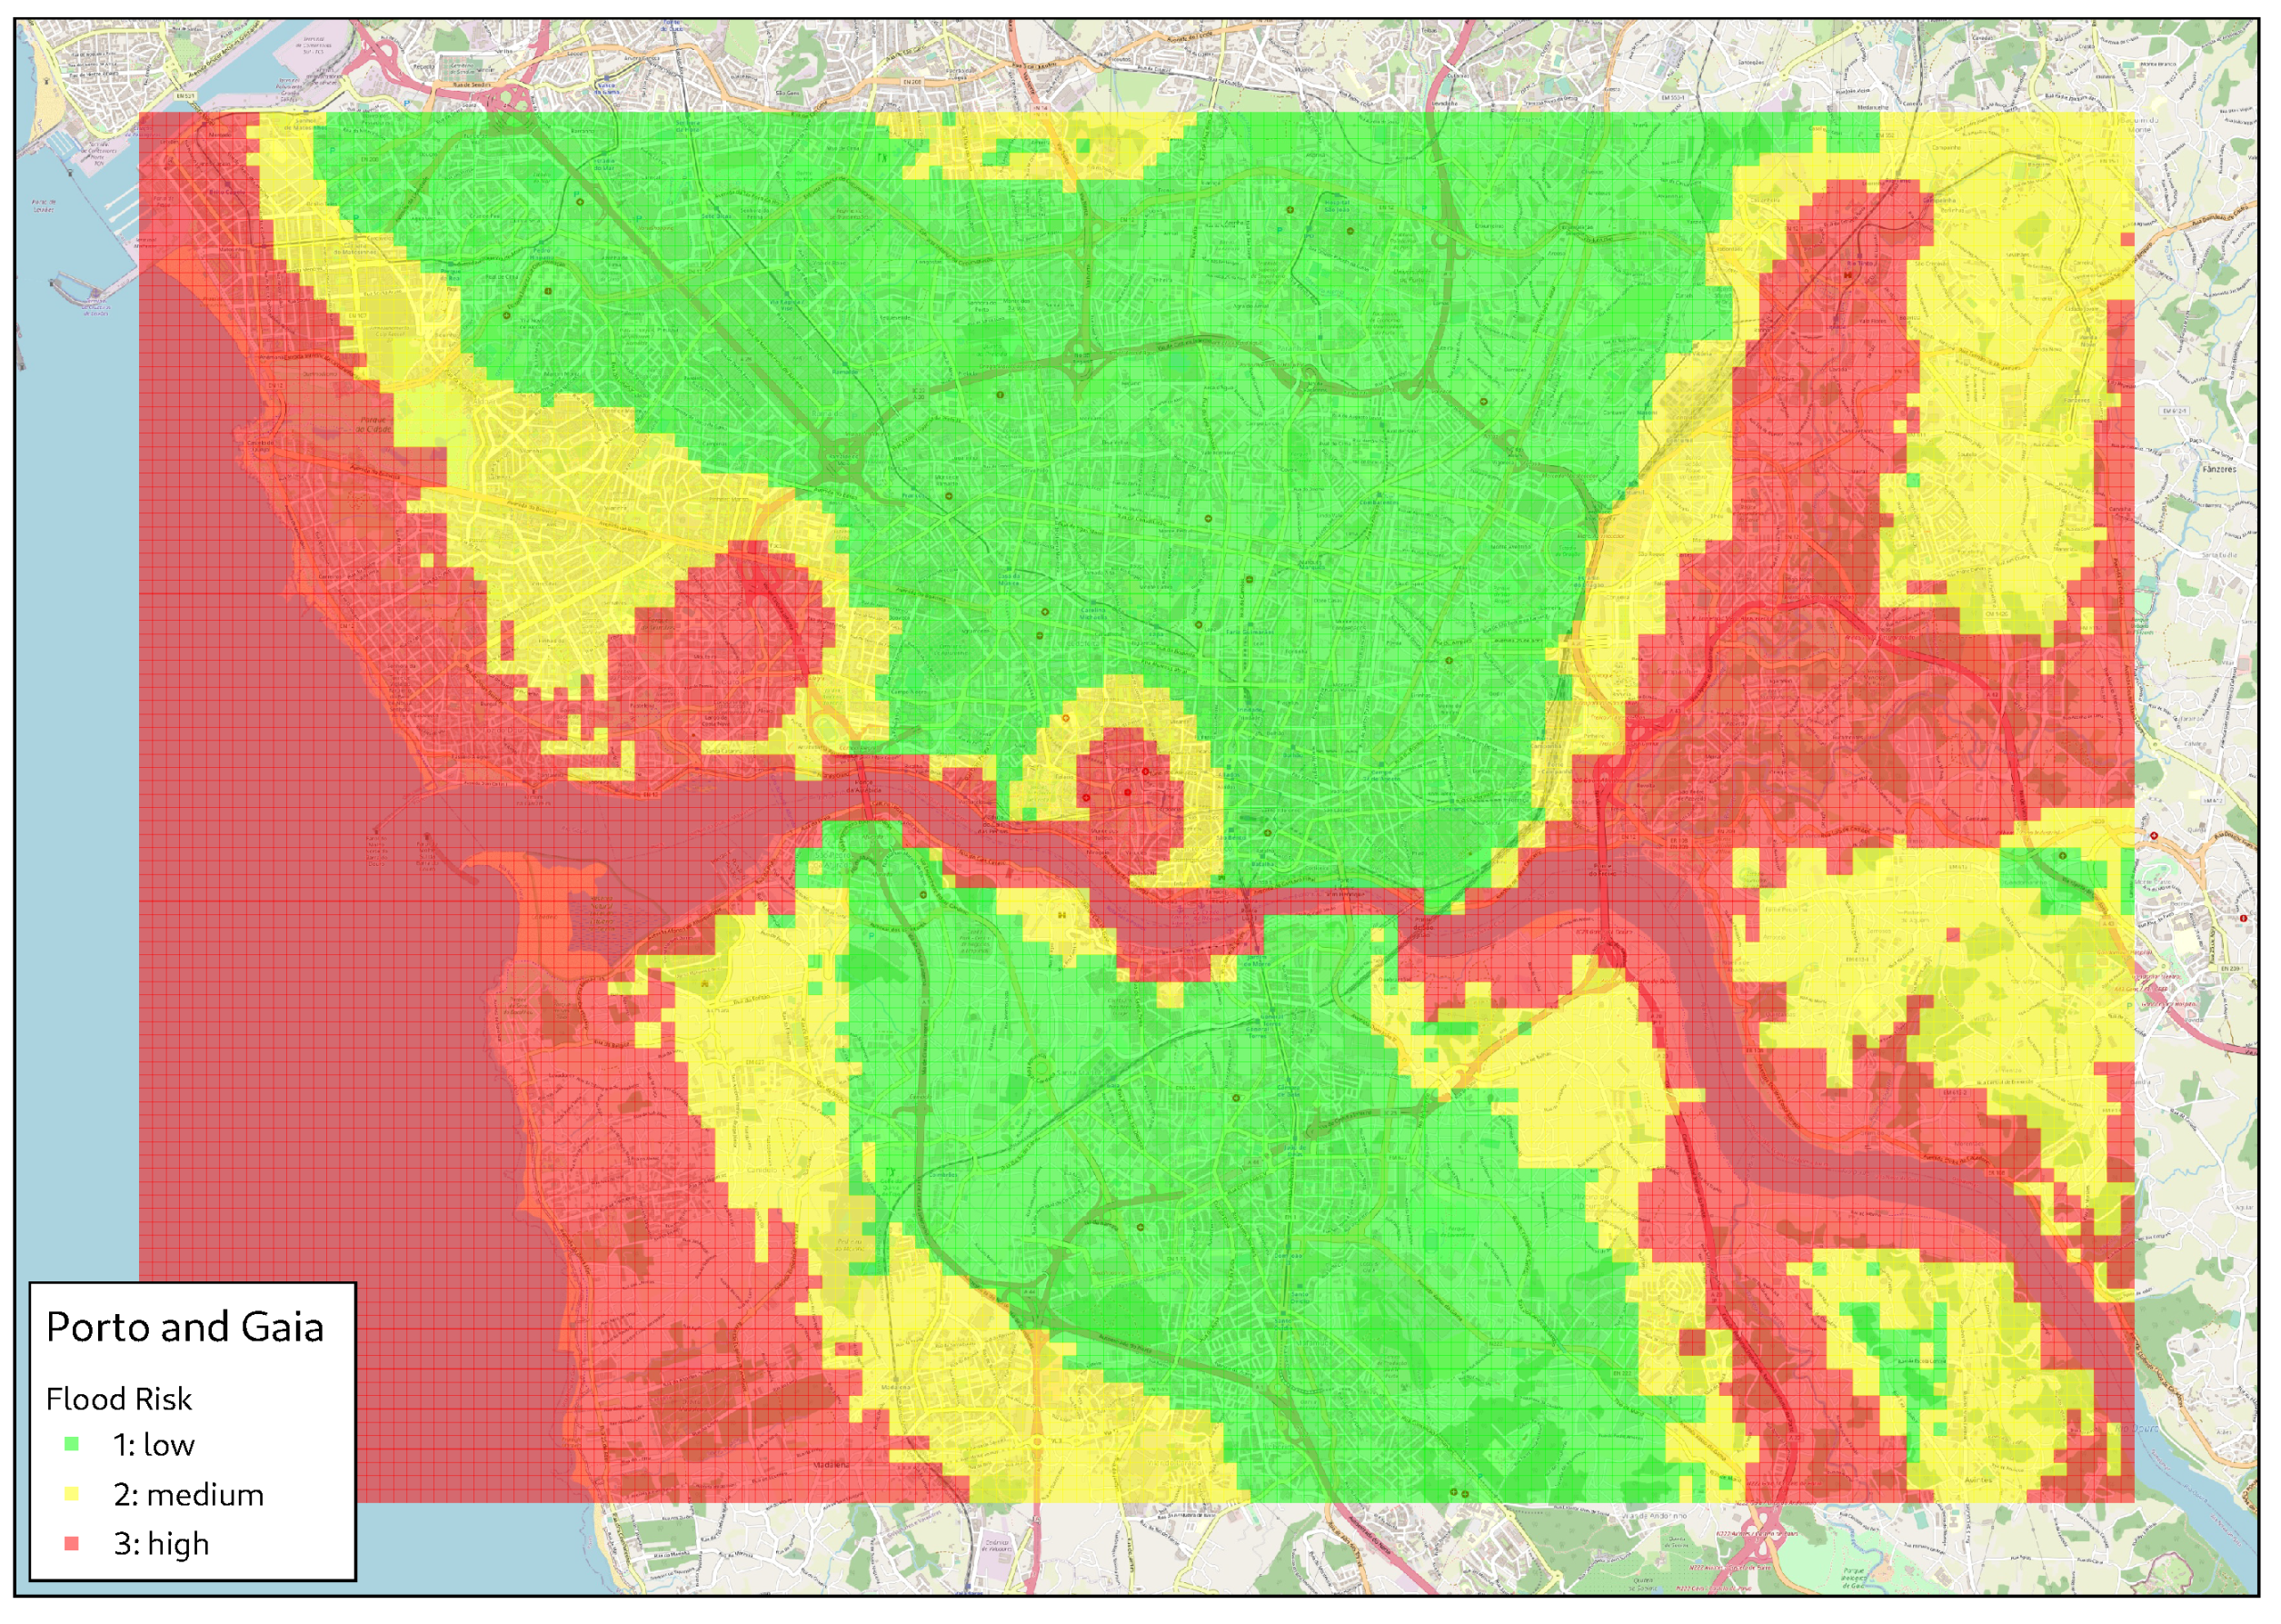
In order to obtain a bigger picture of the flood risk assessment in the surroundings of the Douro River, we applied our approach to a broader area comprising not only the city of Porto but also part of its metropolitan area covering both banks of the river.
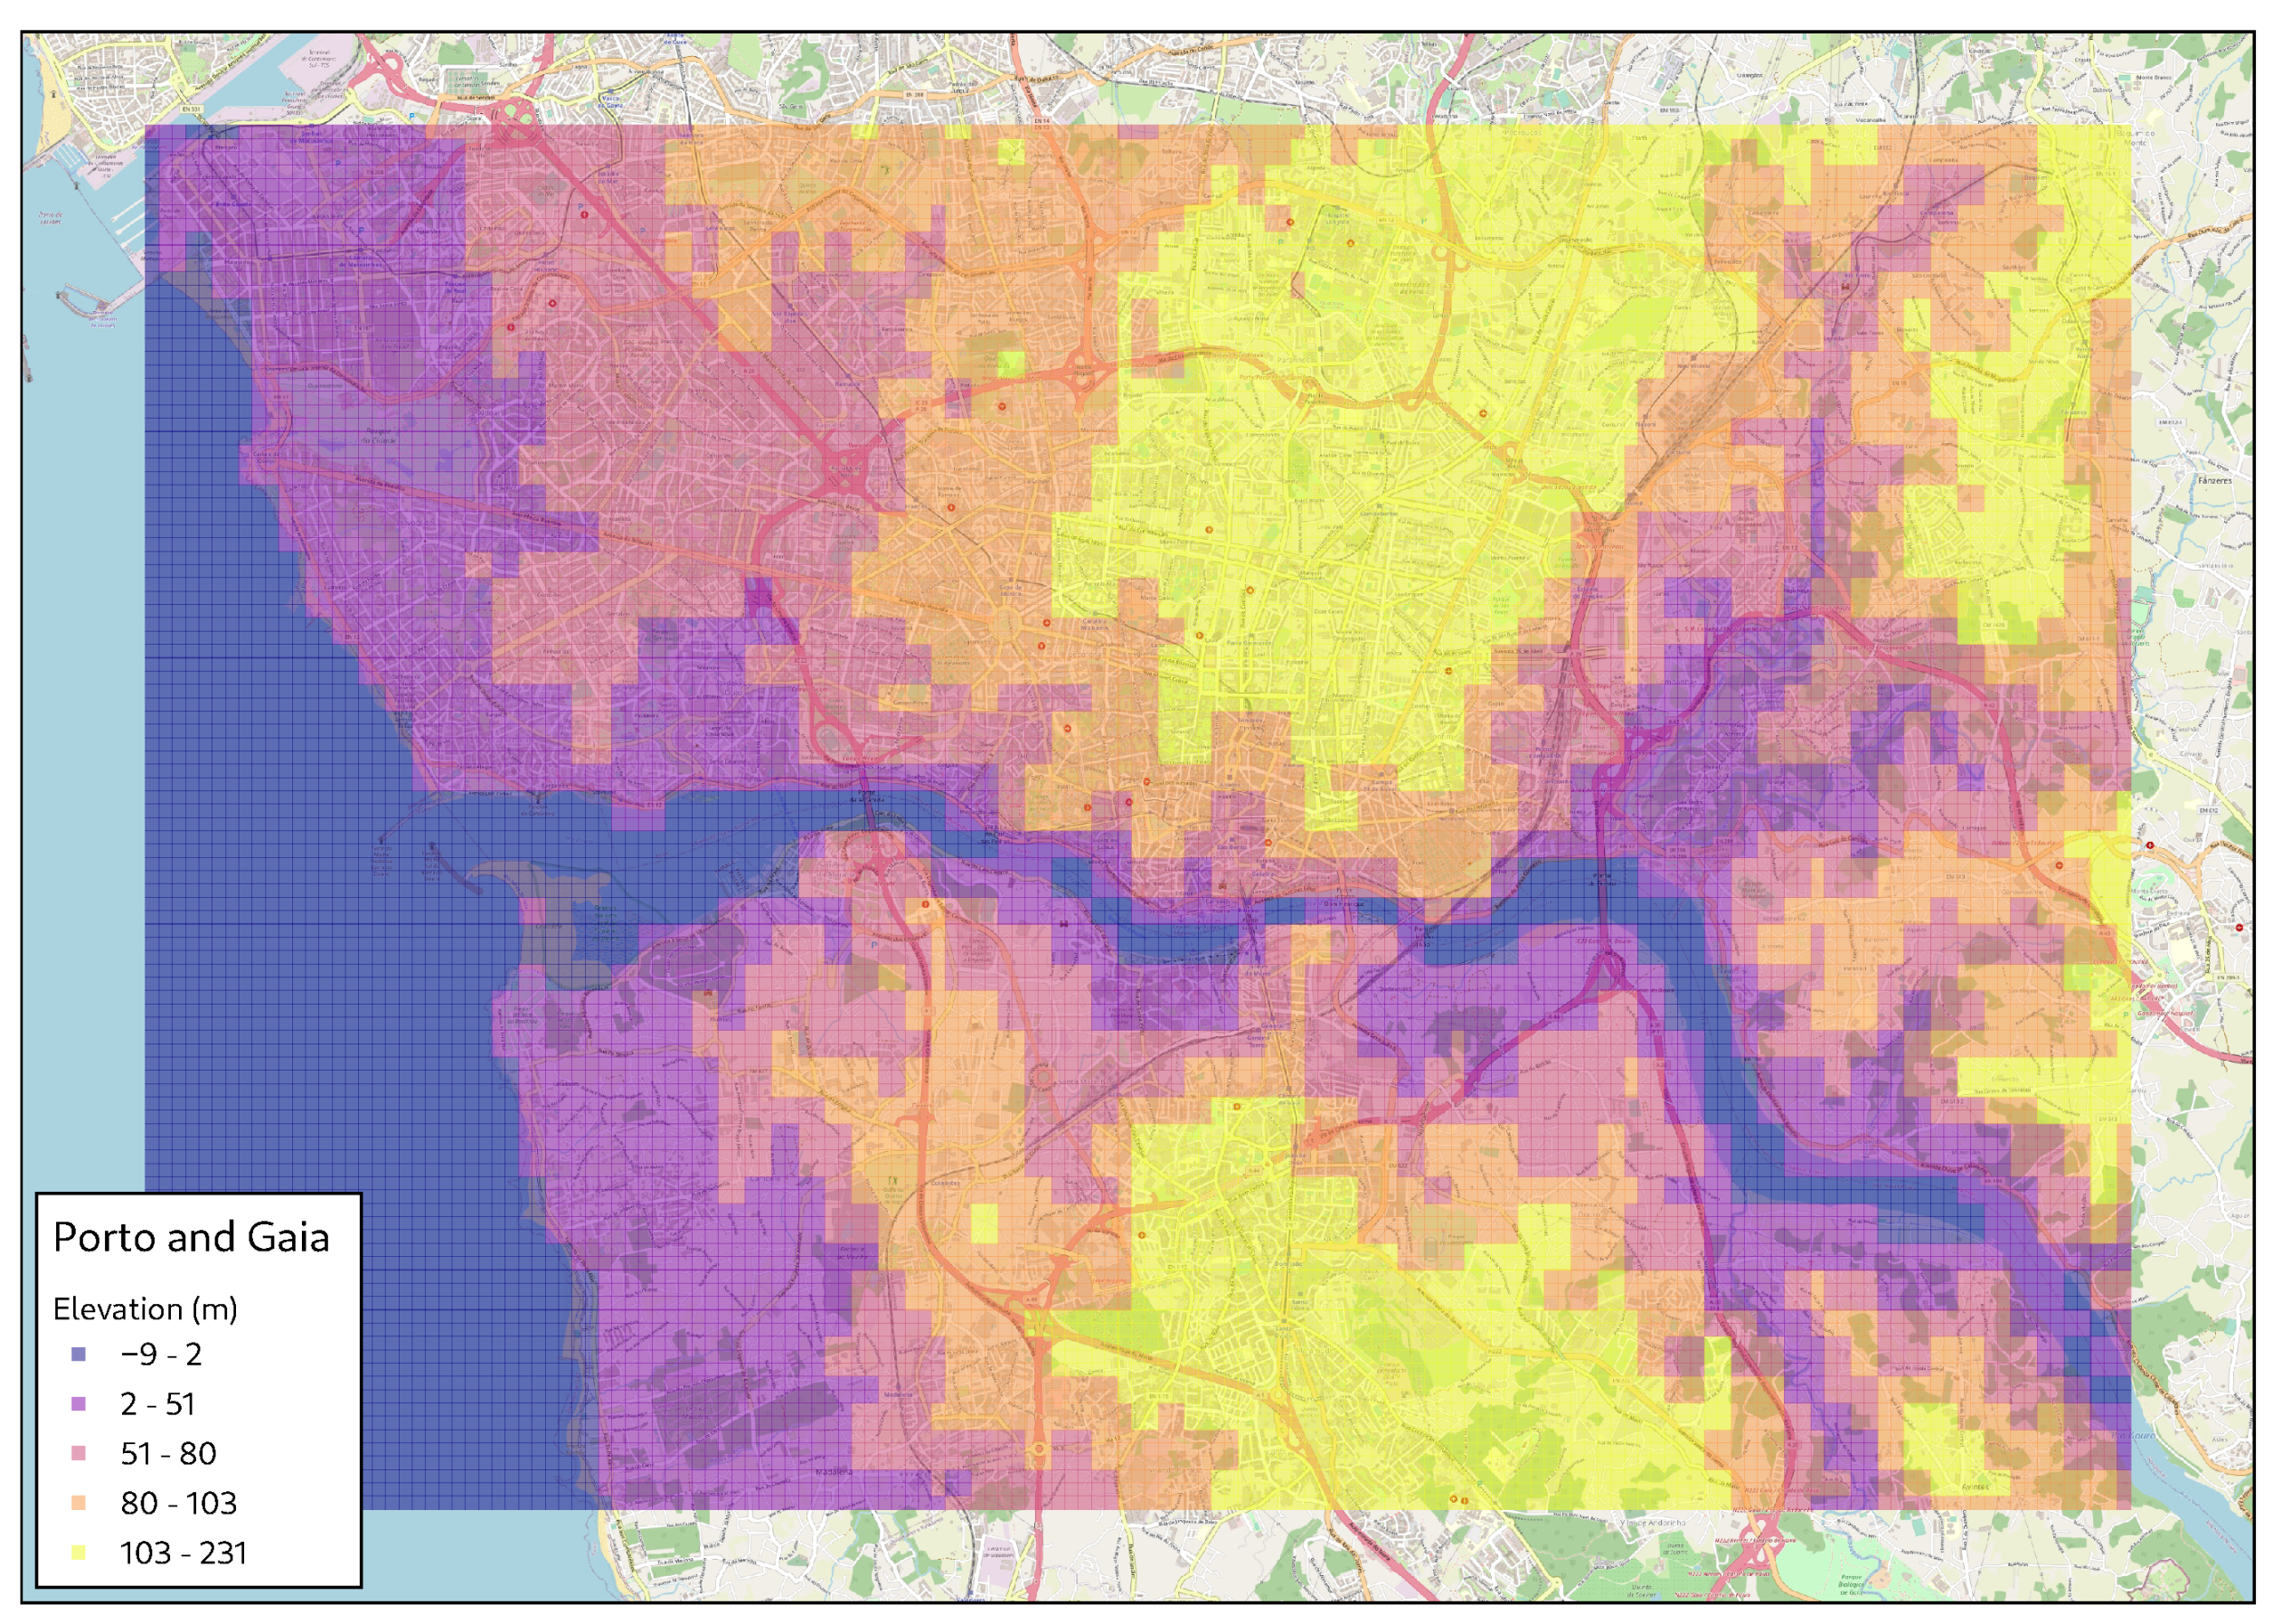
Figure 9 shows the elevation levels for the computed zones in a rectangular AoI (cities of Porto and Vila Nova de Gaia).
Having all risk parameters for this new AoI, we applied the proposed assessment approach to determine the desired flood risk classes, as depicted in
Figure 10.
At first glance, one may notice that the assessment for the area of Porto differs between the scenarios. This is because the proposed assessment approach provides a relative classification, i.e., the three different classification levels mark the zones with low or high risk relative to each other and within the defined AoI. In this sense, red zones are riskier than yellow and green zones in the considered context: if the AoI changes, the resultant assessment and risk classification may change too.
Finally, after the performed computations, we could see that the intended flood risk assessment could be satisfactorily performed, as expected. Since open databases were used as our reference, the only concern was to find the worst historical flood record for the Douro River, which was easy to find (or even loosely estimated). Therefore, we believe that the proposed approach could be easily adopted as a practical tool for improving urban resilience.
6. Discussion and Future Perspectives
The proposed approach is a generalist method that can be applied to any city around the world without restrictions, contributing to the development of smart city initiatives targeted at flooding resilience. The use of open data from OpenStreetMap and Open-Elevation API makes that possible, as well as the defined comprehensive mathematical model. Thus, we expect that our approach will be suitable for several applications in the smart cities’ landscape, particularly regarding emergency detection, alerts, and mitigation, with a lot of potential significant results.
One of the possible applications leveraging the proposed flood risk assessment approach is the deployment planning of sensing units. The work in [
38] exploited only the existence of PoIs when detecting any kind of urban emergency, and we believe that similar results could be achieved when considering flooding. In this case, the classification of the zones would guide the distribution of a previously defined set of sensing units, particularly created to detect flood-related emergencies [
39,
40]. Although it might seem obvious that water sensors must be positioned in the river areas, the performed flood risk assessment indicates the most exposed zones, aiding in the planning of sensors’ deployment.
Following a similar trend, the deployed sensors could be combined with the computed risk maps when finding escape routes during a flood, guiding people through less risky zones. This could avoid the trapping of evacuees in flooded areas, which could have potentially dangerous outcomes [
41,
42]. As such, mobile applications could be developed to leverage interactive heatmaps, allowing users to explore different areas of the city and understand the varying levels of flood risk. Users could receive notifications and alerts based on their location within the heatmap.
Urban planning can also be benefited. In a dense urban area, heavy rain flooding is a real risk and must be tackled to prevent damage to a city’s infrastructure and its inhabitants [
43]. In this sense, the rain flood risk classification reveals zones that are more geographically vulnerable. This assessment may reveal areas in a city that may require suitable drainage infrastructure that is capable of draining all the water from a heavy rain, avoiding flood-related disasters.
In the overall picture, the proposed flood risk assessment method may aid public authorities in better planning the infrastructure in a city, discovering more vulnerable and exposed areas that need special equipment for the detection of, provision of alerts regarding, and for the mitigation of flooding events, preventing excessive losses and damage due to an unprepared urban area. Concerning the existing tools, the proposed approach could also be incorporated, improving their results. By implementing the rain and river flood risk assessments, tools like CityZones [
29] could be enhanced to provide better results for flood risk classification; similar results are expected for other tools devoted to risk assessment.
Our proposed assessment approach could also be integrated within the context of a smart city, particularly in the scenario of multisystems interfacing [
20]. When integrating flood risk heatmaps with smart infrastructure, urban systems can exploit risk data for optimisation. For example, smart traffic lights can be used to prevent vehicles moving towards flooded areas [
44,
45], which could be dangerousforto the drivers or even compromise the rescue of affected people due to unwanted traffic. During a heavy rain, riskier areas could be considered for this processing, reducing traffic even before a flood emergency occurs.
Finally, by applying our proposed approach to the city of Porto, we leveraged georeferenced data to assess and potentially enhance the city’s flood resilience in the face of future challenges. As smart cities continue to evolve, managing and mitigating flood risks have become crucial aspects of urban planning and development. Porto’s experience with the Douro River floods offers invaluable insights for not only safeguarding its future but also providing a blueprint for other urban areas facing similar challenges. We believe that the development of data-driven methodologies to assess risk levels in cities will help authorities in better planning the growth of urban areas and the building of new response centres in order to prevent or at least reduce life and economic losses, reinforcing the applicability of our approach.
7. Conclusions
Among the many types of emergency events that may happen in an urban area, flooding is the most recurrent and has more of an impact on a city. In order to prepare a smart city for such events, a risk classification mechanism must be used to identify the flood-prone areas and to allow for better responses and preparedness. In this context, this article proposed a flood risk assessment methodology that makes use of open data as the reference, making the method generic and very adaptive. The performed experiments for the city of Porto, Portugal, provided some promising results.
The river geolocalisation data obtained from OpenStreetMap allowed us to compute the river flood risk regarding the proximity to river zones. Taking open elevation data from Open-Elevation API, it was possible to calculate the slope of each zone and combine all these data to compute rain flood risk, selecting regions that are too low and surrounded by high-slope zones. The elevation data were also used in the river flood risk assessment to verify which zones in the river surroundings could benefit from an elevation difference higher than the historical flooding heights. Finally, emergency response data from OpenStreetMap were also considered. This combined approach shows that open and publicly available data are valuable for risk assessment, helping with the planning and maintenance of emergency infrastructure in an urban area.
As future studies, other types of floods will be considered, particularly the ones resulting from tsunamis and rapid snow melting. Several cities in Europe are already being affected by climates change, making them more prone to flood events [
5]. Because of these changes, extreme climatic events are predicted to increase in the next years [
46], making cities more prone to tsunamis and coastal flooding. By gathering other types of parameters related to climatic changes, such as snow depth history and temperature changes, we could extend our approach to assess new aspects of flood risks in cities.
Moreover, while the cross-validation of our results with local emergency plans and classical hydrological computations would be valuable, resource constraints prevented this in the current study. Additionally, verifying high-risk areas with watersheds presented cost and time challenges at this stage. However, we plan to address these aspects in future research to enhance the robustness of our findings.


