Article

Toward Establishing a Tourism Data Space: Innovative Geo-Dashboard Development for Tourism Research and Management

by
Dolores Ordóñez-Martínez
1,2,
Joana Maria Seguí-Pons
2 and
Maurici Ruiz-Pérez
2,*
1
Anysolution S.L., 07010 Palma, Balearic Islands, Spain
2
Geography Departament, University of the Balearic Islands, 07122 Palma, Balearic Islands, Spain
*
Author to whom correspondence should be addressed.
Smart Cities 2024, 7(1), 633-661; https://doi.org/10.3390/smartcities7010026
Submission received: 20 December 2023 / Revised: 30 January 2024 / Accepted: 7 February 2024 / Published: 14 February 2024

Abstract

:
The data sharing strategy involves understanding the challenges and problems that can be solved through the collaboration of different entities sharing their data. The implementation of a data space in Mallorca is based on understanding the available data and identifying the problems that can be solved using them. The use of data through data spaces will contribute to the transformation of destinations into smart tourism destinations. Smart tourism destinations are considered as smart cities in which the tourism industry offers a new layer of complexity in which technologies, digitalization, and intelligence are powered by data. This study analyzes four scenarios in which geo-dashboards are developed: flood exposure of tourist accommodation, land-cover changes, human pressure, and tourist uses in urban areas. The results of applying the geo-dashboards to these different scenarios provide tourists and destination managers with valuable information for decision-making, highlighting the utility of this type of tool, and laying the foundations for a future tourism data space in Mallorca.

1. Introduction

Tourism, as a global socio-economic phenomenon, finds itself in a situation of singular relevance where the challenges of sustainability [1,2,3,4] and their adaptation to changing market dynamics and consumer preferences call for a holistic approach in which information and communication technologies take on significant importance [5,6,7].
In this context, smart tourism destinations (STDs) emerge [4,8,9] which are oriented toward an evolution in tourism management and development in smart cities. They focus on the integration of advanced technologies, providing a framework for improving sustainability and accessibility to achieve an enhanced tourism experience. STDs make use of technologies such as the Internet of Things (IoT) [10], big data [11], artificial intelligence, and digital platforms allowing them to better understand the needs and behaviors of tourists. This facilitates the personalization of services and improved resource management [9,12,13].
Smart tourism destinations are considered as smart cities in which the tourism industry offers a new layer of complexity in which technologies, digitalization, and intelligence are powered by data.
STDs place significant emphasis on sustainability, seeking to minimize the environmental impact of tourism through efficient resource management, the promotion of environmentally friendly practices, and the encouragement of responsible tourism [14]. Accessibility is another important characteristic, ensuring that the destination is easily accessible and enjoyable for all [15,16]. They seek to enhance the visitor experience through technology, with mobile apps offering personalized guides, augmented reality to enrich visits to sites of interest, and queue management systems at popular attractions [17].
The management of these destinations Involves an innovative approach that integrates all local stakeholders, from authorities to businesses and the local community, to create a cohesive and sustainable tourism experience. A robust connectivity infrastructure is essential to support the technologies employed, enabling seamless communication between tourists, service providers and destination managers.
Tourism data spaces (TDS) emerge as digital infrastructures or platforms dedicated to the collection, analysis, and sharing of large volumes of data related to the tourism sector [18]. These spaces priorities the secure and efficient handling of information, encompassing diverse data on travel patterns, consumer preferences, accommodation, and transport statistics, among others. The purpose of these data spaces is to provide valuable and relevant information to various stakeholders within the tourism sector, including businesses, researchers, planners, and policymakers. This facilitates data-driven decision-making, the personalization of tourism services, and the development of more effective marketing strategies. Data sharing also plays an important role in anticipating and adapting to market trends, as well as responding to challenges such as sustainability and changing travel dynamics.
It is noteworthy that the European Union has provided a decisive impetus for the implementation of data spaces through the approval of various standards, regulations, and communications. Particularly significant is the Commission Communication COM (2020) on the definition of a European Data Strategy. This strategy is built upon four pillars which are as follows:
  • The establishment of a cross-sectoral governance framework for access to and use of data;
  • The implementation of catalysts (investment in data and reinforcement of capacities, infrastructures, and interoperability);
  • The empowerment of people and SMEs (investment in skills);
  • The creation of common European data spaces in strategic sectors and areas of public interest, including industry, the green pact, mobility, health, financial matters, energy, the agricultural sector, public administrations, and skills in the education system. Additionally, an initiative has been launched to include tourism as a specific area [19].
Smart tourism destinations will greatly benefit from tourism data spaces, by increasing the access to data and the availability of data from private sources, STDs focus on the integration of advanced technologies, sustainability, accessibility, and enhancements in the tourism experience in a specific physical destination. Tourism data spaces focus on the collection, analysis, and use of tourism-related data, allowing data sharing at the level of the destination, but also at a broader level, and therefore, complementing the information existing at the local level. TDS involve the creation of infrastructures for the secure and efficient handling of large volumes of tourism data, utilizing digital platforms or data repositories. Their goal is to provide support for tourism planning, data-driven decision-making, and personalization of tourism services.
A tourism data space is a new possibility to complement smart destinations by providing the knowledge and tools necessary for efficient and sustainable tourism management. Data sharing improves the tourist experience, the efficiency and effectiveness of management tasks, as well as the well-being and long-term competitiveness of destinations.
Open data and interoperability play a pivotal role in the context of smart tourism destinations and tourism data spaces, exerting significant influence on how tourism is managed and experienced in the digital era [20,21,22].
Open data, which implies free and unrestricted access to tourism-relevant data, serves as a catalyst for innovation and development in the tourism sector [23]. This availability of data enables tourists to plan more efficiently and enrich their trips, thereby significantly enhancing the tourism experience. This openness of data fosters the creation of innovative tourism applications and services, boosting the local economy and enhancing the competitiveness of destinations. Additionally, it also promotes transparency, which increases the confidence of tourists and other stakeholders in the sector, such as investors and local authorities.
Interoperability, on the other hand, refers to the ability of different systems and organizations to work effectively together [21,24]. In the context of smart destinations, interoperability is crucial for integrating various data systems and technology platforms. This capability enables more efficient tourism management, fostering collaboration between different entities such as governments, tourism businesses, and service providers. Interoperability ensures that information flows seamlessly between different actors, enhancing coordination in destination management and responsiveness to the needs and expectations of tourists.
Currently, despite the tourism sector generating a large amount of data and digital information being available on topics closely related to tourism (such as natural resources, natural hazards, infrastructure, planning, etc.), there is a notable lack of integrated digital tools that allow planners, stakeholders, and tourists themselves to visualize and interact with this data in an intuitive and effective way. In this context, interactive dashboards can help fill this gap, providing a user-friendly interface to visualize and explore tourism information, detect trends, patterns, and critical insights. It is also worth noting that many existing data analysis systems are not specifically tailored to the unique needs of the tourism sector. Therefore, a significant opportunity is recognized to develop dashboards that focus on tourism, thereby improving the effectiveness of decision-making. Accessible and user-friendly dashboards have the potential to democratize access to data intelligence in the sector.
Integrating concepts such as artificial intelligence (AI) into tourism data spaces (TDS) and geo-dashboards represents a transformative step in managing and enhancing the tourism experience within smart tourism destinations (STDs). AI’s ability to analyze large datasets, recognize patterns, and make predictive analyses aligns perfectly with the objectives of TDS and geo-dashboards, which are centered around collecting, analyzing, and visually presenting vast amounts of tourism-related data.
This research concentrates on the development of four dashboards in the tourism context of the island of Mallorca (Spain) with the aim of enhancing knowledge and offering support for decision-making when it comes to tourism management and planning. The study aligns with the emerging need in the field of tourism data spaces, especially concerning the creation of interactive visualization tools based on data from the tourism ecosystem. This ecosystem encompasses various data sources including travel patterns, user preferences, economic statistics, and environmental data. However, the effective integration of these sources into a unified platform that provides a holistic and detailed view, which well-designed dashboards could offer, is often lacking.
A dashboard is a data visualization tool that provides a summarized and accessible view of various key metrics and data. Its main purpose is to enable users, especially managers and decision-makers, to quickly understand the relevant information and make informed decisions. A dashboard typically presents information through a graphical interface that includes elements such as graphs, charts, tables, indicators, and maps. These elements are designed to be intuitive and easy to interpret.
Dashboards are widely used in different sectors such as business, health, education, smart cities, and technology, owing to their ability to consolidate and simplify large amounts of data. They can be customized to the specific needs of the user or organization, and are often interactive, allowing users to filter and drill down into the data for more detailed analysis.
Tourism is a rapidly evolving industry, marked by shifts in consumer trends, market conditions and external factors such as environmental regulations or health crises. Dashboards that facilitate swift adaptations and responses to these changes are crucial for maintaining competitiveness within the sector. This approach highlights the significance of tourism data spaces as crucial tools, not only for retrospective analysis, but also for proactive planning and adaptation to the dynamic conditions of the tourism market.
Despite the challenges posed by the inaccessibility, fragmentation, and disorganization of some tourist information, it is currently relevant to point out that the Balearic Islands (Spain) currently have significant, accessible, structured, and updated digital data, which enable a direct focus on advanced analysis in the field of tourism.
The dashboards that have been generated share the common characteristic of integrating the geographical component of the tourism information, and in this context, they are referred to as geo-dashboards [25]. Geo-dashboards are embedded in geospatial business intelligence (GBI), which is a fusion of technologies and practices that combines geospatial analysis with business intelligence. This integration involves the use of geographic and spatial data to enhance decision-making and analysis in the business world.
GBI promotes the use of geographic information systems (GIS) and other technologies (remote sensing, GPS, etc.) to visualize, understand, and analyze data with a geographic context. GBI facilitates the integration and analysis of large amounts of data from various sources, encompassing internal company data, such as sales and customer data, as well as external data, like demographic information or traffic and environmental data.
The hypothesis of this study asserts that there currently exist extensive volumes of accessible, high-quality tourist information, which can facilitate progress in the development of tourism data spaces. This progress is achieved through the deployment of visualization and analysis tools that support decision-making in tourism planning and management.
The scientific question aimed to be answered is: How can the development of innovative geo-dashboards for visualizing and analyzing open tourist and territorial data contribute to more informed and sustainable tourism management?
The general objective of this article is to design and implement a suite of advanced geo-dashboards, aimed at enhancing tourism management through detailed visualization and analysis of open tourism-related data. These dashboards are intended to contribute to the creation and consolidation of a tourism data space, with the goal of optimizing decision-making in tourism management and promoting more informed and sustainable practices. The island of Mallorca is proposed as a case study.
The designed geo-dashboards aim to address the following specific objectives:
-
Analyze the vulnerability of tourist accommodation and holiday homes to flooding in Mallorca;
-
Examine changes and evolution in land cover on the island of Mallorca at a municipal level;
-
Study human pressure in sensitive areas using open social media data;
-
Analyze the distribution of tourist activity in urban environments and its relationship with the income level of the resident population.
This study addresses a significant gap in the existing literature by focusing on the integration and application of advanced geo-dashboards within smart tourism destinations and tourism data spaces. Significantly, our study highlights the absence of specific references in the scientific literature concerning the use of geo-dashboards in tourism planning and management, providing a comprehensive framework for their implementation in Mallorca and offering a replicable model for other regions.

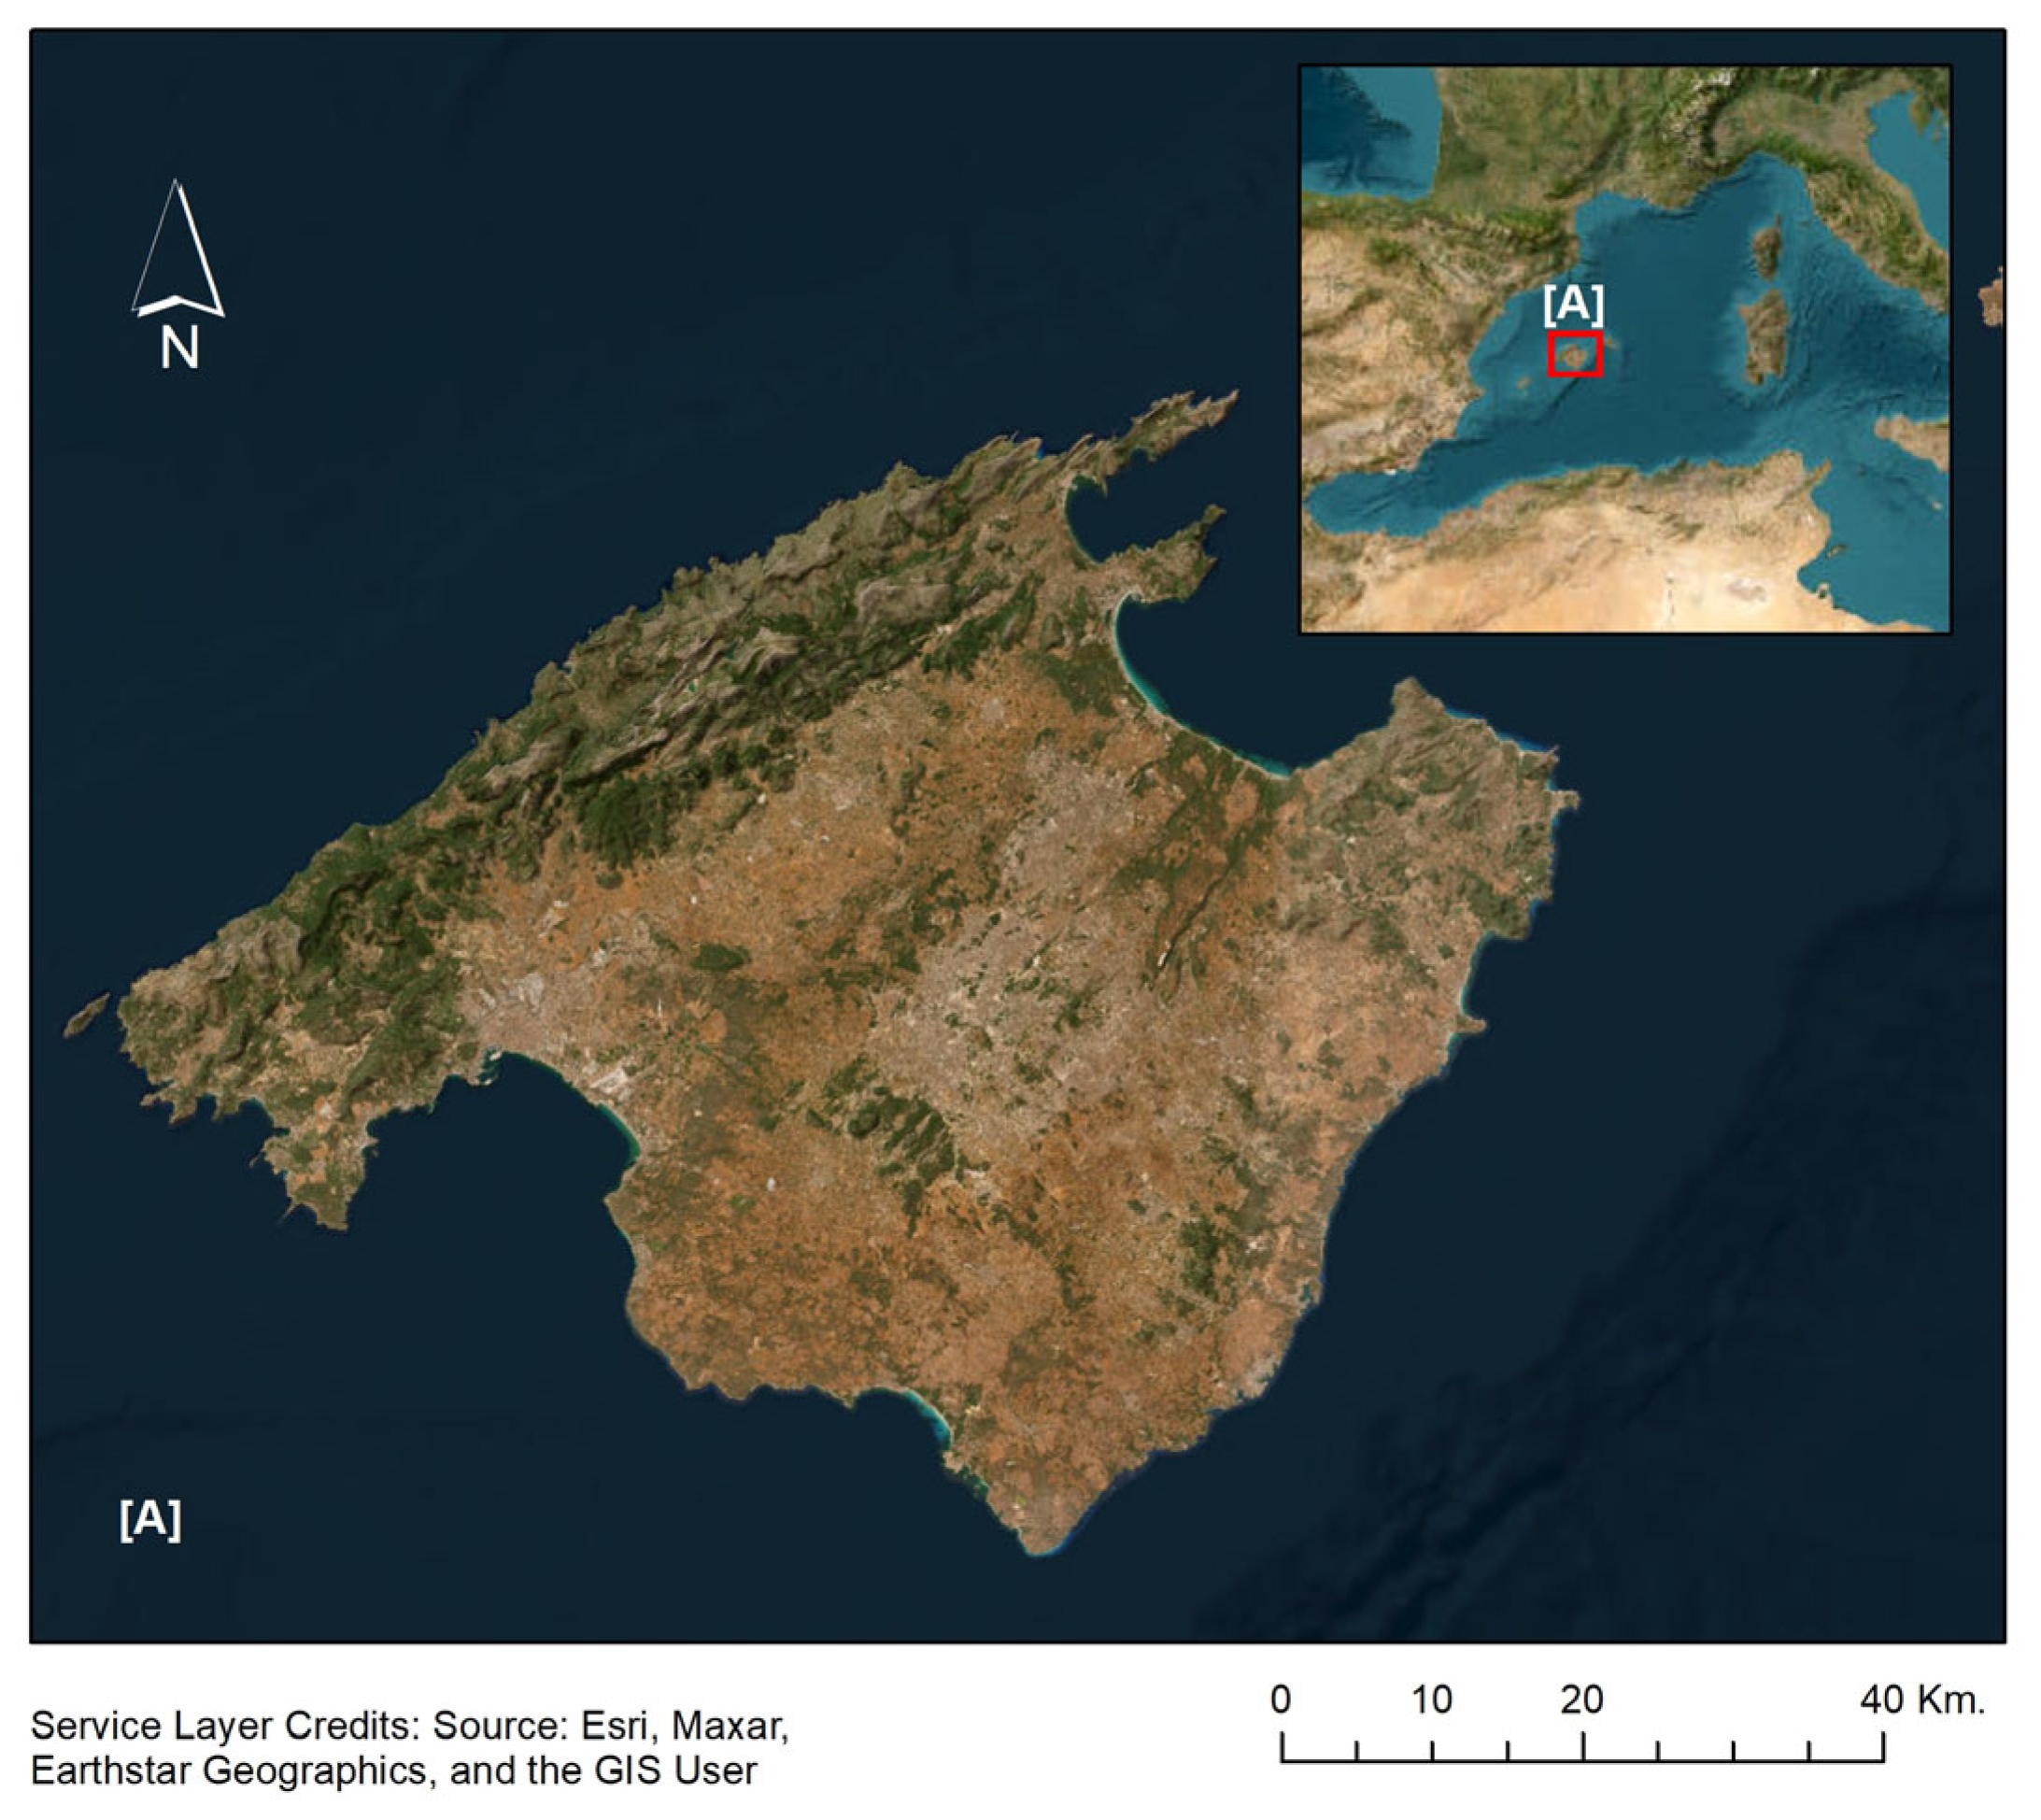
2. Case Study and Focus Areas

The island of Mallorca is part of the Balearic Islands archipelago, together with Menorca, Ibiza, and Formentera. It is located in the Eastern Mediterranean and is included in the Autonomous Community of the Balearic Islands, forming part of the Spanish State (Figure 1).
It is an island of 36,357 km2, with a population of 914,564 people [26]. Its geographical characteristics attract millions of visitors annually, seduced by its sandy beaches, crystal clear waters, mountainous landscapes, and vibrant cultural heritage. Tourism is the main economic activity on the island of Mallorca. This is reflected in the tourist GDP, which in the Balearic Islands accounts for more than 44.8% of GDP [25], and the more than 16 million tourists who visit annually [27].
Mallorca is a mature tourist destination that has undergone significant transformations in recent decades. However, Mallorca’s growing popularity as a tourist destination has brought a series of challenges and issues that require attention and careful management. Among the most relevant impacts and pressures experienced by the island, environmental issues (water consumption, water quality, etc., are to be highlighted [28,29]; as well as salinization of aquifers [30], land artificialization [31], ecosystem pressure [32,33], climate change adaptation [32]), social issues (congestion [34,35,36], gentrification [37], social imbalances [38]), economic aspects (sectorization of the economy, economic imbalances, abandonment of the primary and secondary sectors, increased costs, etc.), and financial aspects (sectorization of the economy, economic imbalances, abandonment of the primary and secondary sectors, increased costs, etc.) must be explored. Insularity further aggravates these pressures, as limited resources and dependence on transport exacerbate their environmental and socio-economic vulnerability [39].
Within this complex geographical framework, we focus on four specific issues of tourism activity on the island, for which we will develop geo-dashboards that will provide detailed knowledge of the issues raised and can support decision-making. The issues addressed are the following:
  • Increased exposure of the island to natural hazards, especially flooding. Increased tourism and consequent urbanization have changed how water is managed and how it flows on the island, exacerbating the risk of flooding in densely populated and tourist areas [40]. This not only poses a danger to inhabitants and tourists but also affects critical infrastructure for tourism and the local economy. The situation is particularly sensitive in the case of holiday dwellings. The problem is particularly sensitive in the case of holiday homes [41], as the tourist population that occupies them is uninformed about the dangers of exposure to flooding which makes them particularly vulnerable;
  • Changes in land use show a marked increase in urbanized areas to accommodate hotels, restaurants, and other tourist infrastructure. This urban expansion has often been at the expense of the island’s natural and agricultural areas, leading to biodiversity loss and a disruption of local ecosystems;
  • The pressure and congestion of ecosystems due to the presence of people is another side effect of the tourist boom in Mallorca. During the summer months, when the flow of tourists reaches its peak, there is considerable stress on certain sites. This constant pressure can lead to environmental degradation, affecting not only the tourist experience but also the quality of life of residents [42];
  • Tourism activities in urban environments can lead to processes of gentrification and economic segregation of the population. Tourism in Mallorca has created a dual economy where, on the one hand, there is a thriving tourism-focused sector and, on the other, there are local communities that often do not benefit equally from this boom. This imbalance can lead to economic and social segregation, where local residents can feel displaced or marginalized within their own island [43].
Moving toward the creation of a robust and efficient tourism data space in Mallorca is necessary. Such a space would allow for a detailed and continuous analysis of tourism patterns and environmental and socio-economic impacts of tourism and would make management measures more effective. Such a platform would facilitate more informed and data-driven decision-making, allowing policymakers, tourism entrepreneurs, and the local community to collaborate in developing sustainable strategies that balance tourism needs with the protection of natural and cultural heritage. Its implementation would also be essential to mitigate the negative impacts of tourism and ensure that Mallorca remains an attractive and sustainable tourist destination in the future.
Selecting the island of Mallorca, a mature tourist destination, as the setting for the development of the proposed geo-dashboards presents a unique and opportune choice. Mallorca, renowned for its diverse tourist offerings and established tourism infrastructure, embodies a rich tapestry of data sources, ranging from visitor patterns to environmental impacts, which are ripe for analysis and visualization. The island’s popularity and well-documented tourism history provide a robust dataset that is ideal for demonstrating the efficacy of geo-dashboards. By leveraging Mallorca’s comprehensive tourism data, these dashboards can offer nuanced insights into tourism management, including aspects like resource allocation, visitor flow optimization, and sustainable tourism practices. Furthermore, the lessons learned and the successes achieved in Mallorca can serve as a valuable model for similar tourist destinations worldwide, showcasing the potential of geo-dashboards in enhancing the tourism experience and supporting sustainable tourism development.
In the following sections, the conceptual bases that frame the four geo-dashboards to be developed on the island of Mallorca will be presented.

2.1. Flood Exposition of Tourist Accommodation (Geo-Dashboard 1)

Tourism activity involves the arrival of people in geographical areas that are normally unknown to them. Therefore, they may have little information about the natural hazards to which they may be exposed, let alone how to cope with them.
The safety of people and their property are key elements to consider in managing a tourist destination. Exposure to natural and man-made hazards is regarded as an exclusion or penalizing factor for tourist destinations; therefore, the communication of exposure to risks is not usually promoted, nor are the consequences of catastrophic events that may have occurred in the past.
Tourists are generally unaware of the natural hazards to which they are exposed in the tourist destinations they visit and are more vulnerable to their effects than the resident population. Tourists’ lack of rootedness in the tourist destination makes them inherently more susceptible to natural hazards than the resident population. This vulnerability is accentuated for tourists such as older people, children, and people with disabilities. In addition, the lack of tourist interaction with host communities results in their isolation in the comfort of their tourist accommodation. In a disaster, this isolation can become a trap [44,45,46].
Knowledge of the territory and the tourist’s relationships with the host population contribute to reducing their vulnerability to natural hazards [47]. The typology of tourism also has implications for social vulnerability to hazards. For example, adventure or cultural tourism, which has a stronger relationship with the host society, reduces its vulnerability due to a better knowledge of the environment.
Typically, tourism is accommodated in establishments specifically oriented to tourist use, such as hotels, flats, and aparthotels, which are usually concentrated in coastal, mountain, or city tourist areas. In more developed countries, generally these infrastructures are usually constructed considering exposure to natural hazards, thanks to established urban planning regulations and risk plans. In an emergency in the face of catastrophic events, tourists staying in regulated hotel infrastructures can rely on the hoteliers and their infrastructures to protect them or move them to safer places, thus reducing their vulnerability [48,49].
However, in recent years, there has been a massive emergence and implementation of the sharing economy in the tourism sector, generating a new type of holiday tourism [50]. The Web 2.0 internet has led to a new model of shared accommodation whose growth has been exponential [51]. Holiday tourism develops a less concentrated and more dispersed geographical distribution model, breaking into the host territory more comprehensively. It takes place in urban, agricultural, and natural settings. As a result, exposure to natural hazards increases exponentially for both the accommodation and the people exposed. Even though tourism is given the motto “live like a local”, the reality is that holiday tourists do not receive sufficient information about the natural hazards to which their accommodation is exposed, let alone how to act in the event of a disaster [52,53]. In the case of a flood, forest fire, landslide, etc., there are no protocols for action and often the tourist’s only contact is the host’s telephone number.
Tourism is a vital economic pillar for Mallorca, and any adverse impact on tourism infrastructure can have significant financial repercussions. Flooding can lead to the temporary closure of accommodation, resulting in a loss of income not only for holiday homeowners and tour operators but also for the local economy, which is heavily dependent on tourism. This situation is exacerbated by the fact that post-flood recovery and reconstruction can be a lengthy and costly process.
The increase in the frequency, intensity, and severity of natural catastrophic events is one of the main problems generated by global change. Many of the areas exposed to natural hazards are currently used for tourism.
The island of Mallorca is exposed to a significant risk of flooding due to various climatic, geomorphological, and anthropic factors. Mallorca’s rainfall regime is generally adapted to a dry Mediterranean climate and gives rise to a fluvial regime based on the absence of permanent watercourses. Extreme and concentrated rainfall at certain times of the year (preferably in autumn) frequently causes torrents to overflow.
It is especially interesting to note that the municipality of Sant Llorenç des Cardassar suffered terrible floods on 10 October 2018. As a result, thirteen people died, of which six were tourists who were circulating in the municipality, unaware of the danger of flooding in the area [54].
Tourism destinations are preferred territories for developing strategic actions to reduce vulnerability. The analysis of exposure to natural hazards is an obligation for destinations. From the local or global level, governments and civil society should increase resilience to such hazards [55,56,57].
From this perspective, the objectives of this dashboard are to inform tourism managers about the type of exposure to flood hazards of each regulated hotel accommodation (hotels and flats), as well as the exposure to flood risks of the Airbnb (and other short-term rental businesses) company’s holiday offer.

2.2. Land-Cover Changes (Geo-Dashboard 2)

The dynamics of changes in land use are of great interest from a territorial, environmental, social, and economic perspective. Tourism as a transversal economic activity has a fundamental impact on the transformation of the territory. In general, the greatest effect is the increase in urban uses and the artificialization of the territory.
In recent decades, the Mediterranean coastline has experienced strong urban pressure due to the construction of infrastructures and hotel facilities (hotels, flats, golf courses, theme parks, etc.). The increase in artificial surfaces has a notable environmental impact on terrestrial and marine ecosystems, an effect on the destruction of habitats, modification of the hydrological regime, increased exposure to natural hazards, etc.
In island environments, the effects of changes in land use can be particularly sensitive due to their irreversibility in relation to limited resources. Therefore, tourism planning must necessarily consider and monitor changes in land use/land cover and try to balance uses to ensure tourism destinations’ sustainability and competitiveness.
On the island of Mallorca, the evolution of land cover from 1990 to 2018 is closely linked to tourist pressure but also to the abandonment of agricultural land, an increase in residential pressure in rural areas, the abandonment of forestry, and the abandonment of natural areas.
The tourist boom in Mallorca has driven a remarkable development of infrastructures and services to meet visitors’ needs. This growth has led to a significant landscape transformation, where areas previously dedicated to agriculture or preserved as natural spaces have been converted into urban or tourist areas. This change in land use has direct implications in several respects. One of these is the increased risk of fire in the wildland–urban interface. As urbanized areas expand into regions closer to forests or natural areas, the risk of forest fires affecting these inhabited areas increases. This not only poses a danger to life and property but also poses significant challenges in terms of emergency management and urban planning.
In parallel, reducing agricultural areas is another direct consequence of this change. The conversion of agricultural land into intensive or extensive urban developments for tourism uses reduces the island’s capacity for local food production, impacting the rural economy and food sustainability. In addition, this transformation can lead to the loss of biodiversity and the alteration of local ecosystems, affecting the environmental balance of the island.
In addition, the increase in built-up areas due to tourism development brings numerous challenges. These include increased pressure on water resources and other public services, waste generation, and the need for additional infrastructure. Massive urbanization can lead to congestion problems and negatively impact the quality of life of residents as well as the experience of tourists.
Pons Esteva (2003) [58] studied the evolution of land use in the Balearic Islands using cartography based on photo-interpretation at a scale of 1:50,000 for the years 1956, 1973, 1995, and 2000. The study shows that urban use experienced strong growth in the period analyzed, from 1.1% of the territory in 1956 to 5% in 2000. Pons Esteva (2016) [39] analyses the relationship between artificialization. He points out that island nature is one of the reasons why the pattern of urbanization of the coastline in the Balearic Islands is not as intense as in the Spanish coast. As a general rule, the larger an island is, the more continental it is and the smaller its islandness, and consequently the greater the development pressure on the coast. Connectivity is the other dimension of islandness that explains the lower degree of urbanization of the islands’ coastal strip.
The objective of the land-cover changes geo-dashboard is to provide an overview of the dynamics of land-cover transformation on the island of Mallorca for the period 1990–2018, providing detailed information on the main transformations experienced, which are divided into three main areas: dynamics of artificial areas, dynamics of agricultural areas, and dynamics in forests and semi-natural areas.

2.3. Human Pressure (Geo-Dashboard 3)

The growing population and tourist pressure on the island of Mallorca, especially in urban areas, sensitive natural areas (beaches, tourist routes), and areas with a concentration of cultural heritage (cathedral, Lluc Monastery, etc.), pose significant challenges that we must try to understand to find rational solutions.
The island, known for its natural beauty and cultural richness, attracts many tourists seeking to enjoy these environments. However, this constant flow of visitors can have negative impacts on both the environment and cultural heritage, as well as on the quality of life of the residents, etc.
In sensitive natural areas, increasing visitor numbers can lead to progressive environmental degradation. This includes soil erosion, disturbance of wildlife habitats, contamination by waste, etc. If not properly managed, tourism activities, such as hiking, cycling, and boat trips, can alter fragile ecosystems and decrease their biodiversity.
Regarding cultural heritage, historical sites and sites of cultural importance also face similar challenges. The large influx of tourists can cause physical wear and tear on ancient structures and archaeological sites. In addition, the massive presence of visitors can alter the authenticity and atmosphere of these places, affecting the experience of both tourists and residents.
Tourist congestion is another significant problem associated with tourism pressure. During peak seasons, visitors can overwhelm popular tourist areas, resulting in crowded streets, crowded beaches, shortages of public services such as parking, and increased traffic and pollution. This situation can negatively affect the quality of the tourist experience and diminish the quality of life for residents.
The need for appropriate regulation is key to addressing these challenges. It is essential to implement policies and strategies that balance promoting tourism with protecting and conserving natural and cultural resources. This may include limiting the number of visitors in certain areas, promoting sustainable tourism practices, improving infrastructure to manage crowds better, and encouraging off-season tourism to distribute visitors throughout the year better. In addition, it is crucial to involve local communities in tourism planning and management to ensure that tourism development benefits the resident population and respects their culture and environment.
It is considered relevant to have historical or real-time information on visitors to a given resource (natural, cultural) to be able to assess the pressure it presents and thus be able to develop plans or actions to adapt this pressure to its true carrying capacity. From this perspective, information on the location of people obtained from the georeferencing of mobile devices is increasingly used.
In the human pressure analysis geo-dashboard, a test is carried out to evaluate the human pressure on the territory of Mallorca obtained from the information extracted from the geo-positioning of photographs of Mallorca published on the Flickr platform.
Flickr is an online photo and video-sharing platform known for its large user community and extensive image library. On the other hand, the Flickr API is a set of programming interfaces allowing developers to interact with the Flickr platform. This includes accessing photos, user information, and metadata associated with images. Many pictures on Flickr are tagged with geographic information indicating where they were taken [59,60,61]. This information can include latitude and longitude coordinates and other location-related metadata. By accessing these photos and their metadata through the API, it is possible to use this information to geo-reference the images. Thus, pictures locating the photos on a map or performing analysis based on their geographic location is possible.
The starting hypothesis is that the location of Flickr photos indicates the number of people at a site, so that a level of human pressure can be extrapolated from the number of pictures in a geographical environment for a given period. In addition, these photos have been taken at a site with a certain land cover/land use, so they can also be used to assess whether human pressure is on a natural, agricultural, or forested geographic environment.
The objective is to generate a geo-dashboard that provides information on human pressure on the territory at the census section level and to assess the level of affectation for every kind of land cover according to level I of the Corine Land Cover 2018 legend.

2.4. Tourism Uses at Urban Areas (Geo-Dashboard 4)

The distribution of tourist uses in urban areas, the income level of the resident population, the externalities generated by tourism, and tourist congestion are issues of great importance in the planning and management of tourism on the island of Mallorca.
The correlation between tourism uses and the income level of the local population can be significant. Areas with a high concentration of tourism often experience an increase in the cost of living, including housing prices and rents, which can displace lower-income residents. This phenomenon, known as tourist gentrification, can alter neighborhoods’ social and economic composition, creating areas where only the better-off can afford to live or vacation. This can lead to socio-economic segregation and the loss of local identity and character of communities.
In addition, tourism generates externalities, both positive and negative. Positive externalities include economic development, job creation, and infrastructure improvement. However, negative externalities can vary significantly, including environmental pollution, noise, and wear and tear on public services and infrastructure. These effects can negatively affect local residents’ quality of life and alter urban areas’ ecological and social balance.
To address these issues, urban planning and management that addresses the needs of both tourists and residents is crucial. This includes fair housing policies, measures to mitigate the negative externalities of tourism, and urban planning that balances tourist spaces with residential areas. Promoting sustainable and responsible tourism that benefits local communities and preserves the unique character of urban areas is also important.
The city of Palma, the capital of the Community of the Balearic Islands (Mallorca), presents a scenario that largely reproduces the set of problems mentioned above. There is an important line of research in this regard [37,62,63,64].
In this context, the development of a geo-dashboard oriented to the management of tourist uses in urban spaces is considered appropriate to be able to analyze information corresponding to the tourist offer in an integrated way, together with demographic and economic variables. To this end, it is necessary to integrate various available data sources that provide information of interest. Specifically, on the one hand, the National Institute of Statistics offers demographic and income information, and, on the other, the cadastral cartography of the Electronic Headquarters of the Cadastre includes information on the urban uses of the territory. The fusion of both cartographies provides a very suitable monitoring tool for the urban diagnosis of tourist activity.

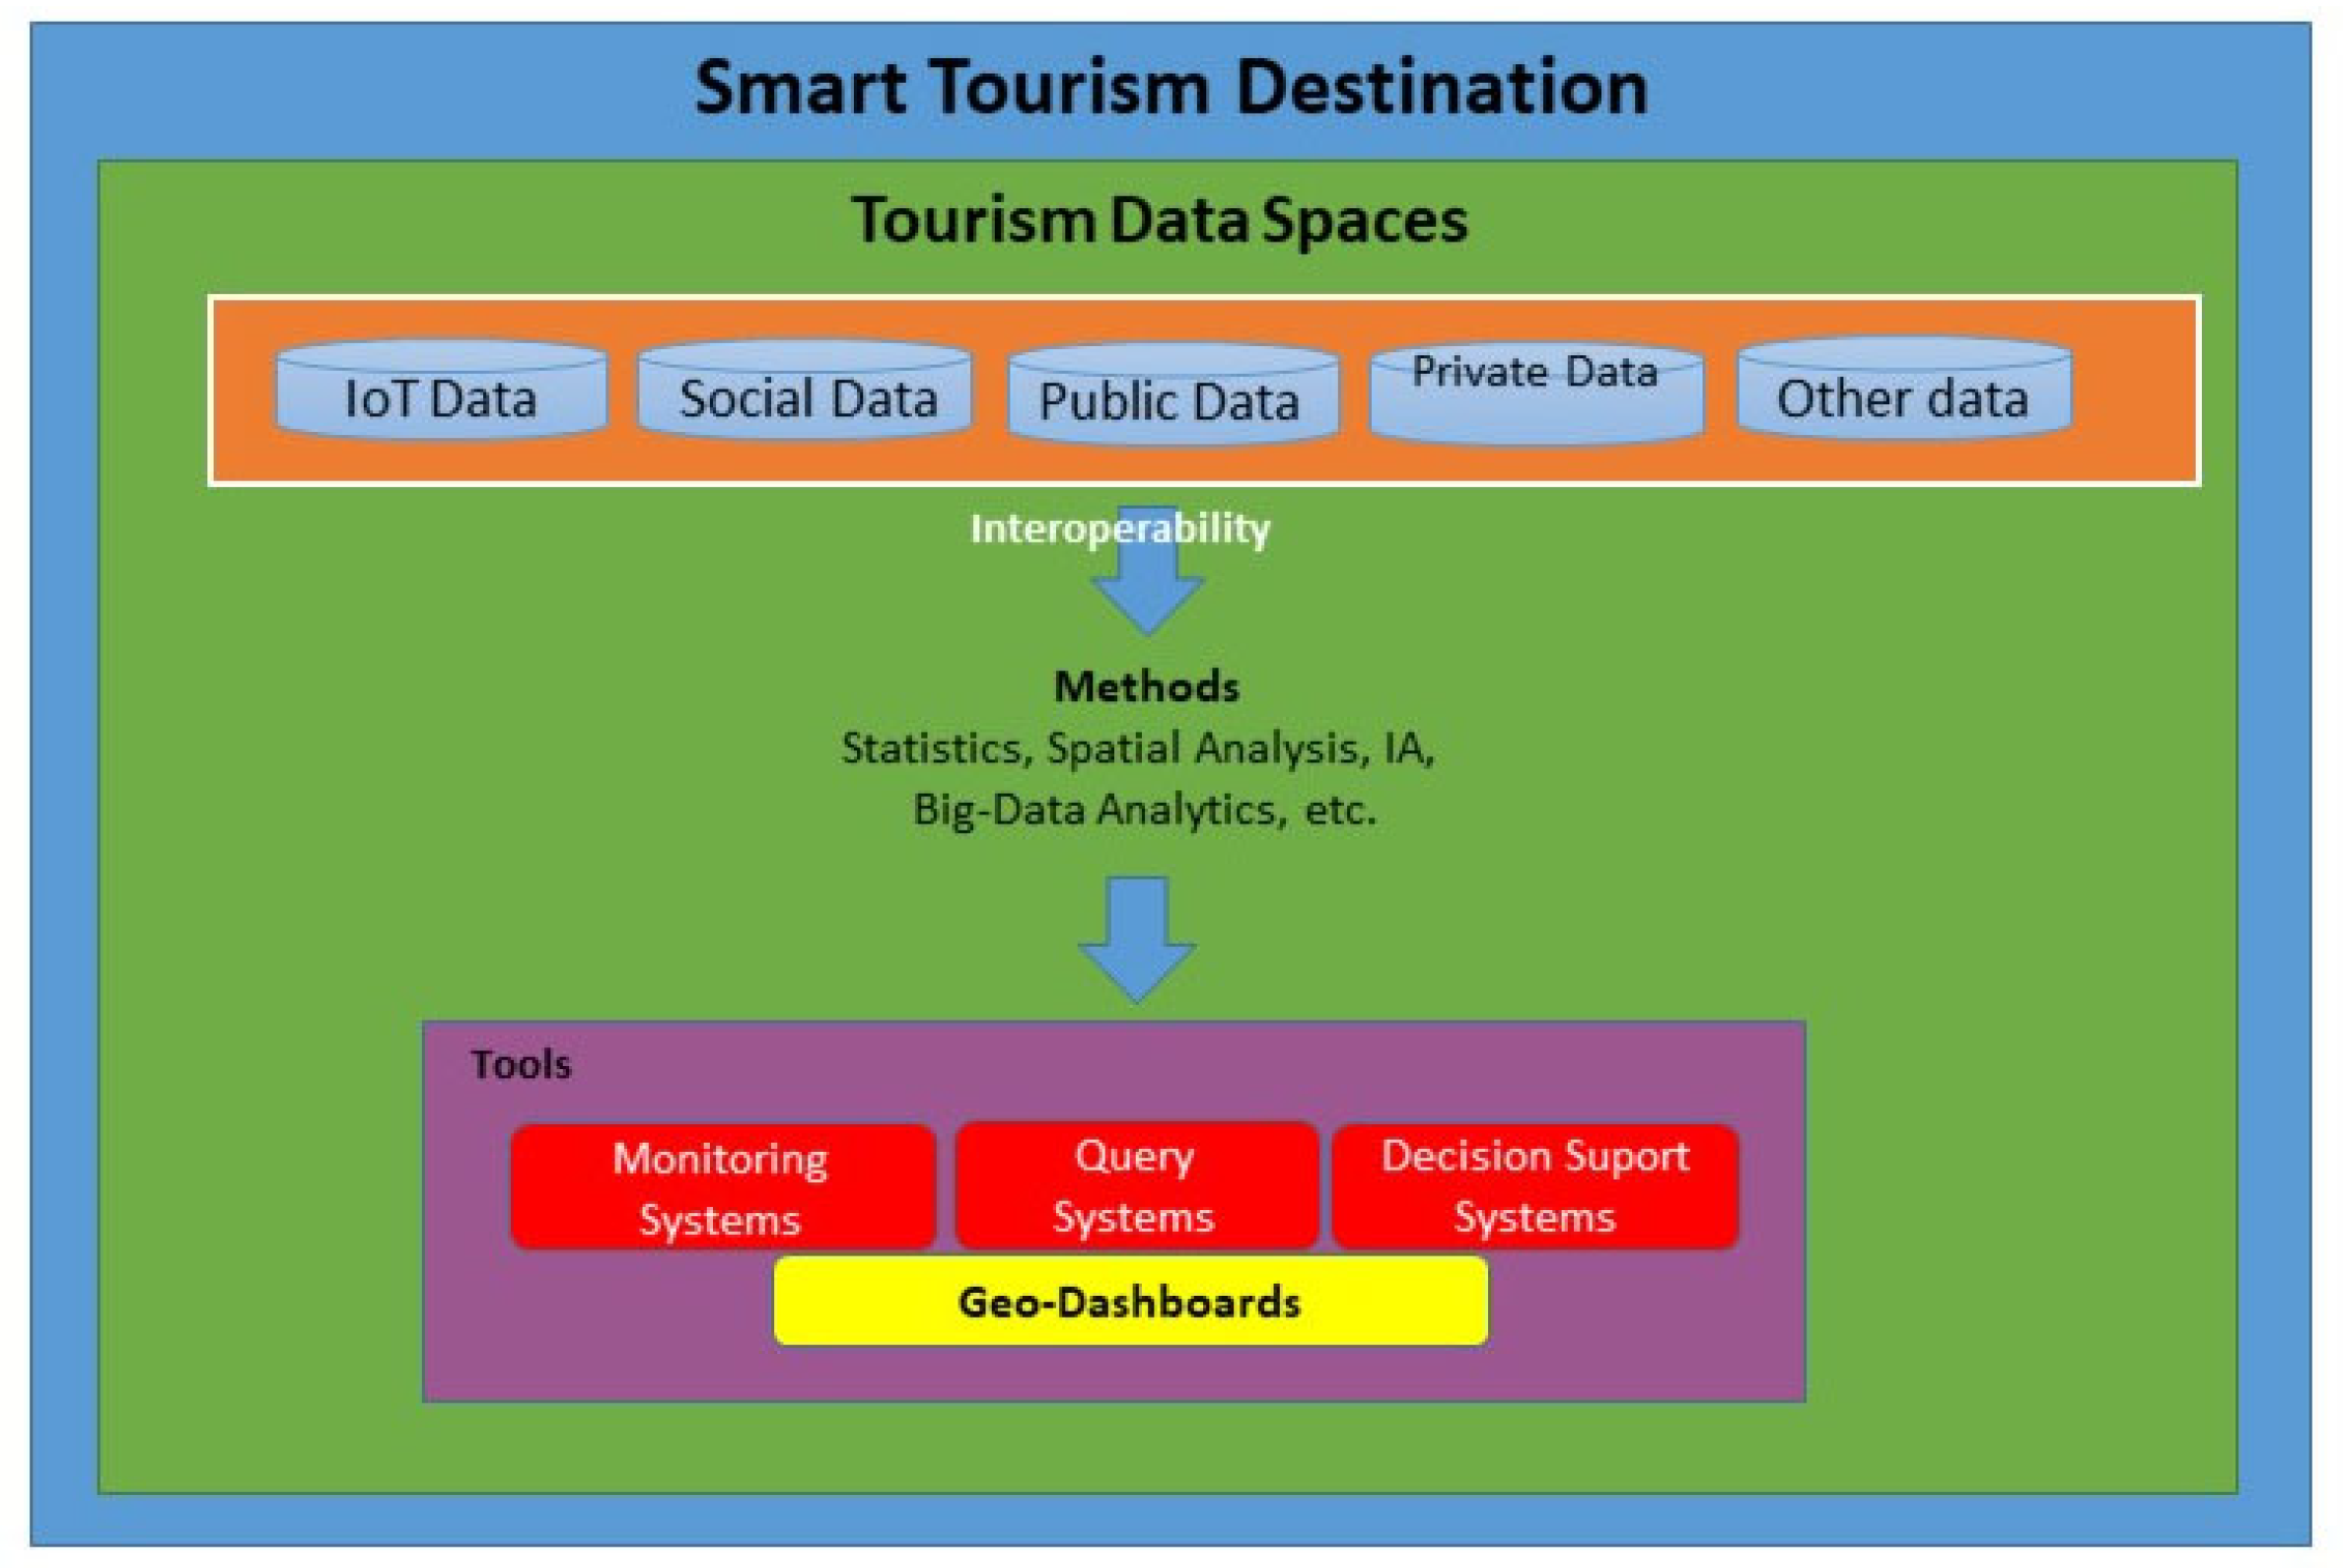
3. Conceptual Framework and State of the Art: Geo-Dashboards
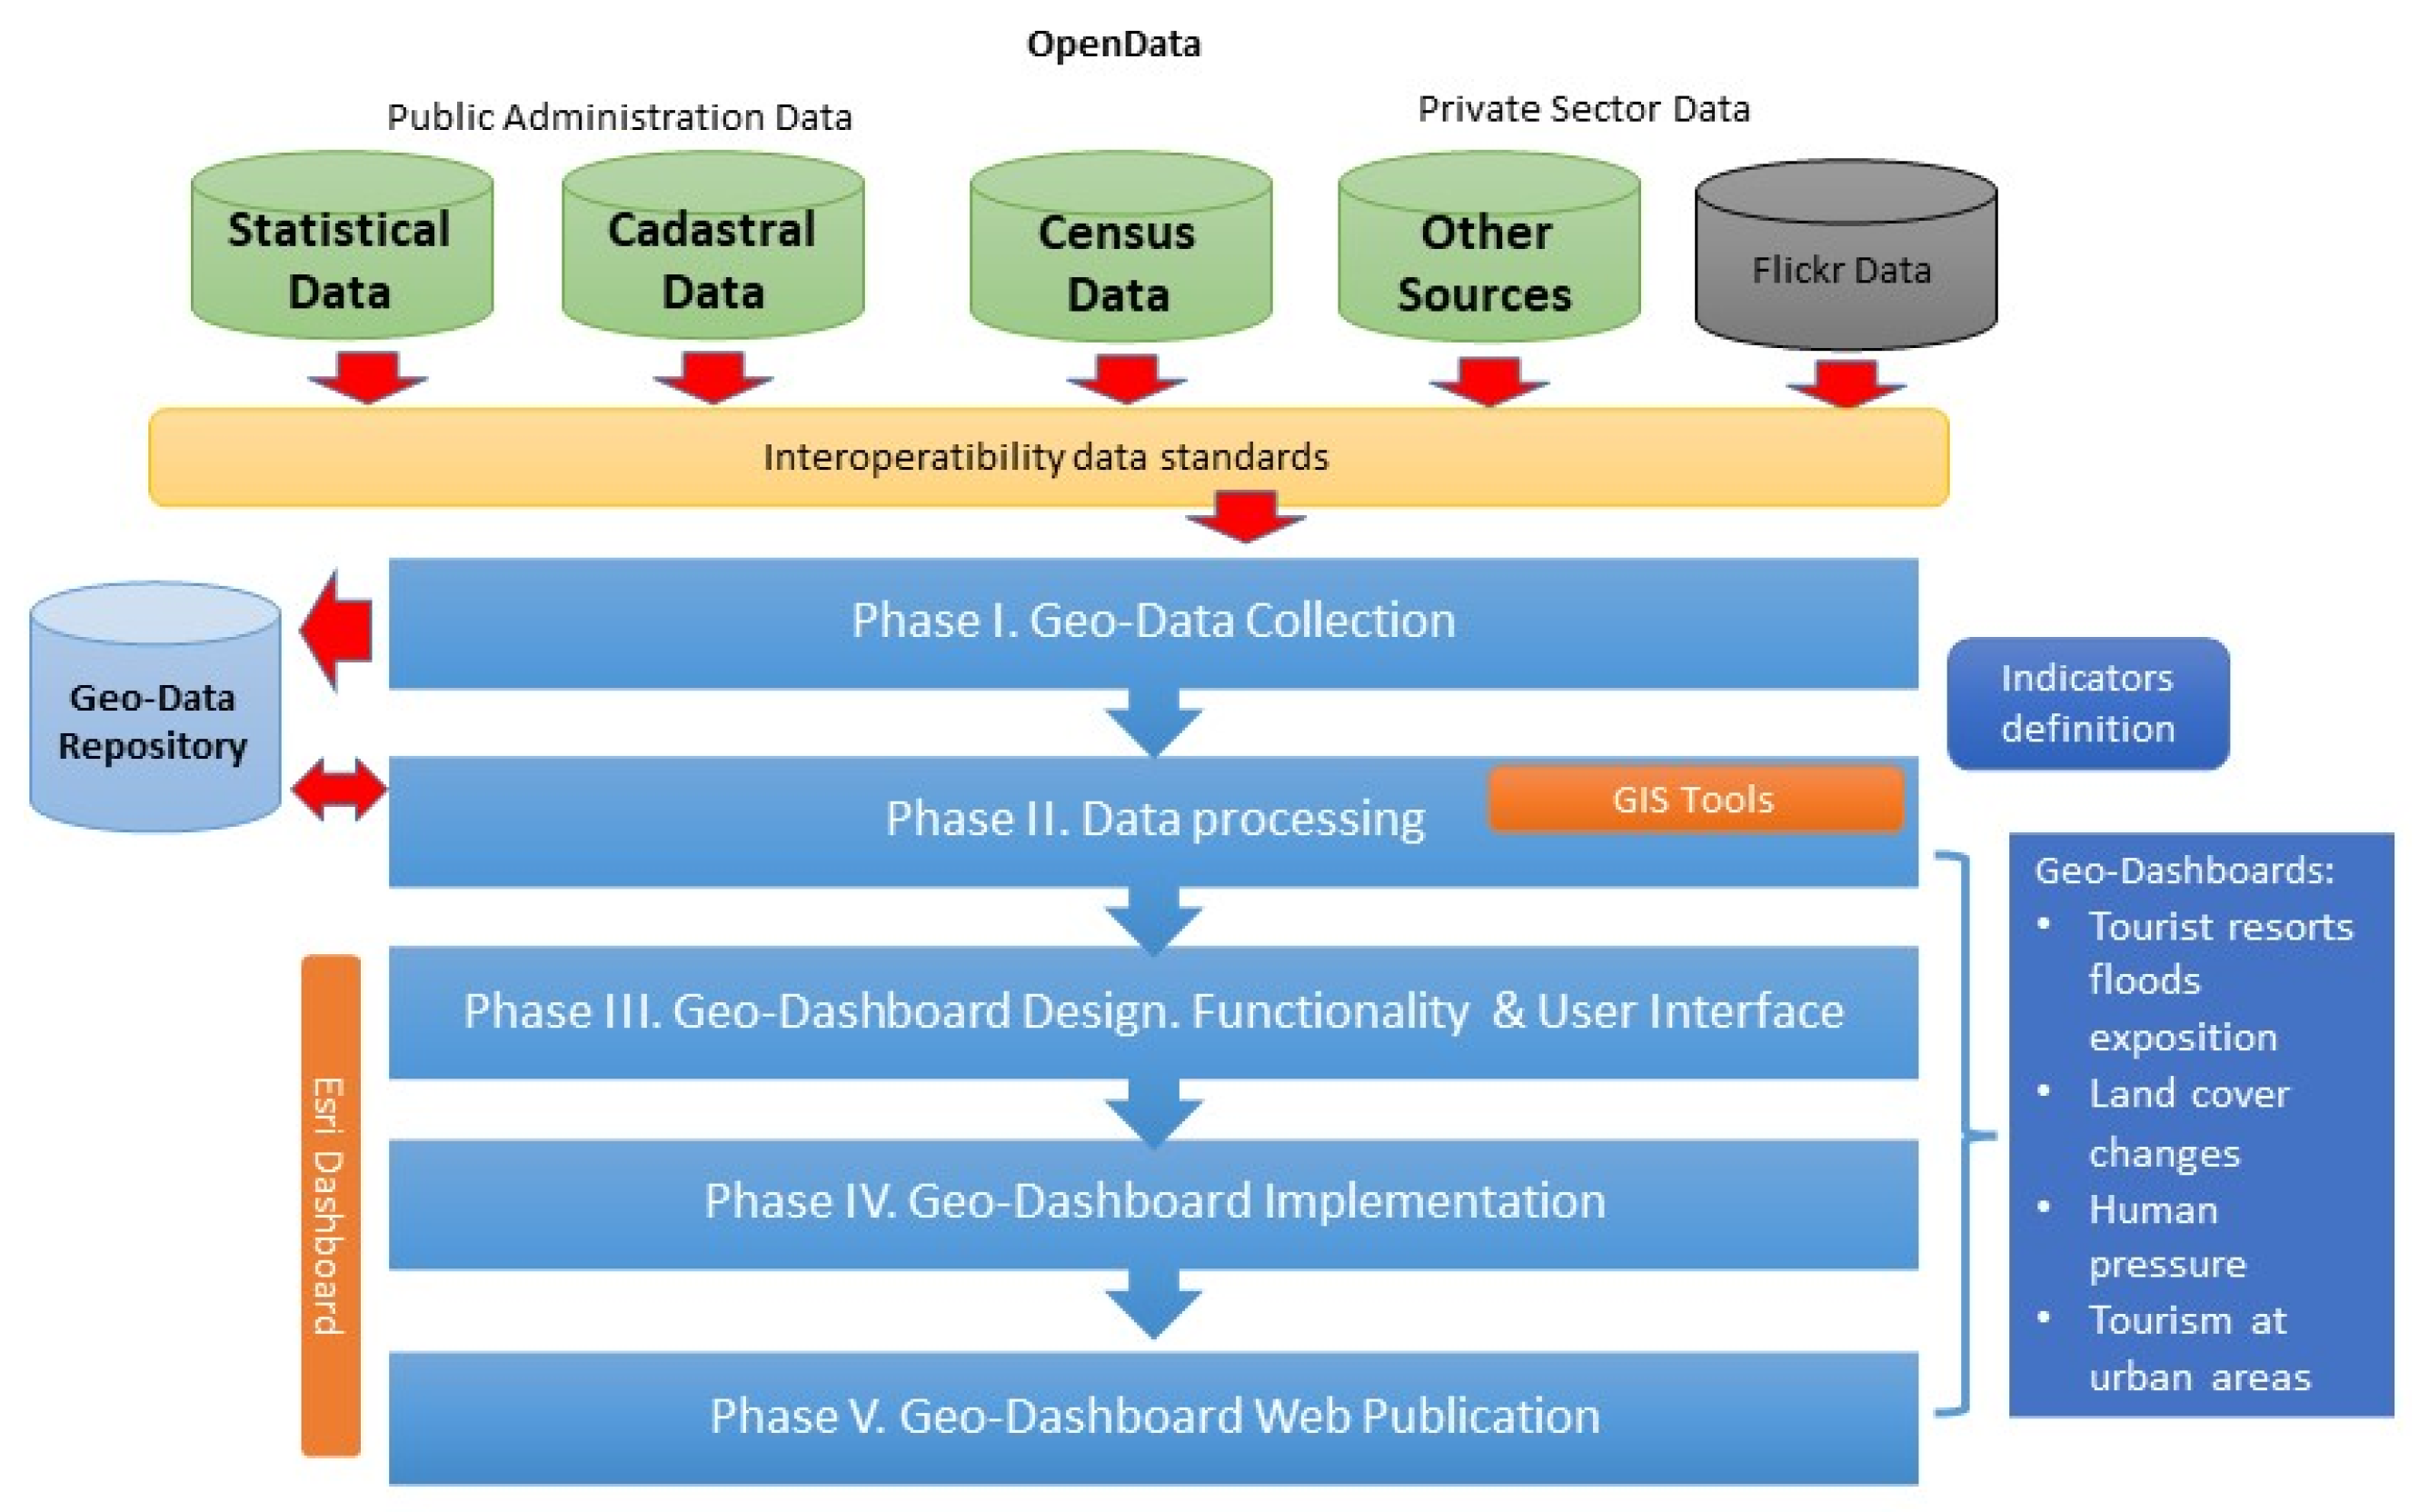
Tourism data spaces reflect a significant evolution in the use of advanced technologies for more efficient management and better understanding of the tourism sector [65,66]. In this context, the integration of various data sources has become increasingly important in the digital era, primarily driven by the need for informed decision-making based on accurate and up-to-date information.
Regarding analytical data tools in tourism, the use of Big Data [60,67,68,69] and predictive analysis [70,71,72,73] has become fundamental. The ability to analyze large volumes of real-time data, ranging from booking pattern detection to integrated analysis of social media comments, enables a deeper understanding of tourism market trends. This information is crucial for anticipating changes in consumer preferences and behaviors, as well as forecasting the demand for tourism services [74,75].
Artificial intelligence and machine learning represent another significant pillar in these data spaces [7,76]. These technologies are used to personalize the tourism experience [77,78], providing recommendations based on users’ previous preferences and behaviors. The ability to process and autonomously learn from data enables these tools to offer increasingly precise and useful insights for tourism planning. Artificial intelligence (AI) plays a crucial role in tourism data analysis. By integrating AI with geo-dashboards, we can enhance tourism planning and support, reducing environmental and social impacts for more sustainable tourism. AI can process vast amounts of data, providing valuable insights into tourist behaviors and preferences. However, it is important to clarify that this project does not aim to incorporate AI tools into the developed geo-dashboards. Our focus is on monitoring aspects rather than on advanced AI functions like pattern detection, modelling, or prediction, defining the scope of our geo-dashboard application in tourism management.
Geolocation and mapping of tourism variables play a crucial role in tourism data spaces. These technologies enable the geographical visualization of tourism data, facilitating functions such as analyzing movement patterns, identifying areas of high tourist concentration, and mapping the distribution of resources and services [79,80,81].
Data dissemination platforms have become an essential component of tourism data spaces. The creation of interactive dashboards and data visualizations allows stakeholders, ranging from tourism planners to businesses and tourists, to access relevant information easily and understandably [82,83,84,85]. These platforms not only represent data visually but also provide interactive analysis, facilitating the identification of complex patterns and emerging trends [22,86,87].
A prominent feature of tourism dashboards is their high degree of interactivity. These tools allow users to manipulate and explore data in various ways, including filtering information by specific categories such as location, time, and type of tourism. This flexibility ensures that different users can customize data visualization to their specific needs. The integration of real-time data is another vital functionality of these dashboards [88]. They capture and display continually updated information, which is crucial in a dynamic sector like tourism. This feature allows tourism operators and planners to respond quickly to emerging changes in travel patterns, bookings, and consumer preferences.
Furthermore, tourism dashboards are effective communication tools. They facilitate the dissemination of complex information to a broad audience, including stakeholders, tourism planners, investors, and the local community [89]. By presenting data in a visual and accessible manner, these dashboards help all those involved to better understand the factors impacting tourism in a specific region.
Geo-dashboards (also known as geospatial dashboards or map-based dashboards) have evolved significantly from their origins, where static maps and limited functionalities were prevalent. The integration of geographic information systems (GIS) and business intelligence (BI) technologies has marked a turning point, greatly expanding their capabilities and applications [82,90,91]. Today, various platforms and tools range from open-source solutions to advanced commercial products. Leaders in the market like QGIS, ArcGIS, Tableau, and Power BI offer advanced spatial analysis and real-time visualization capabilities. Table 1 displays a selection of geo-dashboards as described in the scientific literature, including their objectives and the types of information included in the panels.
Geo-dashboards in tourism represent an integral and advanced tool in the field of smart tourism, serving as a bridge between data collection and strategic decision-making in smart tourism destinations. These dashboards are sophisticated systems that utilize a combination of geographic and alphanumeric data to provide a comprehensive and real-time view of various key aspects of tourism.
Geo-dashboards feed on a wide spectrum of data collected from diverse sources. This data can include detailed geographical information, such as the location of tourist attractions, traffic patterns, areas of high tourist influx, and visitor demographics. In addition, they also incorporate alphanumeric data, which can range from hotel occupancy statistics to tourist spending trends. The integration of these types of data offers a holistic and multidimensional view of the tourism environment.
The power of geo-dashboards lies in their ability to apply advanced analytical and statistical tools. By using artificial intelligence techniques and statistical analysis, these dashboards can process large data sets to identify patterns, trends, and correlations. This enables tourism destination managers to gain valuable insights, such as identifying high-demand areas, predicting tourism trends, and optimizing resources and services.
These systems are situated within a “tourism data space”, a digital ecosystem where relevant information for tourism is accumulated, processed, and analyzed. This data space acts as a centralized repository, facilitating access to up-to-date and accurate information, which is crucial for efficient and effective decision-making. Geo-dashboards enable an interactive and easy-to-understand visualization of data, which helps tourism destination managers to quickly adapt their strategies and services to the changing needs of tourists and the market, thereby fostering a richer, more efficient, and sustainable tourist experience (Figure 2).
Presently, geo-dashboards are indispensable across multiple sectors. In both public and private sectors, their use is widespread, encompassing urban management and public health [102,103], playing a crucial role in disease tracking [101], to logistics and retail planning [104]. In the tourism sector, they add significant value by integrating spatial components into visualization, indicator generation, and implemented analytical tools [90,105,106]. With the increasing availability of real-time data and the adoption of technologies like artificial intelligence and machine learning, geo-dashboards are evolving into smarter and more predictive platforms [107]. This not only enhances real-time analysis capabilities but also opens new possibilities for event and trend prediction and simulation.
Geo-dashboards provide a suitable platform for integrating citizen-provided data (volunteered geographic information) [108], supporting the monitoring of tourism mobility [93,109].
Investigating the development of tourism-focused geo-dashboards is crucial as it fills a significant gap in the existing scientific literature, offering applied possibilities that have not been extensively explored [110]. Advancing interactive geo-dashboards in tourism is vital for sustainable tourism planning and decision-making. These tools can provide comprehensive insights into travel patterns, environmental impacts, and tourist behaviors, enhancing decision-making for both tourists and decision-makers. Such advancements not only align with sustainable tourism objectives but also address a critical need for dynamic and informed tourism management strategies in an increasingly data-driven industry.

4. Methodology

For the construction of the four tourism geo-dashboards to support tourism planning and management, we propose the use of accessible, open, and published tourism and territorial information from various public administrations or private entities that provide information in standard digital formats (Shape, ESRI-Geodatabase, CSV, etc.).
The methodology used for the development of the geo-dashboards is presented in Figure 3. It consists of five phases. The first involves the selection of various geographical information sources from both public and private entities. Information is extracted and integrated into a data repository. Subsequently, in the second phase, various indicators are generated using spatial analysis tools. In the following phases, the creation of the geo-dashboards takes place, which includes the design of functionalities and interface, the implementation of the defined functionalities, and finally, the publication of the tool on the Web.
The four geo-dashboards developed in this project are strategically designed to promote the sustainability of tourism activities on the island of Mallorca. Each dashboard is tailored to address specific aspects of the island’s tourism dynamics: assessing the vulnerability of tourist accommodations to flooding, monitoring changes in land cover, studying human pressure in environmentally sensitive areas, and analyzing the distribution of tourist activities in relation to the economic impact on local communities. By providing detailed visualization and analysis of these crucial factors, the dashboards enable a more informed and strategic approach to tourism management. This approach not only optimizes decision-making for sustainable tourism practices but also contributes significantly to the broader goal of creating a harmonious balance between tourism development and environmental preservation on the island.
The sources of information and the analytical processes used in each case will be discussed in detail separately for each geo-dashboard created in the next sections.

4.1. Geo-Dashboard 1: Flood Tourism Exposition

The geo-dashboard “Flood tourism exposition” uses Airbnb data on the location of holiday homes and regulated tourist accommodation, as well as information from the National Floodplain Mapping System, including flood recurrence periods for 10, 100, and 500 years. The formats of these data vary between CSV and Shape, and sources include the Airbnb website, the Govern de les Illes Balears’ open data portal, and the Ministry for Ecological Transition and the Demographic Challenge (Table 2).
For unregulated tourist accommodation, data from the Airbnb platform was used. Airbnb is a platform that allows ordinary people to rent out their residences to tourists. Some authors consider it as a disruptive innovation that has transformed the accommodation market [111]. Peer-to-peer accommodation is cannibalizing the traditional tourism market. Its geographic scope is wider and more dispersed across the territory. The benefits of tourism are spreading, as is the exposure of tourists to hazards. For the analysis of the location of unregulated tourist accommodation, the Inside Airbnb platform has been taken into account for the location of the holiday tourism offers. This type of source is being used by a number of researchers [112,113,114,115,116].
The floods tourism exposition geo-dashboard has been constructed by integrating flood hazard mapping and point data corresponding to tourist accommodation and holiday homes. The methodology consists of superimposing point entities on polygons representing flood zones (Point over Polygon). In this way, the attributes of the flood zones are integrated with the characteristics of the accommodation and holiday homes.
The interfaces of the designed geo-dashboards have been implemented using ESRI’s dashboard tool, which is included in its ArcGIS.com platform.
It is important to note that this work represents a scientific product developed on an experimental basis in the context of academic research and is not an operational management tool for open use by tourism managers. The use of the geo-dashboards created until now is strictly academic.

4.2. Geo-Dashboard 2

The land-cover changes geo-dashboard is based on the use of Corine Land Cover data for the years 1990, 2000, 2006, 2012, and 2018, and the municipal division, to analyze the evolution of land-cover changes for each municipality on the island of Mallorca. The data are in geodatabase and Shape formats, and sources include the EU Copernicus land monitoring services and the Organismo Autónomo Centro Nacional de Información Geográfica (Table 3).
The analytical process developed consists of the cartographic overlaying using ArcGIS Pro (Intersect) of the series of land-cover maps of the Corine Land Cover project, covering the years 1990, 2000, 2006, 2012, and 2018 on the island of Mallorca, together with the municipal division. Subsequently, a statistical summary is generated, grouping municipalities by the different level 1 categories of the Corine Land Cover legend [117]. This methodology provides a broad and evolutionary view of land-use distribution in all the municipalities of Mallorca, allowing a comprehensive analysis of the changes that have occurred in each municipal area over time.

4.3. Geo-Dashboard 3

The human pressure geo-dashboard extracts geographic metadata from Flickr photos between 2015 and 2019 and groups them by NGI census tracts and 2018 Corine Land Cover typologies. This dashboard focuses on the assessment of population pressure. The data used are presented in Table 4, and their format includes CSV, Shape, and geodatabase. Data sources are the Flickr API, the National Institute of Statistics, and the Copernicus land monitoring services.
The geo-dashboard of human pressure (residential and tourist) is built from the georeferencing of the geographic metadata obtained through a program made in the Python language that consults the Flickr API and extracts the coordinates of the georeferenced photos of the platform for the period 2015–2019 (the program is attached in Table 4 of the Supplementary Materials). A layer of points representing the location of each photo is generated from the pictures. A total of 61,021 photographs have been obtained.
Subsequently, the photo layer (points) is superimposed (Overlay: Intersect) on the census section layers, Corine Land Cover 2018. In this way, the attributes of the census sections and land covers are incorporated into the photo layer.

4.4. Geo-Dashboard 4

The tourist uses at urban spaces geo-dashboard uses urban cadastral cartography, IGN census sections, and demographic and income data to analyze tourist uses of urban land and their relationship with socio-demographic variables. The data are in the Shape and Excel formats and come from the Electronic Headquarters of the Cadastre, the Ministry of Finance and Public Function, and the National Institute of Statistics. Table 5 presents the data sources and the format of the information used to create the geo-dashboard.
With regard to the analytical methodology developed, firstly, a meticulous process of data extraction from the cadastral cartography (alphanumeric and geographic) of the Electronic Headquarters of the Cadastre was carried out, corresponding to the municipality of Palma, complemented with the use of the QGIS program and its Cadastral Classifier extension. This extension allows the efficient classification of urban land uses in the categories identified by the Cadastre. Secondly, demographic and income data from the National Institute of Statistics have been integrated into the city of Palma (Mallorca) census sections. Subsequently, an overlay has been carried out, combining the information from cadastral parcels and census sections to obtain information on land use for each census section for which demographic and economic variables are available.
All the geo-dashboards were created with the ESRI Dashboard tool. First, it was necessary to create ArcGIS Pro v.3.0 projects and publish them through the ArcGIS.com platform. The implementation criteria for the dashboards follow the design guidelines proposed by Janes et al. 2013 [118].

5. Results and Discussion

5.1. Geo-Dashboard: Floods Exposition of Tourist Accommodation

The dashboard aims to dynamically identify the exposure to flood hazards of the tourist accommodation and holiday homes displayed on the base map. A modification of the extent of the visible map leads to a dynamic update of the indicators.
Figure 4 shows the interface of the generated dashboard.
The screen has been divided into three columns (Table 6).
The dashboard’s functionality is to identify interactively and in detail the flood risk exposure of accommodation and holiday homes. A movement of the map extension triggers an update of the indicators.
The information presented by this geo-dashboard is useful and informative for tourists staying in hotels, flats, or holiday homes in Mallorca. The tool makes it possible to identify the site’s exposure level and take appropriate measures to mitigate the potential effects of a flood. Tourism managers/territorial planners can identify which accommodations are exposed to flooding and take preventive and emergency management measures in the occurrence of an event.
In the Supplementary Materials, Tables S1 and S2 are attached, showing the distribution of tourist accommodation and holiday homes exposed to flooding by municipality. In general, Mallorca is widely exposed to flood zones for a recurrence period of 500 years. The municipalities with the highest degree of exposure are Calvià, Campos, Manacor, Palma, Pollença, and Sóller. These results warn of the need to implement appropriate measures to disseminate information on risk exposure and promote risk culture on the island, not only for residents but also for tourists and visitors.
In terms of improvements, the tool could incorporate other functionalities, such as the inclusion of other types of risks (fires, landslides). If it were implemented in the field of public administration, it could provide direct access to the contact telephone numbers of the accommodation facilities to implement protection measures in the event of potential events.
This is an example of a geo-dashboard that uses open and up-to-date data sources to support tourism planning for natural hazard prevention. This is an example of the potential of tourism data spaces in Mallorca to support sustainable tourism planning by integrating geo-scientific information on natural hazards with hotel and holiday home data. The sharing of data between the private sector, academia, and the public sector is the cornerstone of this tourism data space, which has as a direct positive result an increase in the safety of the destination and, therefore, in its attractiveness to tourists.

5.2. Dashboard of Municipal Land-Cover Changes

Figure 5 shows the interface of the land-cover changes geo-dashboard, and Table 4 explains each of the built-in functionalities in detail.
A black background has been selected for the dashboard to highlight both the map and the graphics generated. The interactivity is given by the possibility of choosing the municipality under study. It is also possible to interactively visualize the legend that provides information on the changes experienced (Table 7).
The land-cover changes geo-dashboard is an example of a digital tool built from Corine Land Cover open territorial information which, once integrated into an analysis platform and conveniently combined with municipal details, provides a synthetic vision of the dynamics of land-use transformation on the island of Mallorca.
This is a clear example of the current possibilities that can be implemented within the framework of constructing a tourism data space in Mallorca. The information exists, it is available, and it is feasible to integrate it into a data space.
The interest of the tool from the perspective of tourism planning is highlighted by the fact that it provides relevant indicators of the anthropic pressure of tourist municipalities and allows for the evaluation of the territory’s carrying capacity in the face of new urban-tourist developments.
The analysis of the municipal evolution of land cover, which served as the basis for the dashboard, shows that Mallorca has experienced a notable increase in urbanized areas between 1990 and 2018. However, it is in recent years that the transformation has been most evident (see Table S4 of the Supplementary Materials). Likewise, there has also been a significant decrease in agricultural areas due to the abandonment of farms and an increase in forest and semi-natural areas to cover the agricultural areas. This circumstance means an increase in urban forest areas, which increases the exposure of urbanized areas to the danger of forest fires.

5.3. Human Pressure

Figure 6 shows the user interface of the geo-dashboard. On this occasion, a dark background has been chosen for the design to highlight the color of the graphics and maps.
The functionality of the interface is summarized in Table 8.
The human pressure geo-dashboard is an example of an analysis tool for assessing tourist pressure in Mallorca. Although the information provided by the Flickr platform has not been sufficiently filtered to extract those photos taken by non-residents of the island, the results show a clear pattern that tourist environments include a greater number of images. The tool provides a territorial indicator of human pressure that can be suitably improved to support tourism planning.
This dashboard is a clear example of the potential use of information extracted from social networks to support tourism management and the detection of congestion in geographical areas. The map that serves as a sample in the interface description provides a view of the city of Palma, in which the port area and the old town are the ones with the highest values. These areas correspond to the greatest tourist areas of the city, so it is possible to use this map to indicate human pressure.
The dashboard has been built with private information accessible through an API and public territorial information, confirming the value of synergy in the construction of tourism decision support tools based on data. This type of application would be a suitable tool for incorporation into a tourism data space for Mallorca.

5.4. Geo-Dashboard of Tourism Uses in Urban Areas

Figure 7 shows the user interface of the geo-dashboard.
The functionality of the interface is summarized in Table 9.
The creation of a geo-dashboard of tourism uses in urban areas for the city of Palma in Mallorca is presented as an essential and timely tool for the island’s tourism data space. This type of dashboard facilitates an integrated and in-depth analysis of the tourist offer and demographic and economic variables, which is crucial to understanding the complex interactions between tourism and the local community.
One of the main advantages of this dashboard is its ability to identify and address problems of tourist gentrification. In many tourist cities, including Palma, the increase in tourism and the corresponding demand for accommodation can lead to a displacement of lower-income residents and alter the social and economic composition of neighborhoods. By correlating tourism uses with local income levels, the dashboard can help identify areas at risk of gentrification and thus formulate policies to mitigate these negative effects.
Moreover, tourism generates both positive and negative externalities. While it can boost economic development and job creation, it can also lead to problems such as environmental pollution, noise, and wear and tear on public services and infrastructure. These effects can negatively affect the quality of life of residents and disrupt the ecological and social balance of urban areas. The geo-dashboard provides a platform to monitor these externalities and develop strategies to balance the benefits and disadvantages of tourism.
The dashboard functionality, which allows tourism, demographic, and economic information to be viewed simultaneously and in detail, is particularly valuable. Providing a clear picture of how tourism impacts the different census sections of Palma, facilitates informed and strategic decision-making for more sustainable and equitable tourism management.

6. Conclusions

Currently, the availability of open digital data related to territory, tourism infrastructure, people’s location, and territorial risks, provided by public administrations at various levels, is crucial for developing monitoring and planning tools in tourism. This development significantly contributes to creating a robust tourism data space, highlighting the applicability of these data for decision-making in the tourism sector. The usefulness of this data motivates administrations, the private sector, and academia to produce and share valuable information for the tourism ecosystem.
In this article, we have demonstrated that using open data, it was possible to develop four tools for consulting and monitoring various aspects of tourism activity in Mallorca: risk exposure, changes in land use, human pressure, and tourism activity in urban environments. Mallorca, as a mature tourism destination, has been taken as a case study for the implementation of these digital tools, underlining the need for accessible and operational data.
The developed geo-dashboards represent an initial step in capitalizing on territorial information to support tourism planning on the island. Open access to these dashboards provides a new and attractive perspective on information relevant to tourism planning and management.
However, the research has limitations, mainly due to not incorporating all available information sources and the need for new data sources, both open and private, to advance in creating more advanced analytical tools. This underscores the urgency of developing tourism data spaces in the Balearic Islands and other tourist destinations.
Another limitation is the possibility of improving the functionalities of the built tools by incorporating more precise analyses with advanced artificial intelligence tools for the development of prediction and pattern detection instruments, as well as the inclusion of collaborative planning tools that allow global assessments by experts in real-time to obtain more robust and integrated results.
In the realm of geo-dashboards, the integration of AI can revolutionize how geographical data is processed and visualized. AI can enhance the capabilities of these dashboards by automating the analysis of spatial data, thus providing more accurate and real-time insights into tourist movements, the popularity of destinations, and resource allocation. By incorporating AI, geo-dashboards can transform from merely being tools for data visualization into intelligent systems capable of predictive analytics and trend forecasting. This integration allows for a more dynamic and responsive approach to tourism management, where decisions are informed by real-time data and predictive insights, ensuring a more efficient, sustainable, and personalized tourism experience.
Building on the findings and limitations identified in the article, future activities aimed at enhancing the work conducted on geo-dashboards and contributing to the sustainability of the tourism destination of Mallorca involve several strategic directions.
Firstly, expanding the data sources is crucial. While the current geo-dashboards utilize open data, integrating additional data sources, both open and private, could significantly enrich the analysis. This means actively seeking partnerships with local businesses, tourism operators, and other private entities to gain access to a broader range of data, such as visitor feedback, detailed accommodation statistics, and specific environmental impact data. Collaborating with these stakeholders not only diversifies the data pool but also fosters a more comprehensive understanding of the tourism ecosystem in Mallorca.
Secondly, enhancing the analytical capabilities of the geo-dashboards through advanced AI and machine learning techniques is a vital step.
Additionally, there is an opportunity to improve the functionality of the dashboards by incorporating collaborative planning tools. These tools can enable real-time global assessments by experts, facilitating a more integrated and robust decision-making process. The inclusion of interactive features, where stakeholders can input data, share insights, or even simulate different management scenarios, can significantly enhance the utility and effectiveness of the dashboards.
Furthermore, continuous updating and refinement of the dashboards is necessary to ensure they remain relevant and effective. This involves regular reviews of the data sources, updating the analytical algorithms, and adjusting the dashboards to reflect new tourism trends or environmental concerns.
Lastly, disseminating the findings and methodologies used in developing these geo-dashboards can serve as a model for other tourist destinations. Sharing the lessons learned, challenges faced, and successes achieved in Mallorca with the broader tourism and data science communities can inspire similar initiatives globally, contributing to the advancement of sustainable tourism practices through data-driven insights.

Supplementary Materials

The following supporting information can be downloaded at: https://www.mdpi.com/article/10.3390/smartcities7010026/s1, Table S1. Number of regulated accommodations (hotels and apartments) exposed to floods; Table S2. Number of Airbnb vacation houses by flood recurrence period exposed to floods; Table S3. Land-cover changes 2000-2018 by municipality; Table S4. Python program for extracting the Flirck Python program.

Author Contributions

Conceptualization, D.O.-M. and M.R.-P.; methodology, D.O.-M. and M.R.-P.; validation, D.O.-M.; formal analysis, D.O.-M.; investigation, D.O.-M.; resources, D.O.-M.; data curation, D.O.-M.; writing—original draft, D.O.-M.; writing—review and editing, D.O.-M., J.M.S.-P. and M.R.-P.; supervision, J.M.S.-P. and M.R.-P.; project administration, J.M.S.-P.; funding acquisition, J.M.S.-P. All authors have read and agreed to the published version of the manuscript.

Funding

This paper has been funded in the framework of the project: Universitat de les Illes Balears: OIMO-2023-645/541A

Data Availability Statement

No new data were created or analyzed in this study. Data sharing is not applicable to this article.

Acknowledgments

The authors wish to extend their sincere gratitude to the reviewers of this article for their dedicated and thorough analysis. The insightful comments and suggestions provided have immensely contributed to enhancing the quality and clarity of this work. Their expertise and insights have significantly shaped the ideas presented herein.

Conflicts of Interest

The authors declare no conflict of interest.

References

  1. Peeters, P.; Çakmak, E.; Guiver, J. Current issues in tourism: Mitigating climate change in sustainable tourism research. Tour. Manag. 2024, 100, 104820. [Google Scholar] [CrossRef]
  2. León-Gómez, A.; Ruiz-Palomo, D.; Fernández-Gámez, M.A.; García-Revilla, M.R. Sustainable Tourism Development and Economic Growth: Bibliometric Review and Analysis. Sustainability 2021, 13, 2270. [Google Scholar] [CrossRef]
  3. Prerana; Kapoor, D.; Jain, A. Sustainable tourism and its future research directions: A bibliometric analysis of twenty-five years of research. Tour. Rev. 2023; ahead of print. [Google Scholar]
  4. Jasrotia, A.; Gangotia, A. Smart cities to smart tourism destinations: A review paper. Tour. Intell. Smartness 2018, 1, 47–56. [Google Scholar]
  5. Baidal, J.A.I.; Monzonis, F.J.S.; Sanchez, D.G. Tourism management and information and communication technologies (ICTs): The new smart destinations approach. Doc. D Anal. Geogr. 2016, 62, 327–346. [Google Scholar]
  6. Jia, Q.; Cui, Y.; Liu, E.N.X.U.A.N.; Young, J.; Polly, Y.; Sun, W.; Shen, H. Construction and Design of a Smart Tourism Model Based on Big Data Technologies. Mob. Inf. Syst. 2022, 2022, 1120541. [Google Scholar] [CrossRef]
  7. Hu, H.; Li, C. Smart tourism products and services design based on user experience under the background of big data. Soft Comput. 2023, 27, 12711–12724. [Google Scholar] [CrossRef]
  8. Jovicic, D.Z. From the traditional understanding of tourism destination to the smart tourism destination. Curr. Issues Tour. 2019, 22, 276–282. [Google Scholar] [CrossRef]
  9. Garcia-Milon, A.; Juaneda-Ayensa, E.; Olarte-Pascual, C.; Pelegrin-Borondo, J. Towards the smart tourism destination: Key factors in information source use on the tourist shopping journey. Tour. Manag. Perspect. 2020, 36, 100730. [Google Scholar] [CrossRef]
  10. Tiwari, V.; Mishra, A.; Tiwari, S. Role of data safety and perceived privacy for acceptance of IoT-enabled technologies at smart tourism destinations. Curr. Issues Tour. 2023. [Google Scholar] [CrossRef]
  11. Del Vecchio, P.; Mele, G.; Ndou, V.; Secundo, G. Creating value from Social Big Data: Implications for Smart Tourism Destinations. Inf. Process. Manag. 2018, 54, 847–860. [Google Scholar] [CrossRef]
  12. Saydam, M.B.; Arici, H.E.; Koseoglu, M.A. How does the tourism and hospitality industry use artificial intelligence? A review of empirical studies and future research agenda. J. Hosp. Mark. Manag. 2022, 31, 908–936. [Google Scholar] [CrossRef]
  13. Ordóñez, M.D.; Gómez, A.; Ruiz, M.; Ortells, J.M.; Niemi-Hugaerts, H.; Juiz, C.; Jara, A.; Butler, T.A. IoT technologies and applications in tourism and travel industries industries. In Internet of Things—The Call of the Edge; River publishers: Aalborg, Denmark, 2022; pp. 341–360. [Google Scholar]
  14. Loureiro, S.M.C.; Nascimento, J. Shaping a View on the Influence of Technologies on Sustainable Tourism. Sustainability 2021, 13, 12691. [Google Scholar] [CrossRef]
  15. Montero, A.A.; López-Sánchez, J.A. Intersection of Data Science and Smart Destinations: A Systematic Review. Front. Psychol. 2021, 12, 712610. [Google Scholar] [CrossRef] [PubMed]
  16. Kunzmann, K.R.; Stephenson, M.; Dobson, G. Deciphering the Development of Smart and Sustainable. J. South-East Asian Stud. 2020, 13, 143–154. [Google Scholar]
  17. Caldevilla-Domínguez, D.; Martínez-Sala, A.M.; Barrientos-Báez, A. Tourism and ICT. Bibliometric Study on Digital Literacy in Higher Education. Educ. Sci. 2021, 11, 172. [Google Scholar] [CrossRef]
  18. EU. European Data Space for Tourism (DATES). DATES Project. 2023. Available online: https://www.tourismdataspace-csa.eu/ (accessed on 15 November 2023).
  19. EU. Blue Print. Tourism Data Space. 2023. Available online: https://www.tourismdataspace-csa.eu/wp-content/uploads/2024/01/DRAFT-BLUEPRINT-Tourism-Data-Space-v3.3_final.pdf (accessed on 15 November 2023).
  20. Celdran-Bernabeu, M.A.; Mazon, J.-N.; Sanchez, D.G. Open Data and tourism. Implications for tourism management in Smart Cities and Smart Tourism Destinations. Investig. Tur. 2018, 15, 49–78. [Google Scholar]
  21. Fodor, O.; Werthner, H. Harmonise: A step toward an interoperable e-tourism marketplace. Int. J. Electron. Commer. 2005, 9, 11–39. [Google Scholar] [CrossRef]
  22. Ordóñez-Martínez, D.; Seguí-Pons, J.M.; Ruiz-Pérez, M. Conceptual Framework and Prospective Analysis of EU Tourism Data Spaces. Sustainability 2023, 16, 371. [Google Scholar] [CrossRef]
  23. Baggio, R.; Buhalis, D. Open Data: Challenges and Opportunities for the Tourism Industry. In Tourism Management, Marketing, and Development; Palgrave Macmillan: New York, NY, USA, 2014; pp. 2009–2010. [Google Scholar]
  24. Kotsev, A.; Minghini, M.; Tomas, R.; Cetl, V.; Lutz, M. From spatial data infrastructures to data spaces—A technological perspective on the evolution of European SDIs. ISPRS Int. J. Geo-Info. 2020, 9, 176. [Google Scholar] [CrossRef]
  25. Figgemeier, H.; Henzen, C.; Rümmler, A. A Geo-Dashboard Concept for the Interactively Linked Visualization of Provenance and Data Quality for Geospatial Datasets. Agil. GIScience Ser. 2021, 2, 1–8. [Google Scholar] [CrossRef]
  26. IBESTAT. Demografia/Turismo. 2020. Available online: https://ibestat.caib.es/ibestat/ (accessed on 20 September 2020).
  27. Exceltur; GOIB, IMPACTUR Baleares. p. 43. 2020. Available online: https://www.exceltur.org/wp-content/uploads/2022/04/IMPACTUR-Baleares-2020.pdf (accessed on 15 November 2023).
  28. Deyà-Tortella, B.; Garcia, C.; Nilsson, W.; Tirado, D. Analysis of water tariff reform on water consumption in different housing typologies in Calvià (Mallorca). Water 2017, 9, 425. [Google Scholar] [CrossRef]
  29. Hof, A.; Wolf, N. Estimating potential outdoor water consumption in private urban landscapes by coupling high-resolution image analysis, irrigation water needs and evaporation estimation in Spain. Landsc. Urban Plan. 2014, 123, 61–72. [Google Scholar] [CrossRef]
  30. Kent, M.; Newnham, R.; Essex, S. Tourism and sustainable water supply in Mallorca: A geographical analysis. Appl. Geogr. 2002, 22, 351–374. [Google Scholar] [CrossRef]
  31. Pons, A.; Rullan, O. Artificialization and Islandness in Coastal Areas of Western Mediterranean Europe with special attention to the Spanish tourist coast. Local Econ. Cult. 2013, 1–5. [Google Scholar]
  32. Vázquez-Luis, M.; Borg, J.A.; Morell, C.; Banach-Esteve, G.; Deudero, S. Influence of boat anchoring on Pinna nobilis: A field experiment using mimic units. Mar. Freshw. Res. 2015, 66, 786–794. [Google Scholar] [CrossRef]
  33. Balaguer, P.; Diedrich, A.; Sarda, R.; Fuster, M.; Canellas, B.; Tintore, J. Spatial analysis of recreational boating as a first key step for marine spatial planning in Mallorca (Balearic Islands, Spain). Ocean Coast. Manag. 2011, 54, 241–249. [Google Scholar] [CrossRef]
  34. Valdivielso, J.; Moranta, J. The social construction of the tourism degrowth discourse in the Balearic Islands. J. Sustain. Tour. 2019, 27, 1876–1892. [Google Scholar] [CrossRef]
  35. Saenz-de-Miera, O.; Rosselló, J. The responsibility of tourism in traffic congestion and hyper-congestion: A case study from Mallorca, Spain. Tour. Manag. 2012, 33, 466–479. [Google Scholar] [CrossRef]
  36. Bestard, A.B. Attitudes Toward Tourism and Tourism Congestion. Reg. Dev. 2007, 25, 193–207. [Google Scholar]
  37. Gonzalez-Perez, J.M. Evictions, Foreclosures, and Global Housing Speculation in Palma, Spain. Land 2022, 11, 293. [Google Scholar] [CrossRef]
  38. Ruiz-Pérez, M.; Seguí-Pons, J.M. Transport mode choice for residents in a tourist destination: The long road to sustainability (the case of Mallorca, Spain). Sustainability 2020, 12, 9480. [Google Scholar] [CrossRef]
  39. Esteva, A.P. Islandness, tourism and urbanization in the Balearic Islands. Doc. D Anal. Geogr. 2019, 65, 321–343. [Google Scholar]
  40. Estrany, J.; Grimalt, M. Catchment controls and human disturbances on the geomorphology of small Mediterranean estuarine systems. Estuar. Coast. Shelf Sci. 2014, 150, 230–241. [Google Scholar] [CrossRef]
  41. Yrigoy, I. Rent gap reloaded: Airbnb and the shift from residential to touristic rental housing in the Palma Old Quarter in Mallorca, Spain. Urban Stud. 2019, 56, 2709–2726. [Google Scholar] [CrossRef]
  42. Blázquez-Salom, M.; Blanco-Romero, A. Fieldwork in ground zero, mallorca. A methodological fieldwork proposal for a geographical analysisllll of Tourist Areas. Investig. Geogr. 2021, 2021, 43–59. [Google Scholar]
  43. Lopez, A.N.; del Vas, G.M. Sustainable tourism versus tourism depredation. Balearic Islands, Spain. Rev. Geogr. Venez. 2021, 62, 394–409. [Google Scholar]
  44. Cutter, S.L.; Boruff, B.J.; Shirley, W.L. Social vulnerability to environmental hazards. Soc. Sci. Q. 2003, 84, 242–261. [Google Scholar] [CrossRef]
  45. Provitolo, D.; Reghezza-Zitt, M. Resilience and Vulnerability: From Opposition towards a Continuum. Resil. Imp. Uncertain. Risks Disasters 2015, 29–50. [Google Scholar] [CrossRef]
  46. Koks, E.E.; Jongman, B.; Husby, T.G.; Botzen, W.J.W. Combining hazard, exposure and social vulnerability to provide lessons for flood risk management. Environ. Sci. Policy 2015, 47, 42–52. [Google Scholar] [CrossRef]
  47. Brown, N.A.; Rovins, J.E.; Feldmann-Jensen, S.; Orchiston, C.; Johnston, D. Exploring disaster resilience within the hotel sector: A systematic review of literature. Int. J. Disaster Risk Reduct. 2017, 22, 362–370. [Google Scholar] [CrossRef]
  48. Williams, A.M.; Baláž, V. Tourism, risk tolerance and competences: Travel organization and tourism hazards. Tour. Manag. 2013, 35, 209–221. [Google Scholar] [CrossRef]
  49. Weber, F. Natural Hazards: Increasing Challenges for Tourism Destinations; University of Bern: Bern, Switzerland, 2006; pp. 1–19. [Google Scholar]
  50. Soto, M.T.R.; Clavé, S.A. Second homes and urban landscape patterns in Mediterranean coastal tourism destinations. Land Use Policy 2017, 68, 117–132. [Google Scholar] [CrossRef]
  51. Brochado, A.; Troilo, M.; Shah, A. Airbnb customer experience: Evidence of convergence across three countries. Ann. Tour. Res. 2017, 63, 210–212. [Google Scholar] [CrossRef]
  52. Yang, C.L.; Nair, V. Risk Perception Study in Tourism: Are we Really Measuring Perceived Risk? Procedia -Soc. Behav. Sci. 2014, 144, 322–327. [Google Scholar] [CrossRef]
  53. Cui, F.; Liu, Y.; Chang, Y.; Duan, J.; Li, J. An overview of tourism risk perception. Nat. Hazards 2016, 82, 643–658. [Google Scholar] [CrossRef]
  54. Estrany, J.; Ruiz-Pérez, M.; Mutzner, R.; Fortesa, J.; Nácher-Rodríguez, B.; Tomàs-Burguera, M.; García-Comendador, J.; Peña, X.; Calvo-Cases, A.; Vallés-Morán, F.J. Hydrogeomorphological analysis and modelling for a comprehensive understanding of flash-flood damage processes: The 9 October 2018 event in northeastern Mallorca. Nat. Hazards Earth Syst. Sci. 2020, 20, 2195–2220. [Google Scholar] [CrossRef]
  55. Bahja, F.; Fu, X.X.; Alvarez, S. The evolution of vulnerability research in hospitality and tourism. Anatolia Int. J. Tour. Hosp. Res. 2022. [Google Scholar] [CrossRef]
  56. Ruiz-Pérez, M. Vulnerabilidad territorial frente a desastres naturales: El caso de la isla de Mallorca (Baleares, España). Geofocus Int. Rev. Geogr. Inf. Sci. Technol. 2012, 12, 16–52. [Google Scholar]
  57. Ruiz-Pérez, M.; Grimalt, M.G. Análisis De La Vulnerabilidad Social Frente a Desastres Naturales: El Caso De La Isla De Mallorca. Rev. Digit. Grup. Estud. Geogr. Análisis Espac. Sist. Inf. Geogr. 2012, 4, 1–26. [Google Scholar]
  58. Esteva, A.P. Evolució dels usos del sòl a les illes Balears. 1956–2000. Territoris 2003, 4, 129–145. [Google Scholar]
  59. Ahmouda, A.; Hochmair, H.H. Using Volunteered Geographic Information to measure name changes of artificial geographical features as a result of political changes: A Libya case study. GeoJournal 2018, 83, 237–255. [Google Scholar] [CrossRef]
  60. Kim, Y.; Kim, C.; Lee, D.K.; Lee, H.; Andrada, R.I.I.T. Quantifying nature-based tourism in protected areas in developing countries by using social big data. Tour. Manag. 2019, 72, 249–256. [Google Scholar] [CrossRef]
  61. Zhou, X.; Xu, C.; Kimmons, B. Detecting tourism destinations using scalable geospatial analysis based on cloud computing platform. Comput. Environ. Urban Syst. 2015, 54, 144–153. [Google Scholar] [CrossRef]
  62. Blázquez-Salom, M.; Canada, E.; Murray, I. Conflicts Generated by the Construction of Tourist Centres Financed with Transnational Spanish Capital in the Caribbean and Central America. Scr. Nova- Rev. Electron. Geogr. Cienc. Soc. 2011, 15, 1–17. [Google Scholar]
  63. Vives-Miró, S.; Rullan, O. Dispossession of housing for tourism? Revaluation and travel in the Historic Center of Palma (Mallorca). Rev. Geogr. Norte Gd. 2017, 67, 53–71. [Google Scholar] [CrossRef]
  64. Pérez, J.M.G.; Mantiñán, M.J.P. The unequal city in Palma (Majorca): Geography of confinement during the COVID-19 pandemic. Bol. Asoc. Geogr. Esp. 2020, 87. [Google Scholar]
  65. Data Space Support Centre. Data Space Suport Center. 2023. Available online: https://dssc.eu/ (accessed on 12 November 2023).
  66. EU. Tourism Data Space (DSFT). 2023. Available online: https://dsft.modul.ac.at/about/ (accessed on 7 November 2023).
  67. Weaver, A. Tourism, big data, and a crisis of analysis. Ann. Tour. Res. 2021, 88, 103158. [Google Scholar] [CrossRef]
  68. Hartmann, K.; Lederer, M. The Current State of Big Data Research in Tourism: Results of a Systematic Literature Analysis. Z. Tour. 2021, 13, 209–226. [Google Scholar] [CrossRef]
  69. Mountasser, I.; Ouhbi, B.; Frikh, B.; Hdioud, F. Big Data Research in the Tourism Industry: Requirements and Challenges. Int. J. Mob. Comput. Multimed. Commun. 2020, 11, 26–41. [Google Scholar] [CrossRef]
  70. Li, H.; Hu, M.; Li, G. Forecasting tourism demand with multisource big data. Ann. Tour. Res. 2020, 83, 102912. [Google Scholar] [CrossRef]
  71. Bi, J.-W.; Li, C.; Xu, H.; Li, H. Forecasting Daily Tourism Demand for Tourist Attractions with Big Data: An Ensemble Deep Learning Method. J. Travel Res. 2022, 61, 1719–1737. [Google Scholar] [CrossRef]
  72. Peng, T.; Chen, J.; Wang, C.; Cao, Y. A Forecast Model of Tourism Demand Driven by Social Network Data. IEEE Access 2021, 9, 109488–109496. [Google Scholar] [CrossRef]
  73. Li, Y.; Li, Y.; Li, J.; Ma, S.; Gao, P. Tourism demand forecasting from the perspective of mobility: A brand-new predictive variable generated from intercity population mobility big data. Asia Pac. J. Tour. Res. 2022, 27, 526–546. [Google Scholar] [CrossRef]
  74. Wen, L.; Liu, C.; Song, H. Forecasting tourism demand using search query data: A hybrid modelling approach. Tour. Econ. 2019, 25, 309–329. [Google Scholar] [CrossRef]
  75. Lamest, M.; Brady, M. Data-focused managerial challenges within the hotel sector. Tour. Rev. 2019, 74, 104–115. [Google Scholar] [CrossRef]
  76. Xie, D.; He, Y. Marketing Strategy of Rural Tourism Based on Big Data and Artificial Intelligence. Mob. Inf. Syst. 2022, 2022, 9154351. [Google Scholar] [CrossRef]
  77. Cuomo, M.T.; Tortora, D.; Foroudi, P.; Giordano, A.; Festa, G.; Metallo, G. Digital transformation and tourist experience co-design: Big social data for planning cultural tourism. Technol. Forecast. Soc. Change 2021, 162, 120345. [Google Scholar] [CrossRef]
  78. Ge, J. Research on Small Island Tourism Experience Perception Based on Big Data Analysis. J. Coast. Res. 2020, 115, 39–41. [Google Scholar] [CrossRef]
  79. Kaufmann, M.; Siegfried, P.; Huck, L.; Stettler, J. Analysis of Tourism Hotspot Behaviour Based on Geolocated Travel Blog Data: The Case of Qyer. ISPRS Int. J. Geo-Inf. 2019, 8, 493. [Google Scholar] [CrossRef]
  80. Paolanti, M.; Mancini, A.; Frontoni, E.; Felicetti, A.; Marinelli, L.; Marcheggiani, E.; Pierdicca, R. Tourism destination management using sentiment analysis and geo-location information: A deep learning approach. Inf. Technol. Tour. 2021, 23, 241–264. [Google Scholar] [CrossRef]
  81. Zhu, W.; Hou, Y.; Wang, E.; Wang, Y. Design of Geographic Information Visualization System for Marine Tourism Based on Data Mining. J. Coast. Res. 2020, 103, 1034–1037. [Google Scholar] [CrossRef]
  82. Immawan, T.; Pratiwi, A.I.; Cahyo, W.N. The Proposed Dashboard Model for Measuring Performance of Small-Medium Enterprises (SME). Int. J. Integr. Eng. 2019, 11, 167–173. [Google Scholar] [CrossRef]
  83. Brasovcanu, A.M.P.; Sabou, M.; Scharl, A.; Hubmann-Haidvogel, A.; Fischl, D. Visualizing statistical linked knowledge for decision support. Semant. Web 2017, 8, 113–137. [Google Scholar] [CrossRef]
  84. Lobao, F.; de Castro Neto, M.; Aparicio, M. Smart tourism—City tourism radar: A tourism monitoring tool at the city of Lisbon. In Proceedings of the Atas da Conferencia da Associacao Portuguesa de Sistemas de Informacao, Lisboa, Portugal, 11–12 October 2019. [Google Scholar]
  85. Young, G.W.; Kitchin, R. Creating design guidelines for building city dashboards from a user’s perspectives. Int. J. Hum. Comput. Stud. 2020, 140, 102429. [Google Scholar] [CrossRef]
  86. Chura, P.C.; Yanavilca, A.V.; Soria, J.J.; Castillo, S.V. Datamart of Business Intelligence for the Sales Area of a Peruvian Tourism Company. In Data Science and Algorithms in Systems, Proceedings of the 6th Conference on Computational Methods in Systems and Software (CoMeSySo) 2022, Vol. 2, Lima, Peru, 10–15 October 2022; Springer: Cham, Switzerland, 2023; Volume 597, pp. 415–429. [Google Scholar]
  87. Gonzalez-Martel, C.; Cazorla-Artiles, J.M. An Application of Open Data in Public Administrations: The Lanzarote Tourism Indicator Dashboard. In Marketing and Smart Technologies, Proceedings of the International Conference on Marketing and Technologies (ICMarkTech), Vol. 1, Tenerife, Spain, 1–3 December 2022; Springer: Cham, Switzerland, 2022; Volume 279, pp. 181–190. [Google Scholar]
  88. Park, S.-Y.; Jamieson, W. Developing a Tourism Destination Monitoring System: A Case of the Hawaii Tourism Dashboard. Asia Pac. J. Tour. Res. 2009, 14, 39–57. [Google Scholar] [CrossRef]
  89. Albusaidi, H.S.; Udupi, P.K.; Dattana, V. Integrated Data Analytic Tourism Dashboard (IDATD). In Proceedings of the 2016 5th International Conference on Reliability, Infocom Technologies and Optimization (Trends and Future Directions) (ICRITO), Amity University, Noida, India, 7–9 September 2016; pp. 497–500. [Google Scholar]
  90. Balletto, G.; Milesi, A.; Ladu, M.; Borruso, G. A Dashboard for Supporting Slow Tourism in Green Infrastructures. A Methodological Proposal in Sardinia (Italy). Sustainability 2020, 12, 3579. [Google Scholar] [CrossRef]
  91. Kirtil, I.G.; Askun, V. Artificial Intelligence in Tourism: A Review and Bibliometrics Research. Adv. Hosp. Tour. Res. 2021, 9, 205–233. [Google Scholar] [CrossRef]
  92. Vahidnia, M.H. Citizen participation through volunteered geographic information as equipment for a smart city to monitor urban decay. Environ. Monit. Assess. 2022, 195, 1–18. [Google Scholar] [CrossRef] [PubMed]
  93. Vorwerk, L.; Dietz, L.W. An interactive dashboard for traveler mobility analysis. In Proceedings of the CEUR Workshop Proceedings, Jerusalem, Israel, 12 March 2021; Volume 2855, pp. 13–15. [Google Scholar]
  94. Gallo, P.; Gallo, P.; Timková, V.; Šenková, A.; Karahuta, M. Use of dashboards in predicting the development of the company using neural networks in hotel management. Geoj. Tour. Geosites 2018, 22, 307–316. [Google Scholar]
  95. . Michele, P.; Fallucchi, F.; De Luca, E.W. Create Dashboards and Data Story with the Data & Analytics Frameworks. In Metadata and Semantic Research, MTSR 2019, Proceedings of the 13th International Conference on Metadata and Semantic Research, MTSR, Rome, Italy, 28–31 October 2019; Guglielmo Marconi University, DIII: Rome, Italy, 2019; Volume 1057, pp. 272–283. [Google Scholar]
  96. Kitchin, R.; Maalsen, S.; McArdle, G. The praxis and politics of building urban dashboards. Geoforum 2016, 77, 93–101. [Google Scholar] [CrossRef]
  97. McArdle, G.; Kitchin, R. The Dublin Dashboard: Design and Development of a Real-Time Analytical Urban Dashboard. ISPRS Ann. Photogramm. Remote Sens. Spat. Inf. Sci. 2016, 4, 19–25. [Google Scholar] [CrossRef]
  98. Van Gheluwe, C.; Semanjski, I.; Hendrikse, S.; Gautama, S. Geospatial Dashboards for Intelligent Multimodal Traffic Management. In Proceedings of the 2020 IEEE International Conference on Pervasive Computing and Communications Workshops (PerCom Workshops), Austin, TX, USA, 23–27 March 2020; pp. 11–13. [Google Scholar]
  99. Kaif, M.A.; Samaiya, S.; Purnima, R.A.; Sivasankar, T.; Roy, A.; Poojitha, A. Development of an interactive web-based geovisual analytics platform for analysing crime data. IEEE Symp. Wirel. Technol. Appl. ISWTA 2023, 2023, 158–162. [Google Scholar]
  100. Praharaj, S.; Wentz, E. Building Community Resilience Through Geospatial Information Dashboards. Int. Arch. Photogramm. Remote Sens. Spat. Inf. Sci. -ISPRS Arch. 2022, 48, 151–157. [Google Scholar] [CrossRef]
  101. Bernasconi, A.; Grandi, S. A conceptual model for geo-online exploratory data visualization: The case of the covid-19 pandemic. Inf. 2021, 12, 1–27. [Google Scholar] [CrossRef]
  102. Grandi, S.; Bernasconi, A. Geo-online explanatory data visualization tools as crisis management and communication instruments. In Proceedings of the 30th International Cartographic Conference (ICC), Florence, Italy, 14–18 December 2021; Volume 4. [Google Scholar]
  103. Grandi, S.; Bernasconi, A. Convergence of web design and spatial, statistical, genomic and epidemiological information: The case of geo-dashboards in the Covid-19 crisis. Doc. Geogr. 2020, 1, 463–476. [Google Scholar]
  104. Ruda, A. Spatial decision support using data geo-visualization: The example of the conflict between landscape protection and tourism development. J. Maps 2016, 12, 1262–1267. [Google Scholar] [CrossRef]
  105. Islam, M.T.; Islam, M.R.; Akter, S.; Kawser, M. Designing Dashboard for Exploring Tourist Hotspots in Bangladesh. In Proceedings of the 2020 23rd International Conference on Computer and Information Technology (ICCIT), Dhaka, Bangladesh, 19–21 December 2020. [Google Scholar]
  106. Zuo, C.; Ding, L.; Meng, L. A feasibility study of map-based dashboard for spatiotemporal knowledge acquisition and analysis. ISPRS Int. J. Geo-Inf. 2020, 9, 1–28. [Google Scholar] [CrossRef]
  107. Wickramasuriya, R.; Ma, J.; Berryman, M.; Perez, P. Using geospatial business intelligence to support regional infrastructure governance. Knowl.-Based Syst. 2013, 53, 80–89. [Google Scholar] [CrossRef]
  108. Jonietz, D.; Antonio, V.; See, L.; Zipf, A. Highlighting current trends in volunteered geographic information. ISPRS Int. J. Geo-Inf. 2017, 6, 202. [Google Scholar] [CrossRef]
  109. Cayere, C.; Faucher, C.; Sallaberry, C.; Bessagnet, M.-N.; Roose, P. Tools for processing digital trajectories of tourists. In Proceedings of the 2020 21st IEEE International Conference on Mobile Data Management (MDM), Versailles, France, 30 June–3 July 2020; pp. 232–233. [Google Scholar]
  110. Jing, C.; Du, M.; Li, S.; Liu, S. Geospatial dashboards for monitoring smart city performance. Sustainability 2019, 11, 5648. [Google Scholar] [CrossRef]
  111. Merino-Saum, A.; Jemio, P.A.R.; Hansmann, R.; Binder, C.R. Drivers and barriers to participation in the sharing economy: Does the environment really matter? A systematic review of 175 scientific articles. Resour. Conserv. Recycl. 2023, 198, 107121. [Google Scholar] [CrossRef]
  112. Oskam, J.; Boswijk, A. Airbnb: The future of networked hospitality businesses. J. Tour. Futur. 2016, 2, 22–42. [Google Scholar] [CrossRef]
  113. Koh, E.; King, B. Accommodating the sharing revolution: A qualitative evaluation of the impact of Airbnb on Singapore’s budget hotels. Tour. Recreat. Res. 2017, 42, 409–421. [Google Scholar] [CrossRef]
  114. Groizard, J.L.; Nilsson, W. Mito y realidad del alquiler vacacional en las Islas Baleares. Análisis y recomendaciones de política turística. DEA Work. Pap. Ser. 2017, 84, 26. [Google Scholar]
  115. Zervas, G.; Proserpio, D.; Byers, J. A First Look at Online Reputation on Airbnb, Where Every Stay is Above Average. Mark. Lett. 2020, 32, 1–16. [Google Scholar] [CrossRef]
  116. Gurran, N.; Phibbs, P. When Tourists Move In: How Should Urban Planners Respond to Airbnb? J. Am. Plan. Assoc. 2017, 83, 80–92. [Google Scholar] [CrossRef]
  117. European Environment Agency; Ministerio de Medio Ambiente Y Medio Rural Y Marino. Metodología de Producción de la Base de Datos CLC-Change 2000–2006; European Environment Agency: Copenhagen, Denmark, 2010; pp. 1–30. [Google Scholar]
  118. Janes, A.; Sillitti, A.; Succi, G. Effective dashboard design. Cut. IT J. 2013, 26, 17–24. [Google Scholar]
Figure 1. Location map of Mallorca [A] in the Mediterranean Sea.
Smartcities 07 00026 g001
Figure 2. Geo-dashboards in the smart tourism destination and tourism data spaces framework.
Smartcities 07 00026 g002
Figure 3. Development phases.
Smartcities 07 00026 g003
Figure 4. The general interface of the geo-dashboard: floods exposition of tourist accommodation. Accessible at URL: https://cartouib.maps.arcgis.com/apps/dashboards/83368c3457dc4a619728688e92dda594 (accessed on 15 November 2023).
Smartcities 07 00026 g004
Figure 5. Land-cover changes from the Corine Land Cover (1990–2018) geo-dashboard. https://cartouib.maps.arcgis.com/apps/dashboards/29ba3854dd46434d9408d3df18e1f57d (accessed on 15 November 2023).
Smartcities 07 00026 g005
Figure 6. Human pressure geo-dashboard. https://cartouib.maps.arcgis.com/apps/dashboards/2bfcbdc474ff46d69f661866cf5802d6 (accessed on 15 November 2023).
Smartcities 07 00026 g006
Figure 7. Human pressure geo-dashboard. https://cartouib.maps.arcgis.com/apps/dashboards/cb0f4f42980648e2b784be96542245b2 (accessed on 15 November 2023).
Smartcities 07 00026 g007
Table 1. Objective and type of information of some geo-dashboards.
ReferencesObjectiveInformation Included in the Panels
[92]Urban decay analysisUrban data, cultural heritage, municipal (pavement, contaminated land, abandoned buildings)
[93]Traveler mobility analysisTweets, users
[94]Predicting development of a companyFinancial, organizational, and non-financial
[95]Sardegna touristic movementsTourist movements
[84]Lisbon tourism monitoring Accommodation, expenditures, travel, satisfaction, visits
[96,97]Dublin urban dashboardReal-time information (air quality, hydrometric, river levels, traffic, etc.), non-real-time (employment, households, students, crime, etc.)
[98]Traffic managementBicycle services, parking garages, travel times, traffic incidents, public transports, traffic, etc.
[99]Crime analysisNational crime records specifically focusing on crimes against women
[100]Social resilienceEmployment, jobs, healthcare, income, etc.
[101]EpidemiologyCOVID-19 cases, infected, viral sequences.
Table 2. Sources of information from the geo-dashboard based on exposure to flood hazards.
Geo-DashboardSource of DataFormatLink
Flood tourism expositionAirbnb location of holiday homes CSVhttp://insideairbnb.com/get-the-data
(accessed on 15 November 2023)
Regulated tourist accommodationShapeGovern de les Illes Balears. Open data catalogue
https://www.caib.es/sites/opendatacaib/ca/inici_home/?campa=yes
(accessed on 15 November 2023)
National Floodplain Mapping System
Recurrence periods of 500, 100, 10 years
ShapeMinistry for Ecological Transition and the Demographic Challenge
Flood Risk Management
https://www.miteco.gob.es/es/agua/temas/gestion-de-los-riesgos-de-inundacion/snczi.html
(accessed on 15 November 2023)
Table 3. Geo-dashboard data sources: land-cover changes.
Geo-DashboardSource of DataFormatLink
Land-Cover ChangesCorine Land Cover 1990, 2000, 2006, 2006, 2012, 2018GeodatabaseLand Monitoring Services. Copernicus. EU
https://land.copernicus.eu/en/products/corine-land-cover
(accessed on 15 November 2023)
Municipal division ShapeAutonomous Organization National Centre for Geographic Information
National Geographic Institute
Ministry of Transport Mobility and Urban Agenda
Table 4. Dashboard interface analysis: territorial pressure.
Geo-DashboardSource of DataFormatLink
People PressureFlickr photos 2015–2019. Metadata with geographical coordinatesCSVFlickr API
https://www.flickr.com/services/api/
(accessed on 15 November 2023)
Census sections IGNShapeNational Statistical Institute
http://www.ine.es
(accessed on 15 November 2023)
Corine Land Cover 2018GeodatabaseLand Monitoring Services. Copernicus. EU
https://land.copernicus.eu/en/products/corine-land-cover
(accessed on 15 November 2023)
Table 5. Dashboard interface analysis: tourist activities at urban spaces.
Geo-DashboardSource of DataFormatLink
Urban Touristic Land UsesUrban Cadastral CartographyShapeElectronic Headquarters of the Cadastre
Ministry of Finance and the Civil Service
https://www.sedecatastro.gob.es/
(accessed on 15 November 2023)
Census sections IGNShapeNational Statistical Institute
http://www.ine.es
(accessed on 15 November 2023)
Demographic data
Income data
ExcelNational Statistical Institute
http://www.ine.es
(accessed on 15 November 2023)
Table 6. Dashboard interface analysis: floods exposition of tourist accommodation.
Smartcities 07 00026 i001
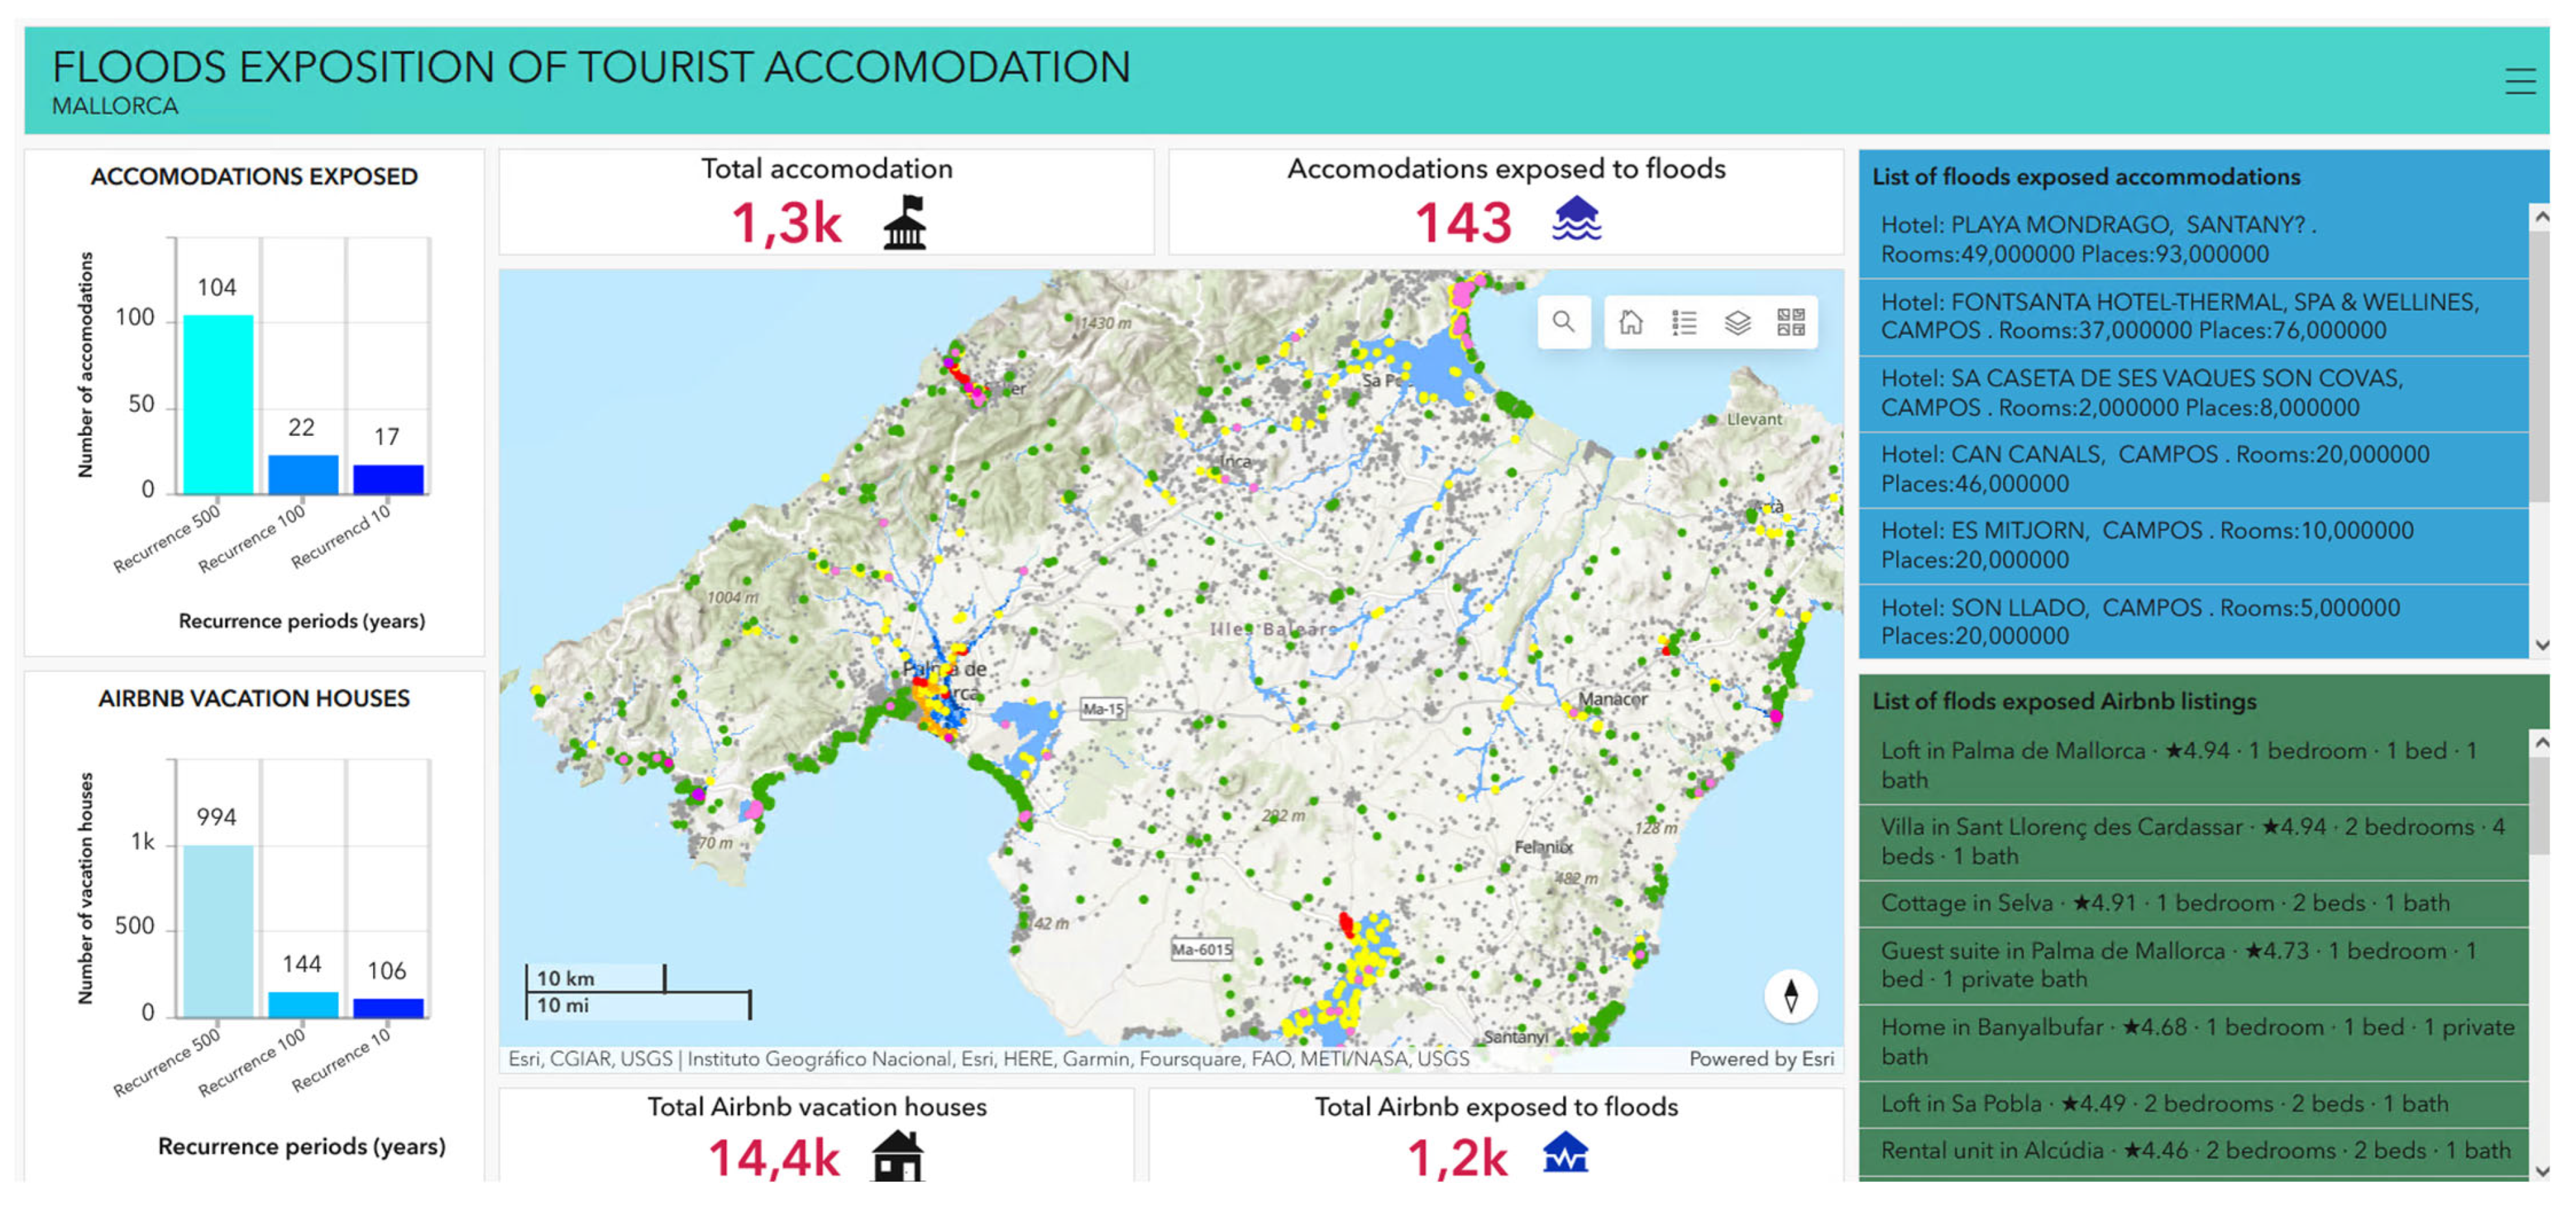
The left column includes two graphs. The first (top left) represents the number of regulated tourist accommodations by 10, 100, and 500-year recurrence flood hazard zones. The second graph (bottom left) shows the number of holiday homes by flood zones.
Smartcities 07 00026 i002The central column shows the interactive map with a legend showing flood zones by return period (polygons), tourist accommodation (dots), and holiday homes published on Airbnb. At the top of the map is an indicator of the total count of accommodations visible on the map and the total number of accommodations exposed to flooding. At the bottom, two counters are displayed, in this case, to show the total number of Airbnb vacation rentals visible on the map and a total number of vacation rentals exposed to flood hazards.
Smartcities 07 00026 i003The right-hand column provides detailed information on each of the accommodations exposed to flood hazards (top window) and the exposed holiday homes (bottom window).
Table 7. Dashboard interface analysis: land-cover changes 1990–2018.
Smartcities 07 00026 i004
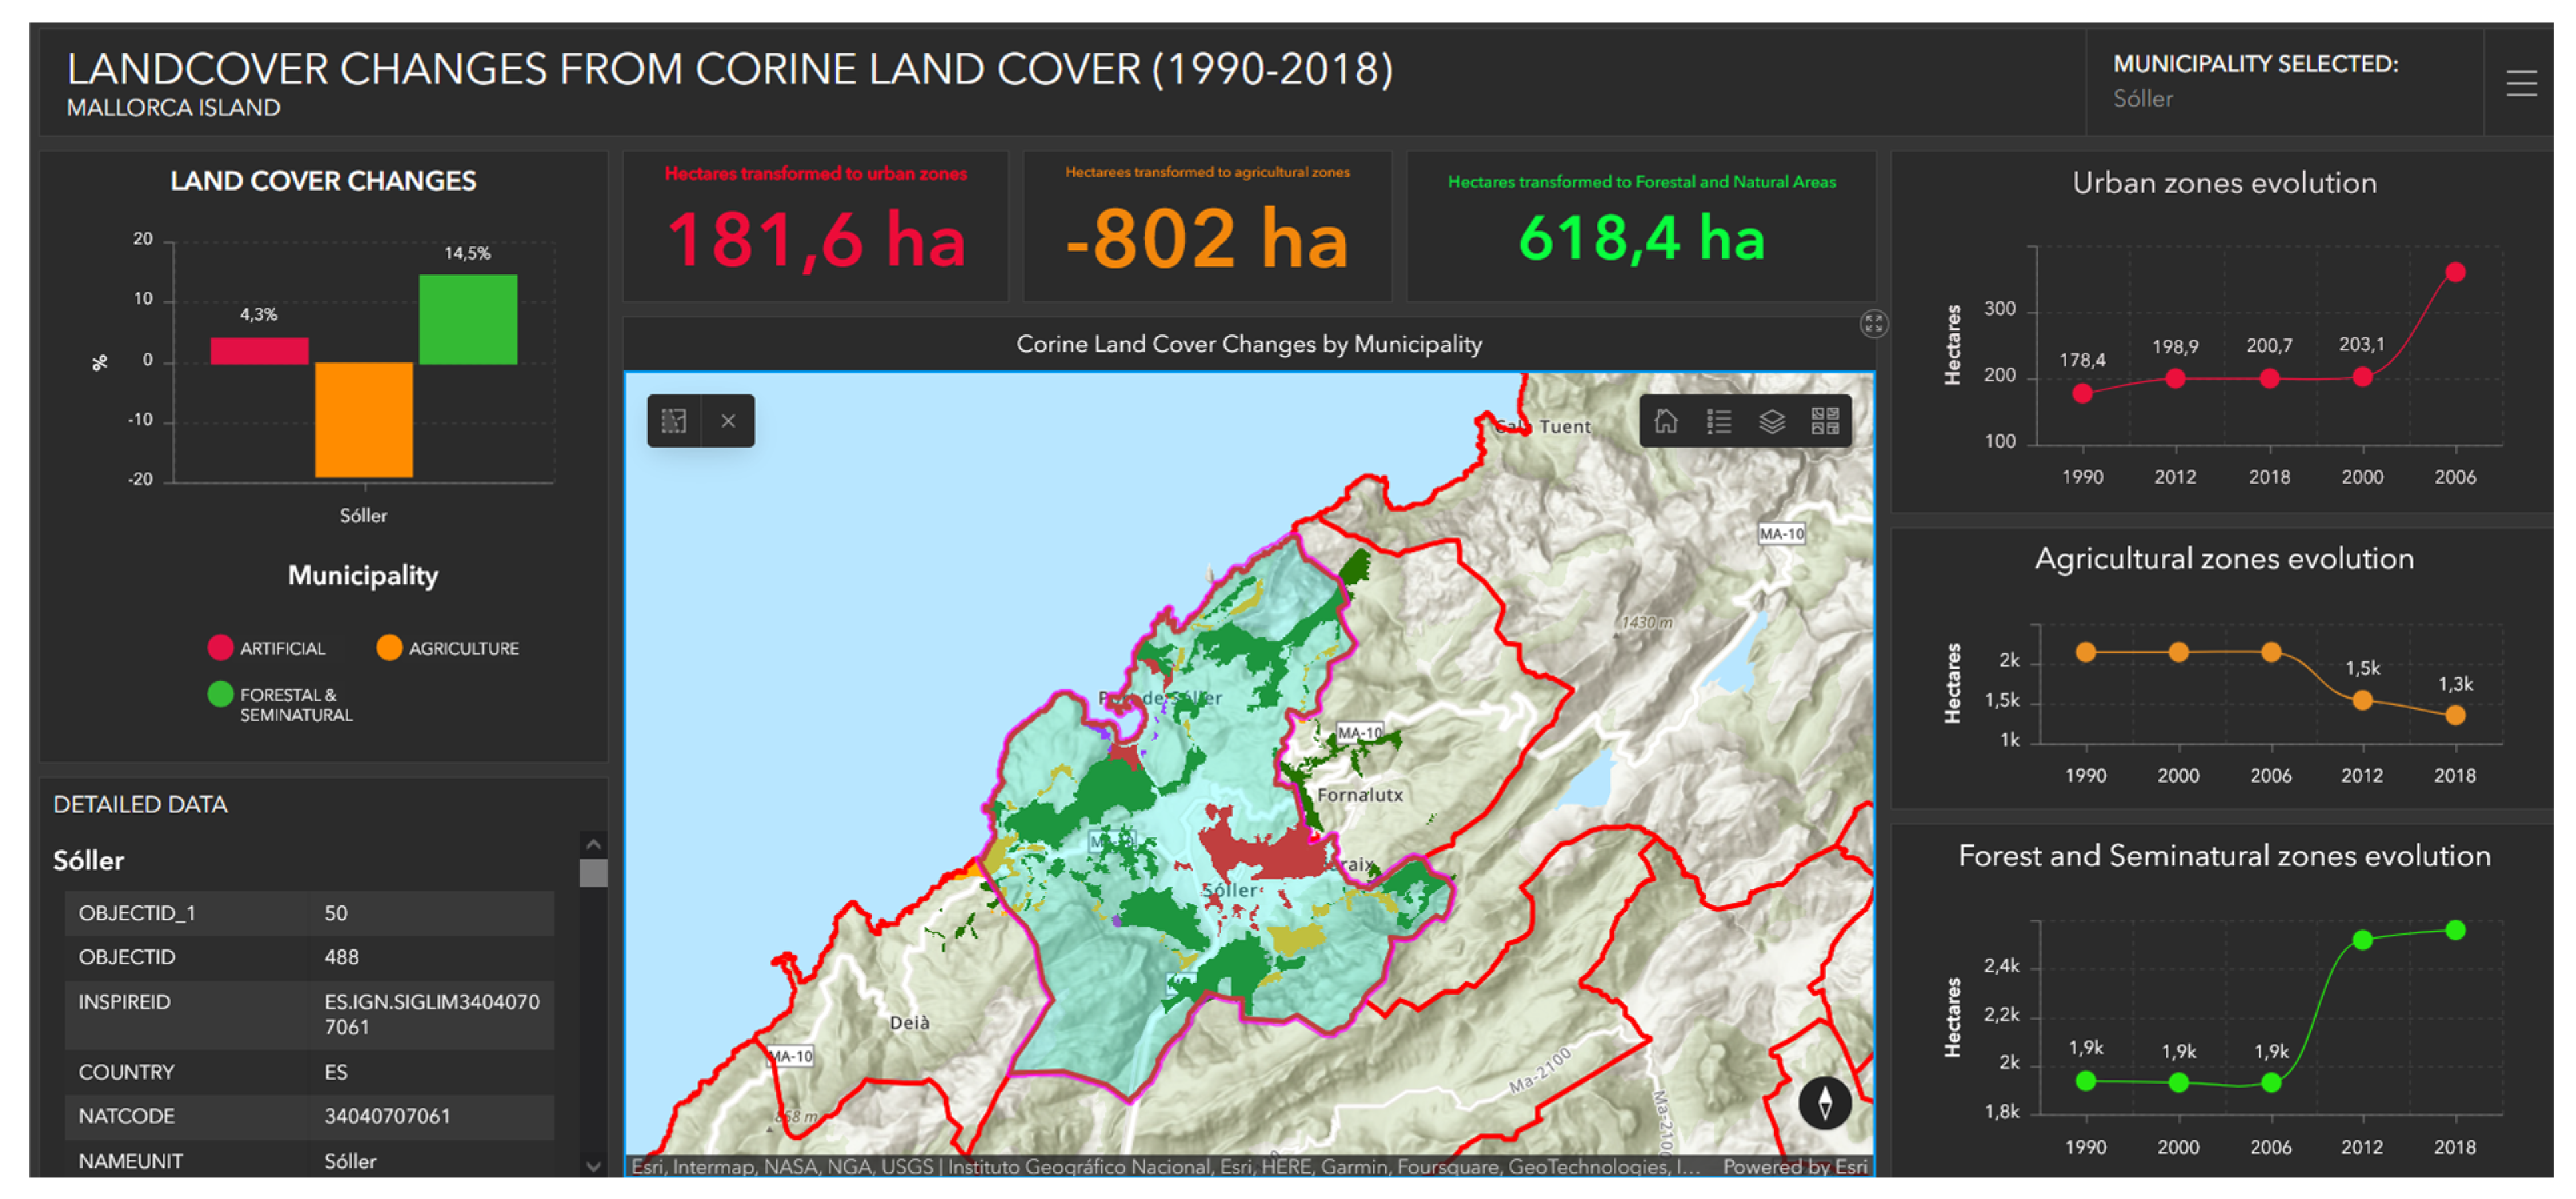
The left column includes a summary graph showing the changes in the selected municipality in relation to the increase in urban areas (red), agricultural areas (orange), and forest–semi-natural areas (green). The results are presented as a percentage of the municipal total.
The attached example shows the land-cover dynamics for the municipality of Sóller from 1990 to 2000. It shows an increase of 4.3% in artificial surfaces, a decrease of 18.8% in agricultural areas, and an increase of 14.5% in forest areas.
The information provided makes it possible to identify each municipality’s dynamics and assess the degree of human pressure in each geographical area.
Smartcities 07 00026 i005In the central column is the interactive map whose legend shows the land-use change coverages in the selected municipality.
At the top of the map are three indicators of the number of hectares converted to artificial, agricultural, and forest areas in the selected municipality for the period 1990–2018.
In this case, the municipality of Sóller experiences a clear increase in urbanized areas (181.5 ha), a decrease in agricultural areas (−802 ha), and an increase in natural areas (618.4 ha).
Smartcities 07 00026 i006The right-hand column provides detailed information on land-cover dynamics from 1990 to 2018.
For each type of cover (urban, agricultural, and forestry), the number of hectares they occupied for each of the years analyzed is observed. In this way, in the case of the municipality of Sóller, a significant increase in urbanized and forested areas can be seen, while the agricultural areas experience a notable recession.
The graph is interactive to be resized to fit the display and provide more detail in the analysis.
Table 8. Analysis of dashboard interface: human pressure.
Smartcities 07 00026 i007
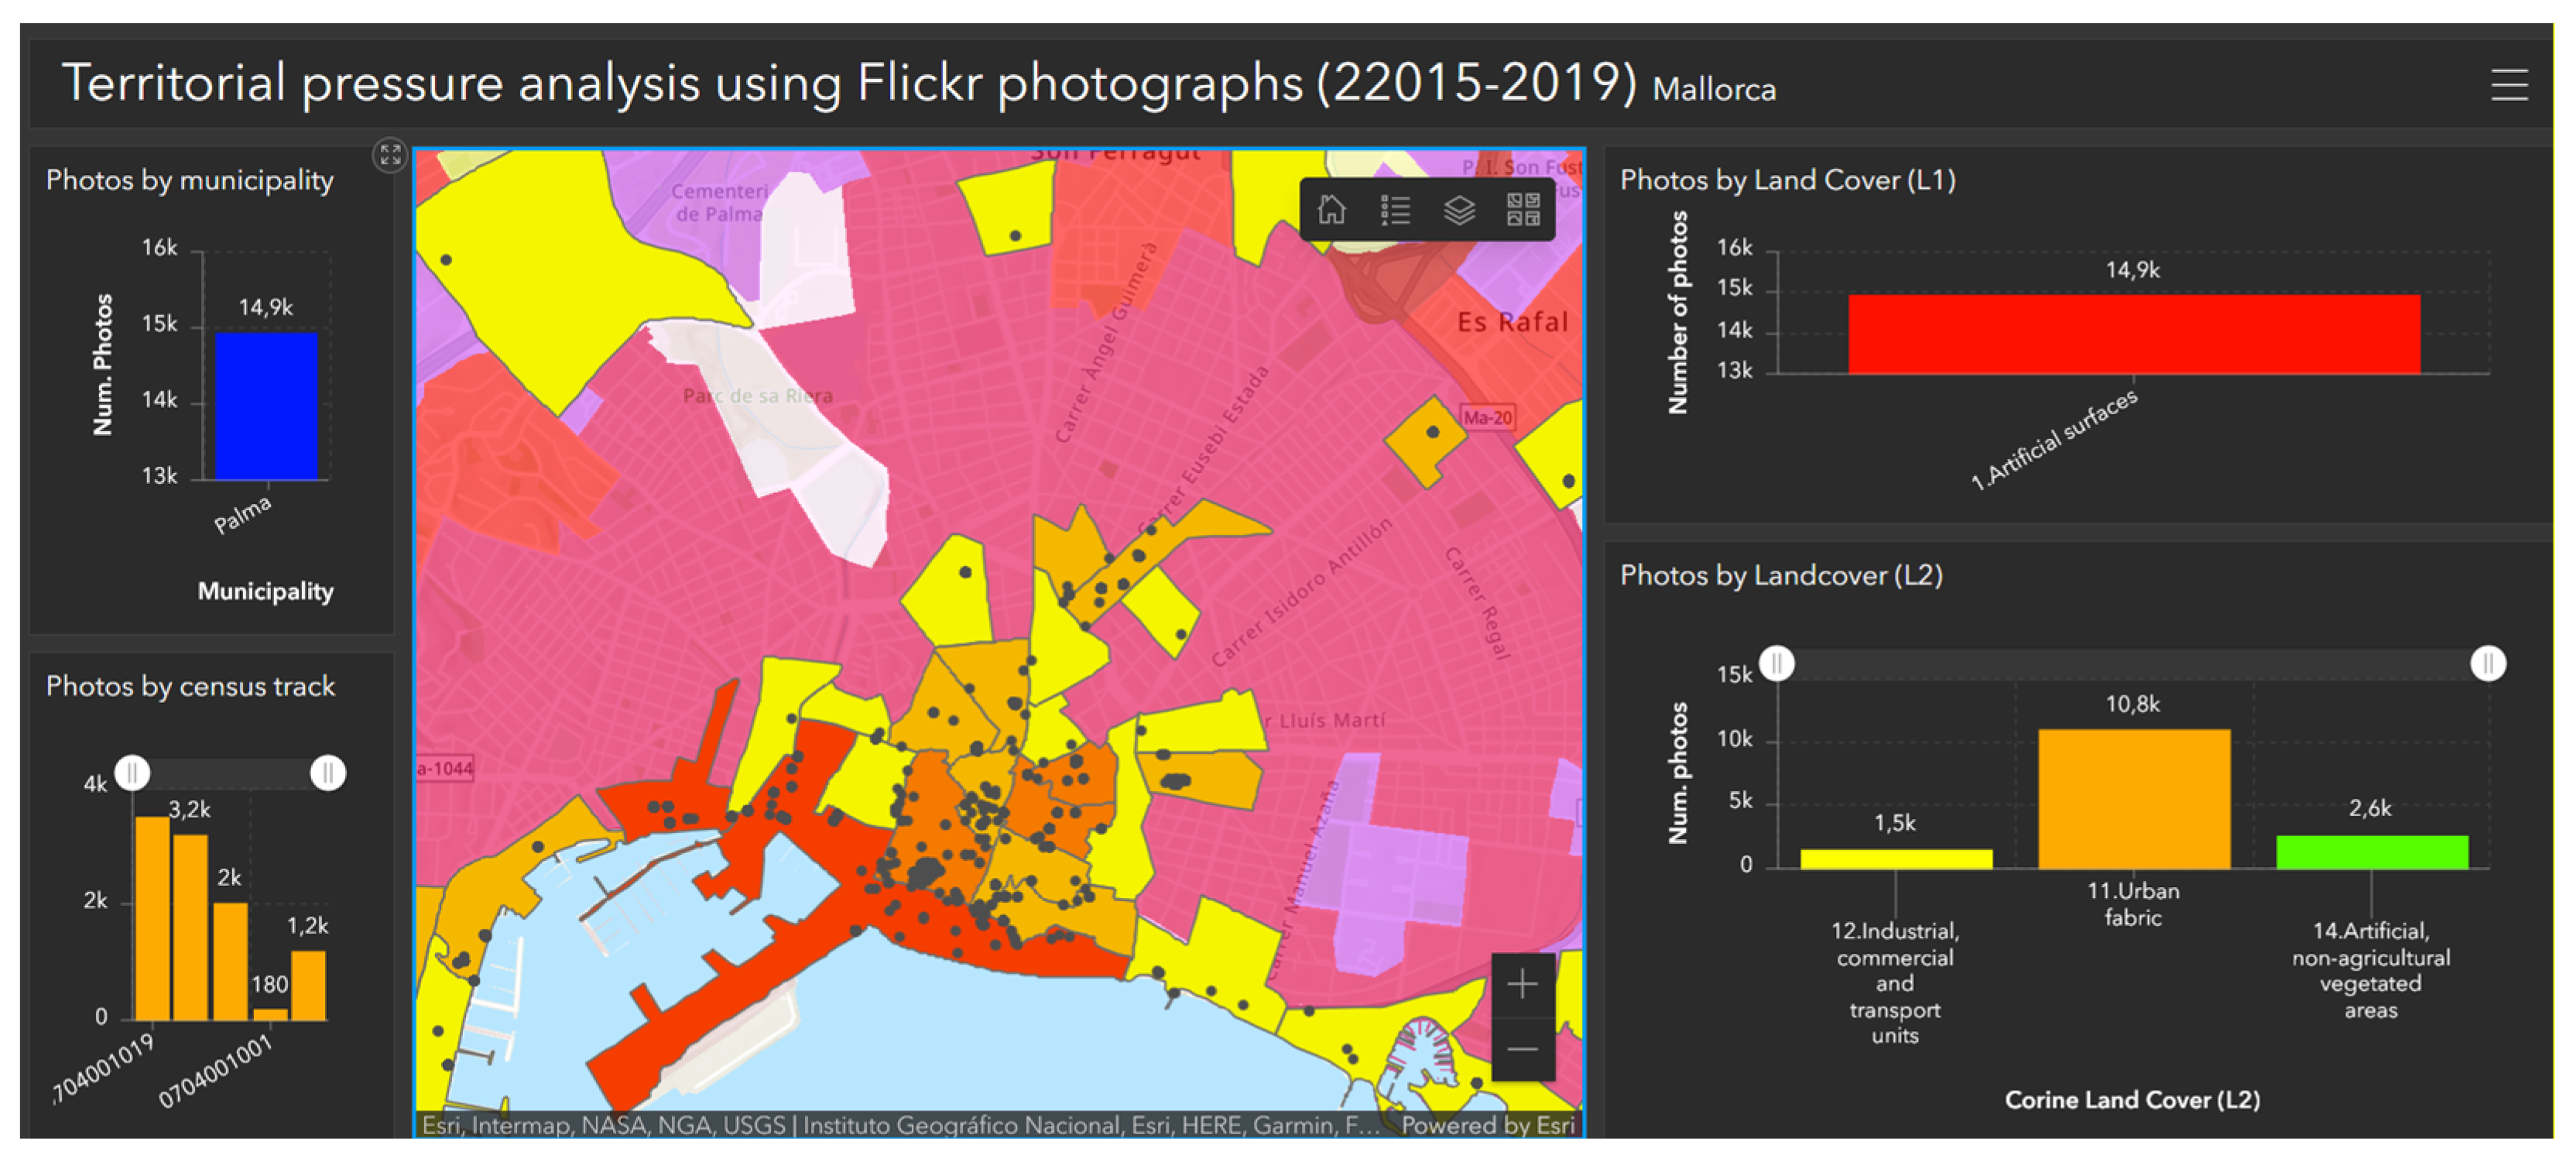
The left column includes two graphs. The first (top left) shows the number of photos per municipality. The second graph presents the number of pictures per census section. This allows an assessment of human pressure by geographical entity. It is possible to identify the municipalities with the highest pressure and, within these, the census tracts with the highest potential influx of people.
Smartcities 07 00026 i008A choropleth map represents the total number of photos per census tract. Its interpretation provides a first approximation of the human pressure per area. It must be recognized that this human pressure would because, in principle, also be an indicator of tourist pressure because the resident population, in general, tends to take few photographs of their surroundings and upload them to the Flickr platform.
Smartcities 07 00026 i009
Smartcities 07 00026 i010
The right-hand column incorporates two graphs showing the land covers of the sites where the photographs have been taken. The upper graph shows the number of photos by land cover using the Corine Land Cover level I categories. In the lower chart, the Corine Land Cover level II categories are used.
These graphs allow us to identify which type of land use has the highest level of anthropogenic pressure based on the published Flickr photographs.
Table 9. Dashboard interface analysis: human pressure.
Smartcities 07 00026 i011
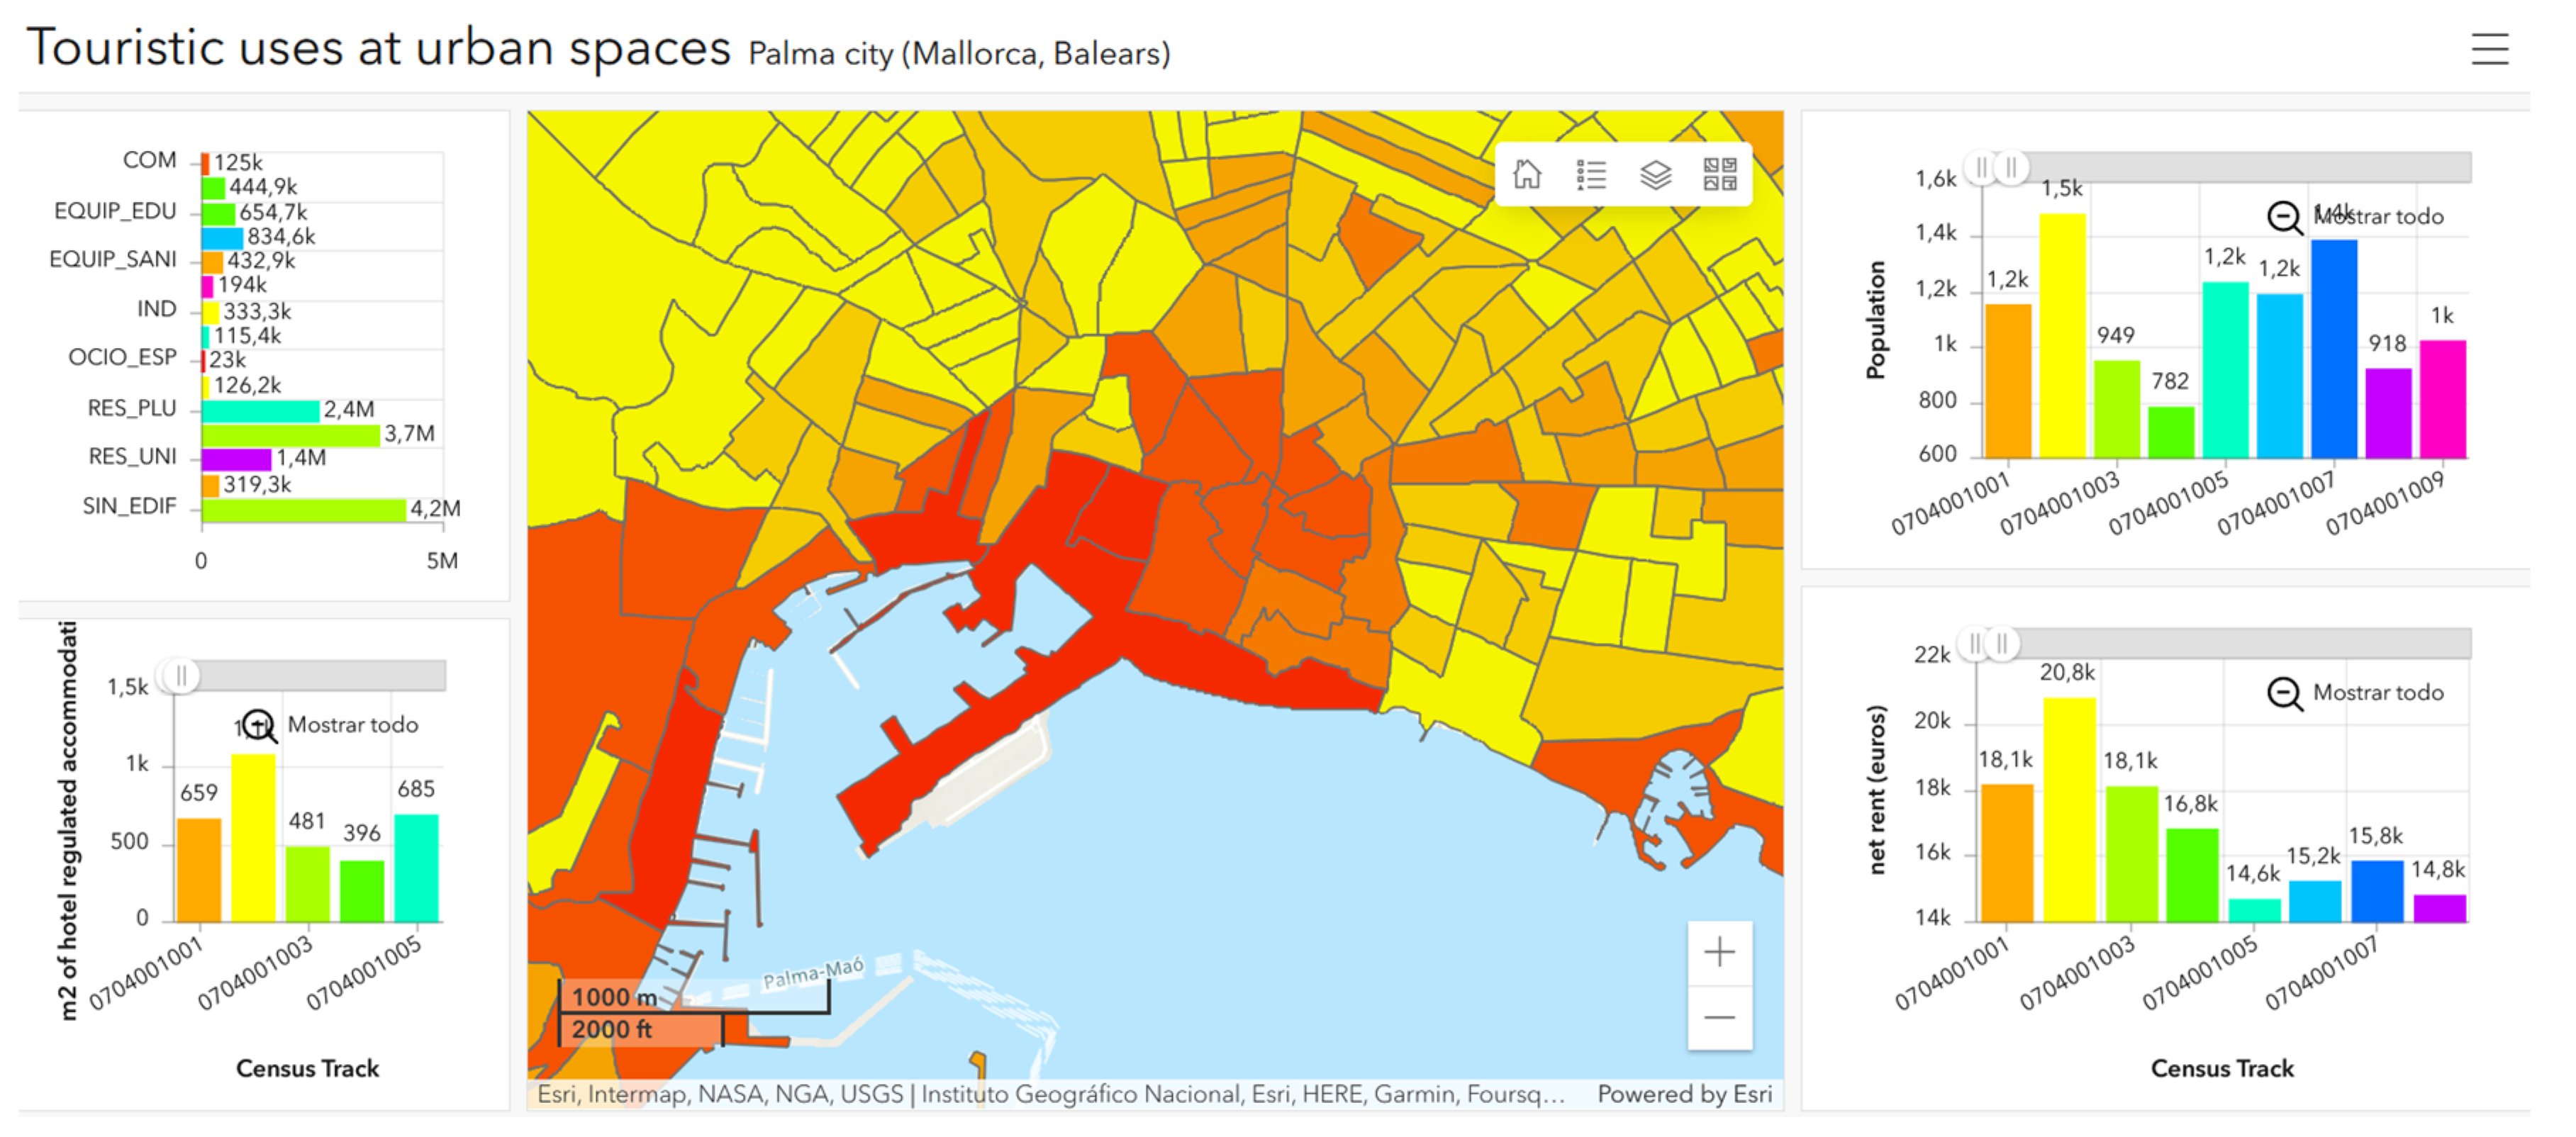
The left column includes two graphs. The first one (top left) presents information on the distribution of urban uses of the map visible and active on the dashboard. The uses correspond to the classification made by the cadastral cartography. These include residential uses as well as hotels and restaurants.
The graph (bottom left) shows the number of m2 of tourism uses per census tract visible on the active map.
Smartcities 07 00026 i012A choropleth map representing the area of hotels and restaurants used by the census tract is presented.
It can be seen that the coastal areas next to the city’s historic center concentrate tourist uses in the city of Palma. It is significant to note the absence of tourist uses in the urban periphery of the city.
In addition, the dashboard makes it possible to activate a layer of urban uses of the city of Palma extracted from the cadastral cartography.
The maximum occupancy uses for each of the cadastral plots are shown.
Smartcities 07 00026 i013
Smartcities 07 00026 i014
The right-hand column incorporates two graphs showing, on the one hand, the resident population in each census tract and, on the other hand, the net income of the resident population in each census tract.
In this way, it is possible to simultaneously have tourist, demographic, and economic information available for each of the census sections of the municipality of Palma.
Disclaimer/Publisher’s Note: The statements, opinions and data contained in all publications are solely those of the individual author(s) and contributor(s) and not of MDPI and/or the editor(s). MDPI and/or the editor(s) disclaim responsibility for any injury to people or property resulting from any ideas, methods, instructions or products referred to in the content.

