

The Effect of Jittered Stimulus Onset Interval on Electrophysiological Markers of Attention in a Brain–Computer Interface Rapid Serial Visual Presentation Paradigm
 , and
on behalf of the Consortium for Accessible Multimodal Brain-Body Interfaces (CAMBI)
, and
on behalf of the Consortium for Accessible Multimodal Brain-Body Interfaces (CAMBI)
Abstract
:1. Introduction
1.1. Rapid Serial Visual Presentation (RSVP)
1.2. Problems with Overlapping Adjacent Brain Responses
1.3. Stimulus Onset Interval “Jitter”
1.4. Aims and Hypotheses
2. Materials and Methods
2.1. Participants: Recruitment and Screening
2.2. Procedure
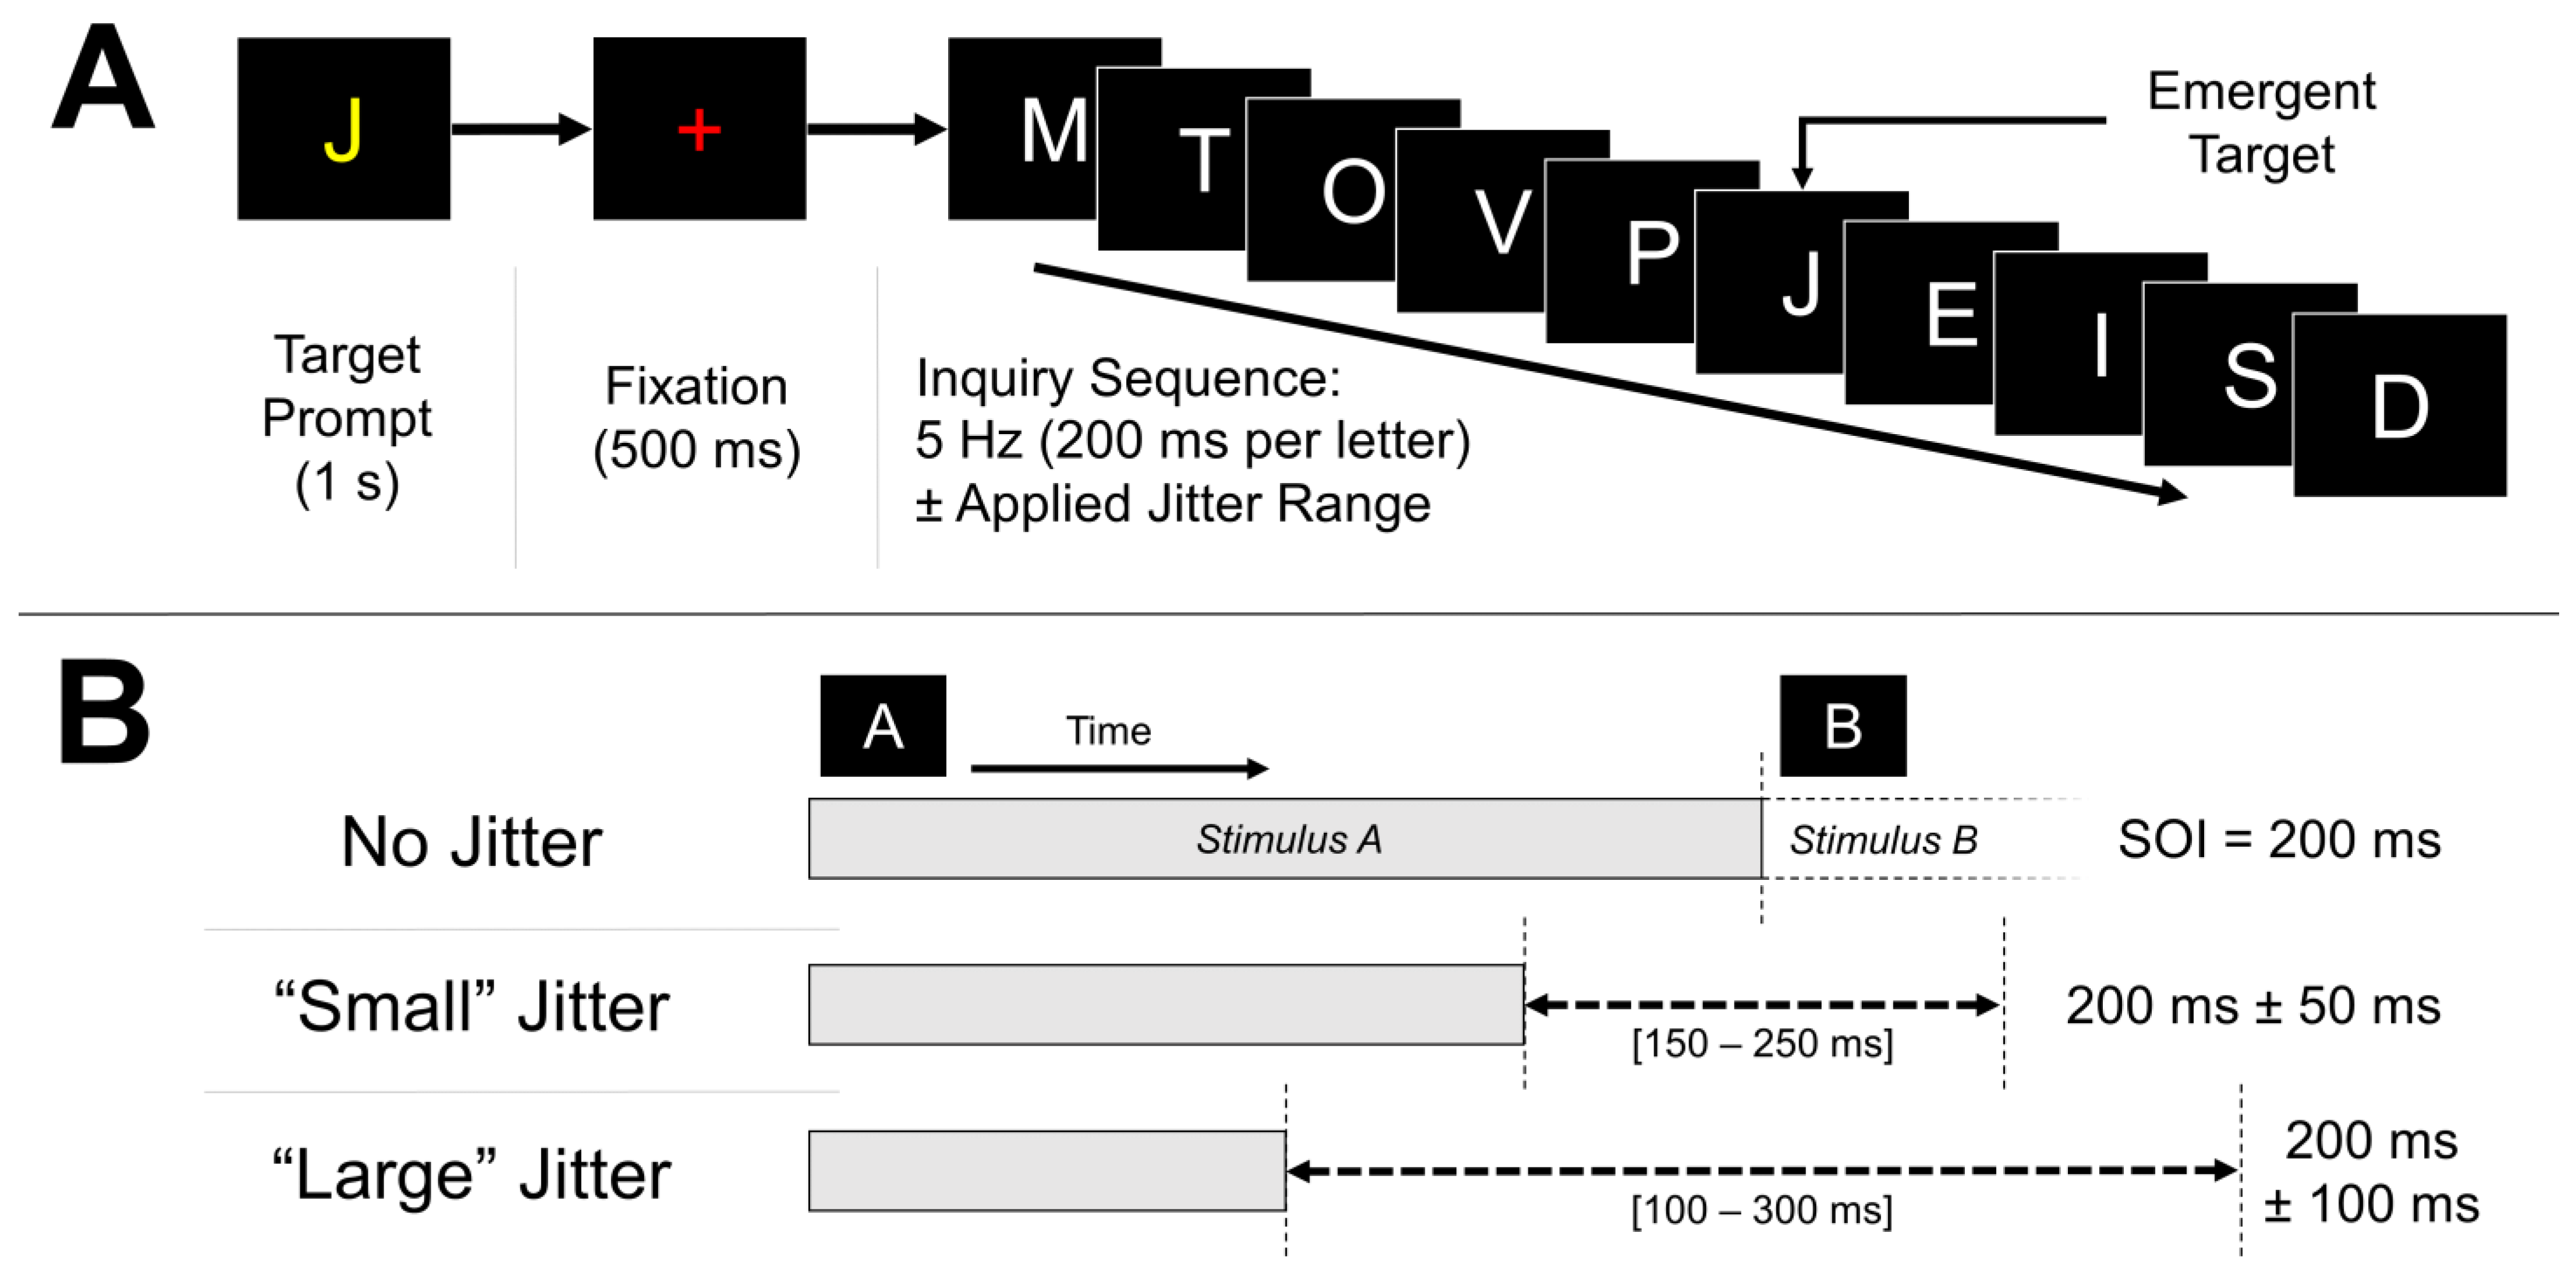
2.3. RSVP Task
2.3.1. RSVP Task: Practice
2.3.2. RSVP Task: Calibration
2.3.3. RSVP Task: Copy Phrase
2.4. Stimuli
2.5. Electrophysiological Recordings
2.6. Electrophysiological Processing
2.6.1. ERP Analyses
2.6.2. Time–Frequency Analyses
2.6.3. Artifact Rejection
2.7. BCI Classifiers
2.7.1. BCI Classifiers: ERP Data
2.7.2. BCI Classifiers: Alpha Data
2.8. Statistical Analyses
3. Results
3.1. ERP Analyses
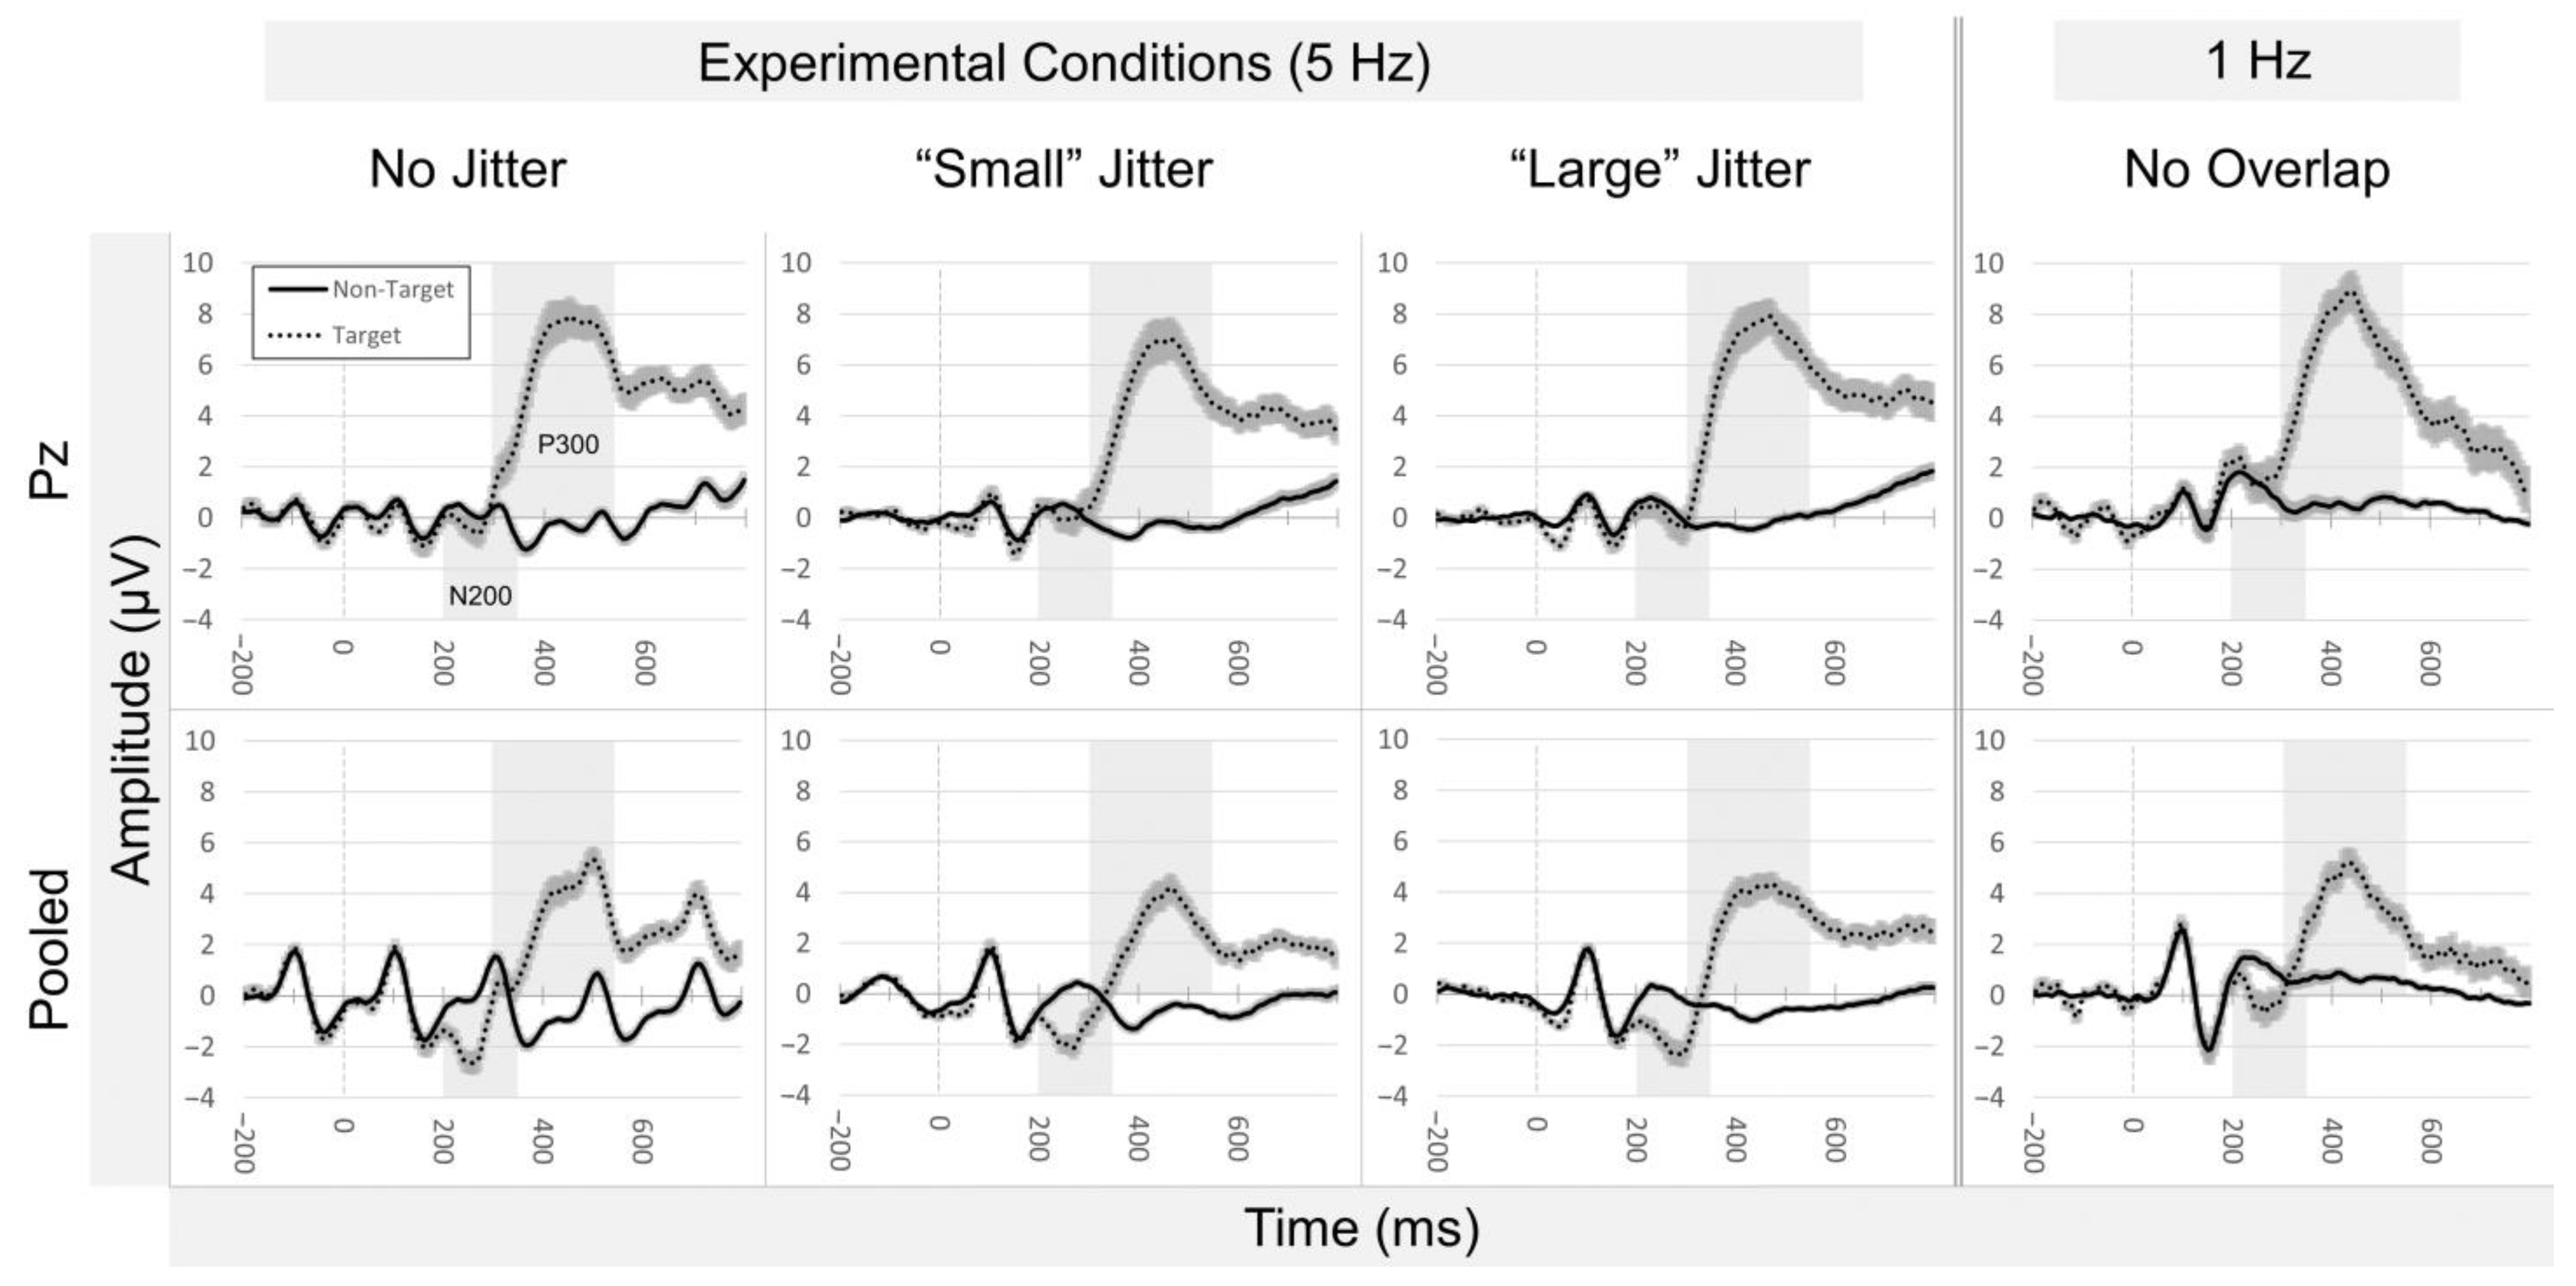
3.1.1. ERP Analyses: N200
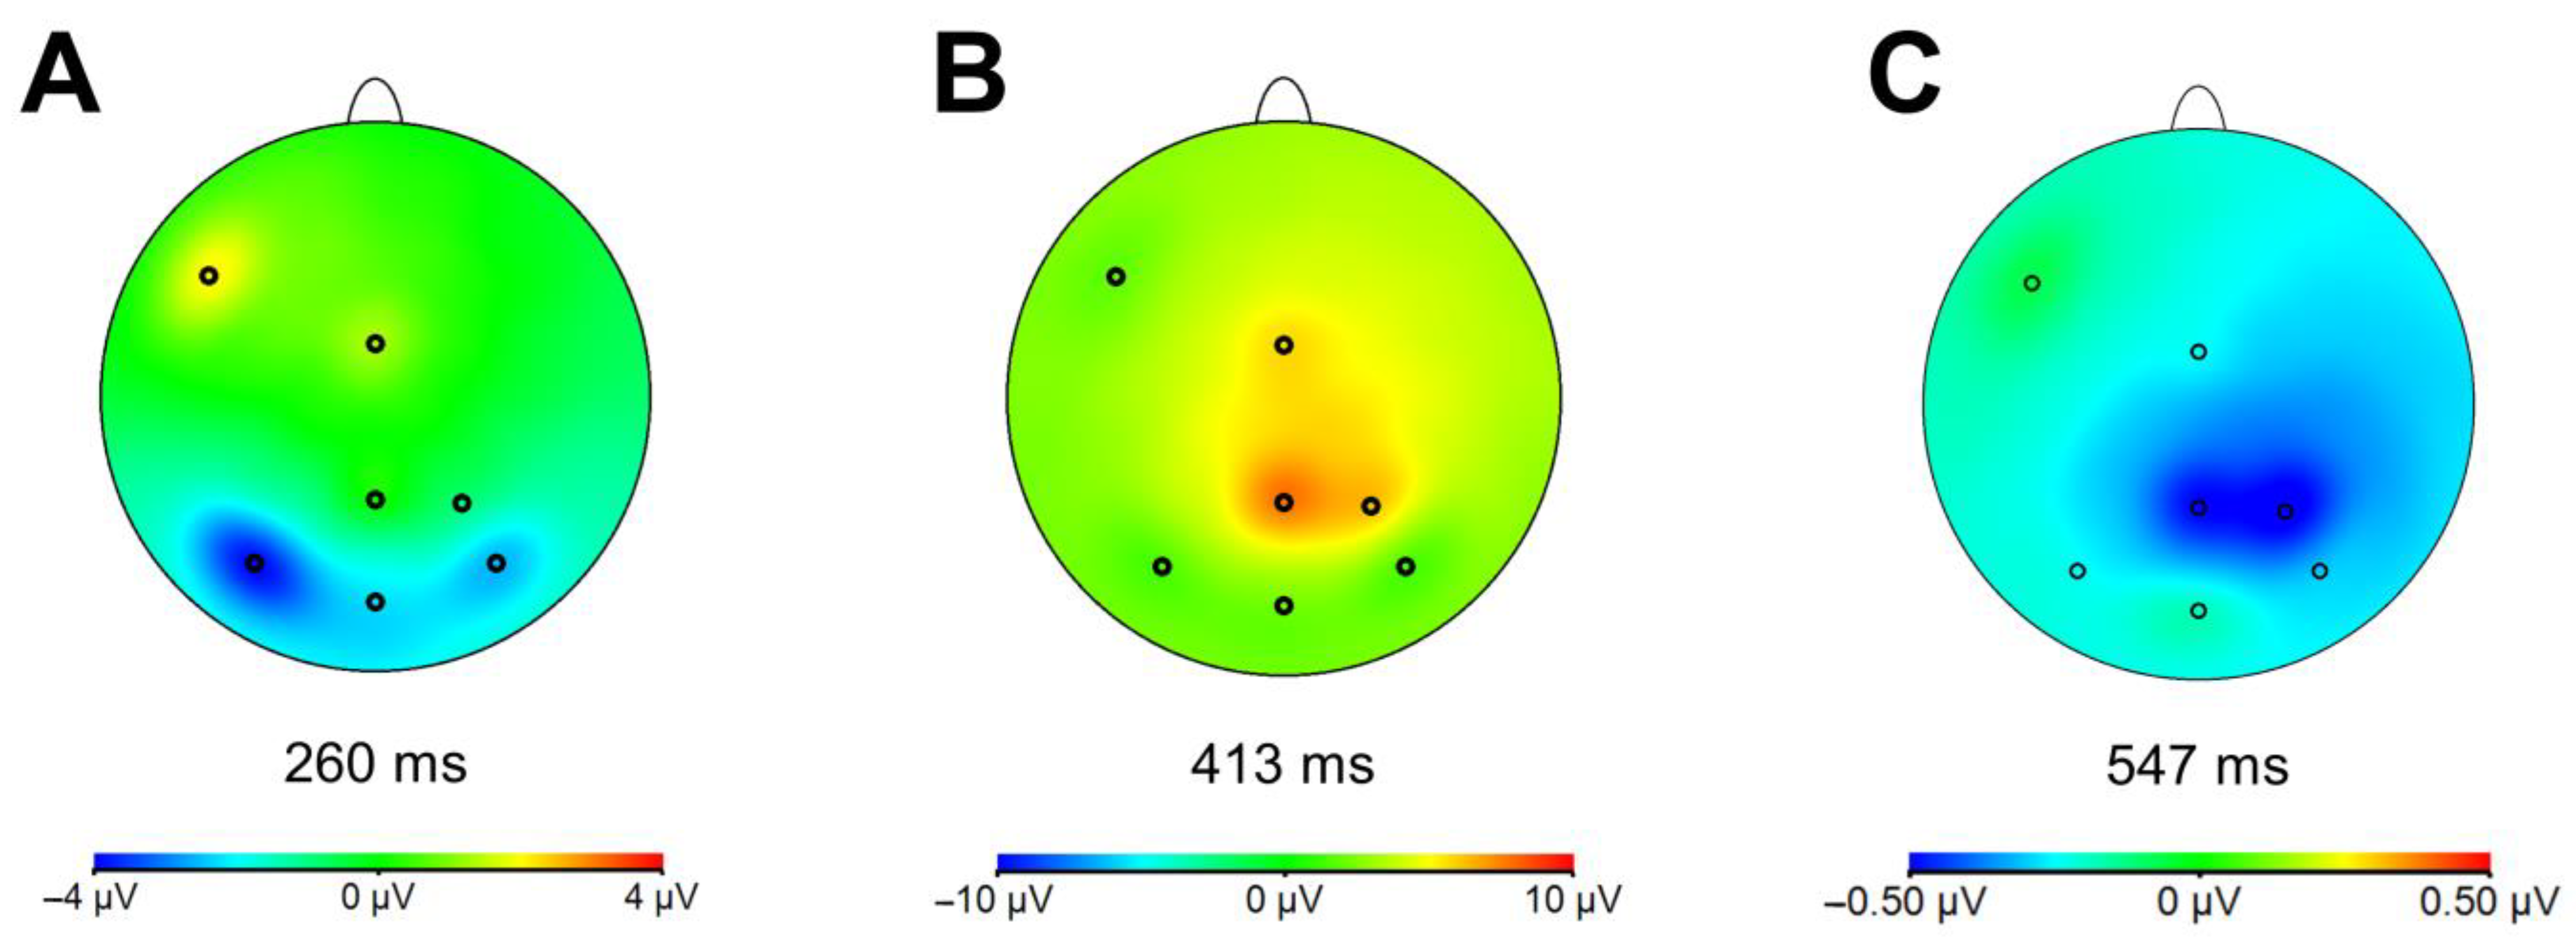
3.1.2. ERP Analyses: P300
3.1.3. ERP Analyses: Signal Variance
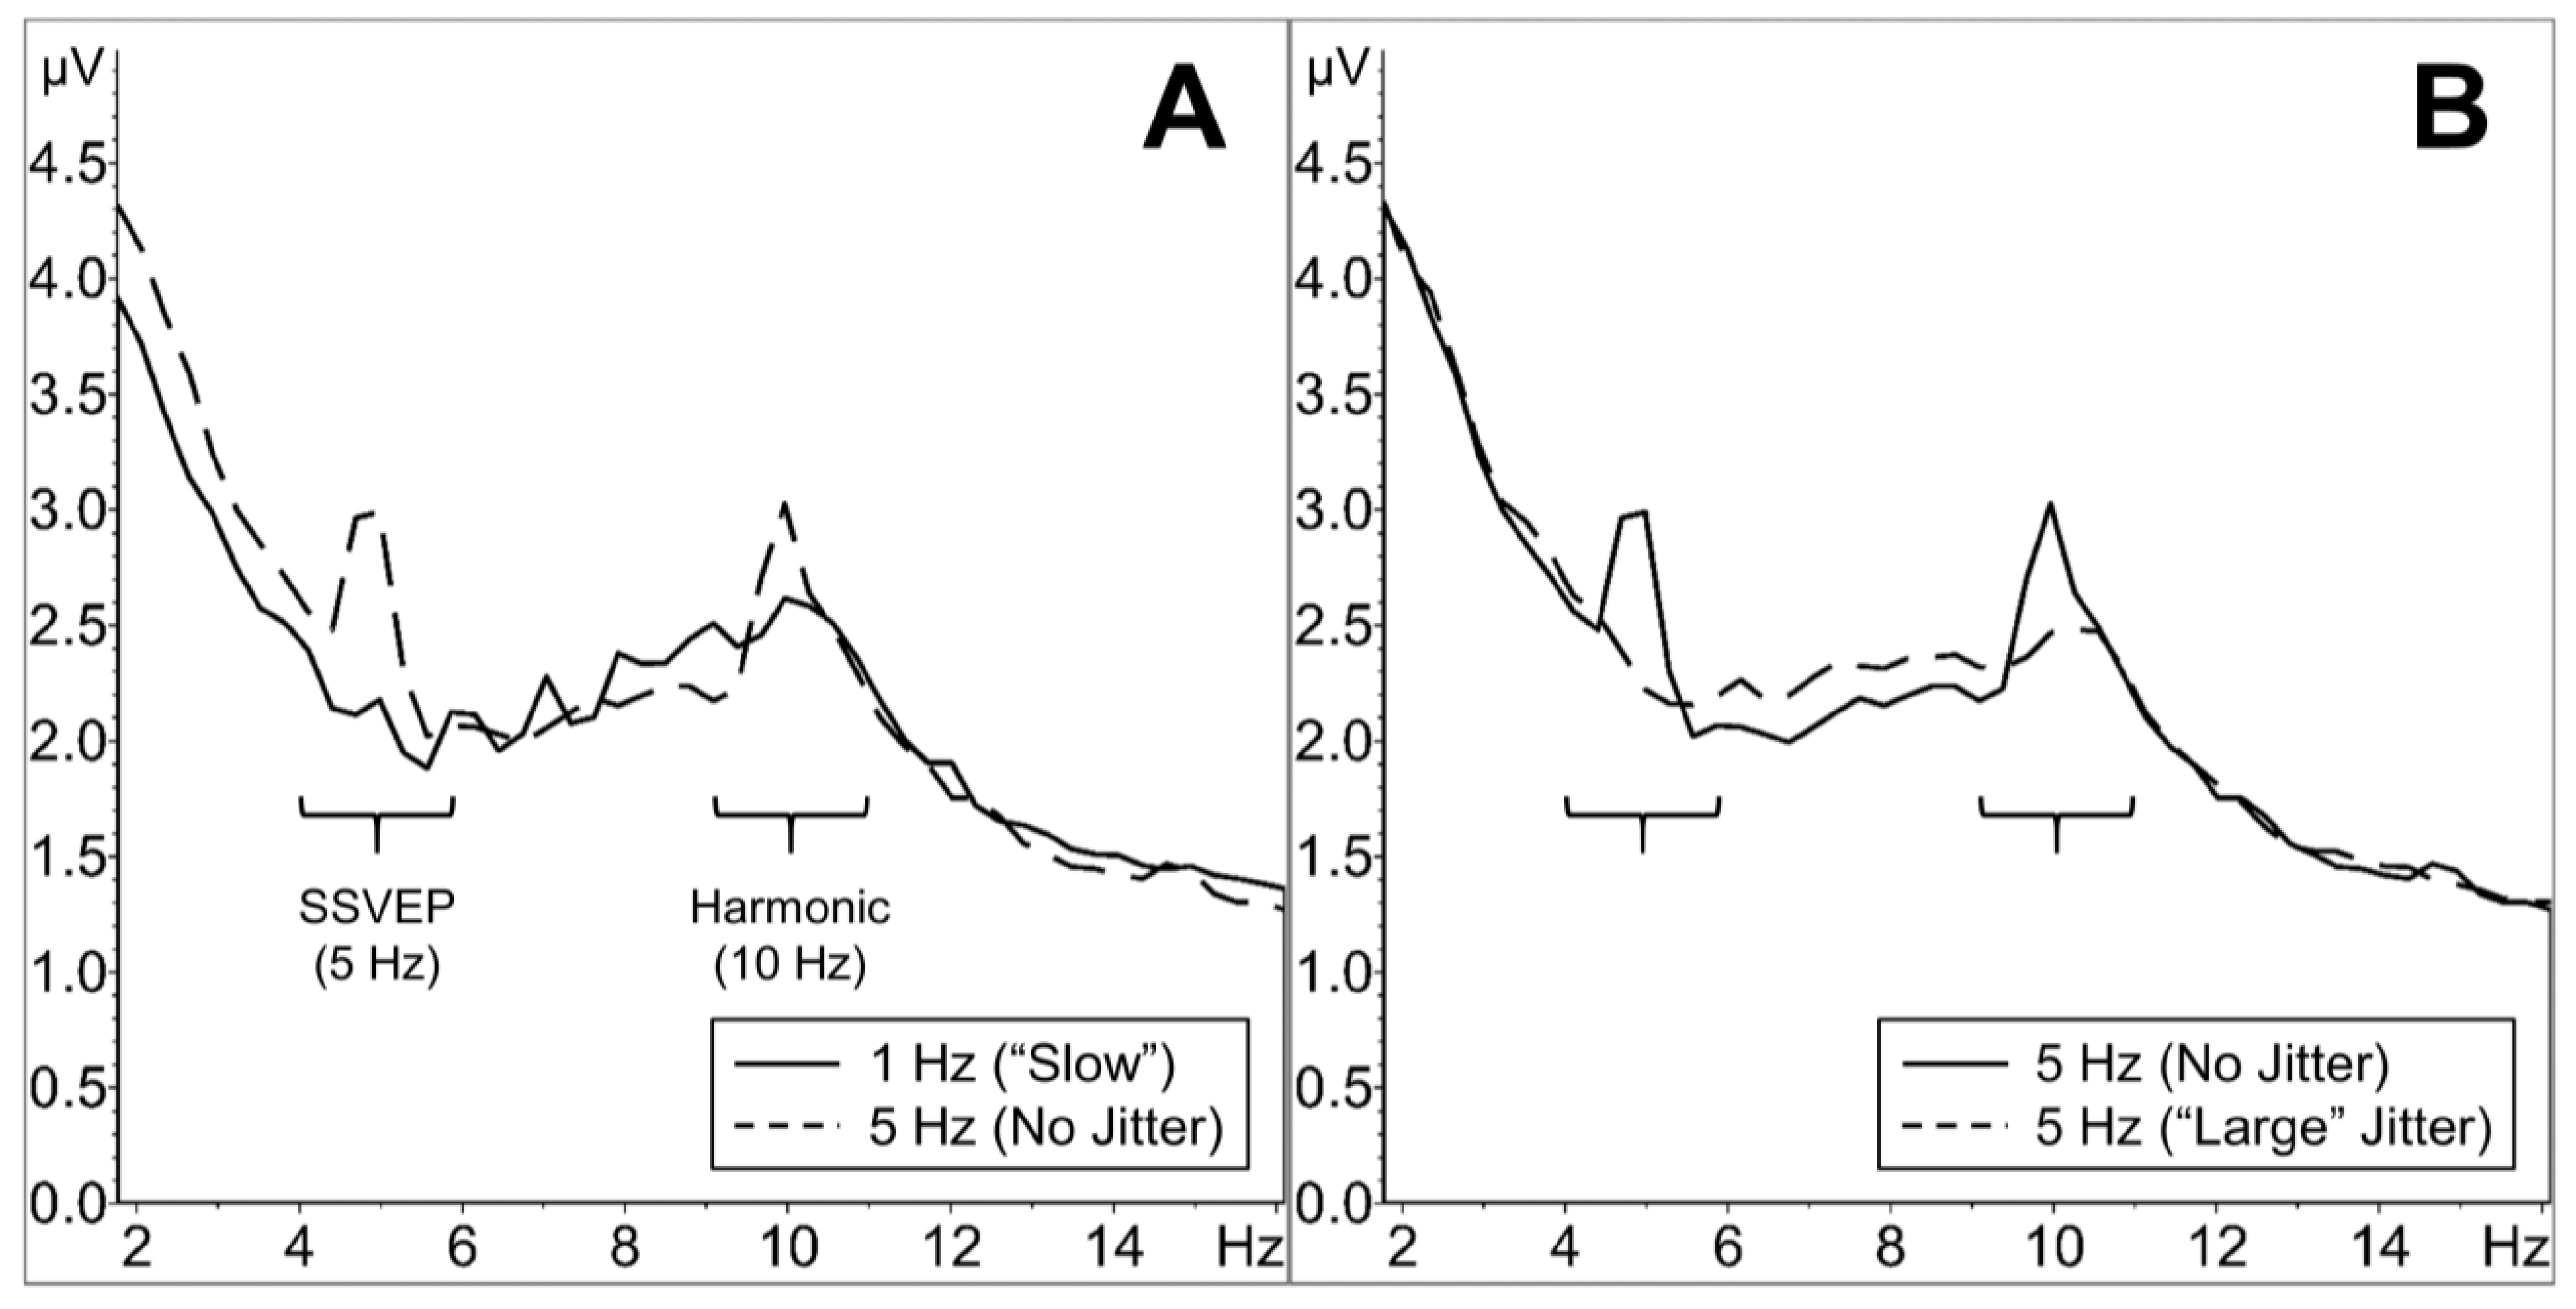
3.2. Time–Frequency Analyses
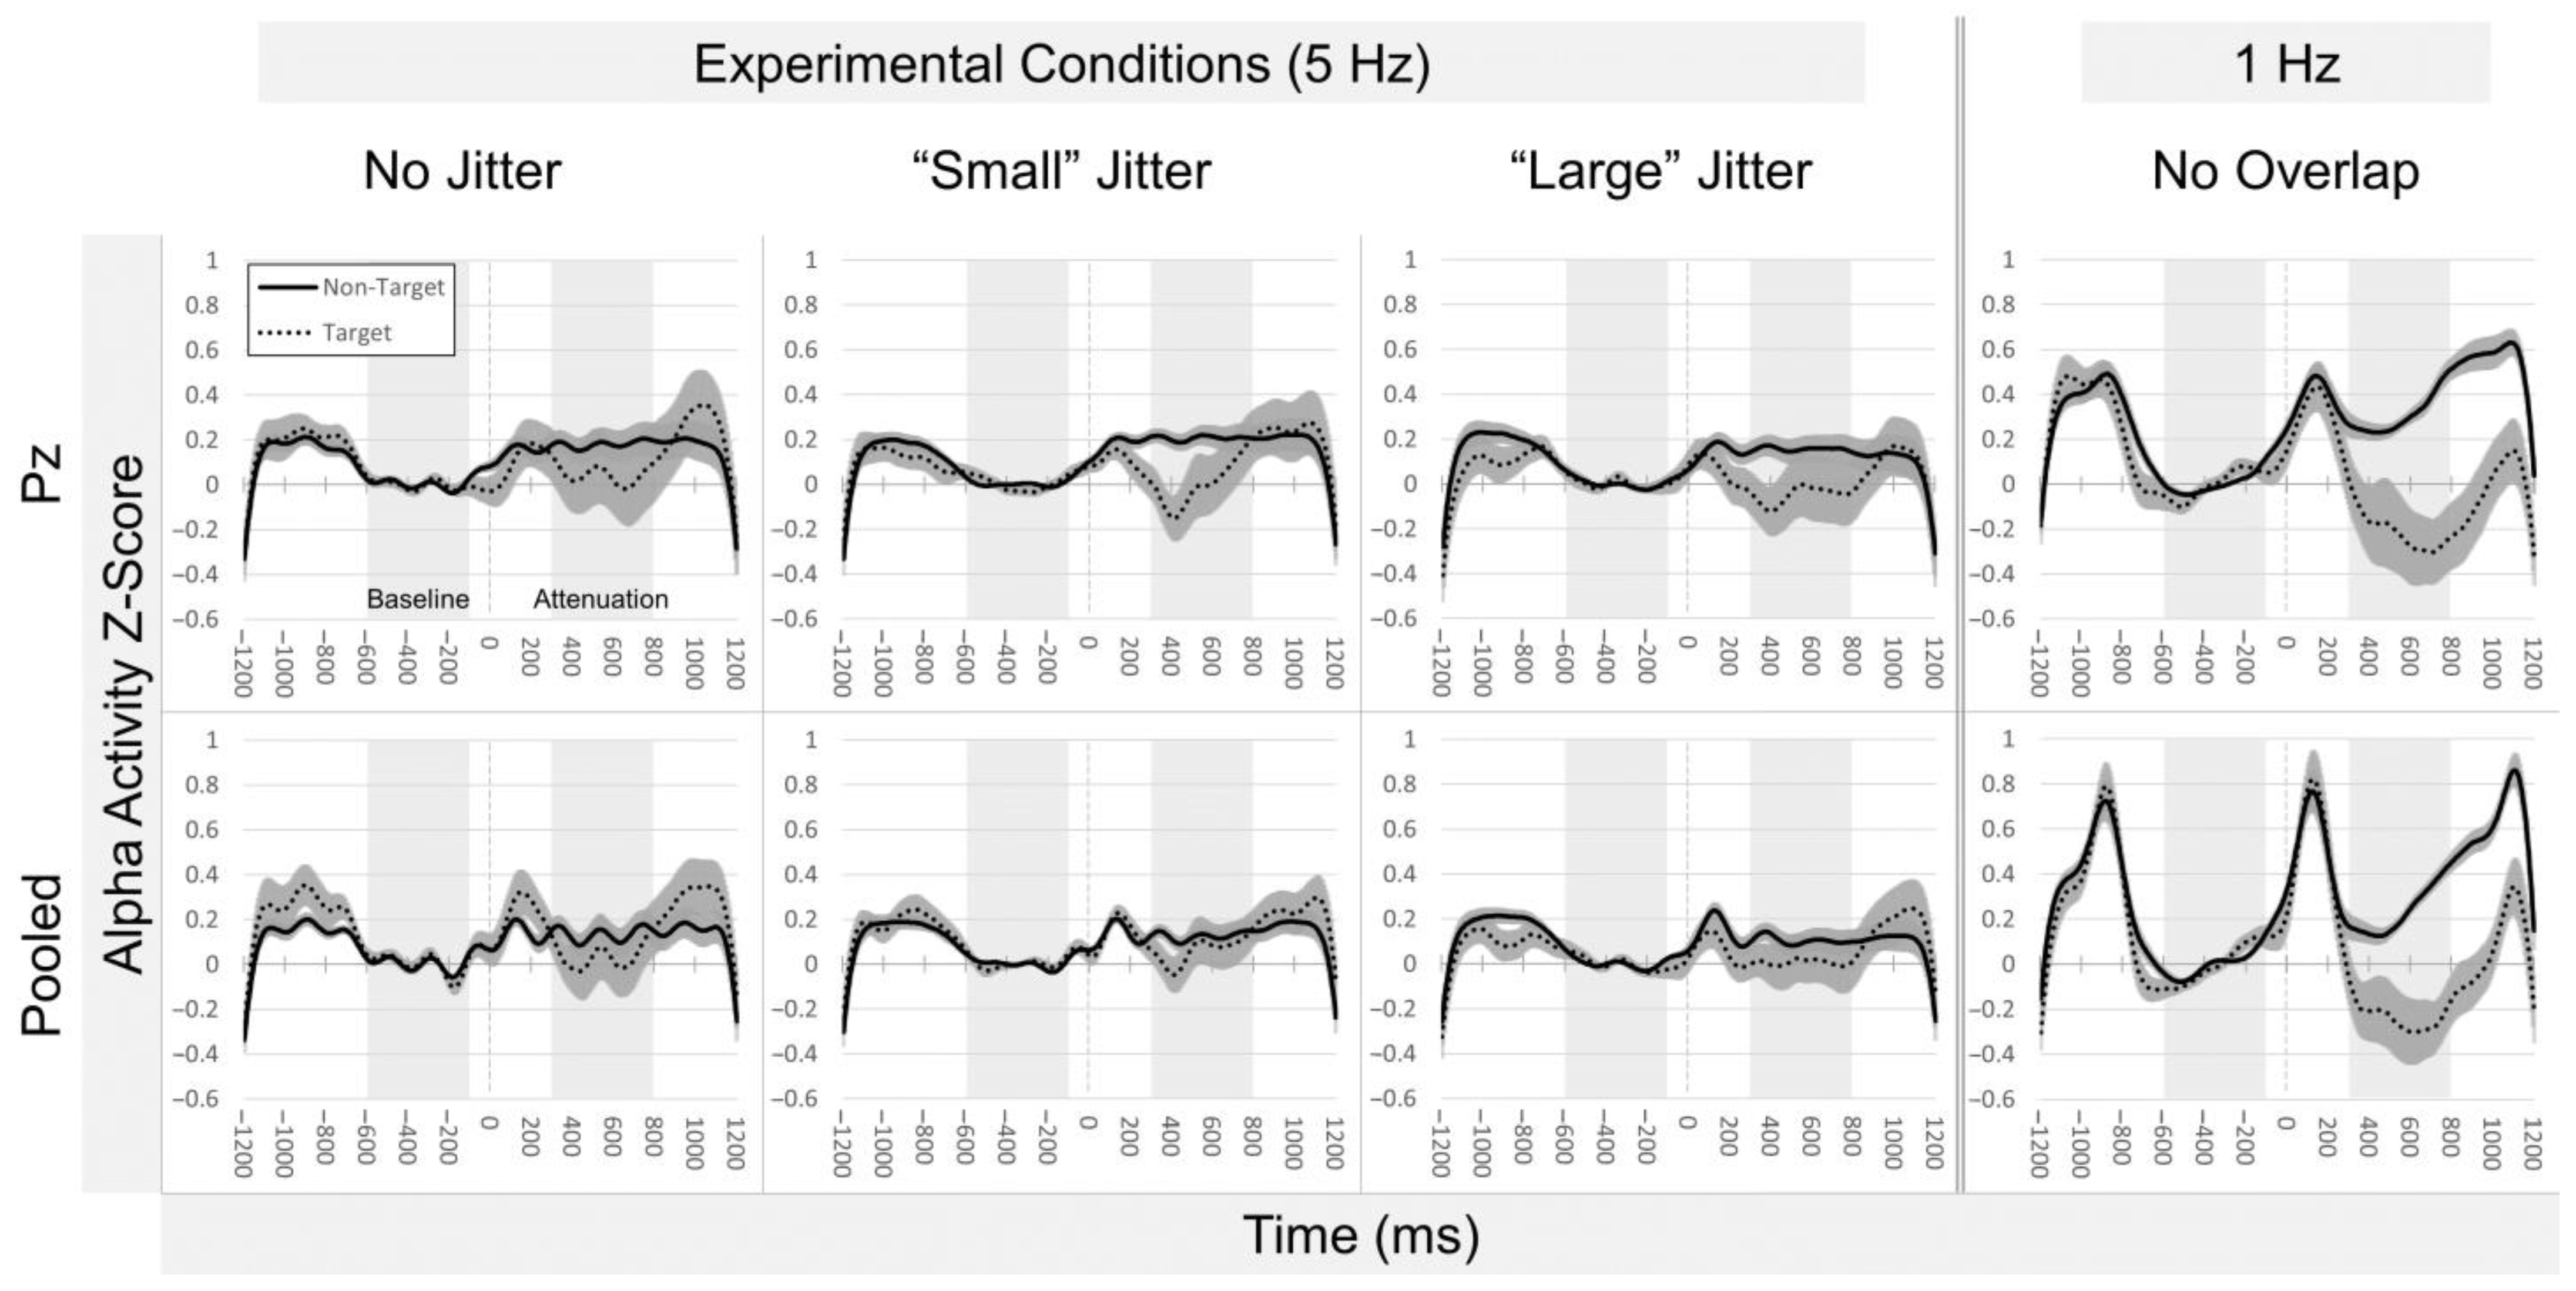
3.2.1. Alpha Effects: Across Participants
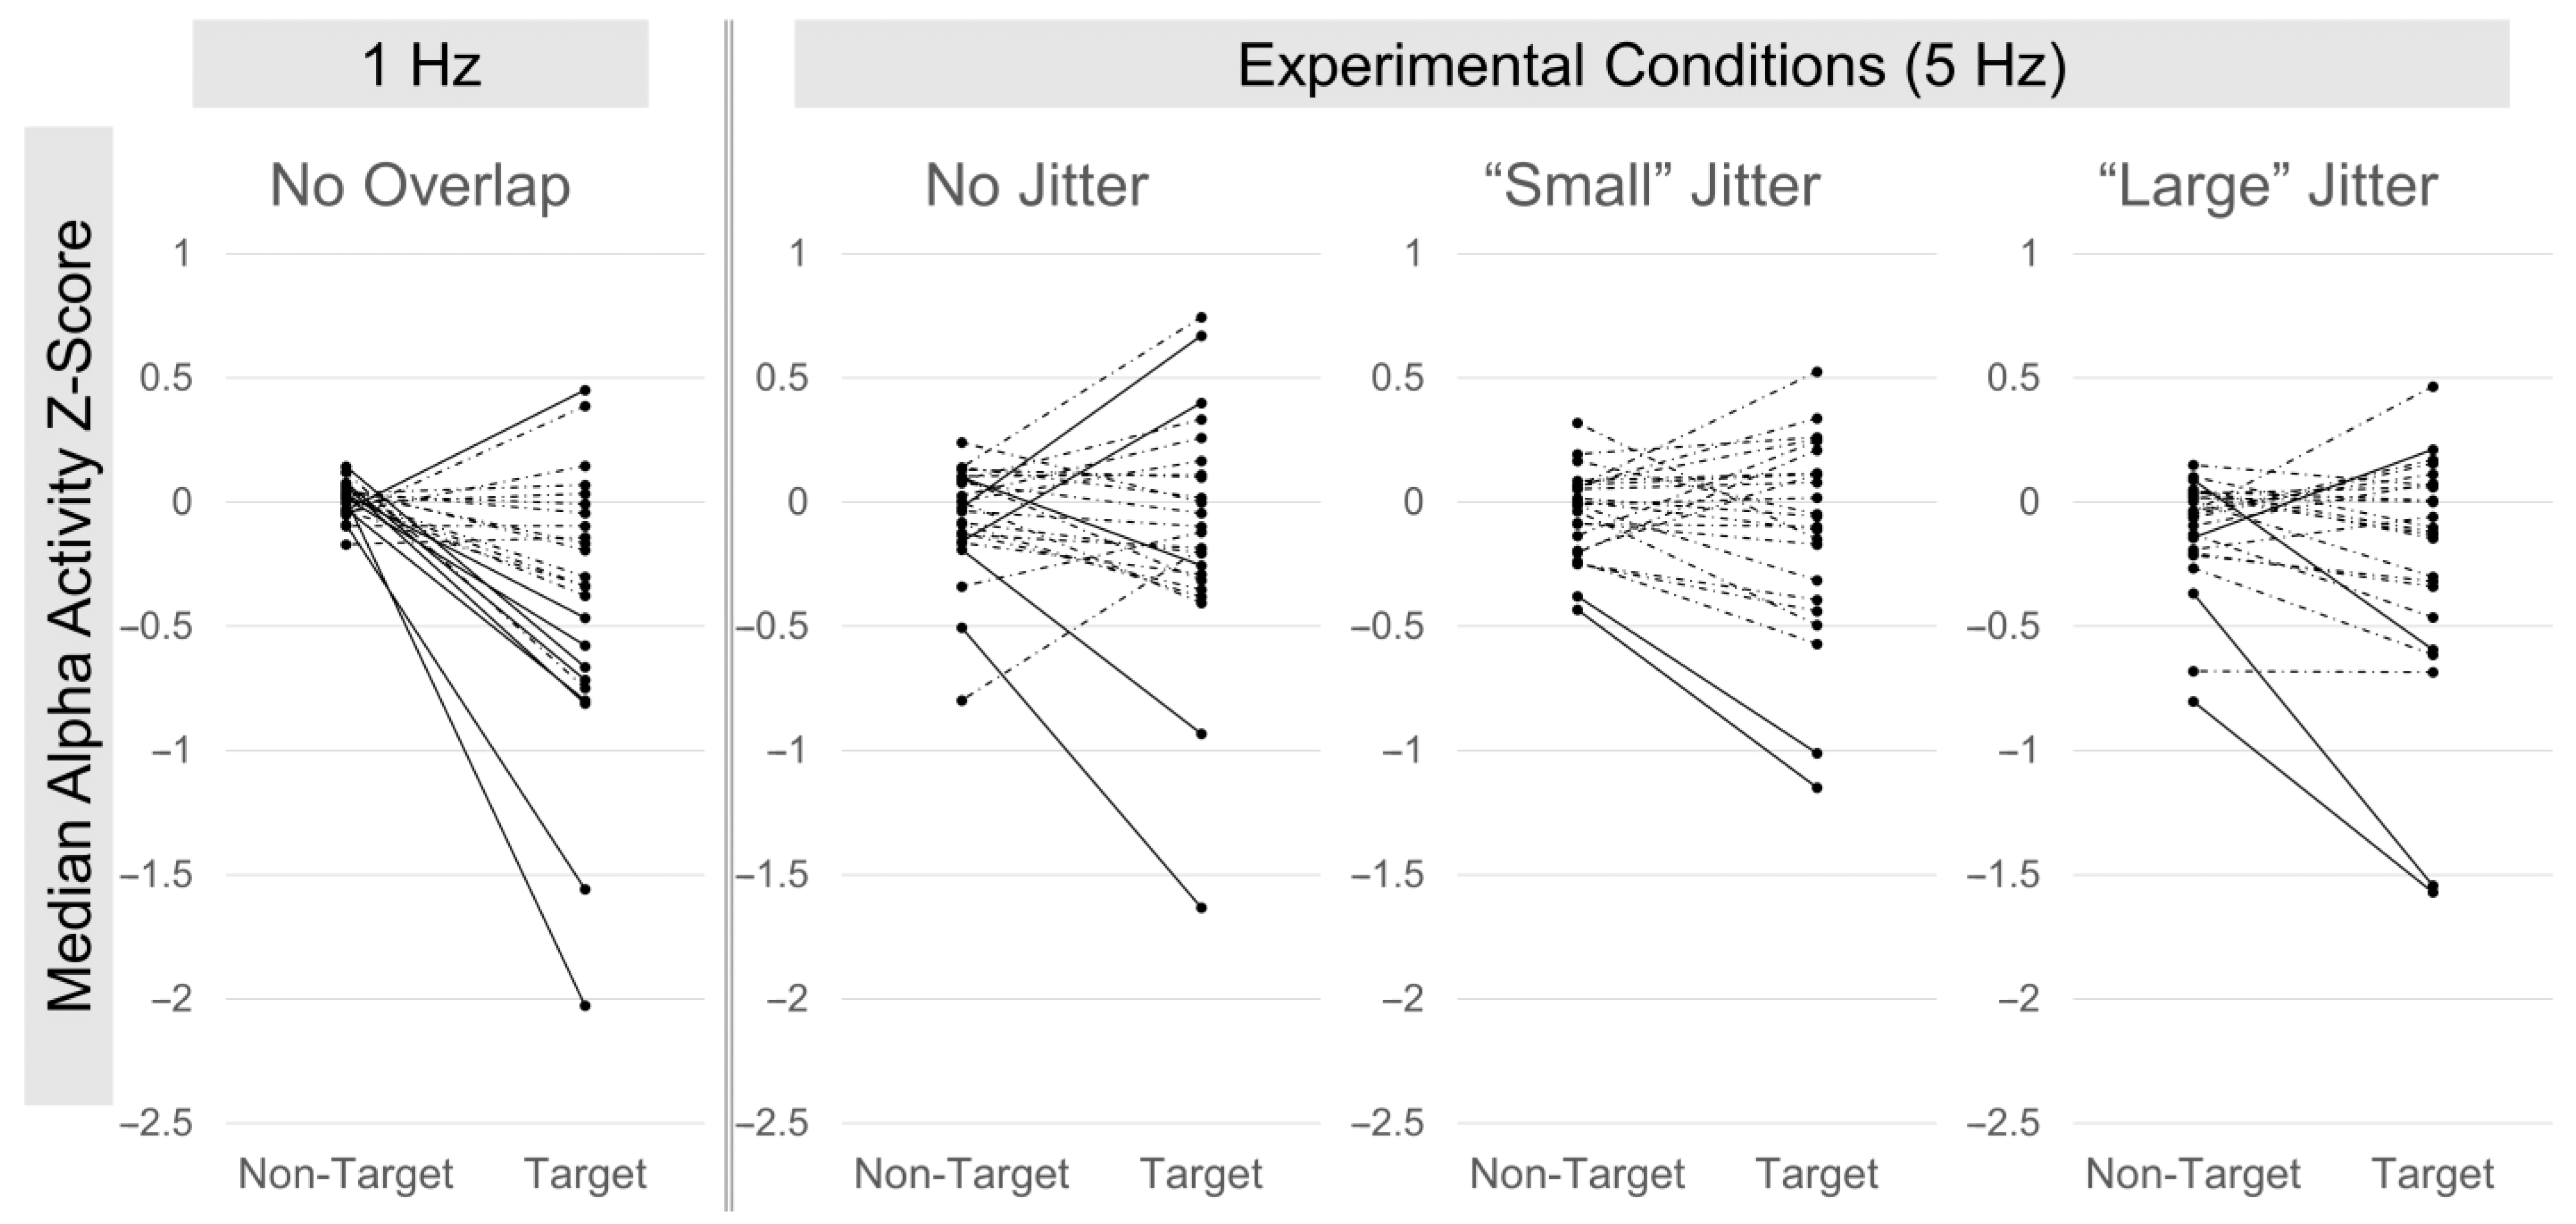
3.2.2. Alpha Effects: Within Participants
3.3. Correlations between Across-Participant ERP Target Effects and Alpha Attenuation
3.4. Classification
3.4.1. Classification: ERPs
3.4.2. Classification: Alpha
3.5. Copy Phrase Performance
3.6. User Experience Questionnaire
3.7. Supplementary Analyses
3.7.1. Supplementary Analyses: Artifact Rejection
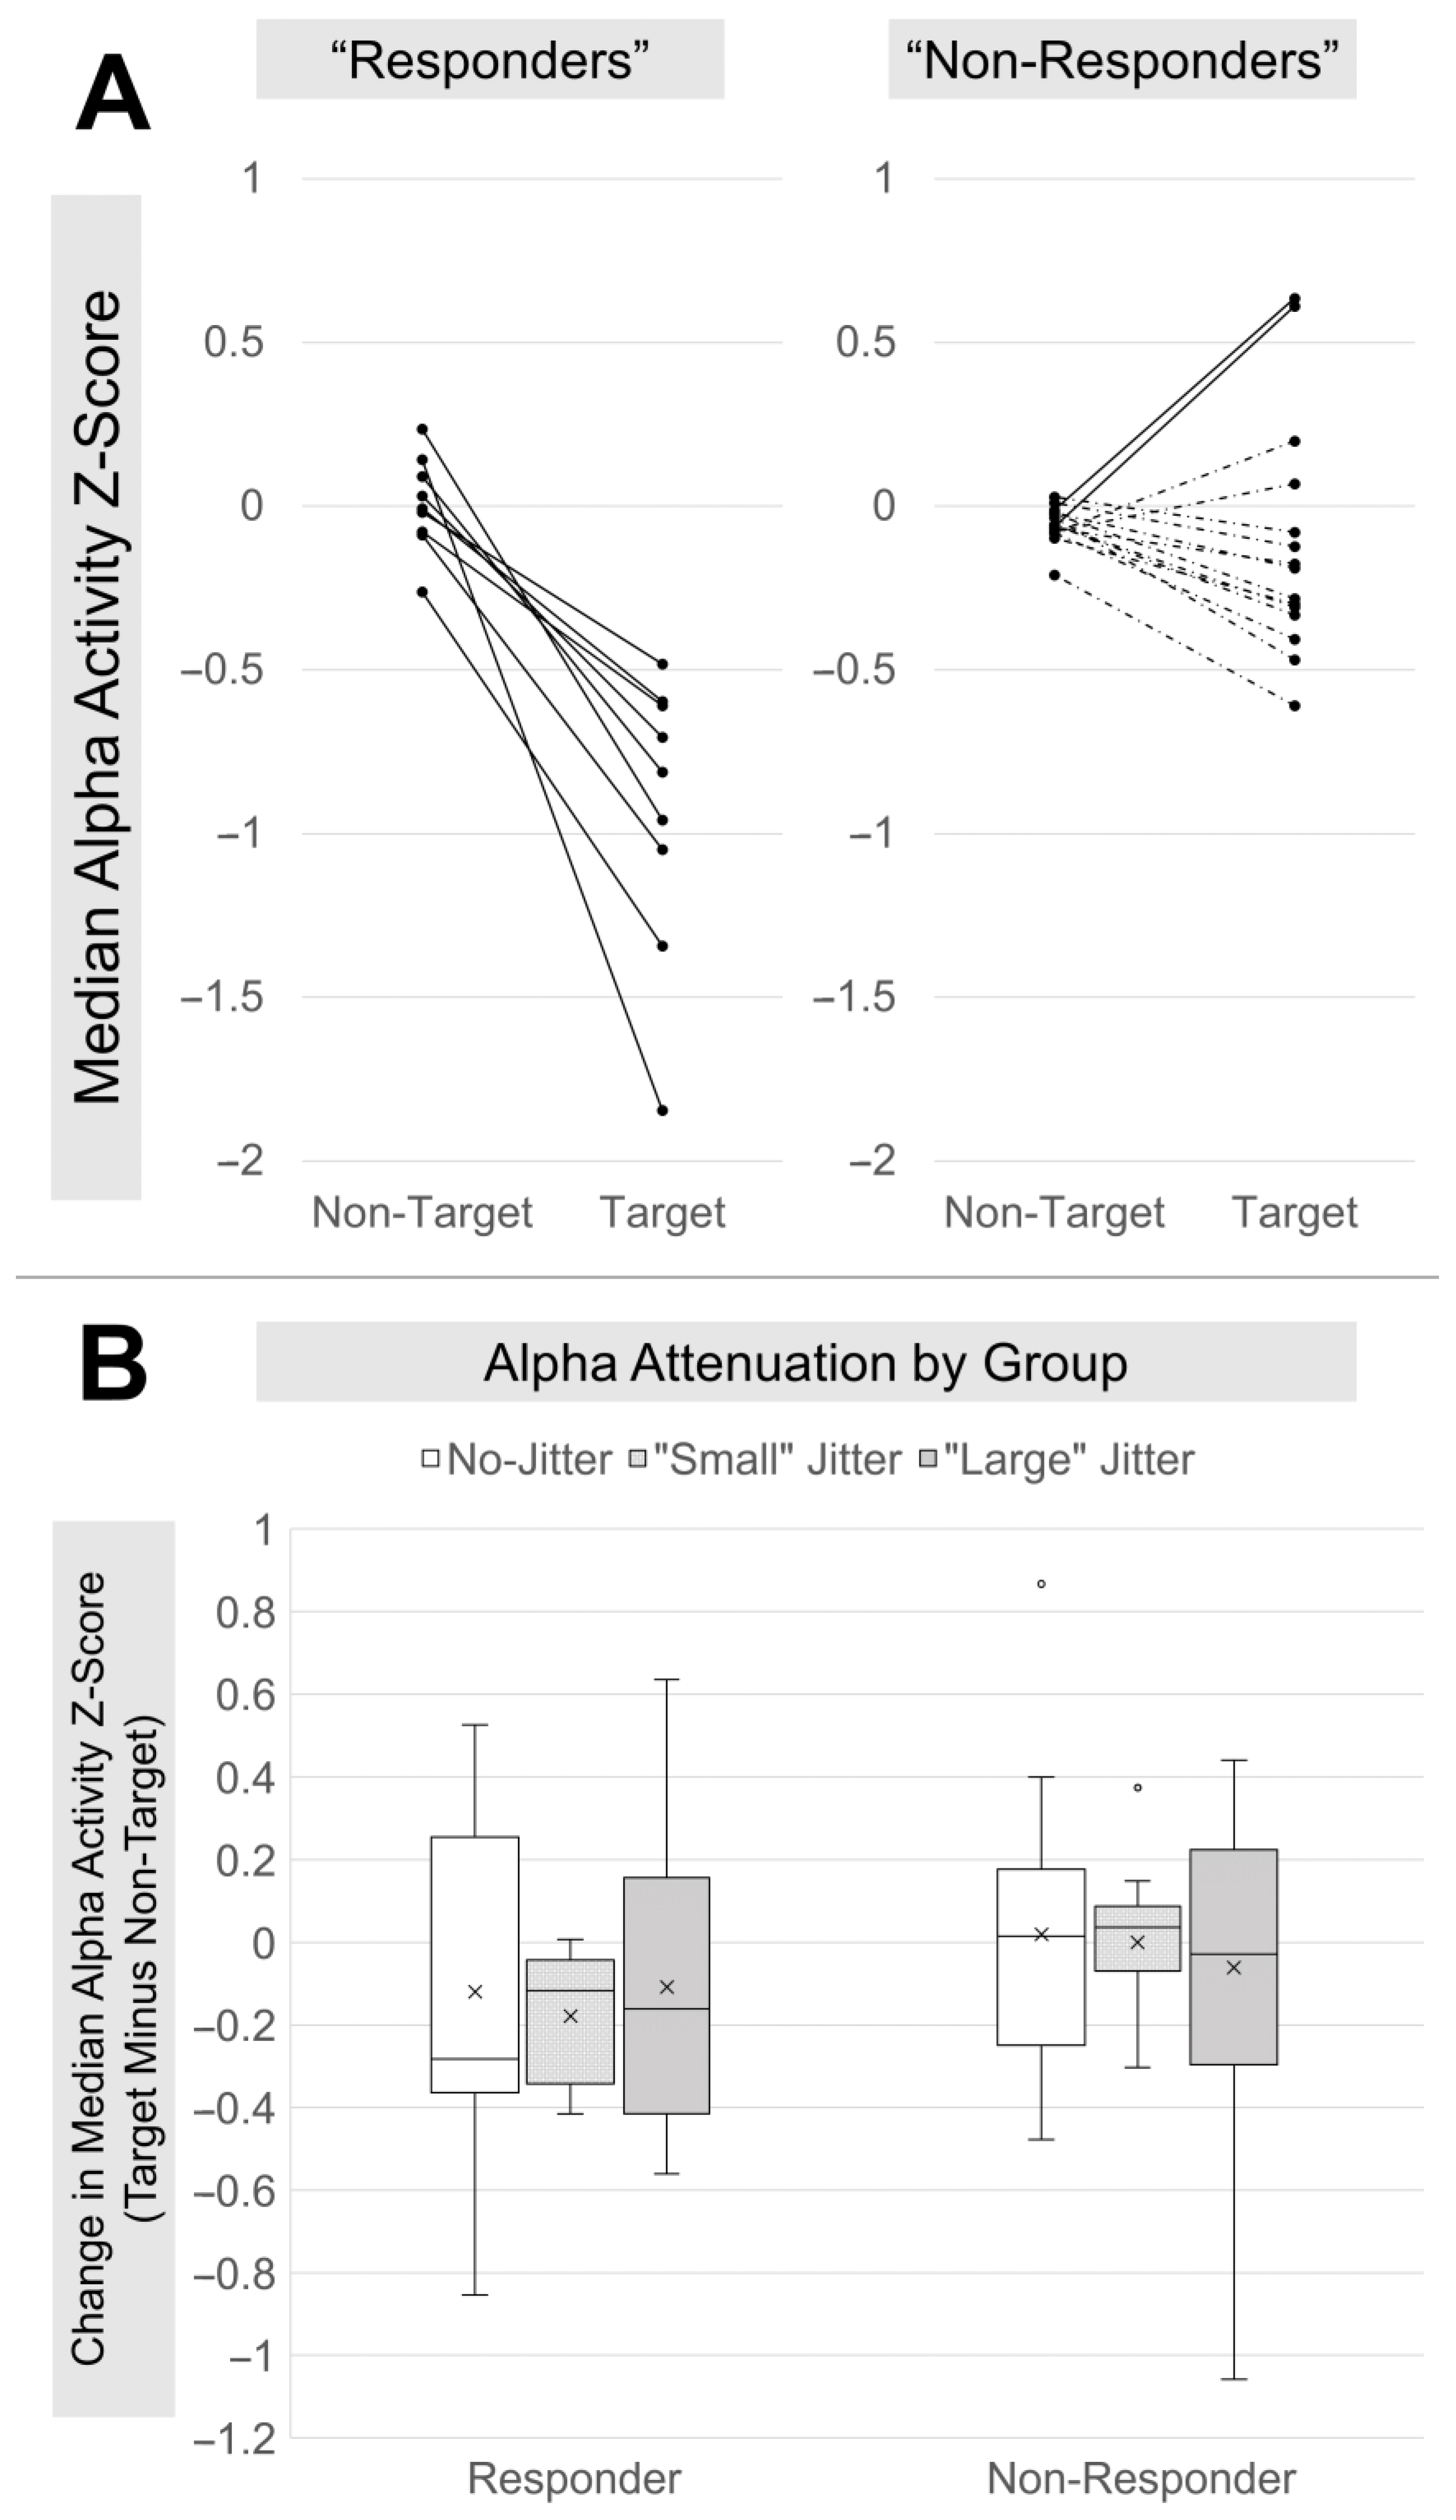
3.7.2. Supplementary Analyses: Alpha “Responder” and “Non-Responder” Groups
4. Discussion
4.1. Summary of Findings
4.2. Adjacent ERP Overlap, Jittered SOI, and SSVEP
4.3. Limitations and Future Directions
5. Conclusions
Author Contributions
Funding
Institutional Review Board Statement
Data Availability Statement
Acknowledgments
Conflicts of Interest
References
- Wolpaw, J.; Wolpaw, E.W. (Eds.) Brain–Computer Interfaces: Principles and Practice; Oxford University Press: New York, NY, USA, 2012; ISBN 978-0-19-538885-5. [Google Scholar]
- Lorach, H.; Galvez, A.; Spagnolo, V.; Martel, F.; Karakas, S.; Intering, N.; Vat, M.; Faivre, O.; Harte, C.; Komi, S.; et al. Walking Naturally after Spinal Cord Injury Using a Brain–Spine Interface. Nature 2023, 618, 126–133. [Google Scholar] [CrossRef] [PubMed]
- Metzger, S.L.; Liu, J.R.; Moses, D.A.; Dougherty, M.E.; Seaton, M.P.; Littlejohn, K.T.; Chartier, J.; Anumanchipalli, G.K.; Tu-Chan, A.; Ganguly, K.; et al. Generalizable Spelling Using a Speech Neuroprosthesis in an Individual with Severe Limb and Vocal Paralysis. Nat. Commun. 2022, 13, 6510. [Google Scholar] [CrossRef] [PubMed]
- Mitchell, P.; Lee, S.C.M.; Yoo, P.E.; Morokoff, A.; Sharma, R.P.; Williams, D.L.; MacIsaac, C.; Howard, M.E.; Irving, L.; Vrljic, I.; et al. Assessment of Safety of a Fully Implanted Endovascular Brain-Computer Interface for Severe Paralysis in 4 Patients: The Stentrode with Thought-Controlled Digital Switch (SWITCH) Study. JAMA Neurol. 2023, 80, 270. [Google Scholar] [CrossRef]
- Rashid, M.; Sulaiman, N.; Abdul Majeed, A.P.P.; Musa, R.M.; Nasir, A.F.A.; Bari, B.S.; Khatun, S. Current Status, Challenges, and Possible Solutions of EEG-Based Brain-Computer Interface: A Comprehensive Review. Front. Neurorobot. 2020, 14, 25. [Google Scholar] [CrossRef] [PubMed]
- Oken, B.; Memmott, T.; Eddy, B.; Wiedrick, J.; Fried-Oken, M. Vigilance State Fluctuations and Performance Using Brain–Computer Interface for Communication. Brain-Comput. Interfaces 2018, 5, 146–156. [Google Scholar] [CrossRef] [PubMed]
- Tian, S.; Wang, Y.; Dong, G.; Pei, W.; Chen, H. Mental Fatigue Estimation Using EEG in a Vigilance Task and Resting States. In Proceedings of the 2018 40th Annual International Conference of the IEEE Engineering in Medicine and Biology Society (EMBC), Honolulu, HI, USA, 18–21 July 2018; pp. 1980–1983. [Google Scholar] [CrossRef]
- Peters, B.; Eddy, B.; Galvin-McLaughlin, D.; Betz, G.; Oken, B.; Fried-Oken, M. A Systematic Review of Research on Augmentative and Alternative Communication Brain-Computer Interface Systems for Individuals with Disabilities. Front. Hum. Neurosci. 2022, 16, 952380. [Google Scholar] [CrossRef] [PubMed]
- Pitt, K.M.; Brumberg, J.S. Evaluating the Perspectives of Those with Severe Physical Impairments while Learning BCI Control of a Commercial Augmentative and Alternative Communication Paradigm. Assist. Technol. 2023, 35, 74–82. [Google Scholar] [CrossRef]
- Orhan, U.; Hild, K.E.; Erdogmus, D.; Roark, B.; Oken, B.; Fried-Oken, M. RSVP Keyboard: An EEG Based Typing Interface. In Proceedings of the 2012 IEEE International Conference on Acoustics, Speech and Signal Processing (ICASSP), Kyoto, Japan, 25–30 March 2012; IEEE: Piscataway, NJ, USA; pp. 645–648. [Google Scholar] [CrossRef]
- Acqualagna, L.; Blankertz, B. Gaze-Independent BCI-Spelling Using Rapid Serial Visual Presentation (RSVP). Clin. Neurophysiol. 2013, 124, 901–908. [Google Scholar] [CrossRef]
- Huang, Y.; Erdogmus, D.; Pavel, M.; Mathan, S.; Hild, K.E. A Framework for Rapid Visual Image Search Using Single-Trial Brain Evoked Responses. Neurocomputing 2011, 74, 2041–2051. [Google Scholar] [CrossRef]
- Lees, S.; Dayan, N.; Cecotti, H.; McCullagh, P.; Maguire, L.; Lotte, F.; Coyle, D. A Review of Rapid Serial Visual Presentation-Based Brain–Computer Interfaces. J. Neural Eng. 2018, 15, 021001. [Google Scholar] [CrossRef]
- Fried-Oken, M.; Kinsella, M.; Peters, B.; Eddy, B.; Wojciechowski, B. Human Visual Skills for Brain-Computer Interface Use: A Tutorial. Disabil. Rehabil. Assist. Technol. 2020, 15, 799–809. [Google Scholar] [CrossRef] [PubMed]
- Brunner, P.; Joshi, S.; Briskin, S.; Wolpaw, J.R.; Bischof, H.; Schalk, G. Does the ‘P300′ Speller Depend on Eye Gaze? J. Neural Eng. 2010, 7, 056013. [Google Scholar] [CrossRef] [PubMed]
- Friedman, D.; Simpson, G.V. ERP Amplitude and Scalp Distribution to Target and Novel Events: Effects of Temporal Order in Young, Middle-Aged and Older Adults. Cogn. Brain Res. 1994, 2, 49–63. [Google Scholar] [CrossRef] [PubMed]
- Woldorff, M.G. Distortion of ERP Averages Due to Overlap from Temporally Adjacent ERPs: Analysis and Correction. Psychophysiology 1993, 30, 98–119. [Google Scholar] [CrossRef]
- Strüber, D.; Polich, J. P300 and Slow Wave from Oddball and Single-Stimulus Visual Tasks: Inter-Stimulus Interval Effects. Int. J. Psychophysiol. 2002, 45, 187–196. [Google Scholar] [CrossRef] [PubMed]
- Klee, D.; Memmott, T.; Smedemark-Margulies, N.; Celik, B.; Erdogmus, D.; Oken, B.S. Target-Related Alpha Attenuation in a Brain-Computer Interface Rapid Serial Visual Presentation Calibration. Front. Hum. Neurosci. 2022, 16, 882557. [Google Scholar] [CrossRef] [PubMed]
- Guger, C.; Allison, B.Z.; Großwindhager, B.; Prückl, R.; Hintermüller, C.; Kapeller, C.; Bruckner, M.; Krausz, G.; Edlinger, G. How Many People Could Use an SSVEP BCI? Front. Neurosci. 2012, 6, 169. [Google Scholar] [CrossRef]
- Kristensen, E.; Rivet, B.; Guérin-Dugué, A. Estimation of Overlapped Eye Fixation Related Potentials: The General Linear Model, a More Flexible Framework than the ADJAR Algorithm. JEMR 2017, 10, 7. [Google Scholar] [CrossRef]
- Thompson, D.E.; Warschausky, S.; Huggins, J.E. Classifier-Based Latency Estimation: A Novel Way to Estimate and Predict BCI Accuracy. J. Neural Eng. 2013, 10, 016006. [Google Scholar] [CrossRef]
- Mowla, M.R.; Huggins, J.E.; Thompson, D.E. Enhancing P300-BCI Performance Using Latency Estimation. Brain-Comput. Interfaces 2017, 4, 137–145. [Google Scholar] [CrossRef]
- Cecotti, H. Toward Shift Invariant Detection of Event-Related Potentials in Non-Invasive Brain-Computer Interface. Pattern Recognit. Lett. 2015, 66, 127–134. [Google Scholar] [CrossRef]
- Zisk, A.H.; Borgheai, S.B.; McLinden, J.; Deligani, R.J.; Shahriari, Y. Improving Longitudinal P300-BCI Performance for People with ALS Using a Data Augmentation and Jitter Correction Approach. Brain-Comput. Interfaces 2022, 9, 49–66. [Google Scholar] [CrossRef]
- Li, M.; Yang, G.; Liu, Z.; Gong, M.; Xu, G.; Lin, F. The Effect of SOA on An Asynchronous ERP and VEP-Based BCI. IEEE Access 2021, 9, 9972–9981. [Google Scholar] [CrossRef]
- Patel, S.H.; Azzam, P.N. Characterization of N200 and P300: Selected Studies of the Event-Related Potential. Int. J. Med. Sci. 2005, 2, 147–154. [Google Scholar] [CrossRef]
- Lopes Da Silva, F.H.; Vos, J.E.; Mooibroek, J.; Van Rotterdam, A. Relative Contributions of Intracortical and Thalamo-Cortical Processes in the Generation of Alpha Rhythms, Revealed by Partial Coherence Analysis. Electroencephalogr. Clin. Neurophysiol. 1980, 50, 449–456. [Google Scholar] [CrossRef] [PubMed]
- Gaillard, C.; Ben Hamed, S. The Neural Bases of Spatial Attention and Perceptual Rhythms. Eur. J. Neurosci. 2022, 55, 3209–3223. [Google Scholar] [CrossRef] [PubMed]
- Foster, J.J.; Sutterer, D.W.; Serences, J.T.; Vogel, E.K.; Awh, E. Alpha-Band Oscillations Enable Spatially and Temporally Resolved Tracking of Covert Spatial Attention. Psychol. Sci. 2017, 28, 929–941. [Google Scholar] [CrossRef]
- Van Gerven, M.; Jensen, O. Attention Modulations of Posterior Alpha as a Control Signal for Two-Dimensional Brain–Computer Interfaces. J. Neurosci. Methods 2009, 179, 78–84. [Google Scholar] [CrossRef]
- Knopman, D.S.; Roberts, R.O.; Geda, Y.E.; Pankratz, V.S.; Christianson, T.J.H.; Petersen, R.C.; Rocca, W.A. Validation of the Telephone Interview for Cognitive Status-Modified in Subjects with Normal Cognition, Mild Cognitive Impairment, or Dementia. Neuroepidemiology 2010, 34, 34–42. [Google Scholar] [CrossRef]
- Kiernan, R.J.; Mueller, J.; Langston, W.; Van Dyke, C. The Neurobehavioral Cognitive Status Examination: A Brief But Differentiated Approach to Cognitive Assessment. Ann. Intern. Med. 1987, 107, 481–485. [Google Scholar] [CrossRef]
- Herscovitch, J.; Broughton, R. Sensitivity of the Stanford Sleepiness Scale to the Effects of Cumulative Partial Sleep Deprivation and Recovery Oversleeping. Sleep 1981, 4, 83–92. [Google Scholar] [CrossRef] [PubMed]
- Maclean, A.W.; Fekken, G.C.; Saskin, P.; Knowles, J.B. Psychometric Evaluation of the Stanford Sleepiness Scale. J. Sleep Res. 1992, 1, 35–39. [Google Scholar] [CrossRef] [PubMed]
- Krusienski, D.J.; Sellers, E.W.; McFarland, D.J.; Vaughan, T.M.; Wolpaw, J.R. Toward Enhanced P300 Speller Performance. J. Neurosci. Methods 2008, 167, 15–21. [Google Scholar] [CrossRef] [PubMed]
- Memmott, T.; Koçanaoğulları, A.; Lawhead, M.; Klee, D.; Dudy, S.; Fried-Oken, M.; Oken, B. BciPy: Brain–Computer Interface Software in Python. Brain-Comput. Interfaces 2021, 8, 137–153. [Google Scholar] [CrossRef]
- Tanner, D.; Morgan-Short, K.; Luck, S.J. How Inappropriate High-Pass Filters Can Produce Artifactual Effects and Incorrect Conclusions in ERP Studies of Language and Cognition: High-Pass Filtering and Artifactual ERP Effects. Psychophysiology 2015, 52, 997–1009. [Google Scholar] [CrossRef] [PubMed]
- Corcoran, A.W.; Alday, P.M.; Schlesewsky, M.; Bornkessel-Schlesewsky, I. Toward a Reliable, Automated Method of Individual Alpha Frequency (IAF) Quantification. Psychophysiology 2018, 55, e13064. [Google Scholar] [CrossRef] [PubMed]
- Fatourechi, M.; Bashashati, A.; Ward, R.K.; Birch, G.E. EMG and EOG Artifacts in Brain Computer Interface Systems: A Survey. Clin. Neurophysiol. 2007, 118, 480–494. [Google Scholar] [CrossRef] [PubMed]
- Minguillon, J.; Lopez-Gordo, M.A.; Pelayo, F. Trends in EEG-BCI for Daily-Life: Requirements for Artifact Removal. Biomed. Signal Process. Control 2017, 31, 407–418. [Google Scholar] [CrossRef]
- CAMBI-Tech/Alpha-Attenuation: Initial Release (1.0.0). Available online: https://doi.org/10.5281/zenodo.6098823 (accessed on 24 April 2023).
- CAMBI-Tech/Alpha-Attenuation. Available online: https://github.com/CAMBI-tech/alpha-attenuation/commit/1e49f2a7b45bc7f0ea577a89440ec5f070e0528c (accessed on 18 April 2023).
- Lee, G.; Gommers, R.; Waselewski, F.; Wohlfahrt, K.; O’Leary, A. PyWavelets: A Python Package for Wavelet Analysis. JOSS 2019, 4, 1237. [Google Scholar] [CrossRef]
- Delorme, A. EEG Is Better Left Alone. Sci. Rep. 2023, 13, 2372. [Google Scholar] [CrossRef]
- Höller, Y.; Thomschewski, A.; Bergmann, J.; Kronbichler, M.; Crone, J.S.; Schmid, E.V.; Butz, K.; Höller, P.; Trinka, E. EEG-Response Consistency across Subjects in an Active Oddball Task. PLoS ONE 2013, 8, e74572. [Google Scholar] [CrossRef] [PubMed]
- Jalilpour, S.; Hajipour Sardouie, S.; Mijani, A. A Novel Hybrid BCI Speller Based on RSVP and SSVEP Paradigm. Comput. Methods Programs Biomed. 2020, 187, 105326. [Google Scholar] [CrossRef] [PubMed]
- Martínez-Cagigal, V.; Thielen, J.; Santamaría-Vázquez, E.; Pérez-Velasco, S.; Desain, P.; Hornero, R. Brain–Computer Interfaces Based on Code-Modulated Visual Evoked Potentials (c-VEP): A Literature Review. J. Neural Eng. 2021, 18, 061002. [Google Scholar] [CrossRef] [PubMed]
- Fernández-Rodríguez, Á.; Medina-Juliá, M.T.; Velasco-Álvarez, F.; Ron-Angevin, R. Effects of Spatial Stimulus Overlap in a Visual P300-Based Brain-Computer Interface. Neuroscience 2020, 431, 134–142. [Google Scholar] [CrossRef]


| Participants (n = 24) | |
|---|---|
| Age: mean years ± SD (range) | 38.71 ± 17.82 (18–76) |
| Gender | |
| Female | 12 |
| Male | 11 |
| Non-Binary | 1 |
| Race | |
| American Indian or Alaska Native | 1 |
| Asian or Asian American | 1 |
| White | 19 |
| Other/Multiple | 3 |
| Ethnicity | |
| Hispanic/Latino | 3 |
| Not Hispanic/Latino | 21 |
| Education | |
| Some college but no degree | 2 |
| Associate degree | 1 |
| Bachelor’s degree | 10 |
| Postgraduate degree | 11 |
Disclaimer/Publisher’s Note: The statements, opinions and data contained in all publications are solely those of the individual author(s) and contributor(s) and not of MDPI and/or the editor(s). MDPI and/or the editor(s) disclaim responsibility for any injury to people or property resulting from any ideas, methods, instructions or products referred to in the content. |
© 2024 by the authors. Licensee MDPI, Basel, Switzerland. This article is an open access article distributed under the terms and conditions of the Creative Commons Attribution (CC BY) license (https://creativecommons.org/licenses/by/4.0/).
Share and Cite
Klee, D.; Memmott, T.; Oken, B., on behalf of the Consortium for Accessible Multimodal Brain-Body Interfaces (CAMBI). The Effect of Jittered Stimulus Onset Interval on Electrophysiological Markers of Attention in a Brain–Computer Interface Rapid Serial Visual Presentation Paradigm. Signals 2024, 5, 18-39. https://doi.org/10.3390/signals5010002
Klee D, Memmott T, Oken B on behalf of the Consortium for Accessible Multimodal Brain-Body Interfaces (CAMBI). The Effect of Jittered Stimulus Onset Interval on Electrophysiological Markers of Attention in a Brain–Computer Interface Rapid Serial Visual Presentation Paradigm. Signals. 2024; 5(1):18-39. https://doi.org/10.3390/signals5010002
Chicago/Turabian StyleKlee, Daniel, Tab Memmott, and Barry Oken on behalf of the Consortium for Accessible Multimodal Brain-Body Interfaces (CAMBI). 2024. "The Effect of Jittered Stimulus Onset Interval on Electrophysiological Markers of Attention in a Brain–Computer Interface Rapid Serial Visual Presentation Paradigm" Signals 5, no. 1: 18-39. https://doi.org/10.3390/signals5010002