1. Introduction
The assessment of a bridge deck’s condition requires the use of multiple nondestructive evaluation (NDE) technologies. Some commonly used techniques are the half-cell potential (HCP) and electrical resistivity (ER). The HCP is used to determine the likelihood of active corrosion in reinforcing steel bars, while ER is employed to assess the corrosive environment. However, the NDE technologies have limitations in detecting certain types of defects and deterioration as their detection and characterization are influenced by various factors. For instance, and as discussed later, the accuracy of HCP measurements can be impacted by factors such as moisture content, concrete cover, and the anode/cathode ratio. Similarly, ER measurements can be influenced by factors such as moisture content, carbonation, and temperature. Therefore, it is crucial to have a thorough understanding of the strengths and limitations of NDE technologies to make the best use of them in a complementary manner.
NDEs play a pivotal role in bridge monitoring, ensuring the structural integrity and safety of these critical infrastructure assets. NDEs provide invaluable data without compromising a bridge’s structural integrity. However, the impact of environmental effects on these tests cannot be underestimated. Variations in moisture levels, or even the presence of corrosion, can alter the values obtained from these tests, potentially leading to an inaccurate interpretation or missed signs of degradation. Therefore, careful consideration of environmental factors is essential to maintaining the reliability and effectiveness of nondestructive tests in bridge inspection.
The primary goal of this research is to address the foregoing issue by enhancing the interpretation of the results of ER and the HCP through the use of machine learning algorithms to analyze the results of surveys via multiple NDE techniques. Additionally, this research study has the following aims:
To integrate information from various NDE technologies to gain a better understanding of how different factors can impact their measurements and, consequently, the detection and characterization of defects or deterioration.
To establish connections between the results from different technologies and the various factors that can influence the measurements to further improve their interpretation.
In summary, this research seeks to overcome the limitations of NDE technologies by conducting a joint analysis of multiple techniques and considering the influence of various factors on their results. In particular, this study introduces an approach to enhance the interpretation of half-cell potential (HCP) and electrical resistivity (ER) measurements in the context of concrete bridge deck assessments. This approach is manifested via the integration of multiple nondestructive evaluation (NDE) technologies with machine learning algorithms, specifically utilizing Random Forest methodology. Furthermore, the study conducts a parametric analysis to explore the impact of various key parameters on HCP and ER measurements, including the degree of saturation, corrosion length, delamination depth, concrete cover, and moisture condition of delamination. By combining these elements, the research improves the accuracy of the measurement interpretation and ensures consistency in the condition monitoring of bridge decks through periodical NDE surveys.
2. Parameters Affecting HCP and ER Measurements
A comprehensive review of the relevant literature was conducted to identify the factors impacting the results of HCP and ER measurements. The sections below provide a summarized description of the parameters that affect the responses of these technologies, providing an understanding of the underlying principles that govern their behavior. This information serves as a foundation for identifying the parameters that are of the highest interest for this research study.
2.1. Parameters Affecting the HCP
HCP measurements can be impacted by various parameters which can result in incorrect interpretations of the data. One such factor is the moisture content, which was shown to reduce electrical resistivity and lead to lower (more negative) HCP values [
1,
2,
3,
4,
5,
6,
7]. Another crucial parameter is the concrete cover thickness, which affects the distribution of the potential, causing the potential at the steel/concrete interface to be significantly different from the potential on the concrete surface as the concrete cover thickness increases [
8]. However, the effect of the concrete cover is still not conclusive, with some studies suggesting it can impact the accuracy of HCP measurements [
5,
9]. The anode/cathode ratio also affects the potential distribution due to corrosion, with a smaller ratio potentially leading to difficulty in detecting localized corrosion [
8]. Furthermore, it was concluded that the relationship between HCP values and the size of the corroded area in the steel bar needs to be further investigated to improve HCP measurements [
10].
2.2. Parameters Affecting the ER
Many factors can influence ER measurements, and these factors can have a significant effect on the measured values. Specifically, parameters such as the degree of saturation, rebar corrosion, and the depth and moisture condition of delamination [
11,
12]. Also, it was found that the electrical resistivity of concrete is sensitive to moisture, with an increase in moisture content leading to a decrease in electrical resistivity [
13]. This conclusion is supported by the findings in [
14]. However, they recommend that further studies be carried out to better understand the response of partially saturated concrete. Larsen et al. [
15], as cited in [
16], discovered an interesting behavior in concrete wherein a decrease in the degree of saturation from 88% to 77% led to an average twofold increase in resistivity, and a decrease from 88% to 66%, led to a sixfold increase. Temperature also affects ER measurements, and according to Elkey and Sellevold [
17], as cited in [
18], an increase in temperature leads to a decrease in ER values. This study found that ER values changed by 5% for each 1 °C in concrete with a degree of saturation under 30% and by 3% for each 1 °C in concrete with a degree of saturation under 70%. Moreover, cracks and delamination can also impact ER measurement values. Khudhair and Gucunski [
19] found that the effect of delamination decreases as the delamination depth from the surface increases. The orientation angle of the delamination has a significant effect on ER measurements in the 45° to 90° range but only a minor impact in the 0° to 30° range. Finally, concrete resistivity may be affected by carbonation [
20].
3. Finite Element Simulations
The present study utilized finite element models to examine all of the nondestructive evaluation (NDE) techniques included in this research. The models were created using COMSOL Multiphysics
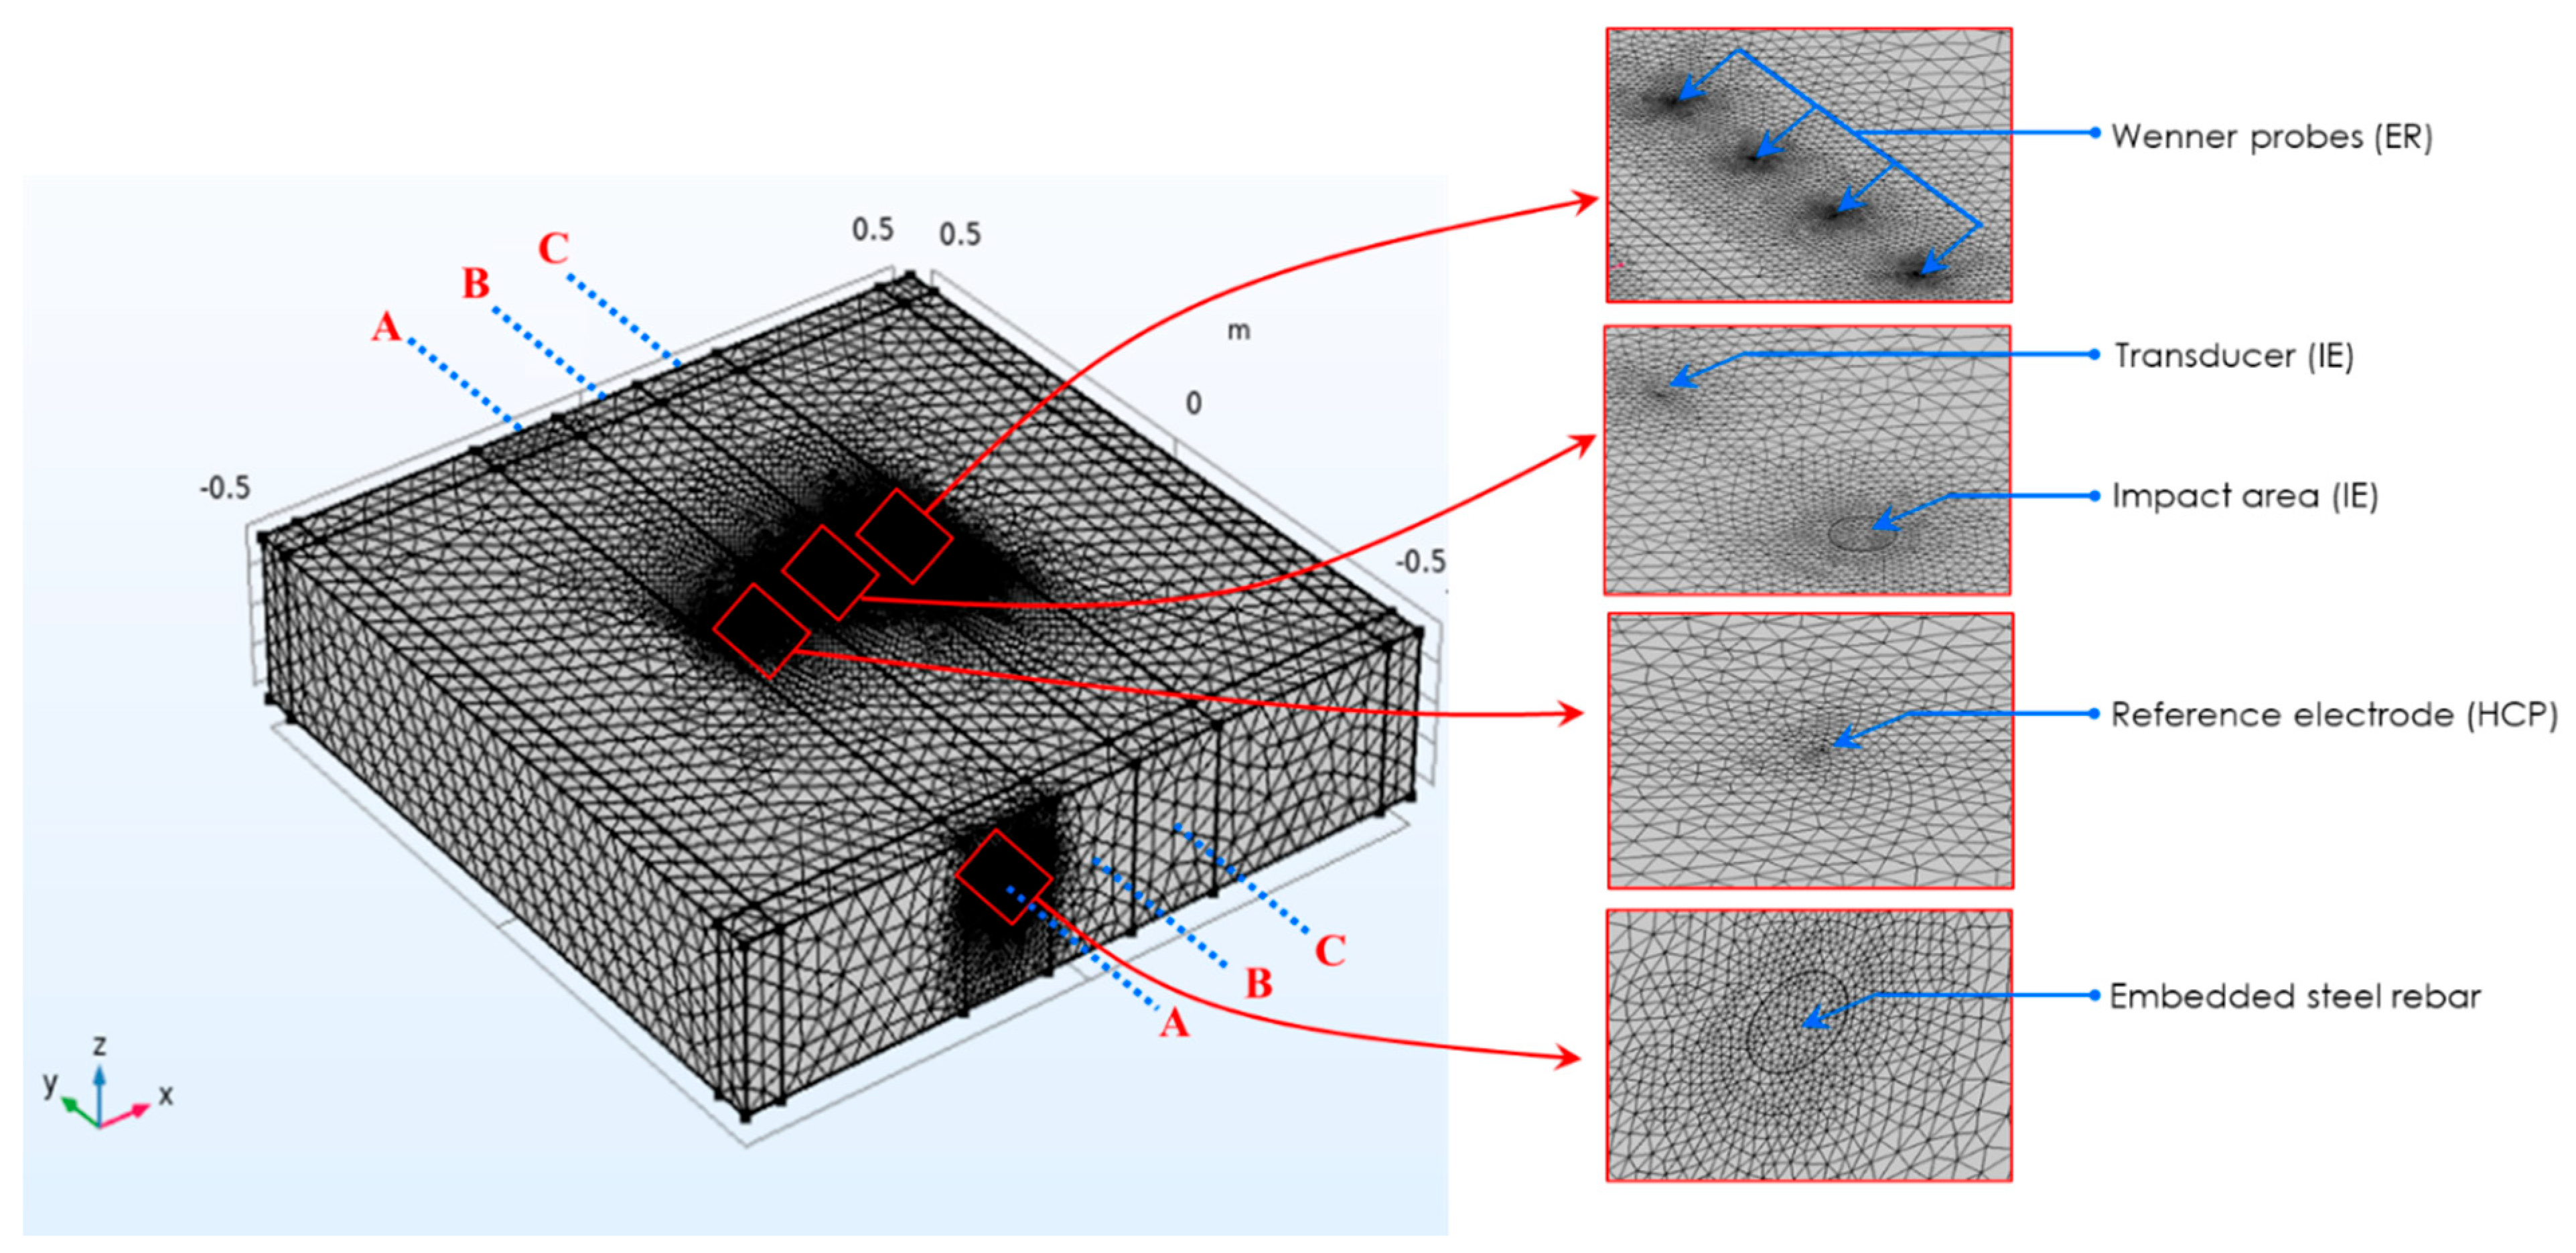
® software, and each NDE technique was given its own unique set of parameters and criteria to account for its distinct properties. The objective was to build a single model that could simulate the three NDE technologies of interest in this study (the half-cell potential, electrical resistivity, and impact echo (IE)) and to examine the effect of different parameters on their measurements. The software was used to integrate properties of interest for all three technologies into a single model, allowing for the simultaneous simulation of measurements by the three NDE technologies. The concrete slab was modeled as a block with dimensions of 1.0 m × 1.0 m × 0.2 m, with Perfect Match Layers (PMLs) that simulated the absorbing boundaries of the four sides to avoid the reflection of elastic waves from the sides for the impact echo measurement. The model components, including various NDE probes, are illustrated in
Figure 1. The model was sliced for meshing purposes, allowing for finer discretization during the solution process. Extra-fine mesh was used around the contact points of the probes of the NDE technologies, such as around the electrodes of the Wenner probe for ER, around the HCP reference electrode, around the transducer and impact area for the impact echo, and around the embedded steel bar. The reason for creating an extra-fine mesh is to achieve precise simulations of the electrical field distribution for ER, wave propagation for the IE, and potential differences for the HCP. The maximum element size for the free tetrahedral element is 0.001 m, with a growth factor equal to 1.2. Additionally, the model components encompass defects, such as the corrosion of steel bars and delamination inside the concrete slab, which were incorporated within the scope of this study.
Five parameters were included to investigate their impact on the interpretation of NDE measurements. The five parameters chosen for this study include the degree of saturation (DoS), rebar corrosion length (CL), delamination depth (DL), concrete cover thickness (CC), and delamination moisture content, whether it is air-filled delamination (AFD) or water-filled delamination (WFD). This chapter focuses on changes in the electrical field and resistivity of the concrete deck that occur as a result of these parameters and the corresponding HCP and ER measurements. The results from the simulation will be utilized for the development of machine learning algorithms. The impact of these parameters is determined by conducting several parametric studies. Below is a description of the variations in the five parameters in this study.
Degree of saturation (DoS): A variety of saturation levels were selected to investigate the influence of pore saturation on the NDE measurements. These values span different saturation conditions that a structure may encounter. Seven saturation levels were chosen, covering a range from 20% to 80% in increments of 10%.
Corrosion length (CL): The term “corrosion length” refers to the length of the anode portion of the steel reinforcing bar. A set of eight values was selected to simulate the corrosion length, which ranges from 2.5 cm to 35 cm in increments of 5 cm.
Delamination depth (DD): A set of six values was selected to reflect various depths of delamination. These values range from 40 mm to 90 mm below the surface of the concrete deck in increments of 10 mm.
Concrete cover (CC): The concrete cover thickness has a substantial impact on the HCP measurement readings due to the presence of non-uniform corrosion on the steel bars. A set of four values were selected to represent the concrete cover thickness: 38 mm, 51 mm, 63 mm, and 76 mm.
Delamination moisture condition: Two values were selected to simulate the moisture condition of the delamination within the concrete deck for this parameter. The first case represents air-filled delamination (AFD), which simulates completely dry conditions, while the second case represents water-filled delamination (WFD), which simulates fully saturated delamination.
3.1. Half-Cell Potential Simulation Result
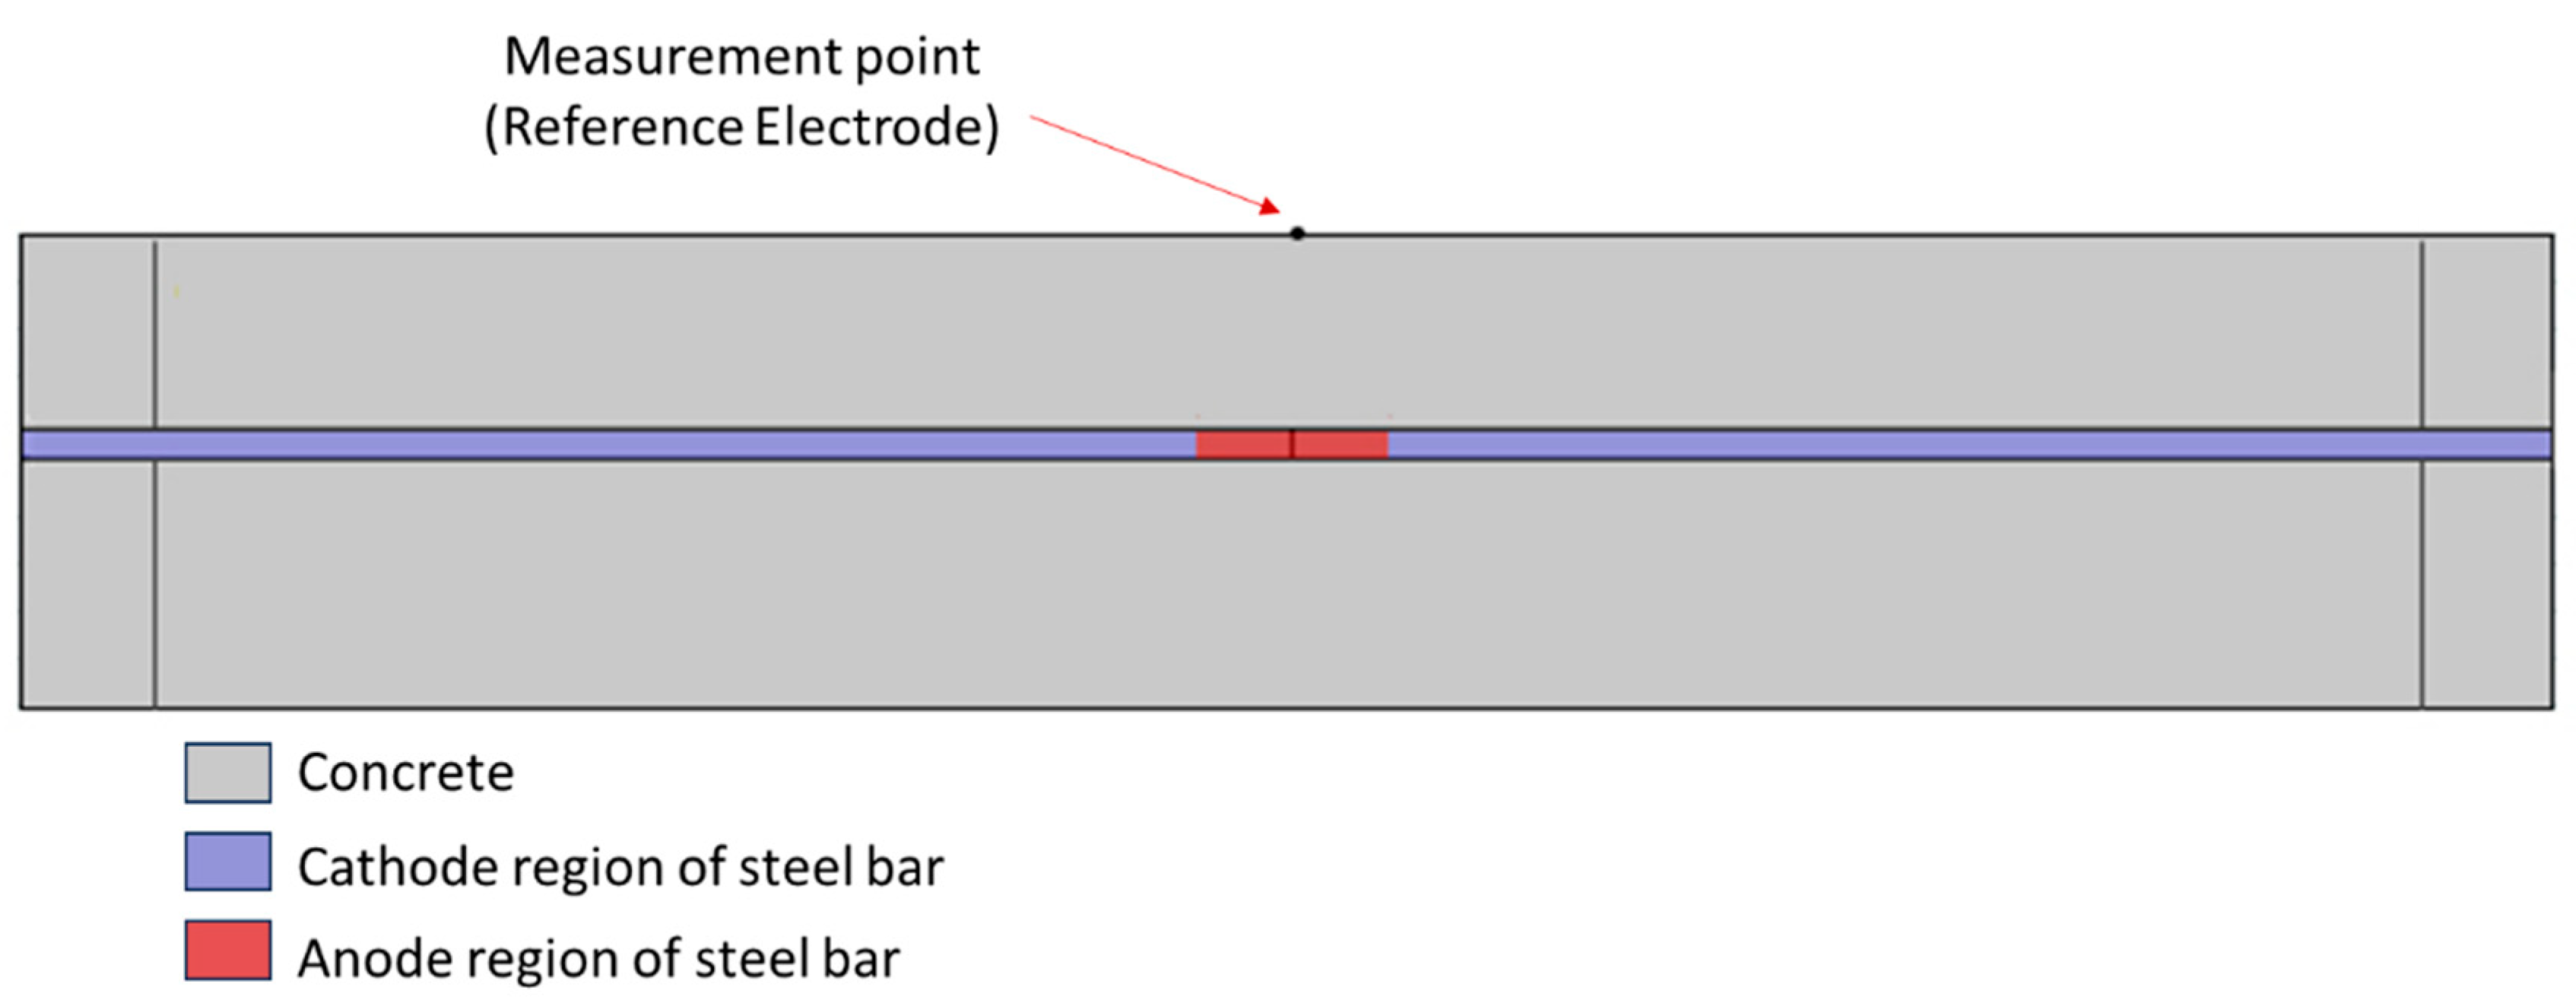
A half-cell can be simulated as an electrode placed within an electrolyte. To determine the potential difference, a reference electrode can be used on the surface of the concrete. The FE (finite element) model used to simulate the HCP (
Figure 1) is the same concrete slab that was utilized for the IE and ER technologies and has a block size of 1.0 m × 1.0 m × 0.2 m. Cross-section A-A, shown in
Figure 2, illustrates the internal steel bar, the cathodic region, and the anodic region (the active corrosion area) within the concrete.
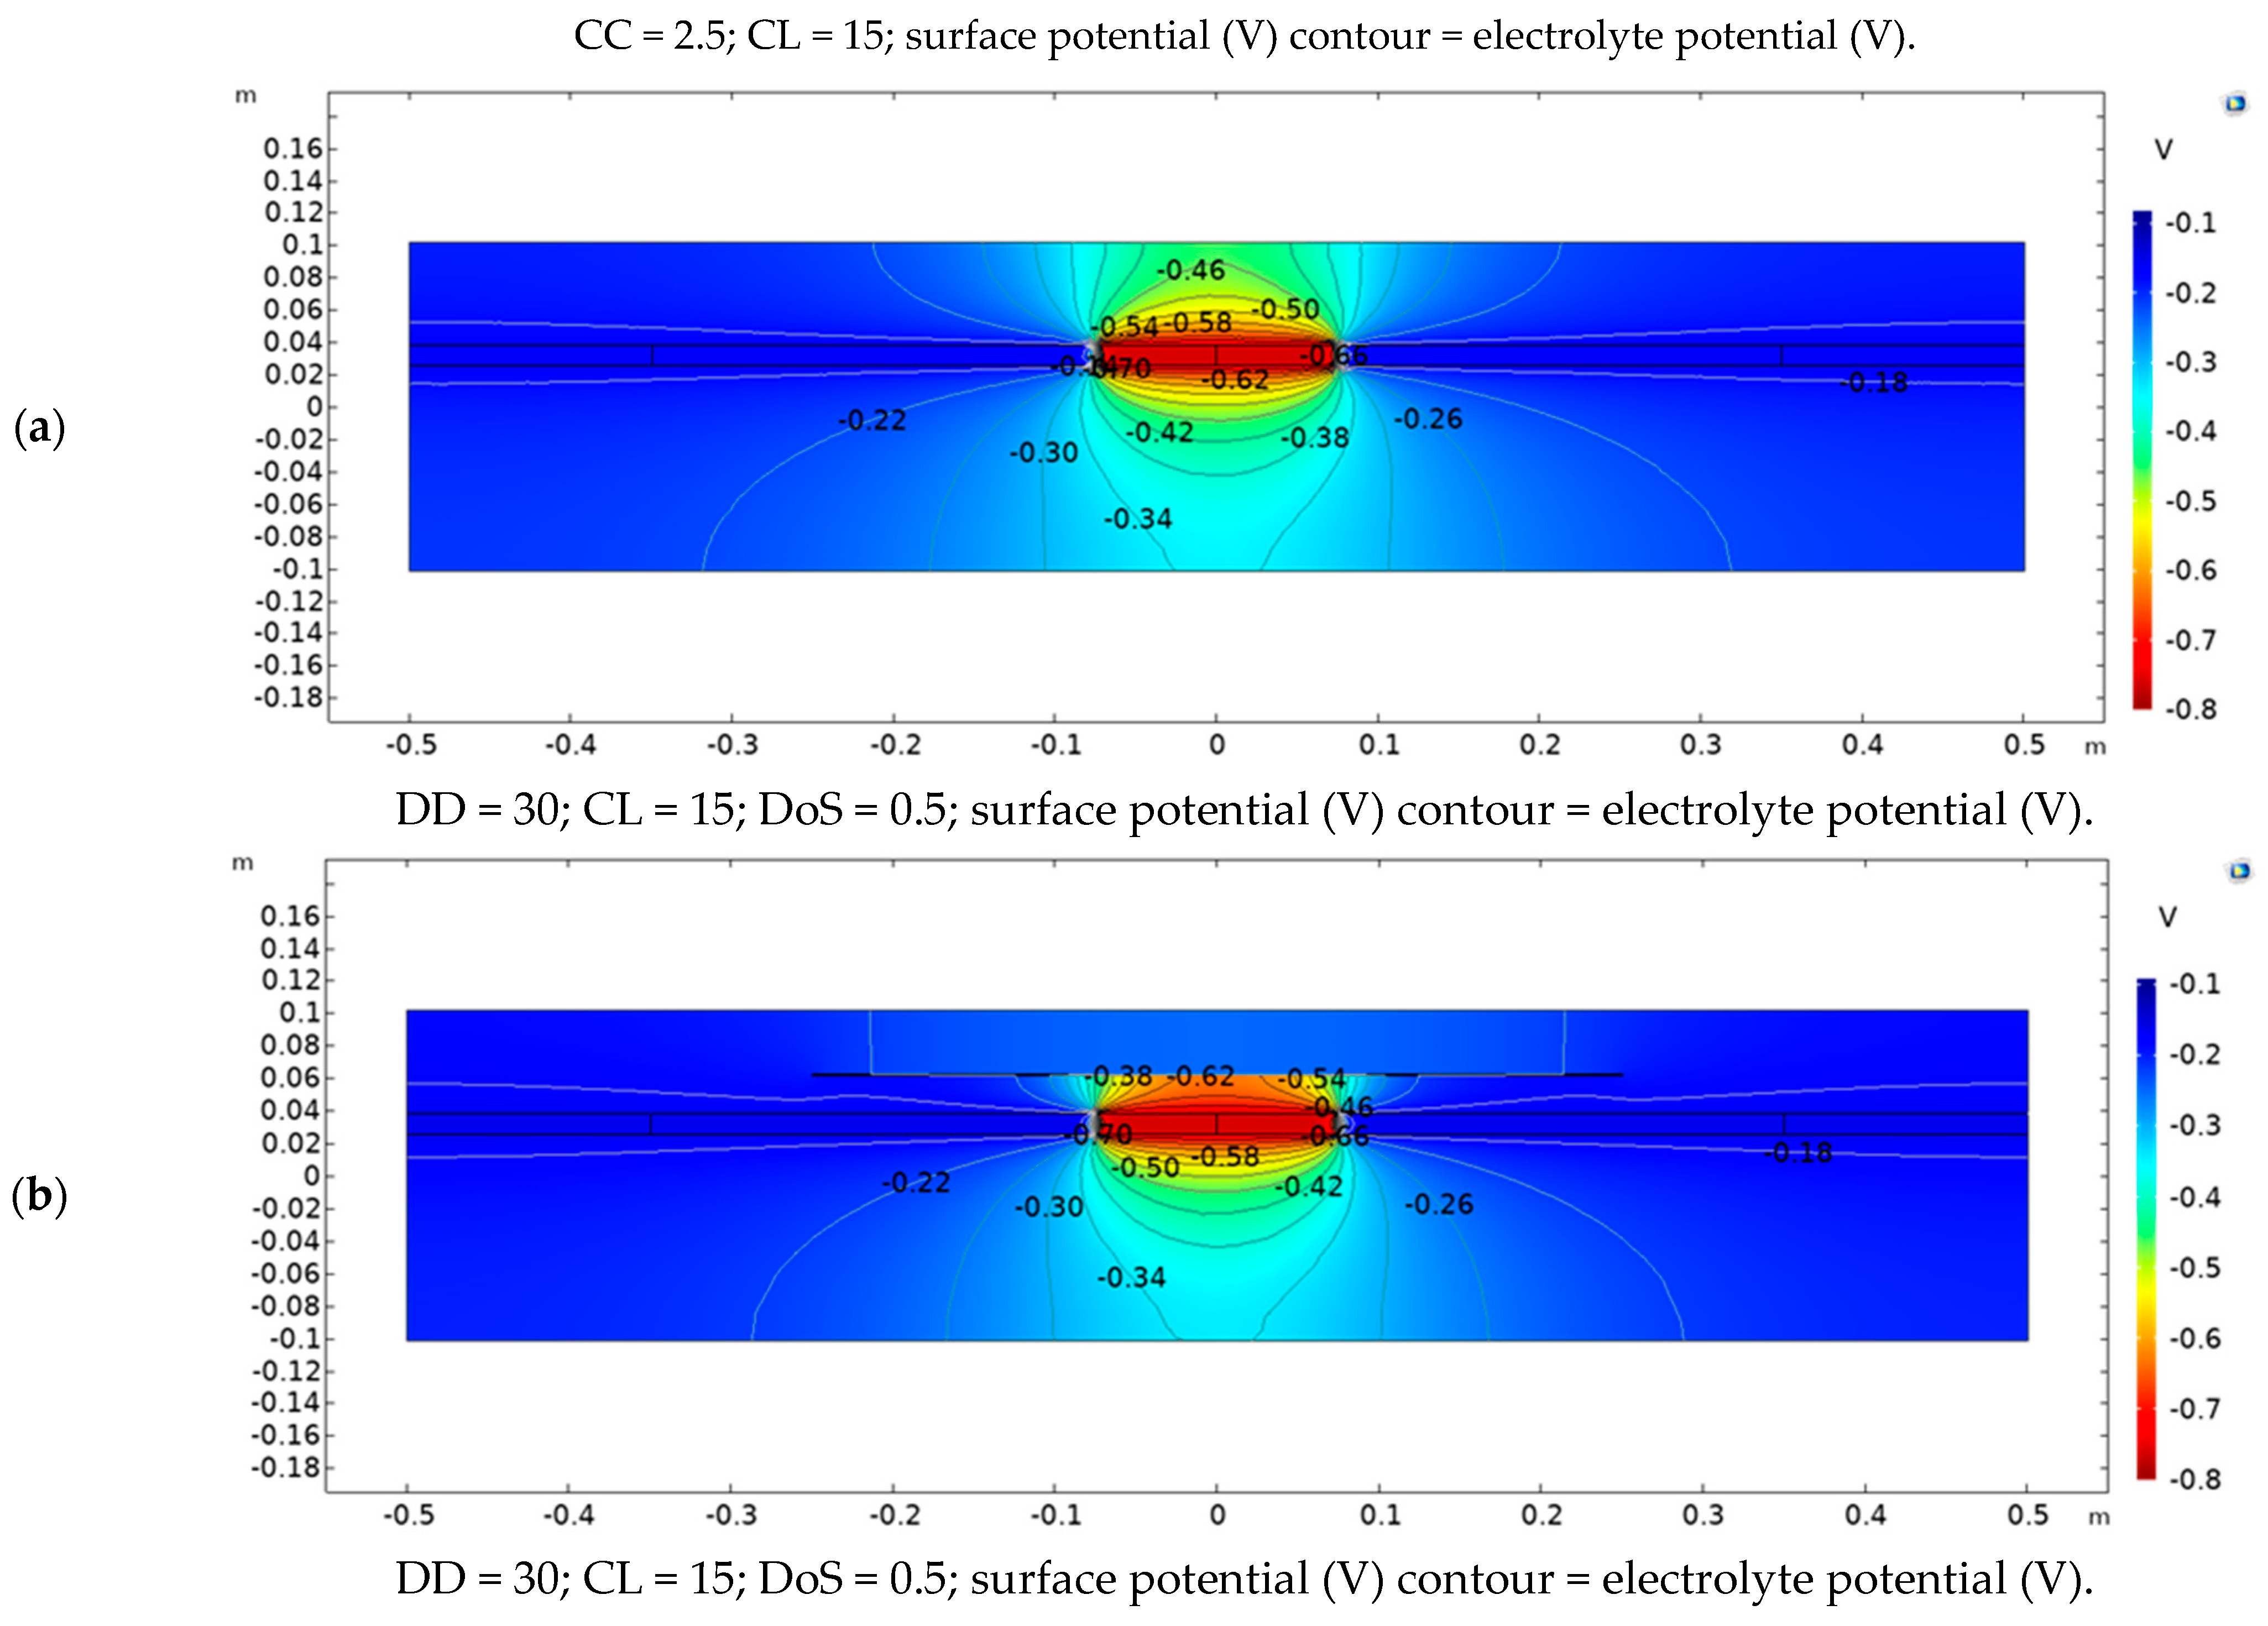
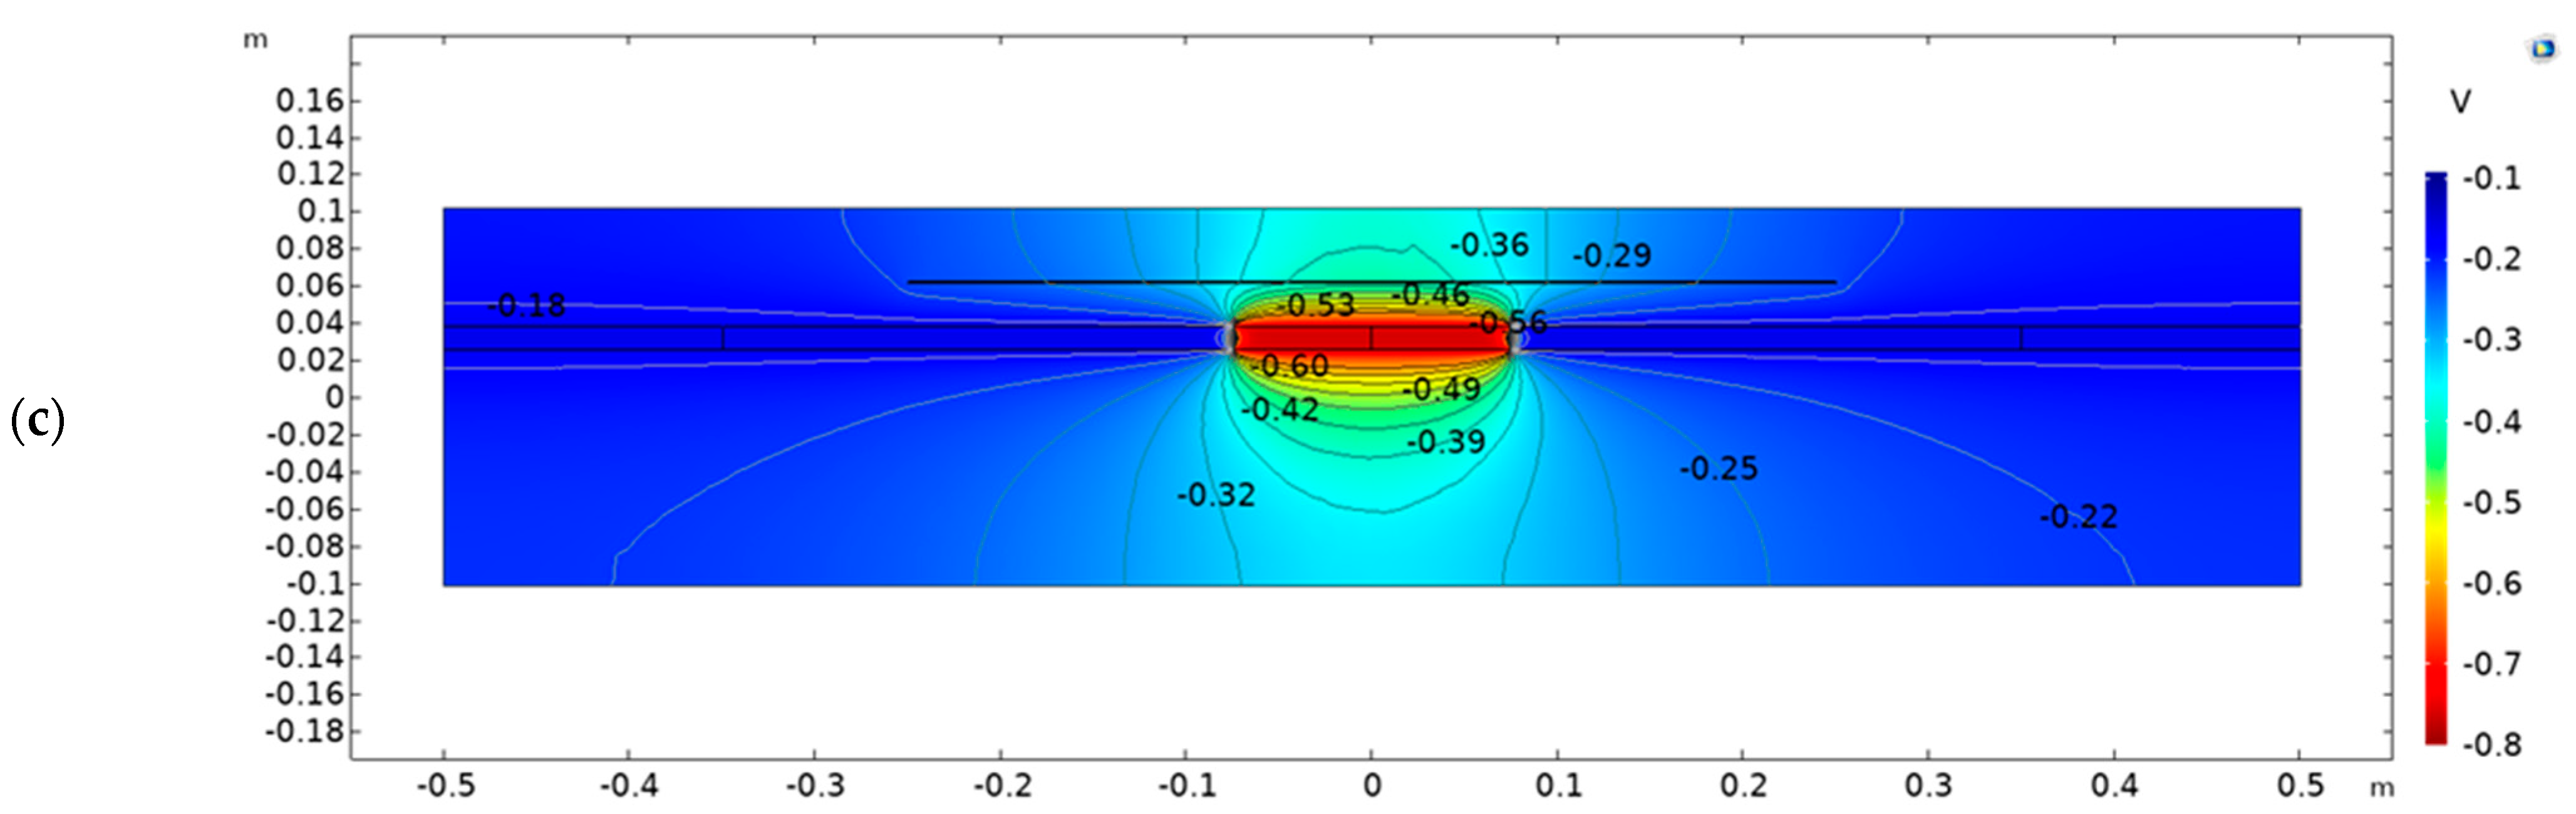
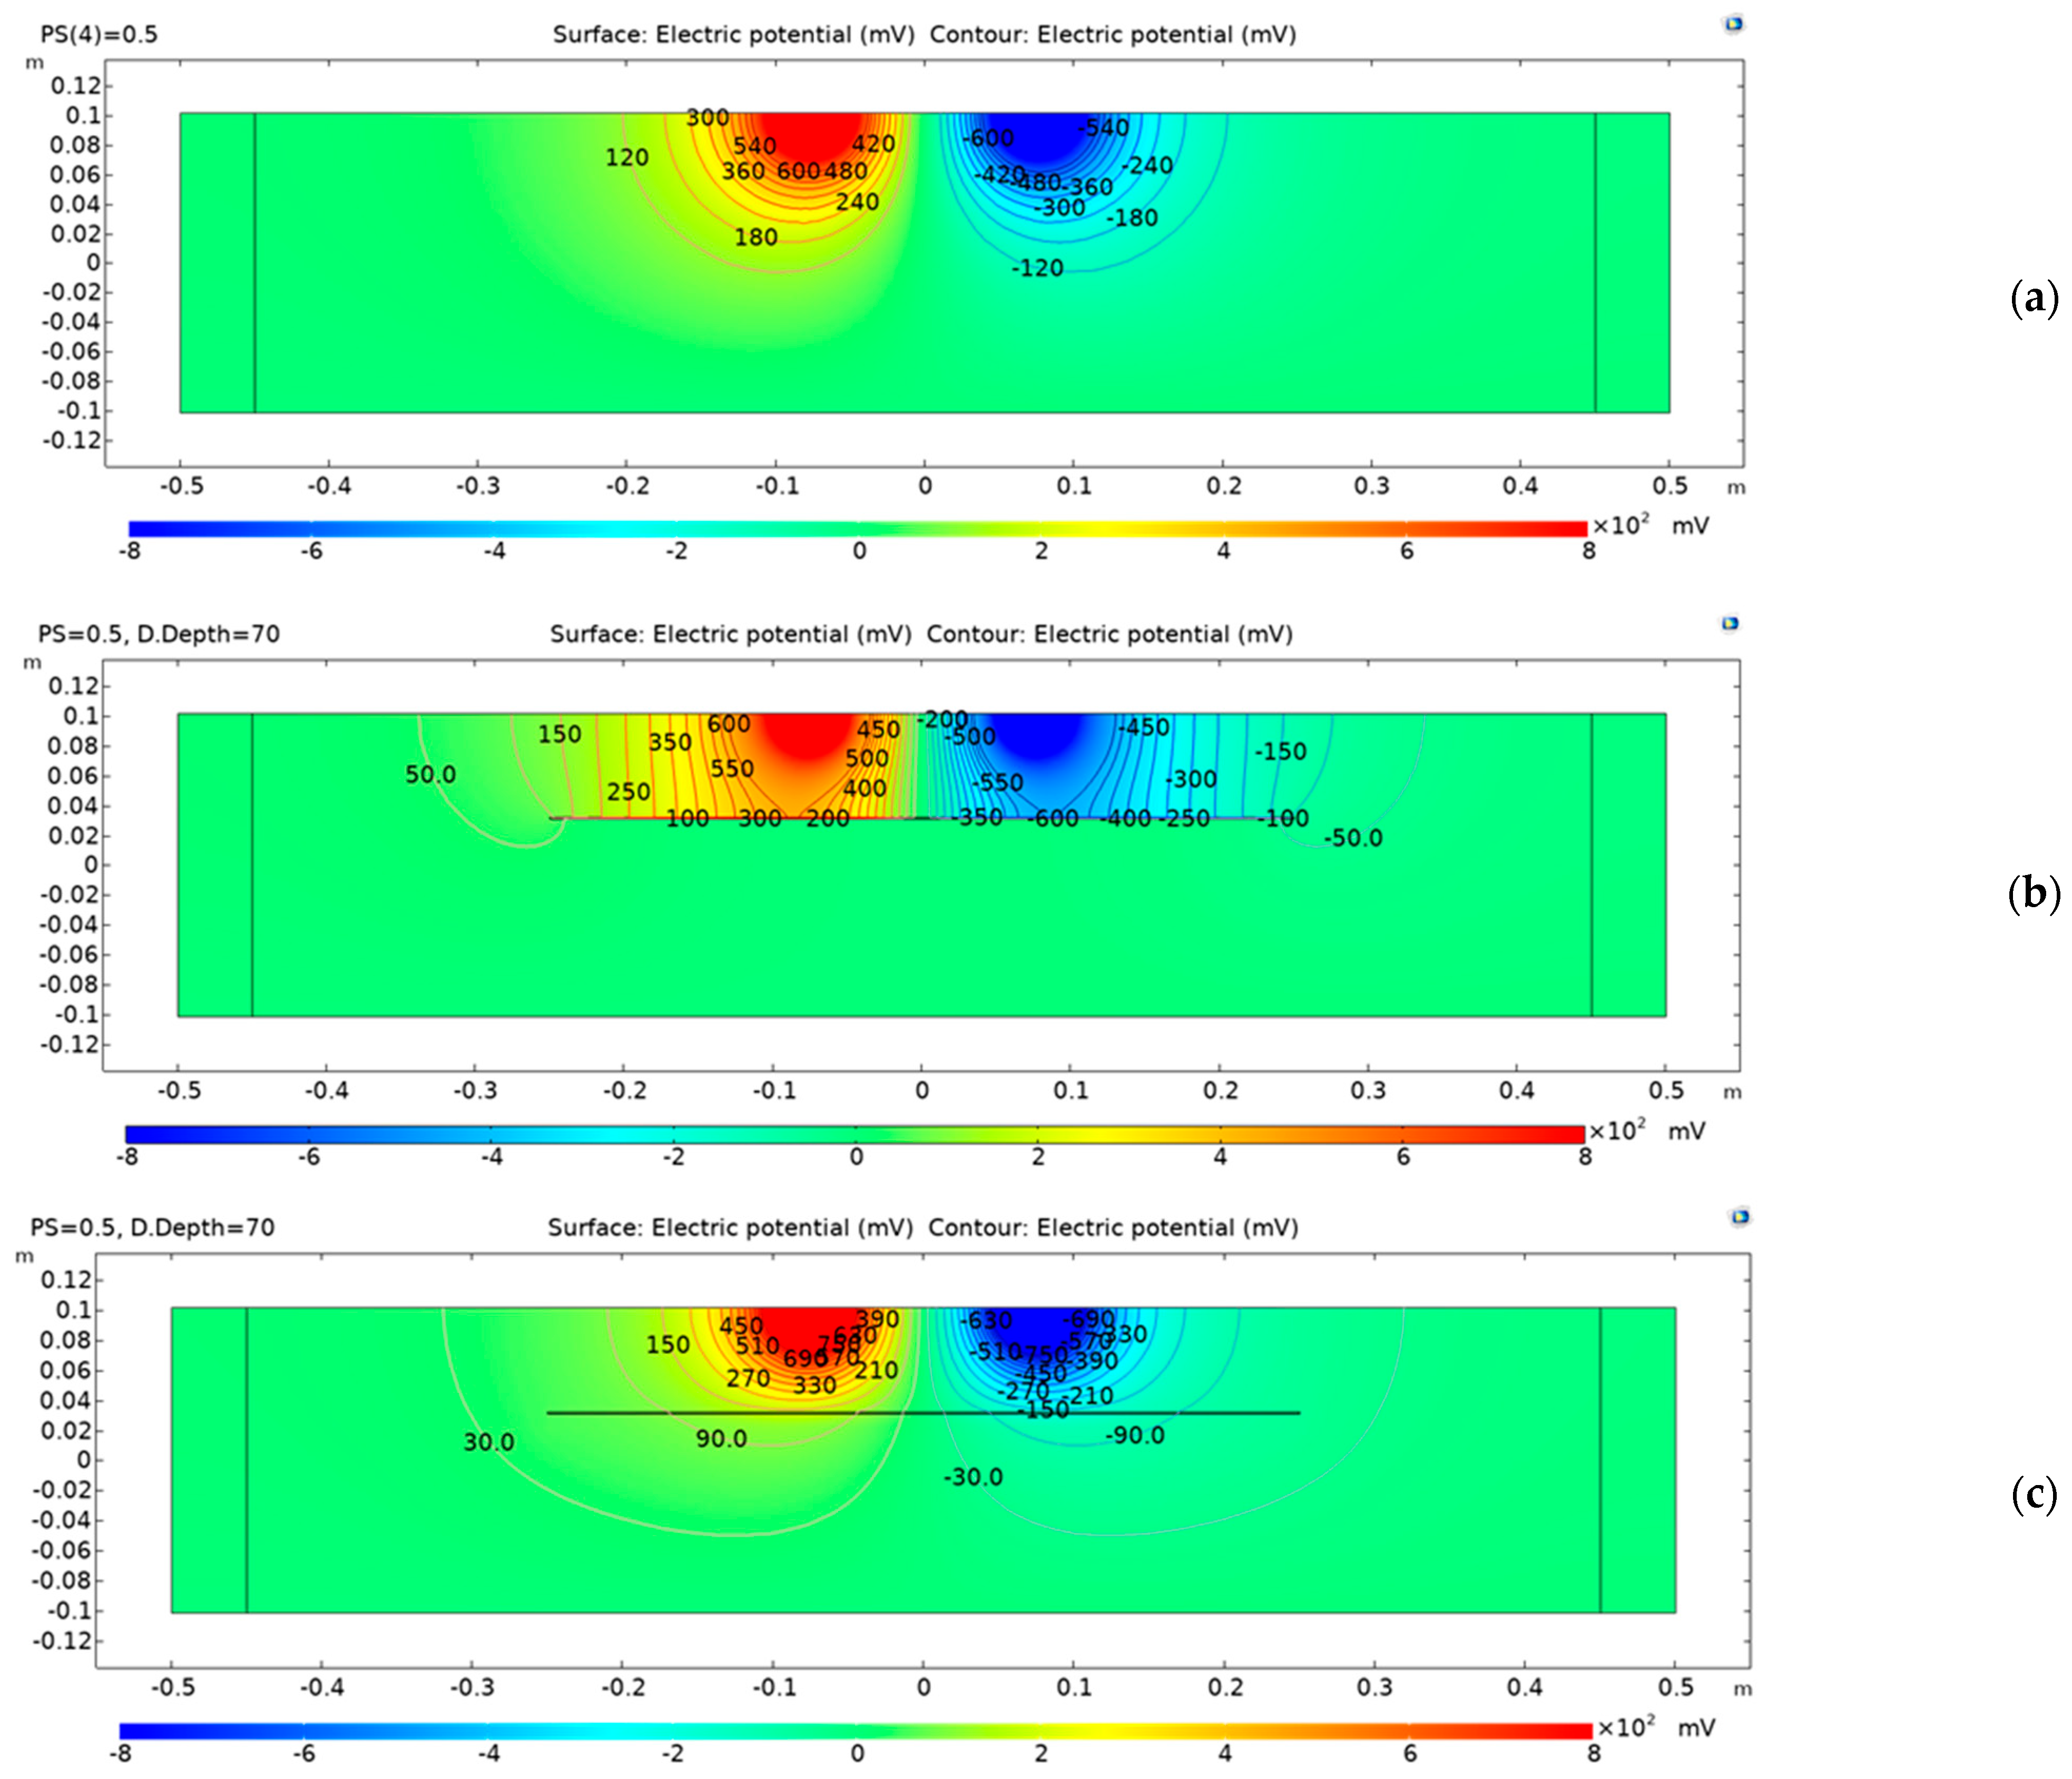
The simulation results indicate that the equipotential lines between the anode and cathode are highly sensitive to certain parameters such as shallow delamination and the saturation level of the delamination. To demonstrate the impact of these and other parameters on the electrochemical corrosion process inside concrete, different simulation scenarios are presented.
Figure 3a displays the potential distribution within concrete caused by a 15 cm length of steel rebar corrosion with 50% saturation and no delamination. On the other hand,
Figure 3b,c show the potential distribution inside concrete with the same parameters but with the presence of 30 mm deep delamination.
Figure 3b illustrates a scenario with air-filled delamination (AFD), while
Figure 3c illustrates a scenario with water-filled delamination (WFD).
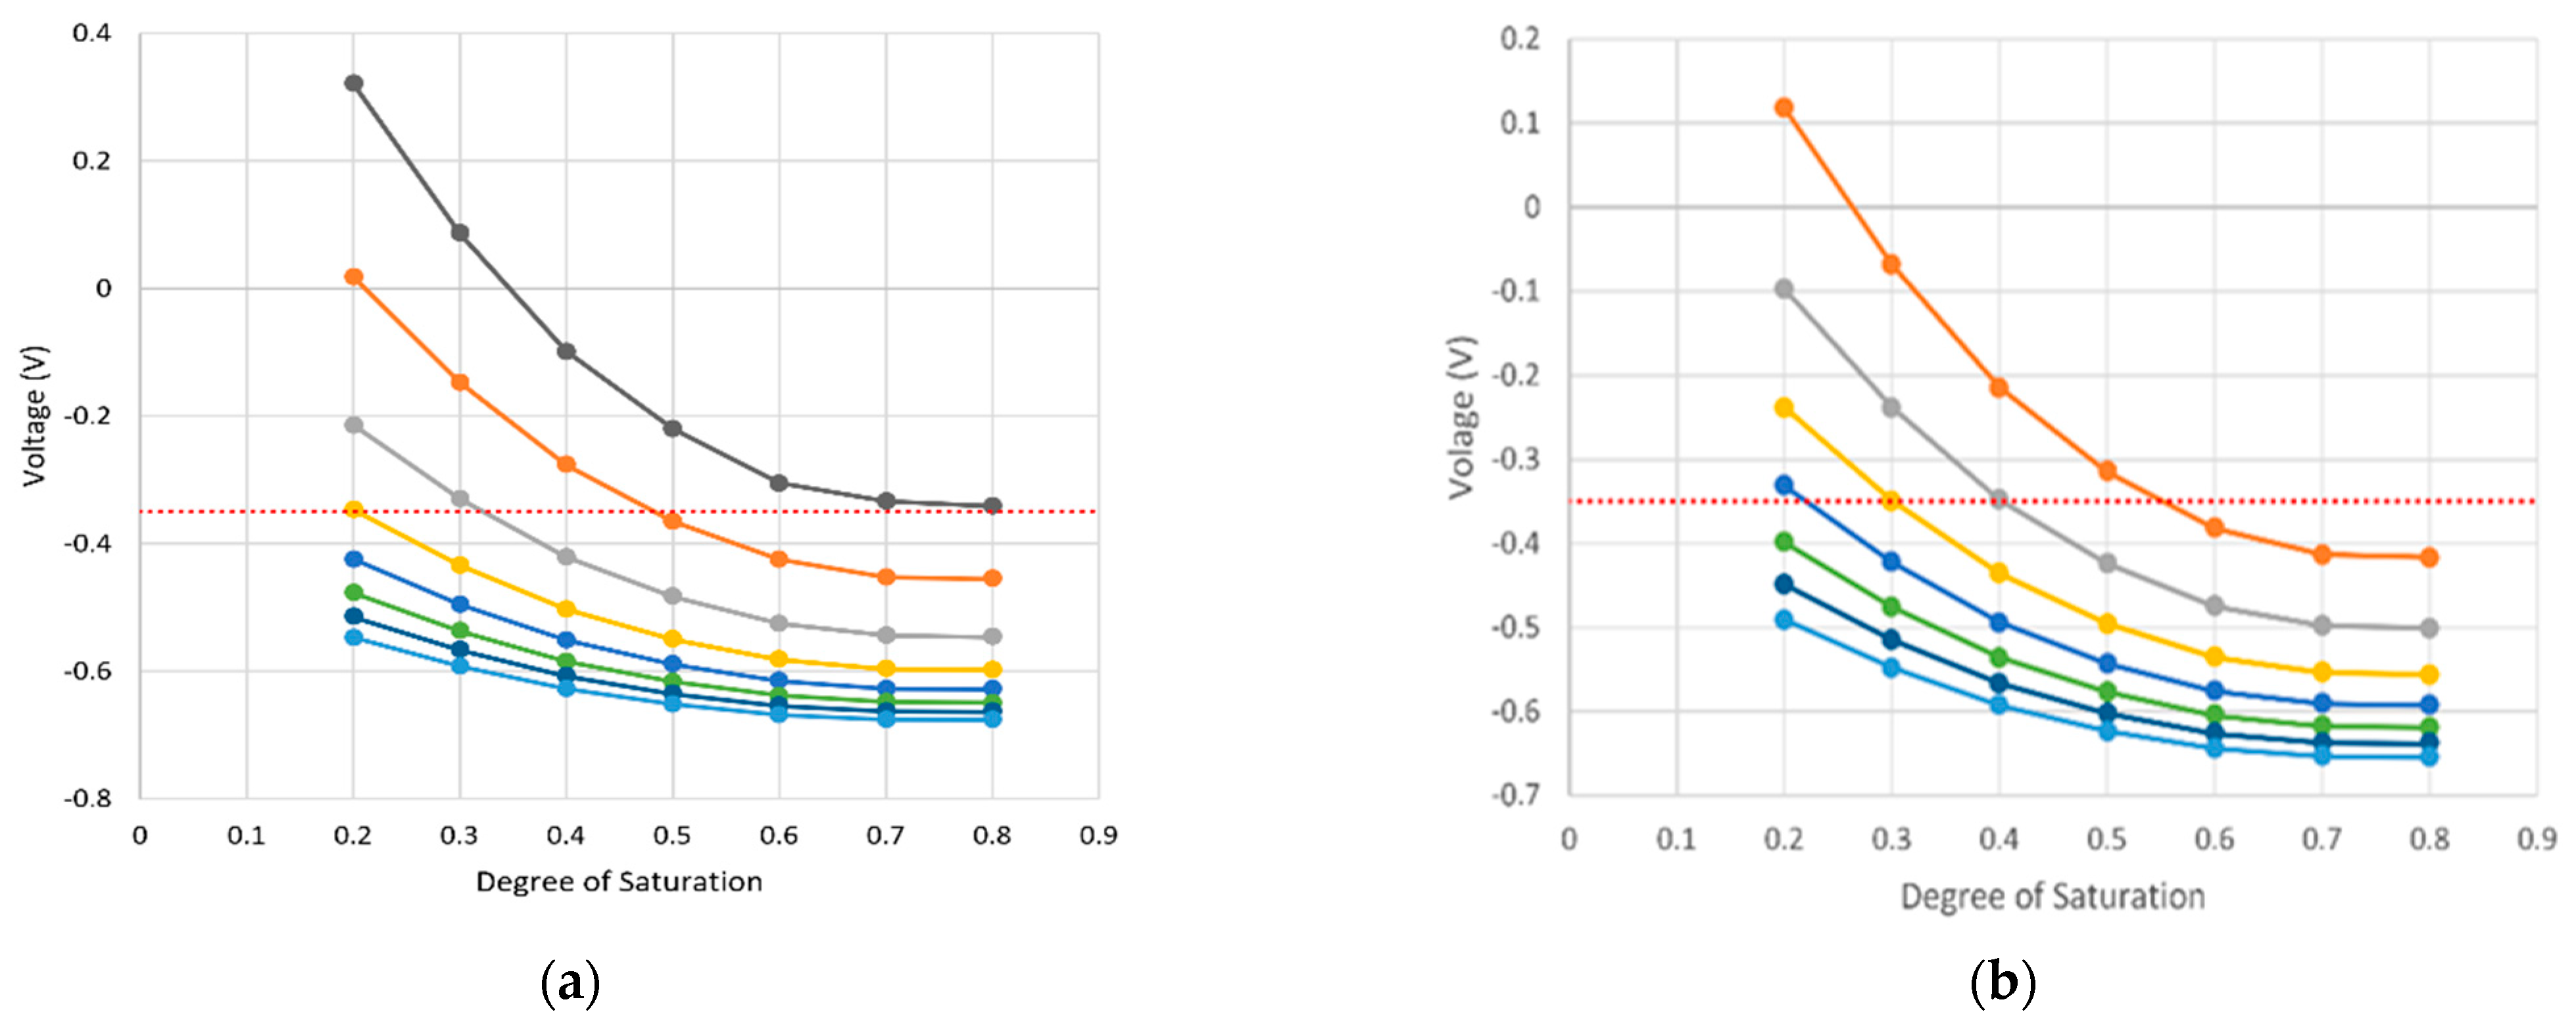
The half-cell potential (HCP) results are influenced by the physical properties of two materials, the rebar steel where corrosion occurs and the surrounding concrete, as well as the characteristics of the pores that regulate electrolyte flow. The results of the HCP are impacted by all five parameters analyzed in this study. In general, the HCP results are positively correlated with both the corrosion length (CL) and the degree of saturation (DoS). As these two parameters increase, the measured potential becomes more negative. Conversely, HCP results are negatively correlated with increases in the concrete cover (CC) and delamination depth (DD).
Figure 4 presents the HCP measurement values for sound concrete with varying corrosion lengths and degrees of saturation at concrete cover thicknesses of 38 mm, 51 mm, 63 mm, and 76 mm. The dashed lines in the figures describe the boundary of the 90% probability of an active corrosion zone according to the standard specification ASTM C876-15.
In
Figure 4a, it can be seen clearly that the corrosion length of 2.5 cm cannot be detected using the HCP as the potential is larger than the threshold for all values of the DoS. Also, the minimum detectable corrosion length is 5 cm with a DoS equal or greater to 0.5, 10 cm with a DoS equal or greater to 0.4, and 15 cm with a DoS equal or greater to 0.3. Furthermore, a corrosion length that is greater than 20 cm can be detected in all values of the DoS. These behaviors change with the change in the concrete cover, as shown in
Figure 4b–d.
3.2. Electrical Resistivity Simulation Results
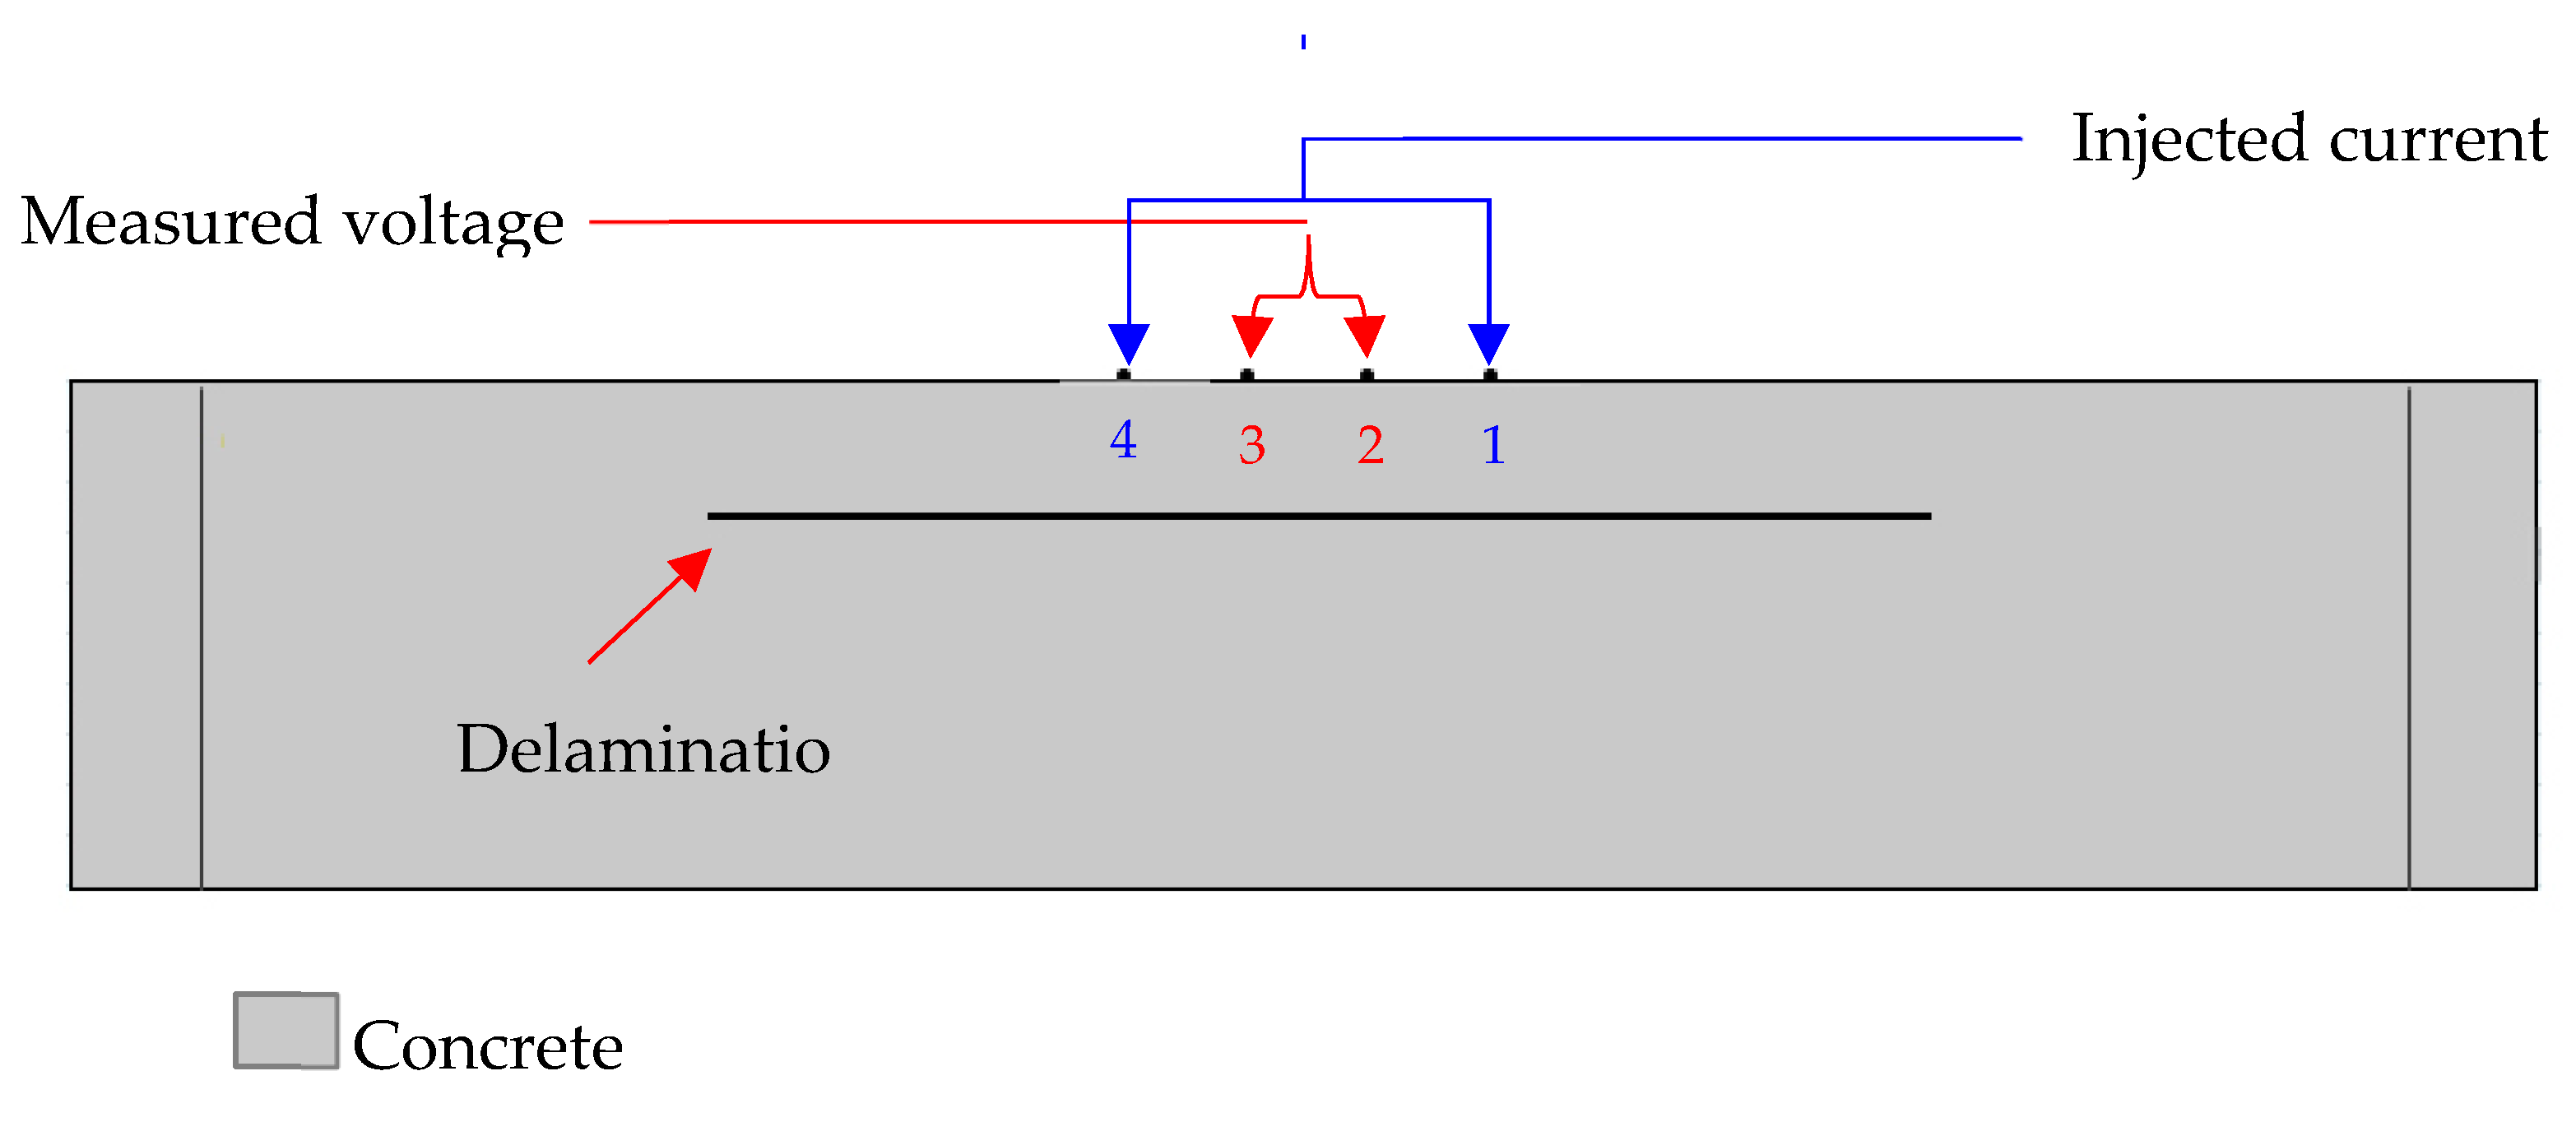
The concrete slab model used for the ER simulation is the same one utilized for the HCP simulation and is represented as a block measuring 1 m × 1 m × 0.2 m. The center of the ER model contains the probe contact area, represented by four electrodes spaced 5 cm apart. The ER technology simulation was carried out by mimicking the operation of the Resipod Proceq probe (according to the Resipod Proceq manual, 2017). This probe injects a current of 200 μA from the two outer electrodes, while the two inner electrodes measure the potential difference in the resulting electrical field, as illustrated in
Figure 5. Specifically, probe No. 1 has a current intensity of +200 μA, and probe No. 4 has a current intensity of −200 μA.
Table 1 displays the electrical conductivity values for concrete, water, and air used in the model. Concrete’s conductivity of 0.002 S/m corresponds to a resistivity of 500 Ω.m.
The electrical potential distribution measured in (mV) at the C-C cross-section (
Figure 1) for the sound concrete is shown in
Figure 6a. The models containing air-filled delamination (AFD) and water-filled delamination (WFD) are shown in
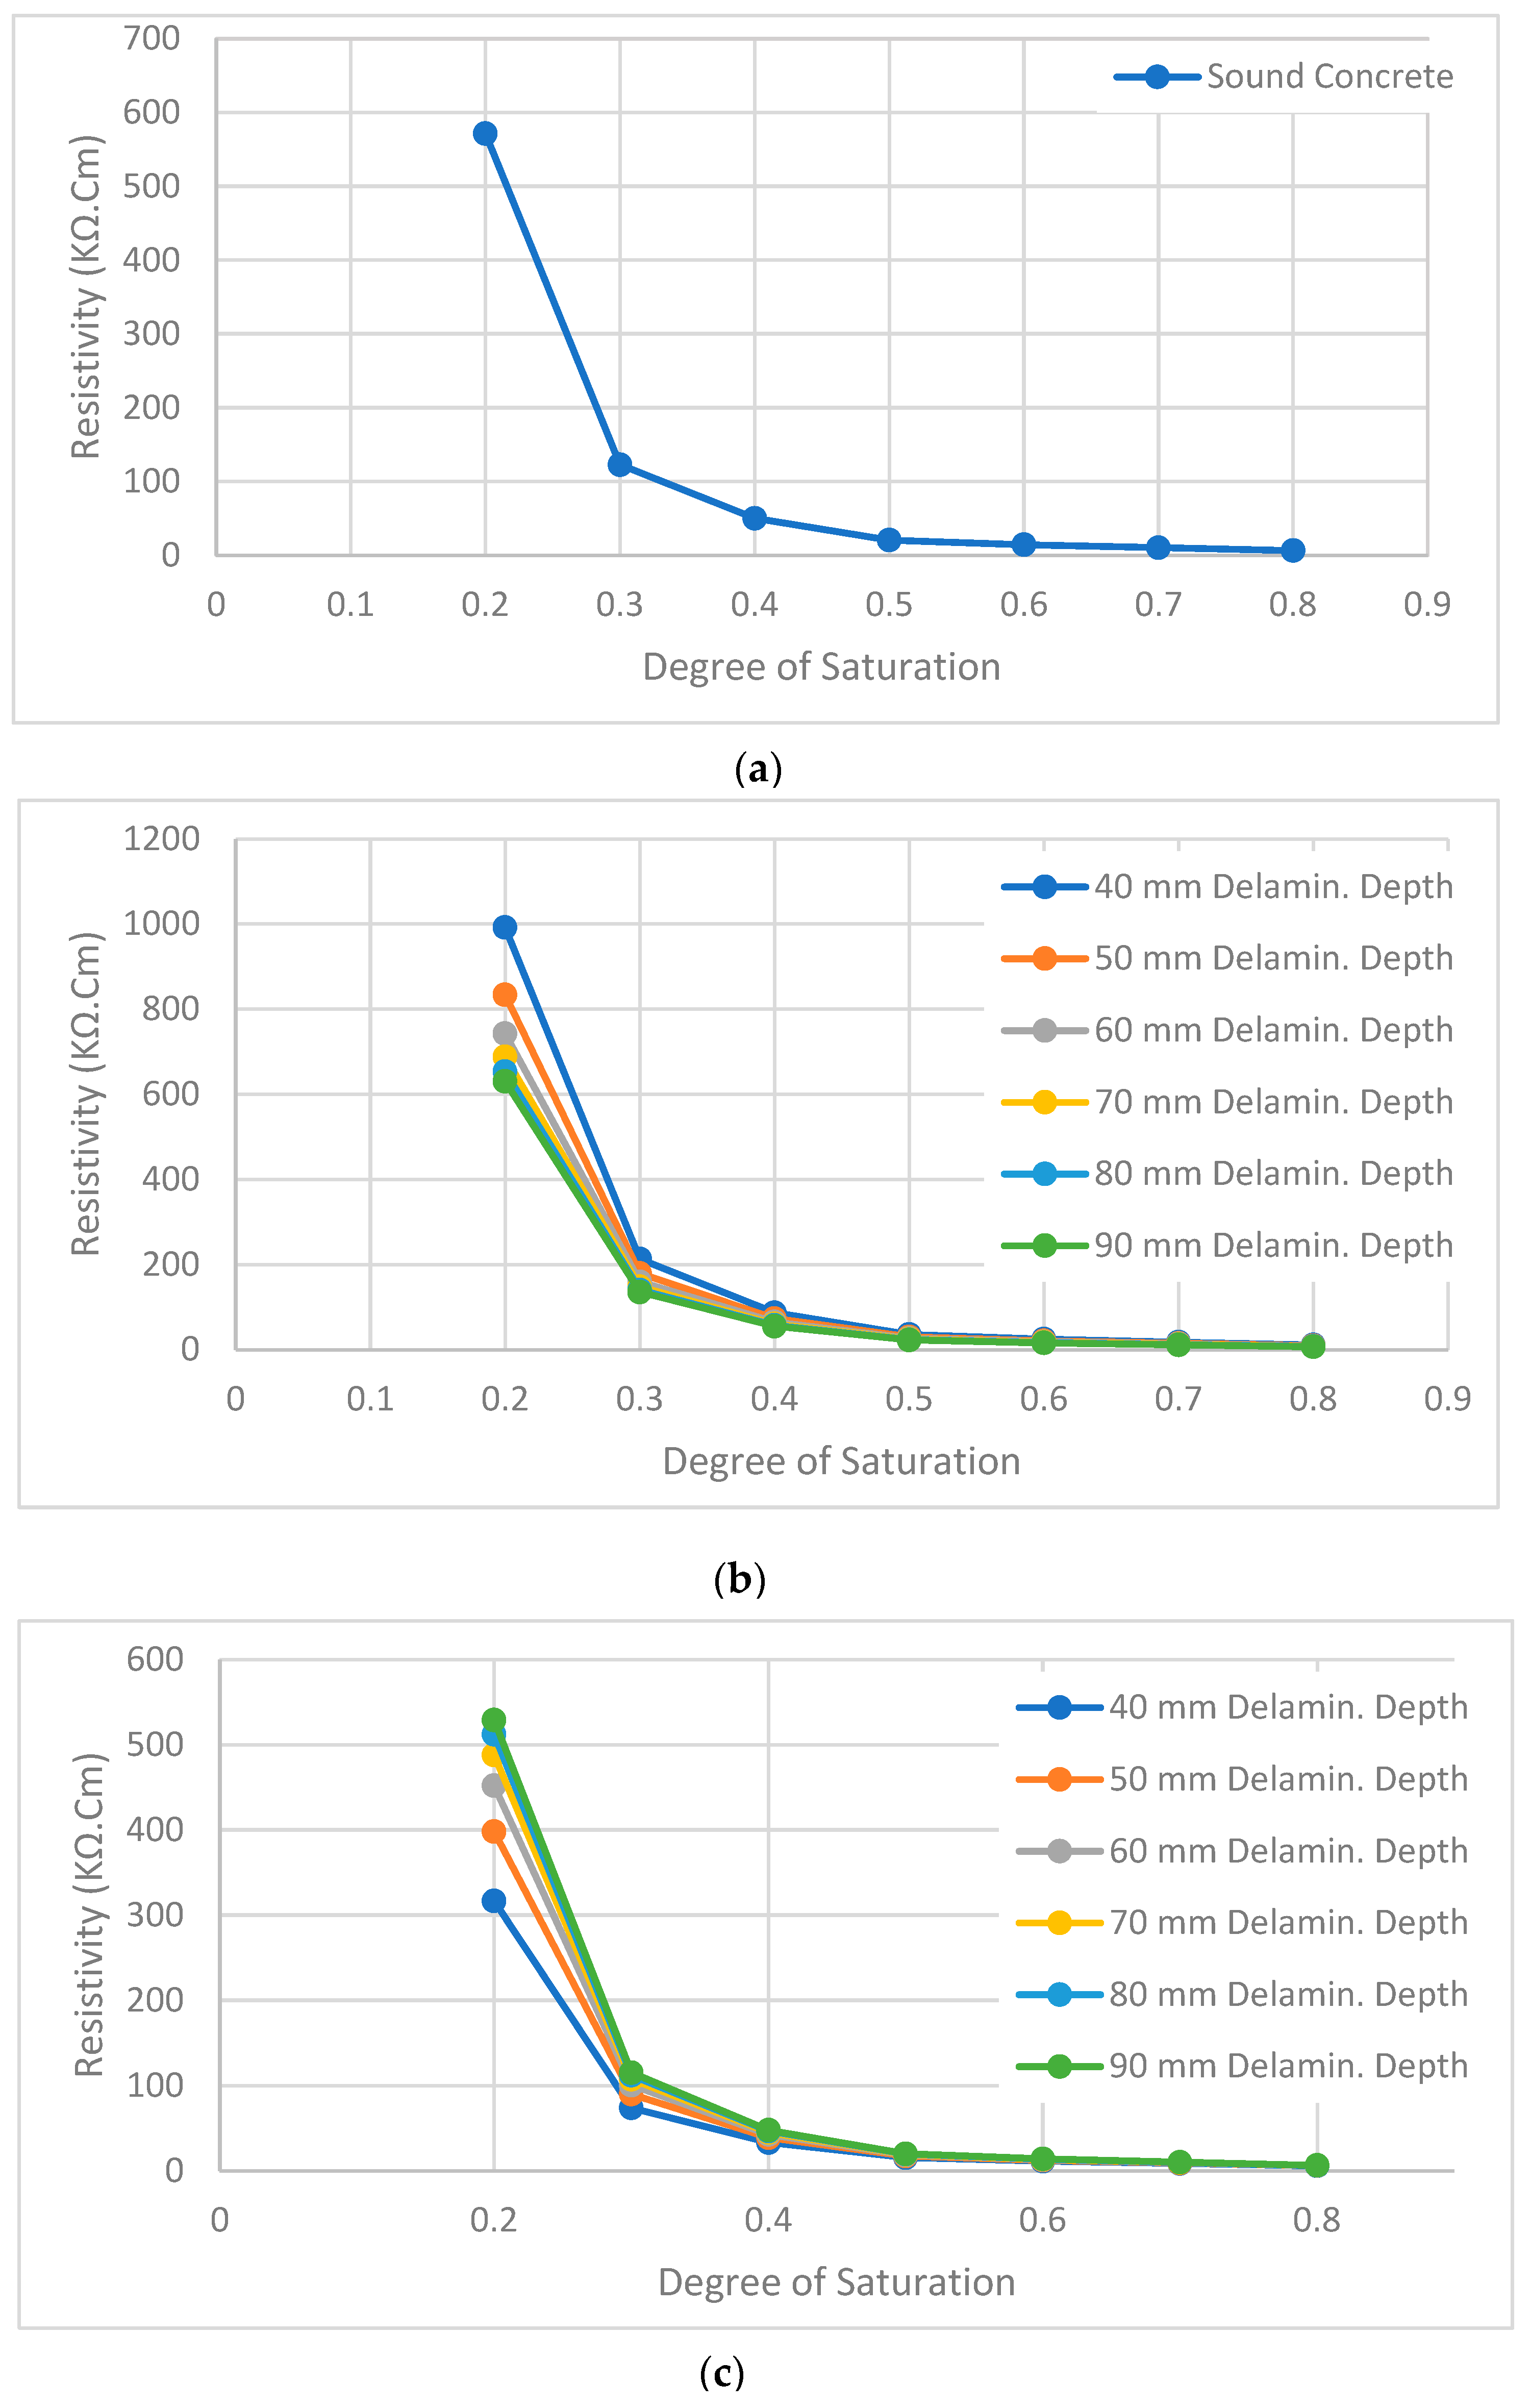
Figure 6b,c, respectively. The simulation results indicate that the measurement of ER technology is highly affected by the level of saturation, the presence and depth of delamination, and the moisture condition of the delamination. As a result, several models were developed to assess the effects of these factors. The ER modeling results highlight a significant impact of these parameters. Generally, the ER values are inversely proportional to the degree of saturation. However, the ER measurements are directly proportional to the depth of delamination for the WFD case and inversely proportional to the AFD case.
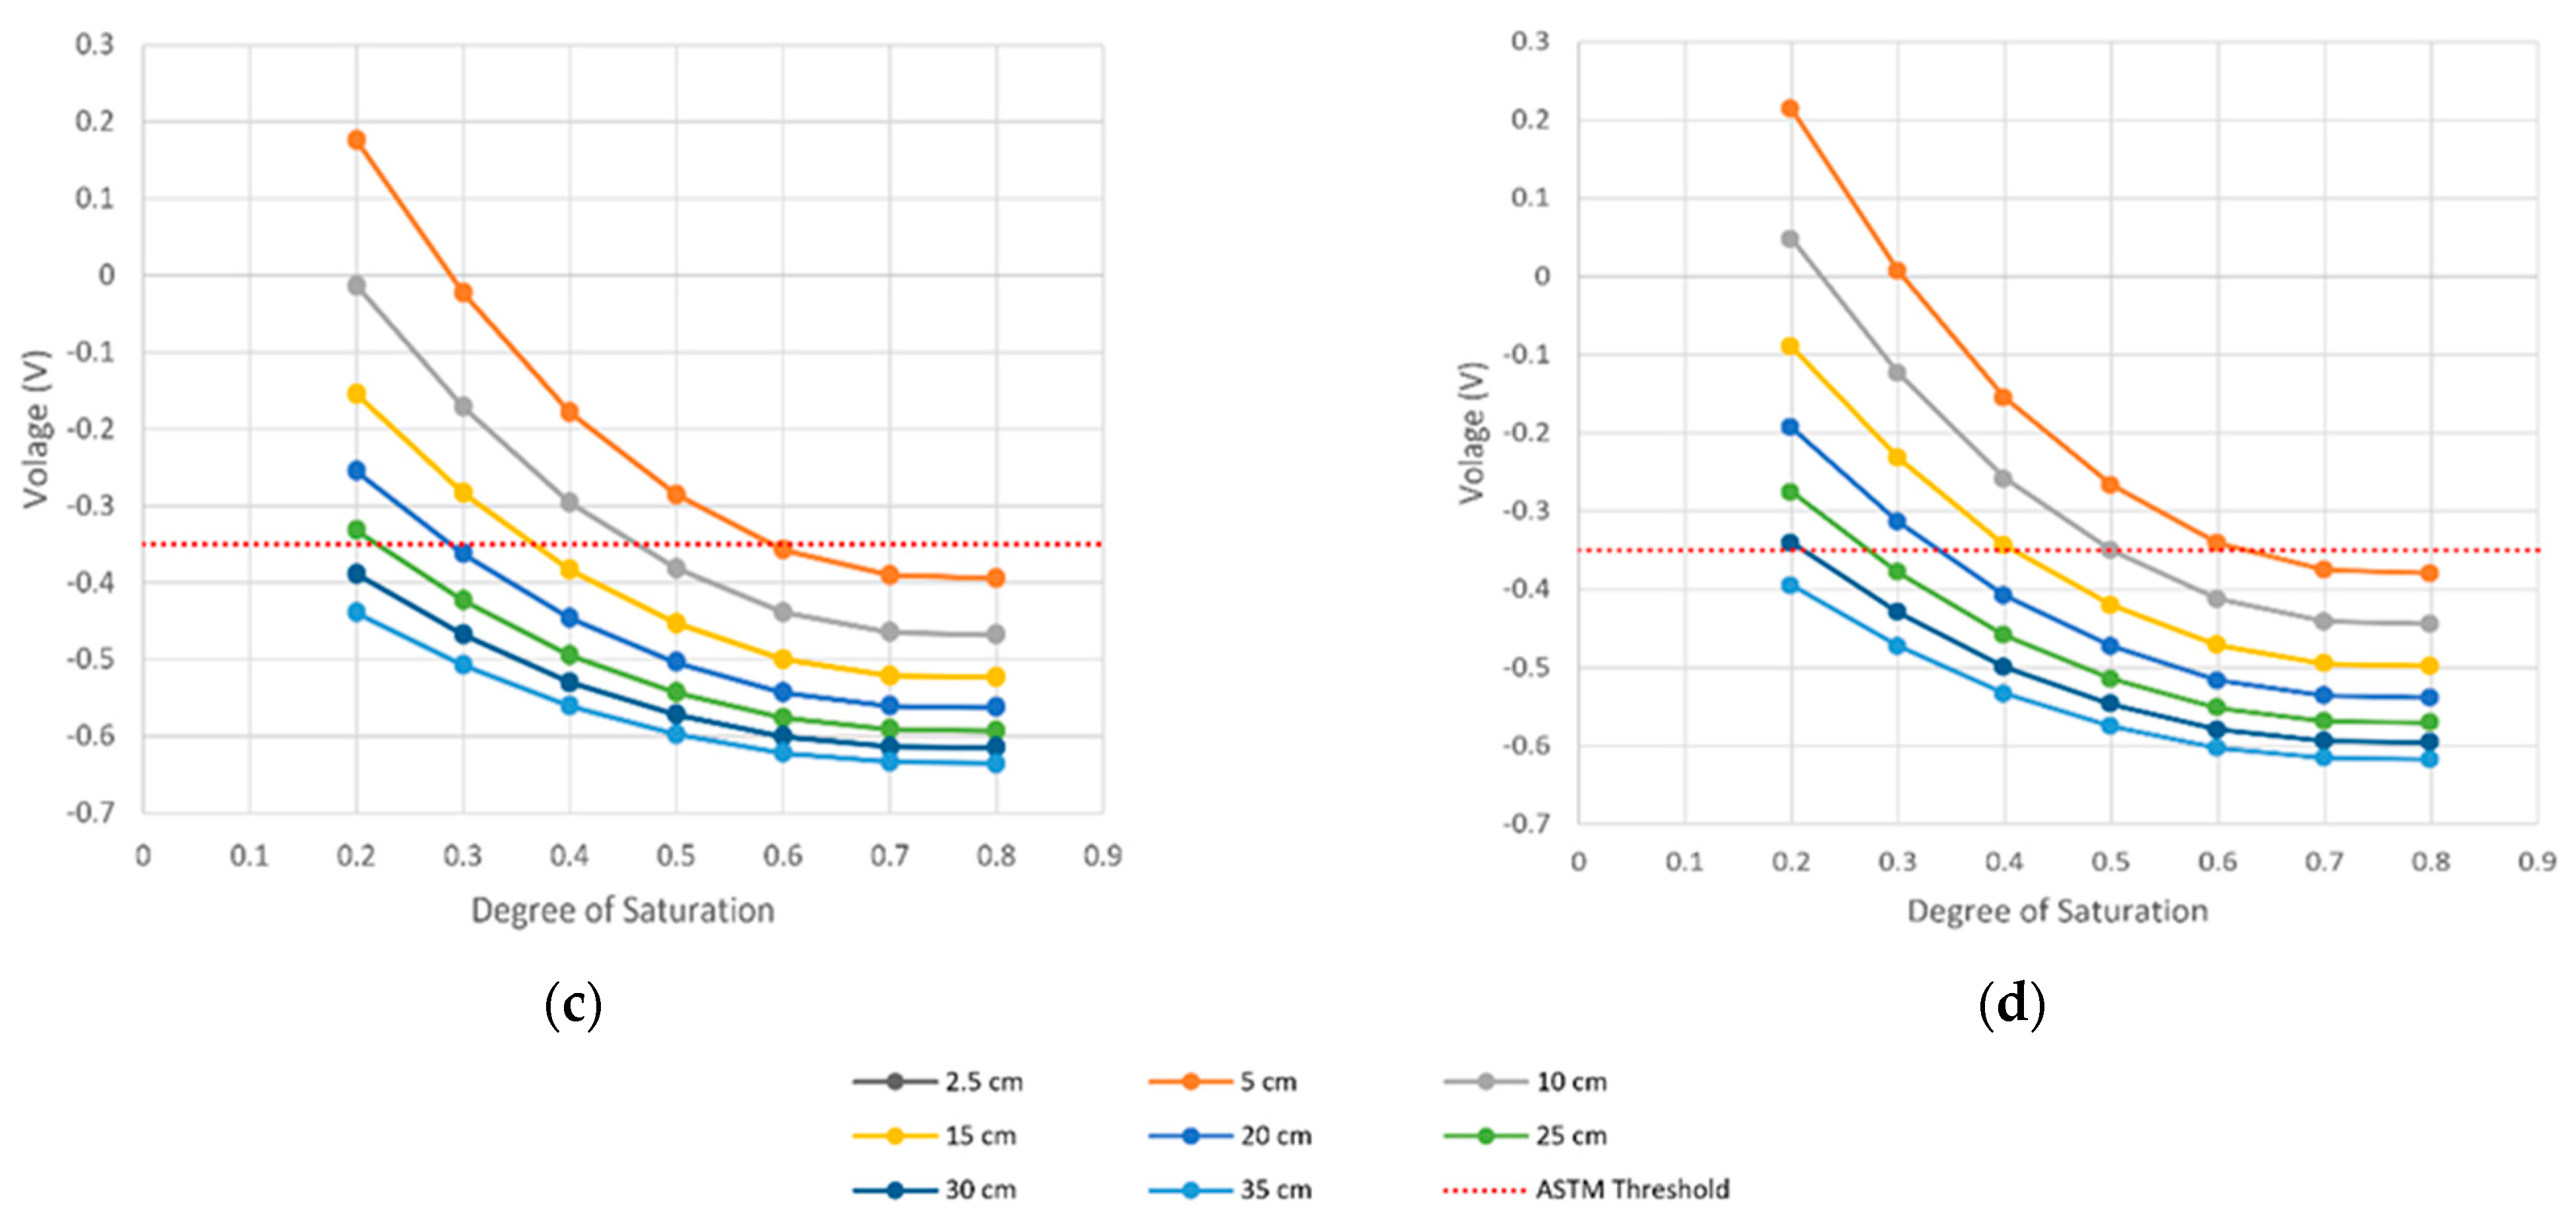
The change in electrical resistivity with the change in the degree of saturation is illustrated in
Figure 7a for the sound concrete model, where the electrical resistivity decreases as the degree of saturation increases. The impact of air-filled delamination (AFD) on electrical resistivity (ER) measurements is demonstrated in
Figure 7b by presenting the ER values for different delamination depths and degrees of saturation. The trend in electrical resistivity lines is similar to those in
Figure 7a, with a drastic decrease in resistivity in the low degree of saturation range from 0.2 to 0.3. Furthermore, the resistivity decreases as the depth of the delamination increases. This can be explained by the fact that AFD serves as an insulator as the electrical conductivity of air is close to zero. In contrast, the electrical resistivity (ER) measurements for water-filled delamination (WFD) are directly proportional to the delamination depth, as demonstrated in
Figure 7c. This can be attributed to the higher electrical conductivity of water compared to concrete. Again,
Figure 7c shows a sharp decrease in ER values for all delamination depths in the low degree of saturation range from 0.2 to 0.3.
3.3. Impact Echo Simulation Results
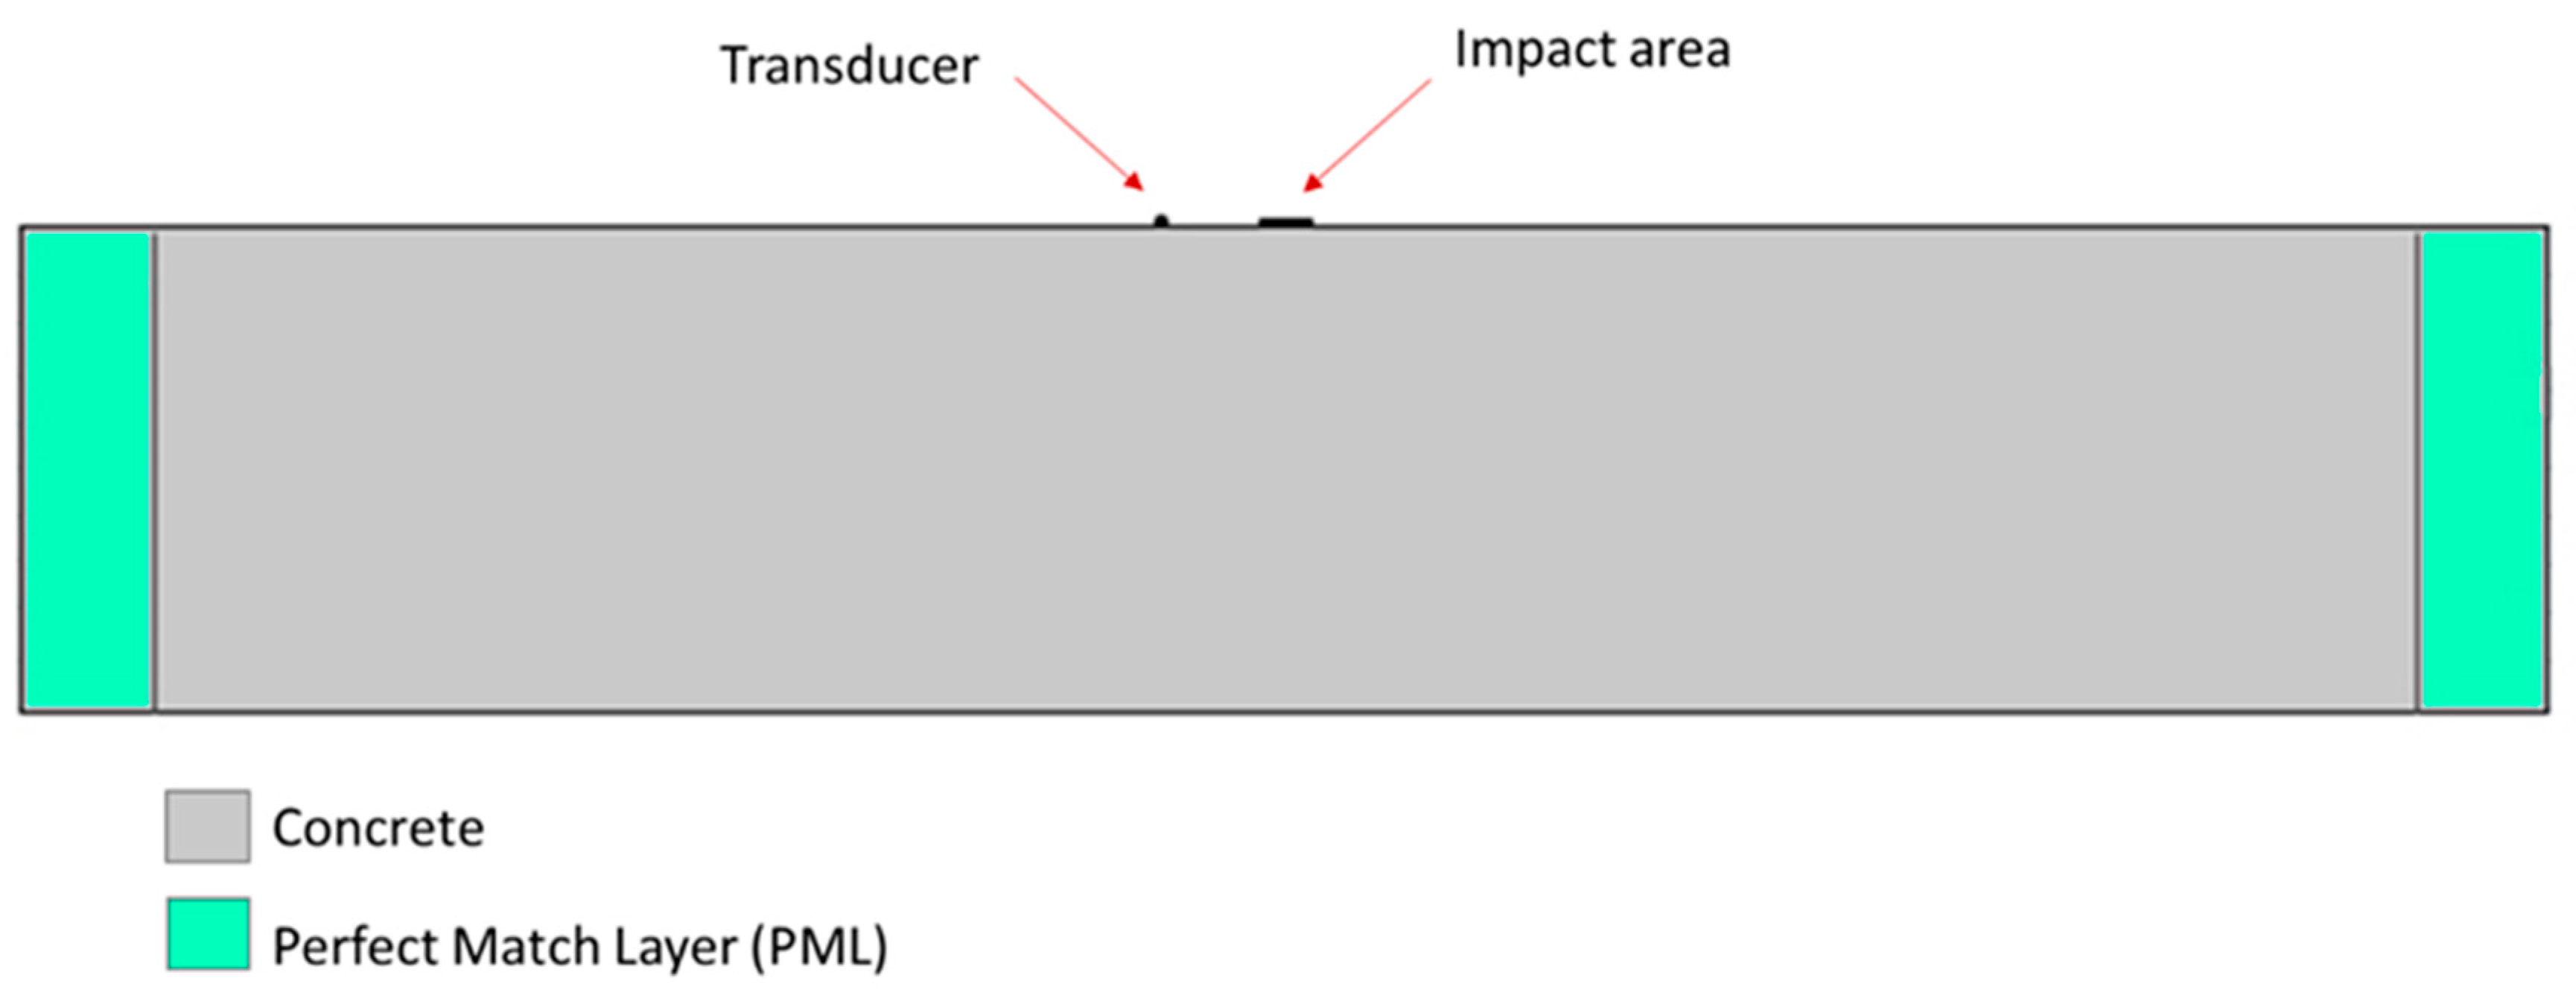
The model for the impact echo (IE) was based on the same model of a 1.0 m × 1.0 m × 0.2 m concrete slab (
Figure 1) with Perfect Match Layers (PMLs) on all four sides to prevent the reflection of elastic waves. The model includes a loading plate and measurement points to represent the impact area and transducer location, respectively. The transducer was positioned 5 cm from the impact point, as shown in
Figure 8. The IE test was simulated using a half-sine wave pulse with a maximum force of 1 N and a duration of 50 microseconds. Poisson’s ratio for concrete is 0.2, the speed of the compression wave (P-wave) is 4000 m/s, and the speed of the shear wave (S-wave) is 2312 m/s.
As shown in
Figure 1b, an ultra-fine mesh was utilized in the vicinity of the transducer and impact point. The purpose of this mesh was to achieve a highly accurate simulation of wave propagation for the IE technology. The maximum size of the free tetrahedral element was set to 0.001 m, with a growth factor of 1.2.
The effect of the impact echo can precisely determine the plate-like structure’s thickness. The thickness is calculated based on the dominant frequency and the velocity of the P-wave in the material, as illustrated in [
21].
where
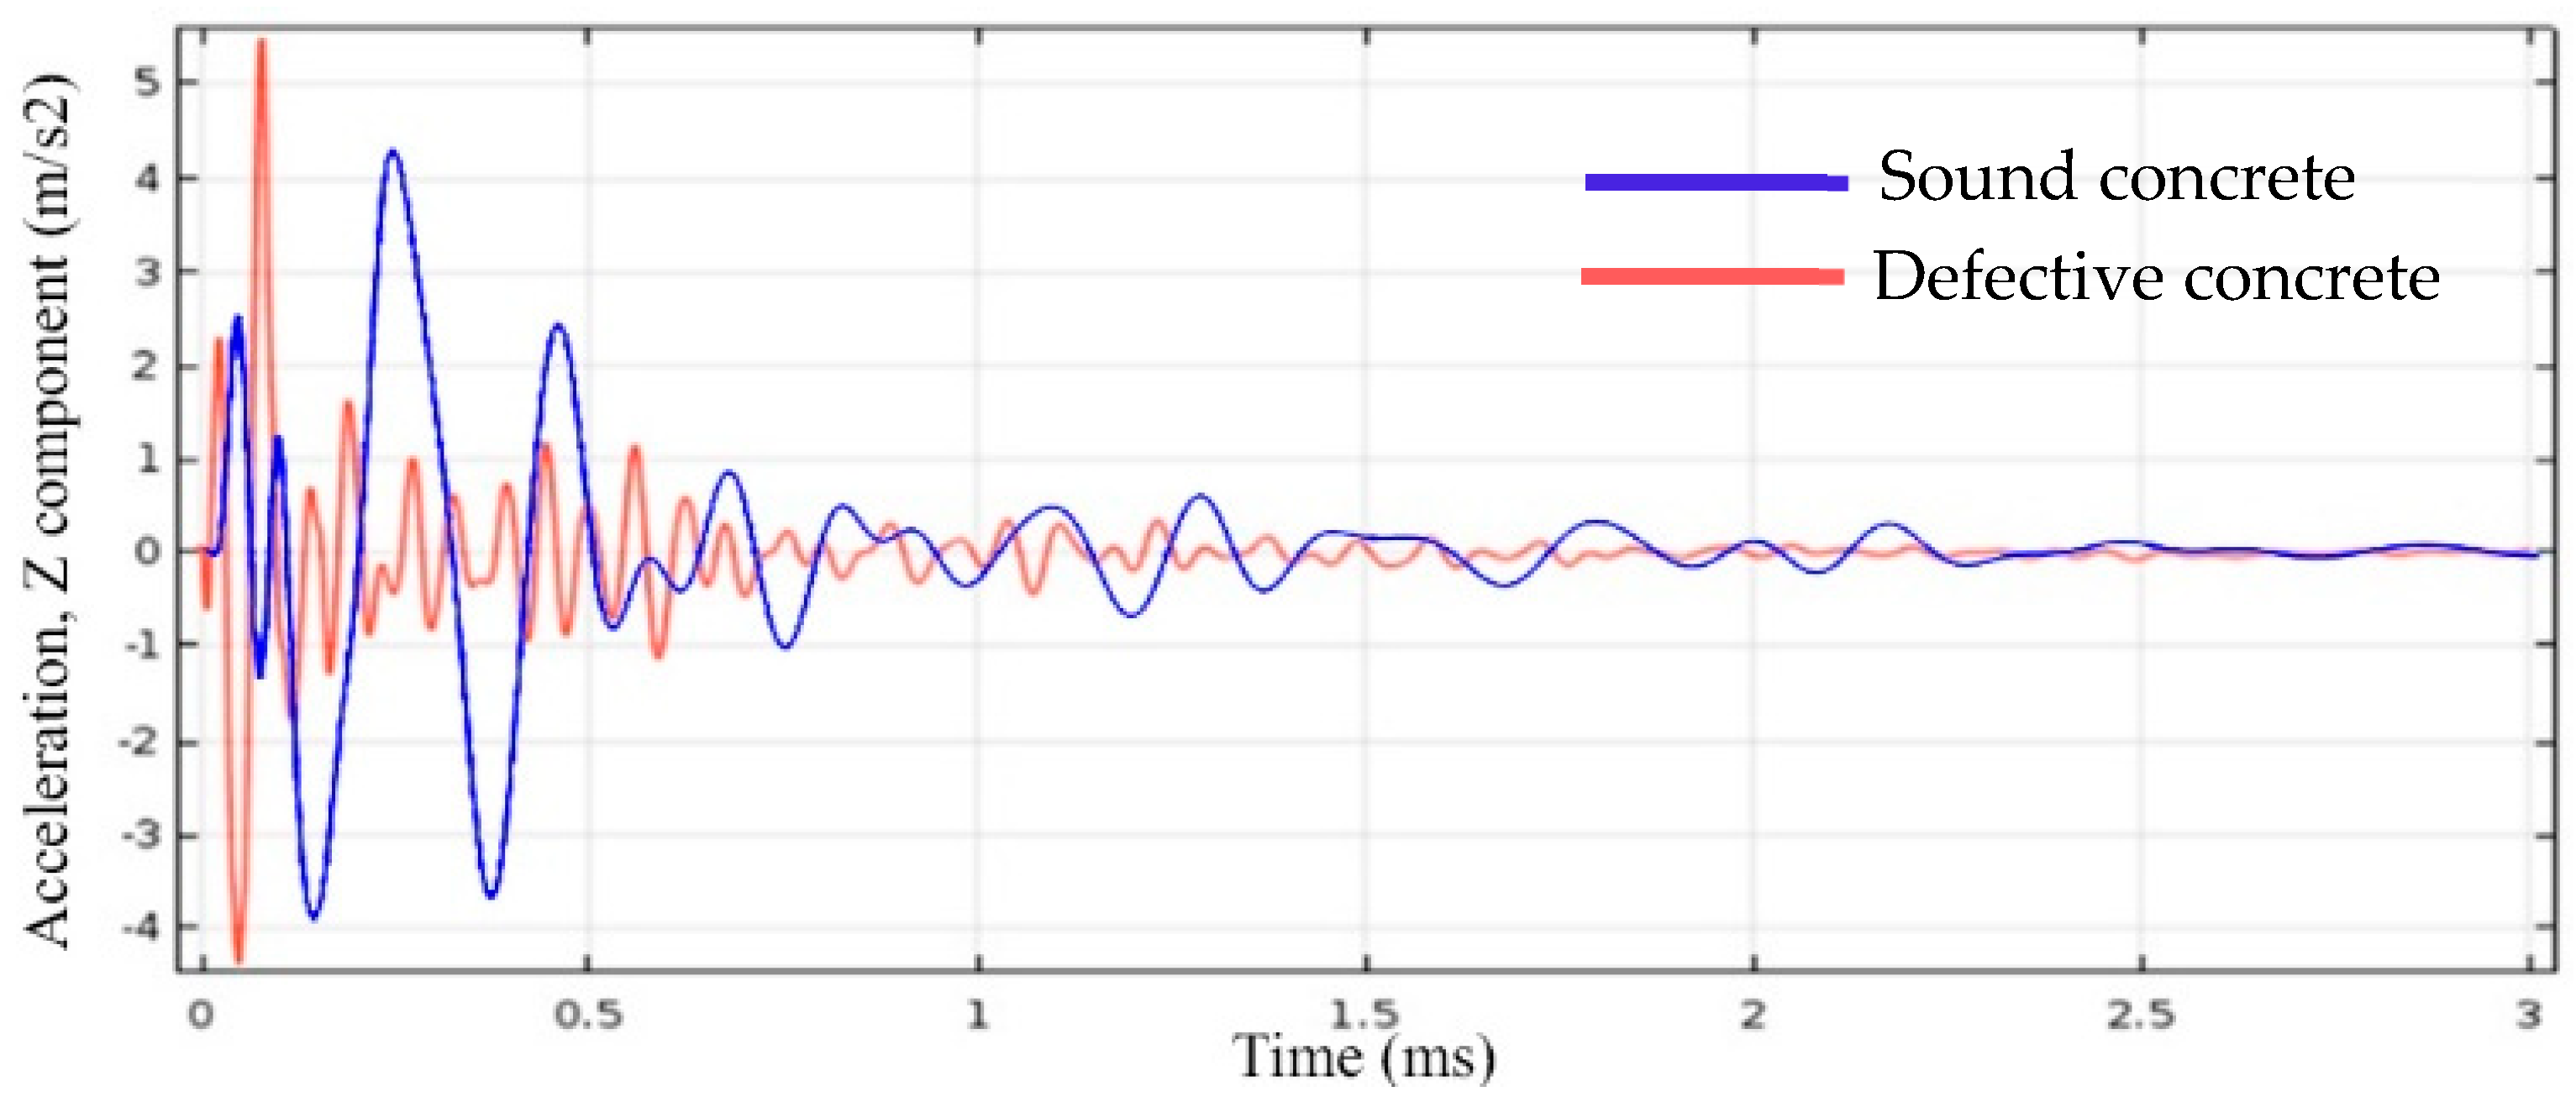
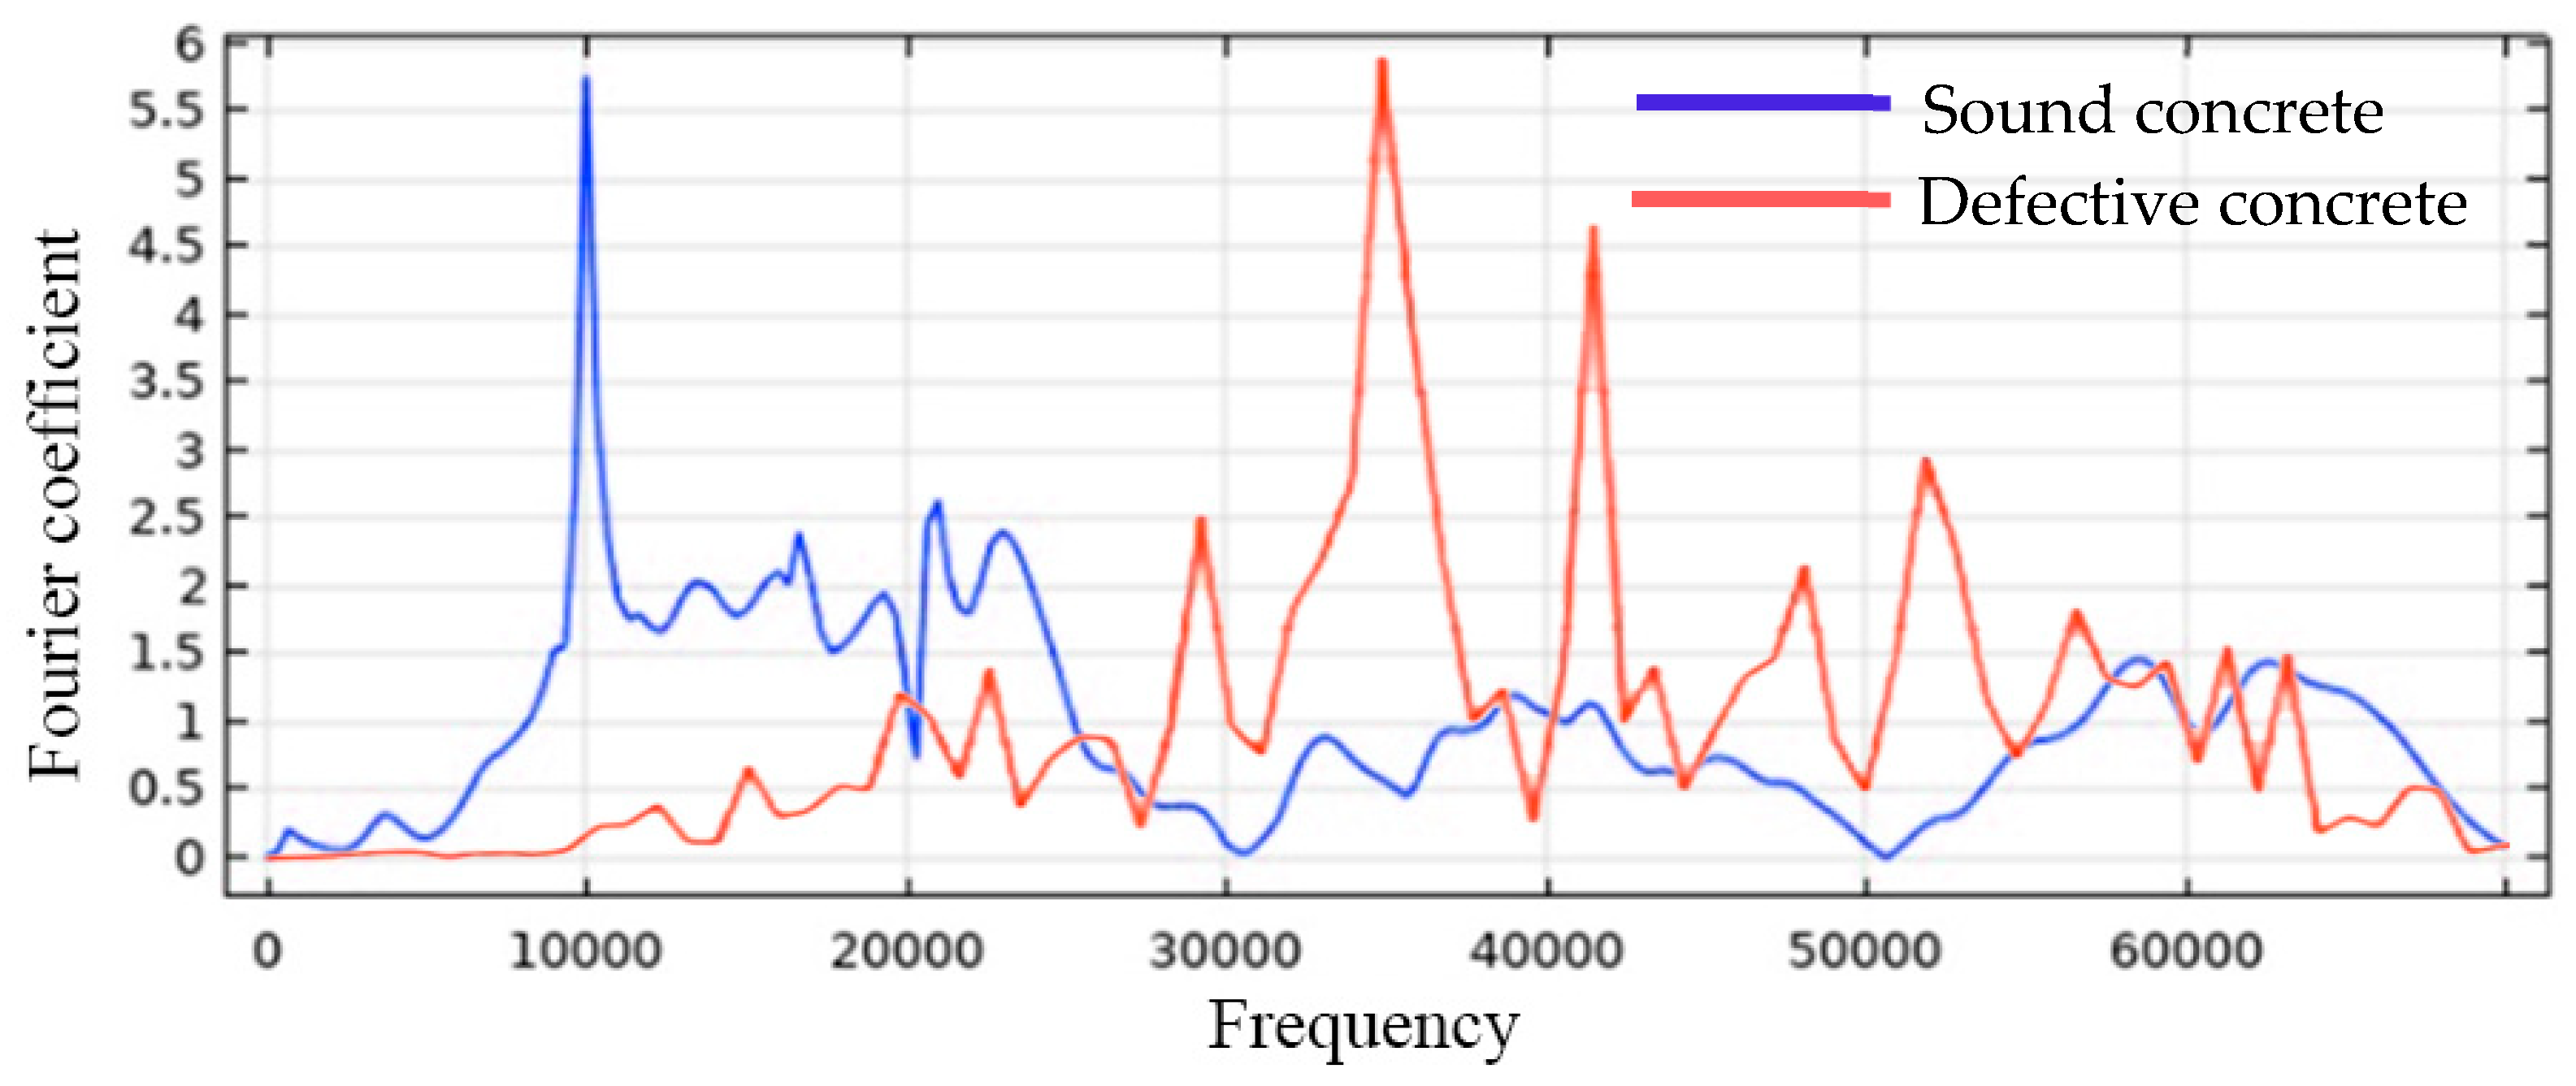
Acceleration time history plots of the sound and defective concrete models are displayed in
Figure 9, while the corresponding frequency spectra for both models are shown in
Figure 10. The frequency spectrum of the impact echo tests on the sound concrete, as seen in a blue line in
Figure 10, reveals that the main frequency is 10,000 Hz. This leads to a calculation of the concrete slab’s thickness of 0.192 m using Equation (1), which is nearly the same as the actual thickness of 0.200 m. On the other hand, the dominant frequency caused by the flaw (a 5 cm deep crack), shown as a red line in
Figure 10, is 34,900 Hz. The calculated depth of the crack in the concrete slab using Equation (1) is [0.96 × 4000/(2 × 34,900)] = 0.055 m, which is very close to the known crack depth of 0.050 m.
4. Machine Learning Algorithms
Machine learning is a method of using computer algorithms to predict a target output using multiple input features. The accuracy of the prediction improves over time through the use of a high-quality data set. Different algorithms can be employed depending on the type of study, data set, and desired output. Machine learning can be divided into two main categories: supervised and unsupervised learning algorithms. A supervised learning algorithm is used when there is a known relationship between the input features and the target output, whereas an unsupervised learning algorithm is used when it is difficult to determine clear relationships between the input features and the desired output. Machine learning was utilized to enhance the interpretation of the ER and HCP results by using data from the three NDE methods. Machine learning has been extensively utilized in various applications of structural assessments by NDEs, as reported in several research studies such as [
22,
23,
24,
25]. Artificial intelligence (AI) has also been employed for concrete evaluations in NDEs for various technologies, including impact echo [
22,
25], half-cell potential [
26], and electrical resistivity [
27].
A supervised learning algorithm was utilized in this study. Supervised learning algorithms are commonly used when there are well-defined attributes that can be linked to the target. Some of the algorithms that can be used for supervised learning include Neural Network, Naïve Bayes, K Nearest Neighbors, and Random Forest algorithms, among others. Supervised learning algorithms can be further divided into two categories: regression for continuous target values and classification for discrete target values. For this research, the Random Forest algorithm was employed since it is known for its high accuracy as it generates a multitude of decision trees using the training data set. The algorithm then returns the prediction as either the average of the individual tree predictions in the case of regression or the class chosen by most of the trees in the case of classification. The Random Forest model underwent a thorough five-fold cross-validation assessing its reliability and generalization. The hyperparameter tuning used grid and randomized searches to optimize parameters like n_estimators, max_depth, and min_samples_split. The model featured 300 decision trees for a balance between complexity and efficiency, with max_depth set at 15 to prevent overfitting. Minimum sample requirements ensured a balance between precision and generalization. Bootstrapping was utilized with a random state of 42, and all available CPU cores were employed for reproducibility and computational power. Class weights were adjusted to address dataset imbalance, collectively enabling accurate ER and HCP measurement predictions.
4.1. Random Forest Algorithm Development
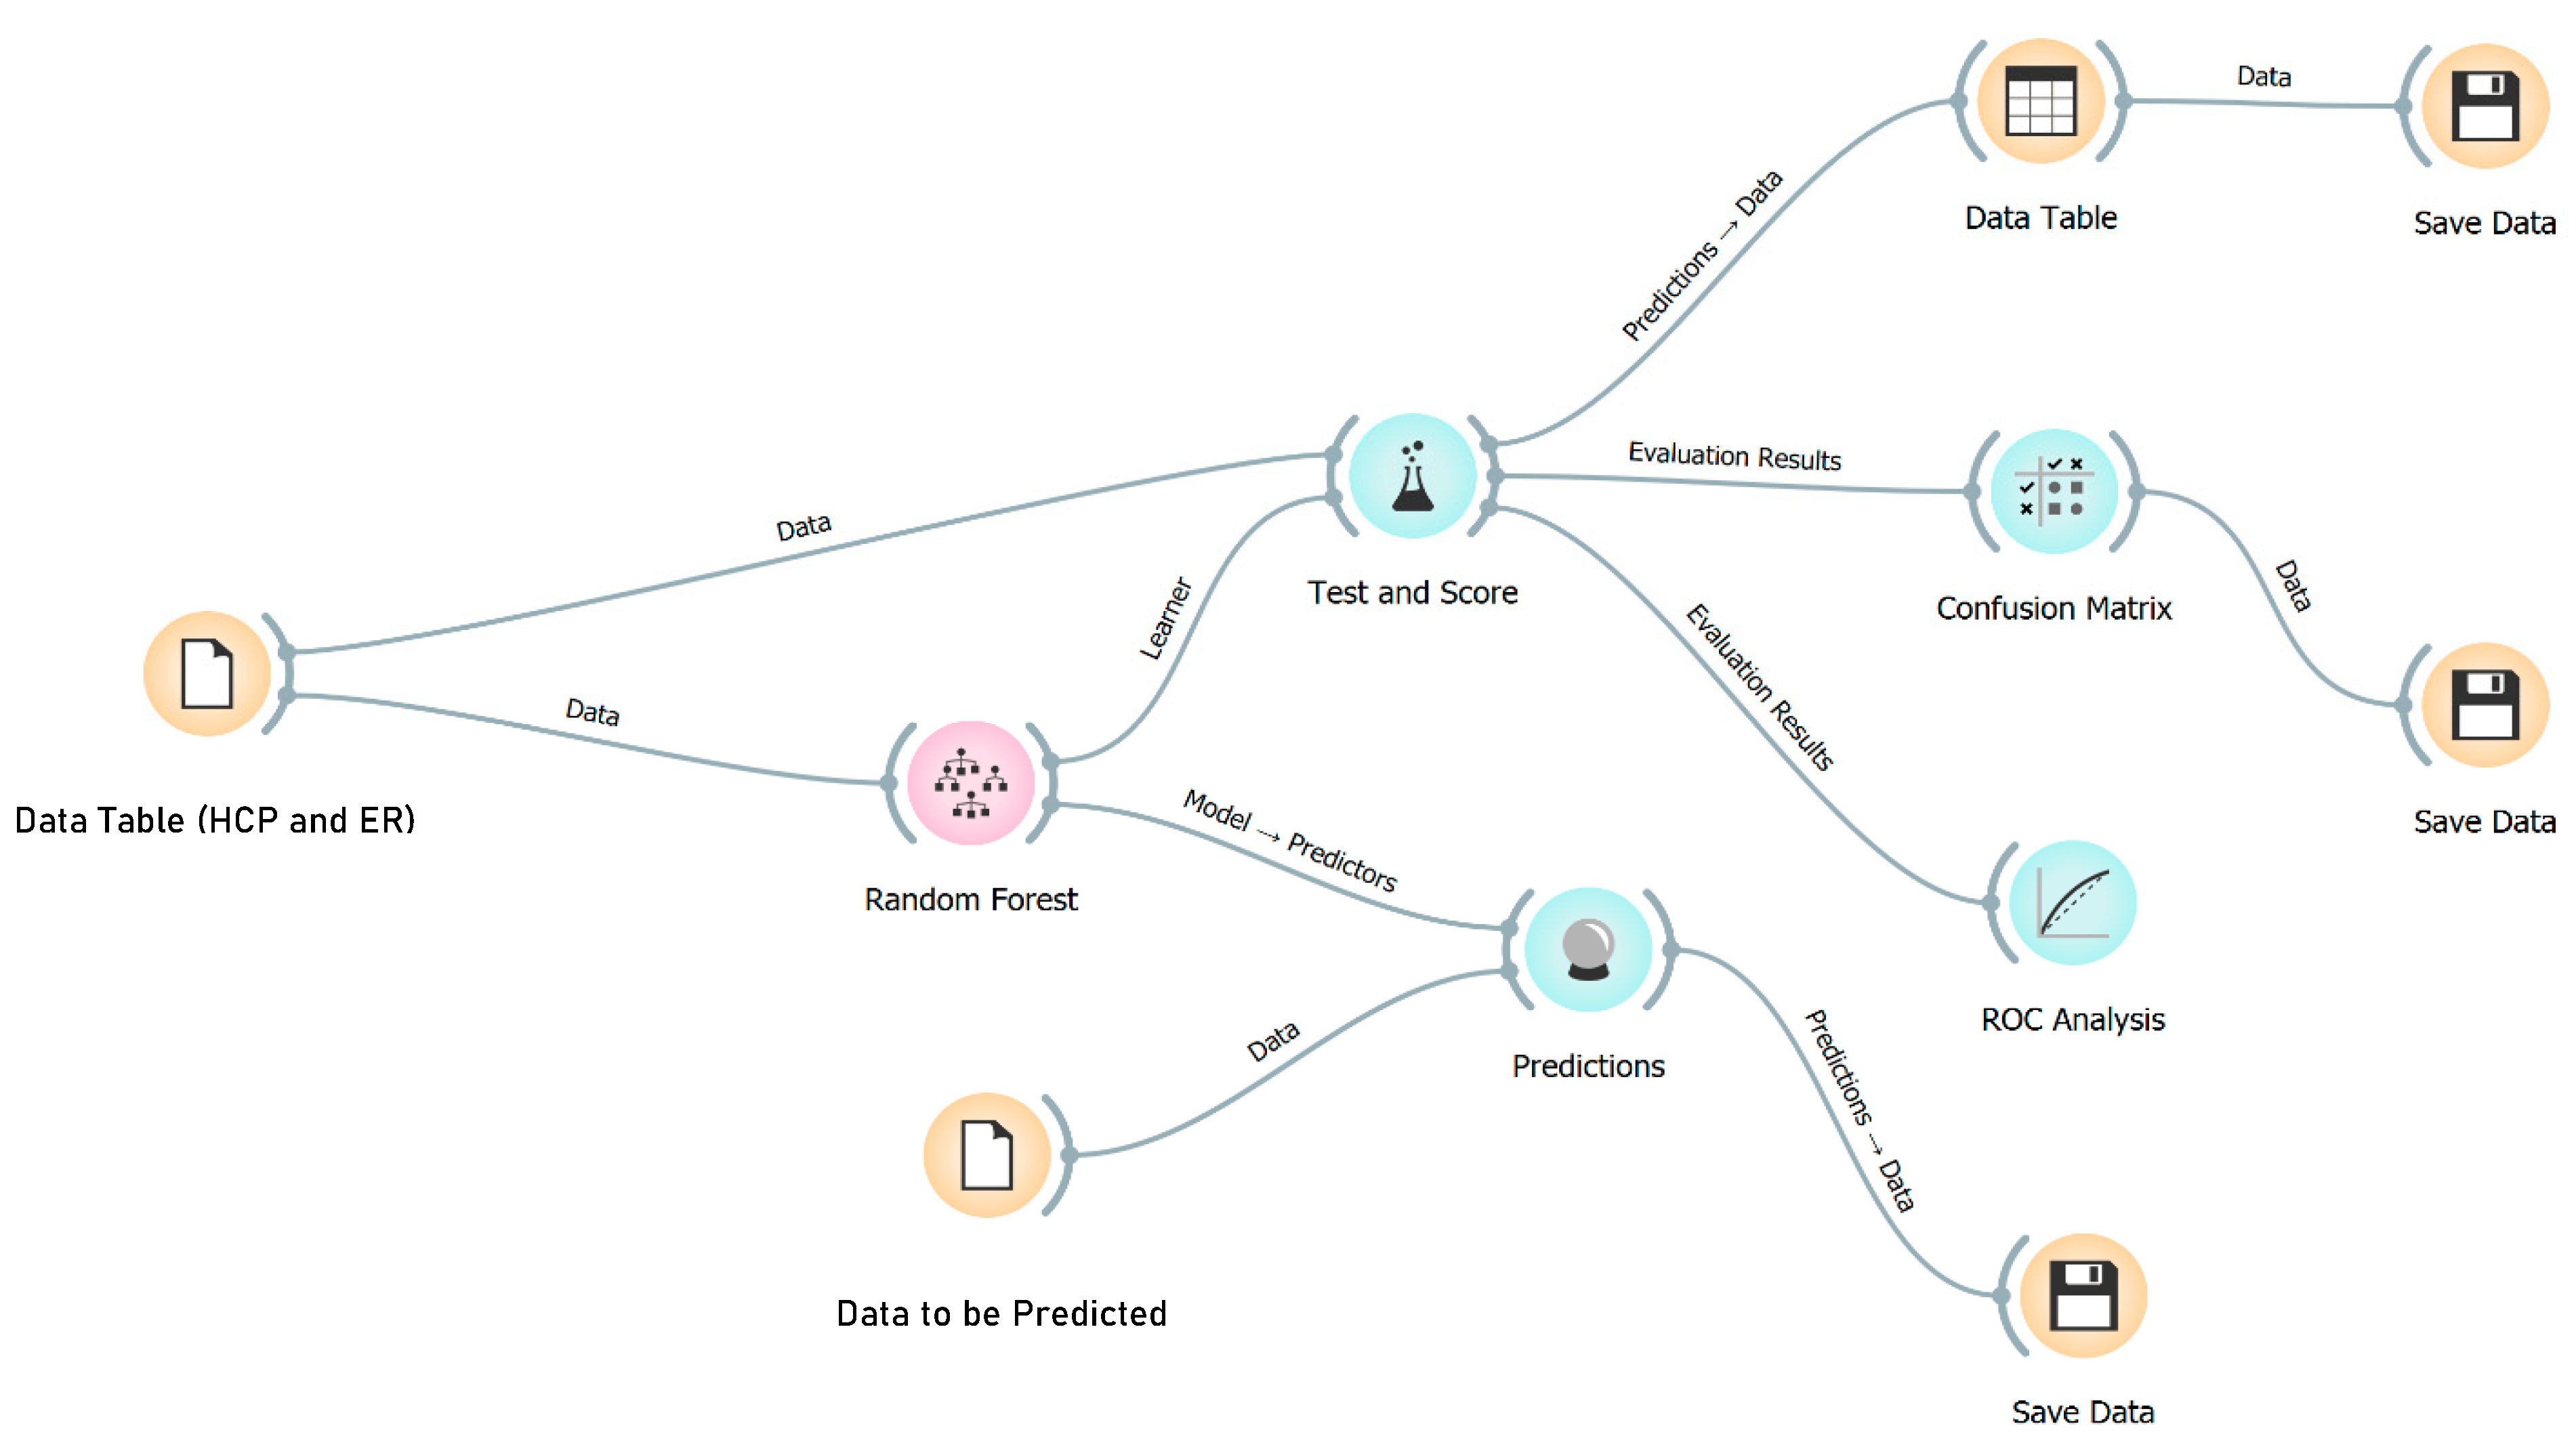
The algorithms were designed to provide corrected measurements from both half-cell potential and electrical resistivity technologies, which are impacted by the presence of the five parameters discussed earlier. The correction of the measurements is based on a reference model with DoS = 40%, DD = 0, CC = 63 mm, and CL = 0. Orange® open-source software was used to build the algorithm. Orange® is a visual programming tool for machine learning, data mining, and data visualization and is written in Python, Cython, C++, and C. It can be used without any programming experience, and all procedures can be performed through a graphical user interface (GUI).
Three-dimensional simulation results of the NDE technologies explained in the foregoing sections were utilized to develop the Random Forest algorithms. The simulation generated 2548 models with specific values for the NDE technologies, forming a data set of 2548 instances for building two machine learning algorithms. The first is the Classification Algorithm, and the second is the Regression Algorithm.
4.1.1. Classification Algorithm
The data set includes nine attribute types involved in the process. These attributes serve various functions in the algorithm, some of which are Features, data that can be input as real numbers from NDE technology measurements on site; some are Meta, data that cannot be measured as real numbers by NDE technologies; and the rest are referred to as Targets, as described below:
Degree of Saturation: the attribute is a Numerical variable that has a Feature role.
Length of Corrosion: the attribute is a Numerical variable that has a Meta role.
Delamination Depth: the attribute is a Numerical variable that has a Feature role.
Concrete Cover: the attribute is a Numerical data variable that has a Feature role.
Delamination M.C: the attribute is a Categorical variable that has a Meta role.
Measured Resistivity: the attribute is a Numerical variable that has a Feature role.
Measured HCP: the attribute is a Numerical variable that has a Feature role.
Actual Resistivity: the attribute is a Categorical variable that has a Target role.
Actual HCP: the attribute is a Categorical variable that has a Target role.
It is worth noting that the attribute “Degree of Saturation” can be observed using various methods like moisture sensors, gravimetric measurements, or electrical impedance techniques. These measurements help in assessing the moisture level within the material. On the other hand, the delamination in the attribute “Delamination Depth” refers to the separation or detachment of layers within the concrete. Observing the delamination depth typically involves NDE techniques like impact echo (IE) or ultrasonic pulse echo (UPE) testing. “Concrete Cover” refers to the thickness of the concrete layer that covers and protects the steel reinforcement within a structure. It can be measured using techniques like ground penetrating radar (GPR) or cover meters.
The targets considered are both the Actual Resistivity and Actual HCP, which will be predicted by the classification algorithm as discrete classification values rather than continuous values. The choice of discrete classification values for the ER method is based on the correlation between resistivity and corrosion risk [
28], while for the HCP method, the choice is based on the link between potential measurements and the active corrosion probability [
29]. The classification values for the HCP and ER are as follows:
Predicted values (Target) for HCP = {No Corrosion, Transition, Corrosion}.
Predicted values (Target) for ER = {Negligible, Weak, Moderate, High}.
The algorithm workflow for the HCP and ER technologies is shown in
Figure 11.
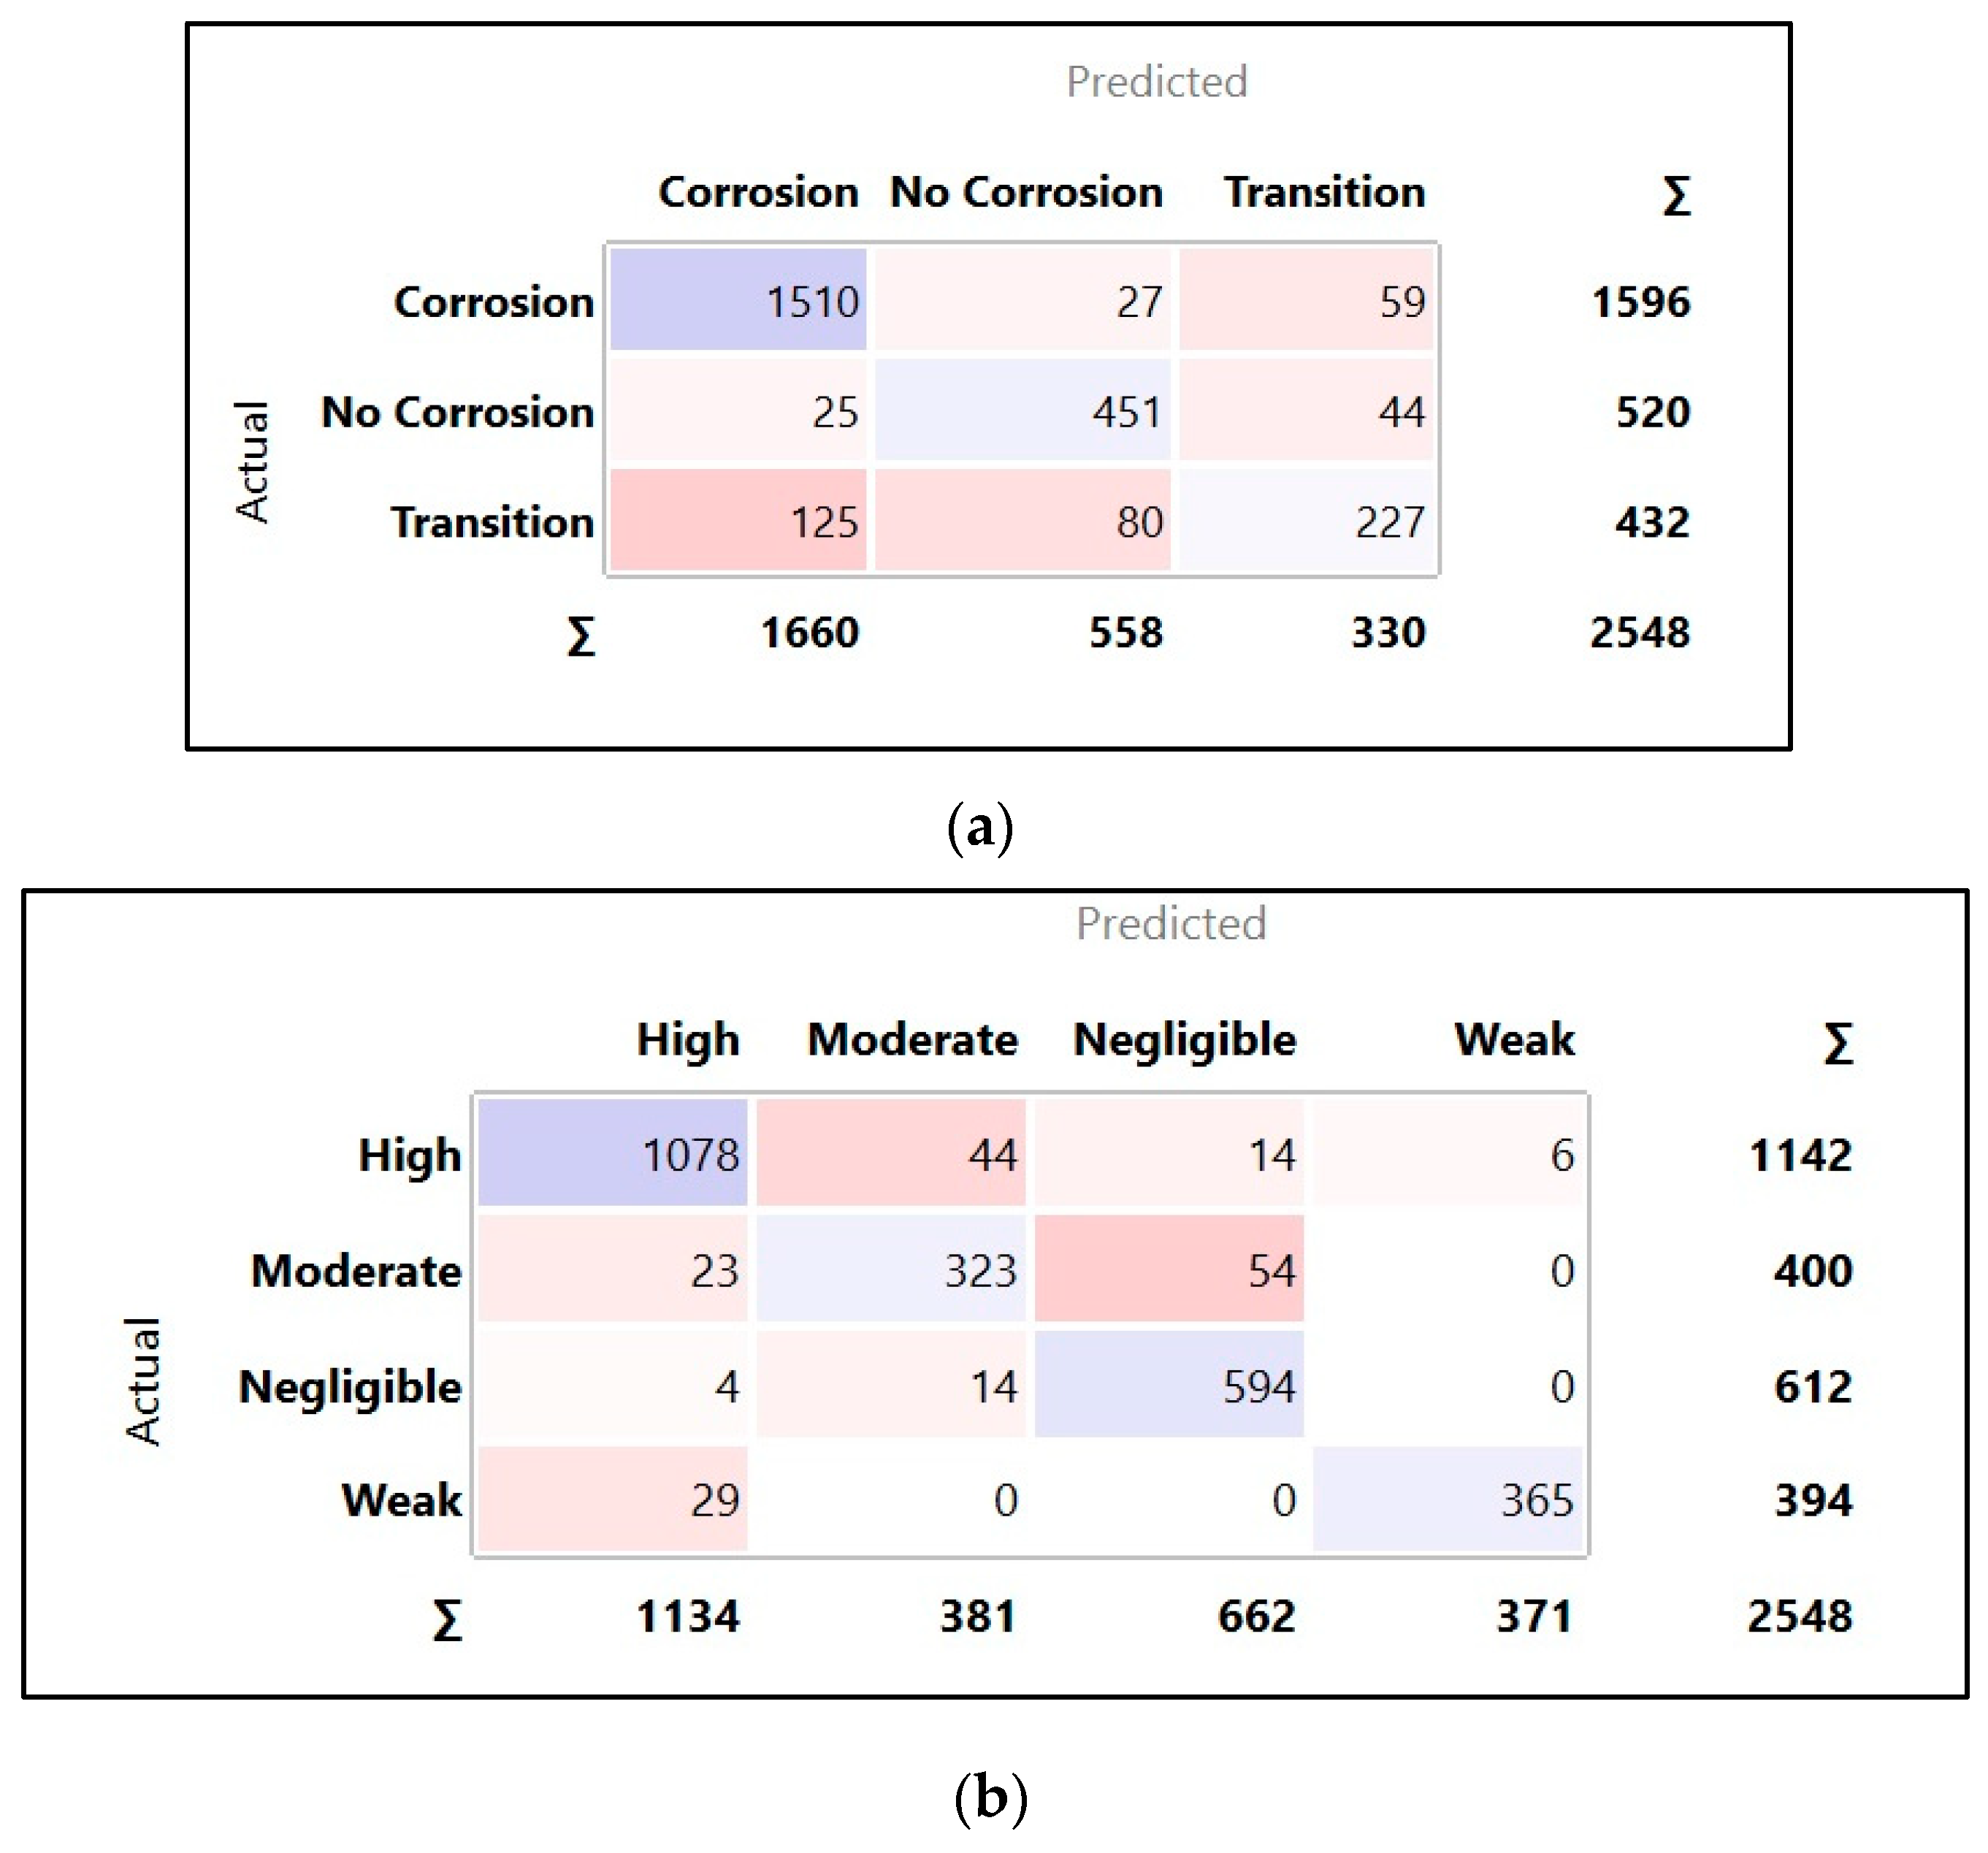
The algorithm demonstrates exceptional precision in predicting both Actual ER classification and Actual HCP classifications. On average, across classes, the algorithm’s accuracy was 92.6% for ER and 85.9% for the HCP. However, the accuracy varies when the target class is altered, as illustrated in
Table 2.
Additionally, the algorithm’s efficiency is tied to other evaluation results that provide a numerical evaluation of its quality, known as a classifier performance measure, including the area under the ROC curve (AUC), F1, precision, and recall. The evaluation results for this algorithm based on the classifier performance measures indicate that the AUC, CA, F1, precision, and recall for the average across classes are 0.989, 0.926, 0.926, 0.927, and 0.926, respectively.
Table 3 below displays the evaluation results for the other classes.
Moreover, the performance of the algorithm can be determined by creating a confusion matrix. This matrix displays the relationship between the predicted and actual classes and is used to evaluate the classification algorithm’s results.
Figure 12a,b display the confusion matrix in terms of the number of instances for the HCP and ER, respectively.
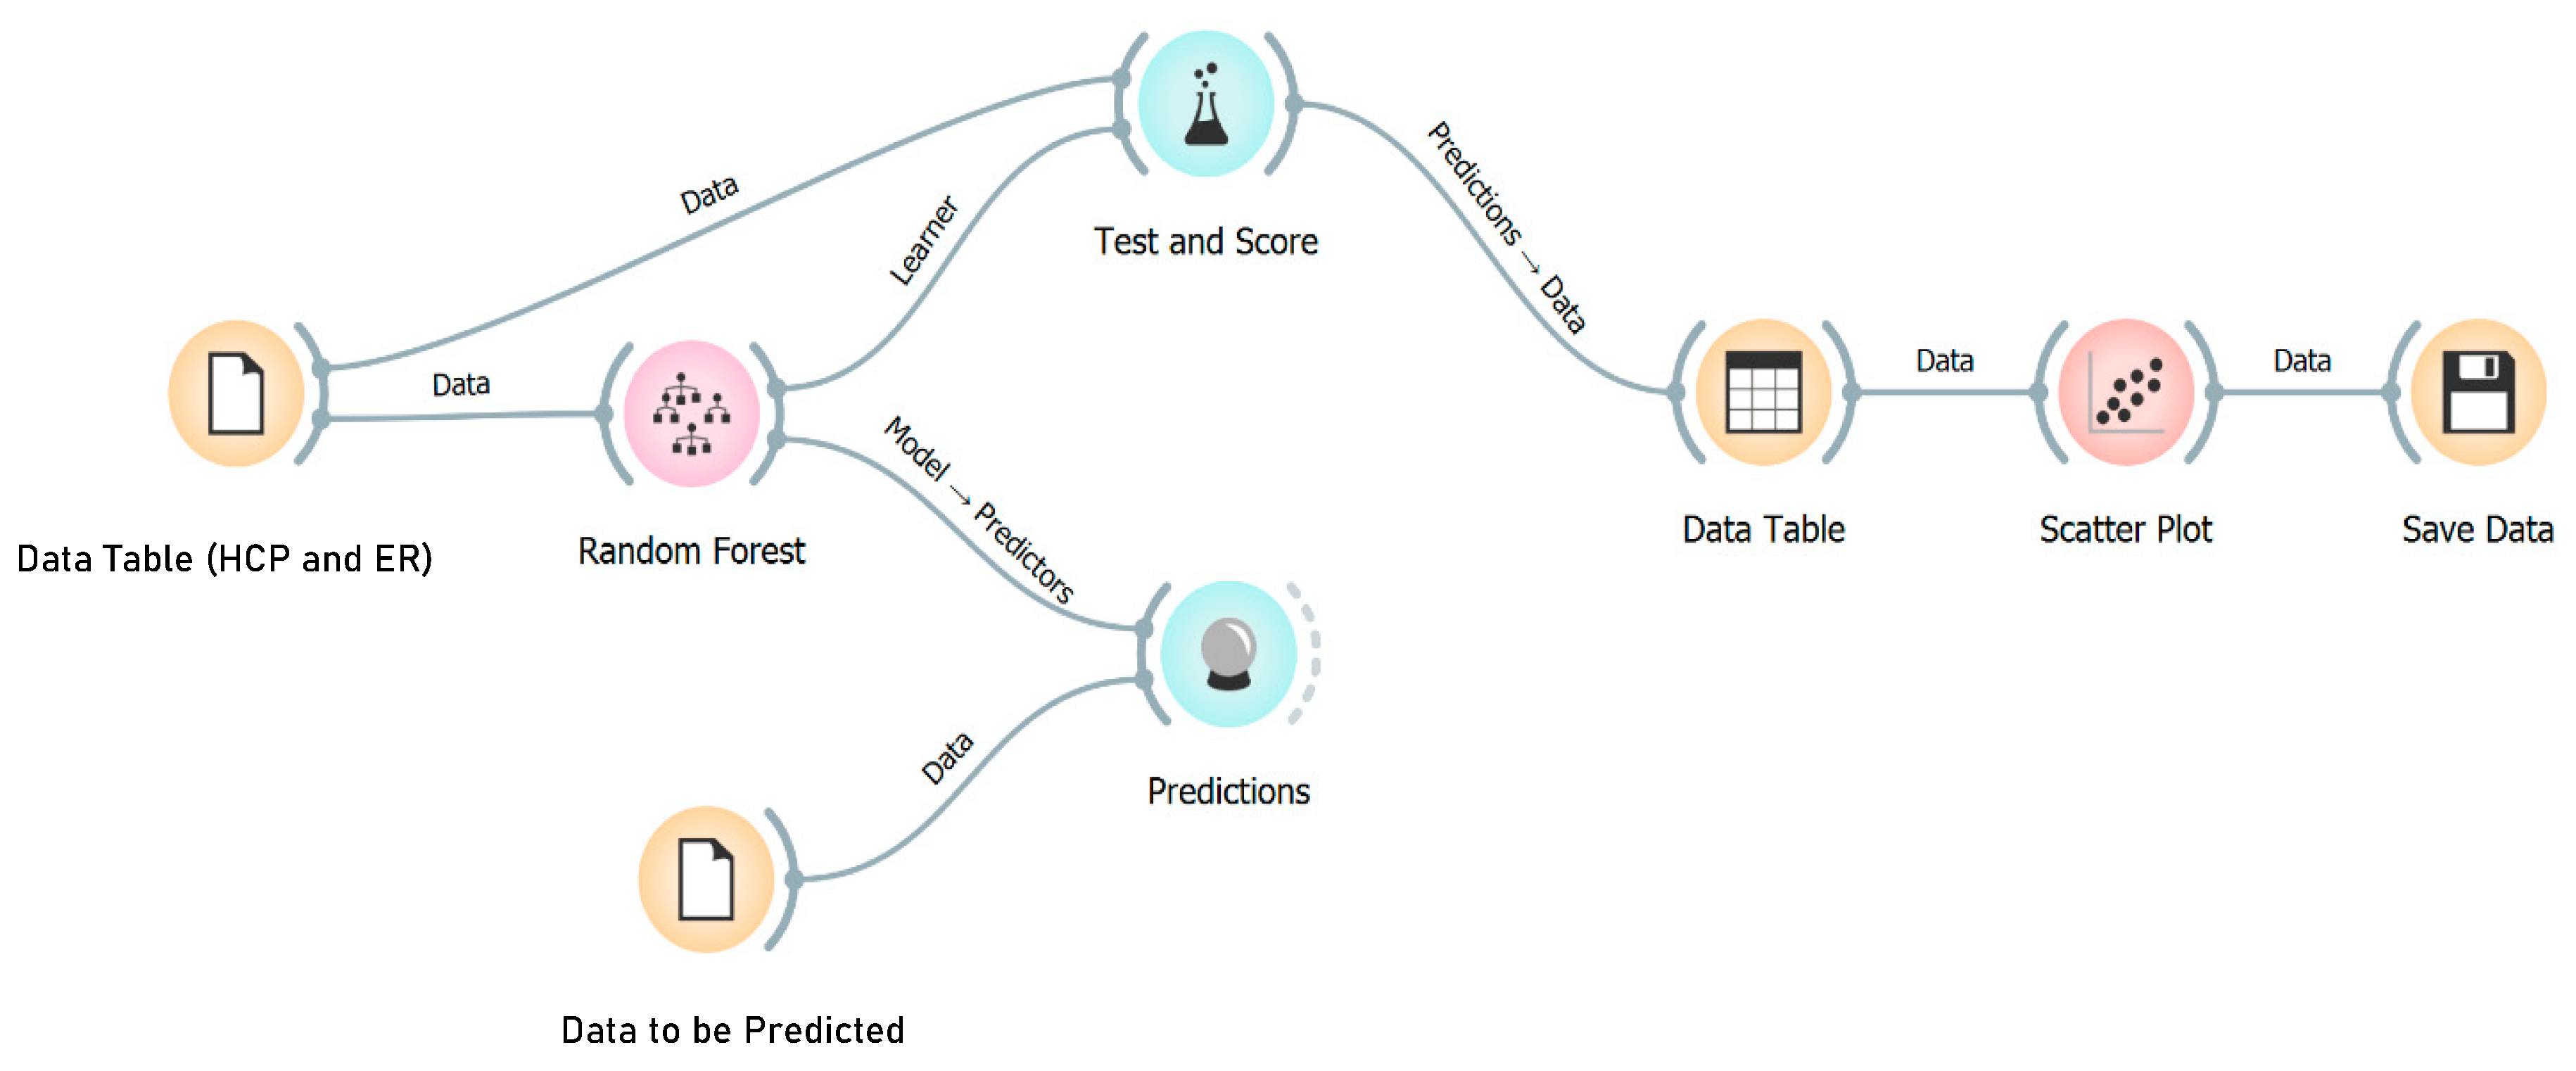
4.1.2. Regression Algorithm
Another way to utilize a machine learning algorithm in an NDE is by developing a regression algorithm. Unlike the classification algorithm described earlier, which predicts discrete targets, a regression algorithm predicts continuous target values. Additionally, a regression algorithm can be more precise by forecasting the exact values of targets that fall within the boundaries of two distinct classes. This makes the predicted targets more concrete in numerical terms. The regression algorithm incorporates nine types of attributes based on the data set. These attributes have varying functions in the process and can be classified as Features, Meta, or Target, as explained below:
Degree of Saturation: the attribute is a Numerical variable that has a Feature role.
Length of Corrosion: the attribute is a Numerical variable that has a Meta role.
Delamination Depth: the attribute is a Numerical variable that has a Feature role.
Concrete Cover: the attribute is a Numerical data variable that has a Feature role.
Delamination M.C: the attribute is a Categorical variable that has a Meta role.
Measured Resistivity: the attribute is a Numerical variable that has a Feature role.
Measured HCP: the attribute is a Numerical variable that has a Feature role.
Actual Resistivity: the attribute is a Numerical variable that has a Target role.
Actual HCP: the attribute is a Numerical variable that has a Target role.
Figure 13 shows the workflow diagram of the algorithm for both HCP and ER technologies.
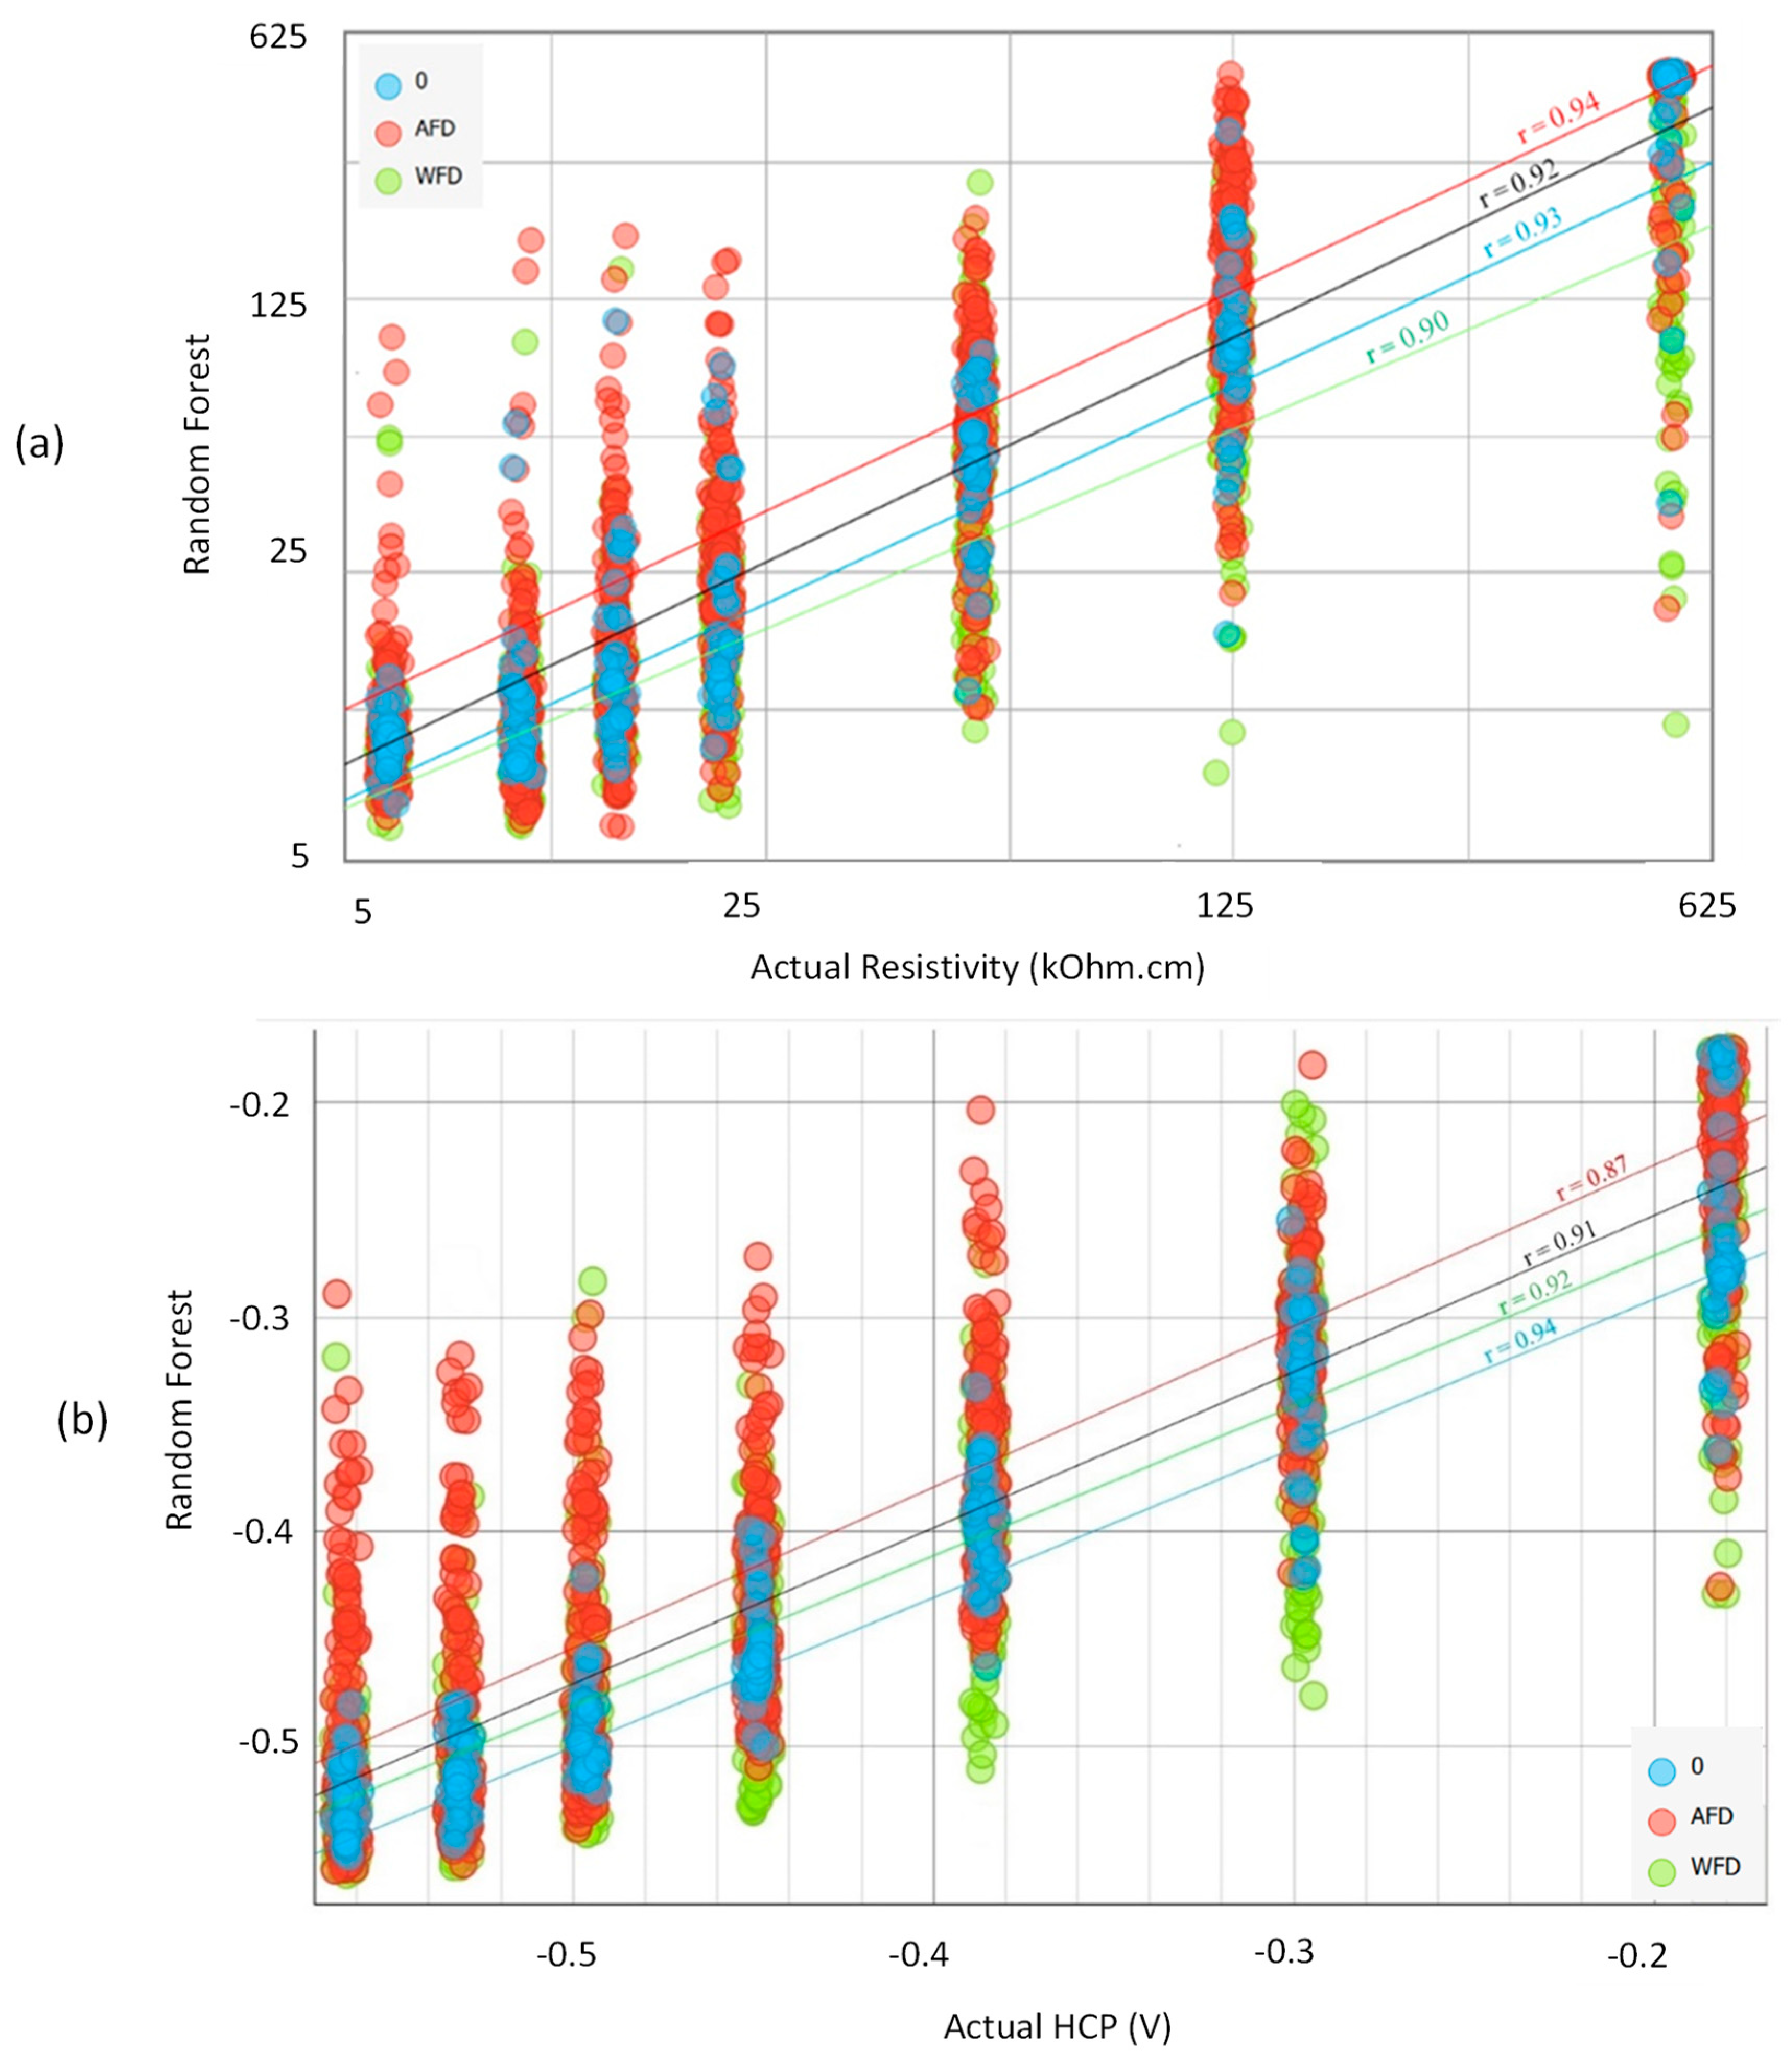
The regression algorithm was evaluated for both ER and the HCP, and the results show that the coefficient of determination (R2) for ER was 0.861, indicating a strong positive relationship between the predicted and actual results, with a CVRSM of 69.388. The R2 for the HCP was 0.841, also indicating a strong positive correlation with a CVRSM of 16.267.
Figure 14a,b display the correlations between actual instances (on the
x-axis) and Random Forest predictions (on the
y-axis) for ER and the HCP, respectively. The correlations are shown in three different colors: blue for no delamination, red for AFD, and green for WFD. In the case of ER, red instances have the highest correlation r value of 0.94, with 0.93, 0.90, and 0.92 for blue instances, green instances, and overall instances, respectively. This indicates that the regression algorithm is the most accurate when ER technology is applied on concrete slabs with AFD and the least accurate on those with WFD. On the contrary, HCP technology has a higher correlation value of r equal to 0.94 for blue instances. Conversely, the other correlation values are 0.87, 0.92, and 0.91 for red, green, and overall instances, respectively. Thus, the regression algorithm’s prediction is most accurate when HCP technology is applied to sound concrete, but its accuracy decreases in the presence of WFD. The lowest accuracy occurs when AFD is present.
5. Implementation of the Algorithms
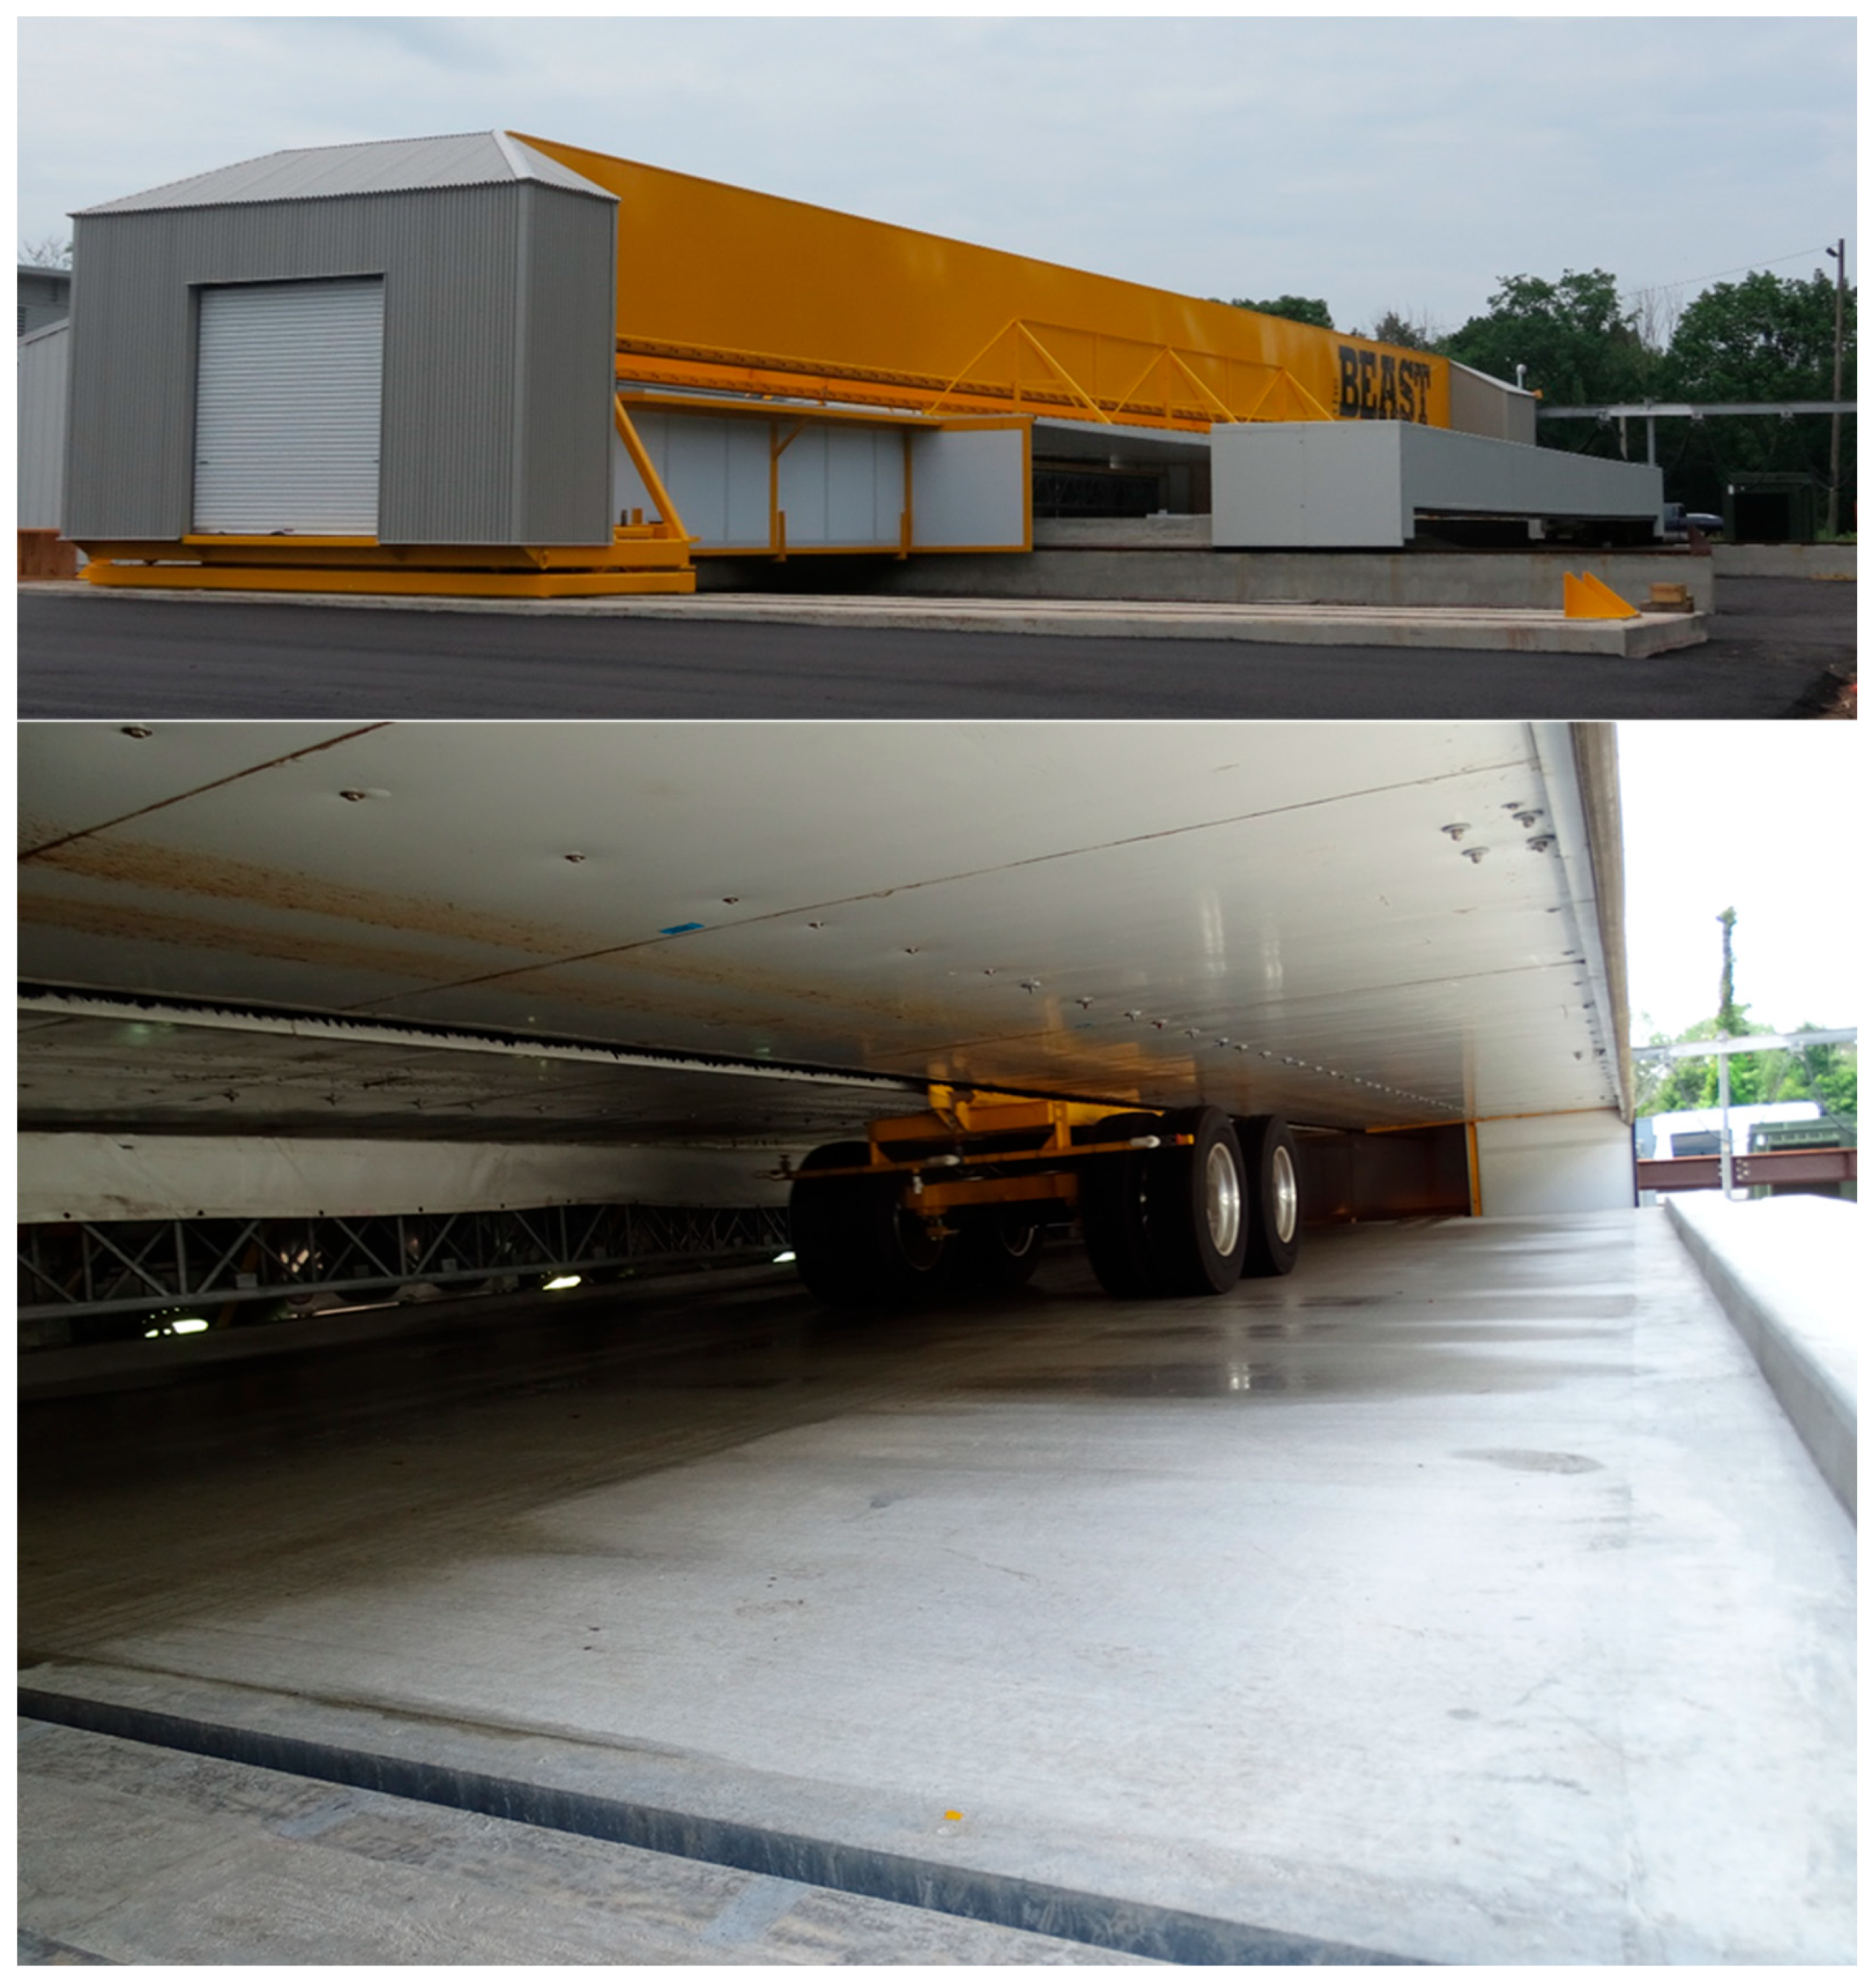
The data were gathered on the concrete deck of the bridge specimen in the BEAST
® (Bridge Evaluation and Accelerated Structural Testing) facility. A dual-axle truck carriage, with a weight equivalent to 50,000 pounds, runs continuously to simulate a truck crossing the deck more than 13,000 times a day. The facility allows the bridge deck to be exposed to various environmental conditions, such as freezing, thawing, salt exposure, and continuous truck traffic, to rapidly simulate its deterioration.
Figure 15 shows the loading device.
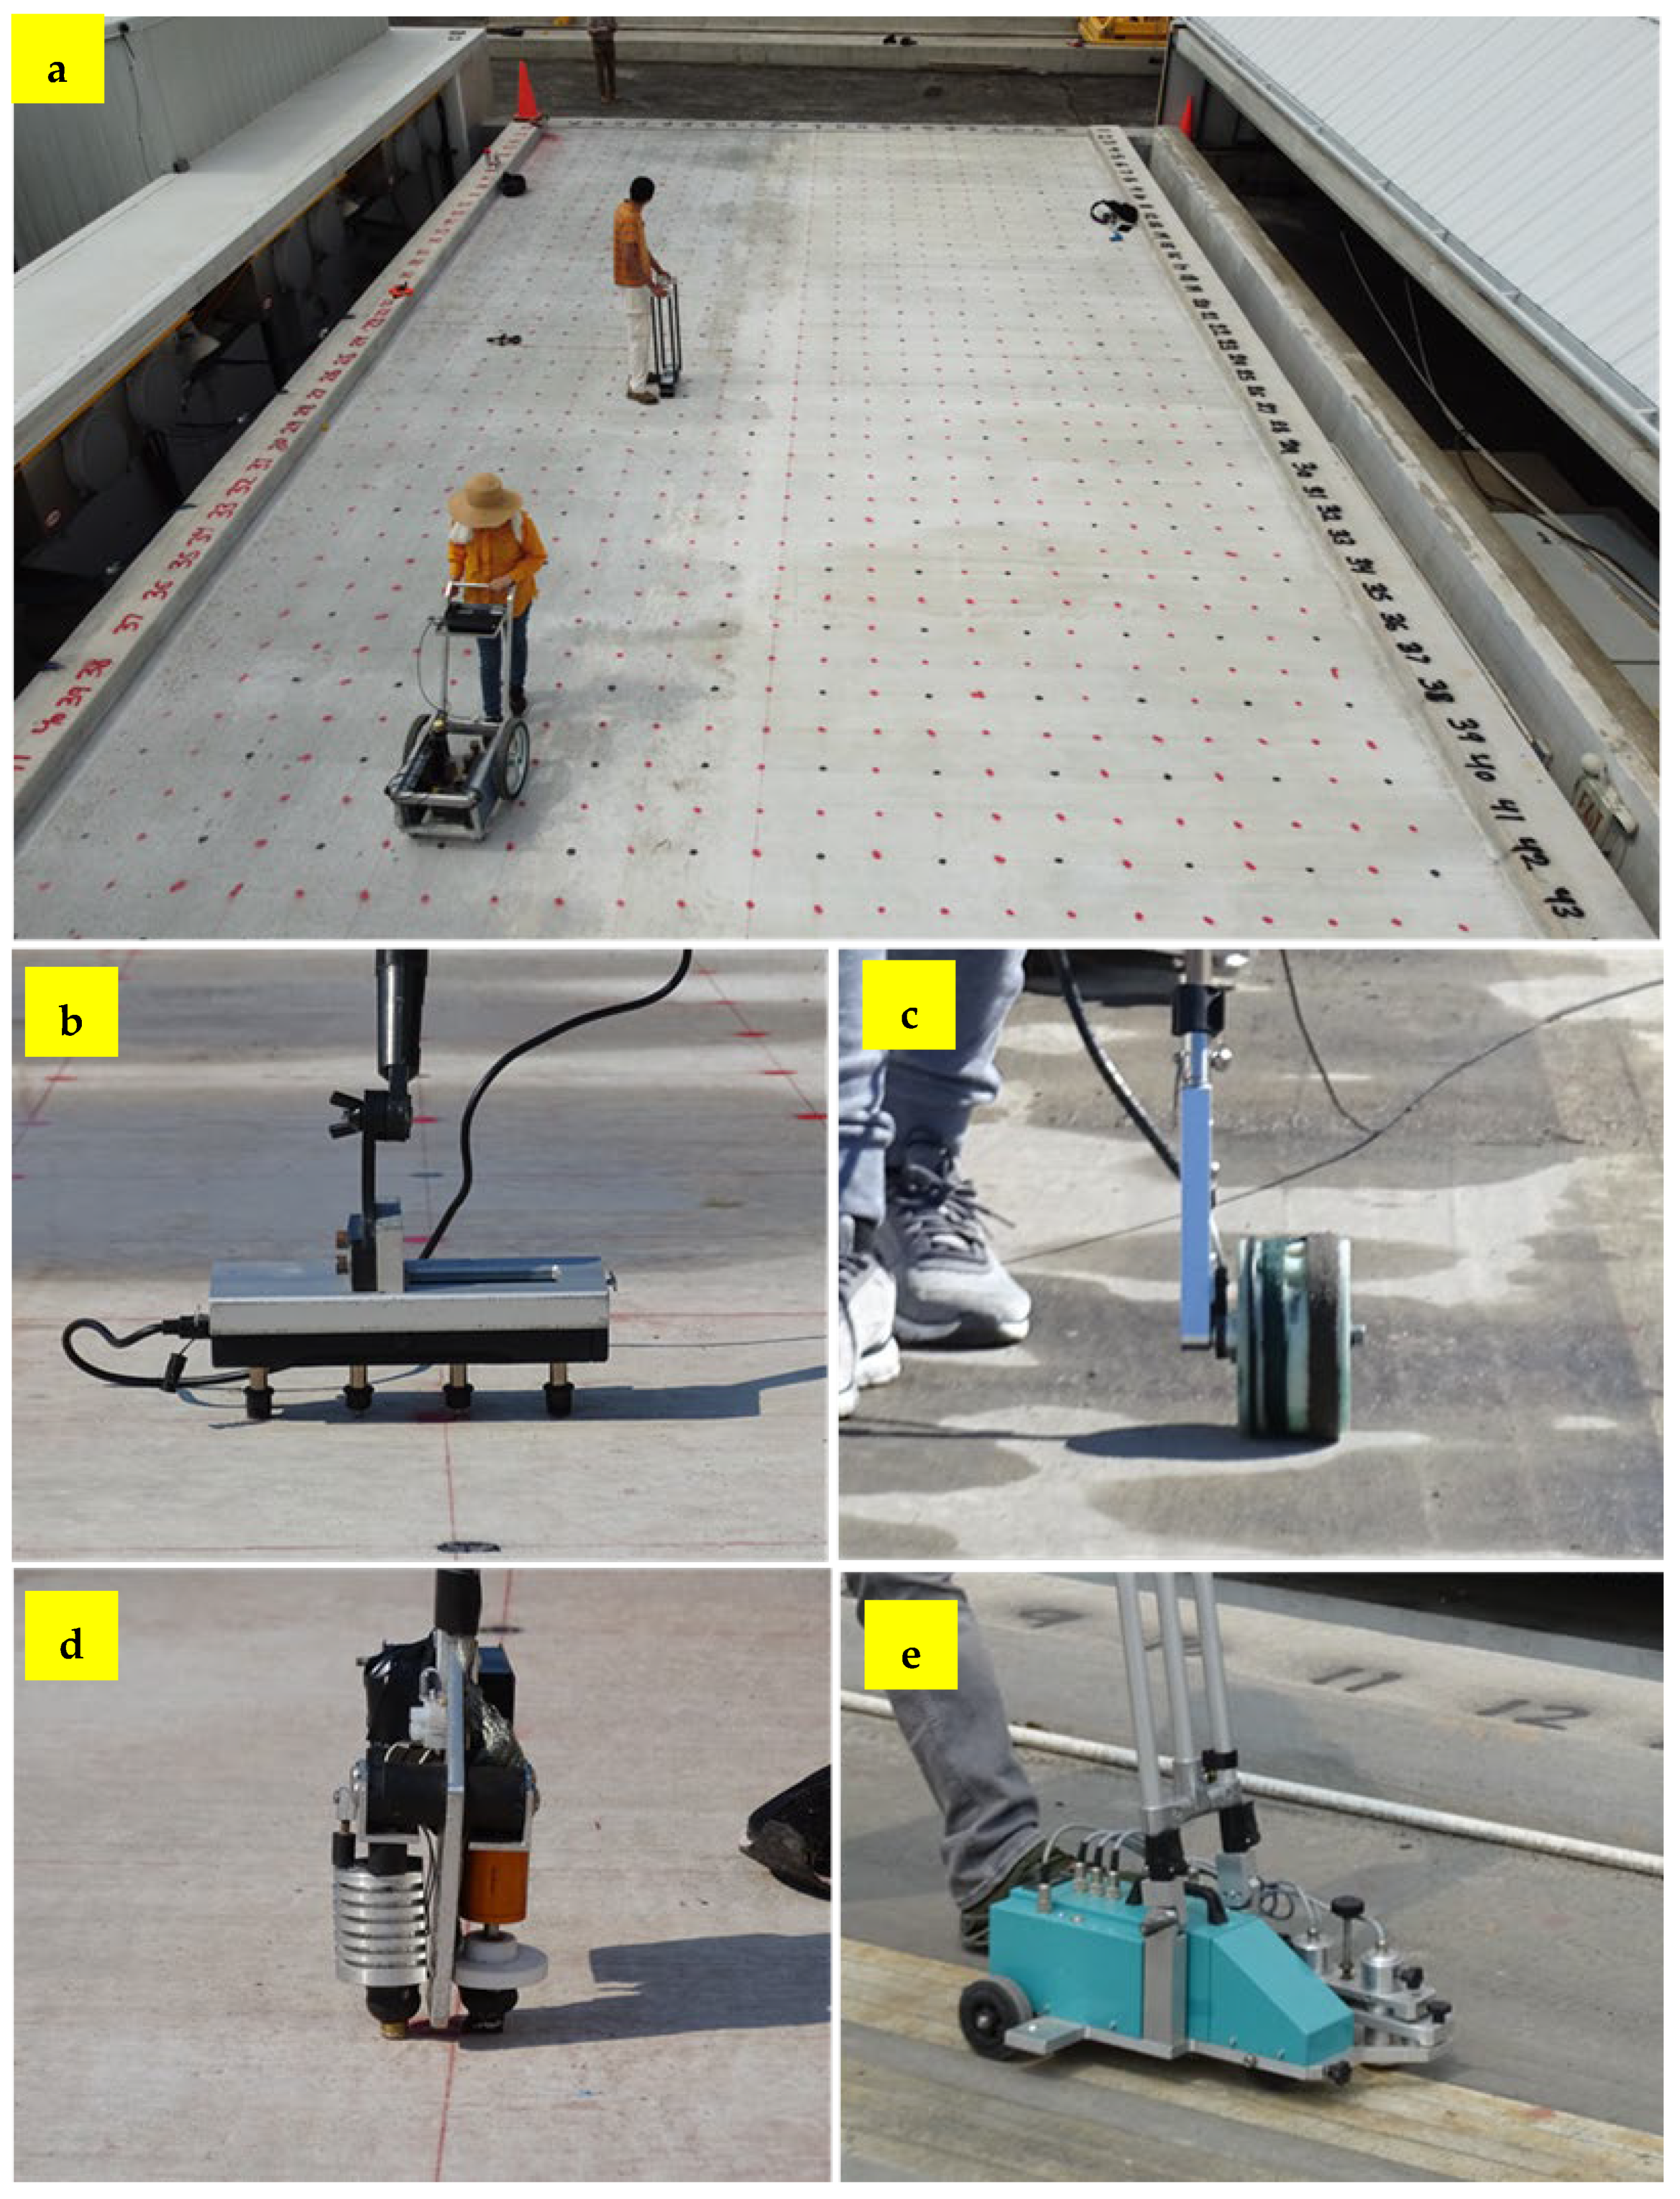
The BEAST facility allows for the assessment of actual bridge decks in regard to their dimensions, construction, exposure to environmental factors, and the loads placed on them by truck axels. It functions as a full-scale prototype that mimics the conditions a real bridge deck experiences. The bridge deck structure is 15 m long and 8.4 m wide, with a 1 ft by 1 ft (0.3 m by 0.3 m) grid marked on it, as illustrated in
Figure 16a. Data were collected using three main NDE technologies: impact echo, electrical resistivity, and half-cell potential. The MOIST-Scan device, shown in
Figure 16e, was also utilized to gather information on the concrete’s degree of saturation; it uses microwave technology to provide an immediate, nondestructive analysis of residual moisture. The collected data on the moisture content were distributed in a range between 0% and 100%.
Figure 16 shows the data gathered via the four NDE techniques. The data were usually gathered monthly to track the progression of deterioration.
5.1. Applying the Regression Algorithm
The presented data were obtained from a BEAST slab evaluation on 24 June 2021. By this time, the BEAST concrete slab had undergone 85 freeze–thaw cycles and 1,671,506 live load cycles and had been sprayed with 3360 gallons of salt brine. Before utilizing the regression algorithm, the data from each technology were analyzed and visualized to compare the differences in data interpretation with and without the ML algorithm.
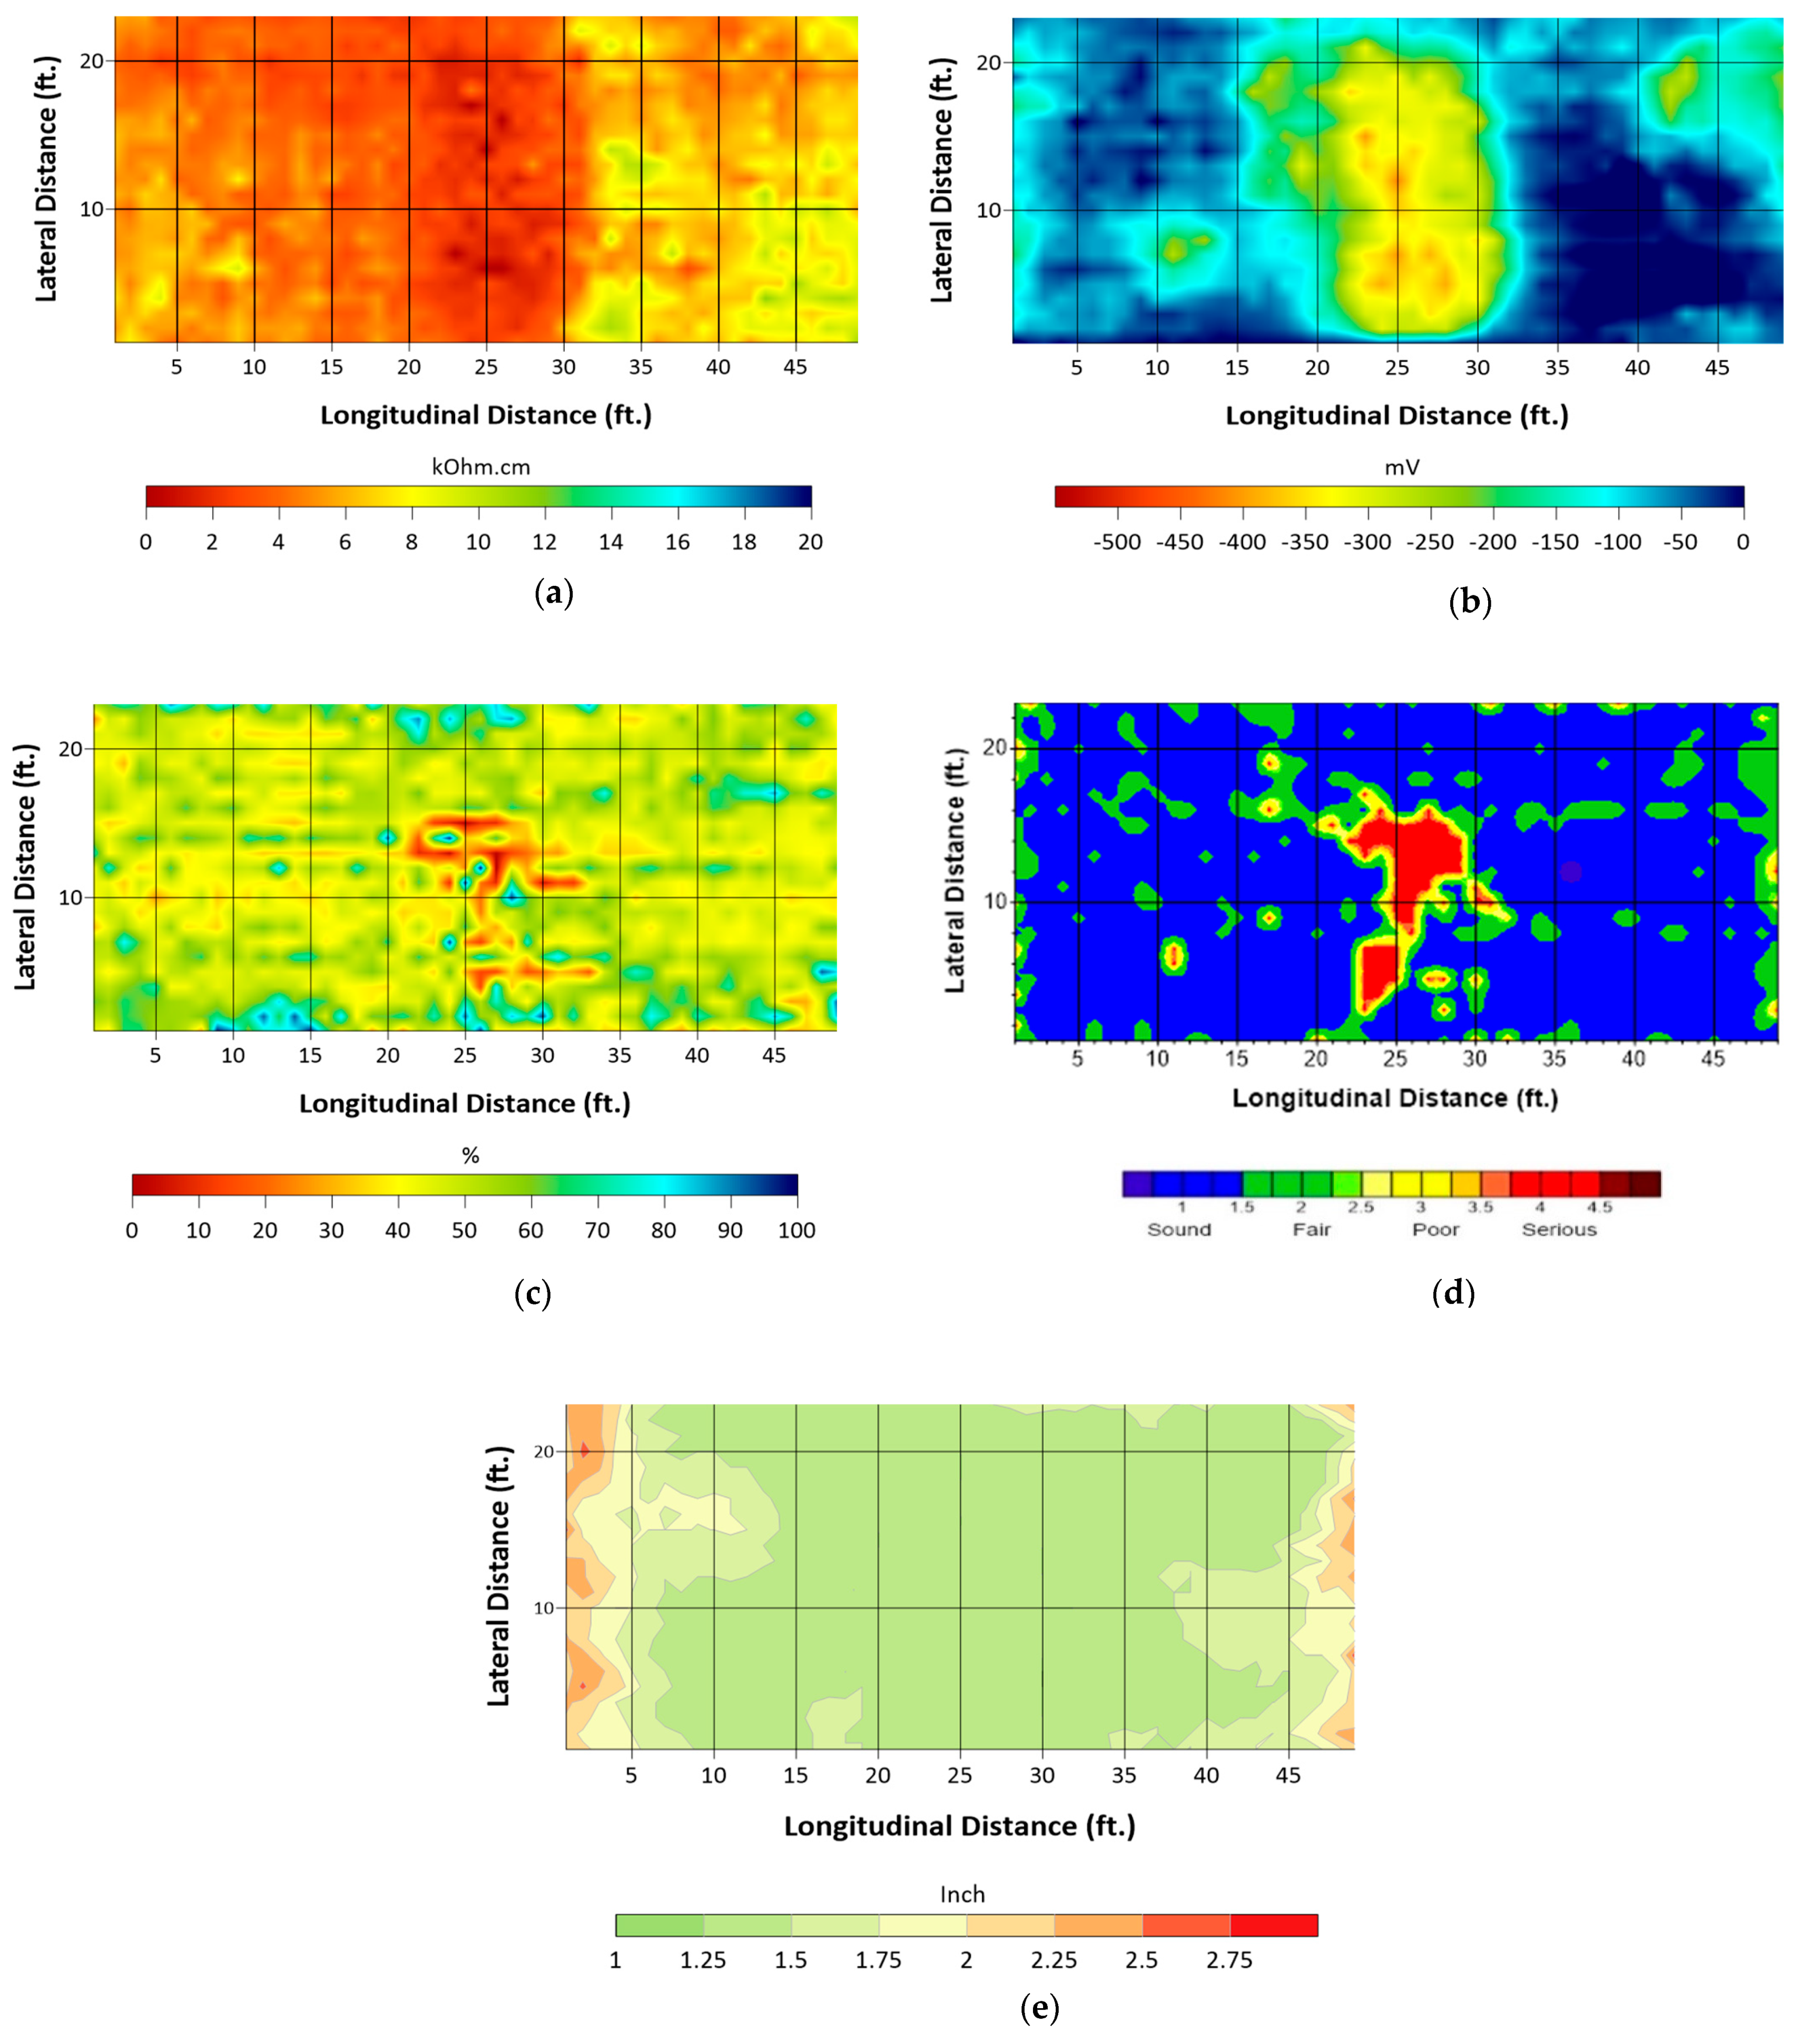
Figure 17a–e present a surface map of the BEAST slab for the electrical resistivity, half-cell potential, degree of saturation, impact echo condition assessment, and concrete cover, respectively.
The results from the impact echo test were unable to determine the depth of delamination as it was shallow, with a maximum depth of about 3 cm (1.25 in). The delamination was found to be located within the concrete cover located at the boundary between the top reinforcement mesh and the concrete. As per the visible spalling, the shallow delamination corresponded with the top reinforcement layer, as shown in
Figure 17d. Furthermore, the concrete cover measurements were obtained from the GPR survey, as illustrated in
Figure 17e. A comparison of results from before and after implementing the algorithm is displayed in
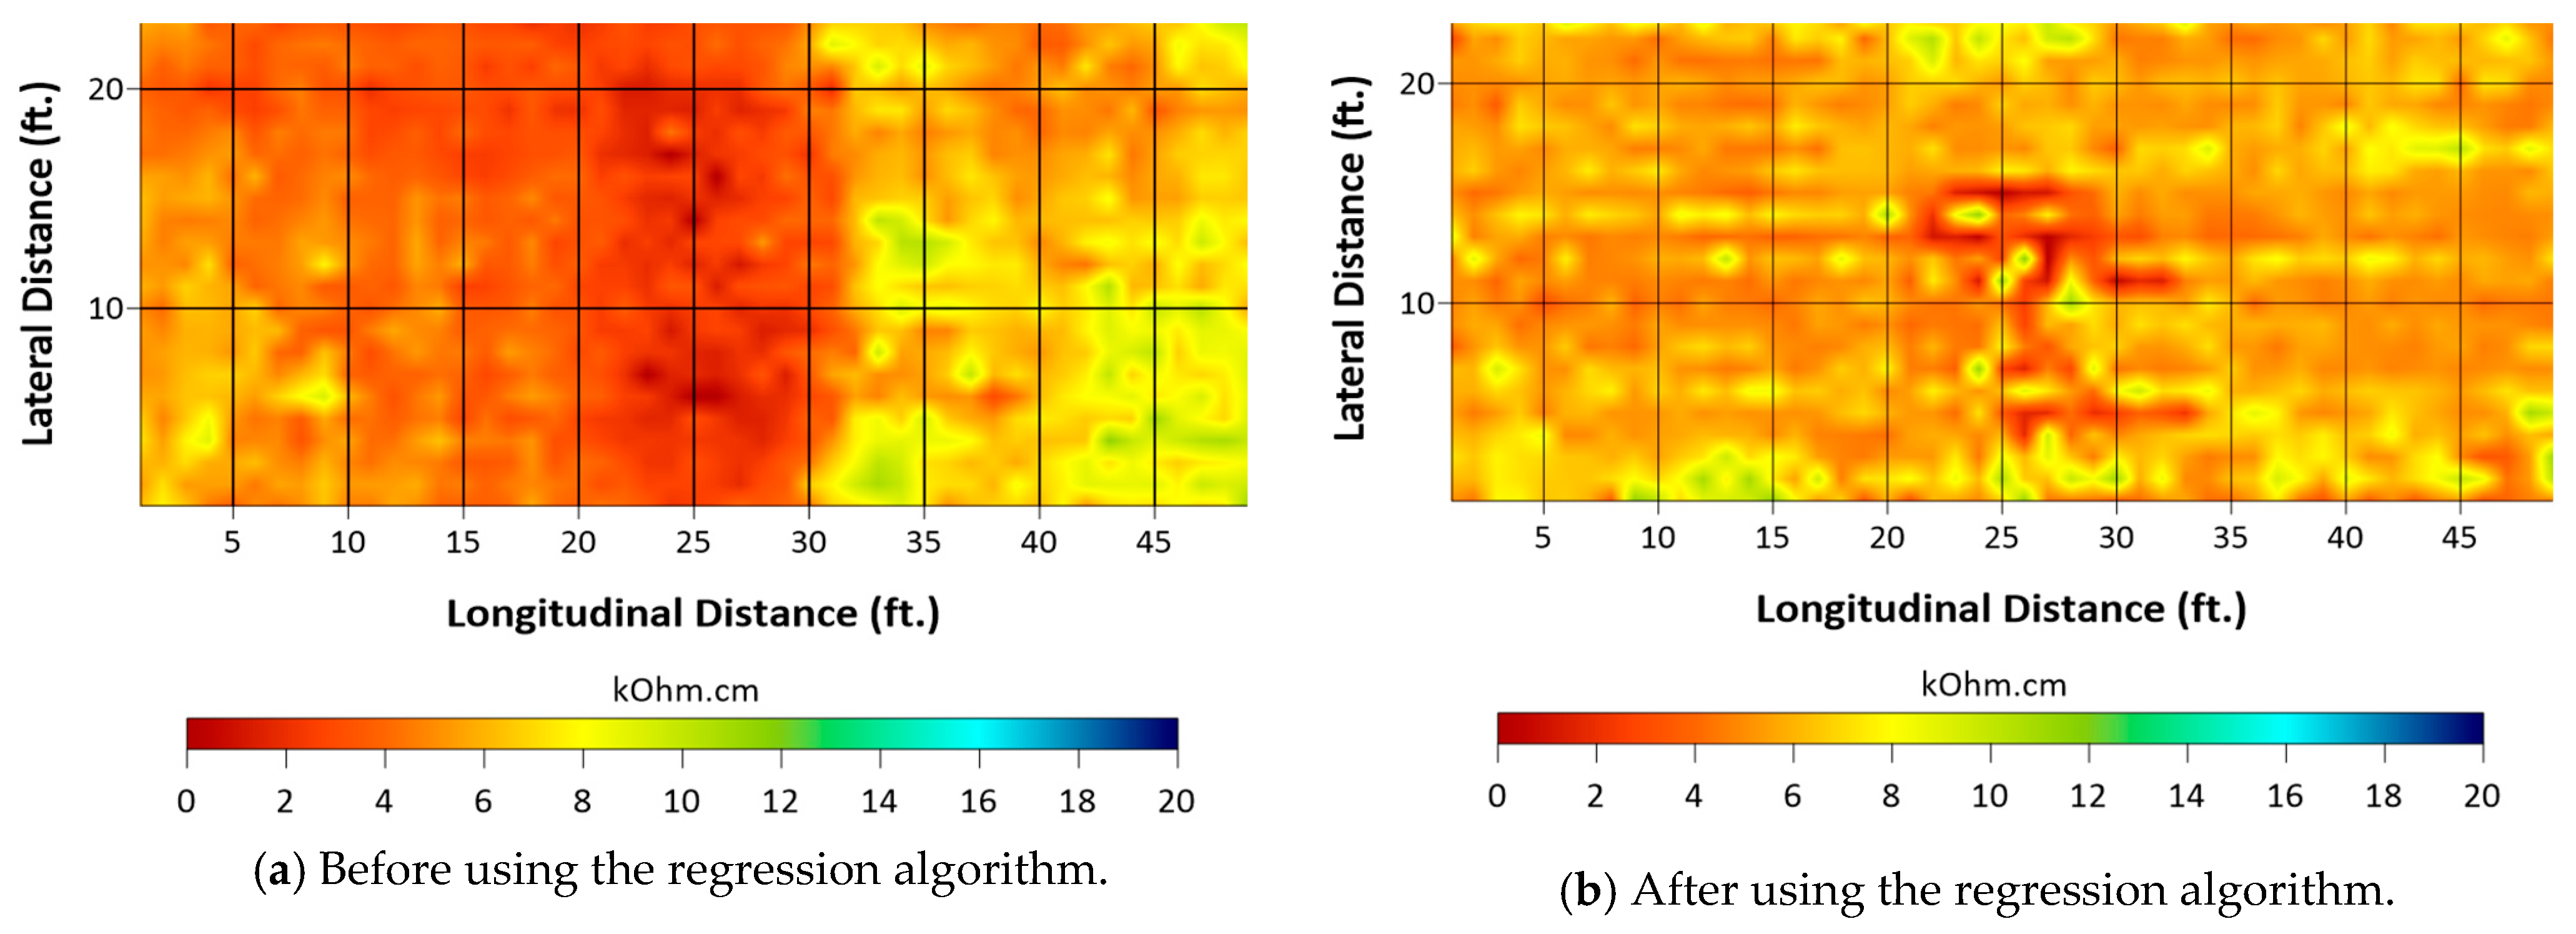
Figure 18 and
Figure 19 for ER and the HCP, respectively. Significant modifications in the ER measurement values can be observed by comparing
Figure 18a (without the algorithm) to
Figure 18b (with the algorithm). The measurements increased from approximately 12 kOhm.cm to roughly 25 kOhm.cm, with the minimum resistivity after using the algorithm appearing in the center of the slab. These changes are due to the impact of the DoS and delamination, which have a considerable influence on the measurement values, as discussed earlier in
Section 3. The algorithm improves the interpretation by correcting for the differences with reference values. The algorithm attempts to counteract the effect of the DoS by reducing resistivity in areas with a low DoS and increasing resistivity in areas with a high DoS. Furthermore, the IE delamination map in
Figure 17d highlights the location of shallow delamination, which is reflected in the corrected ER values in
Figure 18b. The algorithm tries to mitigate the impact of delamination on the ER measurement values by decreasing resistivity in the delaminated area, primarily in the center of the deck, as shown in
Figure 17d.
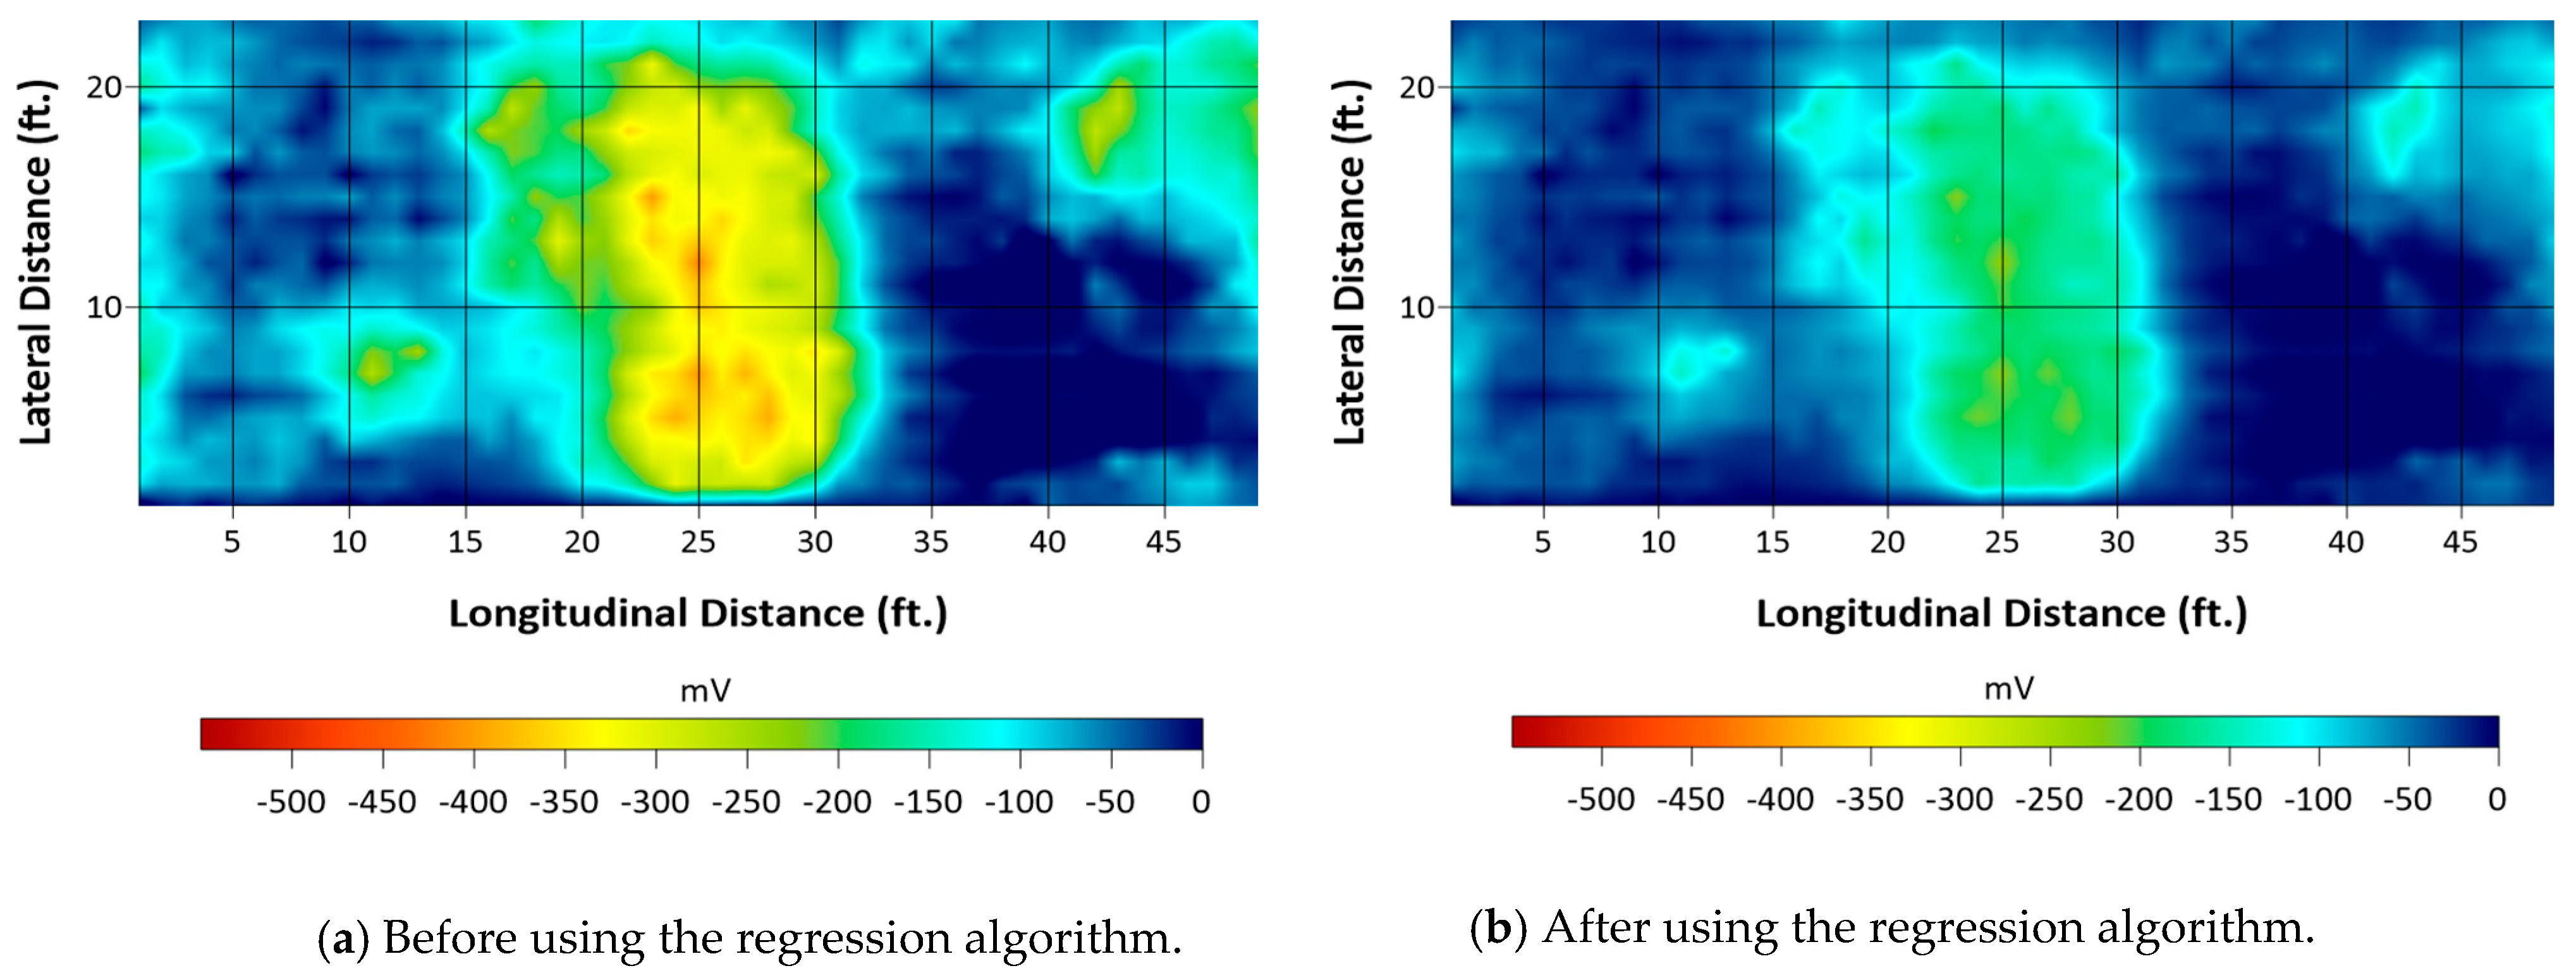
Similarly, the algorithm has produced significant changes in the HCP values. The corrected HCP values in
Figure 19b are a result of the impact of the DoS, delamination, and CC parameters. The algorithm corrects the impact of these parameters by moving the HCP values towards the right side of the scale (less negative values) for areas with high DoS values. Likewise, the HCP values are shifted towards less negative values for areas with low CC values. However, the HCP values are shifted towards the left side (more negative values) for areas with low DoS values.
5.2. Applying the Classification Algorithm
The results produced by this algorithm are classifications, as opposed to the numerical outputs produced by the regression algorithm. Both algorithms were applied to the same BEAST data set. This algorithm makes predictions based on seven categories: four categories for ER (Negligible, Weak, Moderate, and High), and three categories for the HCP (No Corrosion, Transition, and Corrosion).
Figure 20 and
Figure 21 illustrate the surface maps, before and after applying the classification algorithm, for the half-cell potential and electrical resistivity, respectively, based on the seven categories previously mentioned.
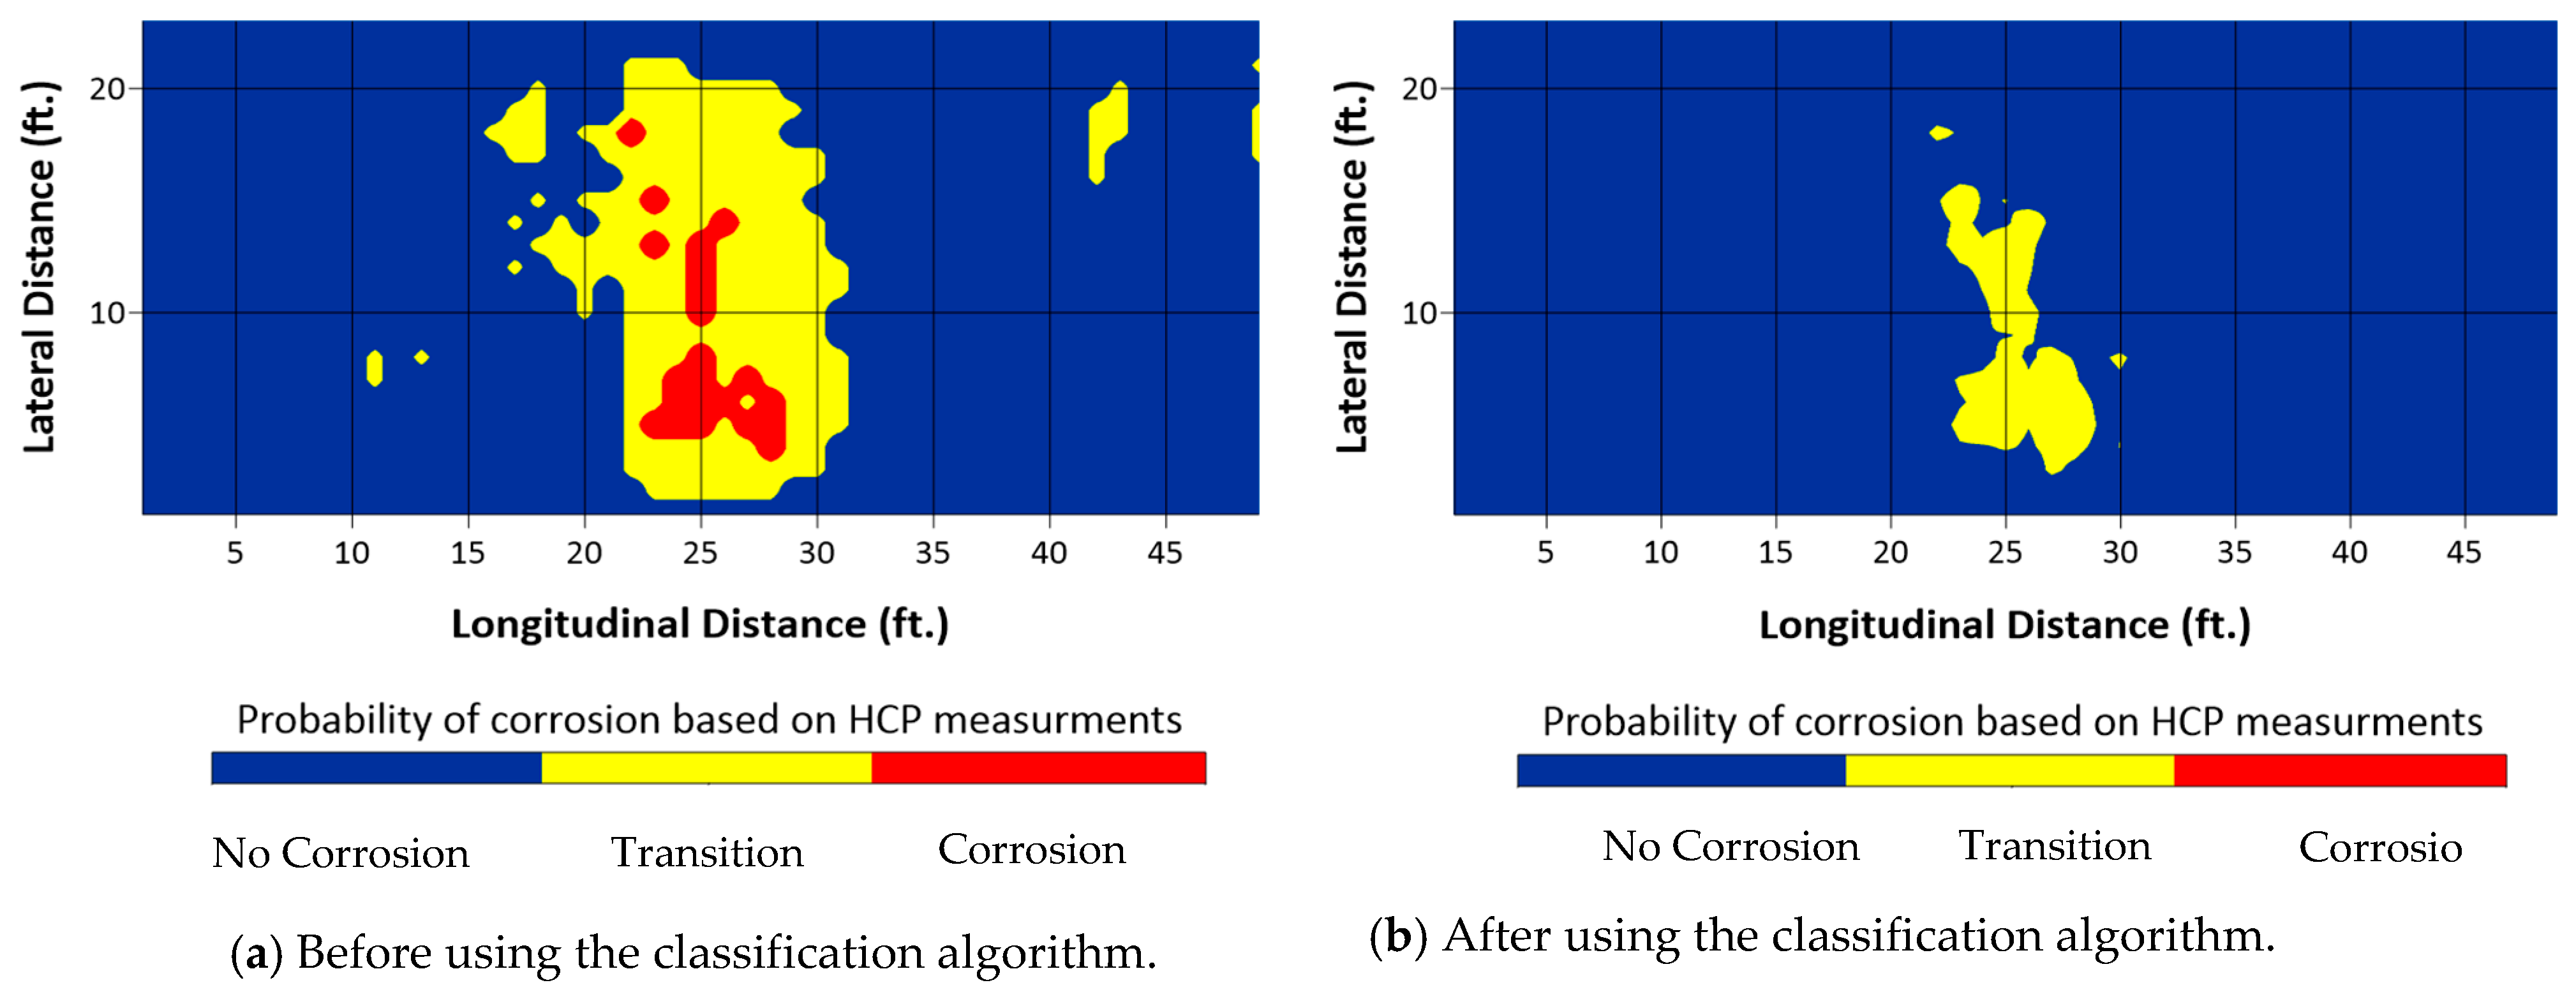
In
Figure 20b, the classification algorithm primarily corrects the HCP values located in the central area of the slab. These corrected values are a result of the influence of parameters such as the DoS, delamination, and CC. The algorithm determines the impact of these factors by categorizing the corrosion area as a transition zone according to the ASTM standard. The high DoS and low CC levels cause the algorithm to interpret the increase in the HCP as a result of improved conductivity. Meanwhile,
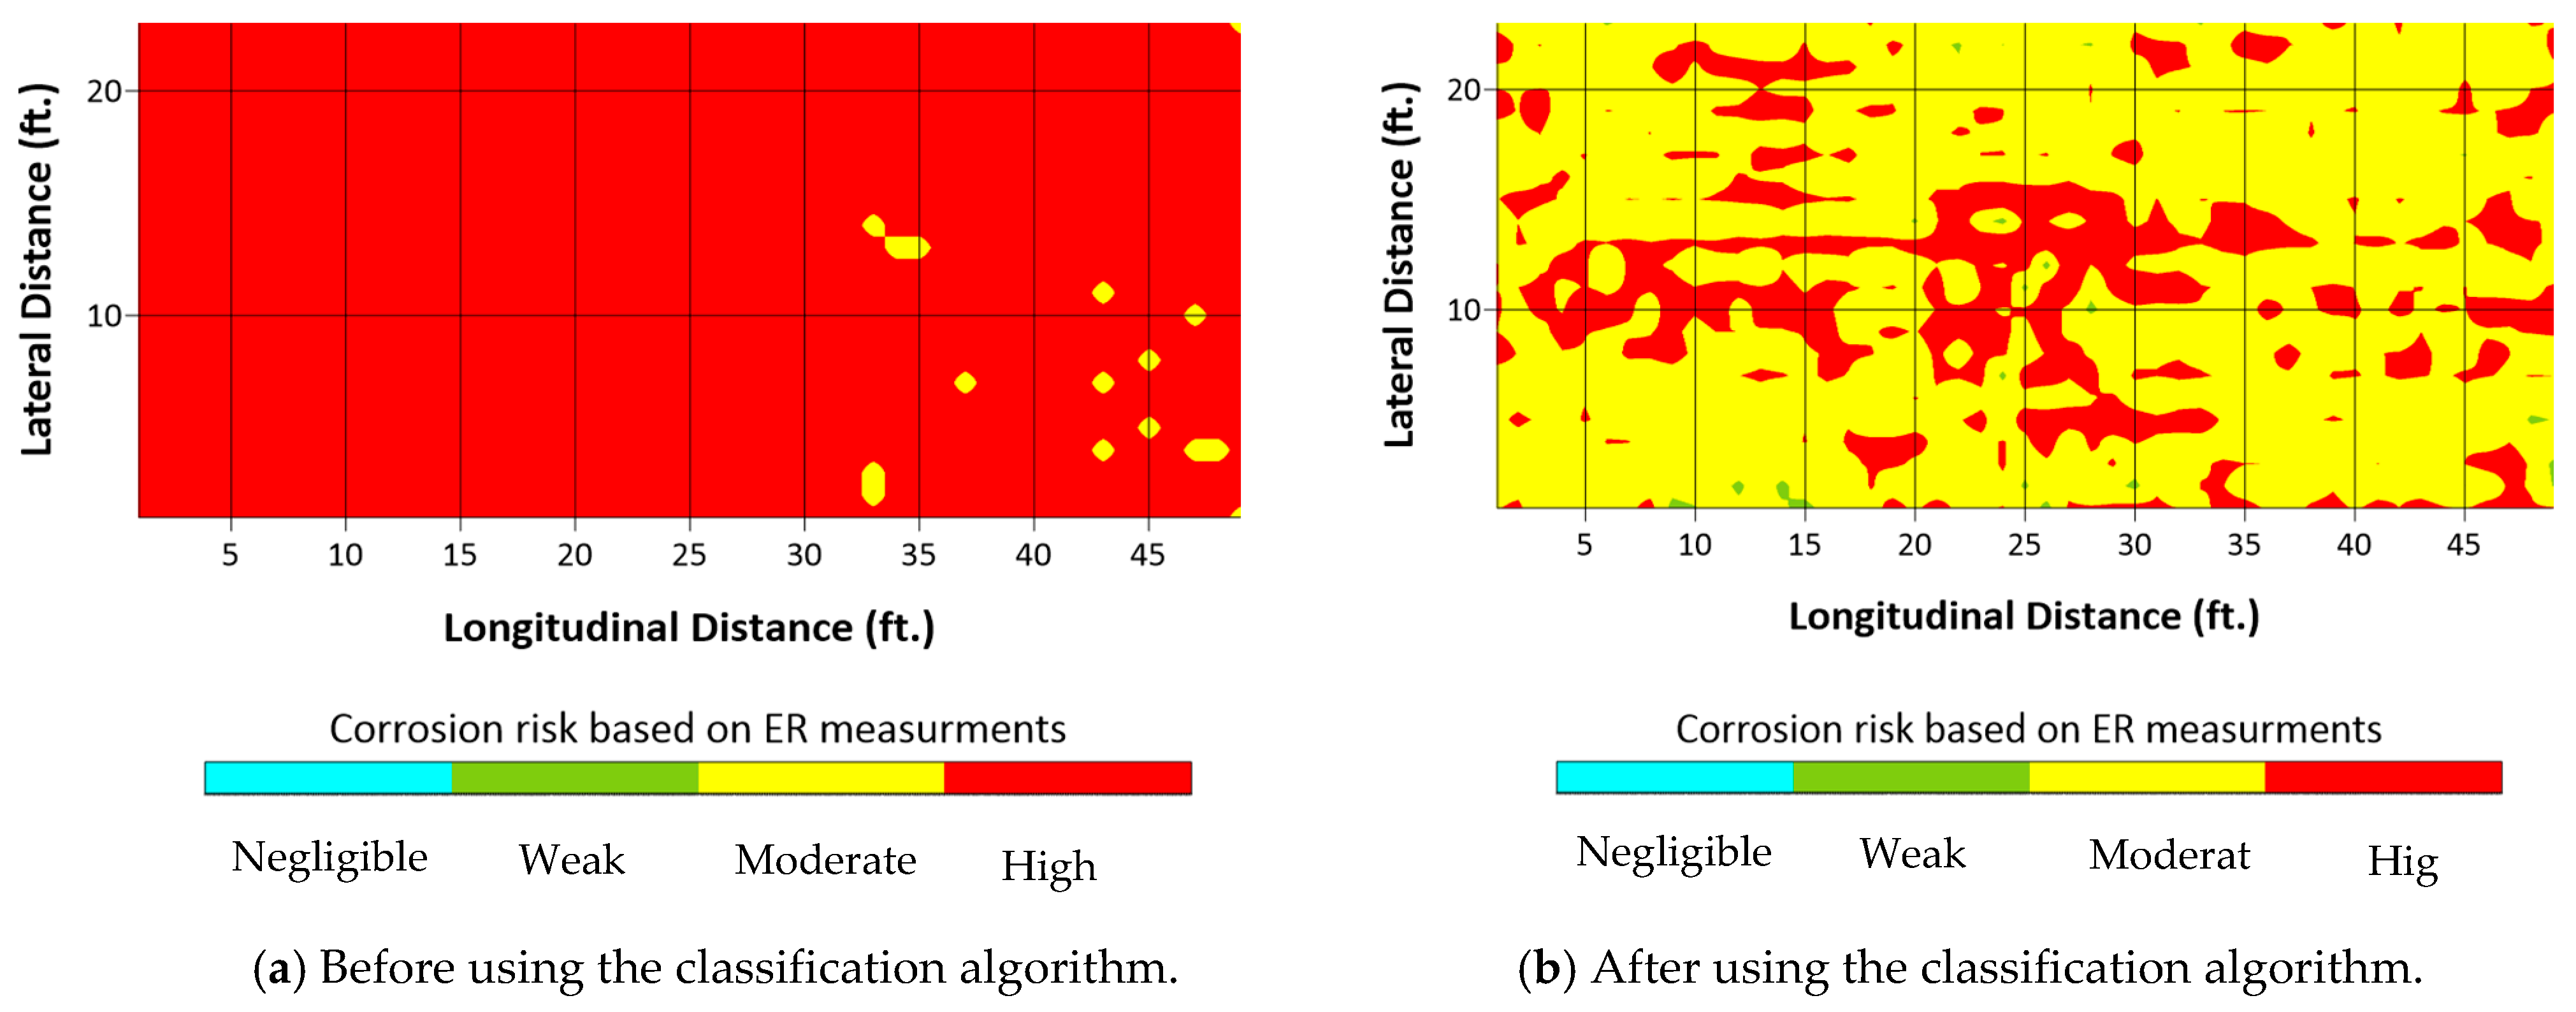
Figure 21b shows that the classification algorithm has reclassified most areas with low resistivity (high corrosion risk) as areas with higher resistivity (moderate corrosion risk). This is, again, due to the effect of a high DoS and the slight impact of delamination, which is represented by a small red dot in the center, indicating a low resistivity value (high corrosion risk).
6. Summary and Conclusions
This research analyzed the impact of various parameters on the NDE measurement results of electrical resistivity (ER) and half-cell potential (HCP) measurements. The findings demonstrate that merging data from multiple technologies can enhance the interpretation of NDE results. The classification and regression algorithms used showed high accuracy in predicting the ER and HCP measurement classifications and values, respectively. The correlation between the predicted and actual values for ER was 0.92, and for the HCP, it was 0.91, which suggests a strong positive correlation.
The results of the numerical simulations and machine learning algorithms applied to an improved interpretation of NDE measurements led to several conclusions:
The ER measurements are significantly impacted by the degree of saturation, delamination depth, and moisture condition of the delamination, while HCP measurements are greatly affected by the degree of saturation, corrosion length, delamination depth, concrete cover, and moisture condition of the delamination.
The results indicate that the HCP has limitations in detecting localized active corrosion less than or equal to 2.5 cm because the potential distribution due to active corrosion cannot exceed the ASTM threshold (−350 mV). The detection of larger localized corrosion depends on the degree of saturation.
The concrete cover thickness affects HCP measurements, and a proper correction must be made to describe it for the reference concrete cover thickness. As the thickness increases, the measured potential decreases and vice versa.
The degree of saturation has a significant impact on both ER and HCP measurements. The HCP values decrease (become more negative) as saturation increases due to increased conductivity changing the potential distribution between the anode and cathode.
Strong correlations were established from numerical simulations between the selected parameters and NDE technology measurement values, enabling their improved interpretation.
Machine learning algorithms are effective correction tools that take into account the effects of all explored parameters.
Both regression and classification algorithms can be used as correction tools, but regression provides higher-resolution corrected values.
All five examined parameters have a significant impact on the measurements and should be considered in the interpretation process.
Author Contributions
Conceptualization, N.G.; methodology, M.K.; software, M.K.; validation, M.K.; investigation, M.K.; data curation, M.K. and N.G.; writing—original draft preparation, M.K.; writing—review and editing, N.G. All authors have read and agreed to the published version of the manuscript.
Funding
This research received no external funding.
Data Availability Statement
Data are contained within the article.
Acknowledgments
The authors gratefully acknowledge the support of the Ministry of Higher Education and Scientific Research in Iraq for the doctoral studies of Khudhair.
Conflicts of Interest
The authors declare no conflict of interest.
References
- Keßler, S.; Gehlen, C. Influence of Concrete Moisture Condition on Half-Cell Potential Measurement. In Proceedings of the 5th International Conferene on the Durability of Concrete Structures (ICDCS), Shenzhen, China, 30 June 2016; pp. 257–264. [Google Scholar] [CrossRef]
- Hussain, R.R. Underwater half-cell corrosion potential bench mark measurements of corroding steel in concrete influenced by a variety of material science and environmental engineering variables. Meas. J. Int. Meas. Confed. 2011, 44, 274–280. [Google Scholar] [CrossRef]
- Negrutiu, C.M. Aspects Regarding Half—Cell Potential Mapping for Reinforced High Strength Concrete. J. Appl. Eng. Sci. 2011, 1, 103–110. [Google Scholar]
- Chabi, P.; Isgor, O.B.; Martin-Perez, B.; Ghods, P. Effectiveness of half-cell potential mapping in corrosion assessment of reinforcement in loaded concrete bridge decks. Proc. Annu. Conf. Can. Soc. Civ. Eng. 2013, 5, 4073–4081. [Google Scholar]
- Yodsudjai, W.; Pattarakittam, T. Factors influencing half-cell potential measurement and its relationship with corrosion level. Meas. J. Int. Meas. Confed. 2017, 104, 159–168. [Google Scholar] [CrossRef]
- Bourreau, L.; Gaillet, L.; Bouteiller, V.; Schoefs, F.; Bourreau, L.; Gaillet, L.; Bouteiller, V.; Schoefs, F.; Thauvin, B.; Bourreau, L.; et al. Better understanding of tide’s influence on half-cell potential and electrical resistivity measurements for reinforced concrete in marine environment. In Proceedings of the IABSE Symposium, Nantes, France, 19–21 September 2018. [Google Scholar]
- Rodrigues, R.; Gaboreau, S.; Gance, J.; Ignatiadis, I.; Betelu, S. Reinforced concrete structures: A review of corrosion mechanisms and advances in electrical methods for corrosion monitoring. Constr. Build. Mater. 2021, 269, 121240. [Google Scholar] [CrossRef]
- Pour-Ghaz, M.; Isgor, O.B.; Ghods, P. Quantitative interpretation of half-cell potential measurements in concrete structures. J. Mater. Civ. Eng. 2009, 21, 467–475. [Google Scholar] [CrossRef]
- Gucunski, N.; Romero, F.; Kruschwitz, S.; Feldmann, R.; Abu-Hawash, A.; Dunn, M. Multiple complementary nondestructive evaluation technologies for condition assessment of concrete bridge decks. Transp. Res. Rec. 2010, 2201, 34–44. [Google Scholar] [CrossRef]
- Sassine, E.; Laurens, S.; François, R.; Ringot, E. A critical discussion on rebar electrical continuity and usual interpretation thresholds in the field of half-cell potential measurements in steel reinforced concrete. Mater. Struct. Constr. 2018, 51, 93. [Google Scholar] [CrossRef]
- Khudhair, M.; Gucunski, N. Multi-NDE Technology Approach to Improve Interpretation of Corrosion in Concrete Bridge Decks Based on Electrical Resistivity Measurements. Sensors 2023, 23, 8052. [Google Scholar] [CrossRef] [PubMed]
- Gucunski, N.; La, H.M.; Dinh, K.; Khudhair, M. Advancing Condition Assessment of Reinforced Concrete Bridge Elements Through Automation, Visualization, and Improved Interpretation of Multi-NDE Technology Data. Mater. Eval. 2023, 81, 56–66. [Google Scholar]
- Hornbostel, K.; Larsen, C.K.; Geiker, M.R. Relationship between concrete resistivity and corrosion rate—A literature review. Cem. Concr. Compos. 2013, 39, 60–72. [Google Scholar] [CrossRef]
- Weiss, J.; Snyder, K.; Bullard, J.; Bentz, D. Using a saturation function to interpret the electrical properties of partially saturated concrete. J. Mater. Civ. Eng. 2013, 25, 1097–1106. [Google Scholar] [CrossRef]
- Larsen, C.K.; Sellevold, E.J.; Askeland, F.; Østvik, J.M.; Vennesland, O. Electrical resistivity of concrete part II: Influence of moisture content and temperature. In Proceedings of the 2nd International RILEM Symposium on Advances in Concrete through Science and Engineering, Quebec City, QC, Canada, 11–13 September 2006. [Google Scholar]
- Azarsa, P.; Gupta, R. Electrical Resistivity of Concrete for Durability Evaluation: A Review. Adv. Mater. Sci. Eng. 2017, 2017, 8453095. [Google Scholar] [CrossRef]
- Elkey, W.; Sellevold, E.J. Electrical Resistivity of Concrete. Report; Norwegian Road Research Laboratory (Statens Vegvesen. Vegdirektoratet): Oslo, Norway, 1995; 33p. [Google Scholar]
- Sanchez Marquez, J.M. Influence of Saturation and Geometry on Surface Electrical Resistivity Measurements. Ph.D. Thesis, Concordia University, Montreal, QC, Canada, 2015. [Google Scholar]
- Khudhair, M.J.; Gucunski, N. Effects of Concrete Delamination and Cracking on Electrical Resistivity Measurement Results. In Proceedings of the NDE/NDT for Highways & Bridges: SMT 2018, New Brunswick, NJ, USA, 27–29 August 2018. [Google Scholar]
- Gowers, K.; Millard, S. Measurement of concrete resistivity for assessment of corrosion. ACI Mater. J. 1999, 96, 536–541. [Google Scholar]
- Sansalone, M.J.; Streett, W.B. Impact-Echo. Nondestructive Evaluation of Concrete and Masonry; Bullbrier Press: Jersey Shore, PA, USA, 1997. [Google Scholar]
- Sengupta, A.; Ilgin Guler, S.; Shokouhi, P. Interpreting Impact Echo Data to Predict Condition Rating of Concrete Bridge Decks: A Machine-Learning Approach. J. Bridg. Eng. 2021, 26, 04021044. [Google Scholar] [CrossRef]
- Mohamadi, S.; Lattanzi, D.; Azari, H. Fusion and Visualization of Bridge Deck Nondestructive Evaluation Data via Machine Learning. Front. Mater. 2020, 7, 392. [Google Scholar] [CrossRef]
- Harley, J.B.; Sparkman, D. Machine learning and NDE: Past, present, and future. In Proceedings of the AIP Conference Proceedings, Rhodos, Greece, 1–5 May 2019; AIP Publishing LLC: Melville, NY, USA, 2019; Volume 2102, p. 90001. [Google Scholar]
- Zhang, J.-K.; Yan, W.; Cui, D.-M. Concrete condition assessment using impact-echo method and extreme learning machines. Sensors 2016, 16, 447. [Google Scholar] [CrossRef] [PubMed]
- Kruschwitz, S.; Ebell, G.; Shen, J. Towards Data Based Corrosion Analysis of Concrete with Supervised Machine Learning. In Proceedings of the Structural Materials Technology (SMT 2018) and the International Symposium Non-Destructive Testing in Civil Engineering, New Brunswick, NJ, USA, 27–29 August 2018. [Google Scholar]
- Chun, P.; Ujike, I.; Mishima, K.; Kusumoto, M.; Okazaki, S. Random Forest-based evaluation technique for internal damage in reinforced concrete featuring multiple nondestructive testing results. Constr. Build. Mater. 2020, 253, 119238. [Google Scholar] [CrossRef]
- Polder, R.B. Test methods for on site measurement of resistivity of concrete—A RILEM TC-154 technical recommendation. Constr. Build. Mater. 2001, 15, 125–131. [Google Scholar] [CrossRef]
- ASTM C876-15; Standard Test Method for Corrosion Potentials of Uncoated Reinforcing Steel in Concrete. ASTM International: West Conshohocken, PA, USA, 2015.
Figure 1.
Finite element 3D model components.
Figure 1.
Finite element 3D model components.
Figure 2.
A-A cross-section.
Figure 2.
A-A cross-section.
Figure 3.
Potential distribution for 15 cm corrosion length and 0.5 DoS: (a) no delamination; (b) AFD at 30 mm; (c) WFD at 30 mm.
Figure 3.
Potential distribution for 15 cm corrosion length and 0.5 DoS: (a) no delamination; (b) AFD at 30 mm; (c) WFD at 30 mm.
Figure 4.
HCP measurements for sound concrete: (a) 38 mm CC; (b) 51 mm CC; (c) 63 mm CC; (d) 76 mm CC.
Figure 4.
HCP measurements for sound concrete: (a) 38 mm CC; (b) 51 mm CC; (c) 63 mm CC; (d) 76 mm CC.
Figure 5.
C-C cross-section.
Figure 5.
C-C cross-section.
Figure 6.
Concrete potential distributions from ER simulations: (a) sound concrete; (b) AFD at 70 mm; (c) WFD at 70 mm.
Figure 6.
Concrete potential distributions from ER simulations: (a) sound concrete; (b) AFD at 70 mm; (c) WFD at 70 mm.
Figure 7.
ER for the models: (a) for sound concrete; (b) with AFD at different depths; (c) with WFD at different depths.
Figure 7.
ER for the models: (a) for sound concrete; (b) with AFD at different depths; (c) with WFD at different depths.
Figure 8.
B-B cross-section for sound concrete.
Figure 8.
B-B cross-section for sound concrete.
Figure 9.
Acceleration time history.
Figure 9.
Acceleration time history.
Figure 10.
Frequency spectra.
Figure 10.
Frequency spectra.
Figure 11.
Workflow diagram for the HCP and ER classification algorithm.
Figure 11.
Workflow diagram for the HCP and ER classification algorithm.
Figure 12.
Confusion matrix for the number of instances: (a) for the HCP; (b) for ER.
Figure 12.
Confusion matrix for the number of instances: (a) for the HCP; (b) for ER.
Figure 13.
Workflow diagram for the HCP and ER regression algorithm.
Figure 13.
Workflow diagram for the HCP and ER regression algorithm.
Figure 14.
Scatter plot of Random Forest predictions against actual values: (a) for ER; (b) for the HCP.
Figure 14.
Scatter plot of Random Forest predictions against actual values: (a) for ER; (b) for the HCP.
Figure 15.
The loading device that represents the truck axel loads at the BEAST® facility.
Figure 15.
The loading device that represents the truck axel loads at the BEAST® facility.
Figure 16.
Data collection of the NDE technologies on the BEAST slab. (a) Grid mark on the concrete deck; (b) electrical resistivity; (c) half-cell potential; (d) impact echo; (e) MOIST-Scan.
Figure 16.
Data collection of the NDE technologies on the BEAST slab. (a) Grid mark on the concrete deck; (b) electrical resistivity; (c) half-cell potential; (d) impact echo; (e) MOIST-Scan.
Figure 17.
NDE surface map from the data collected on the BEAST slab for the (a) electrical resistivity; (b) half-cell potential; (c) degree of saturation; (d) impact echo condition assessment; (e) concrete cover, obtained via GPR survey.
Figure 17.
NDE surface map from the data collected on the BEAST slab for the (a) electrical resistivity; (b) half-cell potential; (c) degree of saturation; (d) impact echo condition assessment; (e) concrete cover, obtained via GPR survey.
Figure 18.
Electrical resistivity result comparison.
Figure 18.
Electrical resistivity result comparison.
Figure 19.
Half-cell potential result comparison.
Figure 19.
Half-cell potential result comparison.
Figure 20.
Half-cell potential result comparison.
Figure 20.
Half-cell potential result comparison.
Figure 21.
Electrical resistivity result comparison.
Figure 21.
Electrical resistivity result comparison.
Table 1.
Material properties.
Table 1.
Material properties.
| Materials | Properties |
|---|
Electrical Conductivity
(S/m) | Relative Permittivity |
|---|
| Concrete | 0.002 | 4.5 |
| Water * | 0.5 | 88.1 |
| Air * | 3 × 10⁻¹⁵ | 1 |
Table 2.
Classification accuracy of the algorithm for different classes.
Table 2.
Classification accuracy of the algorithm for different classes.
| | The Target Class | Classification Accuracy |
| ER | Negligible | 96.6% |
| Weak | 98.6% |
| Moderate | 94.7% |
| High | 95.3% |
| Average Over Classes | 92.6% |
| HCP | No Corrosion | 93.1% |
| Transition | 87.9% |
| Corrosion | 90.7% |
| Average Over Classes | 85.9% |
Table 3.
Evaluation results.
Table 3.
Evaluation results.
| | Target Class | Model | AUC | CA | F1 | Precision | Recall |
| ER | Negligible | Random Forest | 0.991 | 0.966 | 0.932 | 0.897 | 0.971 |
| Weak | Random Forest | 0.993 | 0.986 | 0.954 | 0.984 | 0.926 |
| Moderate | Random Forest | 0.978 | 0.947 | 0.827 | 0.848 | 0.807 |
| High | Random Forest | 0.990 | 0.953 | 0.947 | 0.951 | 0.944 |
| Average Over Classes | Random Forest | 0.989 | 0.926 | 0.926 | 0.927 | 0.926 |
| HCP | No Corrosion | Random Forest | 0.979 | 0.931 | 0.837 | 0.808 | 0.867 |
| Transition | Random Forest | 0.894 | 0.879 | 0.596 | 0.688 | 0.525 |
| Corrosion | Random Forest | 0.971 | 0.907 | 0.928 | 0.910 | 0.946 |
| Average Over Classes | Random Forest | 0.953 | 0.859 | 0.853 | 0.851 | 0.859 |
| Disclaimer/Publisher’s Note: The statements, opinions and data contained in all publications are solely those of the individual author(s) and contributor(s) and not of MDPI and/or the editor(s). MDPI and/or the editor(s) disclaim responsibility for any injury to people or property resulting from any ideas, methods, instructions or products referred to in the content. |
© 2023 by the authors. Licensee MDPI, Basel, Switzerland. This article is an open access article distributed under the terms and conditions of the Creative Commons Attribution (CC BY) license (https://creativecommons.org/licenses/by/4.0/).


