Article

Automatic Identification of Children with ADHD from EEG Brain Waves

Department of Electrical and Computer Engineering, Clarkson University, Potsdam, NY 13699, USA
*
Author to whom correspondence should be addressed.
Signals 2023, 4(1), 193-205; https://doi.org/10.3390/signals4010010
Submission received: 2 January 2023 / Revised: 3 February 2023 / Accepted: 7 February 2023 / Published: 21 February 2023

Abstract

:
EEG (electroencephalogram) signals could be used reliably to extract critical information regarding ADHD (attention deficit hyperactivity disorder), a childhood neurodevelopmental disorder. The early detection of ADHD is important to lessen the development of this disorder and reduce its long-term impact. This study aimed to develop a computer algorithm to identify children with ADHD automatically from the characteristic brain waves. An EEG machine learning pipeline is presented here, including signal preprocessing and data preparation steps, with thorough explanations and rationale. A large public dataset of 120 children was selected, containing large variability and minimal measurement bias in data collection and reproducible child-friendly visual attentional tasks. Unlike other studies, EEG linear features were extracted to train a Gaussian SVM-based model from only the first four sub-bands of EEG. This eliminates signals more than 30 Hz, thus reducing the computational load for model training while keeping mean accuracy of ~94%. We also performed rigorous validation (obtained 93.2% and 94.2% accuracy, respectively, for holdout and 10-fold cross-validation) to ensure that the developed model is minimally impacted by bias and overfitting that commonly appear in the ML pipeline. These performance metrics indicate the ability to automatically identify children with ADHD from a local clinical setting and provide a baseline for further clinical evaluation and timely therapeutic attempts.

1. Introduction

Attention deficit hyperactivity disorder (ADHD) is a behavior disorder characterized by inattention, impulsivity, and in some cases hyperactivity, typically diagnosed in childhood [1]. It is a common childhood developmental disorder. The symptoms of ADHD start before age 12, and in some children, they are noticeable as early as three years of age [2]. The prevalence of ADHD has been estimated at approximately 12.1% among boys and 3.9% among girls [3]. About 6.4 million American children aged 4–17 have been diagnosed with ADHD [4]. ADHD makes it difficult for children to develop the skills to control their attention, behavior, emotions, and activities. As a result, they often act in ways that are hard for parents to manage [5]. Persistent adult ADHD may cause serious long-term consequences, such as poor academic achievement and job performance, increased risk of antisocial behavior, and drug and alcohol abuse [3]. Hence, early detection of this disorder is of great value [6,7].
EEG is a reliable method that provides information about the background activity of the brain and indexes the substrate of cognition and behavior, shown in Table 1 [8]. Therefore, it can be a useful tool for investigating and diagnosing the abnormal behavior of ADHD children. J. Lubar conducted the first abnormalities study by EEG signals in ADHD in 1973. He found that theta (Table 1) activity increased and also beta (Table 1) power dramatically reduced in ADHD [9]. Most patients with ADHD have a common brain-wave pattern that consists of an abundance of slow (delta or theta) brain waves and a shortage of fast (beta) brain waves. This means that they have a high theta-to-beta ratio [10] that could be employed for automatic recognition from the characteristic brain wave.
Recently, researchers have been working with fMRI (functional magnetic resonance imaging) and MRI to identify ADHD. This is a fast-developing and complex research domain [13]. Rubia et al. [14,15] reported decreased activation in the ADHD group in mesial and lateral prefrontal areas in the right hemisphere and the cingulate gyrus by using fMRI. On the other hand, EEG is quicker, affordable, portable, and gives accessible insights into brain function. Therefore, EEG can be a useful gadget for investigating and diagnosing the abnormal behavior of ADHD children.
Even with the current progress, using EEG tests for ADHD detection needs a more precise approach in this area to get more accurate results. The amount of information in EEG signals is vast. It is also complicated for a human to detect abnormalities manually. This is where machine learning (ML) can be useful. Generally, ML is programming computers to optimize a performance criterion using example data or experience [16], which could be employed for the current task.
This study thus aims to automatically identify ADHD children employing machine learning techniques. Previously, most studies used nonlinear features of the EEG signal and used KNN or neural networks for classification (discussed in Section 2). In this study, we have extracted statistical, time-domain, and frequency-domain EEG features; used PCA to select the best features; trained a Gaussian SVM classifier on the selected features; and employed two cross-validation methods: holdout and k-fold cross-validation to validate classifier performance. Since ADHD’s behavior can be caused by differences in brain function, we worked with only four sub-bands: delta, theta, alpha, and beta frequency. The overall contributions of this work can be summarized as follows.
  • An EEG ML pipeline is presented for ADHD detection, explaining each stage of the pipeline (including signal preprocessing and data preparation) with thorough explanations and rationale.
  • Unlike other studies, we employed only the first four sub-bands of EEG, eliminating signals more than 30 Hz and thus reducing the computational load for ML model training while keeping mean accuracy of 93.2%.
  • Simple EEG linear features are emphasized in our proposed model development, whereas other works were only based on complex nonlinear features.
  • The model was trained on a large dataset of 120 children (the highest of other models was 49) collected from two different sessions at two different places, eliminating the measurement bias in data collection. Also, the experimental setup was child-friendly, easy to reproduce in local settings, and could be employed for future ADHD detection.
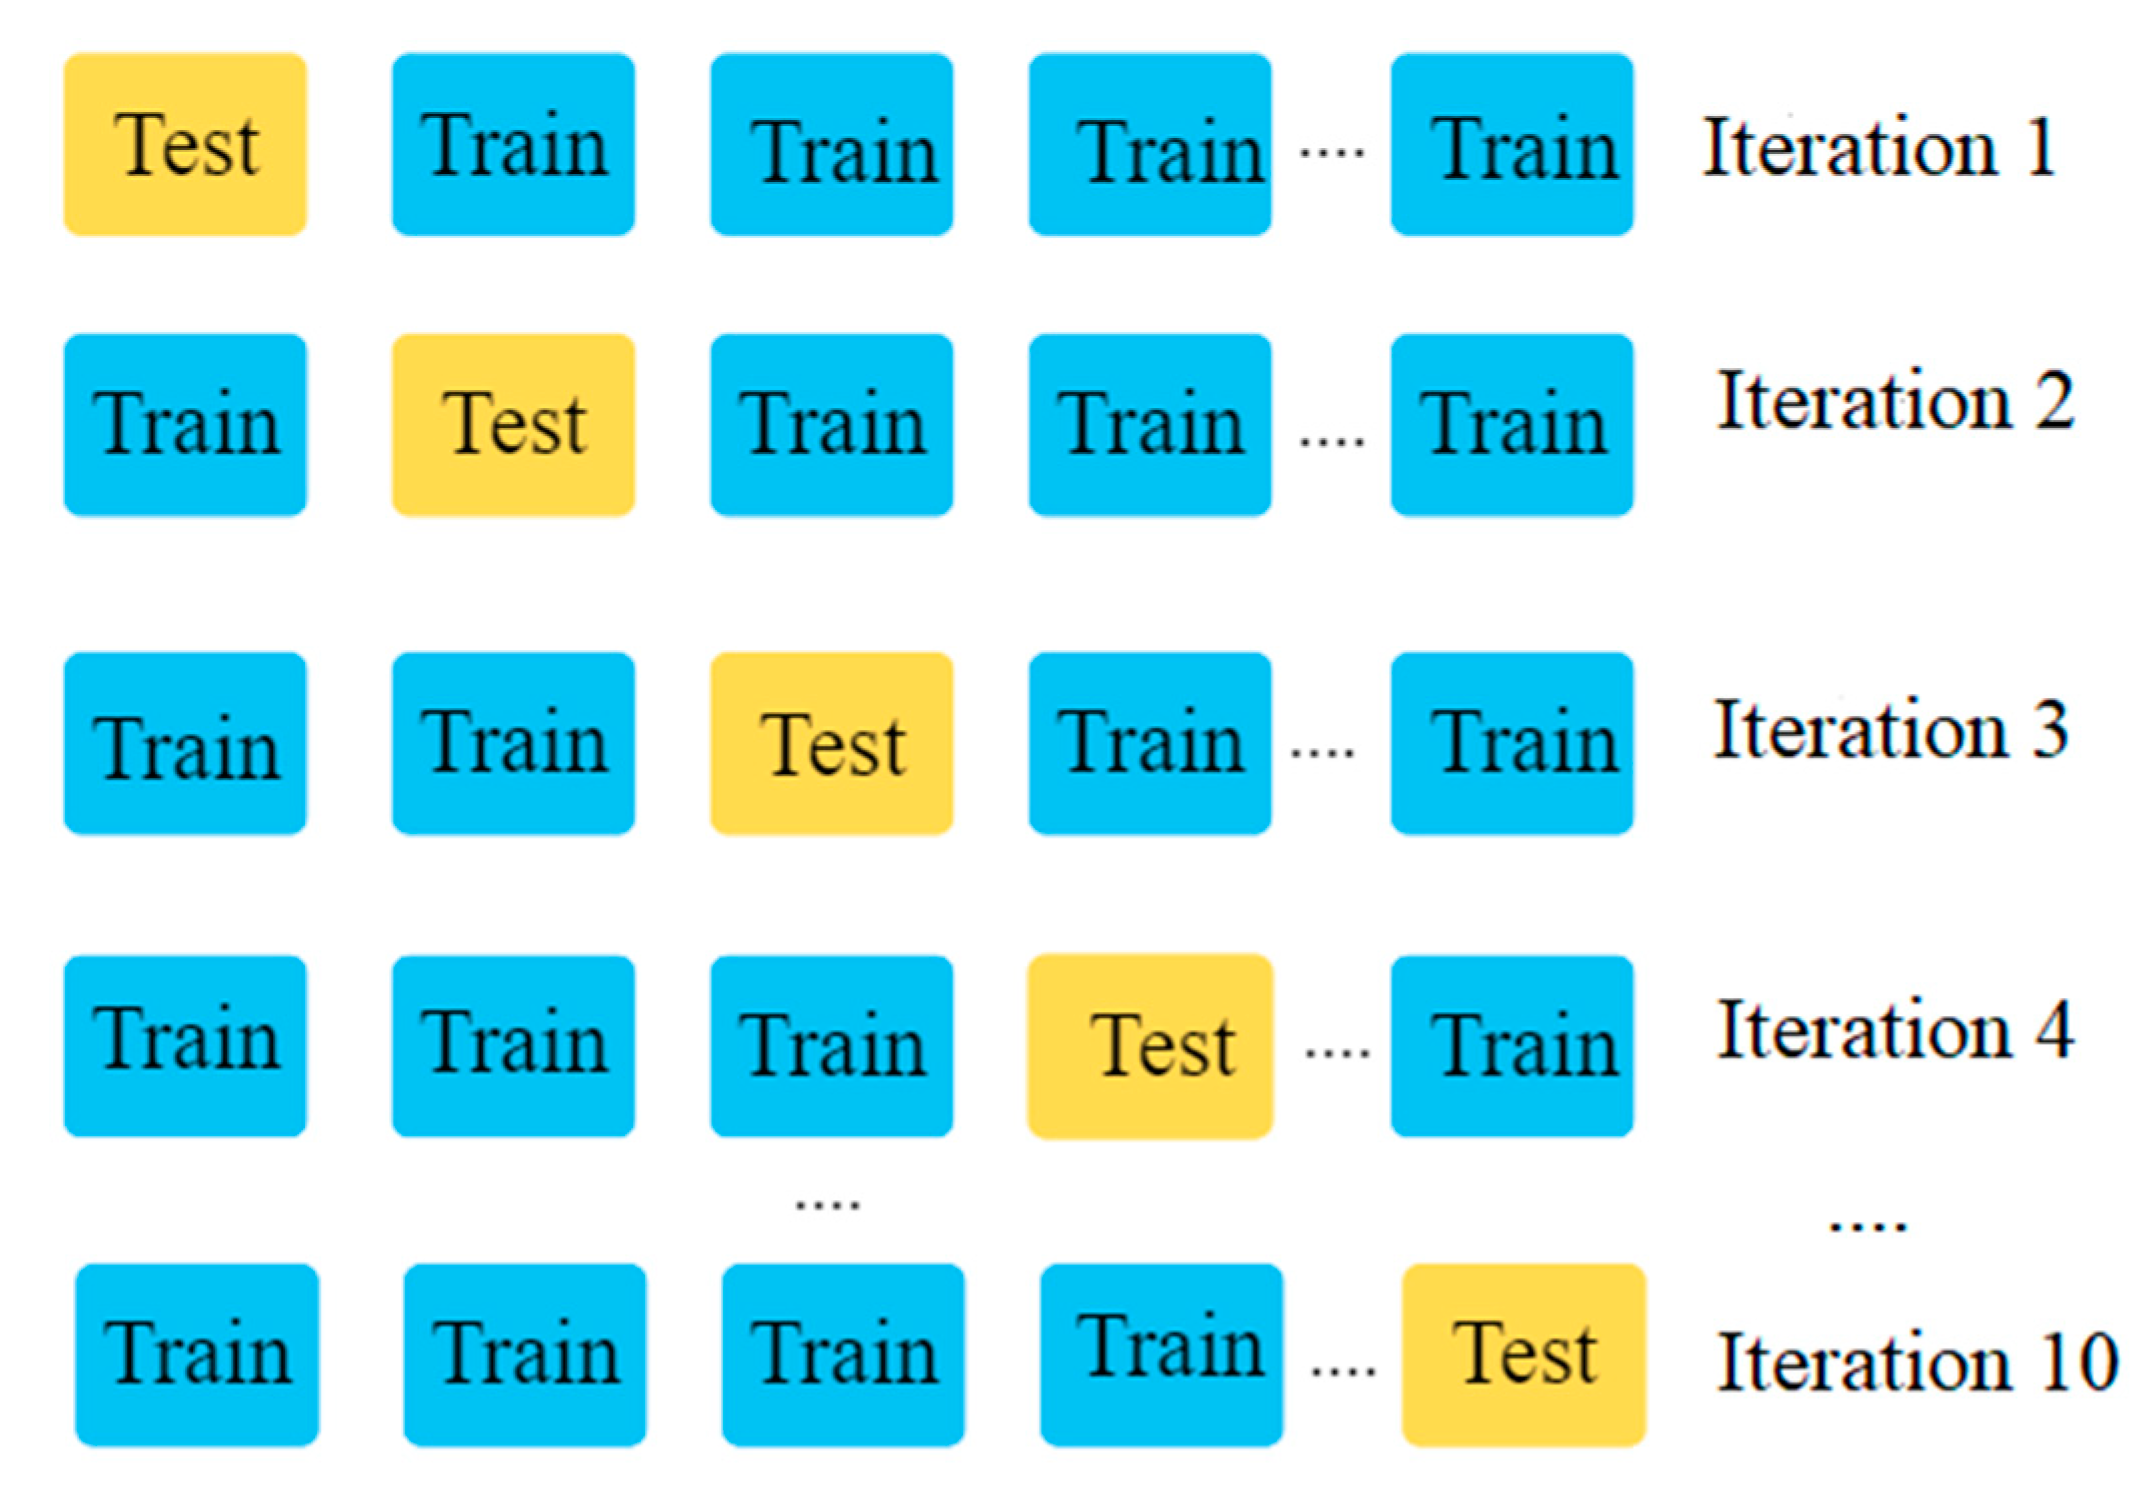
  • We also performed rigorous validation (unlike other works) to ensure that our model is not impacted by bias and overfitting, which commonly appear in the ML pipeline.
The rest of the paper is organized as follows. First, recent and related works are presented in Section 2. Materials and method information is given in Section 3, along with the dataset description. Section 4 describes the preprocessing methods. Section 5 describes the feature extraction and feature selection. Section 6 represents the results. Lastly, Section 7 and Section 8 give the discussion and conclusion of this study.

2. Related Works

ADHD was originally known as childhood hyperkinetic reaction [17]. The American Psychiatric Association (APA) did not officially recognize it as a mental disorder until the 1960s, and in the 1980s, the diagnosis was “attention deficit disorder with or without hyperactivity” [17]. Since then, many studies have been done to identify ADHD using fMRI and EEG. Yin et al. [18] found that neural flexibility altered in children with ADHD and demonstrated the potential clinical utility of neural flexibility to identify children with ADHD, as well as to monitor treatment responses and disease severity using fMRI data. They obtained moderate accuracy of 77% for 10-fold cross-validation and 74.46% for the independent test. Pulini et al. [19] mentioned that the accuracy of ADHD classification ranged from 60% to 80% using neuroimaging features. According to Pulini, circular analysis and a small sample can exaggerate high classification accuracies in neuroimaging studies of ADHD. The use fMRI shows moderate accuracy. It is also expensive, whereas EEG has more portability and freedom in data acquisition. Kiiski et al. [20] calculated the weighted phase lag index (WPLI) for each frequency band of EEG to describe the functional EEG connectivity as a neuromarker for adult ADHD symptoms. Alchalabi et al. [21] applied a machine learning classifier on an EEG-controlled serious game to detect ADHD patients, where EEG data was monitored during the game. In this study, the participants had to play a “FOCUS” game and their attention levels were observed. In the game, the player had to move an avatar by focusing and using mental commands. It achieved 96% in classifying the EEG data to detect the correct attention state during gameplay and 98% in classifying the patients’ EEG data. Ghassemi et al. [22] used nonlinear EEG features to classify adult normal and ADHD participants. Fifty participants underwent a continuous performance test (CPT), where they had to click the left mouse button with their index finger when any letter except for the target “X” was shown on the screen. Three nonlinear features—wavelet entropy, correlation dimension, and Lyapunov exponent—were extracted, and the KNN algorithm was used as a classifier. This study achieved an accuracy of around 96%. Mohammadi et al. [23] performed EEG classification on the data acquired from 30 healthy (9.85 ± 1.77 years) and 30 ADHD (9.62 ± 1.75 years) children during a visual attention task. Higuchi, Katz, and Petrosian fractal dimension exponents and approximate entropy nonlinear features were extracted from the signal. Overall, 92.28% and 93.65% accuracy was achieved, respectively, using the mRMR method and the DISR method using a multilayer perceptron (MLP) neural network. Allahverdy et al. [24] also used visual attention tasks to detect ADHD in 20 healthy and 29 children with ADHD aged 7–12 years using EEG nonlinear features. Lyapunov exponent, Higuchi fractal dimension, Katz fractal dimension, and Sevcik fractal dimension nonlinear features were extracted from the EEG data and showed an accuracy of 96.7% using frontal lobe electrodes with an MLP neural network. Most of the work discussed above mostly used EEG nonlinear features and neural networks for classification. For our model development, we selected this SVM classifier for its simplicity and effectiveness in high-dimension spaces. The number of participants in these reported studies did not exceed 49, while our focus was to find a sample with more variability in the dataset, with a balance between ADHD and healthy subjects. In addition, the experimental setting and the data collection procedure are important for reproducing these studies and establishing a standard for child ADHD detection. The selection of the dataset for this study (described in Section 3) was made considering these factors.

3. Materials and Methods

The public dataset employed in this study is available in the IEEE data port [25]. All the participants were school-aged and right-handed. The participants were 60 healthy children and 60 children with ADHD diagnosed by an experienced psychiatrist of children and adolescents according to DSM-IV criteria [26]. The ADHD children had taken Ritalin for up to 6 months [25]. Ritalin is used in ADHD treatment. It works by altering the concentration of certain natural substances in the brain [27]. There is no conclusive evidence that Ritalin medication will influence the distinction of the brain waves of ADHD children. The healthy group was selected from two primary schools. Table 2 summarizes the information about the participants.
The EEG signals were recorded by a digital device (SD-C24, Sholeh Danesh Co., Tehran, Iran) in the Psychology and Psychiatry Research Center at Roozbeh Hospital (Tehran, Iran) [28]. The recording was performed based on the 10–20 standard [29] by 19 electrodes (Fz, Cz, Pz, C3, T3, C4, T4, Fp1, Fp2, F3, F4, F7, F8, P3, P4, T5, T6, O1, O2) with A1 and A2 electrodes as references on earlobes. Figure 1 shows the electrode locations of the international 10–20 system for EEG.
The recording protocol was designed based on a visual attention task. In the task, the children were shown 20 images with several age-suitable characters, such as images of different animals, and they were asked to enumerate them. The number of characters in each image was chosen between 5 and 16 randomly. To have a continuous stimulus during the EEG recording, each image was displayed immediately after the child’s response. Thus, the child’s performance defines the duration of the EEG recording. The correctness of the answers was not considered [28].
All procedures performed to obtain this dataset were approved by the Institutional Review Board (IRB) and the Ethical Committee of Tehran University of Medical Sciences (TUMS) [28]. Since one of the deficits in ADHD children is visual attention [13,30], in this dataset, the data were obtained by a visual attention task where the children were shown some images that were appropriate and friendly for 7- to 12-year-olds. The balanced dataset was collected from two different places and sessions, so it was free from measurement bias. Considering all these factors and the flexibility in acquiring datasets from children, we chose this dataset.

4. Preprocessing

EEG signals contain different artifacts and noises that should be removed before the analysis. The sampling frequency of the EEG signal is 128 Hz. For the preprocessing method, we used a 4th-order FIR Butterworth filter with the cutoff frequencies 0.5 Hz and 63 Hz. To remove the power-line noise, a 50 Hz notch filter was used. We designed the notch filter using a stop Butterworth filter with the cutoff frequencies 49 Hz and 51 Hz.
After filtering, the time-series data were filtered in EEG frequency bands (delta (0.5–4 Hz), theta (4–8 Hz), alpha (8–13 Hz), beta (13–30 Hz), and lower gamma (30–63 Hz)) using an FIR filter with zero phase distortion. As ADHD patients have a high theta-to-beta ratio, we worked with only four frequency bands: delta, theta, alpha, and beta.
For each subject, the time-series EEG signal was divided into 2 s segments for each channel with 50% overlap. This means each EEG window contained 1 s of previous and 1 s of current windows. In the dataset, for the control group, the minimum task duration was 50 s for one subject, and the maximum task duration was 285 s for one subject with ADHD. As the task timing differed for each subject, the number of segments varied for every subject [24]. For the classification of the EEG signal, we followed the pipeline shown in Figure 2.

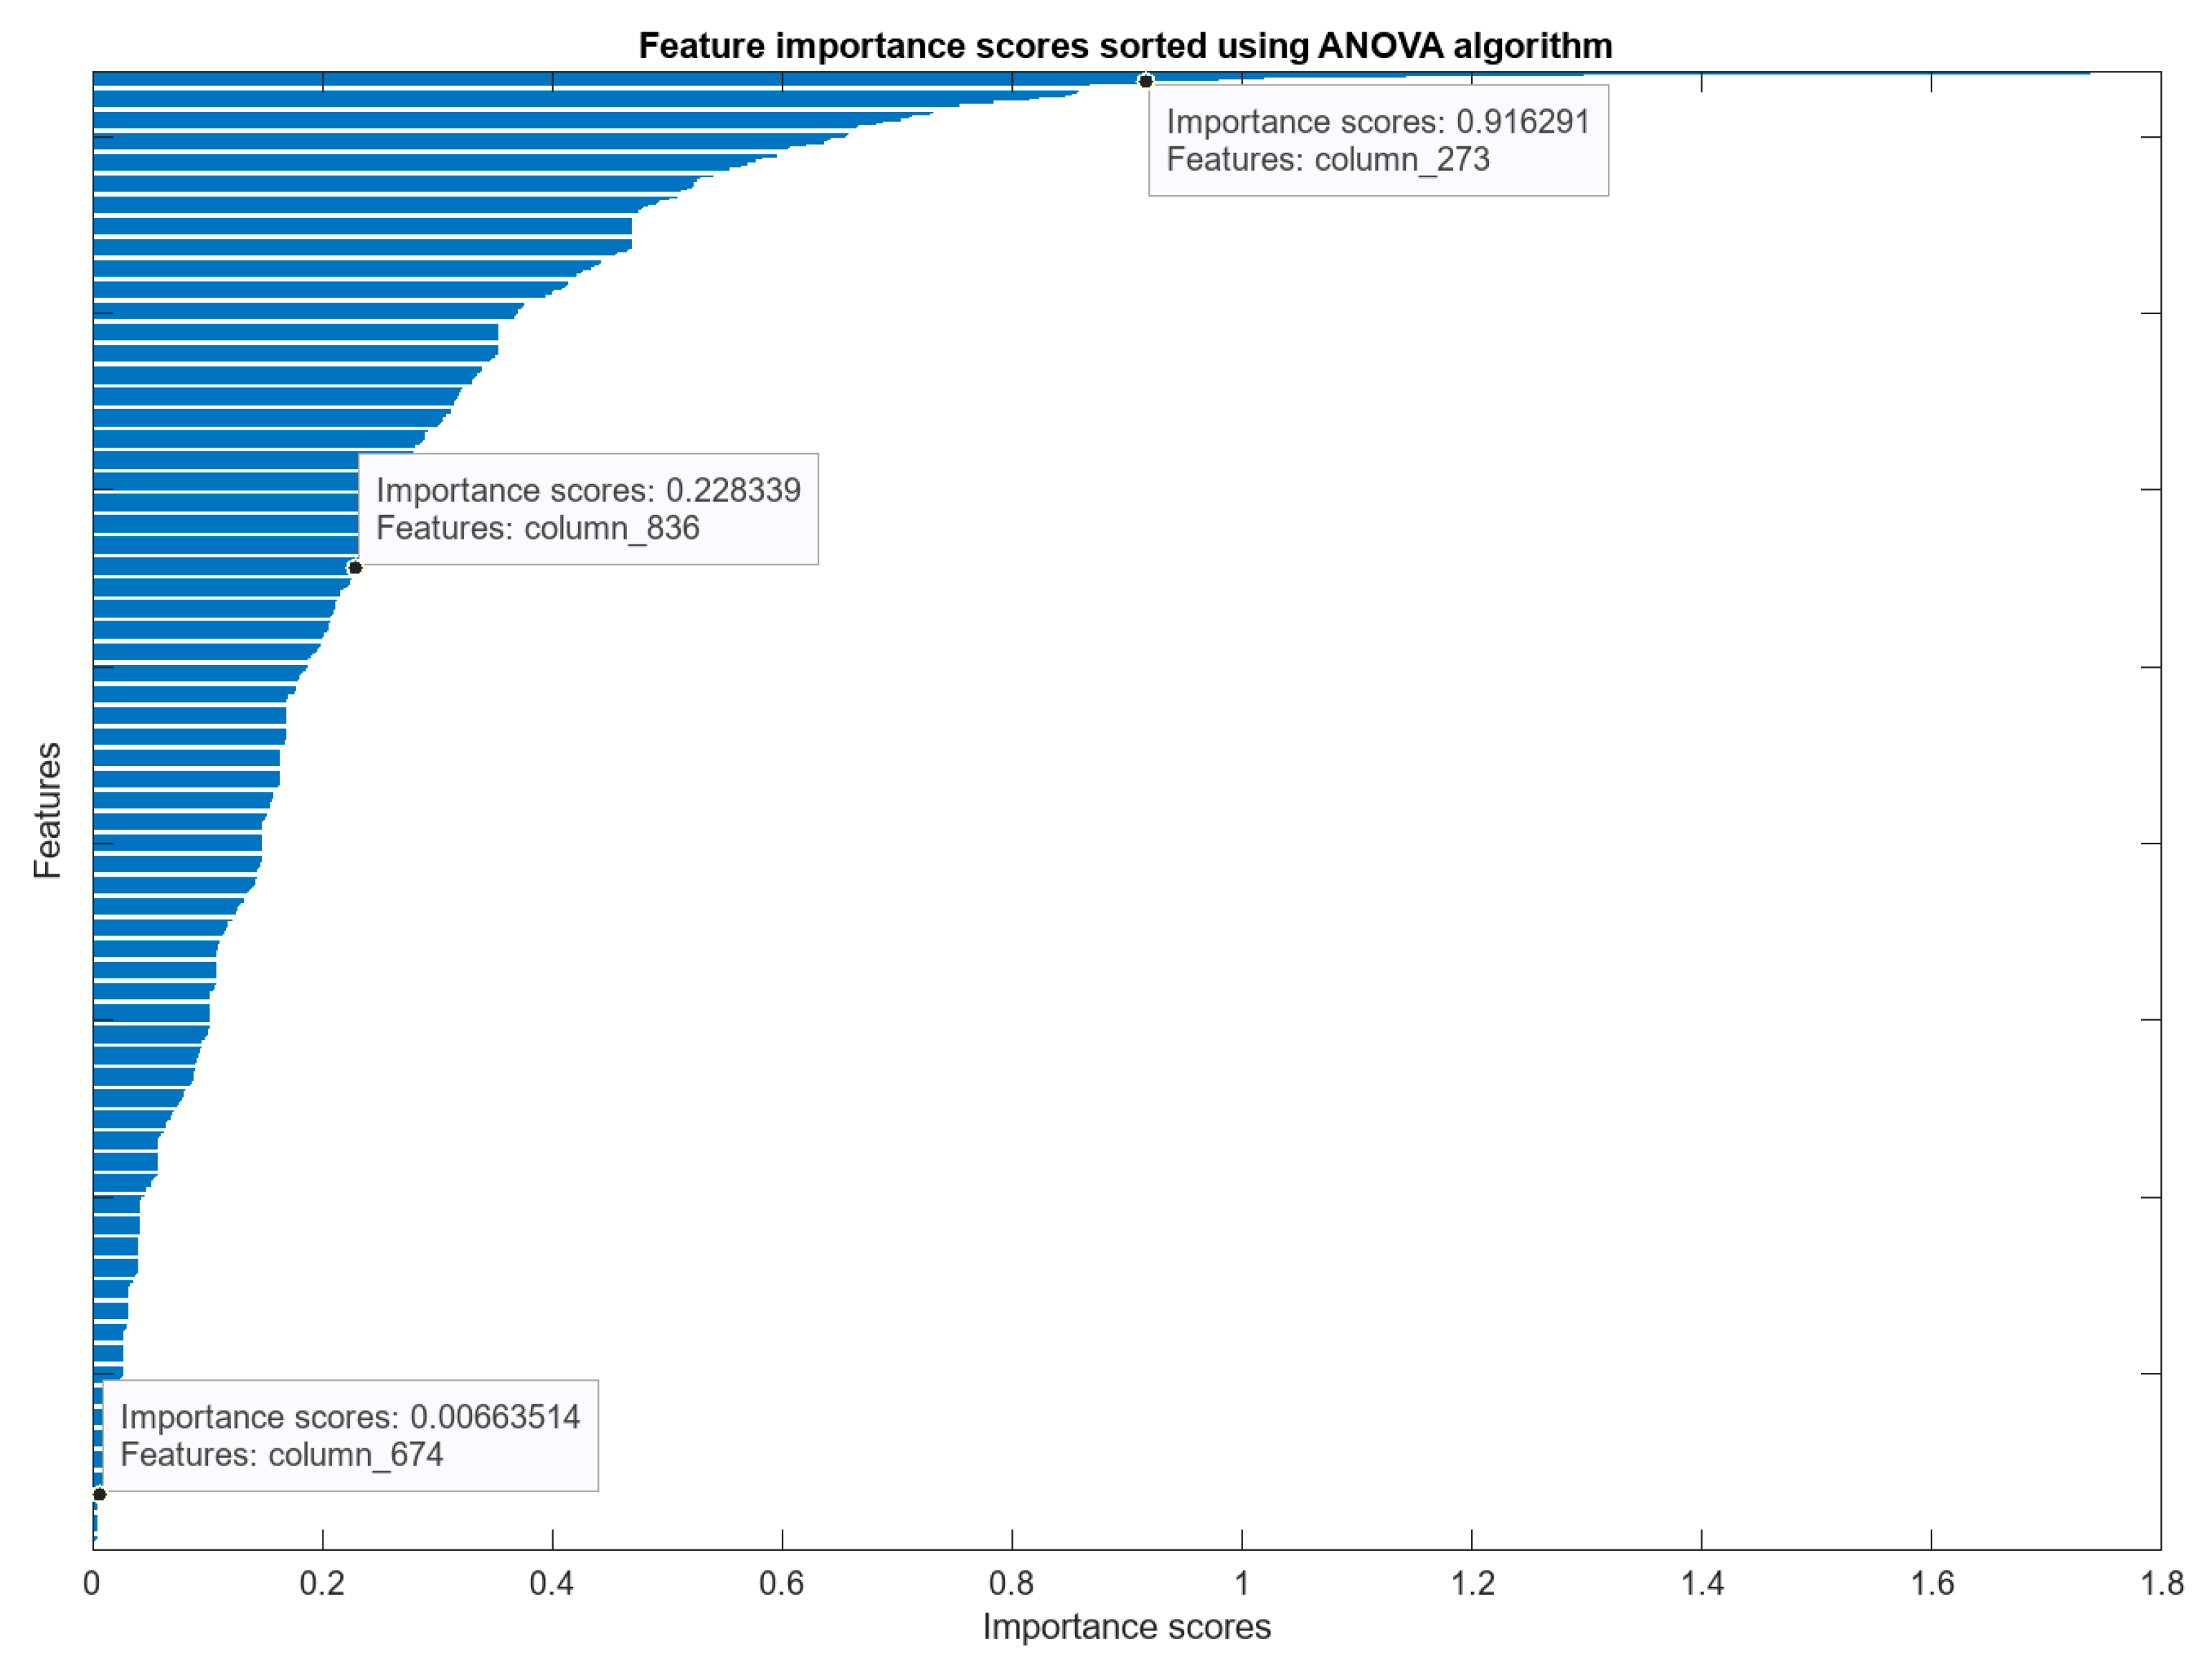
5. Feature Extraction and Feature Selection

Feature extraction is a dimensionality reduction process that reduces an initial set of raw data to more useful and manageable information for processing [31]. This feature extraction has been proven to be an important step in the process of EEG signal classification [32]. To extract significant information from raw data and for efficient training of classifiers, feature extraction is necessary. We extracted 11 features: standard deviation, RMS, skewness, kurtosis, Hjorth activity, Hjorth mobility, Hjorth complexity, Shannon’s entropy, spectral entropy, power spectral entropy (PSD), and band power. Table 3 gives a brief description of these computed features.
For the 2 s window, we extracted these 11 for every 19 channels for every sub-bands. After the feature extraction, we got a total of 836 features and 16,474 instances.
To remove irrelevant features from the classification pipeline, a proper selection of features is necessary. We applied the ANOVA feature-ranking method to visualize which features had the highest importance scores (Figure 3). Analysis of variance (ANOVA) is a statistical method that compares variances across the means (or average) of different groups [42]. In the current analysis, for each predictor variable, a one-way analysis of variance was performed and grouped by class, then features ranked using p-values. For each predictor variable, the algorithm tests the hypothesis that the predictor values grouped by the response classes are derived from populations with the same mean against the alternative hypothesis that the population means are not all the same [43]. ANOVA analyzes the correlation among the features of the data. To enable feature selection for ANOVA, the F-statistic can be used. Each data feature will be ranked based on the F-statistic, and the features with the higher scores can be chosen as the optimal set of components from the data available, so the features with the higher magnitude of scores can be considered optimal features from the data [44].
Feature reduction is necessary to remove highly correlated features to avoid over-fitting. We used PCA, an unsupervised method for dimension reduction, with 80%, 85%, 90%, and 95% explained variance. Explained variance is a statistical measure of how much variation in a dataset can be attributed to each of the principal components generated by the PCA method [45].
For the classification, we used a Gaussian support vector machine (SVM) classifier, a supervised machine learning algorithm. SVM algorithms use a set of mathematical functions that are defined as the kernel [46]. The function of the kernel is to take data input and transform it into the required form [47] so that a nonlinear decision surface can be transformed into a linear equation in a more dimensional space. It returns the dot product between two points in standard feature dimensions [48]. Gaussian is one of the kernel functions that is often used when there is no prior knowledge of a given dataset [49]. The Gaussian kernel can be expressed as k x , y = exp x y 2 2 σ 2 [50]. Here, K is the kernel function, x and y are n-dimensional inputs.
Before applying the classifier, the dataset was split for holdout and k-fold cross-validation. Cross-validation is a statistical method used to estimate the true generalization performance of machine learning models [51]. The holdout method is the simplest cross-validation and randomly splits the dataset. For this, the dataset was separated into three sets, “training set,” “validation set,” and “test set.” This method is good to use when the dataset is very large [52,53]. From the present dataset, we took 70% for the training set, 15% for the test set, and 15% for the validation set. We trained the classifier for 80%, 85%, 90%, and 95% variance of the PCA to remove the correlated features at different percentages and compared the results.
K-fold cross-validation is performed while the dataset is split into a K number of folds [54]. From the dataset, we took 90% for the training set and 10% for the test set to evaluate the performance. For the k-fold cross-validation, we used 10-fold, which means the training set was divided into 10 parts. Nine parts were used for training and one-tenth was reserved for training. This procedure repeats ten times each time, reserving a different tenth for testing. Figure 4 shows the k-fold cross-validation process.
We trained the classifier for 80%, 85%, 90%, and 95% variance of the PCA to remove the correlated features at different percentages and compared the results.

6. Result

Table 4 shows the accuracy of the classifier for holdout validation. Here, we can observe that for 90% variance, we got the highest test accuracy—93.2%. The lowest test accuracy was 85.5.5% for 80% variance using holdout cross-validation.
Beyond 90% variance, as we increased the PCA variance, and the test accuracy decreased because the dataset results in overfitting. We performed holdout cross-validation (with 90% PCA variance) ten times to see the classifier accuracy in different runs, and each time the training test and validation set were randomly divided into 70:15:15. Table 5 shows the performance of holdout cross-validation. It shows that for each time running holdout cross-validation, the test accuracy was around 93% for the SVM classifier. The mean and the STD for performing holdout 10 times were 93.2% and 0.44, respectively, which shows that there was no bias in the classifier model.
Table 6 shows the accuracy of the classifier for k-fold cross-validation. Here, we also got the highest test accuracy at 90% variance, which is 94.2%, and the lowest test accuracy at 84.4% for 97% variance for using k-fold cross-validation. The test accuracy also decreased as we increased the PCA variance because the dataset results in overfitting after 90% variance.
From Table 4 and Table 6, we observe that both cross-validation methods have the highest accuracy for 90% variance. The 10-fold validation method has a 1% higher accuracy than the holdout method.

7. Discussion

As ADHD is the most common disorder in children, early diagnosis will help to prevent future complications [23]. In this paper, we present a machine-learning approach for identifying children with ADHD using an SVM applied to a publicly available dataset (120 participants’ 19-channel EEG data). After denoising, we divided the EEG signal into five sub-bands and took only four frequency bands (delta, theta, alpha, and beta) for the next process, because it is a slow (delta or theta) brain wave and due to a shortage of fast (beta) brain waves in ADHD patients. From the four sub-bands, we extracted statistical, time-domain, and frequency-domain features from each subject’s data. The STD measures the variability and RMS is calculated to determine the power changes in the brain wave. Hjorth parameters indicate the complexity of the brain wave. Mobility, activity, and complexity are the most used Hjorth parameters and also the first derivatives of the signal [56]. Skewness represents the rate of asymmetric distribution of the EEG data. Kurtosis measures the distribution of observed data around the mean. It describes how often outliers occur [57]. Entropy measures the uncertainty or randomness of the brain wave [56]. PSD calculates the power distribution of EEG series in the frequency domain, and it is used to evaluate the abnormalities of the brain [58]. STD, RMS, skewness, and kurtosis are statistical and simple features. These are the simple features to characterize the brain wave.
We also applied PCA of different percentages of variance to reduce dimensionality to prevent overfitting. PCA reduces the number of variables or features of a large dataset while preserving as much information as possible [59]. It makes it convenient and faster for the machine learning algorithm to analyze the dataset.
We used two different cross-validation methods and split the dataset into the train-test-validation set. For different percentages of correlated features, we got different accuracy for both cross-validation methods in the SVM classifier. The highest test accuracy was 93.24% for 90% of the variance in the holdout cross-validation method and 94.2% accuracy for 90% of the variance in the k-fold cross-validation method. Cross-validation evaluates the performance of machine learning models, and this helps to compare machine learning methods and determine which is ideal for solving a specific problem [60]. In our study, we got similar accuracy in both holdout and k-fold cross-validation, which makes our model robust against bias and overfitting.
SVM has been widely used to classify EEG signals for neurological disorders [61]. It works relatively well when there is a clear margin of separation between the classes [62], and the dataset used in this study has two classes: healthy children labeled as class 1 and children with ADHD labeled as class 2. We used Gaussian kernel SVM for classification, as it has excellent learning performance and can give a reliable estimate of uncertainty. The Gaussian kernel ensures a globally optimal predictor that minimizes the estimation and approximation errors of a classifier [63].
In this study, we used statistical and time- and frequency-domain features of the four EEG sub-bands, but most prior work used nonlinear features and also worked with all the sub-bands. As mentioned in Section 2, they mostly employed KNN and neural networks. Recently, many studies have been focusing on MRI to identify neurological disorders, but compared to MRI, EEG is more flexible, affordable, and also suitable for children. We also compared the results of two cross-validations. From the result of these two cross-validations, we can say there is no bias in the dataset. In this study, we got around 93% accuracy in the SVM classifier to identify ADHD in children from 11 features extracted from each sub-band of the EEG signal. This accuracy is reasonable for classifying any EEG signals. The main challenges we faced in this study were to understand this dataset to determine the window segment and select the good features. As it is a large dataset, we selected a 2 s window segment with 50% overlap for each of the sub-bands to have as much information as possible. Windowing is used to isolate features into small segments of overall EEG data to improve feature resolution [64].
In summary, we have presented an EEG machine learning pipeline for ADHD detection, explaining each stage of the pipeline (including signal preprocessing and data preparation) with thorough explanations and rationale. We utilized only the first four sub-bands of EEG and eliminated the higher-frequency band, which reduced the computational load for the model and kept mean accuracy of 93.2%. Simple EEG features were extracted from a large dataset of 120 children, which was collected from two different sessions at two different places, eliminating measurement bias in data collection. The experimental setup was also child-friendly, easy to reproduce in local settings, and could be employed for future ADHD detection. We also performed rigorous validation to ensure that our model was not impacted by bias and overfitting, which commonly appear in the machine learning pipeline. Despite this, we need to address a few limitations of our research.
  • To improve the accuracy, we may need to evaluate more features through the use of different machine learning models for comparison of results.
  • We will also try different window sizes (0.5 s or 5 s, for example) in future studies.
  • We will next work with only two EEG frequency bands (theta and beta), as these two have significant changes in ADHD patients, and investigate more into the sub-band of the EEG signals.
  • Based on our previous research on BCI interfacing [11,65] and EEG channel reduction [66], we will develop a portable solution with reduced EEG channels to evaluate the possibility of real-time ADHD detection.

8. Conclusions

This study provides a machine learning model for EEG classification, which can identify ADHD children using statistical and time-domain and frequency-domain features of four sub-bands of EEG signals. We attained accuracy of between 93% and 94% for holdout and cross-validation, which is acceptable for the large dataset that we were using. The results show that there was no bias in the features set and no overfitting in the classifier model. It will be a helpful model to minimize misdiagnosis of ADHD and also beneficial for the evaluation of treatment efficacy.

Author Contributions

Writing—original draft, A.A.; Writing—review & editing, M.H.I. All authors have read and agreed to the published version of the manuscript.

Funding

This research is funded by Clarkson University New Faculty Start Up Gran.

Data Availability Statement

Not applicable.

Conflicts of Interest

The authors declare no conflict of interest.

References

  1. Attention-Deficit/Hyperactivity Disorder (ADHD) in Children. Available online: https://www.hopkinsmedicine.org/health/conditions-and-diseases/adhdadd (accessed on 18 November 2022).
  2. Attention-Deficit/Hyperactivity Disorder (ADHD) in Children—Symptoms and Causes. Available online: https://www.mayoclinic.org/diseases-conditions/adhd/symptoms-causes/syc-20350889 (accessed on 18 November 2022).
  3. Kessler, R.C.; Adler, L.A.; Berglund, P.; Green, J.G.; McLaughlin, K.A.; Fayyad, J.; Russo, L.J.; Sampson, N.A.; Shahly, V.; Zaslavsky, A.M. The Effects of Temporally Secondary Co-Morbid Mental Disorders on the Associations of DSM-IV ADHD with Adverse Outcomes in the US National Comorbidity Survey Replication Adolescent Supplement (NCS-A). Psychol. Med. 2014, 44, 1779–1792. [Google Scholar] [CrossRef] [PubMed] [Green Version]
  4. Vyvanse® (Lisdexamfetamine Dimesylate). Available online: https://www.vyvanse.com/what-is-adhd (accessed on 18 November 2022).
  5. Parenting a Child with ADHD (for Parents)—Nemours KidsHealth. Available online: https://kidshealth.org/en/parents/parenting-kid-adhd.html (accessed on 18 November 2022).
  6. Kooij, S.J.J.; Bejerot, S.; Blackwell, A.; Caci, H.; Casas-Brugué, M.; Carpentier, P.J.; Edvinsson, D.; Fayyad, J.; Foeken, K.; Fitzgerald, M.; et al. European Consensus Statement on Diagnosis and Treatment of Adult ADHD: The European Network Adult ADHD. BMC Psychiatry 2010, 10, 67. [Google Scholar] [CrossRef] [PubMed] [Green Version]
  7. Diagnostic and Statistical Manual of Mental Disorders. Available online: https://dsm.psychiatryonline.org/doi/book/10.1176/appi.books.9780890425596 (accessed on 18 November 2022).
  8. Van den Heuvel, M.P.; Sporns, O. Network Hubs in the Human Brain. Trends Cogn. Sci. 2013, 17, 683–696. [Google Scholar] [CrossRef] [PubMed]
  9. Lubar, J.F. Discourse on the Development of EEG Diagnostics and Biofeedback for Attention-Deficit/Hyperactivity Disorders. Biofeedback Self-Regul. 1991, 16, 201–225. [Google Scholar] [CrossRef] [PubMed]
  10. Fotuhi, M. Can Neurofeedback Effectively Treat ADHD? Available online: https://neurogrow.com/can-neurofeedback-effectively-treat-adhd/ (accessed on 18 November 2022).
  11. Ketola, E.C.; Barankovich, M.; Schuckers, S.; Ray-Dowling, A.; Hou, D.; Imtiaz, M.H. Channel Reduction for an EEG-Based Authentication System while Performing Motor Movements. Sensors 2022, 22, 9156. [Google Scholar] [CrossRef] [PubMed]
  12. Islam, M.; Ahmad, M. Modeling of Human Emotion with Effective Frequency Band during a Test of Sustained Mental Task. In Proceedings of the 2015 IEEE International WIE Conference on Electrical and Computer Engineering (WIECON-ECE), Dhaka, Bangladesh, 19–20 December 2015; pp. 403–406. [Google Scholar] [CrossRef]
  13. Mazaheri, A.; Coffey-Corina, S.; Mangun, G.R.; Bekker, E.M.; Berry, A.S.; Corbett, B.A. Functional Disconnection of Frontal Cortex and Visual Cortex in Attention-Deficit/Hyperactivity Disorder. Biol. Psychiatry 2010, 67, 617–623. [Google Scholar] [CrossRef]
  14. Rubia, K.; Cubillo, A.; Smith, A.B.; Woolley, J.; Heyman, I.; Brammer, M.J. Disorder-Specific Dysfunction in Right Inferior Prefrontal Cortex during Two Inhibition Tasks in Boys with Attention-Deficit Hyperactivity Disorder Compared to Boys with Obsessive–Compulsive Disorder. Hum. Brain Mapp. 2010, 31, 287–299. [Google Scholar] [CrossRef]
  15. Rubia, K.; Halari, R.; Smith, A.B.; Mohammad, M.; Scott, S.; Brammer, M.J. Shared and Disorder-Specific Prefrontal Abnormalities in Boys with Pure Attention-Deficit/Hyperactivity Disorder Compared to Boys with Pure CD during Interference Inhibition and Attention Allocation. J. Child Psychol. Psychiatry 2009, 50, 669–678. [Google Scholar] [CrossRef]
  16. An Introduction to Machine Learning—GeeksforGeeks. Available online: https://www.geeksforgeeks.org/introduction-machine-learning/ (accessed on 23 December 2022).
  17. The History of ADHD. Available online: https://www.healthline.com/health/adhd/history (accessed on 19 January 2023).
  18. Yin, W.; Li, T.; Mucha, P.J.; Cohen, J.R.; Zhu, H.; Zhu, Z.; Lin, W. Altered Neural Flexibility in Children with Attention-Deficit/Hyperactivity Disorder. Mol. Psychiatry 2022, 27, 4673–4679. [Google Scholar] [CrossRef]
  19. Pulini, A.A.; Kerr, W.T.; Loo, S.K.; Lenartowicz, A. Classification Accuracy of Neuroimaging Biomarkers in Attention-Deficit/Hyperactivity Disorder: Effects of Sample Size and Circular Analysis. Biol. Psychiatry Cogn. Neurosci. Neuroimaging 2019, 4, 108–120. [Google Scholar] [CrossRef]
  20. Kiiski, H.; Rueda-Delgado, L.M.; Bennett, M.; Knight, R.; Rai, L.; Roddy, D.; Grogan, K.; Bramham, J.; Kelly, C.; Whelan, R. Functional EEG Connectivity Is a Neuromarker for Adult Attention Deficit Hyperactivity Disorder Symptoms. Clin. Neurophysiol. 2020, 131, 330–342. [Google Scholar] [CrossRef]
  21. Alchalabi, A.E.; Shirmohammadi, S.; Eddin, A.N.; Elsharnouby, M. FOCUS: Detecting ADHD Patients by an EEG-Based Serious Game. IEEE Trans. Instrum. Meas. 2018, 67, 1512–1520. [Google Scholar] [CrossRef]
  22. Ghassemi, F.; Hassan_Moradi, M.; Tehrani-Doost, M.; Abootalebi, V. Using Non-Linear Features of EEG for ADHD/Normal Participants’ Classification. Procedia Soc. Behav. Sci. 2012, 32, 148–152. [Google Scholar] [CrossRef] [Green Version]
  23. Mohammadi, M.R.; Khaleghi, A.; Nasrabadi, A.M.; Rafieivand, S.; Begol, M.; Zarafshan, H. EEG Classification of ADHD and Normal Children Using Non-Linear Features and Neural Network. Biomed. Eng. Lett. 2016, 6, 66–73. [Google Scholar] [CrossRef]
  24. Allahverdy, A.; Khorrami, A.; Mohammadi, M.; Motie Nasrabadi, A. Detecting ADHD Children Using the Attention Continuity as Nonlinear Feature of EEG. Front. Biomed. Technol. 2016, 3, 1–2. [Google Scholar]
  25. Nasrabadi, A.M. EEG Data for ADHD/Control Children 2020. Available online: https://ieee-dataport.org/open-access/eeg-data-adhd-control-children (accessed on 18 November 2022).
  26. Stein, D.J.; Phillips, K.A.; Bolton, D.; Fulford, K.W.M.; Sadler, J.Z.; Kendler, K.S. What Is a Mental/Psychiatric Disorder? From DSM-IV to DSM-V. Psychol. Med. 2010, 40, 1759–1765. [Google Scholar] [CrossRef] [Green Version]
  27. Ritalin Oral: Uses, Side Effects, Interactions, Pictures, Warnings & Dosing—WebMD. Available online: https://www.webmd.com/drugs/2/drug-9475/ritalin-oral/details (accessed on 18 January 2023).
  28. Direction of Information Flow between Brain Regions in ADHD and Healthy Children Based on EEG by Using Directed Phase Transfer Entropy | SpringerLink. Available online: https://link.springer.com/article/10.1007/s11571-021-09680-3 (accessed on 28 October 2022).
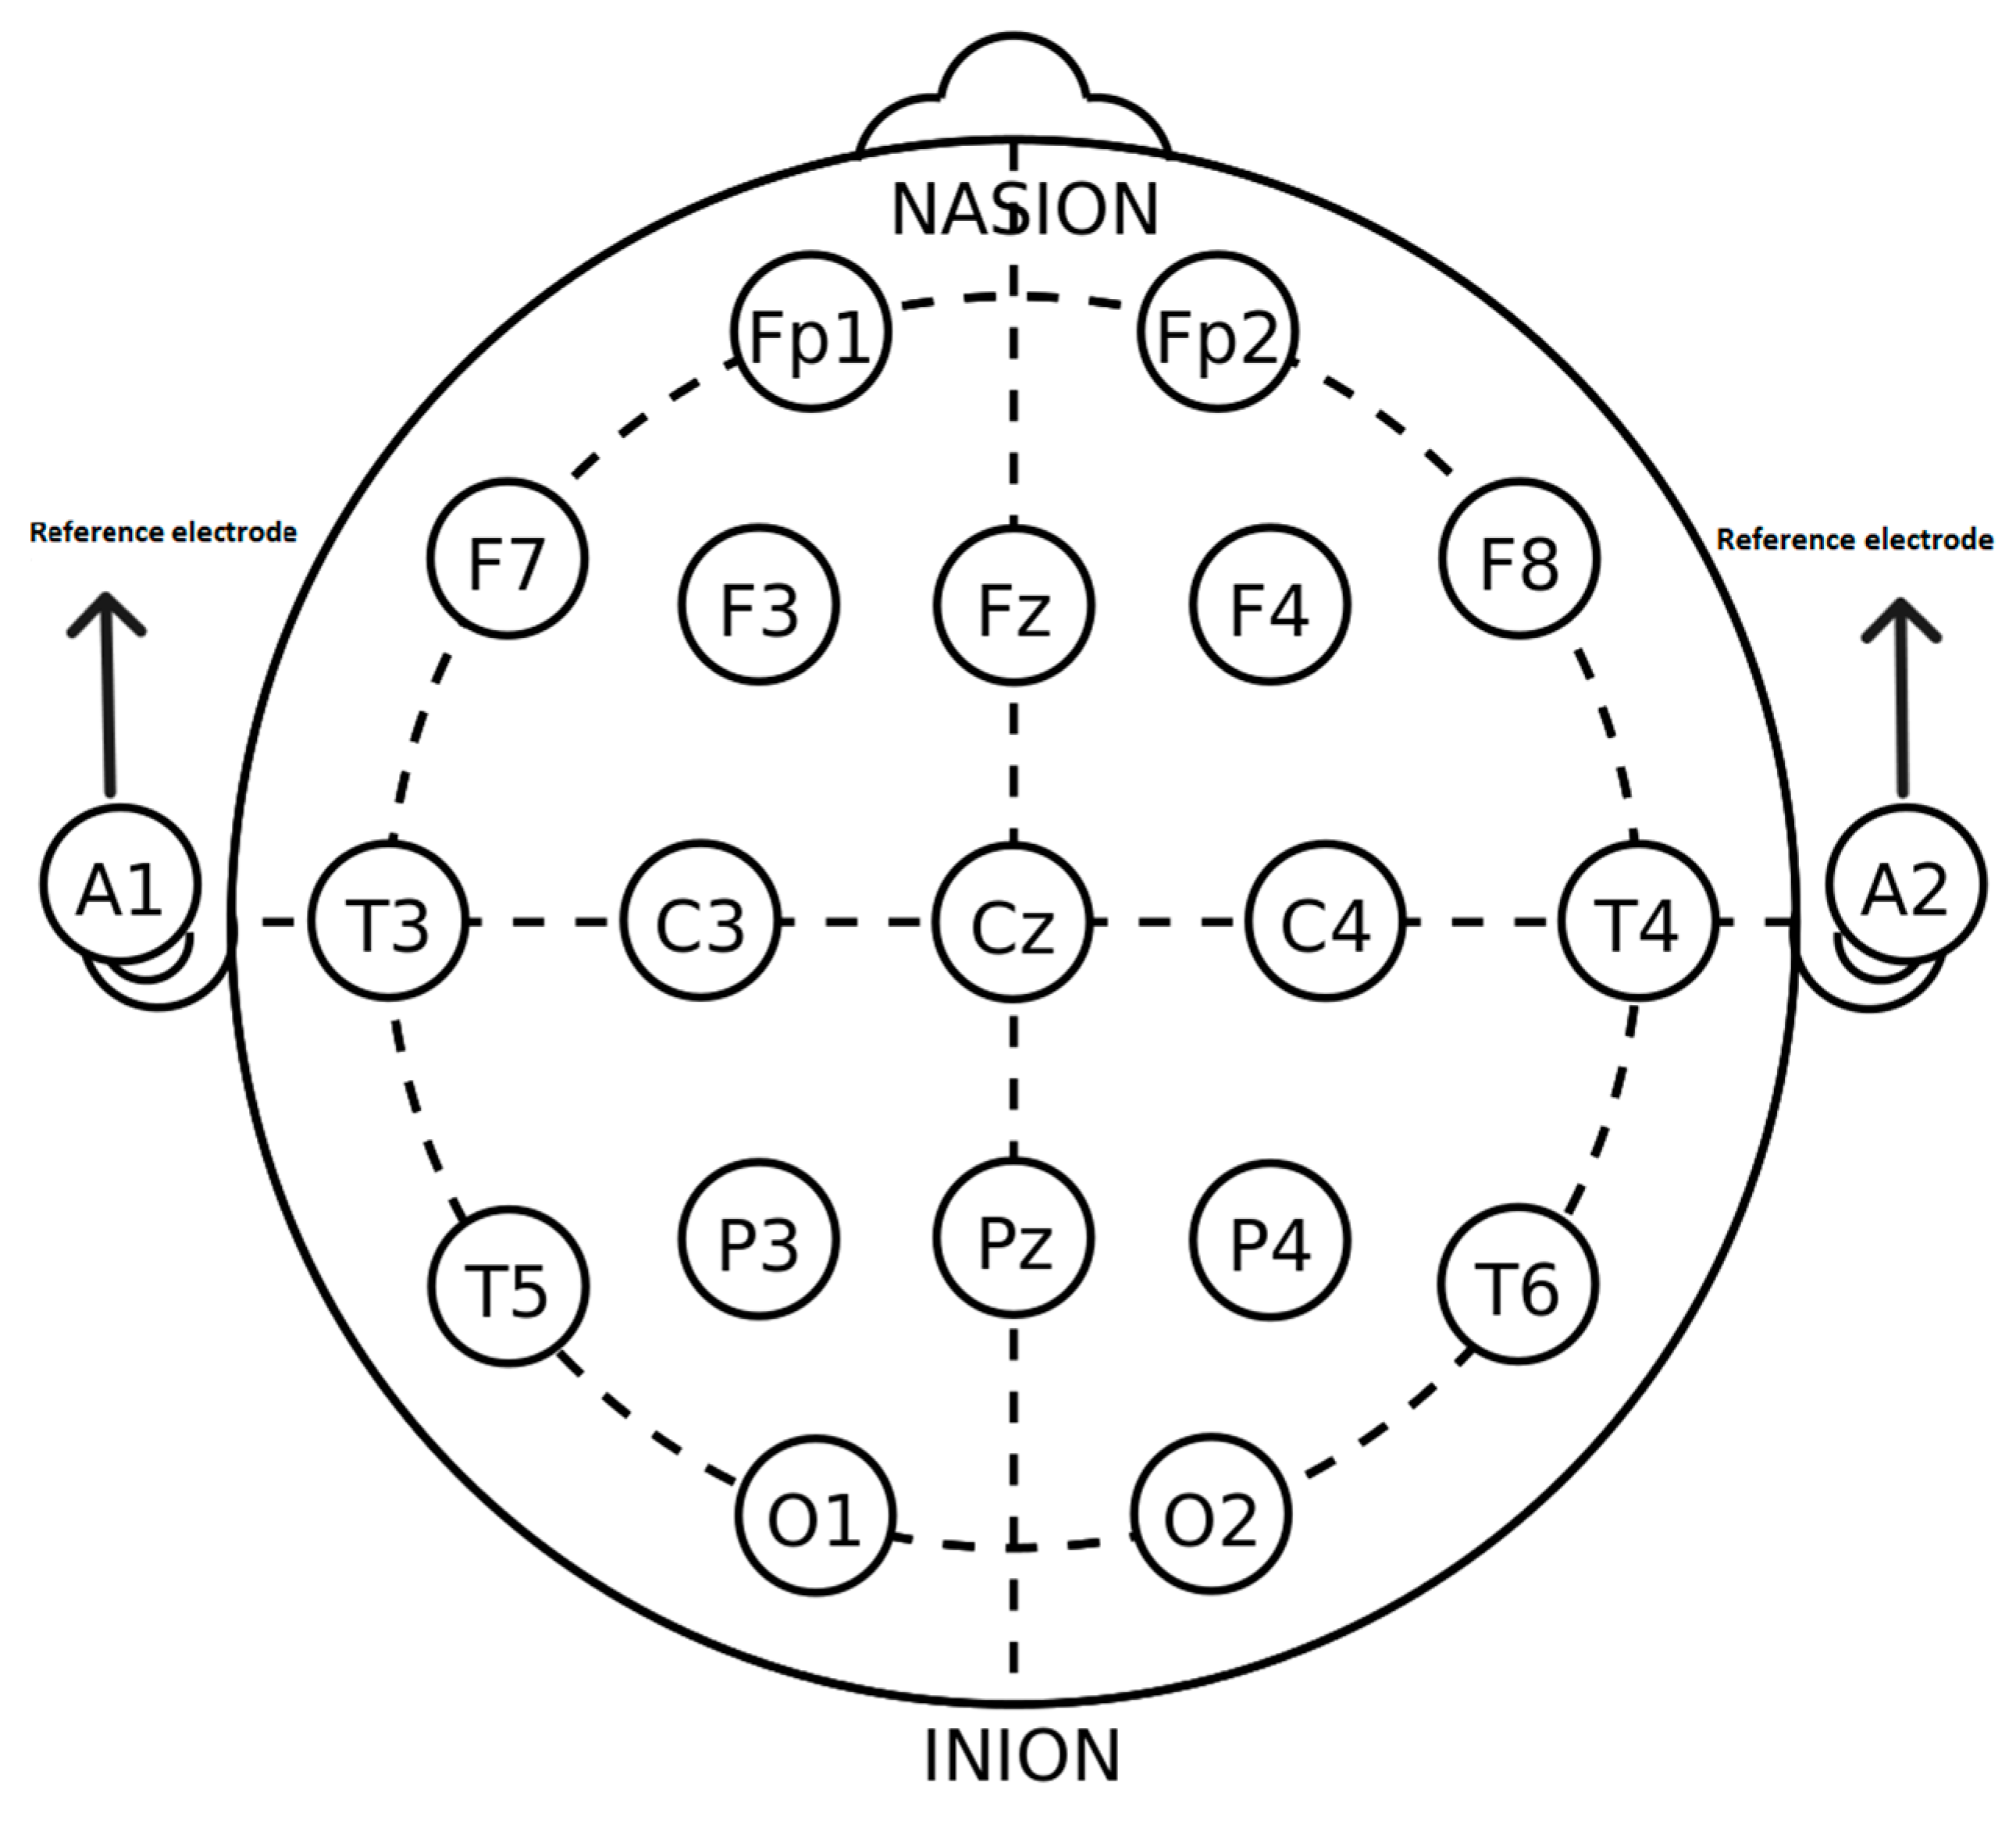
  29. 10–20 System (EEG). Wikipedia. 2022. Available online: https://en.wikipedia.org/w/index.php?title=10%E2%80%9320_system_(EEG)&oldid=1076814653 (accessed on 18 November 2022).
  30. Yourtherapysource Auditory and Visual Attention in Children with ADHD. Available online: https://www.yourtherapysource.com/blog1/2017/06/27/auditory-visual-attention-children-adhd/ (accessed on 18 November 2022).
  31. Feature Extraction. Available online: https://deepai.org/machine-learning-glossary-and-terms/feature-extraction (accessed on 23 December 2022).
  32. Amin, H.U.; Mumtaz, W.; Subhani, A.R.; Saad, M.N.M.; Malik, A.S. Classification of EEG Signals Based on Pattern Recognition Approach. Front. Comput. Neurosci. 2017, 11, 103. Available online: https://www.frontiersin.org/articles/10.3389/fncom.2017.00103 (accessed on 23 December 2022). [CrossRef] [PubMed] [Green Version]
  33. Rahman, A.; Chowdhury, M.E.H.; Khandakar, A.; Kiranyaz, S.; Zaman, K.S.; Reaz, M.B.I.; Islam, M.T.; Ezeddin, M.; Kadir, M.A. Multimodal EEG and Keystroke Dynamics Based Biometric System Using Machine Learning Algorithms. IEEE Access 2021, 9, 94625–94643. [Google Scholar] [CrossRef]
  34. Standard Deviation. Available online: https://www.nlm.nih.gov/nichsr/stats_tutorial/section2/mod8_sd.html (accessed on 9 December 2022).
  35. Root Mean Square (RMS)—Definition, Formula and RMS Error. Available online: https://byjus.com/maths/root-mean-square/ (accessed on 9 December 2022).
  36. Measures of Skewness and Kurtosis. Available online: https://www.itl.nist.gov/div898/handbook/eda/section3/eda35b.htm (accessed on 9 December 2022).
  37. Hjorth Parameters. Wikipedia. 2021. Available online: https://en.wikipedia.org/w/index.php?title=Hjorth_parameters&oldid=1022917018 (accessed on 9 December 2022).
  38. Cocconcelli, M.; Strozzi, M.; Cavalaglio Camargo Molano, J.; Rubini, R. Detectivity: A Combination of Hjorth’s Parameters for Condition Monitoring of Ball Bearings. Mech. Syst. Signal Process. 2022, 164, 108247. [Google Scholar] [CrossRef]
  39. Stephanie Shannon Entropy. Available online: https://www.statisticshowto.com/shannon-entropy/ (accessed on 9 December 2022).
  40. Spectral Density—Wikipedia. Available online: https://en.wikipedia.org/wiki/Spectral_density (accessed on 9 December 2022).
  41. What Is the Band Power Measurement? Technical Support Knowledge Center Open. Available online: https://edadocs.software.keysight.com/kkbopen/what-is-the-band-power-measurement-589310400.html (accessed on 9 December 2022).
  42. What Is Analysis of Variance (ANOVA)? Available online: https://www.tibco.com/reference-center/what-is-analysis-of-variance-anova (accessed on 27 January 2023).
  43. Feature Selection and Feature Transformation Using Classification Learner App—MATLAB & Simulink. Available online: https://www.mathworks.com/help/stats/feature-selection-and-feature-transformation.html (accessed on 28 December 2022).
  44. Darshan, M. Using ANOVA for Feature Selection in Python. Available online: https://machinehack.com/story/using-anova-for-feature-selection-in-python (accessed on 23 January 2023).
  45. Kumar, A. PCA Explained Variance Concepts with Python Example. Data Anal. 2022. [Google Scholar]
  46. What Is a Support Vector Machine (SVM)? Definition from Techopedia. Available online: http://www.techopedia.com/definition/30364/support-vector-machine-svm (accessed on 29 December 2022).
  47. Team, D. Kernel Functions-Introduction to SVM Kernel & Examples. Available online: https://data-flair.training/blogs/svm-kernel-functions/ (accessed on 29 December 2022).
  48. Kernel Method. Available online: https://www.engati.com/glossary/kernel-method (accessed on 29 January 2023).
  49. Awasthi, S. Seven Most Popular SVM Kernels. Dataaspirant. 2020. Available online: https://dataaspirant.com/svm-kernels/ (accessed on 29 December 2022).
  50. Major Kernel Functions in Support Vector Machine (SVM). GeeksforGeeks. 2020. Available online: https://www.geeksforgeeks.org/major-kernel-functions-in-support-vector-machine-svm/ (accessed on 25 January 2023).
  51. Brownlee, J. A Gentle Introduction to k-fold Cross-Validation. MachineLearningMastery.com. 2018. Available online: https://machinelearningmastery.com/k-fold-cross-validation/ (accessed on 30 December 2022).
  52. Allibhai, E. Holdout vs. Cross-Validation in Machine Learning Medium. 2018. Available online: https://medium.com/@eijaz/holdout-vs-cross-validation-in-machine-learning-7637112d3f8f (accessed on 9 December 2022).
  53. Cross Validation. Available online: https://www.cs.cmu.edu/~schneide/tut5/node42.html (accessed on 9 December 2022).
  54. Why Use K-Fold Cross Validation? KDnuggets. Available online: https://www.kdnuggets.com/2022/07/kfold-cross-validation.html (accessed on 17 December 2022).
  55. Introduction to K-Fold Cross-Validation in Python—SQLRelease. Available online: https://sqlrelease.com/introduction-to-k-fold-cross-validation-in-python (accessed on 25 January 2023).
  56. Stancin, I.; Cifrek, M.; Jovic, A. A Review of EEG Signal Features and Their Application in Driver Drowsiness Detection Systems. Sensors 2021, 21, 3786. [Google Scholar] [CrossRef] [PubMed]
  57. Turney, S. What Is Kurtosis? | Definition, Examples & Formula. Available online: https://www.scribbr.com/statistics/kurtosis/ (accessed on 25 January 2023).
  58. Wang, R.; Wang, J.; Yu, H.; Wei, X.; Yang, C.; Deng, B. Power Spectral Density and Coherence Analysis of Alzheimer’s EEG. Cogn. Neurodyn. 2015, 9, 291–304. [Google Scholar] [CrossRef] [PubMed]
  59. Principal Component Analysis (PCA) Explained | Built In. Available online: https://builtin.com/data-science/step-step-explanation-principal-component-analysis (accessed on 30 December 2022).
  60. Joby, A. What Is Cross-Validation? Comparing Machine Learning Models. Available online: https://learn.g2.com/cross-validation (accessed on 29 December 2022).
  61. Richhariya, B.; Tanveer, M. EEG Signal Classification Using Universum Support Vector Machine. Expert Syst. Appl. 2018, 106, 169–182. [Google Scholar] [CrossRef]
  62. Raj, A. Everything about Support Vector Classification—Above and beyond. Available online: https://towardsdatascience.com/everything-about-svm-classification-above-and-beyond-cc665bfd993e (accessed on 31 December 2022).
  63. Blekh, A. Answer to ‘What Makes the Gaussian Kernel so Magical for PCA, and Also in General?’. Cross Validated. 2015. Available online: https://stats.stackexchange.com/questions/131138/what-makes-the-gaussian-kernel-so-magical-for-pca-and-also-in-general (accessed on 29 January 2023).
  64. Keelawat, P.; Thammasan, N.; Numao, M.; Kijsirikul, B. A Comparative Study of Window Size and Channel Arrangement on EEG-Emotion Recognition Using Deep CNN. Sensors 2021, 21, 1678. [Google Scholar] [CrossRef] [PubMed]
  65. Implementation of a Mind-Controlled Wheelchair. Available online: https://www.researchgate.net/publication/362075774_Implementation_of_a_Mind-Controlled_Wheelchair (accessed on 2 February 2023).
  66. Ketola, E.; Lloyd, C.; Shuhart, D.; Schmidt, J.; Morenz, R.; Khondker, A.; Imtiaz, M. Lessons Learned from the Initial Development of a Brain Controlled Assistive Device. In Proceedings of the 2022 IEEE 12th Annual Computing and Communication Workshop and Conference (CCWC), Las Vegas, NV, USA, 26–29 January 2022; pp. 0580–0585. [Google Scholar] [CrossRef]
Figure 1. The 10–20 system for electrode position with A1 and A2 reference electrodes [29].
Signals 04 00010 g001
Figure 2. The pipeline for EEG signal classification employed in this study.
Signals 04 00010 g002
Figure 3. Feature ranking for the current analysis using ANOVA algorithm.
Signals 04 00010 g003
Figure 4. K-fold (10-fold) cross-validation process [55].
Signals 04 00010 g004
Table 1. EEG sub-bands are associated with different brain functions [11,12].
Sub-BandFrequency RangeAssociated Brain Function
Delta0.5–4 HzDeep sleep or unconsciousness
Theta4–8 HzSleep or drowsiness and recall
Alpha8–13 HzEye closed and visual stimuli are limited
Beta13–30 HzAttentive to stimuli or problem-solving
Gamma30 Hz and aboveMovement, emotional processing, and high-level mental activity
Table 2. Information about the participants [25].
BoysGirlsAgeMean AgeDominant Hand
Healthy Children50107–129.85 ± 1.77Right-Handed
ADHD48127–129.62 ± 1.75Right-Handed
Table 3. Summary of EEG features employed in this study.
Feature NameDefinitionMathematical Description
Standard DeviationIt is a statistical feature that is a measure of how spread out the data is to the mean. σ = n = 1 N ( x n μ ) 2 N 1  
xn = n-th data sample, N = Total
No. of samples, µ = mean [33,34]
RMSRMS is the square root-mean-square value of a signal R M S = n = 1 N ( x n ) 2 N  
xn = n-th data sample, N = Total
No. of samples [35]
SkewnessSkewness is the measure of the lack of symmetry from the mean of the dataset. g = n = 1 N ( x n μ ) 3 / N σ 3
xn = n-th data sample, N = Total
No. of samples, µ = mean [33]
KurtosisKurtosis is a measure of whether the data are heavy-tailed or light-tailed relative to a normal distribution. k = n = 1 N ( x n μ ) 4 / N σ 4 3
xn = n-th data sample, N = Total
No. of samples, µ = mean [36]
Hjorth ActivityIt is the variance of the amplitude of the signal in a time function. Represent the signal power.Ha = var(x(t))
x(t) = amplitude of time-varying signal [37,38]
Hjorth MobilityThe mobility is the square root of the activity of the first derivative of the signal divided by the activity of the signal. Represents the mean frequency. H m = v a r ( x t ) v a r x t
x′(t) = 1st derivation of the amplitude of the signal [37,38]
Hjorth ComplexityIt represents the change in frequency. It is defined as the ratio between the mobility of the first derivative of the signal and the mobility of the signal. H c = H m ( x t ) H m x t [37,38]
Shannon’s EntropyShannon’s entropy measures the uncertainty/randomness in a dataset H = n = 1 N P n × l o g P n
Pn = probability of occurrence xn [39]
Spectral Entropy (SEN)SEN is the normalized Shannon’s entropy S E N = n = 0 N 1 P k l o g 2 P k l o g N
P = spectral of normalized frequency,
N = number of frequencies in binary. [28]
Power Spectral Density (PSD)PSD of the signal describes the power present in the signal as a function of frequency [40]
Band PowerIt measures both power and power spectral density in a specified channel bandwidth [41]
Table 4. Results of the SVM classifier for different PCA variance after holdout cross-validation.
% VarianceAccuracy (Validation)Accuracy (Test)Confusion Matrix (Test)
TPTNFPFN
80%88.49%88.06%9671263166124
85%92.18%92.51%1011131212275
90%93.17%93.24%994135413933
95%88.29%88.36%867135826629
97%85.0%85.5%769134434216
Table 5. Results of the SVM classifier for different runs for 90% PCA variance.
NumberAccuracy (Validation)Accuracy (Test)Confusion Matrix (Test)
TPTNFPFN
193.4%93.9%990133112030
293.1%92.7%969132214139
393.0%93.8%992132611835
492.7%93.0%959133915221
592.3%93.6%982133012831
691.3%92.5%953133215828
793.3%93.6%987132512435
891.6%93.0%976132113539
993.1%93.2%981132112940
1093.17%93.24%994135413933
Mean 93.2%
STD 0.44
Table 6. Results of the SVM classifier for different PCA variance after 10-fold cross-validation.
% VarianceAccuracy (Validation)Accuracy (Test)Confusion Matrix (Test)
TPTNFPFN
80%89.3%89.7%6508289079
85%92.7%93.9%6818665941
90%93.4%94.2%6658867521
95%88.5%88.3%56089518012
97%84.8%84.4%49389724710
Disclaimer/Publisher’s Note: The statements, opinions and data contained in all publications are solely those of the individual author(s) and contributor(s) and not of MDPI and/or the editor(s). MDPI and/or the editor(s) disclaim responsibility for any injury to people or property resulting from any ideas, methods, instructions or products referred to in the content.

